Abstract
This study investigates how small logs from native trees, which fail to meet standard sawing criteria, can be utilized to enhance their value by producing solid wood for direct use or remanufacture rather than being relegated to biomass or fuelwood. We analyzed a sample of 177 small, discarded logs from native species from second-growth forests of Nothofagus in the Ñuble Region, Chile. The logs were scored after a qualitative and quantitative assessment for small logs, as designed in this study, and processed using a flexible sawing pattern to optimize wood recovery based on random lengths, widths, and thicknesses. Log dimensions varied, with lengths from 31 to 156.2 cm, small end diameters from 11.5 to 25.6 cm, and volumes between 0.001 and 0.092 m3. Key defects in logs included knots (95%), curvature (79%), and checks (46%), among others. A key result is the obtained general yield value of 36%, a considerable value for small-diameter, low-quality logs. The highest sawing yields were achieved with Nothofagus dombeyi (Mirb.) Oerst (42%), Geviuna avellana Molina and Persea lingue Miers ex Bertero Nees (39%), and Nothofagus obliqua (Mirb.) Oerst (34%). The quality of the boards correlates positively with the quality of the logs, and the yields with the log size and quality. The yield achieved in boards coming from such low-quality logs shows a promising possibility of improvement for this kind of process. Further development of the grading process and automation of the sawmill process could be future research steps.
1. Introduction
The historical degradation of the native Chilean forest makes it difficult to find suitable logs for the sawmill industries. Most of the current usable forests do not have the required diameters or are too old for harvesting, and have not been sustainably managed [1,2]. In this context, the local communities and small owners typically use the forest as a cattle refuge, increasing its degradation [3]. Without proper silvicultural prescriptions, they harvest the best trees, sell the discarded small or disqualified logs as fuelwood, or leave them on the forest floor. In many cases, they abandon the forest [4], or they are not willing to plant new native forest despite the government incentives [5]. Many native forests belong to medium to small owners. Thus, of the total Nothofagus forest area of Roble-Raulí-Coihue across the Ñuble, Biobío, La Araucanía, and Los Ríos regions, 35% is owned by proprietors with properties up to 200 hectares [6]. Many of these owners depend on the land income, and given the degraded condition of many stands, the log yield in dimensions of interest for traditional sawmills is sometimes nonexistent.
Complementary, in the context of climate change, the occurrence of fires has increased considerably in the last decade [7], being exacerbated by the accumulated amount of biomass in these unattended forests. It is possible to use the forest sustainably through good management. However, the alternative has several drawbacks related to the high cost of maintaining the forest, high transaction costs to process permits, restrictive laws, uncertainties, and lack of knowledge and technical guidance [8].
In contrast with this situation, the Chilean forest industry based on plantations is well developed, with a surface of 2.3 million hectares of industrial plantations under intensive management, and a consumption of 40 million m3 of roundwood coming from softwoods and hardwoods, mainly Pinus radiata D. Don. and Eucalyptus spp. [1,9], which is processed as pulp, sawn wood, veneers, and boards, among other products. In fact, only 0.6% of the 6.9 million m3 year−1 of sawn wood production comes from the 14.7 million hectares of native forests [9]. During the 20th and 21st centuries, the relative participation of the native species in the local wood market began to diminish drastically, displaced by exotic species. Thus, today, large sawmills are concentrated in exotic species, with more reliable supply chains in terms of volume and quality, while, according to INFOR [10], mainly small sawmills (below 1000 m3 year−1) account for 92% of native sawn wood, while the remaining is processed in sawmills with productions below 10,000 m3 year−1, mostly (around 80%) in portable sawmills.
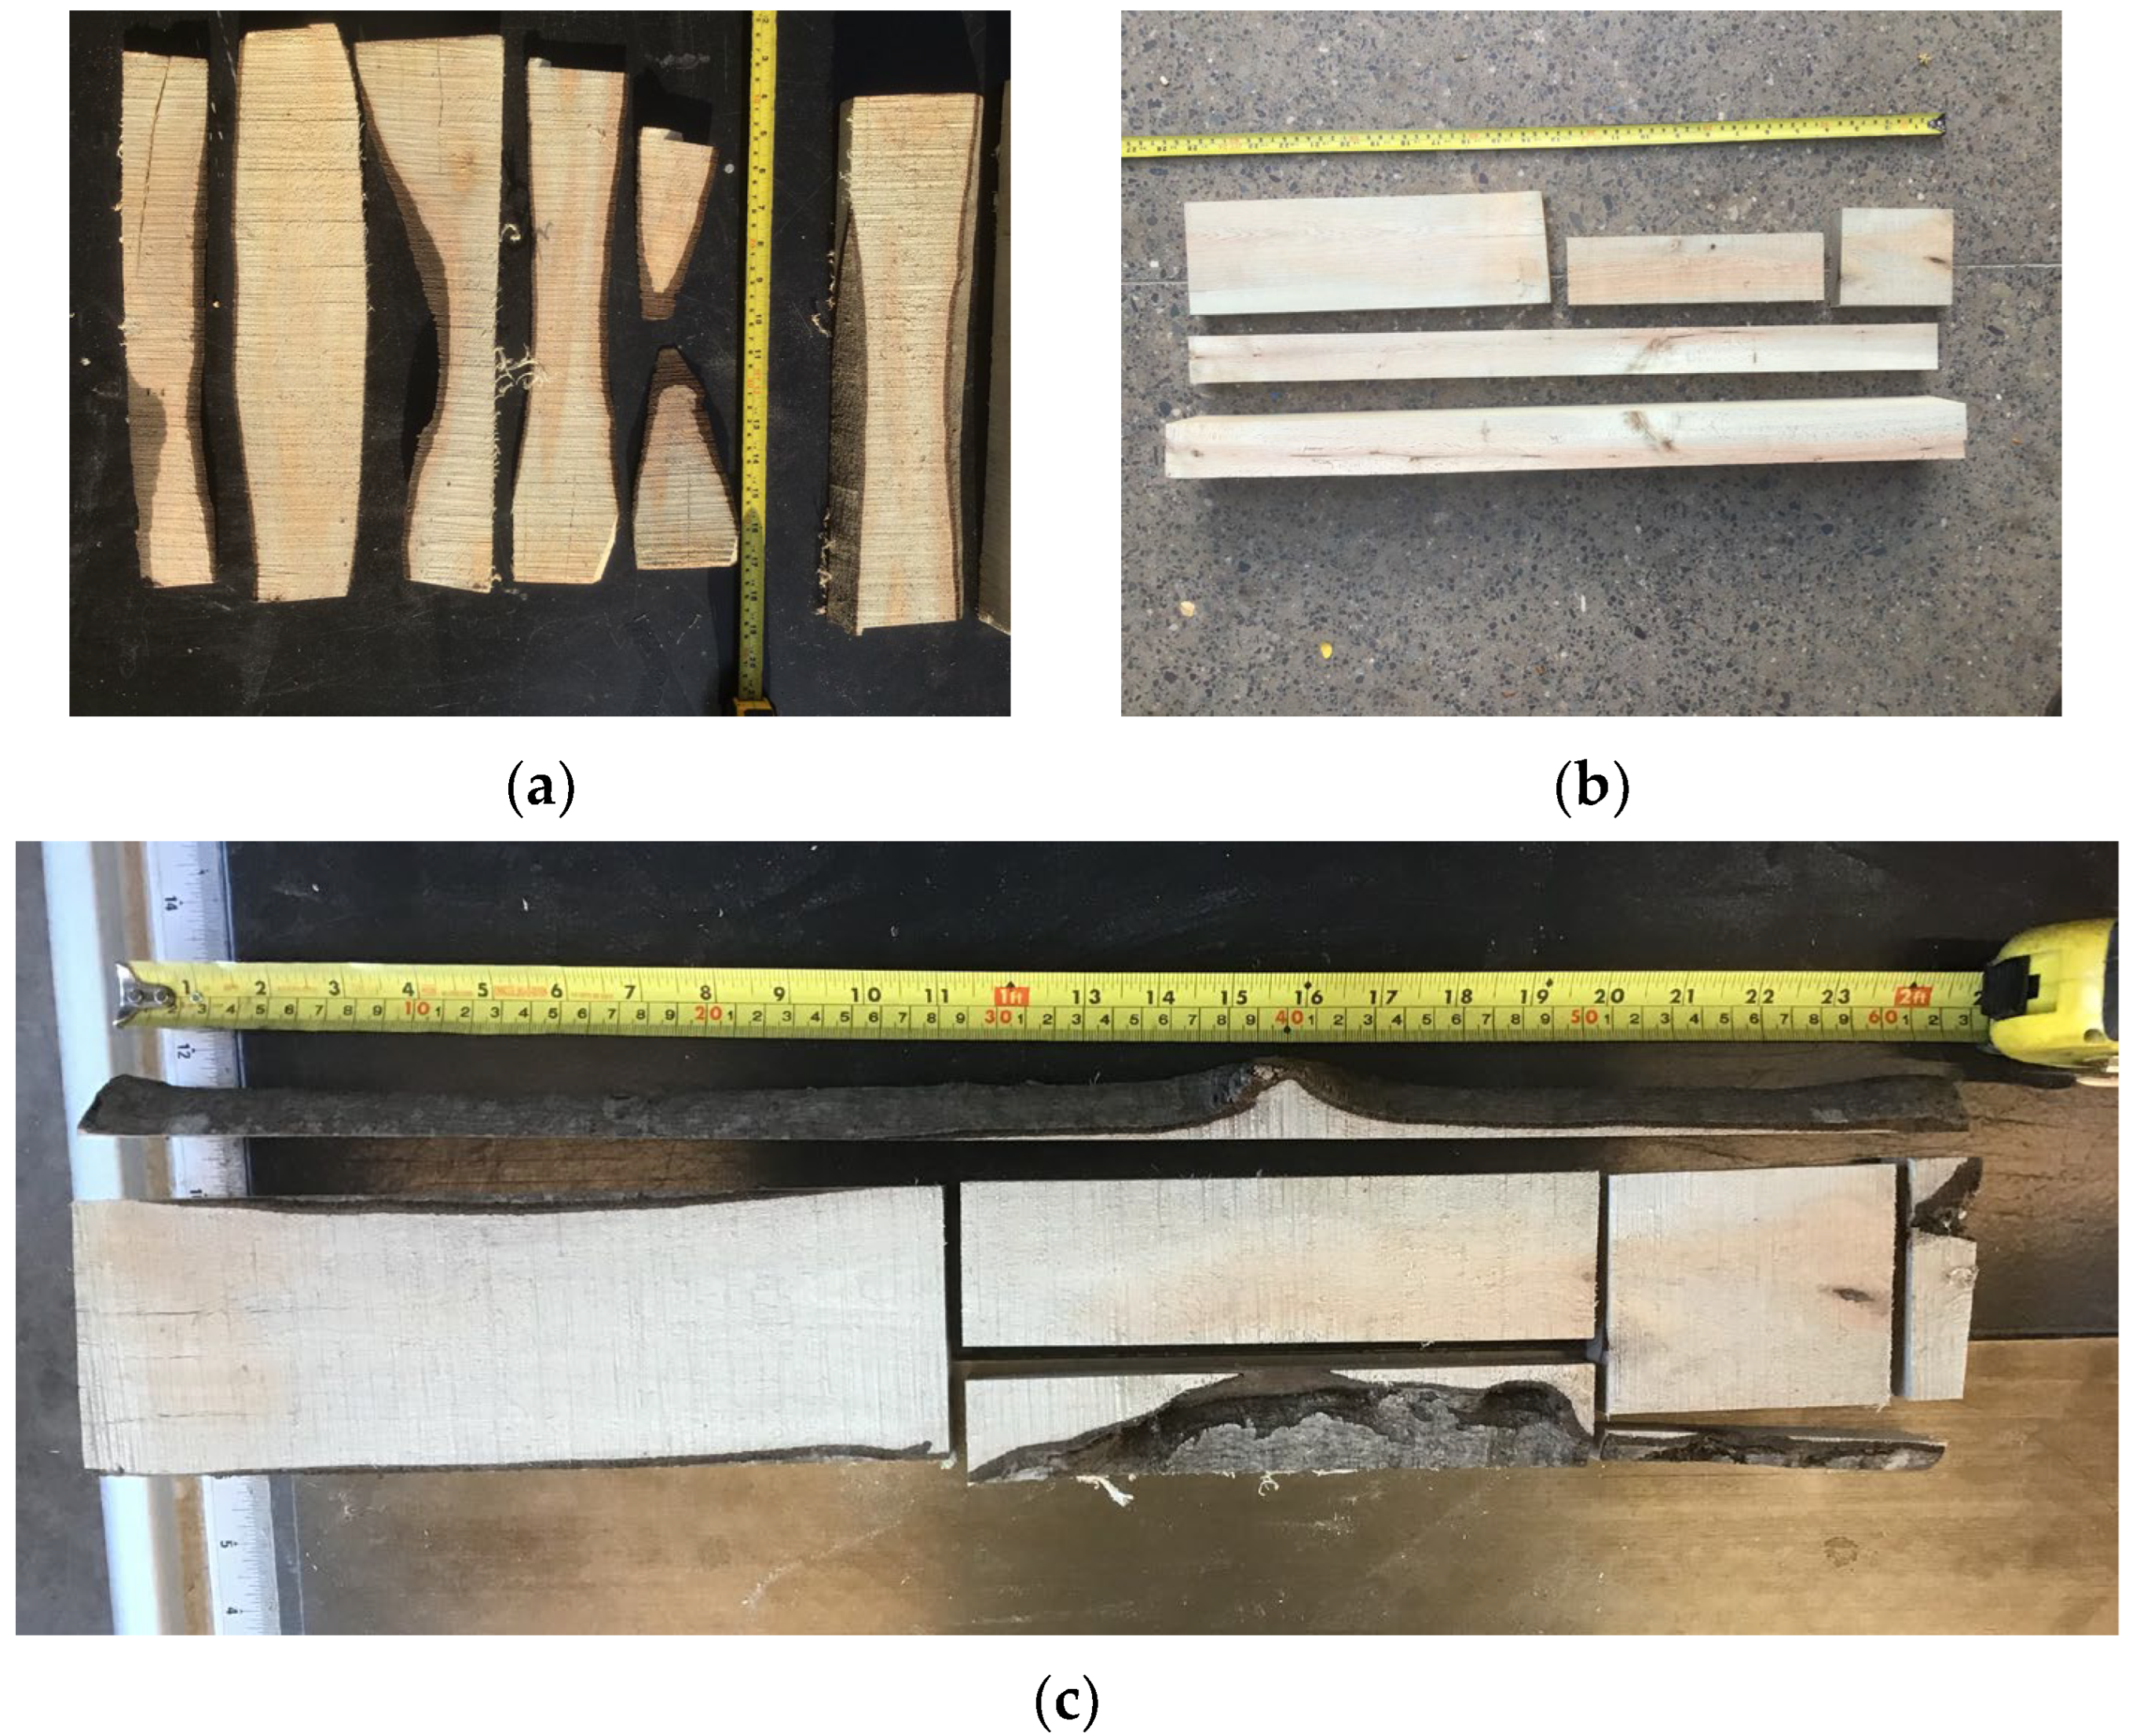
To reduce the high cost of maintaining and improving those degraded native forests, it is necessary to provide an early source of revenue to the forest owner that reduces the management cost and increases the value of the forest. The use of small-diameter logs coming from thinning, or low-quality logs unsuitable for normal sawmills, as a source of small wood pieces of variable size or cut stocks can provide an early and higher revenue for the small forest owners than using this wood as fuelwood or leaving it in the forest. It could give sustainability to the landowner and, according to Dramm [11], it can provide a viable mechanism to reduce forest fuel and the risk of fires. In this direction, Rosen et al. [12] stated that small-diameter logs from forest thinning or harvesting waste are suitable for dimension cuttings for furniture with economic potential. Still, they require a special production flow to be feasible. On the other hand, Moreno, Herrera, and Ferreira [13] state that it can be an alternative source to store carbon dioxide for extended periods, compared with its use as fuel, or if the log is left on the land to decay. The amount of biomass used as fuelwood or left in the forest is considerable, but there is a lack of reliable information to estimate the potential amount of raw material. Stern [14] has discussed using small-diameter roundwood for other uses, proposing using small-diameter roundwood directly as structural wood. Da Silva, Carvalho, Monteiro, and Pereira [15] also show that branches of Brazilian Amazon species have similar physical and mechanical properties compared with the wood from the stem.
Several authors insist on the importance of knowing the value chain from the forest to the product to adapt both sides, reducing the operational costs across the entire chain, especially for small owners [16]. Instead of looking separately at the productive possibilities of the forest and the industrial processing of the logs, it is necessary to look at the whole process and, if required, to redesign it. In this case, having looked at the forest situation, we now have to consider the industry requirements and limitations.
Analyzing now the industrial section of the value chain, in general, sawmills prefer to use large logs instead of small logs under 30 cm in diameter, because of the decrease in yield and the smaller size of the products. According to several authors, the yield can drop from 47% to 26% when the DBH diameter drops from 12 inches (30 cm) to 6 inches (15 cm) in conventional sawmills [17]. Under this approach, much wood is left in the forest or used as fuelwood, not only in Chile. To respond to the sawmills’ requirements, the forestry industry has developed different log classification systems based on logs’ dimensions and quality parameters, oriented to obtain sawn wood typically from commercial logs of at least 20 cm in diameter and commercial lengths larger than 2.44 m. Under these conditions, sawn wood yields can reach between 40 and 60% [18]. The different log grading systems can differ in several aspects, but all of them agree that high-quality logs should be large (high diameters and length) and should produce planks without defects [19,20,21,22,23]. This means that the classification and logs’ segregation systems disqualify small and defective logs, which are the focus of our research.
Recognizing the potential of small logs, in the work “Mechanical Characterization of Visually classified, small-diameter laricio pine round timber,” Fernández-Golfín, Diéz-Barra, Hermoso, and Mier [24] recognize the need to use a mixed grade system to evaluate such logs. Similar results were obtained by Vega, González, Fernández, and González [25] when analyzing Castanea sativa Mill. small-diameter logs grading. In Chile, we have the Chilean Grading System for Nothofagus grading [26], but like many international standards, it is oriented to traditional logs and would disqualify most small logs.
Studies using small-diameter logs to produce several secondary products have been conducted broadly. Experiences in the United States show the use of small logs (4–6 inches; 10–15 cm) to produce CLT (cross-laminated timber) [18]. Also, it is possible to increase the economics of forest management if 20–30% of the thinned material is processed to produce high-value products such as lumber, engineered wood products, structural roundwood, and wood composites [27]. Also, it is possible to use lesser-known species with a smaller diameter, increasing the economics and the sustainability of the harvest [28].
Experiences of using small-sized logs in Chile have been limited and mainly related to the use of logs for biomass, fuelwood, or other lower-value products [29]. Although Chile has 14.7 million hectares of native forests, the productivity of these forests has been very low, particularly affecting small owners. The main product extracted is fuelwood, which accounts for 11.77 million stm3 year−1 [30]. In recent years, only 111 thousand m3 year−1 of roundwood has been extracted from the forest, which is mainly used in the domestic market to produce sawn wood [8]. Thus, there is still a gap in research on how to generate economically viable solutions to promote the management of native forests, which would help the forest and its owners.
In this direction, the present study aims to contribute to developing a source of income that allows for a reduction in the cost of maintaining and managing the native forests by using small logs under 30 cm in end diameter and of poor quality to produce valuable forest products.
This study’s hypothesis states that a specially adapted log grading system and an innovative processing approach on small, low-quality logs can result in average yields greater than 40% for cut-stock products suitable for direct use or further remanufacture.
2. Materials and Methods
2.1. Site and Stands Description
The small logs for this study come from second-growth Nothofagus forests located in two different areas. One is the Ranchillo Alto property, which spans 561 hectares in the foothills of the Andes Mountains (37°03′59″ S, 71°38′58″ W), in Yungay commune, Diguillín Province, Ñuble Region, Chile. It has a Mediterranean climate (warm summer) with mountain influence (Csb(h)) [31], with a short dry season of four months, an average annual rainfall of 1780 mm in the form of rain and snow, and a mean annual temperature of 12 °C [32]. The predominant soil type is volcanic Andosol [33]. These forests are primarily degraded by unregulated fuelwood collection and livestock grazing by local communities.
The second area is the Elnahue Forest property, which spans 1500 hectares, also in the foothills of the Andes Mountains (36°48′ S, 71°37′ W), Coihueco commune, Punilla Province, Ñuble Region. With a similar climate, the area has an average rainfall of 2056 mm and a mean annual temperature of 12.05 °C [34]. It is also located on volcanic Andosol [33], and is covered mainly by second-growth Nothofagus forests that are heavily degraded.
2.2. Logs Selection and Transport
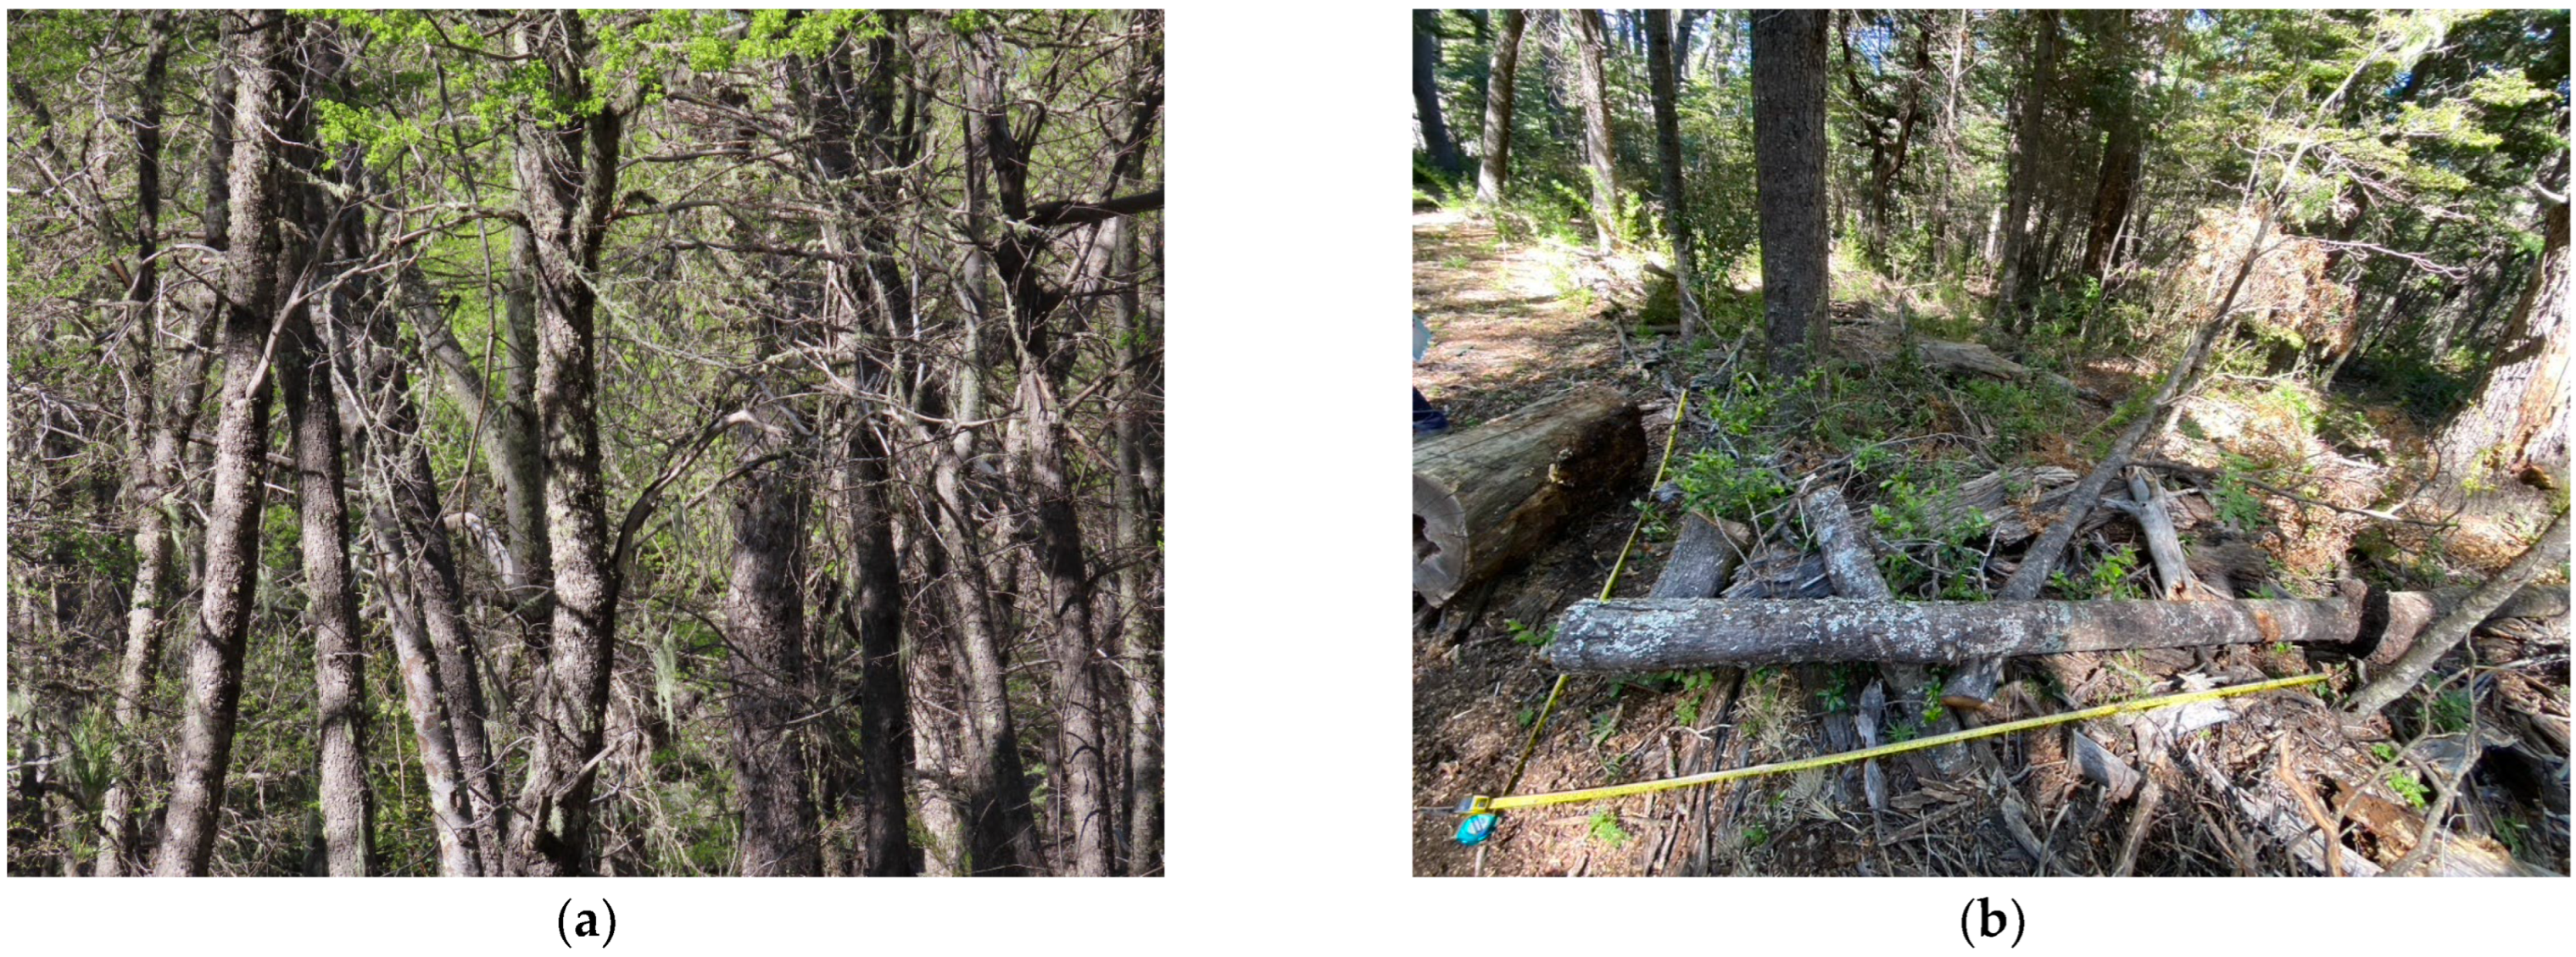
Small logs with poor characteristics for solid wood abandoned on the forest floor were selected in both areas. Figure 1 shows the general aspect of a degraded second-growth forest of Nothofagus and the discarded logs and branches on the forest floor. Selection criteria considered logs with cracks, wounds, fungal infections, curves, and mainly small diameters, among other defects. Only logs in extremely bad conditions were discarded. Logs larger than 1.6 m were cut to a maximum of this length, adjusting them to the size of a traditional pick-up truck for transportation to mimic a typical transportation system of small owners when collecting small logs for fuel. Logs were transported to the Wood Prototype Laboratory at the Faculty of Architecture, Design, and Urban Studies at the Pontificia Universidad Católica de Chile in Santiago, Chile.
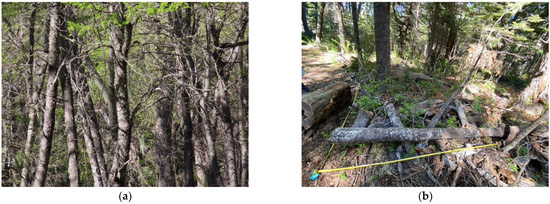
Figure 1.
(a) General aspect of the second-growth Nothofagus forest in Ranchillo Alto land; (b) typical condition of discarded logs on the forest floor.
2.3. Logs Quantitative and Qualitative Characterization
A subsample of 177 logs, including Nothofagus obliqua (Mirb.) Oerst, Nothofagus dombeyi (Mirb.) Oerst, (Nothofagaceae), Lomatia hirsuta Diels ex J.F. Macbr. and Gevuina avellana Molina (Proteaceae), Persea lingue Miers ex Bertero Nees (Lauraceae), and other species were identified by a unique code, and a quantitative and qualitative evaluation was performed. It was necessary to define a particular classification system because the already existing classification system for Nothofagus logs in Chile [22] would have discarded almost all the raw material of the project. Therefore, based on this classification system [22] and other international sources [20,21,23,26,35], a new defect measurement protocol was designed, and a special quality assessment and grading system was defined.
Total length (L, cm) and top and bottom diameter (Dmin and Dmax, respectively, in cm) were measured in each log. Dmin and Dmax were obtained as the average between two perpendicular diameters (D1 and D2, cm) to characterize the irregular-shaped logs. Total log volume (V, m3) was calculated using Smalian formulae [36], as the volume of a cylinder using the average value of Dmin and Dmax, as follows,
The denominator is a conversion factor from cm3 to m3
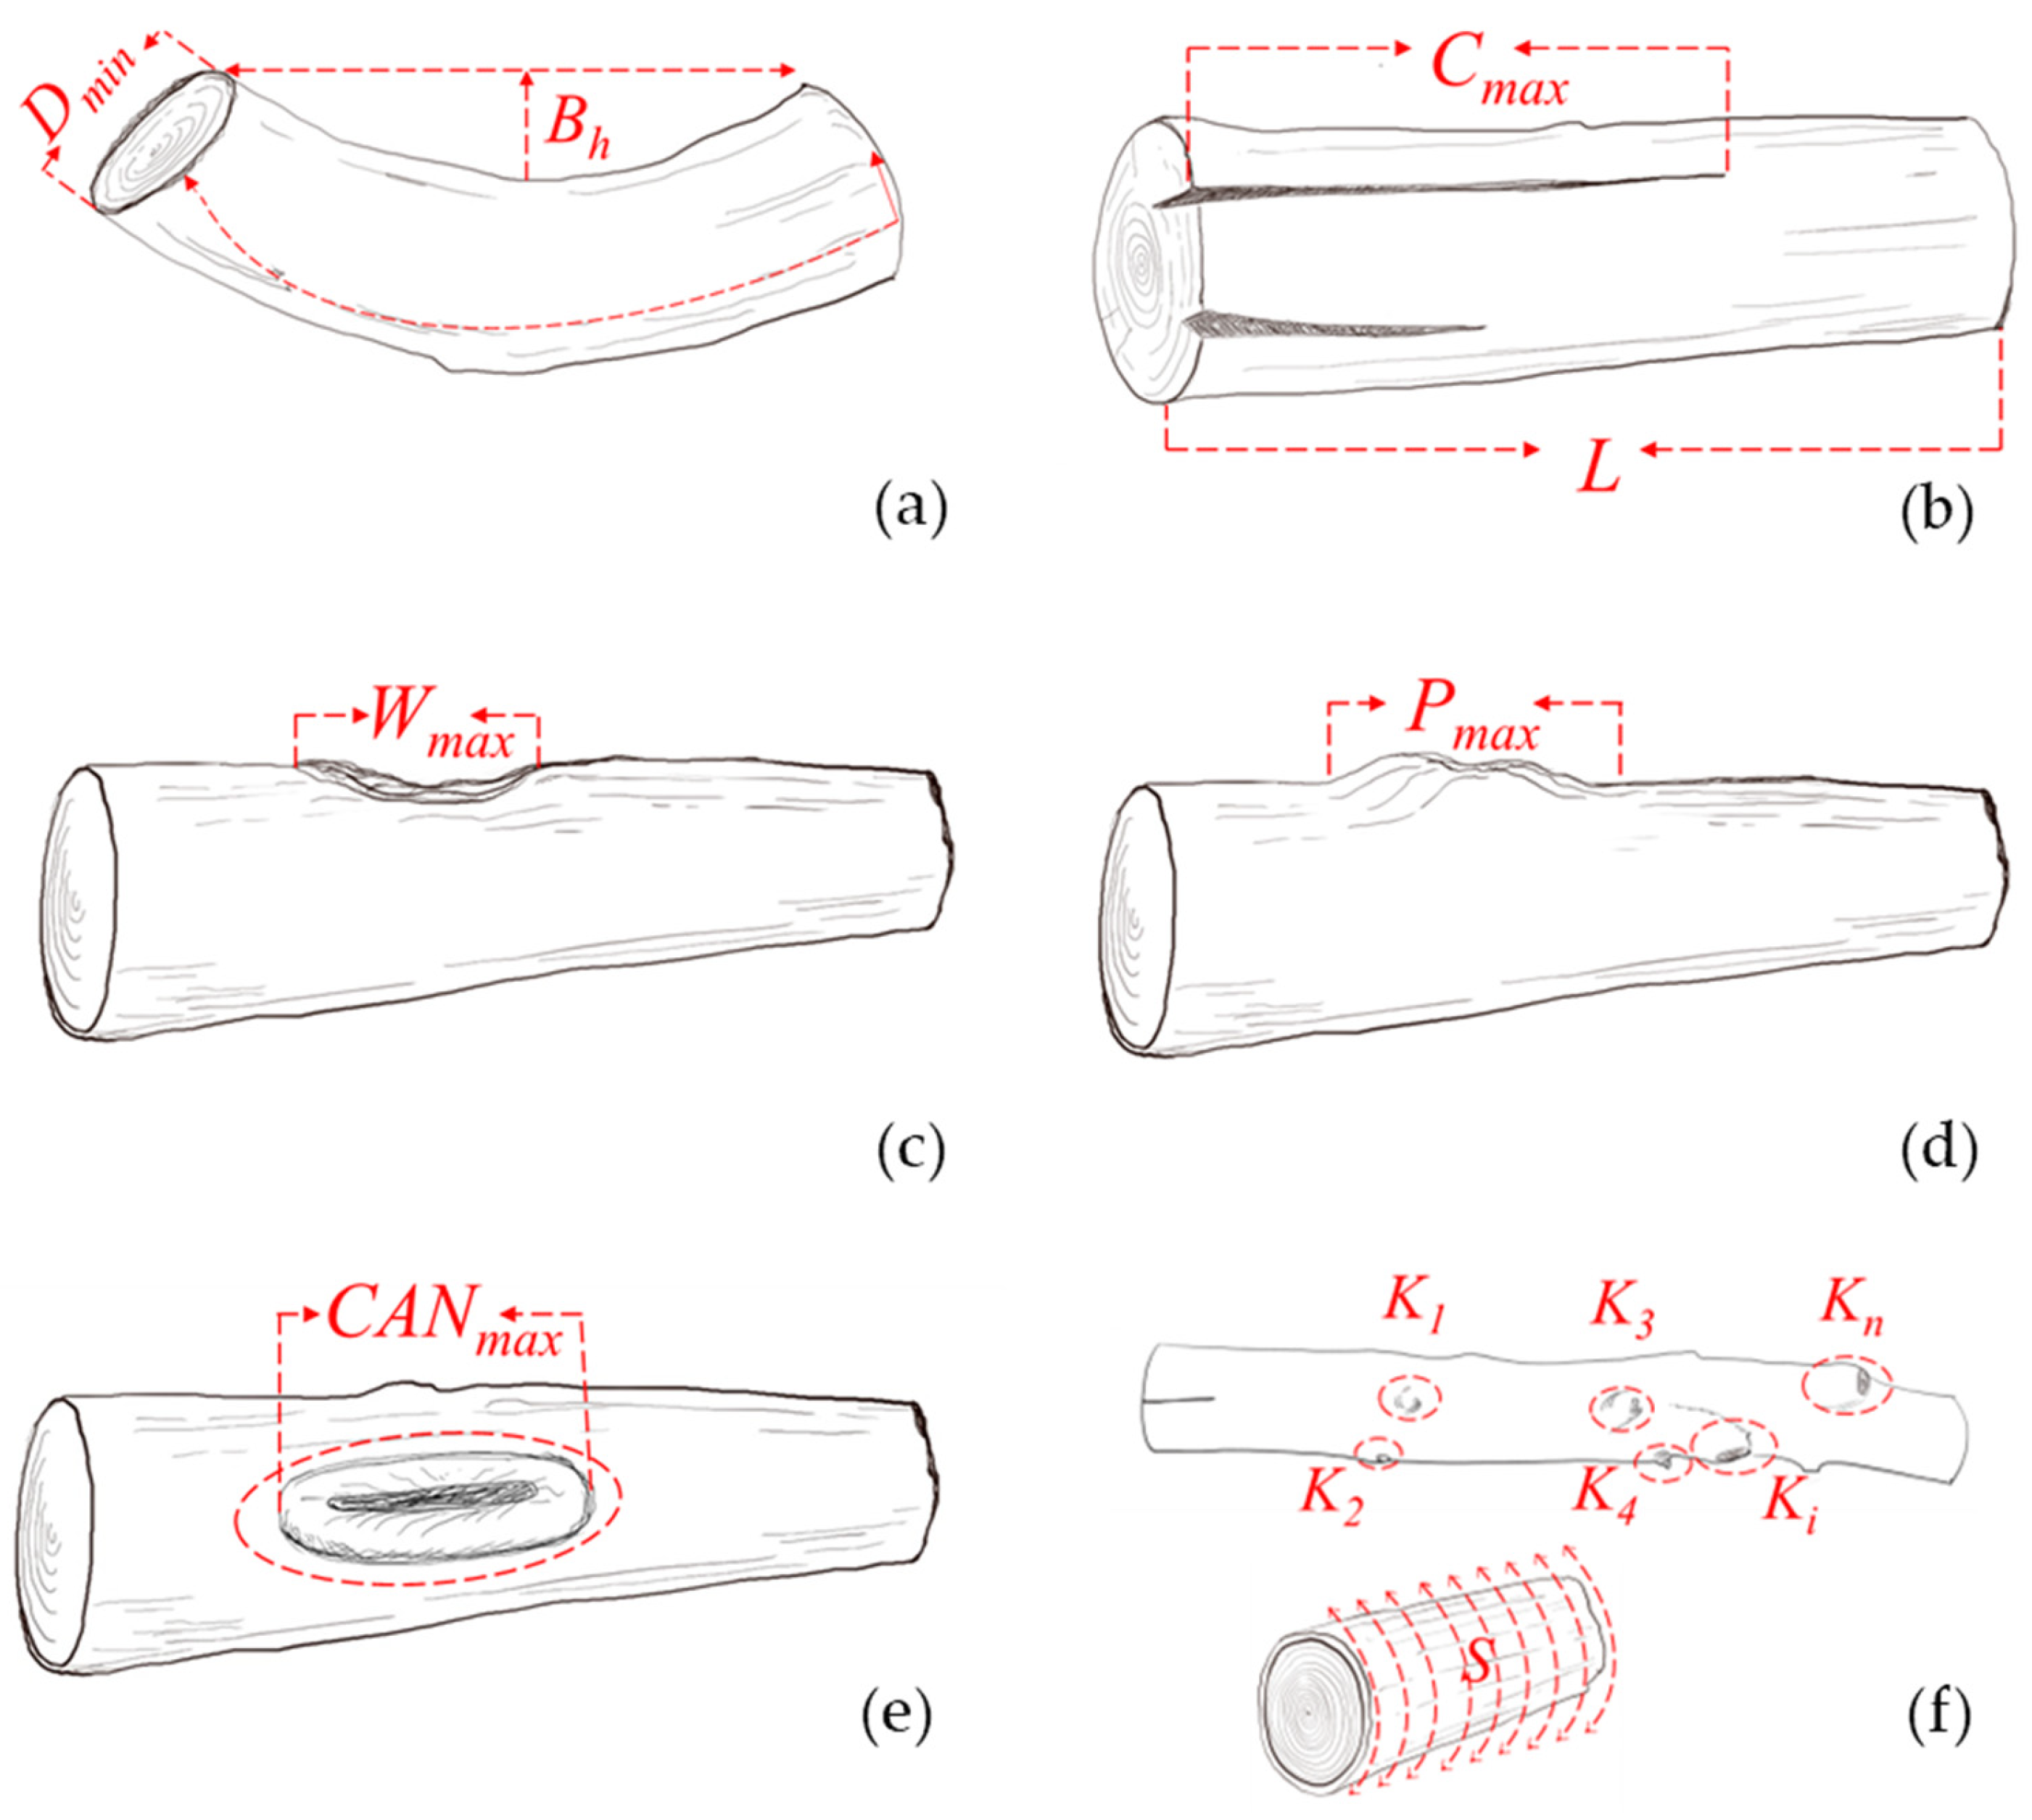
Log quality attributes of log curvature, checks, wounds, protuberances, cankers, and knots were recorded, as defined in Equations (2)–(7), and shown in Figure 2.
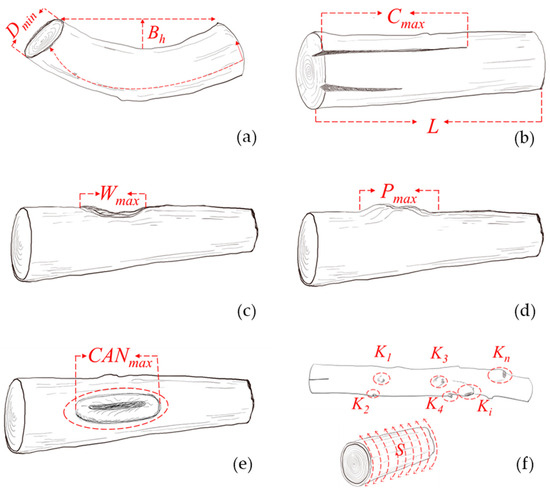
Figure 2.
(a) Log curvature (CURV, %) is the ratio between the maximum bow height (Bh, cm) and the top or smallest diameter of the log (Dmin, cm), in percentage; (b) log check (CHECK, %) is the ratio between the longest check in the log (Cmax, cm) and the total length of the log (L, cm), in percentage; (c) log wounds and holes (WOUND, %) is the ratio between the largest wound (Wmax, cm) and the total length of the log (L, cm); (d) log protuberances (PROT, %) is the ratio between the largest protuberance (Pmax, cm) and the total length of the log (L, cm); (e) log cankers (CANKER, %) is the ratio between the larges canker (CANmax, cm) and the total length of the log (L, cm); (f) knots defects (KNOT, %) is the ratio between the sum of knots Ki surface projected on the log (∑Ki, cm2) and the total surface of the log (S, cm2).
Although logs can show different curve types (end, long, multiple sweeps, and cross crock) [37], it is rare to find those complex curve types in short logs. Therefore, the curvature of a log (CURV, %) was measured as the ratio between the largest bow height (Bh, cm) and the top or smaller diameter of the log (Dmin, cm), expressed as a percentage, following the Chilean Norm NCh3223:2010 [16],
For the largest bow height measurement, the log was located against a wall with both extremes touching the wall and showing its curved form on the ground; the bow height was measured as the maximum distance between the wall and the log (Figure 2a).
After tree felling and cutting, logs begin to lose water. Wood shrinkage and internal tensions produce checks, corresponding to the separation of the tissues along the log, generally related to natural drying [35]. They usually appear on each face of the log (Figure 2b). The check quality characterization of the log (CHECK, %) was expressed as the ratio between the largest check in the log (Cmax, cm) and the total length of the log (L, cm) in percentage, as follows,
Under the name wound (WOUND, %), open wounds, anomalous depressions, and holes in the bole were grouped (Figure 2c) and recorded as the ratio between the largest wound (Wmax, cm) and the total length of the log (L, cm), in percentage, as follows,
In the same way, under the name of protuberances (PROT, %), the bulges (anomalous enlargement of the bole), bumps (protuberance on the log which is overgrown with bark), and burls (sound, stiff, woody protuberance on the bole, more or less rounded or horizontally ridged in form) were recorded (Figure 2d) as the ratio between the length of the largest protuberance (Pmax, cm) and the total length of the log, in percentage as follows,
Cankers (CANKER, %), which are necrotic wounds on the bole of a tree caused by a fungus growth [35], were recorded as the ratio between the most extensive canker defect (CANmax, cm) (Figure 2e) and the total length of the log (L, cm), in percentage,
Log knots defined as the base of pruned branches during the felling process, old branches stumps, or any defect coming from branches presence were recorded as knots (KNOT, %) as the ratio between the sum of the knots Ki defects (∑Ki, in cm2), expressed as their area projected on the log and the total lateral surface of the log (S, cm2),
As this kind of measurement is time-consuming, a visual approximation expressed as a percentage was applied.
The different defects were classified into five discrete classes. Table 1 shows the quality classes for them. Also, a categorical variable of the presence or absence of decay or insect attack (BIO) was recorded, with values of 0, 1, or 2 depending on their absence (0), presence of only one of them (decay or insect) (1), or combined presence (decay and insect) (2) (Table 1).

Table 1.
Log quality classes based on defect presence (curvature (CURV), checks (CHECK), wounds (WOUND), protuberances (PROT), cankers (CANKER), knots (KNOT), and insect attack and decay (BIO)), according to their value in percentage.
2.4. Grading Classification System
After determining each log’s defects individually, a final log grade (GRADE) was assigned, combining all the defects as a sum of their class values (Table 1), with the BIO variable multiplied by two, to gain more weight. Thus, the minimum of the two values in brackets in Equation (8), that is, the minimum value between 3 and the sum (in integer) of all the defect classes’ values, divided by a coefficient of 2.5, generates a range of log grades between 0 and 3, with zero being the best quality and three being the worst.
2.5. Primary and Secondary Logs Breakdown and Remanufacturing
A subsample of 66 logs evaluated in Stage 1 was selected for a yield study, consisting of the sawing and recovery of boards, with the main goal of maximizing recovered wood. The primary and secondary breakdowns were executed in a portable small bandsaw sawmill that can process logs of a maximum diameter of 30 cm and a maximum length of 150 cm. The sawmill has a manual log carriage with a unique design of holders every 30 cm that allows the processing of short logs. The sawmill is part of the Laboratory of Wood Processing and Prototyping at the Faculty of Architecture, Design, and Urban Studies of the Pontificia Universidad Católica de Chile. Logs were processed with bark.
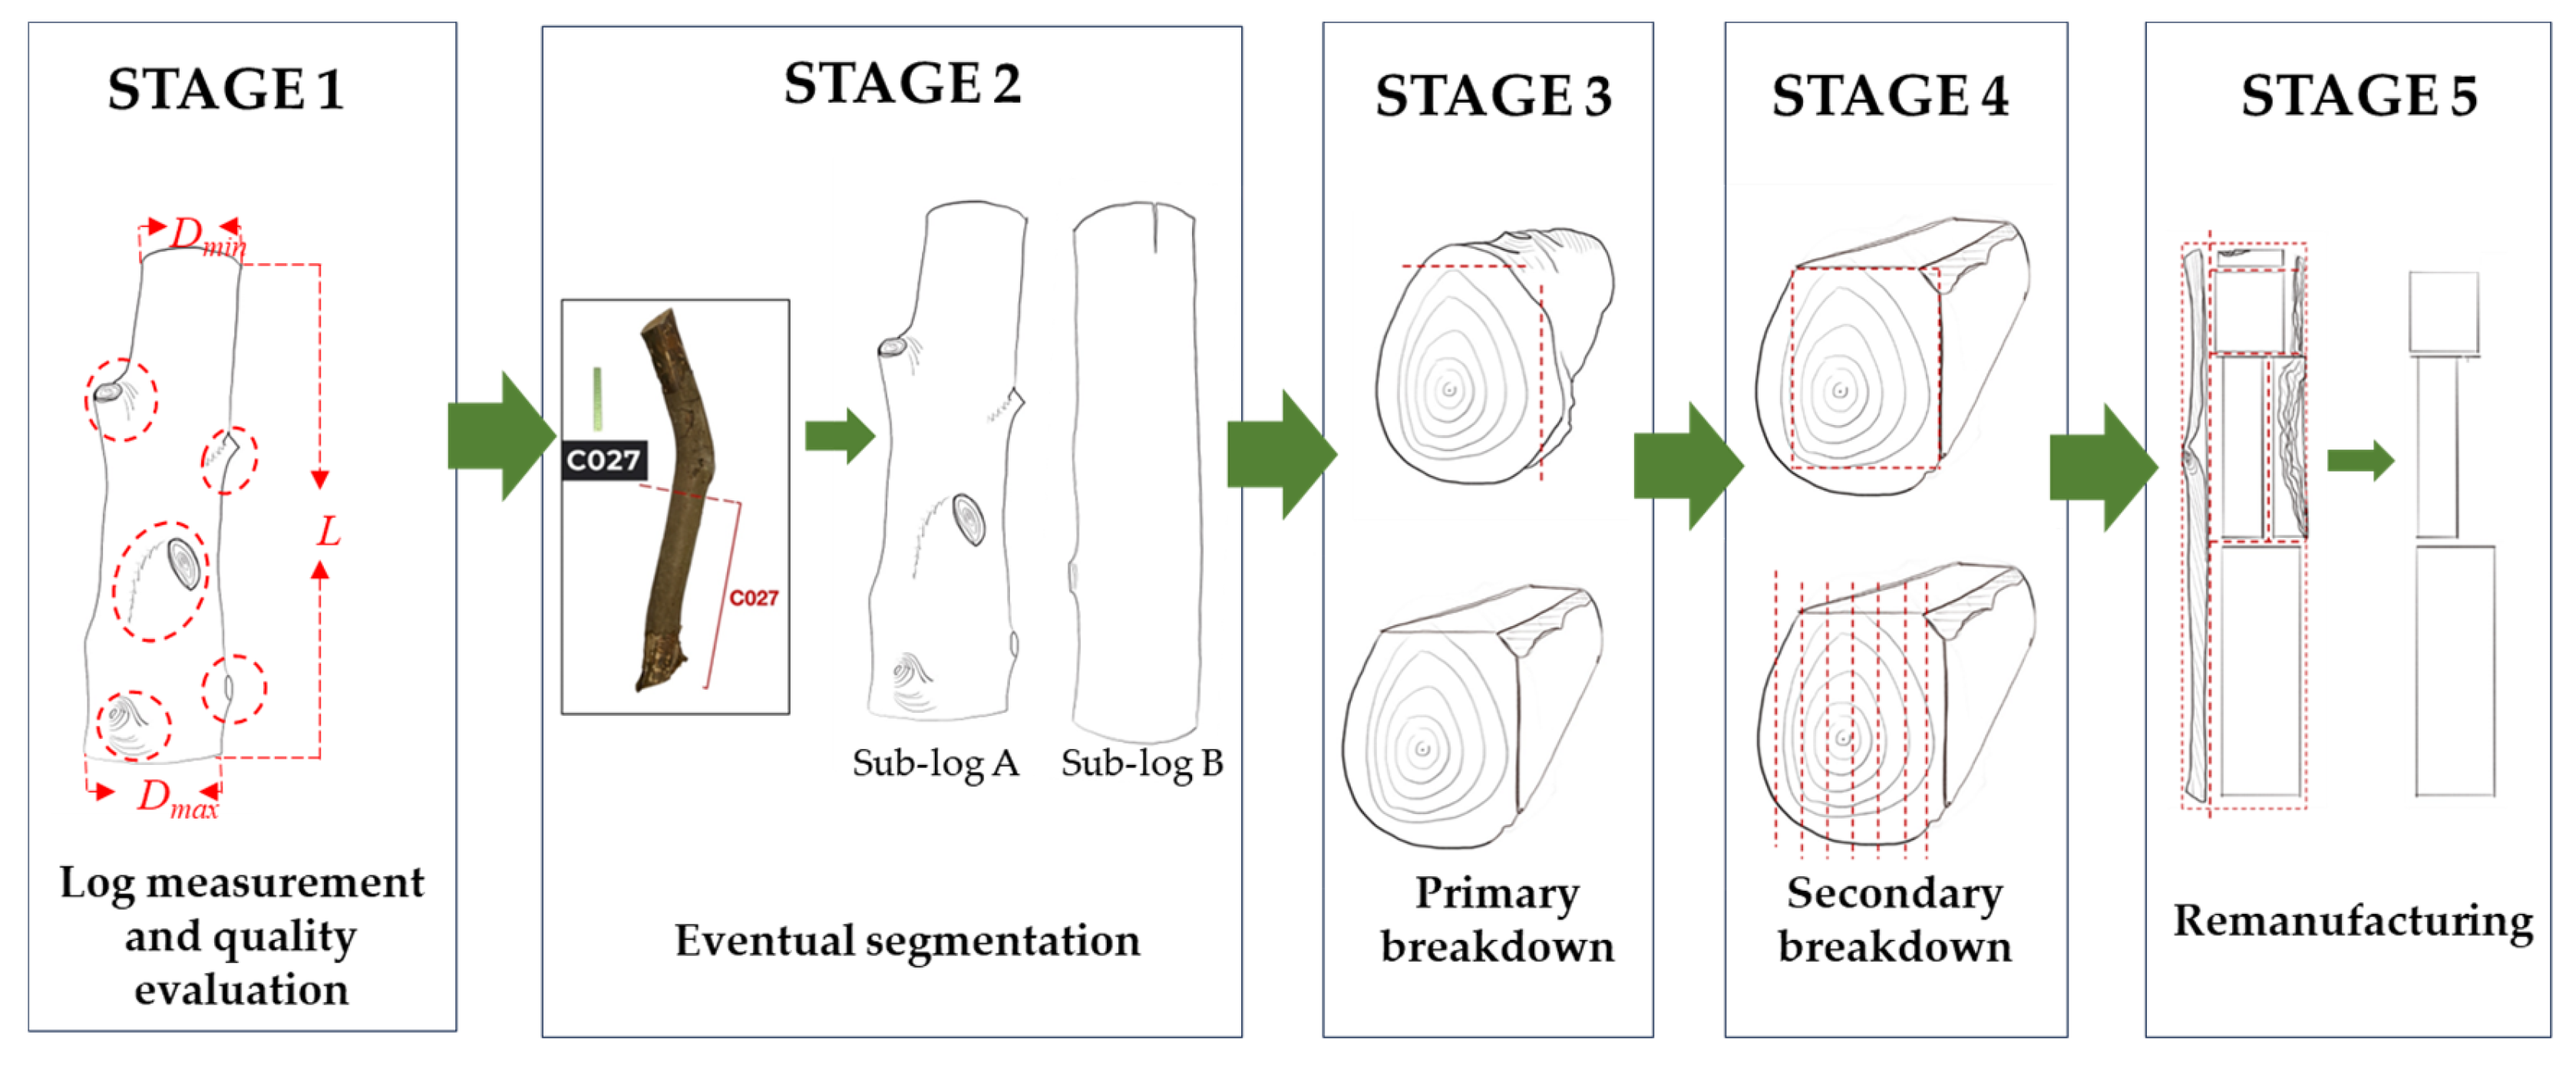
Log processing was divided into a five-stage sequence (Figure 3). Stage 1 corresponds to the log measurement and its defects evaluation, as explained in the previous section.
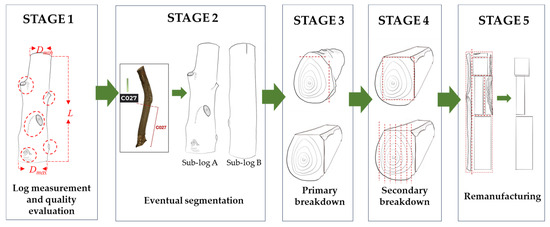
Figure 3.
The five stages of the log inspection and processing sequence are shown in the boxes. Stage 1 of log measurement and quality evaluation; dotted circles show defects (e.g., knots); Both end diameters (Dmin, Dmax) and log length (L)measurements are shown. Stage 2 of the eventual segmentation of very curved logs. Stage 3 of primary breakdown; dotted lines indicate the first two cuts letting two plane faces. Stage 4 of secondary breakdown into boards. Dotted lines show the possible cuts of fixed thickness. Stage 5 of remanufacturing, obtaining final pieces. Dotted lines show the arrangement of pieces obtained from one board, optimizing the recovery of wood in different dimensions.
Stage 2 corresponds to a Segmentation Stage (Stage 2, Figure 3). Curvature often affects logs discarded on the forest ground, leading to significant reductions in yield. Logs exhibiting pronounced curvature were strategically divided at their most curved point, resulting in two smaller yet straighter sections each.
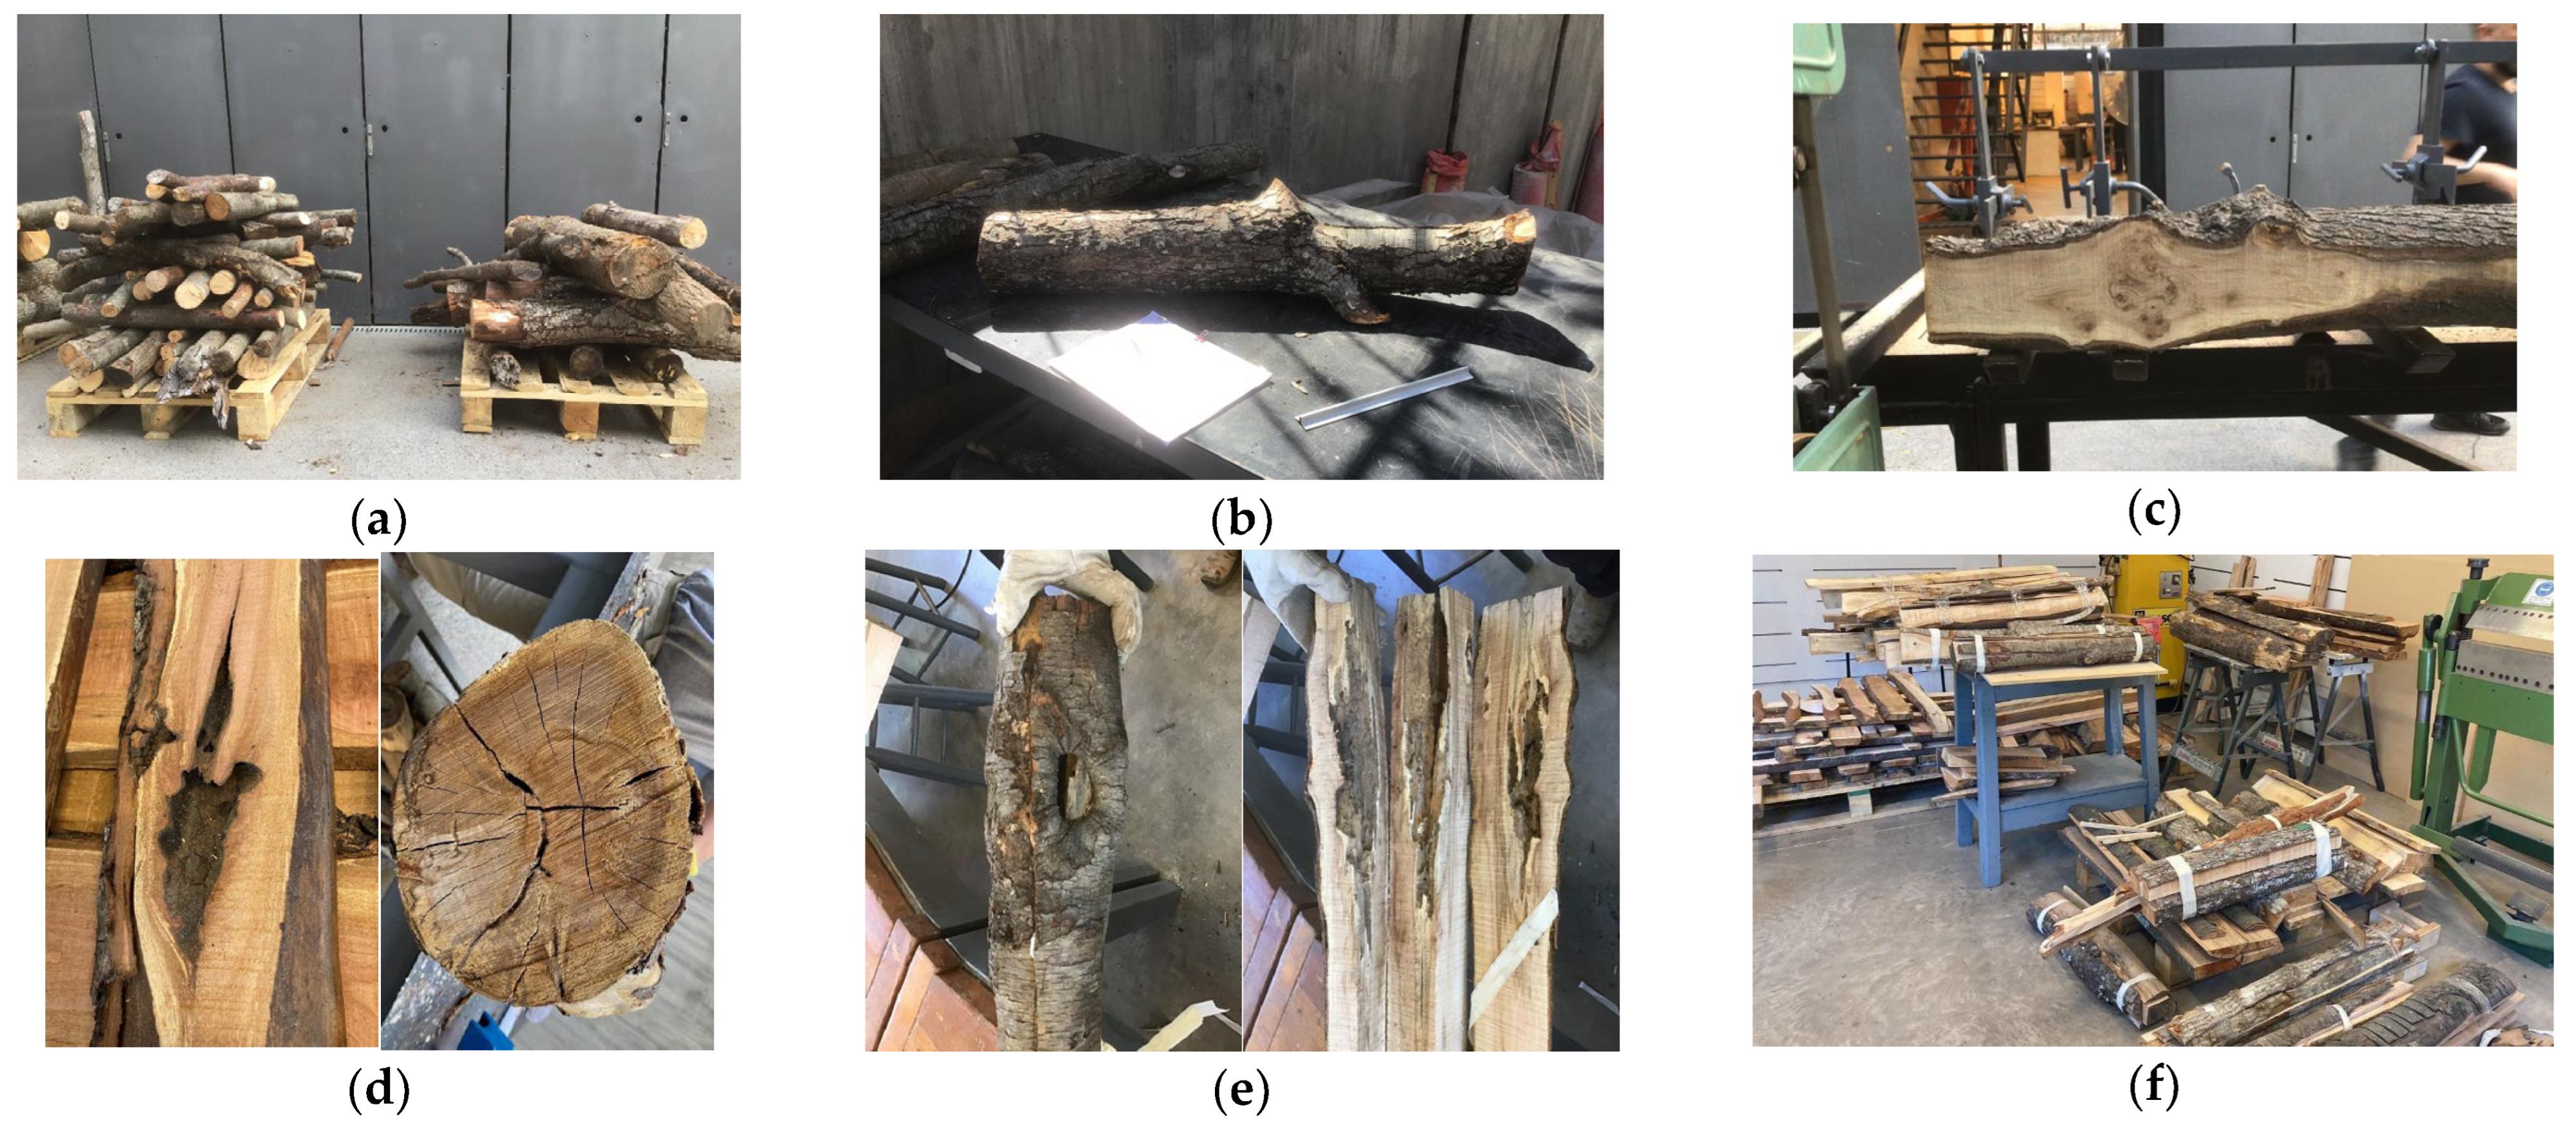
Stage 3 of the log’s primary breakdown consisted of the initial cuts to create two straight sides or semi-cant. After a visual inspection, each log was positioned for the first cut, trying to optimize the possibilities of wood recovery (Stage 3, Figure 3 and Figure 4c).
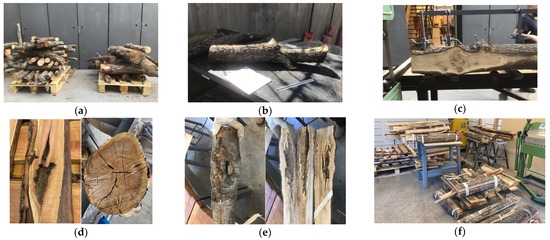
Figure 4.
(a) Pile of logs sorted by relative sizes; (b) log under quality evaluation; (c) first cut of an irregular log but with sound wood; (d,e) examples of the multiple defects present in the logs; (f) bundled logs after primary and secondary breakdown.
Stage 4, subsequently, consisted of the cutting of boards of fixed thickness, typically 2.5 to 5.8 cm (equivalent to 1 to 2 inches); occasionally, a cant (log slabbed on one or more sides) was obtained if log dimensions allowed (Stage 4, Figure 3). After processing, all parts of each log were bundled, labeled, and preserved together (Figure 4f). Figure 4 shows some examples of the processing system.
In Stage 5 (Figure 3), each board, still with bark, underwent planing in a wood planner, was measured, and the best combination of internal pieces was drawn on its surface, followed by secondary sawing and sizing (Figure 5). Through sawing and sizing, efforts focused on eliminating major defects like rot and worm galleries to ensure the final timber product met quality standards. The final recovered pieces per log were measured (Figure 5b), and the total yield for log j (YIELD, %) was calculated as the ratio between the total volume of the recovered boards (BOARDi, m3) and the initial total log volume (V) in percentage, as follows,
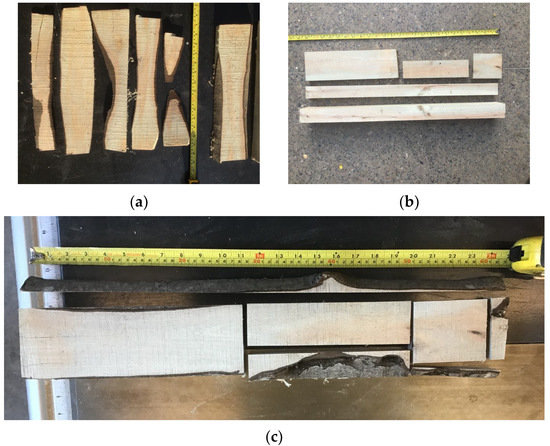
Figure 5.
(a) A set of boards obtained from one log; (b) remanufactured boards obtained from one log; (c) an example of the maximization of board yield by selecting different sizes and arrangements.
2.6. Board Quality Classification
Each board was visually inspected for quality assessment. The percentage of both surfaces affected by checks, decay, insect galleries, and knots was recorded, with the first three defects recorded in a summarized percentage value. A final value of board defects percentage (BOARD.DEFECTS%) was defined as:
Table 2 shows the definition of quality classes of the boards.

Table 2.
Quality classes of boards based on the percentage of presence of checks, decay, and insect galleries (BOARD.DEFECTS%).
2.7. Data Analysis
Each defect’s average, minimum and maximum value, and standard deviation were calculated. The frequency of each defect was obtained. The final log grade and yield per species are presented. The boards obtained and measured after remanufacturing were classified by thickness, width, and length, and their quality was related to the original log quality by Spearman correlation coefficient. The lengths and widths vary, and they are adapted to each primary board size and defect to obtain the maximum wood recovery after eliminating major defects. Therefore, to present the results, the dimensions of the final boards are given in size classes. For width and thickness, the classes are of 2 cm, range, and are nominated by the higher integer value of the class. For example, width class 6 corresponds to boards in the interval of 4 < x ≤ 6. In the case of length, the classes are 25 cm in range; the upper limit value of each class is the nominal value. Thus, length class 40, for instance, corresponds to the interval 20 < x ≤ 40.
Data were processed and analyzed with Microsoft Excel (version 2057) and R Core Team (v2021) [38].
3. Results
3.1. Main Logs Variables and Physical Defects
Table 3 shows the main variables and defects obtained from the 177 logs analyzed, including N. dombeyi (n = 50), N. obliqua (n = 56), P. lingue (n = 6), G. avellana (n = 11), L. hirsuta (n = 51), among other species (n = 3).

Table 3.
Main size variables of the logs by species and total (n = 177).
It is important to mention that the volumes of the logs, due to their small diameters and lengths, are significantly lower than the standard logs processed in a sawmill. While regular logs typically range from 0.1 to 0.8 m3, the small log volumes yield an average of 0.014 m3, posing unique challenges to sawmill operations. The most common defects observed were knots (95%), log curvature (79%), and checks (46%).
Occurrence of Defects on Logs by Species and Log Quality Classes
Table 4 shows a heat map of the occurrence of defects on logs by species and log quality classes.

Table 4.
Occurrence of each defect class by species and log quality classes (n = 177) in percentage of logs.
The main results obtained from the defect analysis are:
- Knots: All the species were classified as class 1 and, in some cases, class 0 or 2. The occurrence of classes 3 and 4 is not common.
- Curvature: All the species have a wide distribution of the logs’ curvature classes except for P. lingue, with 100% of the sample in class 0.
- Wounds: All the species have a low number of wounds, with a clear predominance of class 0.
- Check: All species have a wide distribution of check classes, except P. lingue and others, where only two classes are present.
- Biodeterioration: All species have a wide distribution, but with a predominance of class 0, except P. lingue, where all the logs are in class 0.
- Protuberances: All species have a marked predominance of class 0, except G. avellana, which has a broader distribution.
- Cankers: All species have a marked predominance of class 0.
- On average, curvature, knots, and checks were the most predominant defects. They all have important effects on the final product’s quality; therefore, the sample adequately included the primary log defects.
It is necessary to note that the small number of P. lingue logs processed can lead to overestimating the species’ log quality.
3.2. Log Quality Classification
Based on the log sample, the obtained classes, and the formula to calculate log quality or GRADE (Equation (8)), the following classification was obtained for the logs by species and the aggregate, as shown in Table 5.

Table 5.
Occurrence of log grade classes by species and total (n = 177).
Sixty percent of the evaluated logs are classified as poor or very poor quality (Class 2 and 3), while only 40% fall into category zero or very good quality. Among the species, P. lingue, a very valuable species that has almost disappeared from the market because of the lack of mature individuals, showed a promising 84% of its logs in classes 0 and 1, followed by N. obliqua with 52%, and G. avellana with 36%. Despite the good results of P. lingue, they should be taken with caution, given the small size of the sample (n = 6).
3.3. Sawing Process Result
A subset of 66 logs was processed in the sawmill, obtaining 235 boards of different sizes in width, thickness, and length. The presence of Lomatia hirsuta was diminished in this subsample, and therefore, it was integrated into the group Others. Table 6 shows the yield obtained by species and the aggregate.

Table 6.
Sawn wood yield by species and total.
The species N. dombeyi shows the best yields with an average of 42% per log and a standard deviation of 16.7%. Good results were also obtained in cutting G. avellana and P. lingue with a yield of 39%, followed by N. obliqua with 34%. The other processed species showed low yields (25%). Maximum yield values like 85% in N. dombeyi and 69% in G. avellana show that there are possibilities to increase yield. When analyzing the subsample of logs with yield above 50% (non-shown data), it is coincident that the logs have no or minimal curvature, and an average log grade of 1.3, that is, on average, good quality logs.
Using all the data, an expected positive correlation of r = 0.458 (Spearman coefficient of correlation) exists between log volume and the obtained board volume.
Board Dimensions
Depending on each log’s best cutting scheme, the sawing process generated 235 boards of different widths, thicknesses, and lengths. Tables S2–S4 show the board sections obtained during the sawmilling process, expressed as a combination of width and thickness classes, width and length classes, and thickness and length classes. Table 7 shows data agglomerated by thickness, width, and length classes.

Table 7.
Board dimensions classified by width, thickness, and length classes.
- According to the results in Table 7 and Table S2, most of the sections belong to the thickness classes 2 and 4 cm and to the width classes 4 to 14 cm, totaling 80% of the boards. The most frequent lengths were in the classes 50 to 100, totaling 85% of the boards (Table 7 and Table S3). There are also some trends in obtaining longer boards in larger width classes, which can be related to larger logs.
- As thickness depends more on the cutting schedule, there is no clear relationship between thickness and the length of the boards (Table S4).
Table 7 also shows a high dispersion of sections and lengths obtained in the process. The category with the most boards (6.4%) was 4∙14∙100 cm, followed by 4∙8∙100 cm, 4∙6∙50 cm, 4∙8∙50 cm, 4∙16∙100 cm, comprising only 16.6% of the obtained boards.
3.4. Board Quality Classes
Table 7 also shows the average quality of the boards by the combination of width, length, and thickness classes.
Higher qualities are in the thickness classes 2 and 6. The worst quality appears in the 6 and 8 thickness classes. The best board qualities are obtained in the 2 and 4 width classes, followed by 6 and 10.
Table 8 illustrates the relationship between the original logs’ quality and the boards produced from them, both for individual species and the aggregate of all species. The quality of the logs is categorized into classes, with “0” representing the best quality and “3” representing the worst. The board’s quality is expressed in classes from 1 to 3, with 1 being the best quality. A Spearman correlation coefficient between the logs and the corresponding board qualities is presented.

Table 8.
The relationship between the logs’ quality and the obtained boards’ quality.
As we can see, generally, higher-quality logs tend to produce higher-quality boards. Logs classified as quality 0 and 1 predominantly yield boards of quality 1, and logs classified as quality 2 and 3 primarily result in boards of quality 2. In addition, the behavior of log quality correlating with board quality is largely consistent across individual species. In all cases, the correlation, although quantitatively low, is positive.
However, there was an exception in N. dombeyi, with a very low correlation (r = 0.091), where logs of quality class 2 present mostly good quality boards in class 1. In this case, the absence of central decay in the logs of quality 2 impacted the results. On the other hand, there were some cases of logs classified with 0 or 1 in quality, but after the breakdown, undetected internal decay lowered the yield and quality of the resulting boards.
4. Discussion
One of the project’s goals was to work with small-sized and poor-quality logs, proposing a special log classification system. The proposed classification system results show that 61% of the logs were of poor or very poor quality (log grade classes 2 and 3). This is consistent with the selection pattern used in the forest, prioritizing poor quality log recollection to avoid saw yield overestimation.
After the sawing process, the total yield is acceptable, reaching 36% on average, but lower than the 40% proposed in the hypothesis. The explanation could be in the selection of the logs in the forest, with a major presence of low-quality ones, a selection oriented to avoid overestimated results. Thus, following the proposed log classification system, we could consider the present results as a bottom line of yield that could be improved by choosing better logs in the forests. The subsample of logs with a yield above 50% had, on average, a quality grade of 1.3, reflecting the space for yield improvement by selecting logs by their quality. Thus, applying the classification system of logs developed in this study in the field, and prioritizing logs class 0 and 1, the yield and general quality of the resulting boards would necessarily increase.
The results also show that the proposed classification system adequately reflects the quality of the logs, is oriented towards solid wood production, and is in itself a significant contribution to the field, paving the way for future studies and commercial applications for low-value logs. As stated by different authors [24,25], this kind of raw material needs a special classification system. As far as we know, it is the first log classification system for small logs proposed in Chile, and its use could be tested and expanded in other types of forests.
Finally, it is important to highlight that two species yielded close to 40%, G. avellana and P. lingue, and one above it, N. dombeyi, with 42%. It reinforces the possibility of interesting yield increments by implementing the classification system in the field to increase the proportion of productive logs. Implementing such a methodology will require on-site deployment and training. Still, our experience with forest workers has shown that after proper training, the workers quickly incorporate the new methods and improvements.
The obtained volumetric yield of 36% on average is already an achievement when comparing our results to other studies, such as one using native woods in Brazil, which obtained an average of 44% yield [39] using logs with an average diameter of more than 55 cm. According to Fredriksson et al. [40], it is a fact that processing small-diameter logs results in a lower volumetric yield when compared to large-diameter logs. When comparing our results with those of Wagner et al. [17], reporting the yield dropping from 47% to 26% when the DBH diameter drops from 12 inches (30 cm) to 6 inches (15 cm) in conventional sawmills, a 36% yield demonstrates that the proposed method is a promising possibility for small and low-quality logs.
The results obtained from the sawn process are in line with the bibliography, giving better lumber quality from better quality logs, as stated by Chiorescu and Grönlund [41]. Also, Cumbo, Smith, and Becker [42] indicate that when diameters are below 10 inches (25 cm), the quality of the board obtained is reduced when the diameter of the roundwood is small. This pattern has not been detected in our study mainly because the selection of materials performed by Cumbo, Smith, and Becker does not consider damages or sweep.
Still, intensive work is required to maximize the yield, which will probably reduce the efficiency of the sawmill if the sawing and cutting decision process is performed manually. In a study with beech [43], the energy used to process large diameter logs (40–49 cm) of high quality, compared to process low diameter logs (30–34 cm) of lower quality, increases from 840 kWh m3 to 1350 kWh m3. The automation of the sawing process could be a future area to explore.
As the obtained yield is below the normal sawmill yield, a desirable use of the obtained cut-stocks should be products with a high value in the markets, based on design, and desired attributes such as quality, domestic origin, and environmental friendliness, as stated also in other studies [44]. The international trends related to responsible consumption, fair-trade, eco-friendly, eco-design, recycling, and reusing show an opportunity for developing and commercializing wood-based products using raw material considered waste, like in this research.
Another question that arises is the production capacity using small wood logs. To have a profitable sawmill, a minimum monthly production must be achieved. In this study, the entire process was performed manually and carefully to obtain the maximum yield of each log and piece, contributing to a long production time, which, under operational conditions, will elevate the costs per cubic meter of resulting wood. Already, Stanula, Wieruszewski, Dynowska, and Adamowicz [45] have shown that the productivity of a sawmill is low with small diameters.
The results demonstrate the effectiveness of the flexible sawing pattern used in the study to optimize wood recovery from small logs. The variety of board dimensions indicates that small-diameter, non-saw logs, often considered waste, can be processed into diverse products suitable for direct use or remanufacturing. But, while showcasing the ability to recover diverse products, the high dispersion of board sizes also implies challenges for industrial-scale replication, including the manipulation, sorting, packaging, and subsequent commercialization of the boards. This suggests that while technically feasible, profitability at an industrial level necessarily requires further studies to optimize the process, and probably the adaptation of existing technologies to these different formats. In summary, it requires a distinct concept of wood production. It would not be the first time the forest industry has been confronted with the necessity of changing processes. As an analogous example, during the 20th century, the industrial plantations with shorter rotations and smaller diameters, and the reduction of large diameters in the native forests, moved the sawmill manufacturing industry to develop a new brand of sawmills for smaller diameters.
The irregular geometries of the logs can be seen as an opportunity, because they generate unique textures and attributes (Figure 6), but also as a drawback while selecting and analyzing them individually. Nevertheless, the growing process of automation tools could lead, in the future, to an optimized processing of this kind of log.

Figure 6.
Layout of the industrial process, from logs geometry analysis, defects qualification, processing schedule, and diversity of products for remanufacturing composite products (floors, decks, beams, others), to small pieces products based on diverse basic geometries (parallelepipeds, cylinders, boards), as examples of the multiple market uses of the obtained cut-stocks.
In this complex supply chain, a broader view is necessary. There is an international compromise with the bioeconomy, giving an impulse to conduct research related to the integration of forests in those global goals, with Germany and Sweden’s examples of investment in developing new solutions based on forests [46,47]. With the idea of new solutions scoping with those global goals in mind, we can stress that our results could contribute to reducing the fuel on the forest ground, diminishing the risk of intense fire events, a central problem in Chile, which has suffered, in recent years, a large megadrought of more than 12 years [48], with large wildfires affecting native forests and plantations. This extracted fuel would contribute to the preservation of our forests and provide an early and higher revenue source for small forest owners, reducing the opportunity cost of maintaining and managing native forests. Proper management will benefit the growth of forests by fixing more CO2, and the resulting wood, if used in solid products and not in fuel, will keep this CO2 out of circulation. Therefore, timber obtained from small, discarded logs contributes in several ways to our global issues.
Innovative and open-minded research in this area must be addressed and evaluated under this broader horizon to understand its contribution properly.
For Chile, it could help to change the paradigm in the management of native forests, moving from a model of subsistence and degradation to one of more flexible and innovative valorization, in alignment with global trends of responsible consumption and bioeconomy.
5. Conclusions
Utilizing small-diameter logs, which are traditionally discarded as fuelwood or left in the forest, represents a significant potential source of early income for small forest owners. This approach offers a better economic alternative to fuelwood use. It can foster proper forest management and reduce the accumulation of combustible material on the forest floor, lowering the risk of intense fires. Despite the low productivity of Chilean native forests (with 14.7 million hectares of native forest, only 111 thousand m3 of roundwood are extracted annually for sawn wood, compared to 1416 thousand stm3 of fuelwood), this study demonstrates that low-value logs can achieve average sawing yields of 36%, with species like N. dombeyi reaching up to 42%.
The remanufacturing of small logs aligns with international trends in responsible consumption, fair trade, and eco-design, opening new market opportunities for wood-based products. Beyond its economic value, this practice contributes to the bioeconomy by transforming forest waste into higher-value products. It offers an alternative for long-term carbon dioxide storage compared to its use as fuel or if left on the forest floor. While the yields from small logs (36% average) are lower than those from conventional sawmills processing larger logs (40–60%), they are considered reasonable given the native forest conditions and small diameters. The considerable amount of biomass left in the forest or used as fuelwood ensures a high volume of raw material for future industrial uses.
Processing small-diameter and low-quality logs presents significant technological hurdles impacting profitability and efficiency. Conventional sawmills prefer large logs due to drastically reduced yields with smaller diameters, potentially dropping from 47% to 26%. Inherent defects like knots (95%), curvature (79%), and checks (46%) further complicate processing. Existing classification systems are inadequate for small logs, leading to a high proportion (60%) being classified as poor quality. While a 36% sawing yield was achieved, it required intensive manual labor, suggesting industrial-scale replication would be challenging and costly. Further research is needed to develop profitable industrial processes for this raw material.
Supplementary Materials
The following supporting information can be downloaded at: https://www.mdpi.com/article/10.3390/f16091456/s1. Table S1. Defects of the logs by species and total (n = 177). Table S2. Board dimensions classified by width and thickness classes. Table S3. Board dimensions classified by width and length classes. Table S4. Board dimensions classified by thickness and length.
Author Contributions
Conceptualization, M.P.F. and R.M.A.; Data curation, M.P.F.; Formal analysis, M.P.F., R.M.A. and E.P.; Funding acquisition, M.P.F., R.M.A., F.C. and J.P.E.; Investigation, M.P.F., F.C., R.M.A., J.P.E. and E.P.; Methodology, M.P.F., F.C., J.P.E., R.M.A. and E.P.; Project administration, M.P.F.; Resources, M.P.F.; Supervision, M.P.F. and R.M.A.; Writing—original draft, M.P.F., R.M.A. and E.P.; Writing—review and editing, M.P.F., R.M.A., E.P., F.C. and J.P.E. All authors have read and agreed to the published version of the manuscript.
Funding
This research was funded by the Native Forest Research Grant (Fondo de Investigación de Bosque Nativo in Spanish), Corporación Nacional Forestal (CONAF), Grant (017/2020). The Chilean National Commission for Scientific and Technological Research with Project Grant ANID BASAL FB210015 for supporting this manuscript. The Centro Nacional de Excelencia para la Industria de la Madera (CENAMAD)—ANID BASAL FB210015, funded this manuscript.
Data Availability Statement
The datasets presented in this article are not readily available because the data are part of an ongoing study. Requests to access the datasets should be directed to M. Paulina Fernández, pfernan@uc.cl.
Acknowledgments
All authors thank Agustín Mercado and Pedro León for their help and dedication to the logs and boards processing, and Camila Bilbao for her help in the preliminary evaluation of logs. M.P.F. also thanks the project DecisionES, grant number 101007950 (DecisionES: Decision Support for the Supply of Ecosystem Services under Global Change), a Marie Skłodowska-Curie Research and Innovation Staff Exchange (Call:H2020-MSCARISE-2020), for supporting this manuscript.
Conflicts of Interest
The authors declare that the research was conducted in the absence of any commercial or financial relationships that could be construed as a potential conflict of interest.
References
- Gutiérrez, Á.G.; Díaz-Hormazábal, I.; Lizana, C.; Fuentes, C. Monitoreo de La Degradación de Bosques Nativos de La Región de Los Ríos; Fondo de Investigación del Bosque Nativo: Santiago, Chile, 2020. [Google Scholar]
- Vergara, G.; Gayoso, J. Efecto de Factores Físico-Sociales Sobre La Degradación Del Bosque Nativo. Bosque 2004, 25, 43–52. [Google Scholar] [CrossRef]
- Donoso, P.J.; Promis, A.; Soto, D.P. Silvicultura En Bosques Nativos. Experiencias En Silvicultura y Restauración En Chile, Argentina y El Oeste de Estados Unidos, 1st ed.; Imprenta América: Valdivia, Chile, 2018; ISBN 978-0-692-09238-5. [Google Scholar]
- Bannister, J.R.; Vargas-Gaete, R.; Ovalle, J.F.; Acevedo, M.; Fuentes-Ramirez, A.; Donoso, P.J.; Promis, A.; Smith-Ramírez, C. Major Bottlenecks for the Restoration of Natural Forests in Chile. Restor. Ecol. 2018, 26, 1039–1044. [Google Scholar] [CrossRef]
- Smith-Ramírez, C.; Castillo, J.; Armesto, J.J. Willingness of Rural Communities to Reforest with Native Tree Species in Central Chile. Restor. Ecol. 2019, 27, 1401–1408. [Google Scholar] [CrossRef]
- Martin, M.; Büchner, C.; Sagardia, R.; Bahamóndez, C.; Rojas, Y.; Guzmán, F.; Barrientos, M.; Barrales, L.; Guiñez, R. Disponibilidad de Madera Nativa de Renovales de Roble—Raulí—Coihue. Regiones de Ñuble a Los Ríos. 2020–2049. In Informe Técnico No 237; Instituto Forestal, Ministerio de Agricultura: Santiago, Chile, 2020. [Google Scholar]
- Úbeda, X.; Sarricolea, P. Wildfires in Chile: A Review. Glob. Planet. Change 2016, 146, 152–161. [Google Scholar] [CrossRef]
- Nasi, R.; Putz, F.E.; Pacheco, P.; Wunder, S.; Anta, S. Sustainable Forest Management and Carbon in Tropical Latin America: The Case for REDD+. Forests 2011, 2, 200–217. [Google Scholar] [CrossRef]
- Infor Anuario Forestal 2024 (Chilean Statistical Yearbook of Forestry); Instituto Forestal: Santiago, Chile, 2024.
- Bañados, J.C.; Pardo, E. Directorio de la Industria Forestal Chilena 2025 (Directory of Chilean Forestry Industry 2025); Instituto Forestal: Santiago, Chile, 2025. [Google Scholar]
- Dramm, J.R. Small-Diameter Utilization Issues and Opportunities. In Proceedings of the 27 Wood Technology Clinic & Show, Oregon Covention Center, Portland, OR, USA, 24 March 1999; pp. 30–38. [Google Scholar]
- Rosen, H.; Stewart, H.; Polak, D. Dimension Yields from Short Logs of Low-Quality Hardwood Trees. USDA For. Serv. Res. Pap. 1980, NC-184, 1–22. [Google Scholar]
- García, N.M.; Machuca, M.A.H.; Caraciolo, R.L. Modelo Para Cálculo Estimación Del Carbono En Tipo Forestal Roble-Raulí-Coigüe En La Reserva Nacional Malleco—Chile. Rev. Arvore 2011, 35, 1299–1306. [Google Scholar] [CrossRef]
- Stern, E.G. Construction with Small-Diameter Roundwood. For. Prod. J. 2001, 51, 71–82. [Google Scholar]
- Da Silva, L.; Carvalho, F.W.; Monteiro, B.; Pereira, V.H. Wood from Forest Residues: Technological Properties and Potential Uses of Branches of Three Species from Brazilian Amazon. Sustainability 2022, 14, 11176. [Google Scholar] [CrossRef]
- Ueda, G. Quick Cash or Income Maximization: Economic Significance of Premature Harvesting for Farm Forestry Smallholders in the Mount Meru Area, Tanzania. Afr. Study Monogr. 2018, 55, 7–26. [Google Scholar] [CrossRef]
- Wagner, F.G.; Fiedler, C.E.; Keegan, C.E. Processing Value of Small-Diameter Sawtimber at Conventional Stud Sawmills and Modern High-Speed, Small-Log Sawmills in the Western United States—A Comparison. West. J. Appl. For. 2000, 15, 208–212. [Google Scholar] [CrossRef]
- António Manhiça, A.; Pereira da Rocha, M.; Timofeiczyk Júnior, R. Rendimiento No Desdobro de Pinus Sp. Utilizando Modelos de Corte Numa Serraria de Pequeno Porte. Floresta 2010, 42, 409–420. [Google Scholar] [CrossRef]
- Souter, R.; De La Maza, J.E.; Emanuelli, P. Normas de calidad de productos madereros del bosque nativo. In Sociedad Alemana para la Cooperación Técnica (GTZ), 1st ed.; Litografía Valente Ltd.: Brighton, UK, 2003. [Google Scholar]
- Hanks, L.F.; Gammon, G.L.; Brisbin, R.L.; Rast, E.D. Hardwood Log Grades and Lumber Grade Yields for Factory Lumber Logs; Res. Pap. NE-468; U.S. Department of Agriculture, Forest Service, Northeastern Forest Experiment Station: Broomall, PA, USA, 1980; 92p.
- Deutschen Forstwirtschaftsrates e.V.; Deutsche Holzwirtschaftsrates e.V. Rahmenvereinbarung für den Rohholzhandel in Deutschland (RVR); Fachagentur Nachwachsende Rohstoffe: Freiburg im Bresigau, Germany, 2015. [Google Scholar]
- Guerra, E.; Celis, F.; Navarro, C.O.; Souter, R. Clasificación de Trozas. Maderas—Especies Latifoliadas. Clasificación Visual de Trozas Provenientes de Bosques Secundarios Nativos de Las Especies Coigüe, Raulí y Roble. Norma NCh 3223-2010, 1st ed.; Universidad Católica de Temuco: Temuco, Chile, 2011. [Google Scholar]
- Institute of Agriculture. A Hardwood Log Grading Handbook; University of Tennessee: Knoxville, TN, USA, 2023. [Google Scholar]
- Fernández-Golfín, J.I.; Díez-Barra, M.R.; Hermoso, R.; Mier, R. Mechanical Characterization of Visually Classified, Small-Diameter Laricio Pine Round Timber. Span. J. Agric. Res. 2007, 5, 304–311. [Google Scholar] [CrossRef]
- Vega, A.; González, L.; Fernández, I.; González, P. Grading and Mechanical Characterization of Small-Diameter Round Chestnut (Castanea sativa Mill.) Timber from Thinning Operations. Wood Mater. Sci. Eng. 2019, 14, 81–87. [Google Scholar] [CrossRef]
- Lawrence, C. Utilization of Low-Value Lumber from Small-Diameter Timber Harvested in Pacific Northwest Forest Restoration Programs in Hybrid Cross Laminated Timber (CLT) Core Layers: Technical Feasibility; Oregon State University: Corvallis, OR, USA, 2017. [Google Scholar]
- Findley, A.J.; Carroll, M.S.; Blatner, K.A. Social Complexity and the Management of Small-Diameter Stands. J. For. 2001, 99, 18–26. [Google Scholar] [CrossRef]
- Racelis, A.E.; Barsimantov, J.A. The Management of Small Diameter, Lesser-Known Hardwood Species as Polewood in Forest Communities of Central Quintana Roo, Mexico. J. Sustain. For. 2008, 27, 122–144. [Google Scholar] [CrossRef]
- Emanuelli, P.; Milla, F. Alternativas de Productos Madereros del Bosque Nativo Chileno, 1st ed.; CONAF, Sociedad Alemana de Cooperación Técnica (GTZ), Eds.; Litografía Valente Ltd.: Santiago, Chile, 2006. [Google Scholar]
- Corporación de Desarrollo Tecnológico. Medición del Consumo Nacional de leña y Otros Combustibles Sólidos Derivados de la Madera; Calefacción Sustentable: Santiago, Chile, 2015. [Google Scholar]
- Sarricolea, P.; Herrera-Ossandon, M.; Meseguer-Ruiz, Ó. Climatic Regionalisation of Continental Chile. J. Maps 2017, 13, 66–73. [Google Scholar] [CrossRef]
- Dirección General de Aguas DGA. 08124004 Las Cruces Weather Station. Available online: https://snia.mop.gob.cl/BNAConsultas/reportes (accessed on 1 March 2024).
- Wrigth, C.A. The Volcanic Soils of Chile. In Proceedings of the Sixth International Soil Classification Workshop Chile and Ecuador 9 to 20 January 1984, Chile, Ecuador, 9–20 January 1984; Sociedad Chilena de la Ciencia del Suelo: Santiago, Chile, 1985. [Google Scholar]
- Dirección General de Aguas DGA 08130006 Diguillín Weather Station. Available online: https://snia.mop.gob.cl/BNAConsultas/reportes (accessed on 1 March 2024).
- Lockard, C.R.; Putnam, J.A.; Carpenter, R.D. Grade Defects in Hardwood Timber and Logs; U.S. Department of Agriculture—Forest Service: Beltsville Branch, MD, USA, 1963; Volume 244. [Google Scholar]
- Prodan, M.; Peters, R.; Cox, F.; Real, P. Mensura Forestal, 1st ed.; Instituto Interamericano de Cooperación para la Agricultura: San José, CA, USA, 1997. [Google Scholar]
- Edlund, J.; Warensjö, M. Repeatability in Automatic Sorting of Curved Norway Spruce Saw Logs. Silva Fenn. 2005, 39, 265–275. [Google Scholar] [CrossRef][Green Version]
- R Core Team. R: A Language and Environment for Statistical Computing; R Foundation for Statistical Computing: Vienna, Austria, 2021. [Google Scholar]
- De Lima, R.B.; Ferreira, R.L.C.; Da Silva, J.A.A.; Guedes, M.C.; Da Silva, D.A.S.; De Oliveira, C.P.; Rabelo, F.G.; Silva, L.F.D.C. Effect of Species and Log Diameter on the Volumetric Yield of Lumber in Northern Brazilian Amazonia: Preliminary Results. J. Sustain. For. 2020, 39, 283–299. [Google Scholar] [CrossRef]
- Fredriksson, M.; Bomark, P.; Broman, O.; Grönlund, A. Using Small Diameter Logs for Cross-Laminated Timber Production. Bioresources 2015, 10, 1477–1486. [Google Scholar] [CrossRef]
- Chiorescu, S.; Grönlund, A. The Visual Grading System for Scots Pine Logs in Relation to the Quality of Sideboards Produced. For. Prod. J. 2003, 53, 53–60. [Google Scholar]
- Cumbo, D.W.; Smith, R.L.; Becker, C.W., III. Value Analysis of Lumber Produced from Small-Diameter Timber. For. Prod. J. 2004, 54, 29–34. [Google Scholar]
- Popadić, R.; Furtula, M.; Milić, G. Influence of Diameter and Quality of Beech Logs on the Potential Energy of Sawmill Residues. Bioresources 2019, 14, 6331–6340. [Google Scholar] [CrossRef]
- Toivonen, R.M. Product Quality and Value from Consumer Perspective-An Application to Wooden Products. J. For. Econ. 2012, 18, 157–173. [Google Scholar] [CrossRef]
- Stanula, Z.; Wieruszewski, M.; Dynowska, J.; Adamowicz, K. Comparative Efficiency of Roundwood Processing into Pallet Lumber. Folia For. Pol. 2024, 66, 310–316. [Google Scholar] [CrossRef]
- Górriz, E.; Martínez, I. Avanzando Hacia Una Bioeconomía Circular: El Papel de Los Bosques. Cuad. Soc. Esp. Cienc. For. 2017, 43, 151–162. [Google Scholar]
- Lovrić, M.; Lovrić, N.; Mavsar, R. Mapping Forest-Based Bioeconomy Research in Europe. For. Policy Econ. 2020, 110, 101874. [Google Scholar] [CrossRef]
- González-Reyes, Á.; Christie, D.A.; Schneider-Valenzuela, I.; Venegas-González, A.; Muñoz, A.A.; Hadad, M.; Gipoulou-Zuñiga, T.; Tapia-Marzan, V.; Gibson-Carpintero, S.; Santini-Junior, L.; et al. Recent Multispecies Tree-Growth Decline Reveals a Severe Aridity Change in Mediterranean Chile. Environ. Res. Lett. 2024, 19, 064046. [Google Scholar] [CrossRef]
Disclaimer/Publisher’s Note: The statements, opinions and data contained in all publications are solely those of the individual author(s) and contributor(s) and not of MDPI and/or the editor(s). MDPI and/or the editor(s) disclaim responsibility for any injury to people or property resulting from any ideas, methods, instructions or products referred to in the content. |
© 2025 by the authors. Licensee MDPI, Basel, Switzerland. This article is an open access article distributed under the terms and conditions of the Creative Commons Attribution (CC BY) license (https://creativecommons.org/licenses/by/4.0/).

