Article

Planting Native Herbaceous Species During Land Reclamation: 3-Year Growth Response to Soil Type and Competing Vegetation

by
Camille Chartrand-Pleau
1,2,
Dani Degenhardt
3 and
Amanda Schoonmaker
1,*
1
NAIT Centre for Boreal Research, 8102 99 Ave, Peace River, AB T8S 1R2, Canada
2
Centre Armand-Frappier Santé Biotechnologie, Institut National de la Recherche Scientifique (INRS), 531 Boulevard des Prairies, Laval, QC H7V 1B7, Canada
3
Natural Resources Canada, Northern Forestry Centre, 5320 122 St NW, Edmonton, AB T6H 3S5, Canada
*
Author to whom correspondence should be addressed.
Forests 2025, 16(9), 1442; https://doi.org/10.3390/f16091442
Submission received: 28 July 2025 / Revised: 29 August 2025 / Accepted: 6 September 2025 / Published: 10 September 2025

Abstract

In forest land reclamation, revegetation efforts often focus on restoring tree composition, while the recovery of the understory vegetation community is typically left to natural regeneration. This regeneration relies mainly on wind-dispersed seeds, ingress from adjacent intact forests, or seed emergence from stockpiled surface soils. We examined the growth and survival of nursery-propagated, field-planted native herbaceous forbs on a reclaimed industrial site where topsoil placement depth was varied to manipulate soil nutrient availability and levels of competing vegetation. A pre-emergent herbicide was applied to half of the standard topsoil plots to assess the impact of ruderal vegetation competition. We addressed the following two questions: (1) How does placed topsoil depth affect the growth and survival of native forbs? We hypothesized that deeper topsoil (higher nutrient availability) would enhance growth but reduce survival due to increased competition. (2) Does competing ruderal vegetation negatively affect survival and/or growth? We hypothesized that competition would reduce growth in all species, but that Canada goldenrod (Solidago canadensis L.) would show greater resilience due to its pioneering nature. The results showed that S. canadensis exhibited consistently high growth and survival across all topsoil treatments, confirming its competitive advantage. Showy aster (Eurybia conspicua (Lindl.) G.L.Nesom) survival remained high during no-topsoil and shallow-topsoil treatments, with reductions under standard-depth topsoil linked to increased competition. Spreading dogbane (Apocynum androsaemifolium L.) survival varied but tended to be higher in no-topsoil and shallow-topsoil conditions. These findings suggest that certain native forbs can thrive across a range of soil conditions, and that Canada goldenrod, in particular, is a strong candidate for revegetation programs where competition from ruderal vegetation is a concern.

1. Implications for Practice

Canada goldenrod, showy aster, and spreading dogbane could be planted as pioneering understory vegetation species in diverse soil conditions during forest land reclamation.
The planting of Canada goldenrod seedlings results in nearly ten times as many plants after 3 years due to this species’ strong capacity for vegetative reproduction.
The use of pre-emergent herbicide to reduce competing herbaceous vegetation on a reclaimed industrial site was not critical for the establishment of planted native herbaceous forbs.

2. Introduction

Industrial activities, such as logging and oil sand mining, have been and continue to be major drivers of economic growth in many countries. Their associated activities, such as soil stripping, stockpiling, and redistribution, can alter the soil properties of the ecosystem, including the pH, bulk density, electrical conductivity (EC), and total carbon stock [1]. Vegetation community assessments have shown that native herbaceous species, including native forbs, differ significantly between reclaimed areas and undisturbed natural systems [1]. These disturbances often leave sites in a bare, early successional state, making ecological recovery a difficult and slow process [2]. For this reason, many governments worldwide have implemented legislative requirements for forest land reclamation [3,4,5]. These regulations require industries to implement reclamation practices in their operations, with the overarching goal of restoring the landscape to a condition that closely resembles its pre-disturbance state. Ecologically speaking, these practices need to consider wildlife habitats and native species community compositions, as well as ecological structure and function [6].
In Alberta (Canada), reclamation efforts have predominantly focused on planting woody species to restore the overstory structure of the original forest. Unfortunately, this emphasis has led to limited attention being given to understory vegetation and its critical role in creating a self-sustaining boreal landscape [7]. In fact, vegetation community assessments have shown that native herbaceous species, including native forbs, differ significantly between reclaimed areas and undisturbed natural systems [1]. It has been shown that the composition of understory vegetation in the boreal forest can significantly influence key elements that contribute to the ecosystem’s structures and functions [7,8], nutrient cycling [9,10], and wildlife [11]. As such, there is a need to consider the integration of native forb species in reclamation practices. To date, industries primarily rely on spontaneous natural recovery mechanisms, though these methods have not always proven to be efficient [12,13] due to the loss of seed viability from stockpiling. In North America, direct seeding of native forbs is also challenged by difficulty in accessing native plant propagules [14] and achieving the species-specific germination conditions [13]. Planting rooted seedlings, a common practice employed using commercial tree species, may provide another opportunity with which to reliably incorporate native forbs into revegetation prescriptions. Recently, Schoonmaker et al. (2023) planted rooted seedlings of fireweed (Chamaenerion angustifolium (L.) Scop.) and showy aster (Eurybia conspicua (Lindl.) G.L.Nesom) that had been co-grown with white spruce (Picea glauca (Moench) Voss) seedlings with survival occurrence rates of 0.8 and 0.4–0.6 after four years, respectively [15]. While these results are promising, there remains limited knowledge regarding the expected consistency of utilizing rooted seedlings of native forbs in land reclamation applications.
Canada goldenrod (Solidago canadensis L.), showy aster, and spreading dogbane (Apocynum androsaemifolium L.) are three early successional, perennial native forbs commonly found in Alberta’s upland boreal forest. These species are capable of rhizomatous growth [15,16] and tolerate full sun [7]. On sites where few native understory species are expected to emerge from the seed or propagule bank, planting native forbs may be a valuable technique to expedite the development of desirable understory plant community characteristics to support biodiversity and improve the site’s long-term ecological resilience. The goal of our study was to investigate the survival and growth of three native forbs, Canada goldenrod, showy aster, and spreading dogbane, following out-planting on a recently reclaimed industrial site. In this study we will answer the following questions:
  • How does placed topsoil depth affect the growth and survival of these native forbs? We hypothesize that larger quantities of topsoil (=higher nutrition) will lead to higher growth rates, but we concurrently expect to observe a reduction in survival due to increased herbaceous competition.
  • Does competing ruderal vegetation have a negative impact on survival and/or growth? We hypothesize that, given similar soil quality, competing vegetation will reduce growth outcomes for each species, but the magnitude of the effect will be proportional to each individual species—we expect Canada goldenrod to show greater resilience as it is known to be an aggressive pioneering species.

3. Methods

3.1. Greenhouse Stock Type Production

Forb seedlings (Canada goldenrod, showy aster and spreading dogbane) were grown at NAIT Centre for Boreal Research’s greenhouse facility in Peace River, Alberta (56.23293° N, −117.33130° W), during spring–summer 2020. Seeds for this trial were previously collected (Table S1) and were stored at −20 °C prior to sowing. Seedlings were grown in 412A styroblocksTM (125 mL volume, 77 cavities per block, BeaverPlastics, Acheson, AB, Canada) to yield approximately 200 plants per species. Individual blocks were filled with peat and moistened, then approximately 5–10 seeds were sown into individual cavities on 13 May 2020. Cavities were thinned to a single plant once true leaves were visible. The soil surface was kept moist during seed emergence and once thinning was completed, cavities were covered in a thin layer of silica sand (Target, Morinville, AB, USA) to reduce soil evaporation and algae development. Three to four weeks after sowing, seedlings received a starter fertilizer to encourage root development (4-12-4, Quick Start, The Scotts Miracle-Gro Company, Mississauga, ON, Canada). Seedlings were then watered as required and fertigated up to three times per week, depending on the quantity of water they received. Fertigation concentrations were as follows: 66 ppm N, 84 ppm P, 92 ppm K, 94 ppm Ca, 39 ppm Mg, 57 ppm S, 3 ppm Fe, 0.01 ppm Mn, 0.17 ppm Zn, 0.58 ppm Cu, 0.25 ppm B, 106 ppm HCO3, 87 ppm CaCO3, and 26.4 ppm Na.
Greenhouse climate was set to a daytime temperature target of 22 °C (19–27 °C) and relative humidity of 45%–80% with an 18h photoperiod. Between 20 and 22 June, seedlings were moved outdoors for the summer until early September, when they were brought back into the greenhouse. Fall greenhouse climate was set to match near-ambience for the region, with an air temperature target of 4 °C (2–10 °C). During the fall, seedlings were watered to keep the soil moist but were not fertigated after September 1st. In November 2020, seedlings were lifted from the blocks, wrapped in bundles of 10 plugs and stored at below-freezing temperatures (−4 °C) in plastic bags within wax-lined boxes until planting the following spring.

3.2. Stock Characterization

Ten seedlings of each species were subsampled during stock lifting in November 2020. Total root dry biomass of individual species was determined by manually washing soil from roots and using soil sieves (1 mm mesh screen) to collect root fragments. All plant material was oven-dried at 70 °C until weight constancy and dry biomass weighed to the nearest 0.001 g per individual seedling. Mean root mass was 2.0 g for showy aster (±0.5 SD), 1.9 g for spreading dogbane (±0.4 SD), and 3.1 g for Canada goldenrod (±1.3 SD).

3.3. Field Study Site Description and Experimental Design

The present study took place within a 14-hectare former sand and gravel quarry situated approximately 75 km SE of Fort McMurray, AB, Canada (56.23957° N, −110.85934° W). Site reclamation, recontouring, and soil placement activities occurred throughout May 2021, including placement of 5 cm of subsoil and site-wide decompaction. In each of replicate study blocks, three topsoil placement depth prescriptions were applied (Table 1, Figure S2). Topsoil depth treatments included standard topsoil placement with a target of 15 cm depth (H), shallow or low topsoil depth placement with target of 5 cm depth (L), and no topsoil placed (N). From 3 to 5 June 2021, within a few days of topsoil placement, the entire study site was rough/loose plowed with a RipPlowTM attached to a dozer (D7 cat or equivalent) to allow for deep soil decompaction, given that this site had received substantial heavy traffic over many years. One to two days following decompaction, a subset of the study site (50% of each topsoil depth treatment area, Figure S1) had the equivalent of 580 g ha−1 of pre-emergent herbicide (TorpedoTM, active ingredients flumioxazin and pyoxasulfone, Nufarm, Calgary, Alberta) applied in strips to cover approximately 50% of the ground surface. This herbicide treatment was designed to reduce seed-based herbaceous competition, which is a common occurrence in these types of disturbances.
This experiment utilized a subset of the broader experimental design described above and included all topsoil depth treatments without herbicide, as well as the standard topsoil depth treatment in combination with pre-emergent herbicide (H+C). Four replicate plots of each of the treatments (N, L, H, H+C) were established across the study area. Each plot was delineated into three (H+C) or six lines (H, N, L). Two seedlings of each species were assigned to a randomized point on each line with 1.5 m spacing, for a total of 6 (H+C) or 12 plants (N, L, H) of each species per replicate plot. Seedlings were removed from cold storage, transported to the site, and allowed to thaw over several days in a shaded forest area adjacent to the study site before being planted between 12 and 17 June 2021. Across the study, 168 plants of each of the three forb species (504 plants altogether) produced in the greenhouse were planted.

3.4. Field Measurements

Vegetation cover estimates and survival rates of individual plants were recorded annually in early August between 2021 and 2023. At each planting location, a 0.5 × 0.5 m quadrat was centered on the plant and the % cover of native forb vegetation was recorded. At each plant, roots were meticulously followed from the original seedling plug to new shoots, to the end of the root system, or until the root sunk below 20 cm (determined by hand exposure and the assistance of small trowels; [15]). All shoots arising from within 10 cm of the original plug were considered part of the original plant, while new ‘shoots’ were categorized as those that were at least 10 cm away from the original plant. The linear distance of individual roots and the number of new shoots were recorded. All aboveground biomass within the same root system was clipped at the root collar and placed in paper bags. The samples were then transported back to the lab, oven dried at 70 °C for 24 h [15], and then weighed to the nearest 0.01 g.
In September 2021, soil samples were collected for soil chemical characterization. Within each replicate soil treatment (no topsoil, shallow, standard, or standard + competition control) a transect was delineated and a soil sample was taken to a depth of 45 cm (collected in 3 distinct layers at 15 cm increments) at three locations along the transect. A composite soil sample of each of these layers was also collected using a hand auger and sent to the Canadian Forestry Service (CFS) analytical lab, and the following parameters were determined: soil texture, conductivity, pH, N, P, K, and total anions/cations. In addition, at a single location, bulk density was determined at 0–15, 15–30, and 30–45 cm layers by inserting three 5 cm × 5 cm cylindrical cores into the soil profile.

3.5. Statistics

Data visualization and analysis were carried out using R statistical computing language and environment (version 4.1.2, Vienna, Austria). Annual cumulative survival and forb vegetation cover were analyzed as a two-factor mixed effects model where factor 1 was Year of Assessment and factor 2 was Soil Treatment. A nested random effect was included in the model to reflect the hierarchical structure of the data set (replicate line within plot and plot within replicate block). Survival was fitted with a binomial distribution and cover employed a gamma distribution; both responses were analyzed via the function glmmTMB (package glmmTMB; [17]). For measurements conducted only in year 3, a single-factor model was employed to test soil treatment effects. This included total aboveground biomass, root length, number of new plants, and number of lateral roots. Biomass and root length were fitted with a gamma distribution, and the number of new plants and lateral roots with the compois (poisson) or negative binomial distribution when overdispersion was detected. When significant (p ≤ 0.05) differences were detected, treatments were separated with post hoc (Tukey test) multiple comparison tests using the emmeans function [18].
Site-level total vegetation cover was analyzed as a two-factor generalized linear mixed effects model with soil treatment and year as fixed effects, and treatment nested within blocks as random effects to account for repeated measurements over time. The same modelling process as described above was used to fit this model and to conduct post hoc testing. Soil samples collected in the first year of the study were analyzed utilizing principal components analysis (PCA, function prcomp) to understand the multivariate nature of their soil chemical properties [19]. Data was mean-centered (standardized), given that individual soil parameter values varied in absolute terms and the PCA used a correlation matrix. Screen plots were utilized (function fviz_eig, R package factoextra; [20]) to determine important principal components in each PCA where the explained variance was equal to or greater than the relative weighting of individual variables (Figure S3). Correlations between individual soil property correlations and principal components were also extracted utilizing the function get_pca_var (R package factoextra; [20]) to further illustrate the relative strength of these properties in the explained variance of the principal components.

4. Results

4.1. Site Treatment Characteristics

Total vegetation cover increased over the three years for all topsoil depth treatments, with a significant interaction between year of assessment and soil treatment (Table 1 and Table 2). In years 1–2, vegetation cover was similar across all soil treatments, except in the L treatment, which showed a significant increase in cover from year 1 to year 2 (Table 1). In year 3, the lowest cover proportion was associated with the N treatment, with an average of 0.25 (CI 0.19–0.32) compared with values of 0.35 (0.28–0.43) and 0.49 (0.40–0.57) in treatments with topsoil (Table 1). Principal component analysis of the soil properties illustrated substantial separation of the N treatment from both the H/H+C and L treatments; this was driven by the combined effect of lower EC, total organic carbon (TOC), and extractable K and P (Figure 1). All other topsoil treatments largely overlapped in terms of soil properties (Figure 1). The C:N ratio between the topsoil treatments varied between 16.4 (N treatment) and 21.9 (H treatment) (Table S2).

4.2. Canada Goldenrod

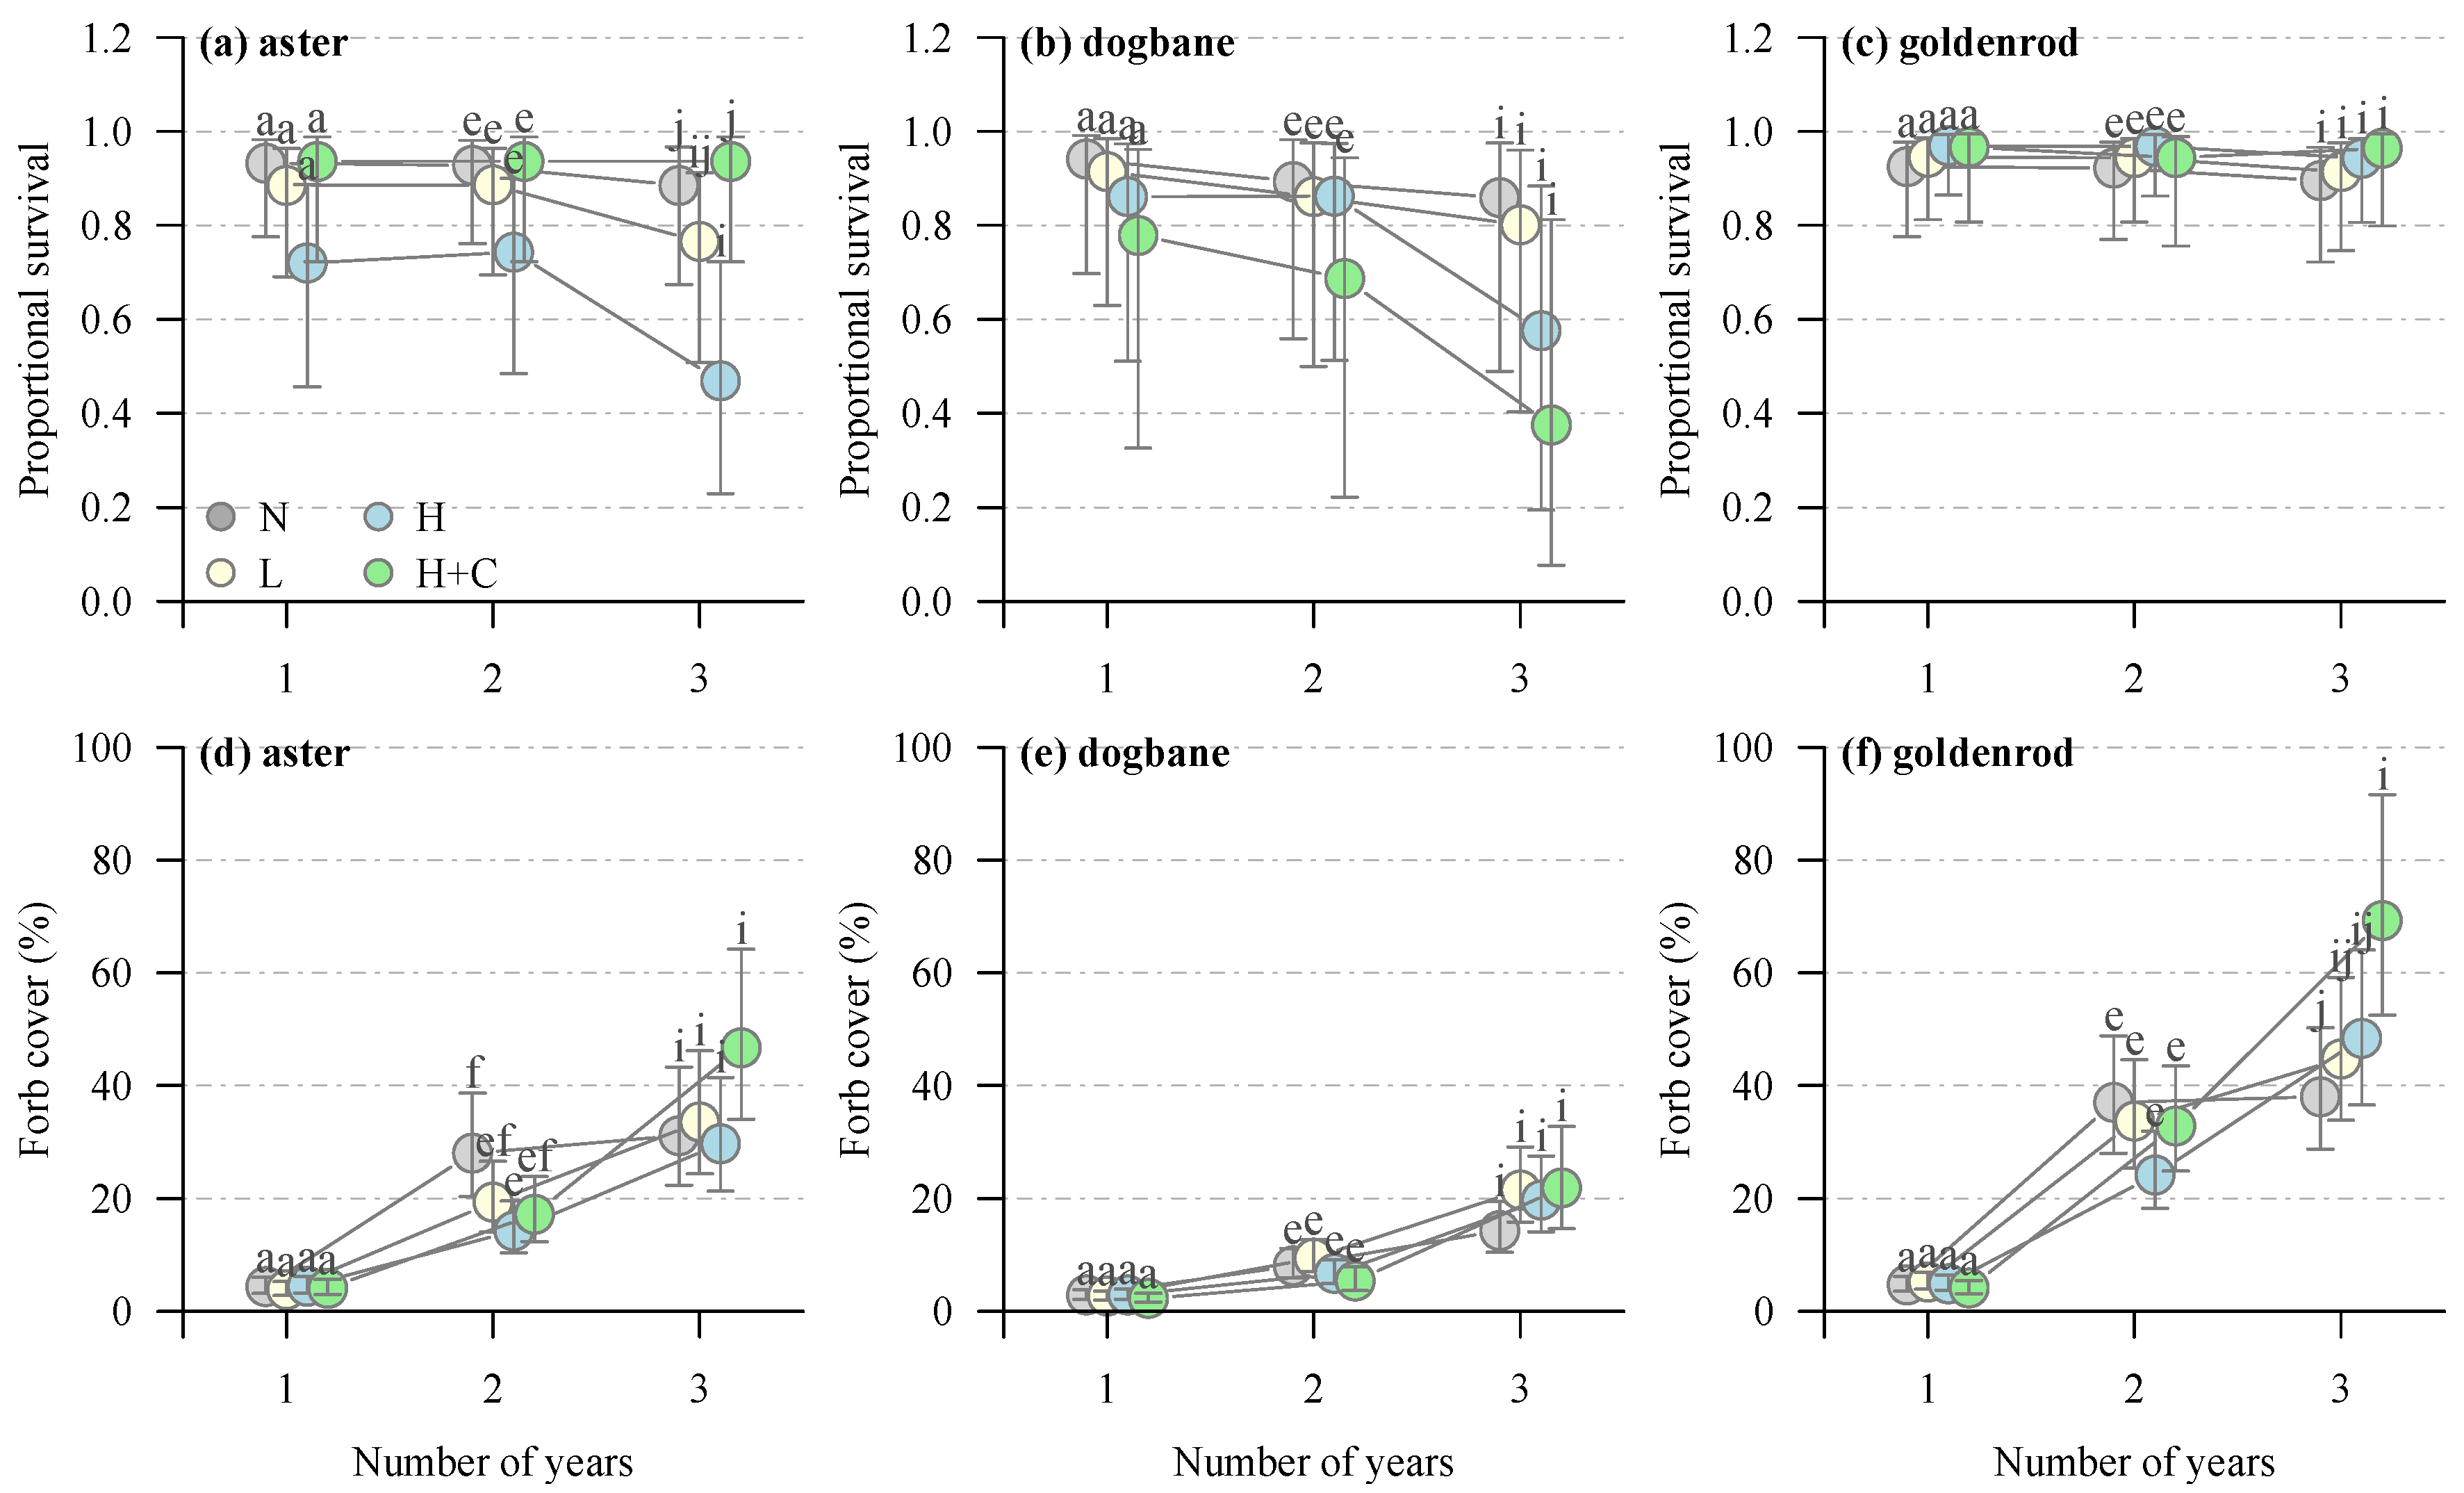
Canada goldenrod’s proportional survival was similar across the three-year investigation (p = 0.4768) and amongst soil treatments, at 0.94 overall (p = 0.6803) (Table 2, Figure 2c). There was a significant two-way interaction between year of assessment and soil treatment that affected the vegetation ground cover of goldenrod (p = 0.0004). While cover was similar amongst the soil treatments in years 1–2, the H+C treatment in year 3 showed a substantial increase relative to the other treatments, reaching nearly 70% cover (Figure 2f). This resulted in a significant increase when compared with the N treatment at 38% (Figure 2f).
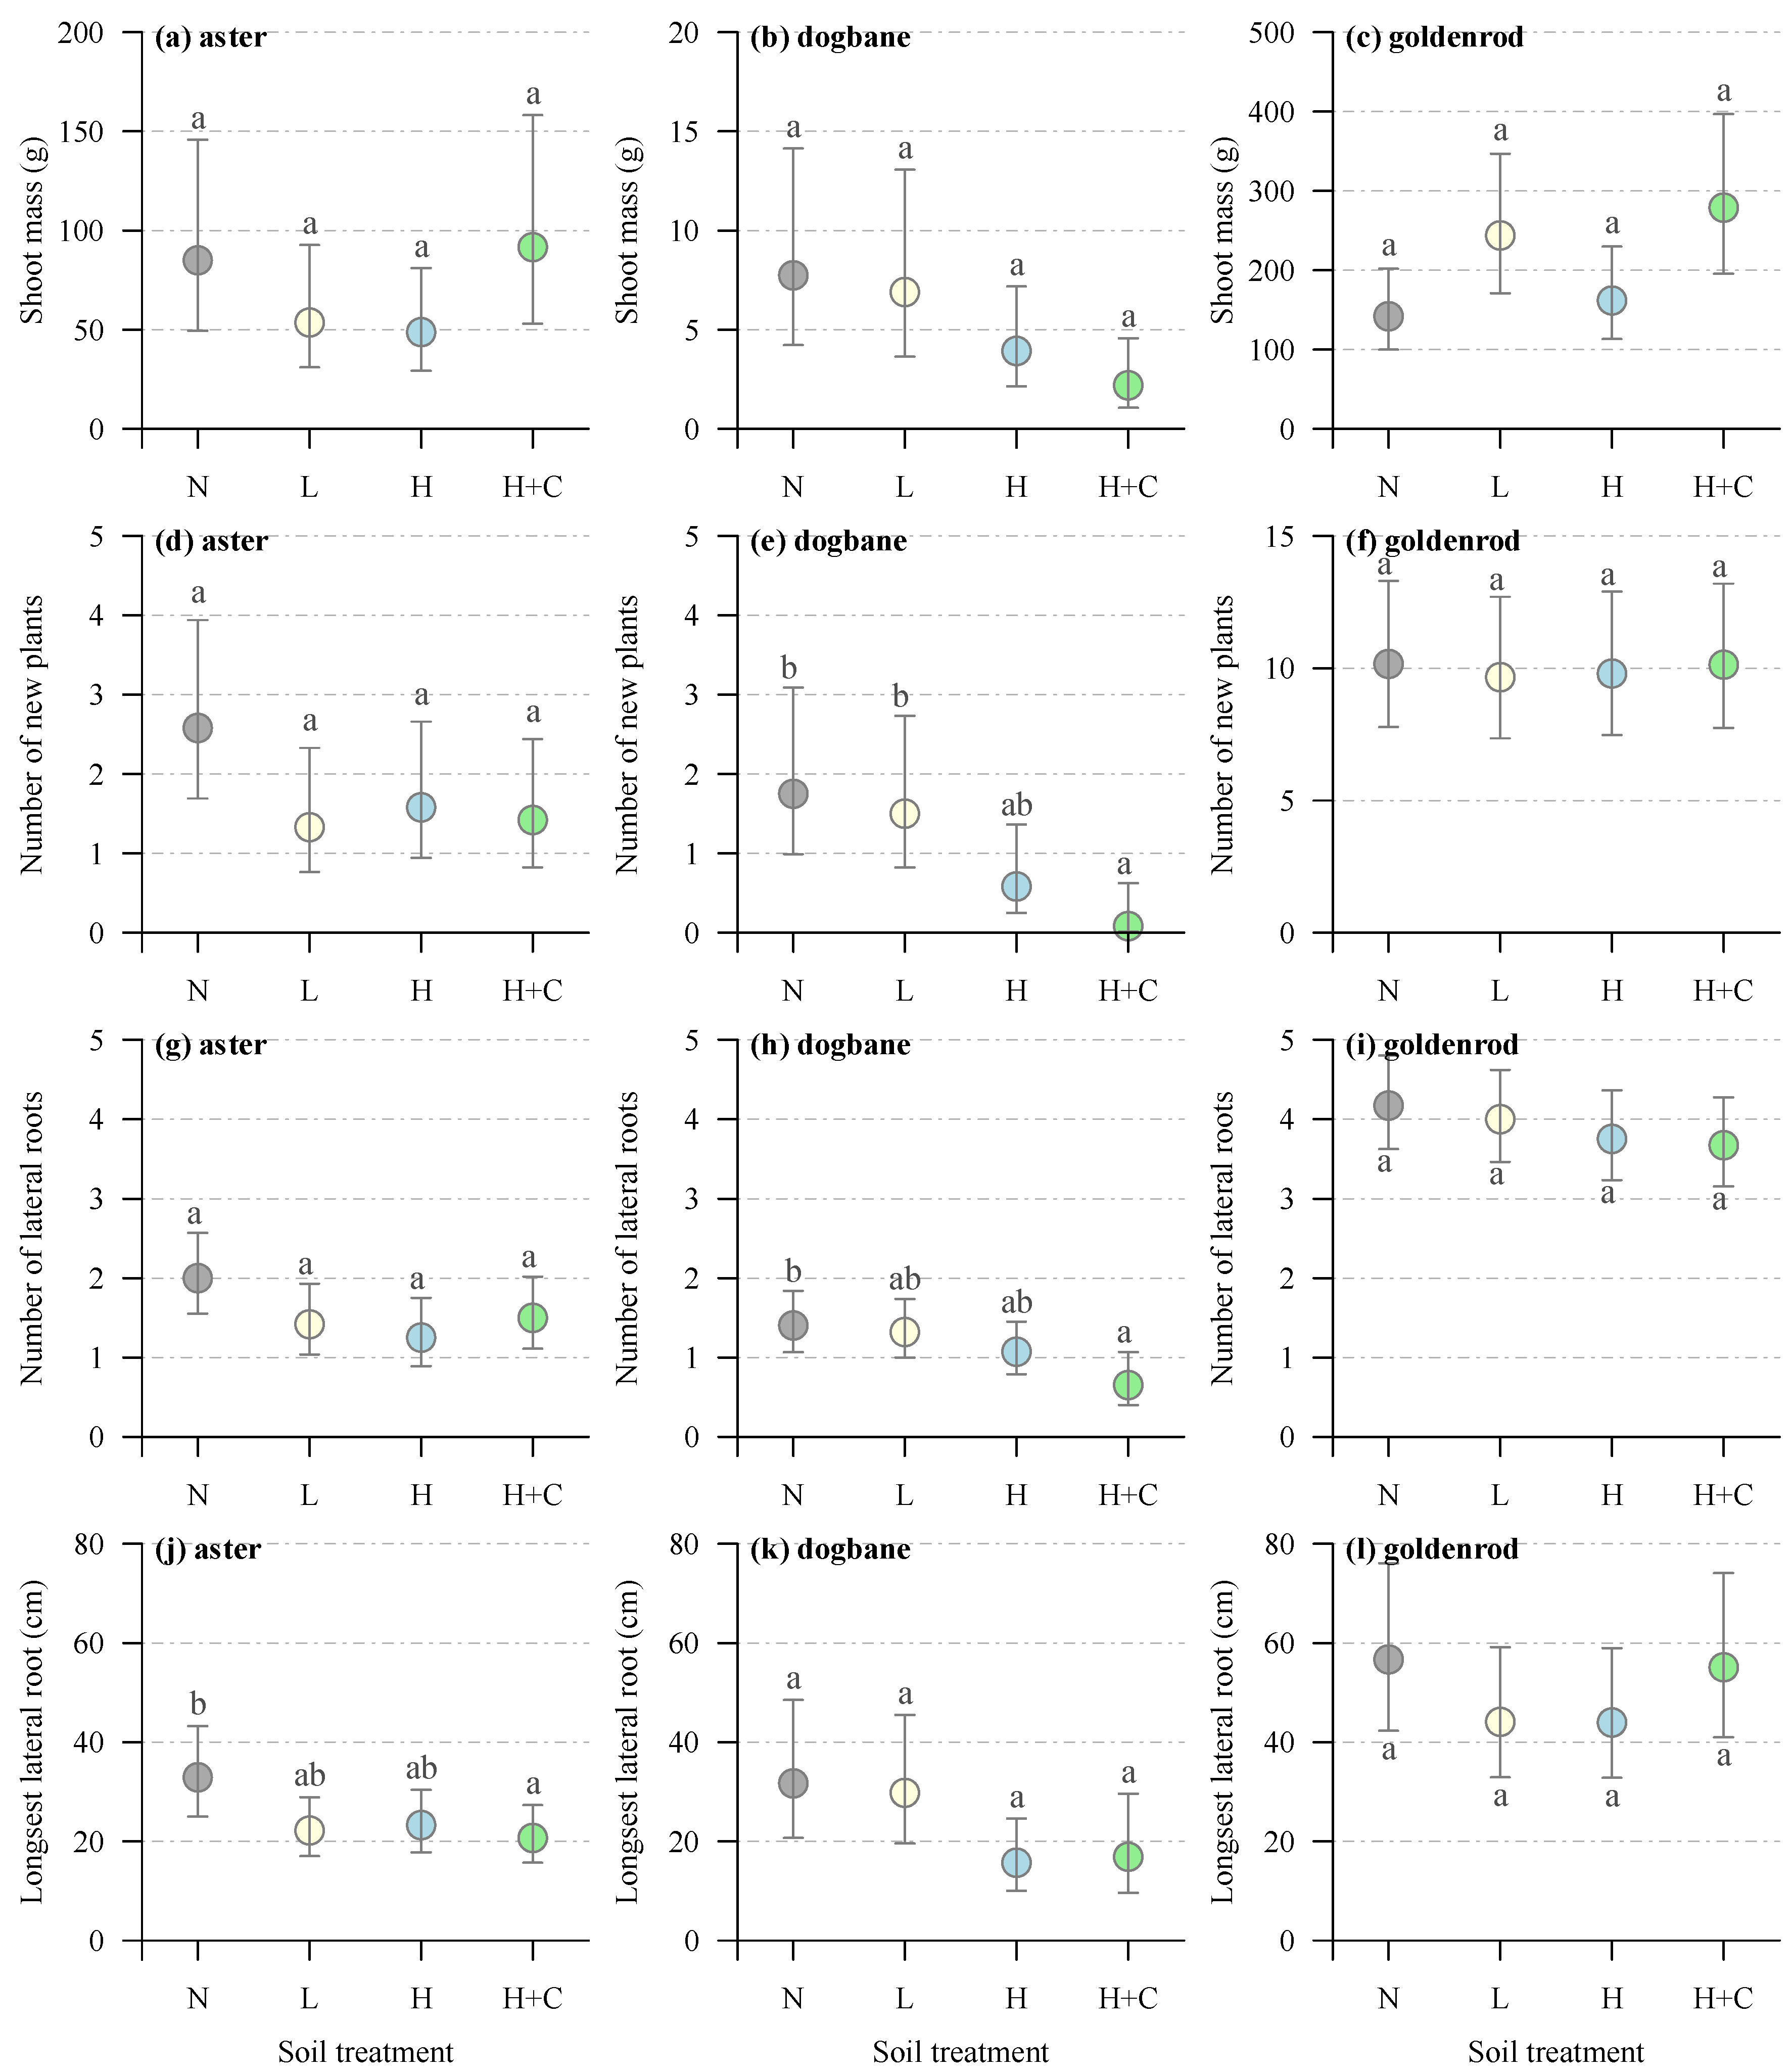
Shoot biomass in year 3 also showed a significant soil treatment effect (p = 0.0286) and although there was no significant effect detected amongst treatment means, the H+C and L treatments had two times the mean biomass of the N and H treatments (Figure 3c). The number of new plants, lateral roots, and longest lateral roots were similar amongst the soil treatments (Table 2). On average, Canada goldenrod plants produced 10 new plants for every living seedling planted (Figure 2f) and 3.5–4 new lateral roots (Figure 3i), with the longest laterals exploring 40–60 cm away from the original plant (Figure 3l).

4.3. Showy Aster

Soil treatment (p = 0.0081) and year of assessment (p = 0.0055) significantly affected showy aster survival (Table 2). The proportional survival amongst soil treatments was similar in years 1–2, but in year 3 the H treatment was significantly lower at 0.47 compared to the H+C (0.93) and N treatments (0.88), with the L treatment not statistically distinct from any soil treatment at 0.79 (Figure 2a). There was a significant two-way interaction between year of assessment and soil treatment that affected the vegetation ground cover of showy aster (p = 0.0276). This was due to an increase in cover during year 2 for the N treatment (28%), while that of all other treatments was ~14–17% during the same year (Figure 2d). In year 3, this pattern reversed, with the H+C treatment showing the highest average cover (Figure 2d). Shoot biomass in year 3 showed a significant soil treatment effect (p = 0.0369), but there was no significant difference amongst treatments despite the N and H+C treatments having, on average, nearly twice the biomass of the L and H treatments (Figure 3a). Showy aster produced, on average, 1.5–2.5 new emerging shoots for each living seedling planted (Figure 3d) and 1.25–2.0 new lateral roots (Figure 3g), with no differences associated with soil treatment (Table 2). Finally, a significant soil treatment effect was detected for the longest lateral root (p = 0.0357), with the N treatment (33 cm) and H+C (20 cm) treatment being significantly different from one another (Figure 3j).

4.4. Spreading Dogbane

Spreading dogbane survival declined progressively over the three-year study (p = 0.0004) though soil treatments were similar (Table 2). It is notable that proportional survival in the N (0.86) and L (0.80) treatments was, on average, nearly twice as high compared with the standard (0.57) and standard + CC (0.37) treatments; as there was a high degree of variability in replicate blocks, this created substantial uncertainty (high variance) in the confidence interval estimates (Figure 2b). Although there was a two-way interaction between year of assessment and soil treatment that affected spreading dogbane vegetation ground cover (p = 0.0293), there was no meaningful difference amongst soil treatments within a given year and cover did increase steadily over time (Figure 2e). The overall shoot biomass in year 3 did not show a significant difference between soil treatments (Table 2); however, there was a substantial decrease in mean biomass for the H and H+C treatments relative to the N and L treatments (Figure 3b). Both the number of emerging new plants (p = 0.0082) and lateral roots (p = 0.0235) were different amongst soil treatments (Table 2). While the H treatment, with 0.6 new plants on average, was not significantly different than the other treatments, both the N and L treatments had significantly greater numbers of new plants (1.5–1.75) compared with the H+C treatment (0.08) (Figure 3e). The number of lateral roots (1.4) in the N treatment was also greater than the H+C treatment (0.7) though the H and L treatments were not distinct from either treatment (Figure 3g). Finally, despite the significant difference in the longest lateral root observed (p = 0.0291) (Table 2), the mean values of this response revealed no significant difference between the four treatments, with the longest lateral root length averaging 16–31 cm from the original plant (Figure 3k).

5. Discussion

For most measured parameters in this three-year study there were few differences amongst soil treatments, suggesting that nutrient accessibility was not a limiting factor for forb development. Ruderal vegetation competition did appear to have some influence on growth and survival, at least for some of the species studied, with varying magnitudes. This fact may also have indirectly contributed to the few growth improvements observed in the most nutrient-rich soil treatments (H and H+C) compared with the N treatment. However, the competition effect was subtle, as the H and H+C treatments often showed similar native forb responses. When differences were observed, they were more often observed in the slower-growing spreading dogbane and showy aster compared to Canada goldenrod, which grew vigorously in every treatment it was planted into. With regard to our second hypothesis, as previously shown by Wilson (1988) [21], Gedroc et al. (1996) [22], and Müller et al. (2000) [23], we observed the longest lateral roots in the N treatment for all three species. As a means to access nutrient sources in a nutrient-limited environment, plants tend to allocate more energy to elongating lateral roots.
Soil nutritive content did not affect Canada goldenrod survival or growth, which was high across treatments. These results do not align with our first hypothesis, which stated that higher nutrition would improve growth rates but reduce survival rates because of increased competition. Further, our results demonstrate that given the same soil quality (H or H+C), reducing vegetation competition did not alter the survival or growth outcomes of Canada goldenrod. Our results highlight Canada goldenrod’s versatility and resilience in a variety of soil types and competitive conditions, which concurs with the pre-existing knowledge about this species [16,24,25].
The response of showy aster to the soil treatments and competitive effects within the present investigation reflect an intermediate response relative to that observed in Canada goldenrod and spreading dogbane. There was a significant decline in survival within the H treatment compared to the N treatment, yet this effect was mediated in the H+C treatment. While there was no statistical difference in total cover amongst the soil treatments after three years, there was a substantial increase in average cover for the standard + competition control treatment compared with the standard treatment, further suggesting that showy aster did benefit from the additional soil resources provided when early ruderal competition was reduced. The total shoot biomass in year 3 showed that the aboveground biomass growth potential was similar between the no-topsoil and standard + competition control treatments at nearly 100 g per plant (other soil treatments averaged ~50 g per plant). These results highlight that while showy aster may show some growth benefits associated with higher soil nutritional properties, it is likely that the higher availability of growing space associated with the no-topsoil and standard + competition control treatments is more influential for this species, at least in the short term. These results also illustrate the capacity for showy aster to grow on a wide range of terrains and align with its occurrence on early successional sites [26].
The growth and survival of spreading dogbane also ran counter to our first hypothesis, as cover was similar amongst the treatments and biomass-related metrics tended to favor the N and L treatments. However, we did observe a stronger, though not statistically significant, decline in survival associated with both H treatments, which is suggestive of plant competition-mediated impacts, though we would not have expected to observe the same survival reduction in the H+C treatment. There are two plausible explanations for this last result—the first is that the relative reduction in competing vegetation offered by the H+C treatment was insufficient for spreading dogbane which, relatively speaking, was the slowest-growing species of the three native forbs studied and by the third year, the control offered by the pre-emergent herbicide treatment had waned. Secondly, it is also possible that spreading dogbane was negatively impacted by the herbicide applied, and although it was a pre-emergent herbicide which is designed to target seed emergence, it is possible that this species was particularly sensitive. Further investigation is needed to better understand which explanation was driving its reduced survival under these circumstances.
Although most soil properties showed substantial overlap, particularly in the H and L treatments, the variation in the C:N ratio at different treatments and depths may suggest differences in nitrogen mineralization rates and the factors driving microbial activity in these treatments. In particular, for the N treatment, the C:N ratio was well below 20, which is the optimal range for efficient nutrient cycling and supporting a healthy balance of microbial activity and plant growth. Typically, a lower C:N ratio (<20) can accelerate the decomposition of TOC and lead to rapid nitrogen mineralization and leaching [27]. Given the low N concentration in the N treatment, we would expect the mineralized N in the soil to be depleted quickly. This may lead to long-term reductions in plant growth in understory and overstory species.
This was a short-term investigation and studies such as these should be assessed over longer time periods to better connect short-term growth with longer-term establishment outcomes. For all species studied, the annual cover data collected had not yet stabilized, as cover was increasing year over year. For both Canada goldenrod and showy aster, the survival rates stabilized between years 2 and 3, but this was not the case for spreading dogbane in the H treatment. Therefore, some caution is needed when extrapolating these results beyond the time frame of the present investigation.

6. Conclusions

In summary, topsoil depth had a limited influence on the growth and survival of the three native forbs studied, suggesting that nutrient availability was not a primary limiting factor over the three-year period. Canada goldenrod showed consistently high survival and vigorous growth across all soil treatments, indicating that topsoil depth and the associated nutrient differences had little effect on this species. Showy aster exhibited moderate sensitivity to soil and competition effects, with improved survival when early ruderal competition was reduced, while spreading dogbane showed variable responses but tended to perform better in shallower or no-topsoil treatments. Overall, competing ruderal vegetation had only subtle effects on growth and survival, primarily affecting the slower-growing species, whereas Canada goldenrod remained relatively resilient. These results indicate that topsoil depth and ruderal competition can influence some species, but the magnitude is species-dependent, with Canada goldenrod emerging as a highly versatile and competitive candidate for future reclamation efforts.

Supplementary Materials

The following supporting information can be downloaded at: https://www.mdpi.com/article/10.3390/f16091442/s1, Table S1. Native forb seed source information including year of collection and geographic location. Seeds were collected by NAIT Centre for Boreal Research staff and stored frozen at the research facility in Peace River, AB. Following collection, seeds were stored in −18 °C freezer until sowing in the greenhouse. Table S2. Mean soil properties in September at 0–15 cm depth in the first growing season (year 1). Soil treatment includes N = no topsoil, L = 5 cm topsoil placement, H = 15 cm topsoil placement and HC = 15 cm topsoil placement and competition control. Values are means ± one standard deviation of the mean where measurements were based on 2 assessment points per block replicate (8 samples per soil treatment). Table S3. Summary of parameterization of generalized linear models in terms of fixed and random effects, distribution utilized and associated link function by response variable. Figure S1. Images of seedling production in the (a–c) nursery on 3 June 2020, and (b) outdoors on 20 August 2020. Photo credit: Kaela Walton-Sather, NAIT Centre for Boreal Research. Figure S2. Map illustrating the treatment layout of the study site showing the topsoil placement and pre-emergent herbicide treatments. Treatment notations are as follows: B1-4 refers to the replicate study blocks, H/L/C refer to the standard (H), shallow (L) or no-topsoil treatment (N) and T/C refer to treatment with pre-emergent herbicide (T) or untreated (C). Note that some treatment levels are not reflected in the present investigation. Figure S3. Images of root excavation activities of native forbs where the (a) flagging tape indicates the vegetative spread and location of new aboveground plants of goldenrod and (b) image of a goldenrod root rhizome that had spread laterally from the original plant (indicated by the marker with orange flagging). Photo credit: Camille Chartrand-Pleau, NAIT Centre for Boreal Research. Figure S4. (a) Scree plot illustrating proportion of variance explained in analysis of soil chemistry results in year 1 of the study. (b) Correlations of chemical properties with individual dimensions (axes). Figure S5. Images of planted native forbs in August 2023, after three growing seasons at a reclamation site in the shallow topsoil treatment outlined in red. (a) Canada goldenrod [Solidago canadensis], (b) showy aster [Eurybia conspicua] and (c) creeping dogbane [Apocynum androesaefolium]. Photo credit: Amanda Schoonmaker, NAIT Centre for Boreal Research.

Author Contributions

A.S. conceived and designed the research; A.S. and D.D. secured funding for this research; C.C.-P. and A.S. conducted field work and analyzed the data; AS created the illustrations; C.C.-P., D.D. and A.S. wrote and edited the manuscript. All authors have read and agreed to the published version of the manuscript.

Funding

Funding for this work was provided by an NSERC IRCC grant (CIRC 472065-19) and ConocoPhillips Canada.

Data Availability Statement

Raw data are available upon request.

Acknowledgments

We would like to acknowledge the efforts of Robert Albricht (ConocoPhillips Canada), who was highly supportive of this work and most notably facilitated the setup of the study site. Several student research assistants and staff at the NAIT Center for Boreal Research also assisted with this project in the field. We appreciate the feedback on an earlier draft of this manuscript provided by Angeline Van Dongen (Natural Resources Canada). The raw data associated with this manuscript will be available in an online repository (after the manuscript is accepted).

Conflicts of Interest

The authors declare no conflicts of interest.

References

  1. Baah-Acheamfour, M.; Dewey, M.; Fraser, E.C.; Schreiber, S.G.; Schoonmaker, A. Assessing Ecological Recovery of Reclaimed Well Sites: A Case Study from Alberta, Canada. Front. For. Glob. Change 2022, 5, 849246. [Google Scholar] [CrossRef]
  2. Lupardus, R.C.; McIntosh, A.C.S.; Janz, A.; Farr, D. Succession after reclamation: Identifying and assessing ecological indicators of forest recovery on reclaimed oil and natural gas well pads. Ecol. Indic. 2019, 106, 105515. [Google Scholar] [CrossRef]
  3. Environment and Sustainable Resource Development (ESRD). 2010 Reclamation Criteria for Wellsites and Associated Facilities for Forested Lands (Updated July 2013); Environment and Sustainable Resource Development: Edmonton, AB, Canada, 2013; p. 81. [Google Scholar]
  4. U.S. Department of the Interior. Surface Mining Control Reclamation Act (SMCRA); U.S. Department of the Interior, Office of Surface Mining: Washington, DC, USA, 1977.
  5. Australia Department of Industry Tourism and Resources. Mine Closure and Completion: Leading Practice Sustainable Development Program for the Mining Industry; Department of Industry, Resources and Tourism: Canberra, Australia, 2006.
  6. Williamson, T.B.; Edwards, J.E. Adapting Sustainable Forest Management to Climate Change: Criteria and Indicators in a Changing Climate; Canadian Council of Forest Ministers: Ottawa, ON, Canada, 2013. [Google Scholar]
  7. Hart, S.A.; Chen, H.Y.H. Understory Vegetation Dynamics of North American Boreal Forests. Crit. Rev. Plant Sci. 2006, 25, 381–397. [Google Scholar] [CrossRef]
  8. Thrippleton, T.; Bugmann, H.; Kramer-Priewasser, K.; Snell, R.S. Herbaceous Understorey: An Overlooked Player in Forest Landscape Dynamics? Ecosystems 2016, 19, 1240–1254. [Google Scholar] [CrossRef]
  9. Knops, J.M.H.; Nash, I.I.I.T.H.; Schlesinger, W.H. The Influence of Epiphytic Lichens on the Nutrient Cycling of an Oak Woodland. Ecol. Monogr. 1996, 66, 159–179. [Google Scholar] [CrossRef]
  10. Weber, M.G.; Cleve, K.V. Nitrogen dynamics in the forest floor of interior Alaska black spruce ecosystems. Can. J. For. Res. 1981, 11, 743–751. [Google Scholar] [CrossRef]
  11. Hanley, T.A.; Deal, R.L.; Orlikowska, E.H. Relations between red alder composition and understory vegetation in young mixed forests of southeast Alaska. Can. J. For. Res. 2006, 36, 738–748. [Google Scholar] [CrossRef]
  12. Cohen, A.; Naeth, M. Increasing Woody Species Diversity for Sustainable Limestone Quarry Reclamation in Canada. Sustainability 2013, 5, 1340–1355. [Google Scholar] [CrossRef]
  13. Smreciu, A.; Gould, K. Field emergence of native boreal forest species on reclaimed sites in northeastern Alberta. Nativ. Plants J. 2015, 16, 204–226. [Google Scholar] [CrossRef]
  14. Macdonald, S.; Landhäusser, S.; Skousen, J.; Franklin, J.; Frouz, J.; Hall, S.; Jacobs, D.; Quideau, S. Forest restoration following surface mining disturbance: Challenges and solutions. New For. 2015, 46, 703–732. [Google Scholar] [CrossRef]
  15. Schoonmaker, A.L.; Mathison, A.; Mackenzie, M.D. Hitchhiker planting: Mixed-species container stock planting as a novel tool to increase plant diversity on industrially disturbed sites. Can. J. For. Res. 2023, 53, 905–921. [Google Scholar] [CrossRef]
  16. Johnson, D.; Kershaw, L.; Mackinnon, A. Plants of the Western Forest: Alberta, Saskatchewan and Manitoba Boreal and Aspen Parkland, 3rd ed.; Partners Publishing: Beaver Dam, NB, Canada, 2020. [Google Scholar]
  17. Brooks, M.E.; Kristensen, K.; van Benthem, K.J.; Magnusson, A.; Berg, C.W.; Nielsen, A.; Skaug, H.J.; Maechler, M.; Bolker, B.M. glmmTMB Balances Speed and Flexibility Among Packages for Zero-inflated Generalized Linear Mixed Modeling. R J. 2017, 9, 378–400. [Google Scholar] [CrossRef]
  18. Lenth, R.V. Least-squares means The R package lsmeans. J. Stat. Softw. 2018, 69, 1–33. [Google Scholar]
  19. Dietrich, S.T.; MacKenzie, M.D.; Battigelli, J.P.; Enterina, J.R. Building a Better Soil for Upland Surface Mine Reclamation in Northern Alberta: Admixing Peat, Subsoil and Peat Biochar in a Greenhouse Study with Aspen. Can. J. Soil Sci. 2017, 97, 592–605. [Google Scholar] [CrossRef]
  20. Kassambara, A.; Mundt, F. Factoextra: Extract and Visualize the Results of Multivariate Data Analyses, R package version 1.0.7; The R Foundation: Vienna, Austria, 2020; Available online: https://CRAN.R-project.org/package=factoextra (accessed on 5 September 2025).
  21. Wilson, J.B. A Review of Evidence on the Control of Shoot: Root Ratio, in Relation to Models. Ann. Bot. 1988, 61, 433–449. [Google Scholar] [CrossRef]
  22. Gedroc, J.J.; McConnaughay, K.D.M.; Coleman, J.S. Plasticity in Root/Shoot Partitioning: Optimal, Ontogenetic, or Both? Funct. Ecol. 1996, 10, 44–50. [Google Scholar] [CrossRef]
  23. Müller, I.; Schmid, B.; Weiner, J. The effect of nutrient availability on biomass allocation patterns in 27 species of herbaceous plants. Perspect. Plant Ecol. Evol. Syst. 2000, 3, 115–127. [Google Scholar] [CrossRef]
  24. Abhilasha, D.; Quintana, N.; Vivanco, J.; Joshi, J. Do allelopathic compounds in invasive Solidago canadensis s.l. restrain the native European flora? J. Ecol. 2008, 96, 993–1001. [Google Scholar] [CrossRef]
  25. Pinno, B.; Li, E.; Khadka, B.; Schoonmaker, A. Germination and early growth of boreal understory plants on 3 reclamation soil types under simulated drought conditions. Nativ. Plants J. 2017, 18, 92–105. [Google Scholar] [CrossRef]
  26. Craig, A.; Macdonald, S.E. Threshold effects of variable retention harvesting on understory plant communities in the boreal mixedwood forest. For. Ecol. Manag. 2009, 258, 2619–2627. [Google Scholar] [CrossRef]
  27. Van der Sloot, M.; Kleijn, D.; De Deyn, G.B.; Limpens, J. Carbon to nitrogen ratio and quantity of organic amendment interactively affect crop growth and soil mineral N retention. Crop Environ. 2022, 1, 161–167. [Google Scholar] [CrossRef]
Figure 1. The principal component analysis of soil properties (0–30 cm depth) grouped by topsoil depth treatments, where N = no topsoil, L = 5 cm topsoil placement, H = 15 cm topsoil placement, and HC = 15 cm topsoil placement and competition control. Values for individual treatment plots are shown as small symbols and the mean centroid value per treatment shown as a larger symbol. Ellipses show 95% confidence intervals around the mean centroid value. Arrows the illustrate the variables correlation with principal components.
Forests 16 01442 g001
Figure 2. The mean survival (expressed as a proportion) and forb cover (%) of showy aster, spreading dogbane, and Canada goldenrod by year of assessment and soil treatment, where N = no topsoil, L = shallow topsoil placement, H = standard topsoil placement, and H+C = standard topsoil placement and competition control. The values are estimated marginal means with error bars representing the 95% confidence intervals of the means (n = 4 replicate blocks per soil treatment, 6–12 observations per block). Treatment means within a measurement year that have differing letters indicate a significant difference (α < 0.05).
Forests 16 01442 g002
Figure 3. The mean aboveground shoot mass, number of new plants, number of lateral roots (>10 cm), and length of the longest lateral root of showy aster, spreading dogbane, and Canada goldenrod after 3 growing seasons by soil treatment, where N = no topsoil, L = shallow topsoil placement, H = standard topsoil placement, and H+C = standard topsoil placement and competition control. The values are estimated marginal means, with error bars representing the 95% confidence intervals of the means (n = 4 blocks per soil treatment, 3 observations per block). Treatment means with differing letters indicate a significant difference (α < 0.05).
Forests 16 01442 g003
Table 1. The site’s total vegetation cover (expressed as a proportion) development (years 1–3), where N = no topsoil, L = 5 cm topsoil placement, H = 15 cm topsoil placement, and HC = 15 cm topsoil placement and competition control. The values are means, with the 95% confidence interval of each mean shown in brackets. Treatment means within a measurement year that have differing letters indicate a significant difference (α < 0.05) (22-point measurements per treatment block replicate, n = 4 blocks).
Soil TreatmentYear 1Year 2Year 3
N0.05 ab (0.03–0.08)0.19 a (0.14–0.25)0.25 b (0.19–0.32)
L0.09 b (0.06–0.13)0.22 a (0.16–0.28)0.40 a (0.33–0.49)
H0.07 ab (0.04–0.10)0.21 a (0.16–0.28)0.49 a (0.40–0.57)
HC0.03 a (0.01–0.05)0.16 a (0.11–0.21)0.35 ab (0.28–0.43)
Table 2. An analysis of deviance table for the generalized linear mixed effects models evaluating native forb responses. DF = degrees of freedom.
ResponseForbFixed EffectsChi-Square ValueDFp-Value
Site total vegetation cover Soil treatment10.556030.0144
Year407.41102<0.0001
Soil treatment × year28.13106<0.0001
SurvivalAsterSoil treatment11.796930.0081
Year10.393120.0055
Soil treatment × year1.846760.9332
DogbaneSoil treatment3.062730.3820
Year15.526520.0004
Soil treatment × year3.15860.7887
GoldenrodSoil treatment1.508330.6803
Year1.481420.4768
Soil treatment × year0.784560.9925
Forb coverAsterSoil treatment2.440130.4862
Year475.74522<0.0001
Soil treatment × year14.187560.0276
DogbaneSoil treatment1.84230.6058
Year481.1612<0.0001
Soil treatment × year14.02860.0293
GoldenrodSoil treatment1.290530.7313
Year1115.05792<0.0001
Soil treatment × year24.557860.0004
Shoot biomassAsterSoil treatment8.485330.0369
DogbaneSoil treatment5.591730.1333
GoldenrodSoil treatment9.048130.0286
Number of new plantsAsterSoil treatment4.866730.1818
DogbaneSoil treatment11.75330.0082
GoldenrodSoil treatment0.095530.9924
Number of lateral rootsAsterSoil treatment5.791530.1222
DogbaneSoil treatment9.479630.0235
GoldenrodSoil treatment1.861930.6016
Longest lateral rootAsterSoil treatment8.562630.0357
DogbaneSoil treatment9.01430.0291
GoldenrodSoil treatment2.543430.4675
Disclaimer/Publisher’s Note: The statements, opinions and data contained in all publications are solely those of the individual author(s) and contributor(s) and not of MDPI and/or the editor(s). MDPI and/or the editor(s) disclaim responsibility for any injury to people or property resulting from any ideas, methods, instructions or products referred to in the content.