Abstract
As wooden buildings become larger and taller, wood properties such as the dynamic modulus of elasticity (), a criterion for evaluating structural timber, are becoming increasingly important. However, the of logs is rarely considered in forestry management. In this study, standing trees that can produce logs with high at the standing tree stage were identified to facilitate log sales decisions based on the values. In the generalized linear mixed model-based prediction of log , bucking position and site index were selected as random effects. Incorporating random effects improved the coefficient of determination to 0.651, and log could be predicted using the site index class, which reflects site productivity. The results indicate that detailed site conditions conventionally used to assess forest productivity are also useful for predicting the of logs before harvesting. Moreover, the of logs estimated at the standing tree stage can inform decisions regarding appropriate sales destinations.
1. Introduction
With growing concerns about global warming, the demand for larger and high-rise wooden buildings is increasing as a means of carbon fixation [1]. The mechanical properties of wood, such as strength, are important when it is used as a structural material, and it is required in Japan to clearly demonstrate its strength performance [2]. Therefore, the dynamic modulus of elasticity (), which correlates with strength and can be measured non-destructively, is used as an indicator of strength performance in Japan [3]. However, since logs are delivered to the sawmill without prior quality assessment, the sawmill must purchase more logs than required when a certain quantity of logs with high for structural use is needed. As a result, many low-quality logs are processed, and the wood processing industry bears the associated costs [4]. Thus, the selection of logs with high or trees with high potential for producing high- logs should improve the efficiency of securing raw materials for log distribution. When logs that meet the quality requirements of sawmills can be secured, they are typically assigned higher prices than usual [5,6]. In addition, Cryptomeria japonica (Japanese cedar) exhibits high variability in strength performance and is generally classified as a species with a low [7]. Therefore, if it is possible to identify standing trees that produce logs with a high , such trees of guaranteed quality can be preferentially harvested and sold at higher prices. By determining the of logs in advance, harvesting and sales can be strategically planned to achieve greater efficiency and profitability in log trading.
Substantial efforts have been made to identify standing trees that produce logs with high ; however, most methods suggested in previous studies are challenging and labor-intensive, especially when assessments must be conducted on standing trees. For example, numerous studies using nondestructive testing have shown that the of logs can be predicted with high accuracy at the standing tree stage by measuring the velocity of stress waves [8,9,10,11,12,13]. In addition, prediction models using the microfibril angle (MFA) have been developed to estimate [14]. Viguier et al. [15] also achieved high prediction accuracy by analyzing the grain angle using optical scanning. However, from the perspective of forest management, it is ideal to identify standing trees capable of producing high- logs without relying on difficult-to-measure variables.
The relationship between tree growth, an indicator commonly used in forest management, and the of logs has been partially clarified. Lower growth rates tend to be associated with a higher . A clear negative correlation was observed between the diameter at breast height (DBH) of trees and the of logs; trees with larger DBH tended to have lower values [16,17]. In addition, the of logs varies depending on the vertical position within a single tree [18,19]. In Japanese cedar, differences in tree height have also been suggested as a cause of individual variation in the vertical distribution of within trees [20], indicating that tree height may also influence the of logs. Krenn et al. [21] indicated that low-moisture sites, where height growth is slow, produce logs with high . This indicates that site conditions with low productivity have the potential to produce logs with high , which might serve as a useful indicator, together with tree growth, for identifying trees that produce logs with high .
Considering the postharvest sorting of logs based on for different buyers, it is desirable to predict the variation in of logs produced from trees within the same site. Although tree growth indicators, such as DBH and tree height, can be assessed at the individual tree level, site conditions are generally evaluated by comparing their effects on tree growth at the site level (e.g., 50 m × 50 m or 25 m × 25 m plots) [22,23]. There are a few documented cases in which the productivity of site conditions has been assessed in detail for individual trees within the same site. However, recent advances in light detection and ranging (LiDAR) technologies, such as unmanned aerial vehicle-based LiDAR (UAV-LiDAR) and terrestrial laser scanning, have enabled a detailed representation of topography. This makes it possible to examine how fine-scale site conditions within a stand affect individual tree growth and the of logs.
To clarify the relationship between the characteristics of standing trees and those of the logs from these trees, it is necessary to trace each log back to the original tree from which it was harvested. However, obtaining traceable trees from a large number of sites is difficult. Although this might be a tedious process, accumulating such case studies is essential for promoting transparency and efficiency in log trading.
Therefore, as a case study, this study aimed to identify standing trees capable of producing logs with high to select the optimal trees for harvesting and determine sales destinations based on values. Tree growth indicators (mean annual growth, DBH, and height) were evaluated at each site (where slope type, deposition type, and site index class were determined) to assess the influence of these conditions on tree growth within a single site. The relationship between tree growth indicators and the of the harvested logs was then analyzed while considering the bucking position (the height along the tree from which each log was produced), as this is known to influence the log . An prediction model was developed using a generalized linear mixed model (GLMM), based on tree growth indicators and detailed site conditions. In the GLMM, tree growth indicators were treated as fixed effects, while factors such as site conditions and bucking position were included as random effects to account for their hierarchical variation and improve the accuracy of predictions [24]. The potential for and challenges of identifying high--log-producing trees at the standing tree stage are discussed.
2. Materials and Methods
2.1. Study Site
The study site is a privately owned forest in Wazuka Town, Kyoto Prefecture, Japan. The site is a 45-65-year-old Japanese cedar plantation with approximately 350 trees/ha. Since there is no record of thinning history, the intensity and timing of the thinning are unknown. However, poor-quality standing trees are selectively harvested during commercial thinning. As is common in many Japanese forests, detailed management records, such as cultivar and planting density, were unavailable (Figure 1). The elevation of the site is 435 m. From 2015 to 2024, the 10 y average climatic conditions were as follows: a maximum temperature of 38.7 °C, a minimum temperature of −2.5 °C, and a total annual precipitation of 1661.7 mm [25]. The target species of this study, Cryptomeria japonica (Japanese cedar), is a major coniferous species in Japan. Large-scale afforestation of this species was actively promoted in the 1950s [26], particularly in valleys and on gentle slopes with favorable moisture conditions. Currently, cedar accounts for approximately 60% of Japan’s domestic log production [27] and plays a vital role in national timber supply. However, due to the considerable variability in wood quality [7], its use as structural timber remains limited, and many of the structural materials used in Japan are made from foreign species.
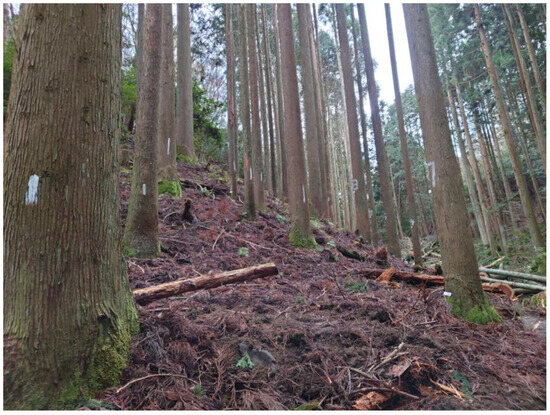
Figure 1.
The target site of cedar trees in Wazuka Town, Kyoto Prefecture, Japan.
2.2. Sampling and Data Collection
2.2.1. Tree and Log Data
Tree height and DBH were measured in 27 trees designated for thinning at the study site. Prior to thinning, aerial images of the forest were captured using the DJI Matrice 300 RTK (DJI, Shenzhen, China) to identify tree locations. In addition, LiDAR measurements were conducted using the DJI Zenmuse L1 (DJI, Shenzhen, China) to obtain topographic information. After felling, each tree was cut into 4 m logs (Figure 2), totaling 104 logs, taking 2 to 5 logs from each tree. To link each log to its original tree, the tree number and bucking position were marked at the top end of each log. The first 4 m section from the bucking height was the bottom log, and the section located above the bottom log was the upper log (Figure 2a). The bucking position was categorically divided into two sections (bottom and upper) because the of the first log (bottom section) is known to be lower in Japanese cedar [28].
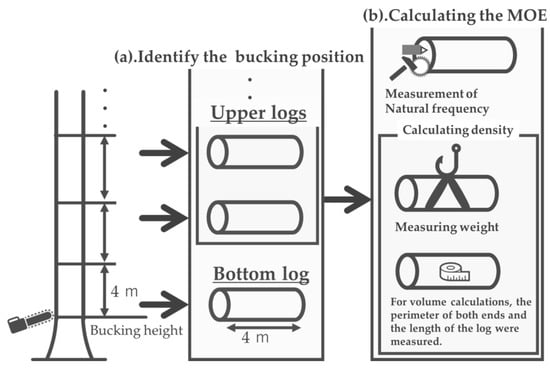
Figure 2.
Workflow of field survey and data acquisition: (a) classification of backing positions; the bottom log was categorized as the initial 4 m section from the bucking height; upper logs were defined as those positioned above the bottom log; (b) parameters obtained for calculation.
The of each log is calculated using Equation (1) in accordance with the Japanese Agricultural Standard [3]:
where (m) is the log length, (Hz) is the natural frequency [29,30], and (kg/) is the density calculated by dividing the weight by the log volume (). The length and perimeter of the top and bottom ends were measured to calculate the volume of each obtained log, and the weights were measured for density calculations (Figure 2b). Natural frequency was measured using an HG-2020 device (ATA Inc., Tokyo, Japan) by striking the cross section of wood with a hammer [29,30] (Figure 2b). Photographs of the bottom end of each bottom log were taken to count the growth rings and determine tree age.
2.2.2. Site Condition Data
To evaluate growth differences among standing trees within a single site, this study used a geographic information system (GIS, ArcGIS Pro 3.2.0) to derive detailed site conditions, such as slope type, depositional type, and site index class, from a 5 m resolution digital elevation model (DEM) generated using UAV-LiDAR data.
Site conditions primarily affect the height growth of cedars. For example, Nakao et al. [22] reported a positive correlation between land moisture and height growth (25 m × 25 m scale), whereas Teraoka et al. [23] suggested that the depositional type has the greatest influence on site productivity (50 m × 50 m scale). These studies examined the relationship between site conditions and tree height at a broad scale, specifically, the variation in land productivity between different sites.
However, DBH is strongly influenced by competition among trees, with the dominant trees tending to develop larger DBH, particularly those in the same stand and under the same treatment [31]. This finding suggests that dominant trees that benefit from site conditions suitable for growth may have a larger DBH. Therefore, we first confirmed how fine-scale (5 m × 5 m) site conditions within a single site affected tree growth, both height and DBH, to ultimately influence log .
In the current study, the slope type was defined based on topographic variation (Figure 3), and a classification of nine slope types was created using GIS, combining profile and plan curvatures [32] (e.g., concave, linear, and convex in valley, linear, and ridge areas). At the study site, cedar was planted only in the valleys and was therefore classified into three slope types: concave, linear, and convex within the valley areas (Figure 3a). Soil deposition was defined as the depositional type. Following the classification method proposed by Teraoka et al. [23], the slope type was categorized into three classes based on the gradient: steep and moderate slopes were classified as creep soil (creep), whereas gentle slopes were further divided into colluvial (concave or linear) and residual (convex) types (Figure 3b).
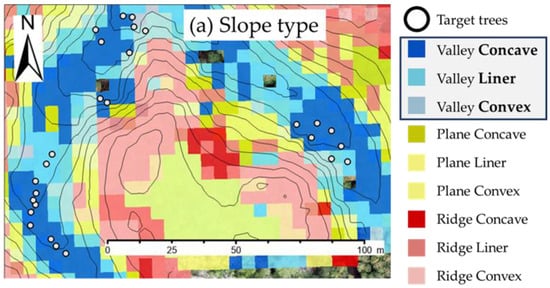

Figure 3.
Geographic information system (GIS) map derived from a 5 m resolution digital elevation model generated using unmanned aerial vehicle-based light detection and ranging (LiDAR) data. (a) Slope type; (b) depositional type; (c) site index class. The white circle indicates the location of a target tree. The legend surrounded in blue indicates the site conditions used in this study.
In the current study, the combination of slope and depositional type, as used by Nagashima et al. [33], was defined as the site index class, which represented the site productivity. Three classes were established: Class A, considered productive, included combinations such as concave with colluvial or creep soil, and linear with colluvial or creep. Class B, indicating moderate productivity, included convex with creep soil. Class C, considered unproductive, included convex with residual soil (Figure 3c). However, because the study site was located entirely in the valley, Class C was not observed, and only Classes A and B were used.
2.3. Method of Analysis
2.3.1. Detailed Site Conditions, Growth Indicators, and
To discuss the relationships between tree growth indicators and the of logs, it is important to show that the indicators used in this study had secured the general tendency indicated in previous studies [22,23,31,33]. Before analyzing the main relationship, we first investigated the differences in due to the bucking position. Then, we investigated the variation in according to detailed site conditions. Also, we examined the associations between tree growth indicators and detailed site conditions, as well as between tree growth indicators and the of logs. We evaluated these trends in the context of previous studies.
Differences in based on bucking position were analyzed by generating and comparing boxplots, and statistical significance was assessed using the Wilcoxon rank-sum test [34]. Similarly, differences in associated with detailed site conditions were examined using boxplots and statistical tests. The Wilcoxon rank-sum test was applied for categorical variables such as depositional type and site index class [34], while the Kruskal–Wallis test [35] was used for slope type. When significant differences were identified, Steel–Dwass multiple comparison tests [36] were conducted as post hoc analysis. The relationship between site conditions and tree growth indicators was examined by creating and comparing boxplots of mean annual height and DBH growth for each site condition. The differences were examined by applying the Wilcoxon rank-sum test [34] for the site index class and depositional type, and the Kruskal–Wallis test [35] for the slope type, followed by Steel–Dwass [36] multiple comparisons in cases where significant differences were detected. The mean annual height and DBH were calculated by dividing the tree height and DBH by the tree age.
The tree growth indicators and of the logs were plotted on a scatter plot, and the relationship between the two was determined by calculating the regression relationship and its coefficient of determination using the least-squares method. The of logs differs with respect to the bucking position, such that the approximation formulae and coefficients between tree growth indicators and of logs were calculated separately according to the bucking position (bottom or upper). The p-value was calculated to assess the significance of the coefficient of determination of the regression.
2.3.2. Developing a Model to Predict the of Logs in Order to Select the Optimal Tree for Harvesting and Determine Sales Destination Before Harvest
An predictive model was developed using a GLMM that included growth indicators, site condition, and bucking position. The GLMM was selected because it allowed for the selection of an optimal subset of predictor variables while accounting for random effects in the data. The of logs was used as the response variable, and height and DBH growth were standardized and used as fixed explanatory variables. To clarify the relationship between and the factors of site conditions and bucking position, the latter two were incorporated as random effects. An optimal combination of explanatory variables was determined to investigate the effects of tree growth indices and site conditions on the of the logs. To avoid the effects of multicollinearity, site condition variables were included individually as random effects in the model and were not included simultaneously. Candidate models were ranked in ascending order based on Akaike Information Criterion (AIC) values [37]; models with the lowest AIC or an AIC difference of less than two units were considered to have substantial support and were selected for further interpretation.
The lme4 package [38] in R (version 4.4.2) was used to fit the GLMM. A Gaussian error distribution with identity link functions was specified assuming that the of the logs followed a normal distribution. The dredge function of the MuMIn [39] package was used for model selection to identify the best-fit set of explanatory variables.
3. Results
3.1. Detailed Site Conditions, Growth Indicators, and
The differences in based on bucking position are shown in Figure 4. Similarly, the differences in related to detailed site conditions are presented in Figure 5, followed by the differences in height and DBH growth according to site condition, which are presented in Figure 6 and Figure 7. The of logs from the upper section tended to be significantly higher than that of logs from the bottom (p < 0.01, Figure 4). Logs harvested from convex slopes showed significantly higher compared to those from concave (p < 0.05) and linear slopes (p < 0.01, Figure 5a). In terms of depositional type, was significantly higher in logs from creep soil than from colluvial soil (p < 0.05, Figure 5b). Similarly, for site index class, Class B exhibited significantly higher than Class A (p < 0.01, Figure 5c). The convex slope tended to have smaller mean annual growth in both height and DBH. Differences were detected between the concave and convex slopes (p < 0.01) and linear slopes (p < 0.01) in height growth (Figure 6a). Differences were found in DBH growth for all slope types (p < 0.05, Figure 7a). No differences in height were detected between the depositional type (p = 0.711, Figure 6b), whereas trees in the colluvial soil grew faster than those in the creeping soil in terms of DBH growth (p < 0.05, Figure 7b). The site index class showed differences in both height (p < 0.01) and DBH growth (p < 0.01), with Class A having greater height and DBH growth than Class B (Figure 6c and Figure 7c).
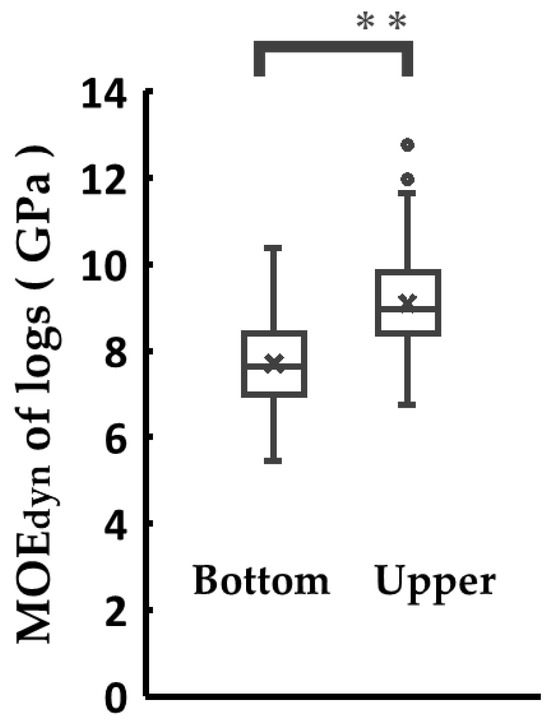
Figure 4.
Differences in by bucking position. Asterisks indicate statistical significance: ** p < 0.01.
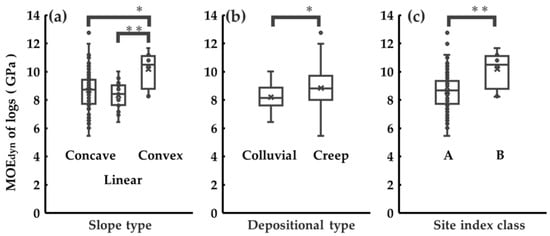
Figure 5.
Differences in by site conditions: (a) relationship between slope type and of logs; (b) relationship between depositional type and of logs; (c) relationship between site index class and of logs. Asterisks indicate statistical significance: * p < 0.05, ** p < 0.01.
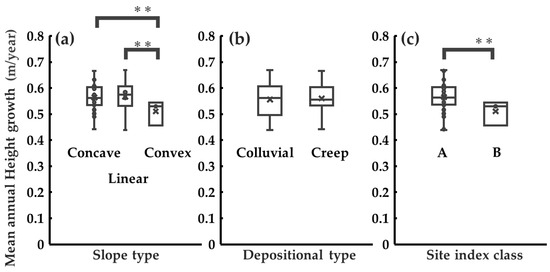
Figure 6.
Relationship between site condition and tree growth: (a) relationship between slope type and height; (b) relationship between depositional type and height; (c) relationship between site index class and height. Asterisks indicate statistical significance: ** p < 0.01.
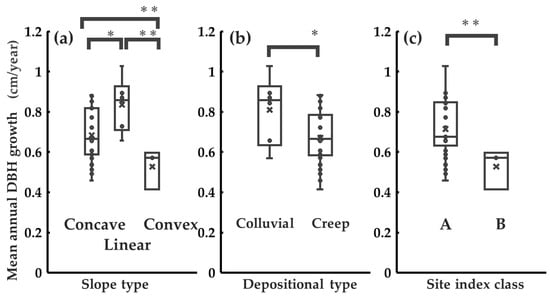
Figure 7.
Relationship between site condition and tree growth. (a) Relationship between slope type and diameter at breast height (DBH) growth; (b) depositional type and DBH growth; (c) site index class and DBH growth. Asterisks indicate statistical significance: * p < 0.05, ** p < 0.01.
No relationship between height and was found, regardless of bucking position. The height and of logs for the bottom log (Figure 8a) are shown in Equation (2) (R2 = 0.0112; p = 0.533):
y = −2.10x + 8.88
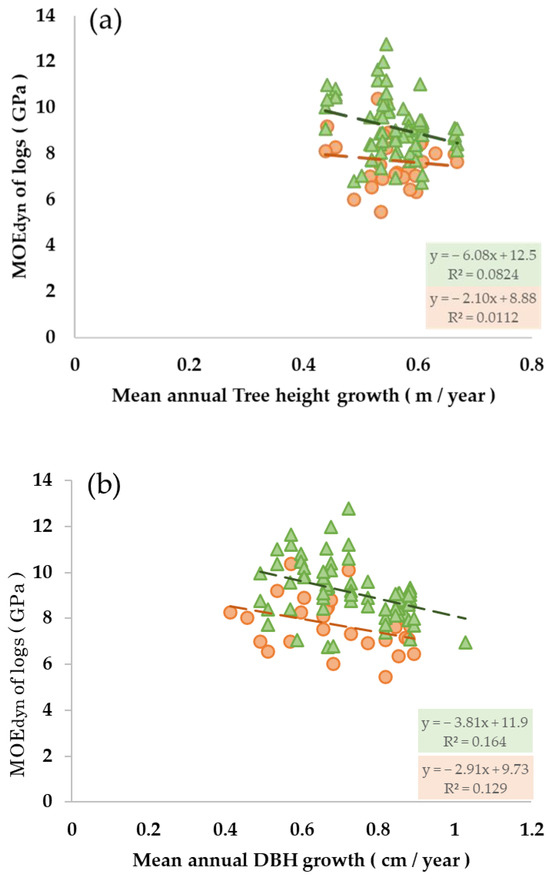
Figure 8.
Relationship between log and tree growth by bucking position. (a) Relationship between of logs and height growth by bucking position; (b) relationship between of logs and diameter at breast height (DBH) growth by bucking position; data from the bottom log is shown in orange and data from the upper log in green.
The equation for the upper log is shown in Equation (3) (R2 = 0.0824, p = 0.115):
y = −6.08x + 12.5
Although the slopes of the equations for the bottom and upper logs were negative, the values were very different (−2.10 for the bottom and −6.08 for the upper log) together with the intercepts (the bottom log: 8.88; the upper log: 12.5).
No relationship between DBH growth and was found for the bottom log (p = 0.0655), based on Equation (4) (Figure 8b; R2 = 0.129):
y = −2.91x + 9.73
A relationship between DBH growth and was found for the upper log (p < 0.01) based on the approximate equation (Equation (5); Figure 8b; R2 = 0.164):
y = −3.81x + 11.9
The slopes of the bottom and upper approximations were both negative, although the slope values (bottom: −3.81, upper: −2.91) and intercepts (bottom: 9.73, upper: 11.9) were different. The coefficient of determination between DBH growth and was 0.164, and that for tree height growth was 0.129, both of which were low. This suggests that growth indicators alone are not strongly correlated with .
3.2. Developing a Model to Predict the of Logs in Order to Select the Optimal Tree for Harvesting and Determine Sales Destination Before Harvest
The results of the GLMM for predicting the are presented in Table 1. The selected model included DBH growth as a fixed effect, and site index class and bucking position as random effects, with the following structure: ~ DBH growth + (1| site index class) + (1|bucking position). Only the best model is shown, because there was no model in which the difference in AIC was within two units of the best model (AIC = 325). Only DBH growth was selected as the explanatory variable, and the estimated coefficient was −0.360, with a strong negative relationship with (p < 0.01). The site index class and bucking position were selected as random effects. The site index class had contrasting effects on the of logs: Class A (well-growing sites) had a negative effect (−0.596), while Class B (poor-growth sites) had a positive effect (+0.596). For bucking position, the bottom had a negative effect on the of logs at −0.762, whereas the upper had a positive effect at 0.762. The coefficient of determination for the DBH growth was only 0.04, whereas the coefficient of determination considering random effects was 0.651.

Table 1.
Results of the generalized linear mixed model.
4. Discussion
4.1. Detailed Site Conditions, Growth Indicators, and
This study suggests that detailed site conditions (slope type, depositional type, site index class) derived from a high-resolution 5 m × 5 m DEM may influence tree height growth within a single site (Figure 6), showing the same tendency observed in previous studies which used coarser-scale DEMs and focused on comparisons between different sites [22,23,33]. In particular, significant differences in height growth were observed between convex and concave slope types (p < 0.01, Figure 6a), as well as between convex and linear slope types (p < 0.01), with convex slopes consistently showing poorer height growth. A significant difference in height growth was also found between site index classes A and B (p < 0.01) (Figure 6c). Because Japanese cedar grows well in moist soil [22], convex with low moisture is considered unfavorable for its growth. Furthermore, since site index Class A is associated with higher productivity [33], the observed significant differences in topographic conditions are consistent with trends reported in previous studies.
On the other hand, DBH growth is known to be strongly influenced by competition among trees—driven by planting density [40], thinning, and the availability of resources, such as light and water—rather than by site condition. However, significant differences in DBH growth were observed across all three site conditions in this study (Figure 7). Similar to the results for height growth, convex slopes showed significantly lower DBH growth compared to both concave and linear slopes (p < 0.01 for both) (Figure 7a). Additionally, a significant difference in DBH growth was found between site index Class A and B (p < 0.01, Figure 7c). This suggests the importance of a fine-scale understanding of environmental variation at the individual-tree level to evaluate DBH growth. The relationship between site conditions and DBH observed in the present study demonstrates the possibility of evaluating DBH growth when site conditions are assessed at a finer spatial resolution. In particular, at later stages of stand development—when competition for height growth has diminished—favorable site conditions, such as adequate soil moisture, appear to promote DBH growth rather than height growth [41]. The site in this study is considered to fall under such conditions. Also, Figure 5 shows that tended to be significantly lower in site conditions where tree growth, as indicated by height and DBH, was generally better (concave, linear, colluvial, and Class A), compared to conditions with poorer growth (convex, creep, and Class B). This suggests that logs harvested from trees grown in topographic conditions favorable for Japanese cedar growth—likely due to better moisture availability—may have lower values. There was no strong relationship between tree growth indicators and (Figure 8). Previous studies have suggested a negative correlation between DBH growth and [18], and a similar negative relationship was observed in this study as well (Figure 8b). However, the coefficients of determination were low for both the bottom and upper logs (Figure 8b). Consistent with previous studies, the of logs from the upper section tended to be significantly higher than that of logs from the bottom (Figure 4) [16,18]. Although this study does not aim to identify the physical mechanism and to identify the causes of the vertical variation in within the same trees, previous research has shown that differences in wood properties, such as wood density [42,43], proportion of juvenile wood, and fiber angle, including MFA, as reported by Kijidani [20], can account for such variations. In addition, due to the very low coefficient of determination (bottom: 0.129, upper: 0.164), no clear relationship was observed between and tree height growth (Figure 8a). However, different trends were observed between the bottom and upper logs. In the upper logs, the slope was −6.08, compared to −2.10 in the bottom logs, indicating a stronger negative relationship with tree height growth in the upper logs. Although individual vertical variations in in cedars have been suggested to be influenced by tree height growth [20], this trend was not observed in this study. To better understand this discrepancy, it may be necessary to examine more detailed information on tree height growth—such as early growth during the formation of juvenile wood—rather than using only average height growth, as was the case in this study. This would involve analyzing the relationship between or wood properties and vertical position within the tree. Early growth is likely influenced not only by site conditions but also by initial planting density. Therefore, future research should focus on sites where such records are available and where tree height and DBH have been measured periodically, in order to clarify these relationships.
4.2. Developing a Model to Predict the of Logs in Order to Select the Optimal Tree for Harvesting and Determine Sales Destination Before Harvest
The of logs could be predicted with a certain degree of accuracy based on DBH growth, site conditions, and bucking position, and it is therefore possible to extract stands that can produce logs with high within a single site. The selected model included mean DBH growth as a fixed effect, as well as site index class and bucking position as random effects (Table 1). The coefficient of determination based on fixed effects alone was just 0.04, whereas it increased substantially to 0.651 when random effects were included. The coefficient of determination for the prediction model using stress wave velocity reported by Harada et al. [16] was 0.672, and a similar level of accuracy was achieved in this study. Although stress wave velocity must be measured for each standing tree in the study of Harada et al. [16], this study was able to construct a comparable prediction model without such measurements, using DBH growth, site index class, and bucking position. Although not strongly evident, a negative relationship between DBH growth and was observed, as shown in Figure 7c (p < 0.01). Furthermore, the top GLMM model indicated a significant negative relationship between DBH growth and , with a partial regression coefficient of −0.360. This suggests, consistent with previous studies [16,17], that there is a negative correlation between DBH growth and . However, the low coefficient of determination (0.04) of the GLMM only using fixed effects indicated that it is difficult to develop a log prediction model based solely on DBH growth. The site index class, which was one of the factors that significantly improved the coefficient of determination of GLMM when included as a random effect, showed a consistent trend with Figure 7c, namely a negative effect on the of logs for Class A (high-productivity sites) and a positive effect for Class B (low-productivity sites). This suggests that site index class within a single location negatively correlates with the of the harvested logs. In addition, bucking position, another factor, improved the coefficient of determination of GLMM, indicating a trend of higher at the upper bucking position and lower at the bottom position.
Based on these results, if the site conditions, DBH and tree age, are known, the of the logs can be predicted with an accuracy of 0.651 at the standing tree stage. This enables the sorting of logs at the standing tree stage; those with high can be directed to structural lumber that requires high stiffness, whereas those with low can be allocated to biomass or other facilities where the of the logs is not a critical factor. The results of this study indicate the potential to predict the of bottom and upper logs at the standing tree stage. This suggests that harvested logs can be sorted based on their predicted . Such sorting is expected to improve the efficiency of log distribution. However, to implement this system in practice, it is essential to quantitatively demonstrate the economic benefits that log producers can gain from this sorting process. However, because DBH and tree age estimation require field surveys, forecasting log incurs considerable costs. Therefore, it is optimal to develop alternative tree-based indices or for log-prediction models derived from LiDAR data, which would eliminate the need for on-site field surveys. Tree height can be estimated by calculating the difference between the digital surface model (DSM) and DEM [44]. Recent studies have demonstrated the potential of LiDAR in forest assessment: Ahmed et al. [45] showed that the mean annual ring width in conifers can be estimated from crown characteristics obtained via UAV-LiDAR, and Irwin et al. [46] quantified tree competition using LiDAR-derived data. In the future, these LiDAR-based indices may facilitate the identification of stands with a high without the need for field surveys.
The analysis in this study was conducted at a single site. Therefore, it is necessary to examine whether this prediction model can be applied to multiple sites. In such cases, variability is likely to differ between sites or production areas, potentially affecting the prediction accuracy. Therefore, it is important to investigate various factors that may contribute to this variation, such as tree species [31,40,47,48], climate conditions [22], genetic variation within species [49], planting density [40,50], and management practices [42,51]. For example, since the growth of Japanese cedar is known to vary depending on climate [22], future studies incorporating additional sites should include locations with climates different from that of the present study site in Kyoto. Understanding the influence of these factors on is essential for improving the robustness and generalizability of the prediction model.
Therefore, as a basis for future logging planning, LiDAR and other remote sensing methods can be used to identify areas likely to produce logs with high , although this approach has not yet been tested in this study and remains a subject for future research. The findings of this study also support selection decisions of buyers seeking high- logs by identifying trees within the same site that are expected to produce logs with high .
5. Conclusions
As a case study, this study attempted to identify standing trees that can produce logs with high in order to be able to select the optimal trees for harvesting based on values and to determine where to sell the trees. Analysis of the relationship between tree growth indices and site conditions showed that both DBH and height increased in areas with favorable moisture conditions within the same stand and under the same treatment. In other words, detailed site conditions indicate the potential productivity of individual trees. The GLMM results indicated that the model with the lowest AIC selected DBH growth as the explanatory variable, and a significant negative correlation was observed. The coefficient of determination for the fixed effect alone was low at 0.04, but it improved to 0.651 when site index and bucking position were included as random effects. These findings suggest that detailed site conditions, which are traditionally used to evaluate productivity, may also help predict before harvest. This study serves as an initial step in developing a prediction model for based on tree growth indices and site conditions. Although the study was limited to a single site with a small number of samples, the findings provide a foundation for future research involving multiple sites with different climate zones and planting densities.
Author Contributions
Investigation: K.H., Y.N., M.N. and K.N.; writing—original draft: K.H.; writing—review and editing: Y.N., M.N., K.K. and K.N.; funding acquisition: K.N. All authors have read and agreed to the published version of the manuscript.
Funding
This study was supported by JSPS KAKENHI (grant number 23K05470).
Data Availability Statement
The data underlying this article cannot be shared publicly because of the need to protect the privacy of individuals who participated in the study.
Acknowledgments
We thank Shigasato Moriei Co., Ltd. for their cooperation with the survey.
Conflicts of Interest
The authors declare no conflicts of interest.
References
- Lenz, P.; Bernier-Cardou, M.; MacKay, J.; Beaulieu, J. Can wood properties be predicted from the morphological traits of a tree? A canonical correlation study of plantation-grown white spruce. Can. J. For. Res. 2012, 42, 1518–1529. [Google Scholar] [CrossRef]
- Aoki, K. Current State and Future Tasks of Timber and Wood-Based Materials for Engineered Wood Products. J. Jpn. Wood Res. Soc. 2015, 61, 169–173. [Google Scholar] [CrossRef][Green Version]
- Ministry of Agriculture, Forestry and Fisheries of Japan (MAFF). Japanese Agricultural Standards; Ministry of Agriculture, Forestry and Fisheries: Tokyo, Japan, 2012. Available online: https://www.maff.go.jp/j/jas/jas_kikaku/pdf/kikaku_55.pdf (accessed on 24 June 2025).
- Wagner, L.; Bader, T.K.; Auty, D.; Grabner, M.; Evans, R. Key Parameters Controlling Stiffness Variability within Trees: A Multiscale Experimental–Numerical Approach. Trees 2013, 27, 321–336. [Google Scholar] [CrossRef]
- Kishi, K.; Kojiro, K.; Akashi, H.; Adachi, W.; Fuchigami, Y.; Furuta, Y. Development of a simple strength grade prediction method for lumber products at the log stage: Verification of the effectiveness of prediction method and log measurement cost when manufacturing lamina from logs produced in Kyoto Prefecture. J. Wood Sci. 2022, 68, 124–131. [Google Scholar] [CrossRef]
- Hassegawa, M.; Savard, M.; Lenz, P.R.N.; Duchateau, E.; Gélinas, N.; Bousquet, J.; Achim, A. White spruce wood quality for lumber products: Priority traits and their enhancement through tree improvement. Forestry 2020, 93, 16–37. [Google Scholar] [CrossRef]
- Sasaki, H.; Sumiya, K.; Takino, S.P. Mechanical Properties of Thirty-six Varieties of Cryptomeria. Mokuzai Kenkyu Shiryo 1983, 17, 192–205. [Google Scholar]
- Ikeda, K.; Arima, K. Quality evaluation of standing trees by a stress-wave propagation method and its application II: Evaluation of Sugi stands and application to production of Sugi (Cryptomeria japonica D. Don) structural square sawn timber. J. Wood Sci. 2000, 46, 189–196. [Google Scholar]
- Moore, J.R.; Lyon, A.J.; Searles, G.J.; Vihermaa, L.E. The effects of site and stand factors on the tree and wood quality of sitka spruce growing in the United Kingdom. Silva Fenn. 2009, 43, 195. [Google Scholar] [CrossRef]
- Butler, M.A.; Dahlen, J.; Eberhardt, T.L.; Clark, A.; Anthony, R.W.; Daniels, R.F. Acoustic evaluation of Loblolly pine tree- and lumber-length logs allows for segregation of lumber modulus of elasticity, not for modulus of rupture. Ann. For. Sci. 2017, 74, 20. [Google Scholar] [CrossRef]
- Schimleck, L.; Dahlen, J.; Apiolaza, L.A.; Downes, G.; Emms, G.; Evans, R.; Moore, J.; Pâques, L.; Van den Bulcke, J.; Wang, X. Non-destructive evaluation techniques and what they tell us about wood property variation. Forests 2019, 10, 728. [Google Scholar] [CrossRef]
- Wessels, C.B.; Malan, F.S.; Rypstra, T. A review of measurement methods used on standing trees for the prediction of some mechanical properties of timber. Eur. J. For. Res. 2011, 130, 881–893. [Google Scholar] [CrossRef]
- Bucur, V. A review on acoustics of wood as a tool for quality assessment. Forests 2023, 14, 1545. [Google Scholar] [CrossRef]
- Auty, D.; Achim, A.; Macdonald, E.; Cameron, A.D.; Gardiner, B.A. Models for predicting clearwood mechanical properties of Scots pine. For. Sci. 2016, 62, 403–413. [Google Scholar] [CrossRef]
- Viguier, J.; Jehl, A.; Collet, R.; Bleron, L.; Meriaudeau, F. Improving Strength Grading of Timber by Grain Angle Measurement and Mechanical Modeling. Wood Mater. Sci. Eng. 2014, 10, 145–156. [Google Scholar] [CrossRef]
- Harada, K.; Nakata, Y.; Nakazawa, M.; Kojiro, K.; Nagashima, K. Empirical relationships of the characteristics of standing trees with the dynamic modulus of elasticity of Japanese Cedar (Cryptomeria japonica) logs: Case study in the Kyoto Prefecture. Forests 2025, 16, 244. [Google Scholar] [CrossRef]
- Teraoka, Y.; Takata, K.; Koga, S. Use of trunk-MOE of Japanese Cedar as forestry management information. J. For. Plan. 2001, 35, 21–29. [Google Scholar] [CrossRef]
- Tsushima, S.; Koga, S.; Oda, K.; Shiraishi, S. Effects of initial spacing on growth and wood properties of Sugi (Cryptomeria japonica) cutting cultivars. J. Wood Sci. 2006, 52, 196–205. [Google Scholar] [CrossRef]
- Burawska-Kupniewska, I.; Mańkowski, P.; Krzosek, S. Mechanical properties of machine stress graded sawn timber depending on the log type. Forests 2021, 12, 532. [Google Scholar] [CrossRef]
- Kijidani, Y.; Kitahara, R. Vertical variation in wood properties of the Obi-Sugi (Cryptomeria japonica) cultivar. J. Wood Sci. 2009, 55, 198–206. [Google Scholar] [CrossRef][Green Version]
- Krenn, T.; Berthold, D.; Ritter, N.; Kietz, B. Effects of growth and treatment conditions on the quality of Norway Spruce (Picea abies L.) sawn timber. Forests 2024, 15, 1588. [Google Scholar] [CrossRef]
- Nakao, K.; Kabeya, D.; Awaya, Y.; Yamasaki, S.; Tsuyama, I.; Yamagawa, H.; Miyamoto, K.; Araki, M.G. Assessing the regional-scale distribution of height growth of Cryptomeria japonica stands using airborne LiDAR, forest GIS database and machine learning. For. Ecol. Manag. 2022, 506, 119953. [Google Scholar] [CrossRef]
- Teraoka, Y.; Masutani, T.; Imada, M. Site index estimation method for forest management: Estimating tree height using topographic factors readable from topographic maps. J. Fac. Agric. Kyushu Univ. 1991, 45, 125–133. [Google Scholar] [CrossRef]
- Bolker, B.M.; Brooks, M.E.; Clark, C.J.; Geange, S.W.; Poulsen, J.R.; Stevens, M.H.H.; White, J.S.S. Generalized linear mixed models: A practical guide for ecology and evolution. Trends Ecol. Evol. 2009, 24, 127–135. [Google Scholar] [CrossRef] [PubMed]
- Japan Meteorological Agency. Transport and Tourism. Annual Climate Data for Kyoto Prefecture for the Year 2023. Available online: https://www.data.jma.go.jp/obd/stats/etrn/view/annually_s.php?prec_no=61&block_no=47759&year=2023&month=&day=&view= (accessed on 18 June 2025).
- Forestry Agency. Annual Report on Forest and Forestry in Japan, Fiscal Year 2023 (R5); Forestry Agency, Ministry of Agriculture, Forestry and Fisheries: Tokyo, Japan, 2024. Available online: https://www.rinya.maff.go.jp/j/kikaku/hakusyo/r5hakusyo/attach/pdf/zenbun-8.pdf (accessed on 18 June 2025).
- Ministry of Agriculture, Forestry and Fisheries. Lumber Statistics Survey, 2023 (R5); e-Stat, Government of Japan: Tokyo, Japan, 2024. Available online: https://www.e-stat.go.jp/stat-search/files?page=1&layout=datalist&toukei=00500217&tstat=000001014476&cycle=7&year=20230&month=0&tclass1=000001014477&tclass2=000001215720 (accessed on 18 June 2025).
- Koizumi, A. Variation in Modulus of Elasticity in Coniferous Plantation Timber. Mokuzai Kogyo 1998, 53, 206–211. [Google Scholar]
- Wang, X. Acoustic measurements on trees and logs: A review and analysis. Wood Sci. Technol. 2013, 47, 965–975. [Google Scholar] [CrossRef]
- Gallego, A.; Ripoll, M.A.; Timbolmas, C.; Rescalvo, F.; Suarez, E.; Valverde, I.; Rodríguez, M.; Navarro, F.B.; Merlo, E. Modulus of elasticity of I-214 young poplar wood from standing trees to sawn timber: Influence of the age and stand density. Eur. J. Wood Prod. 2021, 79, 1225–1239. [Google Scholar] [CrossRef]
- Šilinskas, B.; Varnagirytė-Kabašinskienė, I.; Aleinikovas, M.; Beniušienė, L.; Aleinikovienė, J.; Škėma, M. Scots Pine and Norway Spruce wood properties at sites with different stand densities. Forests 2020, 11, 587. [Google Scholar] [CrossRef]
- Esri. Curvature Function—ArcGIS Pro Documentation. Available online: https://pro.arcgis.com/en/pro-app/latest/help/analysis/raster-functions/curvature-function.htm (accessed on 1 July 2025).
- Nagashima, K. Forest management based on site suitability: A case study of Odai Town, Mie Prefecture. In Landscape Ecology for Sustainable Society; Hong, S.K., Nakagoshi, N., Eds.; Springer: Tokyo, Japan, 2017; pp. 181–196. [Google Scholar]
- Bauer, D.F. Constructing confidence sets using rank statistics. J. Am. Stat. Assoc. 1972, 67, 687–690. [Google Scholar] [CrossRef]
- Hollander, M.; Wolfe, D.A.; Chicken, E. Nonparametric Statistical Methods, 3rd ed.; Wiley Series in Probability and Statistics; Wiley: Hoboken, NJ, USA, 2015. [Google Scholar] [CrossRef]
- Steel, R.G.D. Some rank sum multiple comparison tests. Biometrics 1961, 17, 539–552. [Google Scholar] [CrossRef]
- Akaike, H. A New Look at the Statistical Model Identification. In Selected Papers of Hirotugu Akaike; Parzen, E., Tanabe, K., Kitagawa, G., Eds.; Springer Series in Statistics; Springer: New York, NY, USA, 1974. [Google Scholar] [CrossRef]
- Bates, D.; Mächler, M.; Bolker, B.; Walker, S. Fitting linear mixed-effects models using lme4. J. Stat. Softw. 2015, 67, 1–48. [Google Scholar] [CrossRef]
- Burnham, K.P.; Anderson, D.R. Model Selection and Multimodel Inference: A Practical Information-Theoretic Approach, 2nd ed.; Springer: New York, NY, USA, 2002. [Google Scholar]
- Ishiguri, F.; Kasai, S.; Yokota, S.; Iizuka, K.; Yoshizawa, N. Wood quality of Sugi (Cryptomeria japonica) grown at four initial spacings. IAWA J. 2005, 26, 375–386. [Google Scholar] [CrossRef]
- Sharma, R.P.; Štefančík, I.; Vacek, Z.; Vacek, S. Generalized nonlinear mixed-effects individual tree diameter increment models for beech forests in Slovakia. Forests 2019, 10, 451. [Google Scholar] [CrossRef]
- Zobel, B.J.; Buijtenen, J.P. Wood Variation: Its Causes and Control; Springer Series in Wood Science; Springer: Berlin, Germany, 1989. [Google Scholar]
- Kollmann, F.F.P.; Côté, W.A., Jr. Principles of Wood Science and Technology: I Solid Wood, 1st ed.; Springer: Berlin, Germany, 1968. [Google Scholar]
- Jensen, J.R. Remote Sensing of the Environment: An Earth Resource Perspective, 2nd ed.; Pearson Prentice Hall: Upper Saddle River, NJ, USA, 2007. [Google Scholar]
- Ahmed, S.; Hilmers, T.; Uhl, E.; Tupinambá-Simões, F.; Bravo, F.; del Río, M.; Pretzsch, H. Crown structure indicates tree secondary growth, competition legacy, and growth potential of dominant species in Europe. Ecol. Indic. 2025, 170, 113074. [Google Scholar] [CrossRef]
- Irwin, L.A.K.; Coops, N.C.; Riofrío, J.; Grubinger, S.G.; Barbeito, I.; Achim, A.; Roeser, D. Prioritizing Commercial thinning: Quantification of growth and competition with high-density drone laser scanning. Forestry 2025, 98, 293–307. [Google Scholar] [CrossRef]
- Cardona, L.; Couillard, P.-L.; Achim, A. Lower wood stiffness in old-growth than in post-cut and post-fire stands indicates forest structure is a key driver of wood properties in Black Spruce. Can. J. For. Res. 2024, 54, 749–761. [Google Scholar] [CrossRef]
- Moore, J.; Achim, A.; Lyon, A.; Mochan, S.; Gardiner, B. Effects of early re-spacing on the physical and mechanical properties of Sitka Spruce structural timber. Forest Ecol. Manag. 2009, 258, 1174–1180. [Google Scholar] [CrossRef]
- Fukatsu, E. Past, present and future of forest tree breeding in Japan: (2) Japanese Cedar—2. Inheritance and acquisition of growth-related traits. J. Jpn. Soc. For. Genet. Tree Breed. 2023, 12, 4. [Google Scholar] [CrossRef]
- Fukuchi, S.; Yoshida, S.; Mizoue, N.; Murakami, T.; Kajisa, T.; Ota, T.; Nagashima, K. Analysis of the planting density toward low-cost forestry: A result from the experimental plots of Obi-Sugi planting density. J. Jpn. For. Soc. 2011, 93, 303–308. [Google Scholar] [CrossRef]
- Barrette, J.; Achim, A.; Auty, D. Impact of intensive forest management practices on wood quality from conifers: Literature review and reflection on future challenges. Curr. For. Rep. 2023, 9, 101–130. [Google Scholar] [CrossRef]
Disclaimer/Publisher’s Note: The statements, opinions and data contained in all publications are solely those of the individual author(s) and contributor(s) and not of MDPI and/or the editor(s). MDPI and/or the editor(s) disclaim responsibility for any injury to people or property resulting from any ideas, methods, instructions or products referred to in the content. |
© 2025 by the authors. Licensee MDPI, Basel, Switzerland. This article is an open access article distributed under the terms and conditions of the Creative Commons Attribution (CC BY) license (https://creativecommons.org/licenses/by/4.0/).