Author Contributions
Conceptualization, K.W.; data curation, K.W., M.P., and T.P.; formal analysis, K.W. and T.P.; funding acquisition, T.O. and K.W.; investigation, K.W. and M.P.; methodology, K.W. and M.P.; project administration, K.W.; resources, K.W., T.P., and M.P.; software, T.P.; supervision, T.O., T.P., and M.P.; validation, all authors; visualization, K.W., T.P., and M.P.; writing—original draft, K.W. and T.P.; writing—review and editing, all authors. All authors have read and agreed to the published version of the manuscript.
Figure 1.
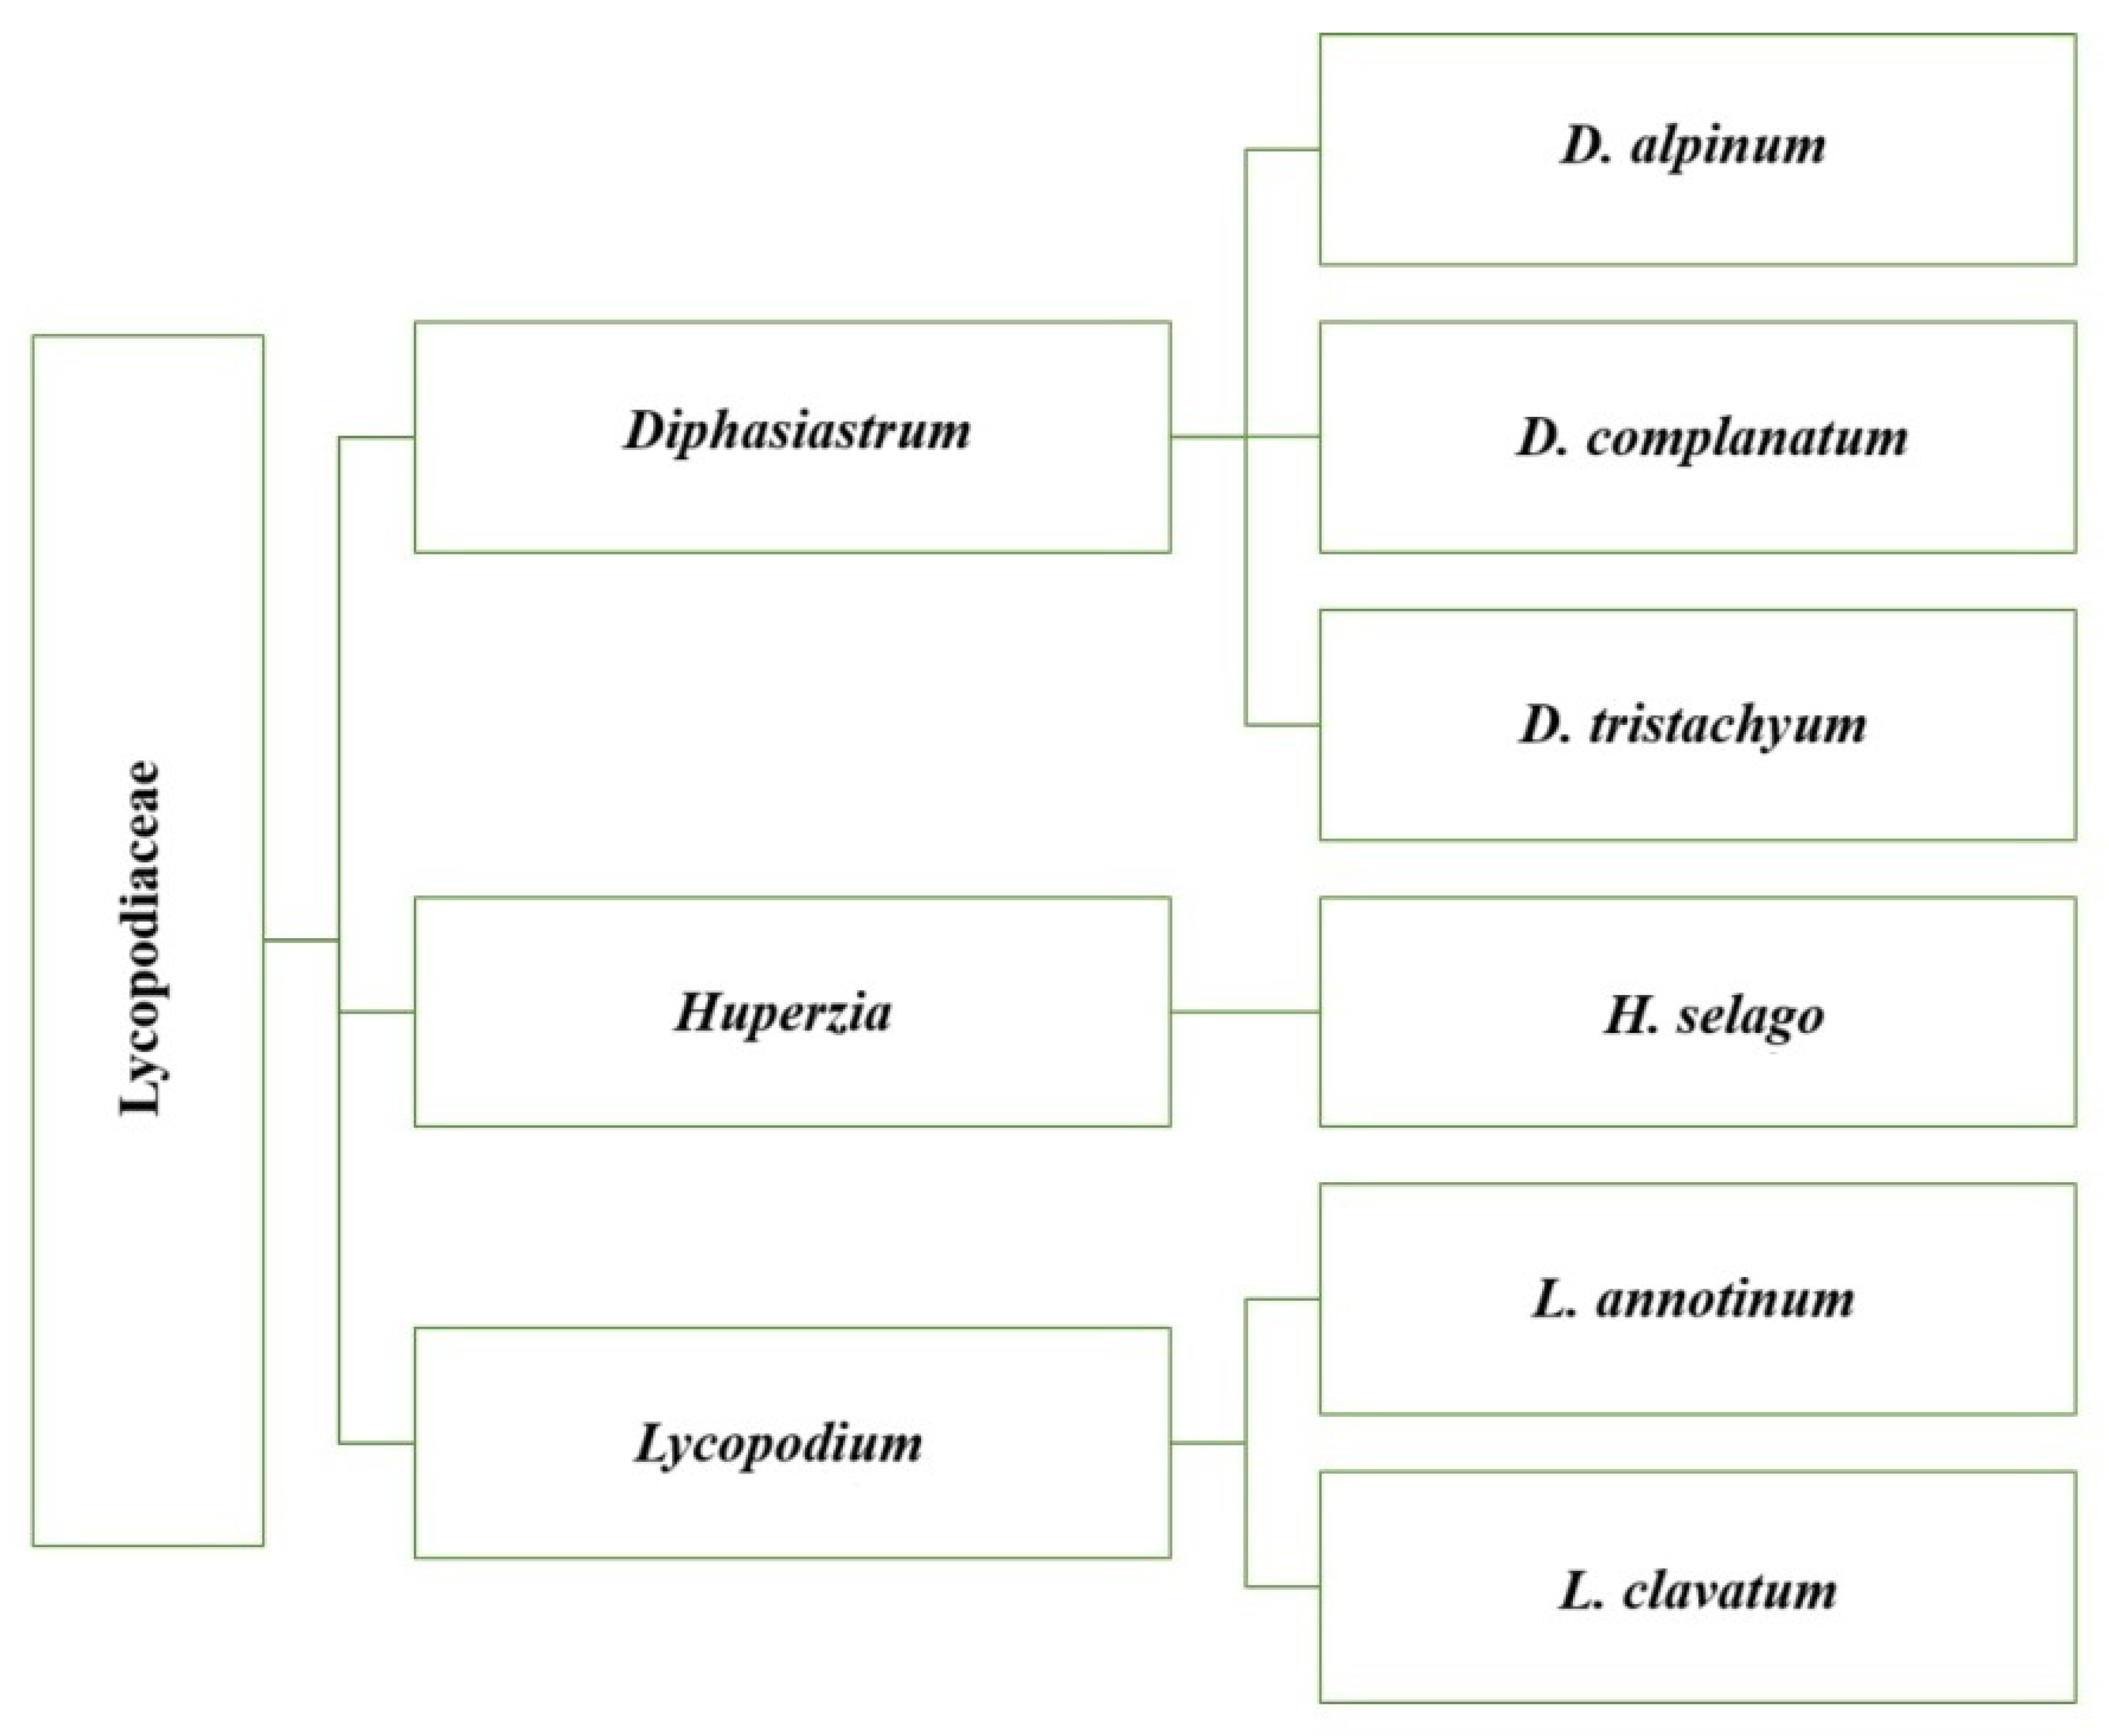
Schematic representation of the taxonomic tree of the family Lycopodiaceae, including the three main genera (Diphasiastrum, Huperzia, Lycopodium) and representative species.
Figure 1.
Schematic representation of the taxonomic tree of the family Lycopodiaceae, including the three main genera (Diphasiastrum, Huperzia, Lycopodium) and representative species.
Figure 2.
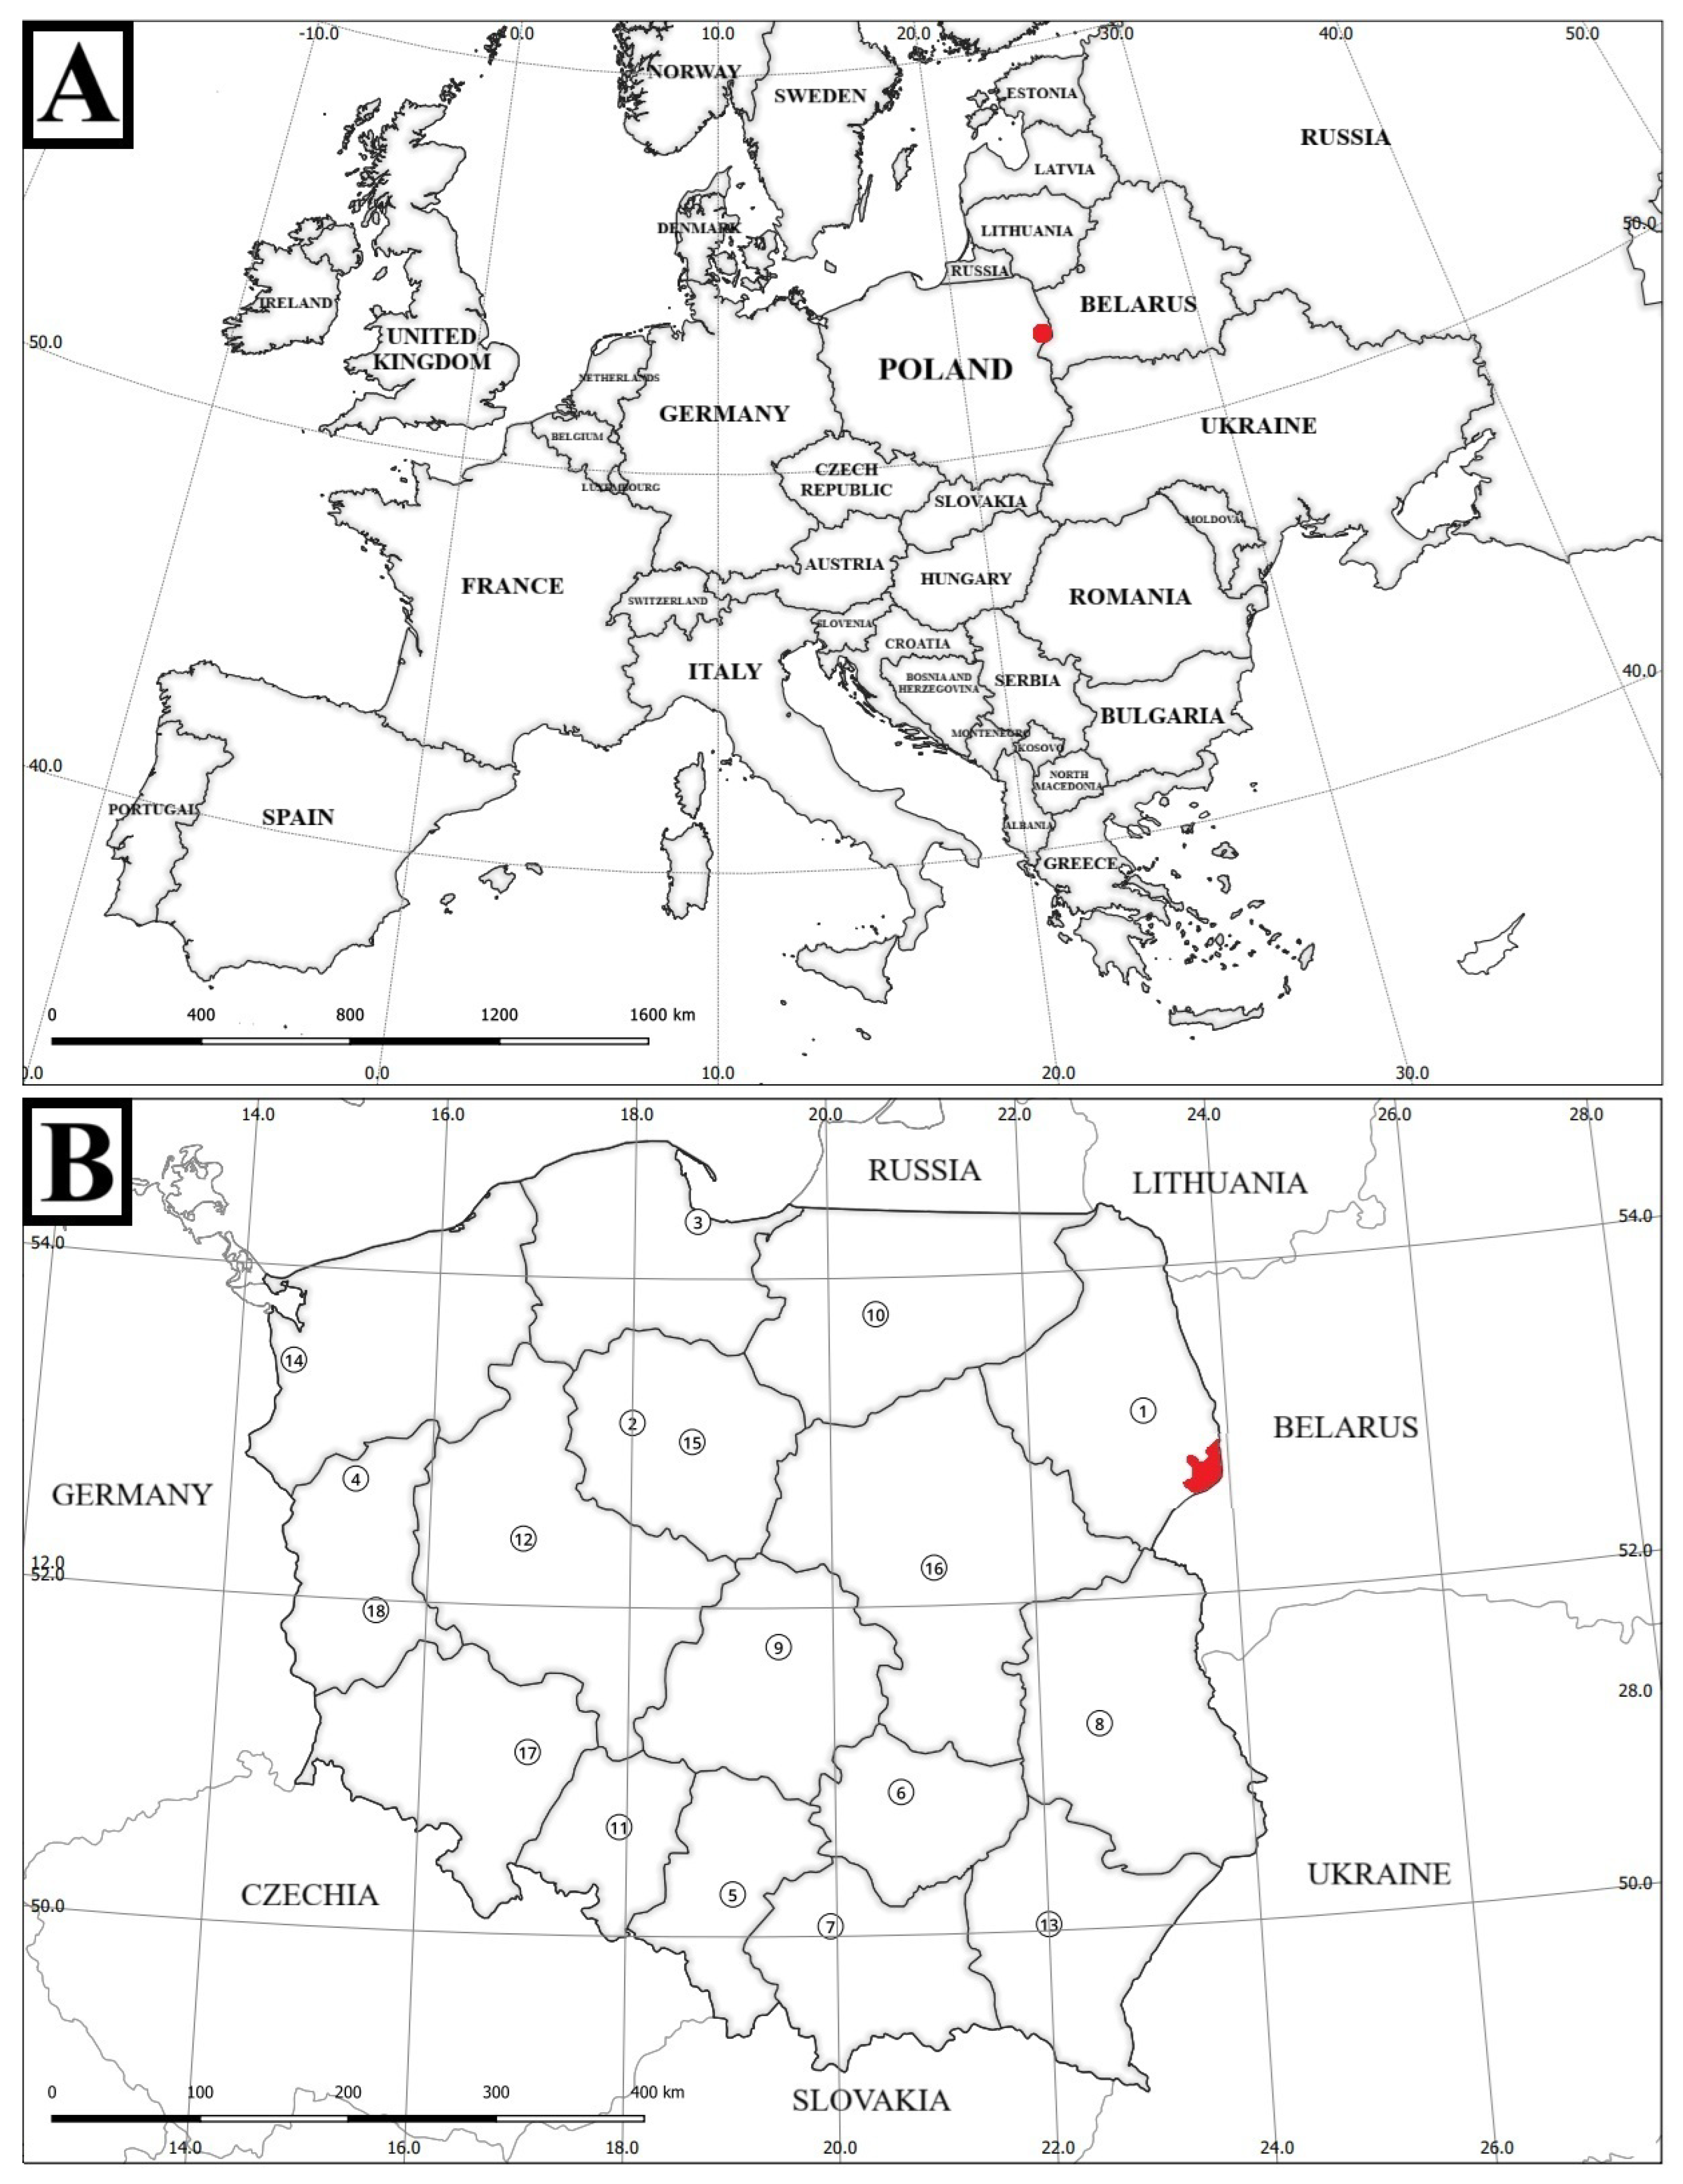
Geographical setting of the study area. (A) Position of the Białowieża Primeval Forest within Europe; (B) Extent of the Białowieża Primeval Forest (area shaded in red) within Poland; central coordinates: 52°43′ N, 23°52′ E. Numbered labels indicate voivodeship capitals (see list below). Map prepared by the authors; base map data © OpenStreetMap contributors (2025). Voivodeship capitals by number: 1—Białystok; 2—Bydgoszcz; 3—Gdańsk; 4—Gorzów Wielkopolski; 5—Katowice; 6—Kielce; 7—Kraków; 8—Lublin; 9—Łódź; 10—Olsztyn; 11—Opole; 12—Poznań; 13—Rzeszów; 14—Szczecin; 15—Toruń; 16—Warszawa; 17—Wrocław; 18—Zielona Góra.
Figure 3.
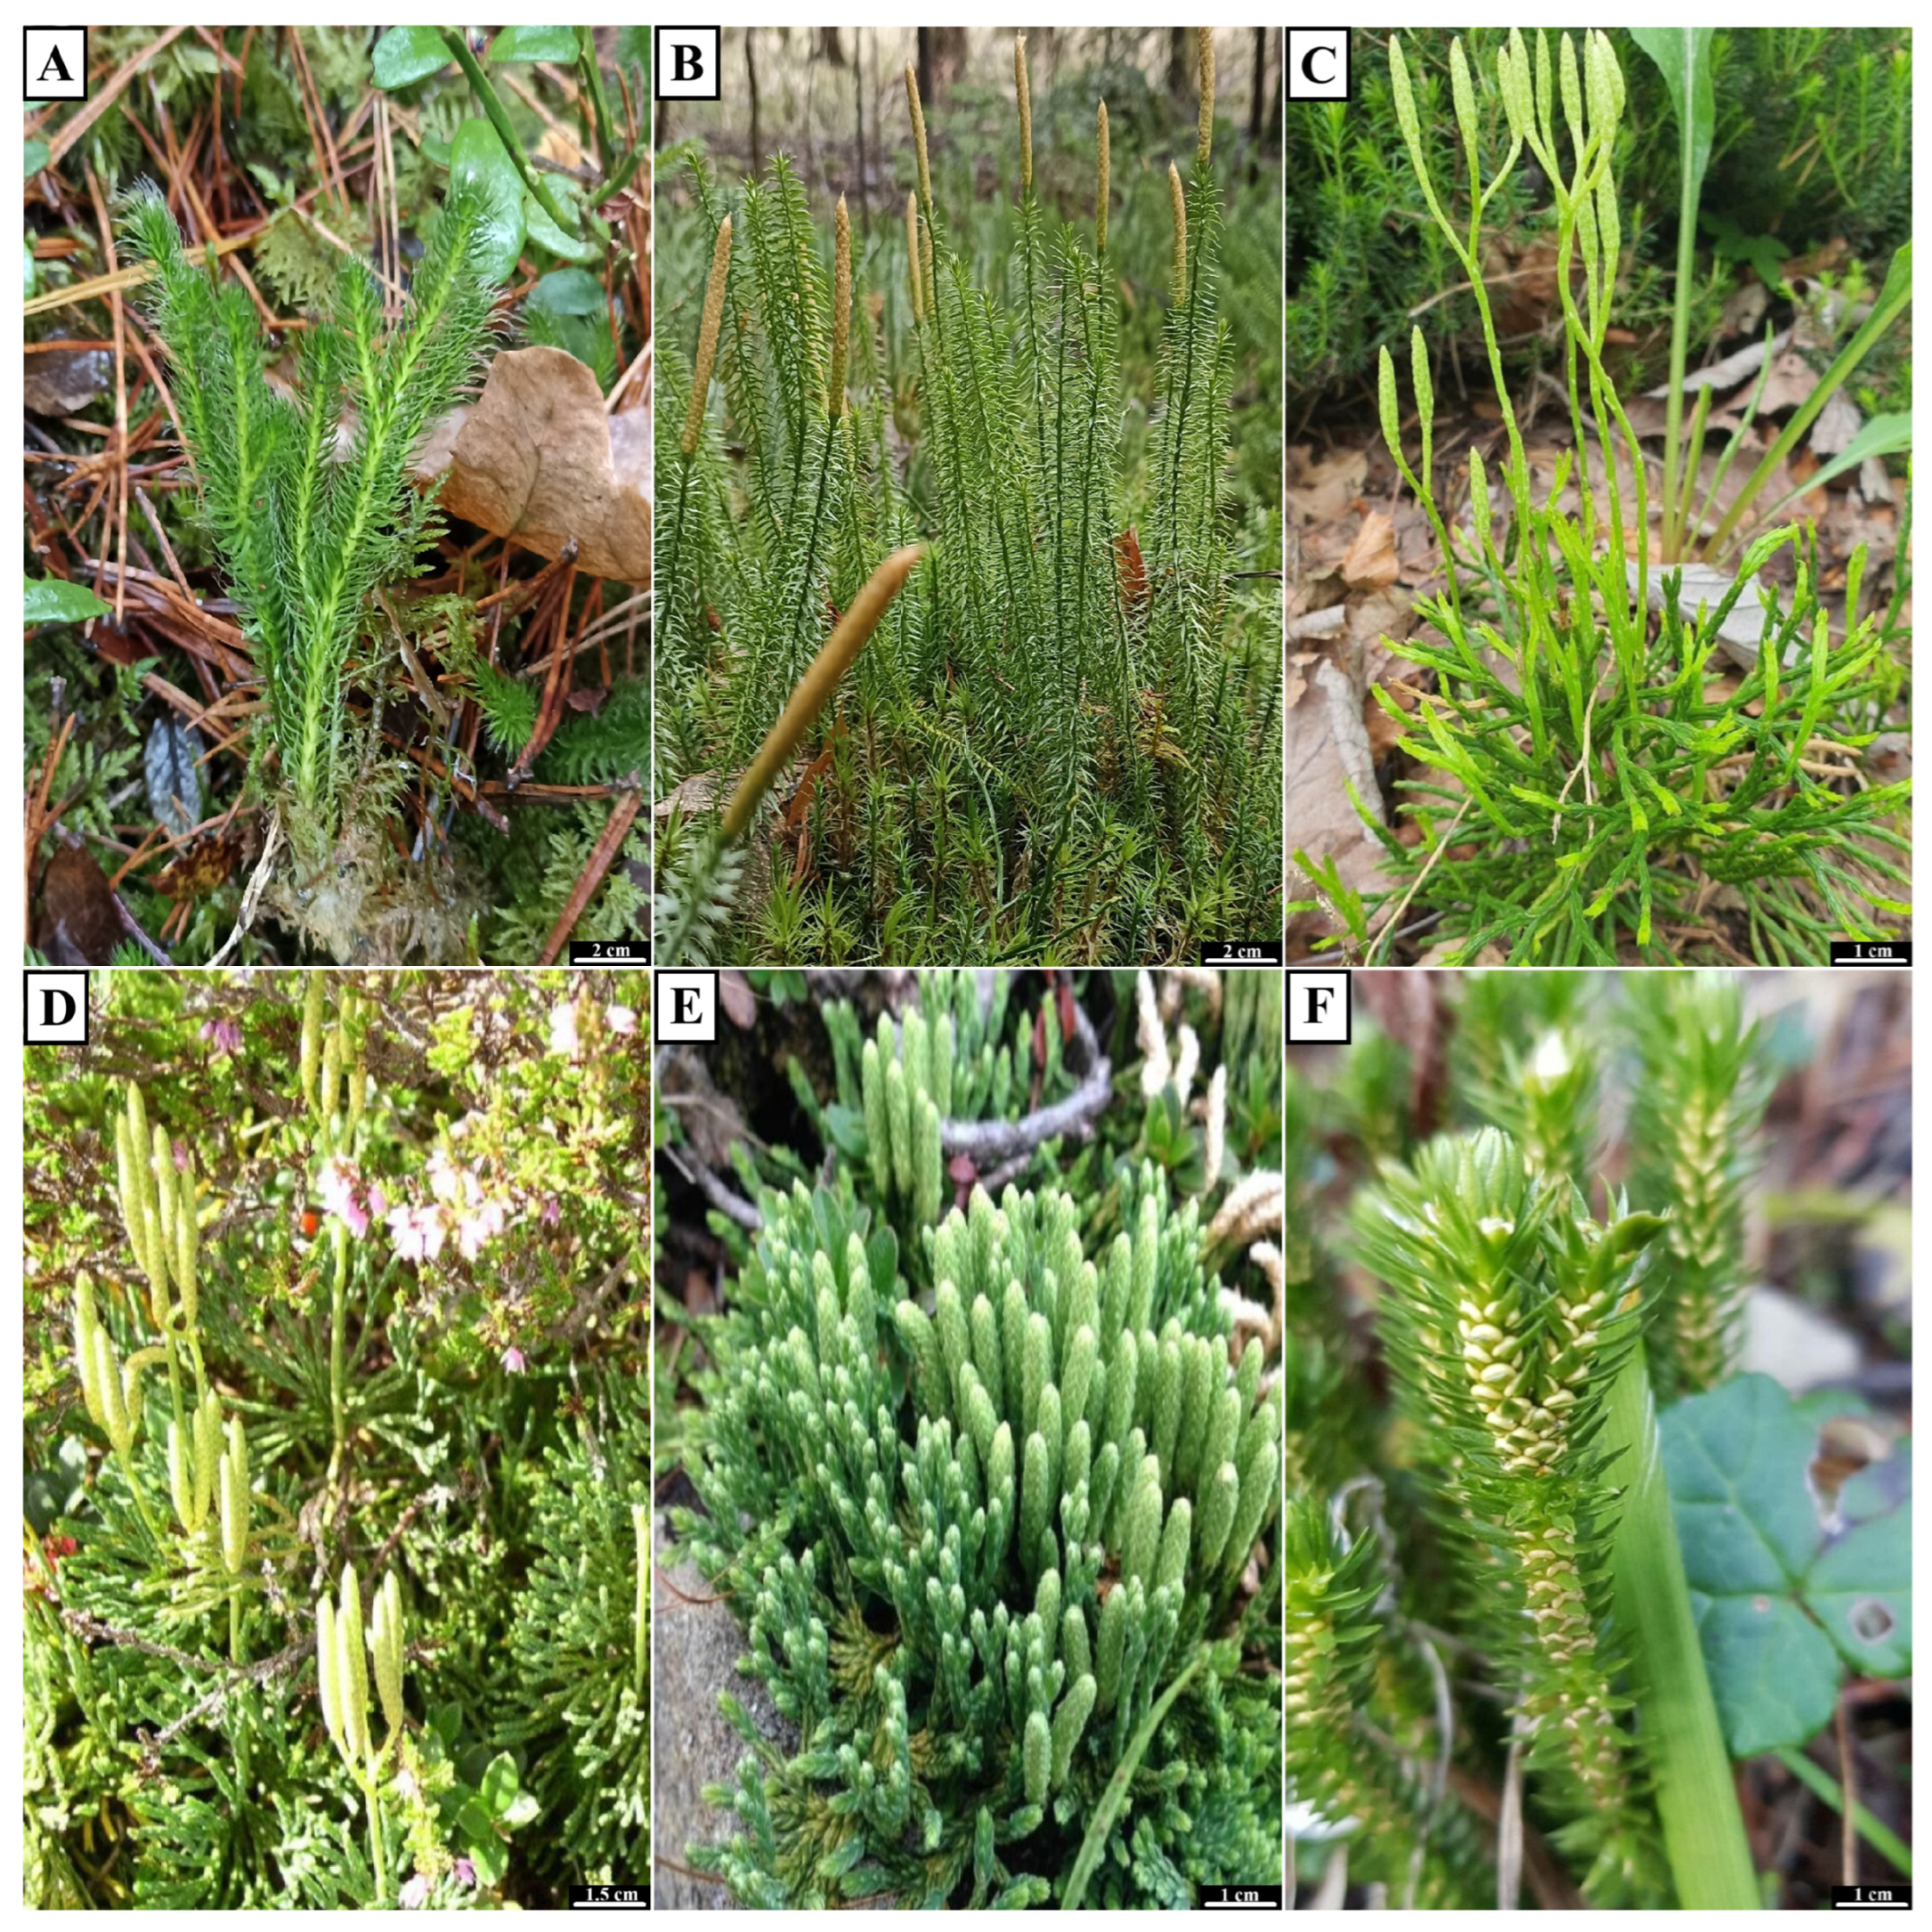
Representative habitats and field morphology of the six investigated Lycopodiaceae taxa in the Białowieża Primeval Forest. (A) Lycopodium clavatum; (B) Lycopodium annotinum; (C) Diphasiastrum complanatum; (D) Diphasiastrum tristachyum; (E) Diphasiastrum alpinum; (F) Huperzia selago.
Figure 3.
Representative habitats and field morphology of the six investigated Lycopodiaceae taxa in the Białowieża Primeval Forest. (A) Lycopodium clavatum; (B) Lycopodium annotinum; (C) Diphasiastrum complanatum; (D) Diphasiastrum tristachyum; (E) Diphasiastrum alpinum; (F) Huperzia selago.
Figure 4.
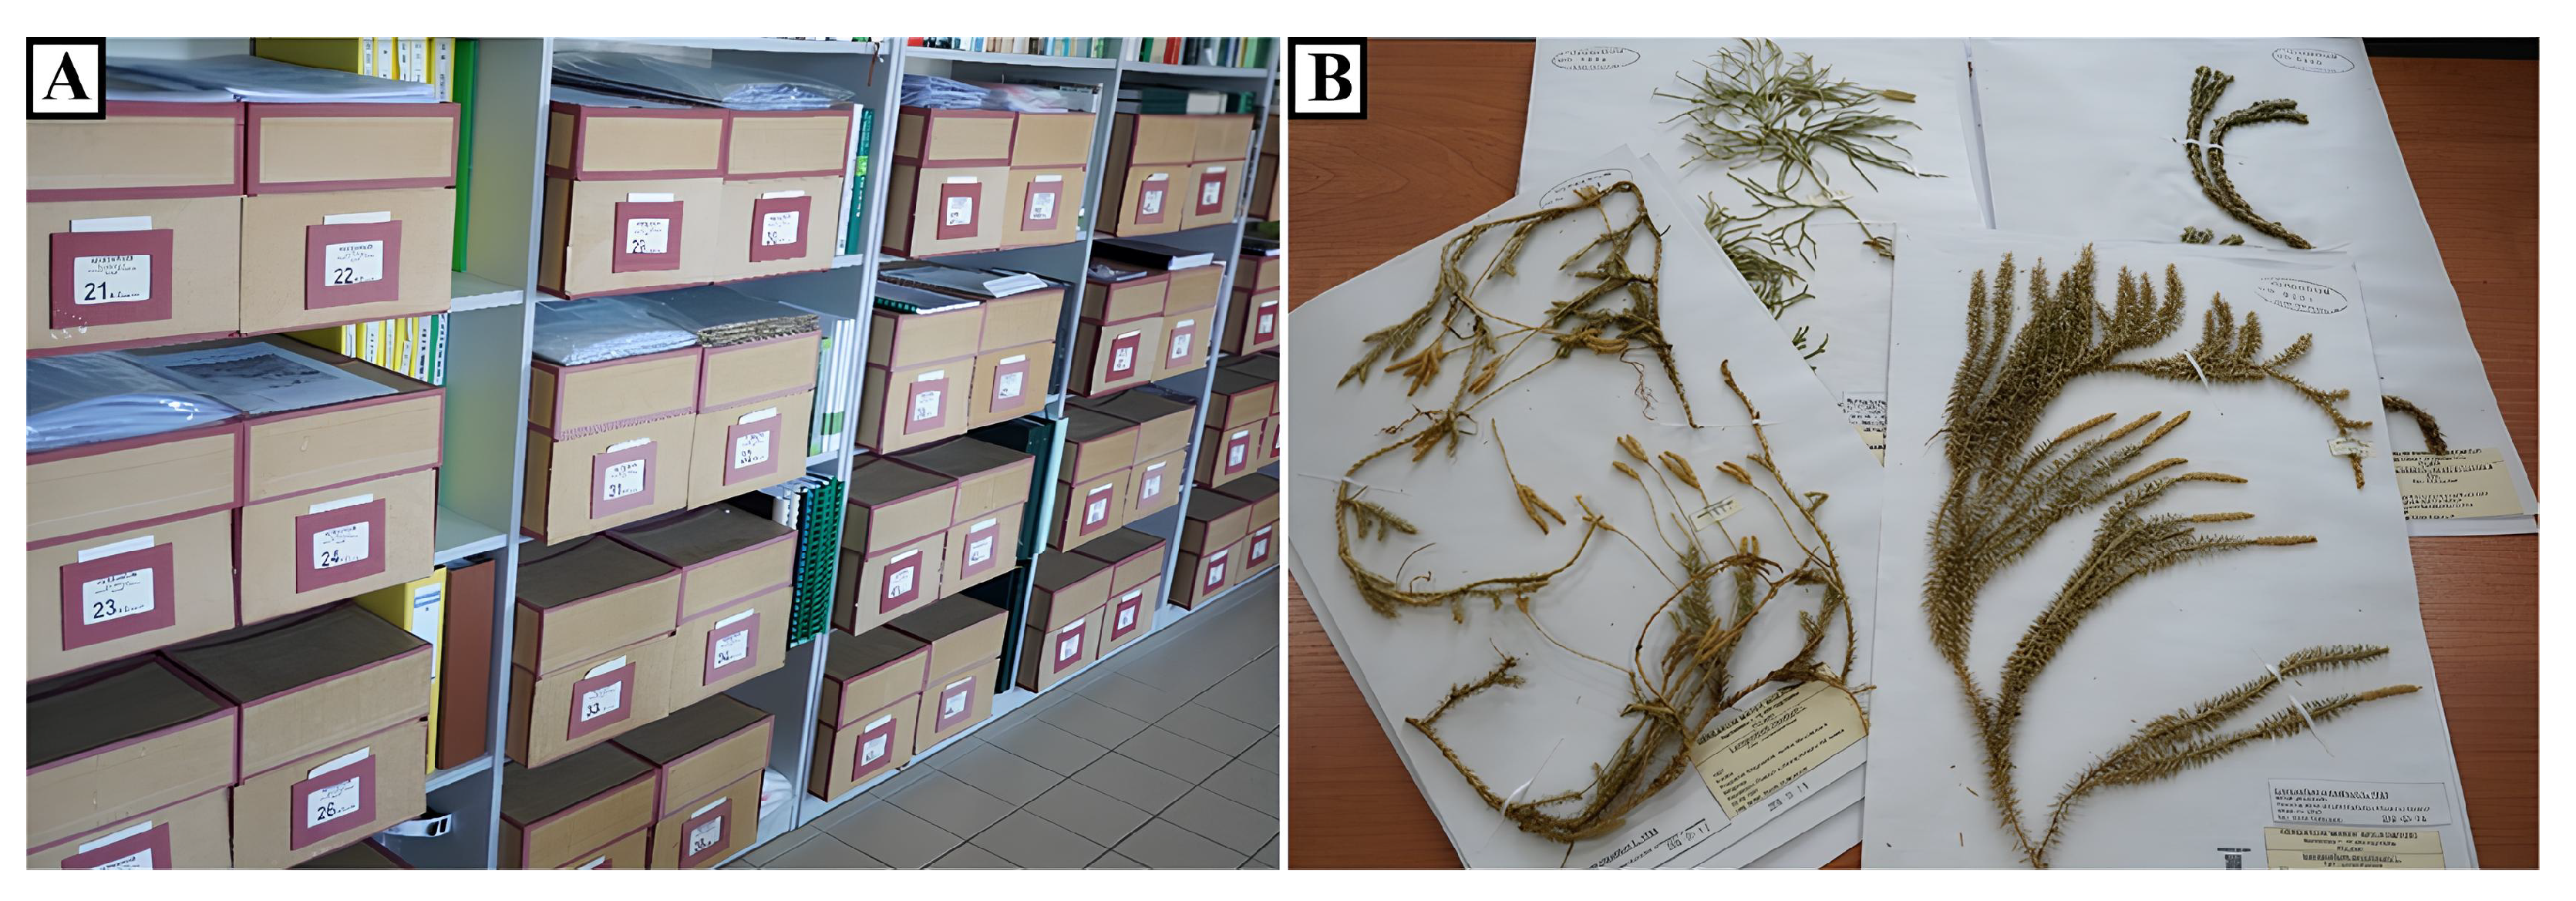
Herbarium resources housing the study vouchers. (A) Compactus cabinets holding the BLS collection at the Institute of Forest Sciences, Białystok University of Technology; (B) voucher sheets selected for spore isolation, each bearing full accession data and taxonomic determination.
Figure 4.
Herbarium resources housing the study vouchers. (A) Compactus cabinets holding the BLS collection at the Institute of Forest Sciences, Białystok University of Technology; (B) voucher sheets selected for spore isolation, each bearing full accession data and taxonomic determination.
Figure 5.
Sample preparation workflow for scanning electron microscopy (SEM). (A) Leica EM ACE200 low-vacuum sputter coater; (B) sample holder with mounted SEM stub prior to microscope insertion; (C) 12.7 mm aluminum stub bearing a carbon-adhesive disc; (D) batch of 10 stubs ready for simultaneous sputtering; (E) stubs positioned on the quartz crystal microbalance shelf for real-time film-thickness monitoring.
Figure 6.
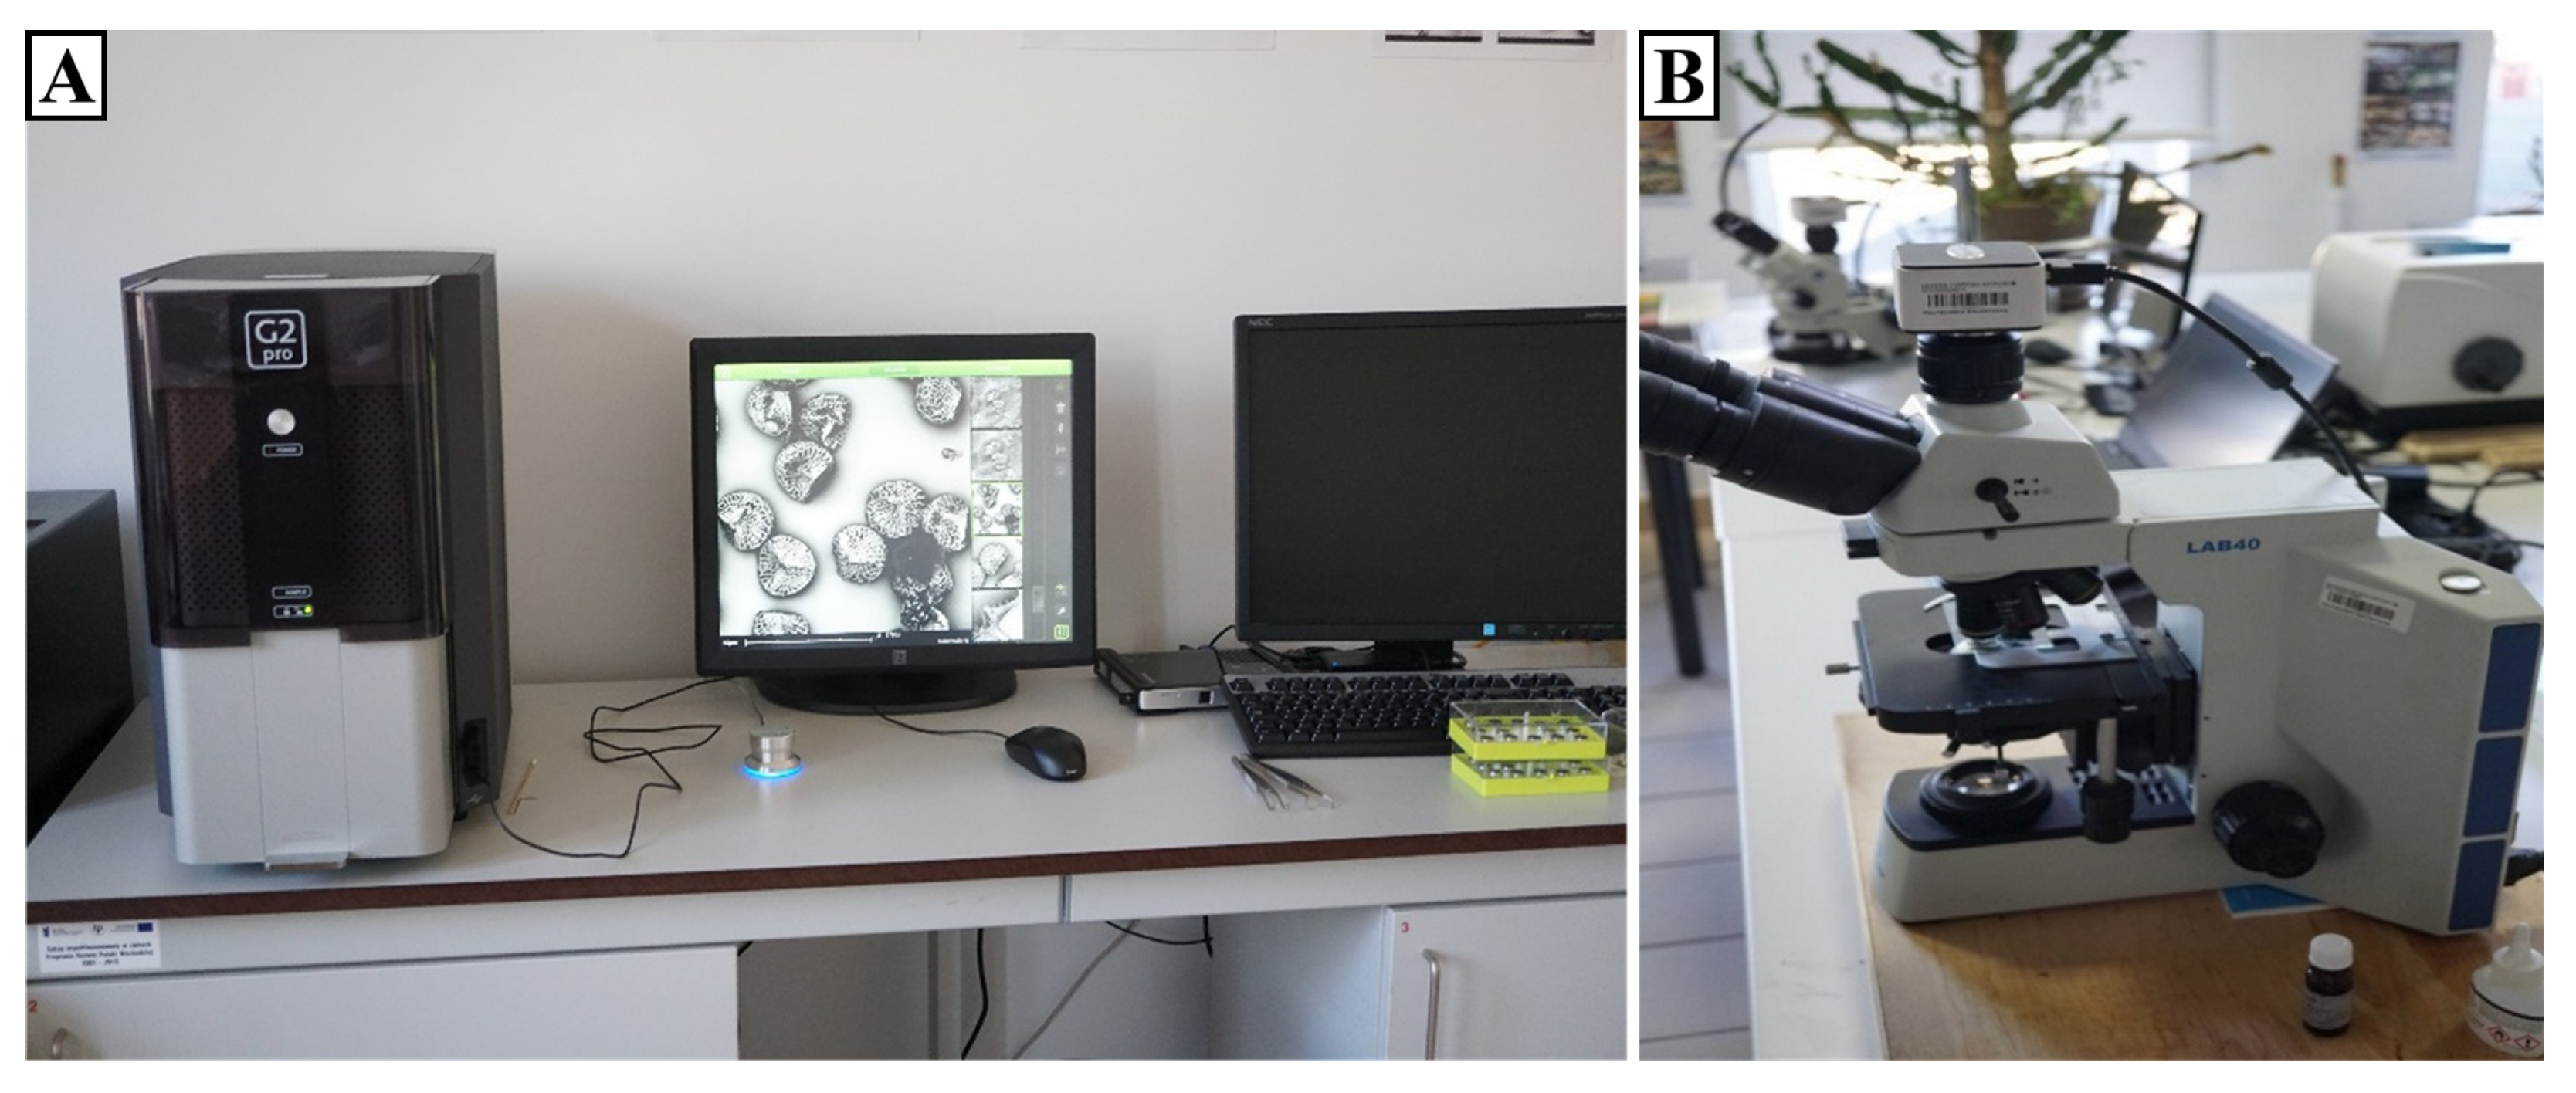
Principal microscopy instrumentation used for spore imaging. (A) Phenom G2 Pro desktop SEM providing 25 nm spatial resolution at magnification; (B) OptaTech LAB 40 transmitted-light microscope with an integrated 12 Mpx CMOS camera, supporting bright-field and DIC imaging up to .
Figure 6.
Principal microscopy instrumentation used for spore imaging. (A) Phenom G2 Pro desktop SEM providing 25 nm spatial resolution at magnification; (B) OptaTech LAB 40 transmitted-light microscope with an integrated 12 Mpx CMOS camera, supporting bright-field and DIC imaging up to .
Figure 7.
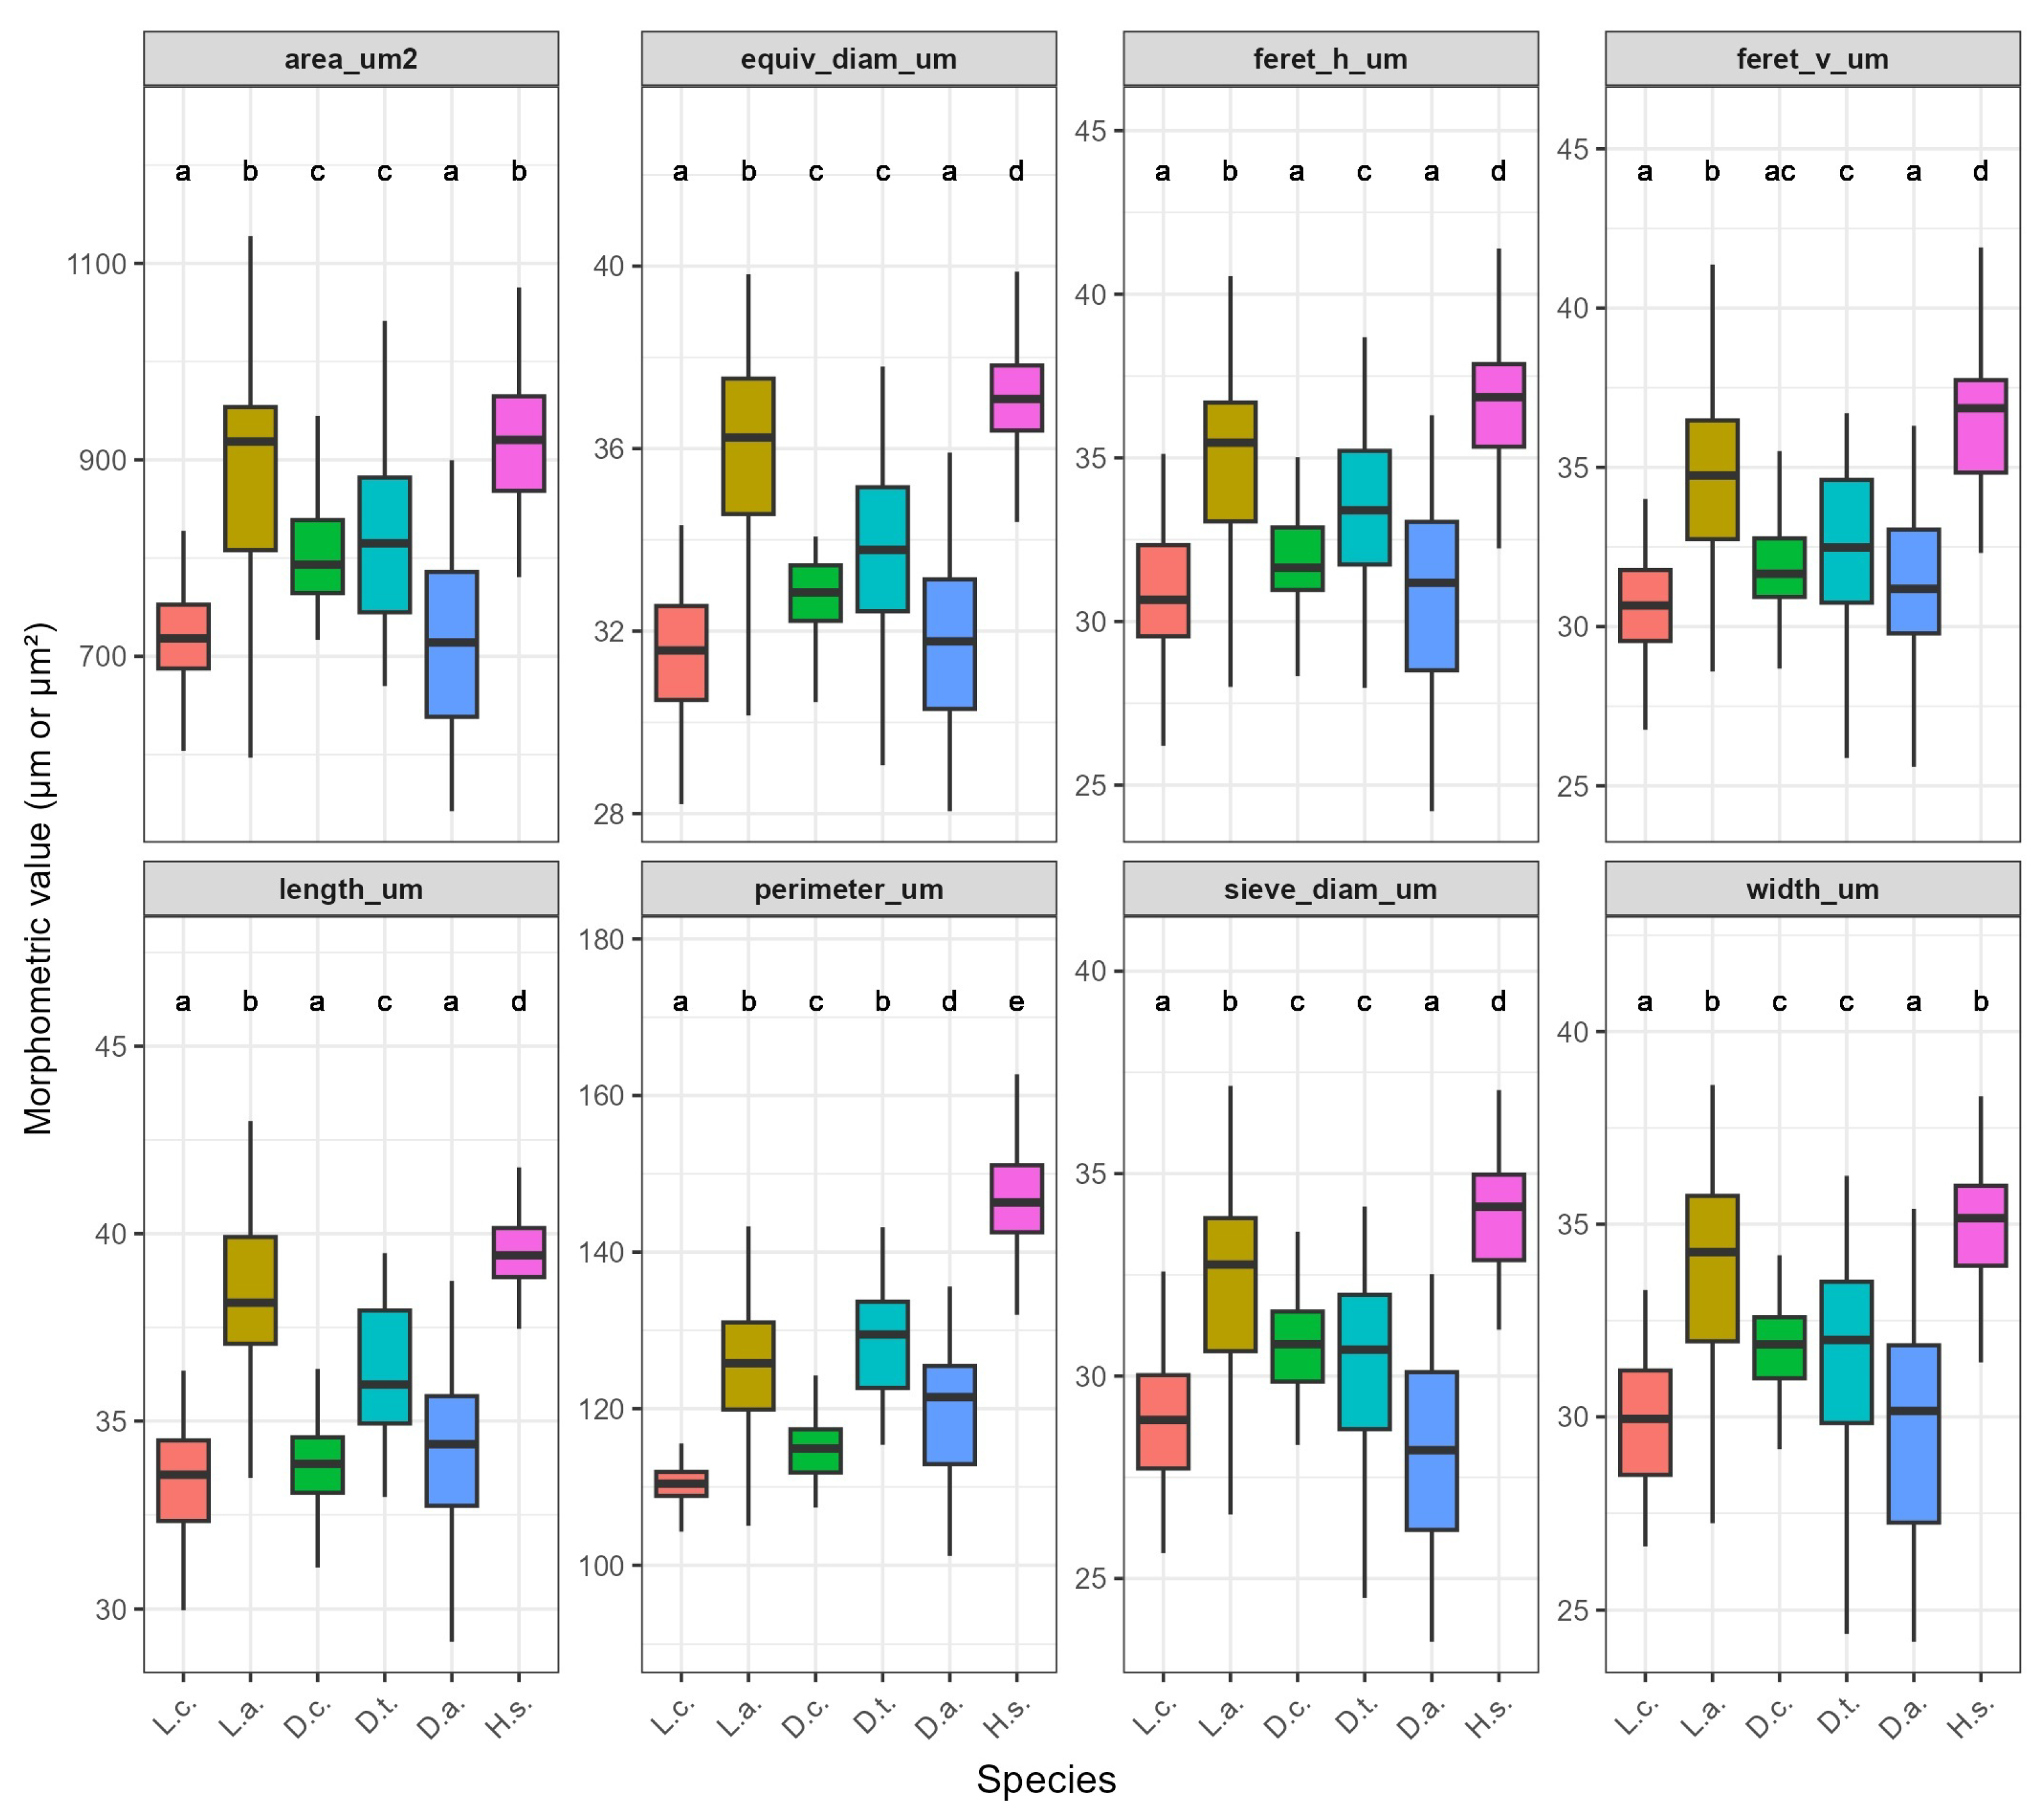
Multi-panel box plot of eight morphometric traits across six Lycopodiaceae taxa (labels: L.c., L.a., D.c., D.t., D.a., H.s.). Alphabetical letters above boxes indicate Tukey homogeneous groups (). Projected area, for instance, separates D.t. (group A) from L.c. and L.a. (group C), confirming significant interspecific divergence.
Figure 8.
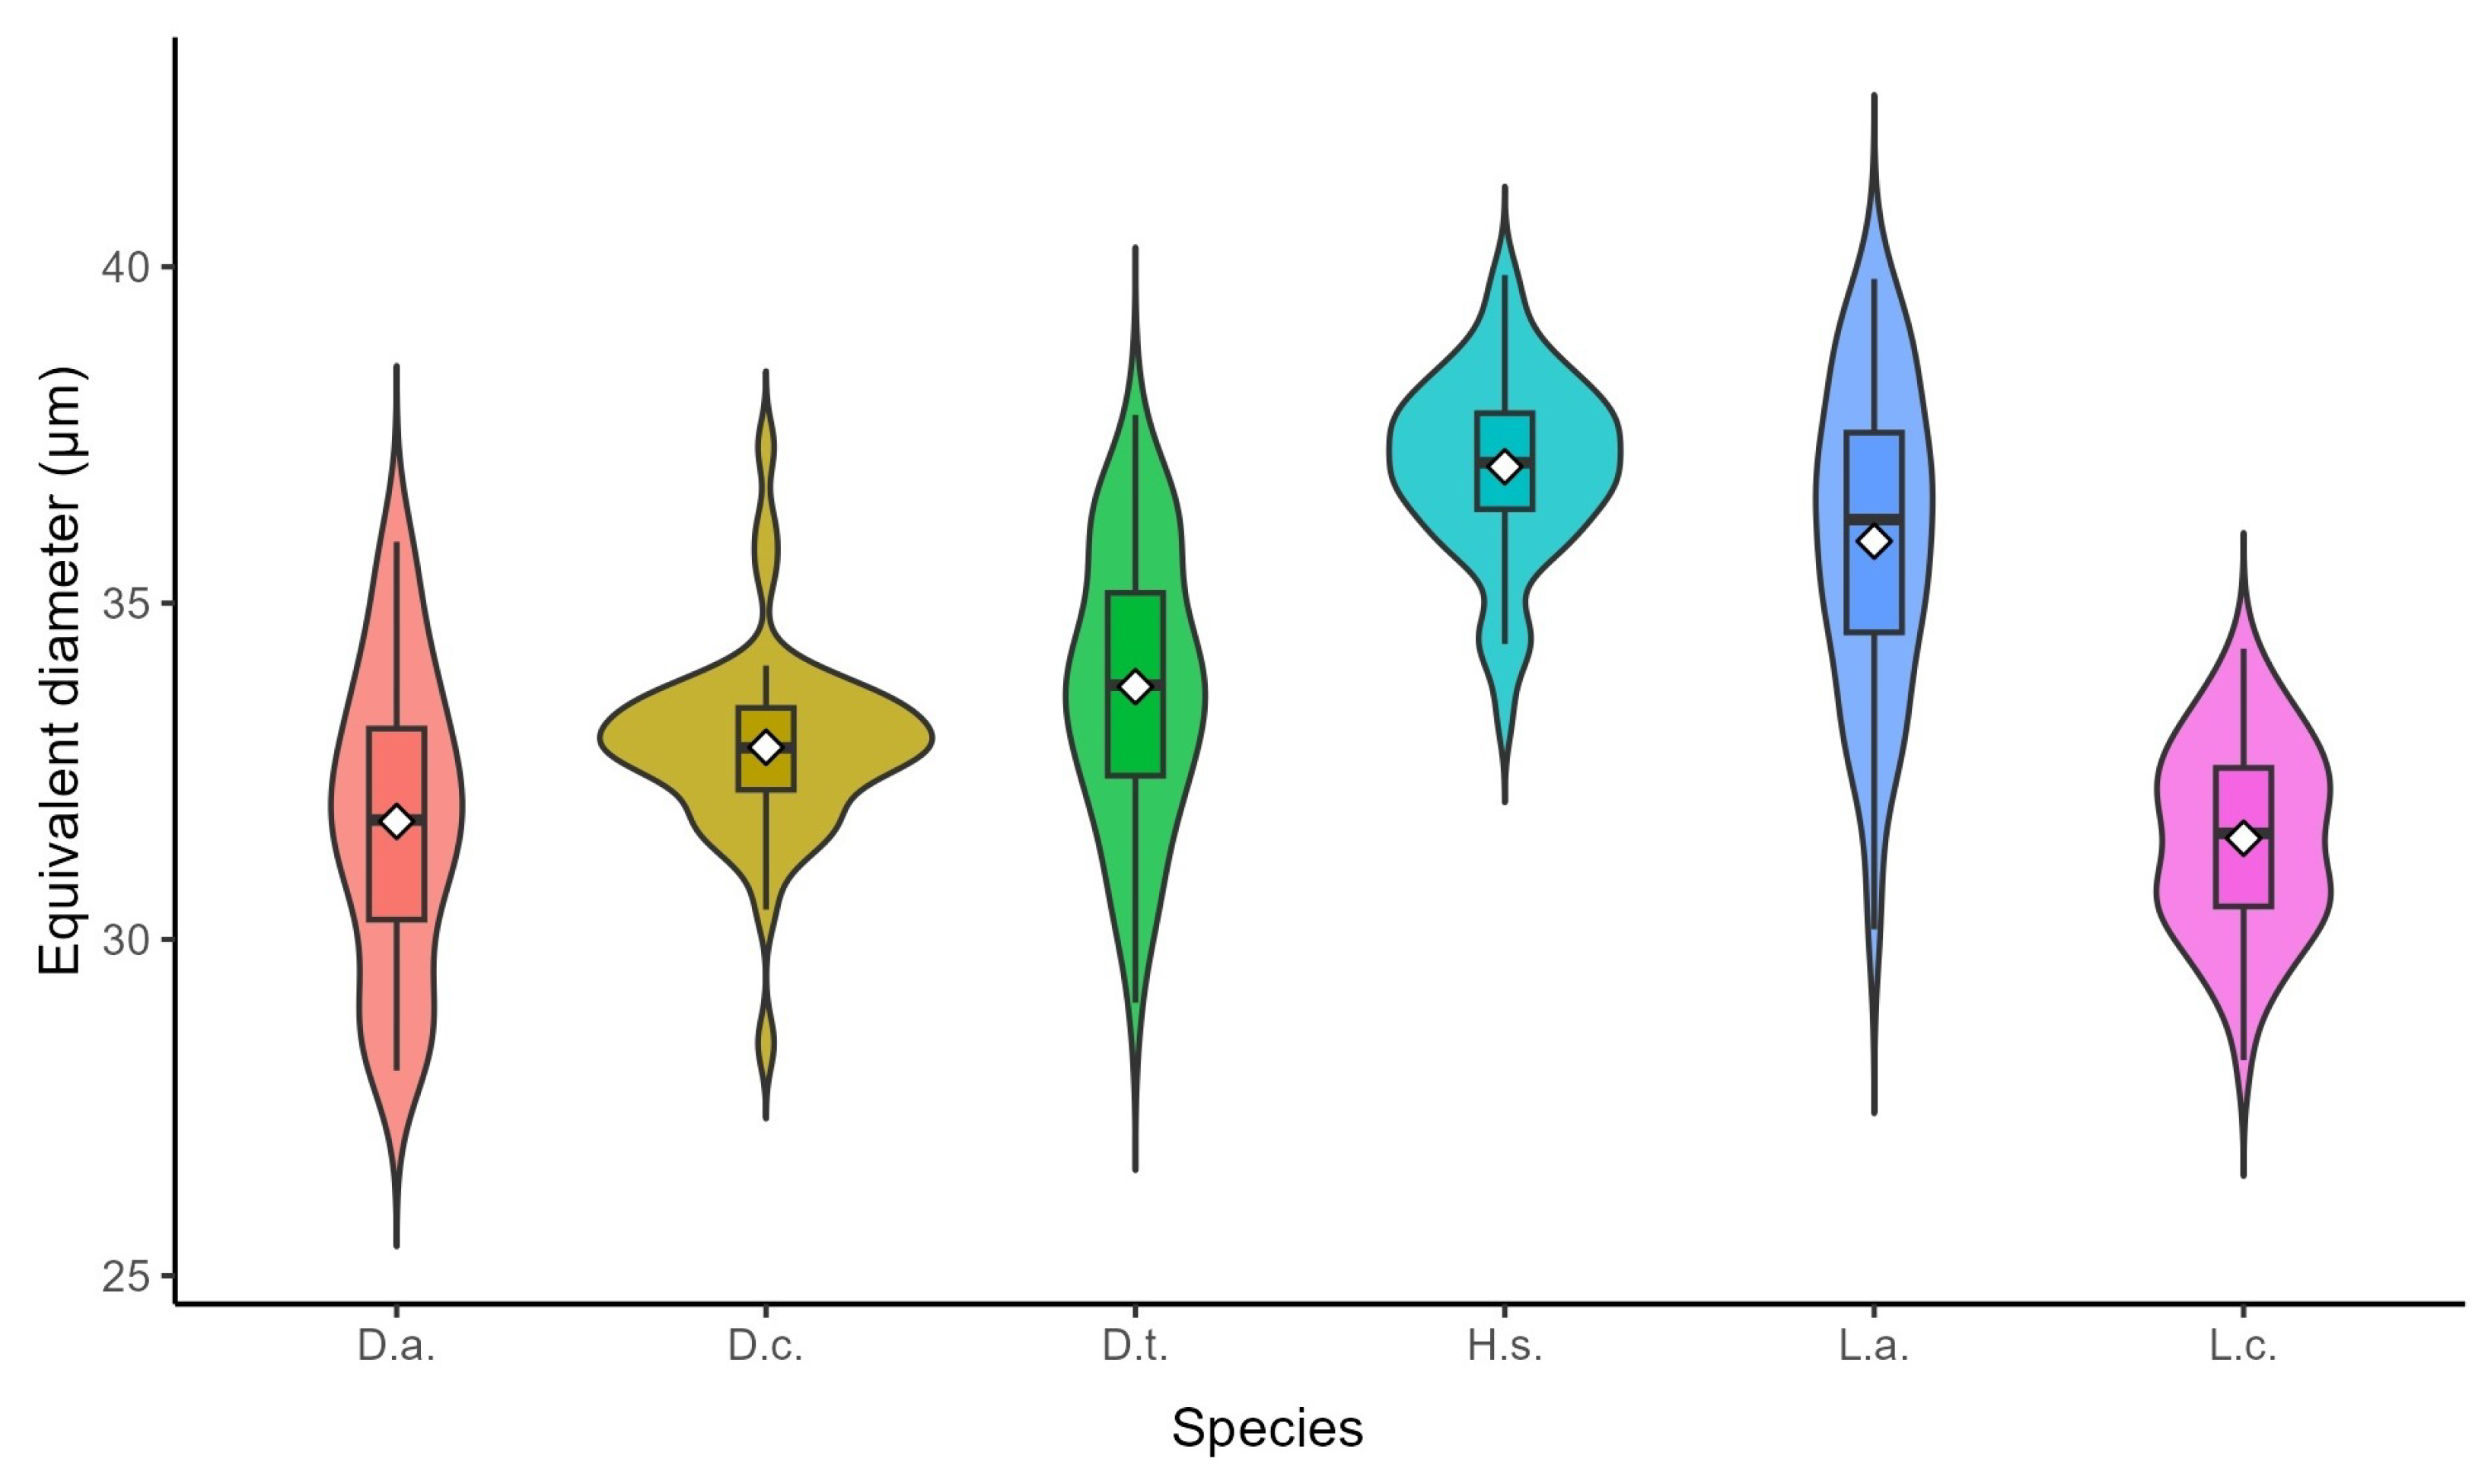
Violin boxplot depicting the distribution of equivalent spore diameters across six Lycopodiaceae taxa. White diamonds represent arithmetic means, while box limits denote inter-quartile ranges. The plot reveals pronounced interspecific size divergence, with H.s. possessing the largest mean diameter () and L.c. the smallest ().
Figure 9.
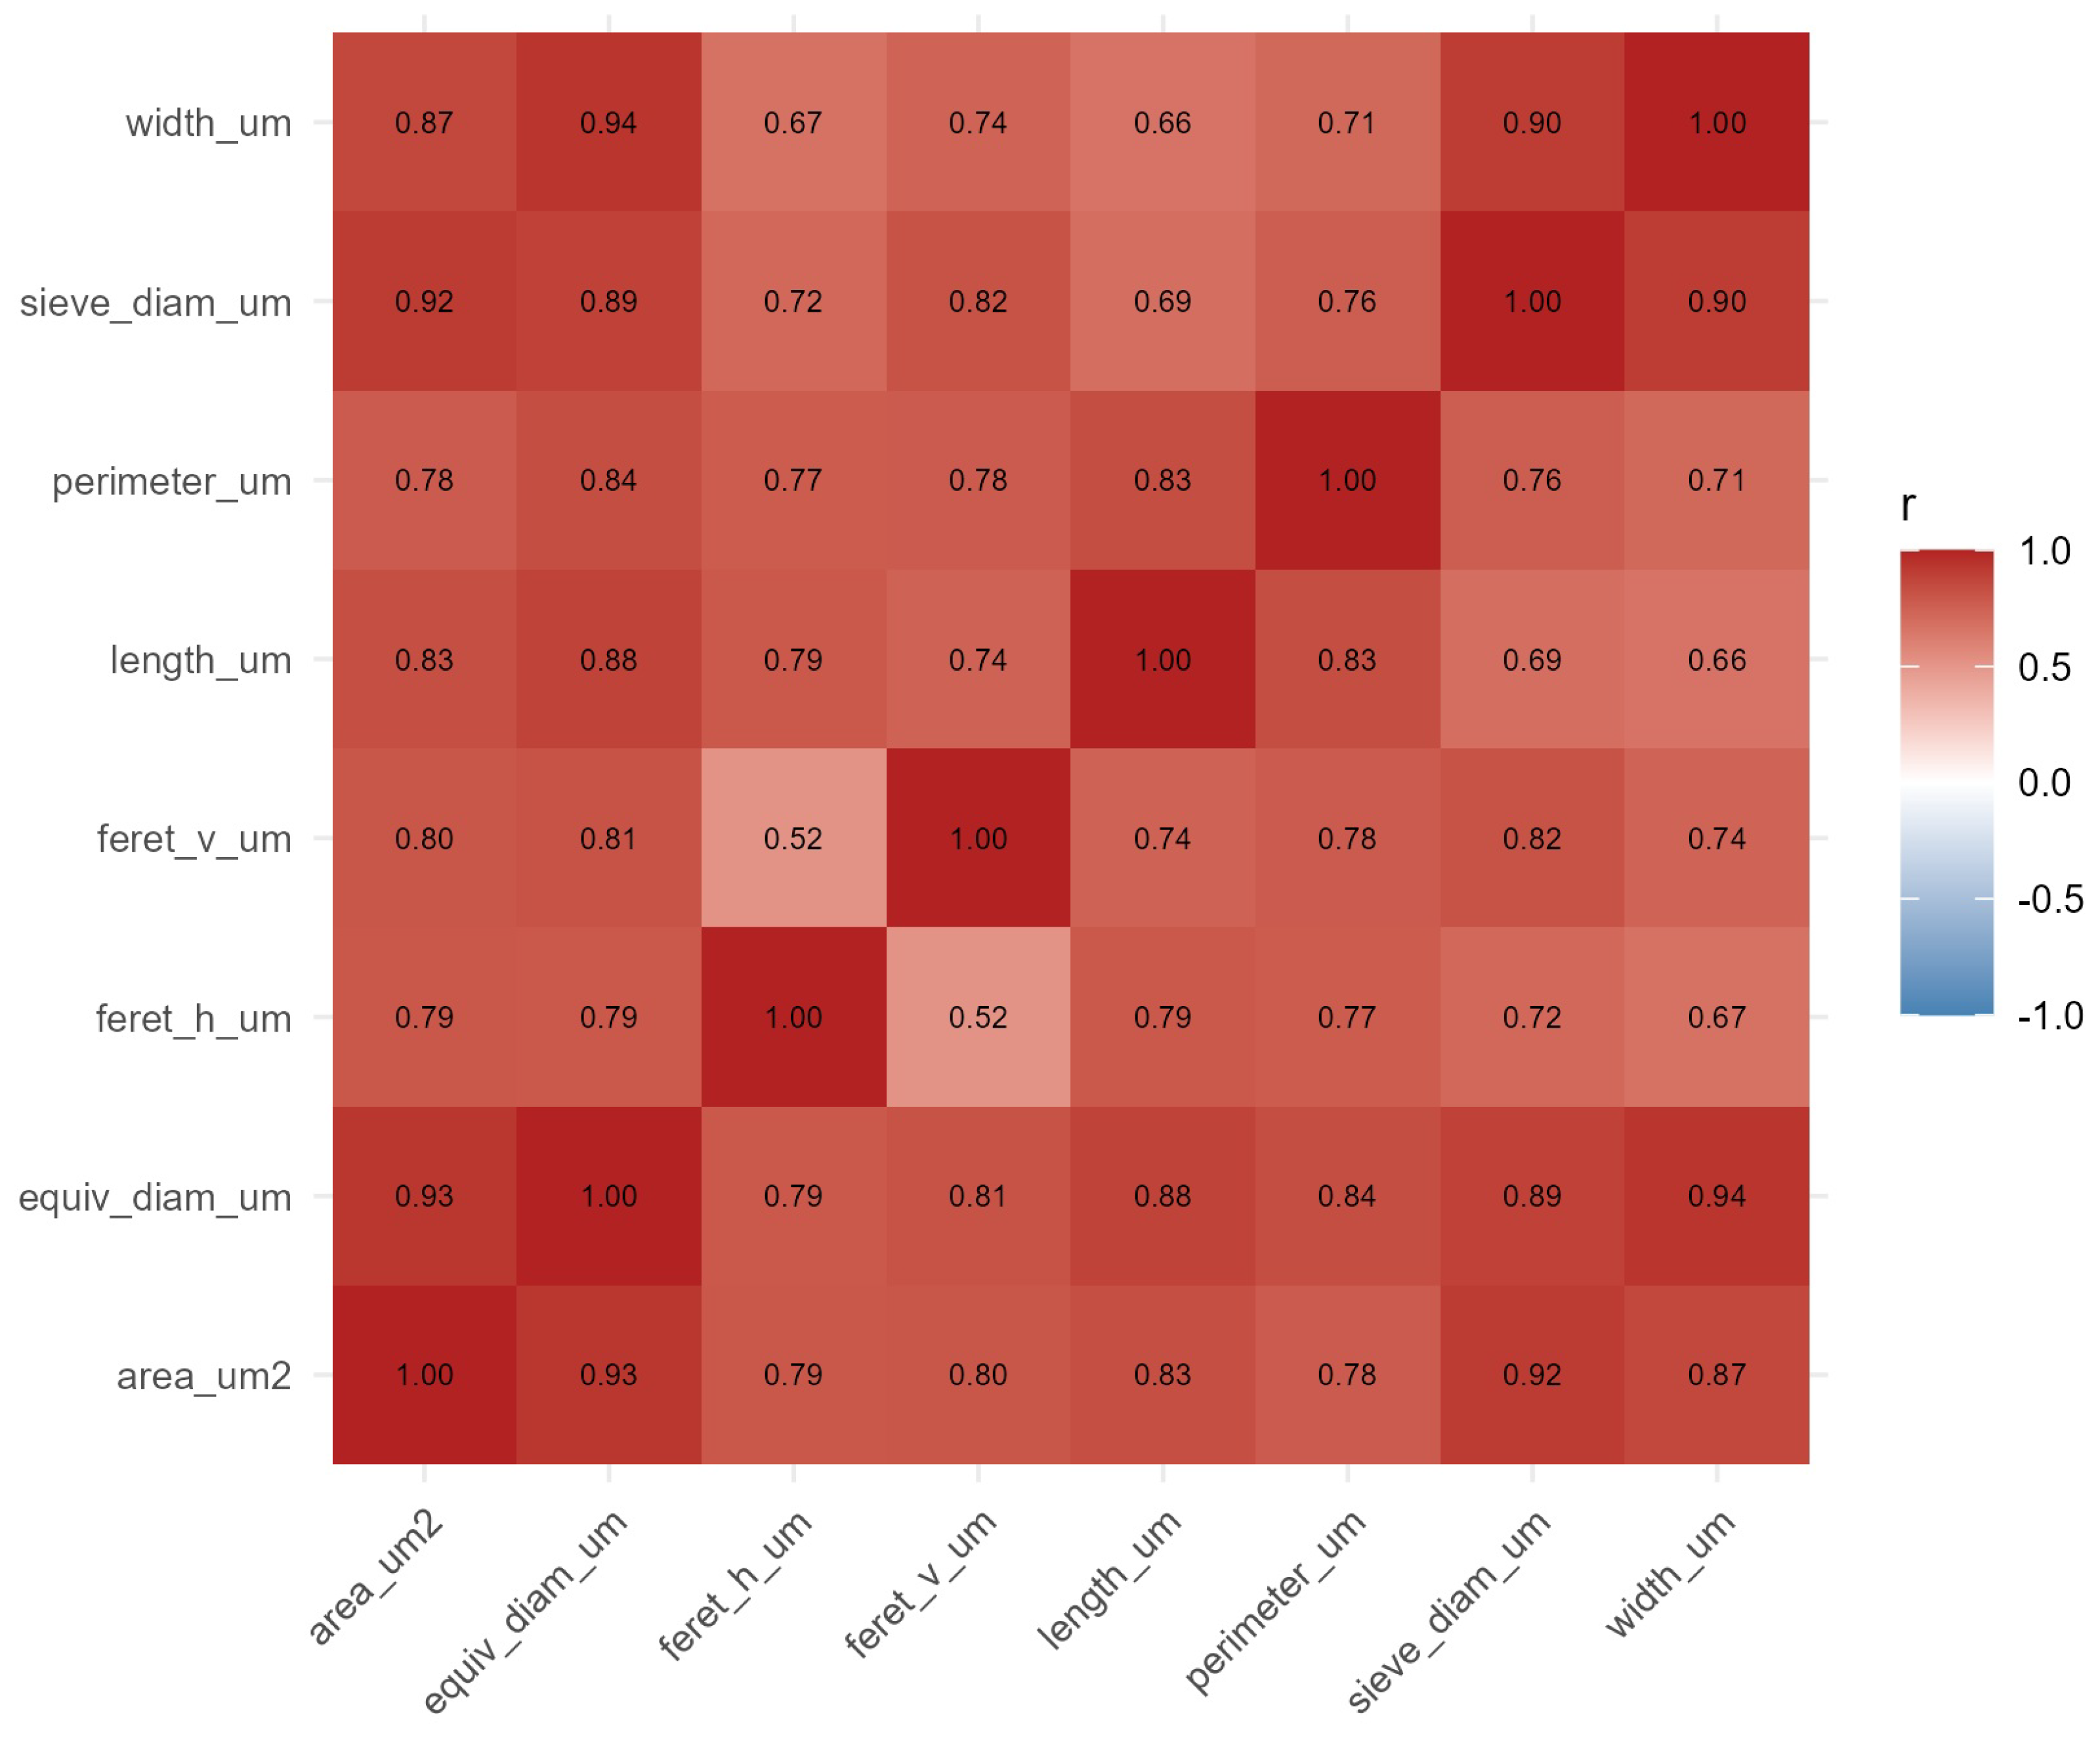
Correlation matrix of eight morphometric variables. Pearson coefficients are displayed, with non-significant cell pairs (false discovery rate ) left blank. Strong collinearity is evident between length-related measures (length_um, feret_v_um), whereas area_um2 maintains moderate independence (VIF ), justifying its retention in multivariate models.
Figure 10.
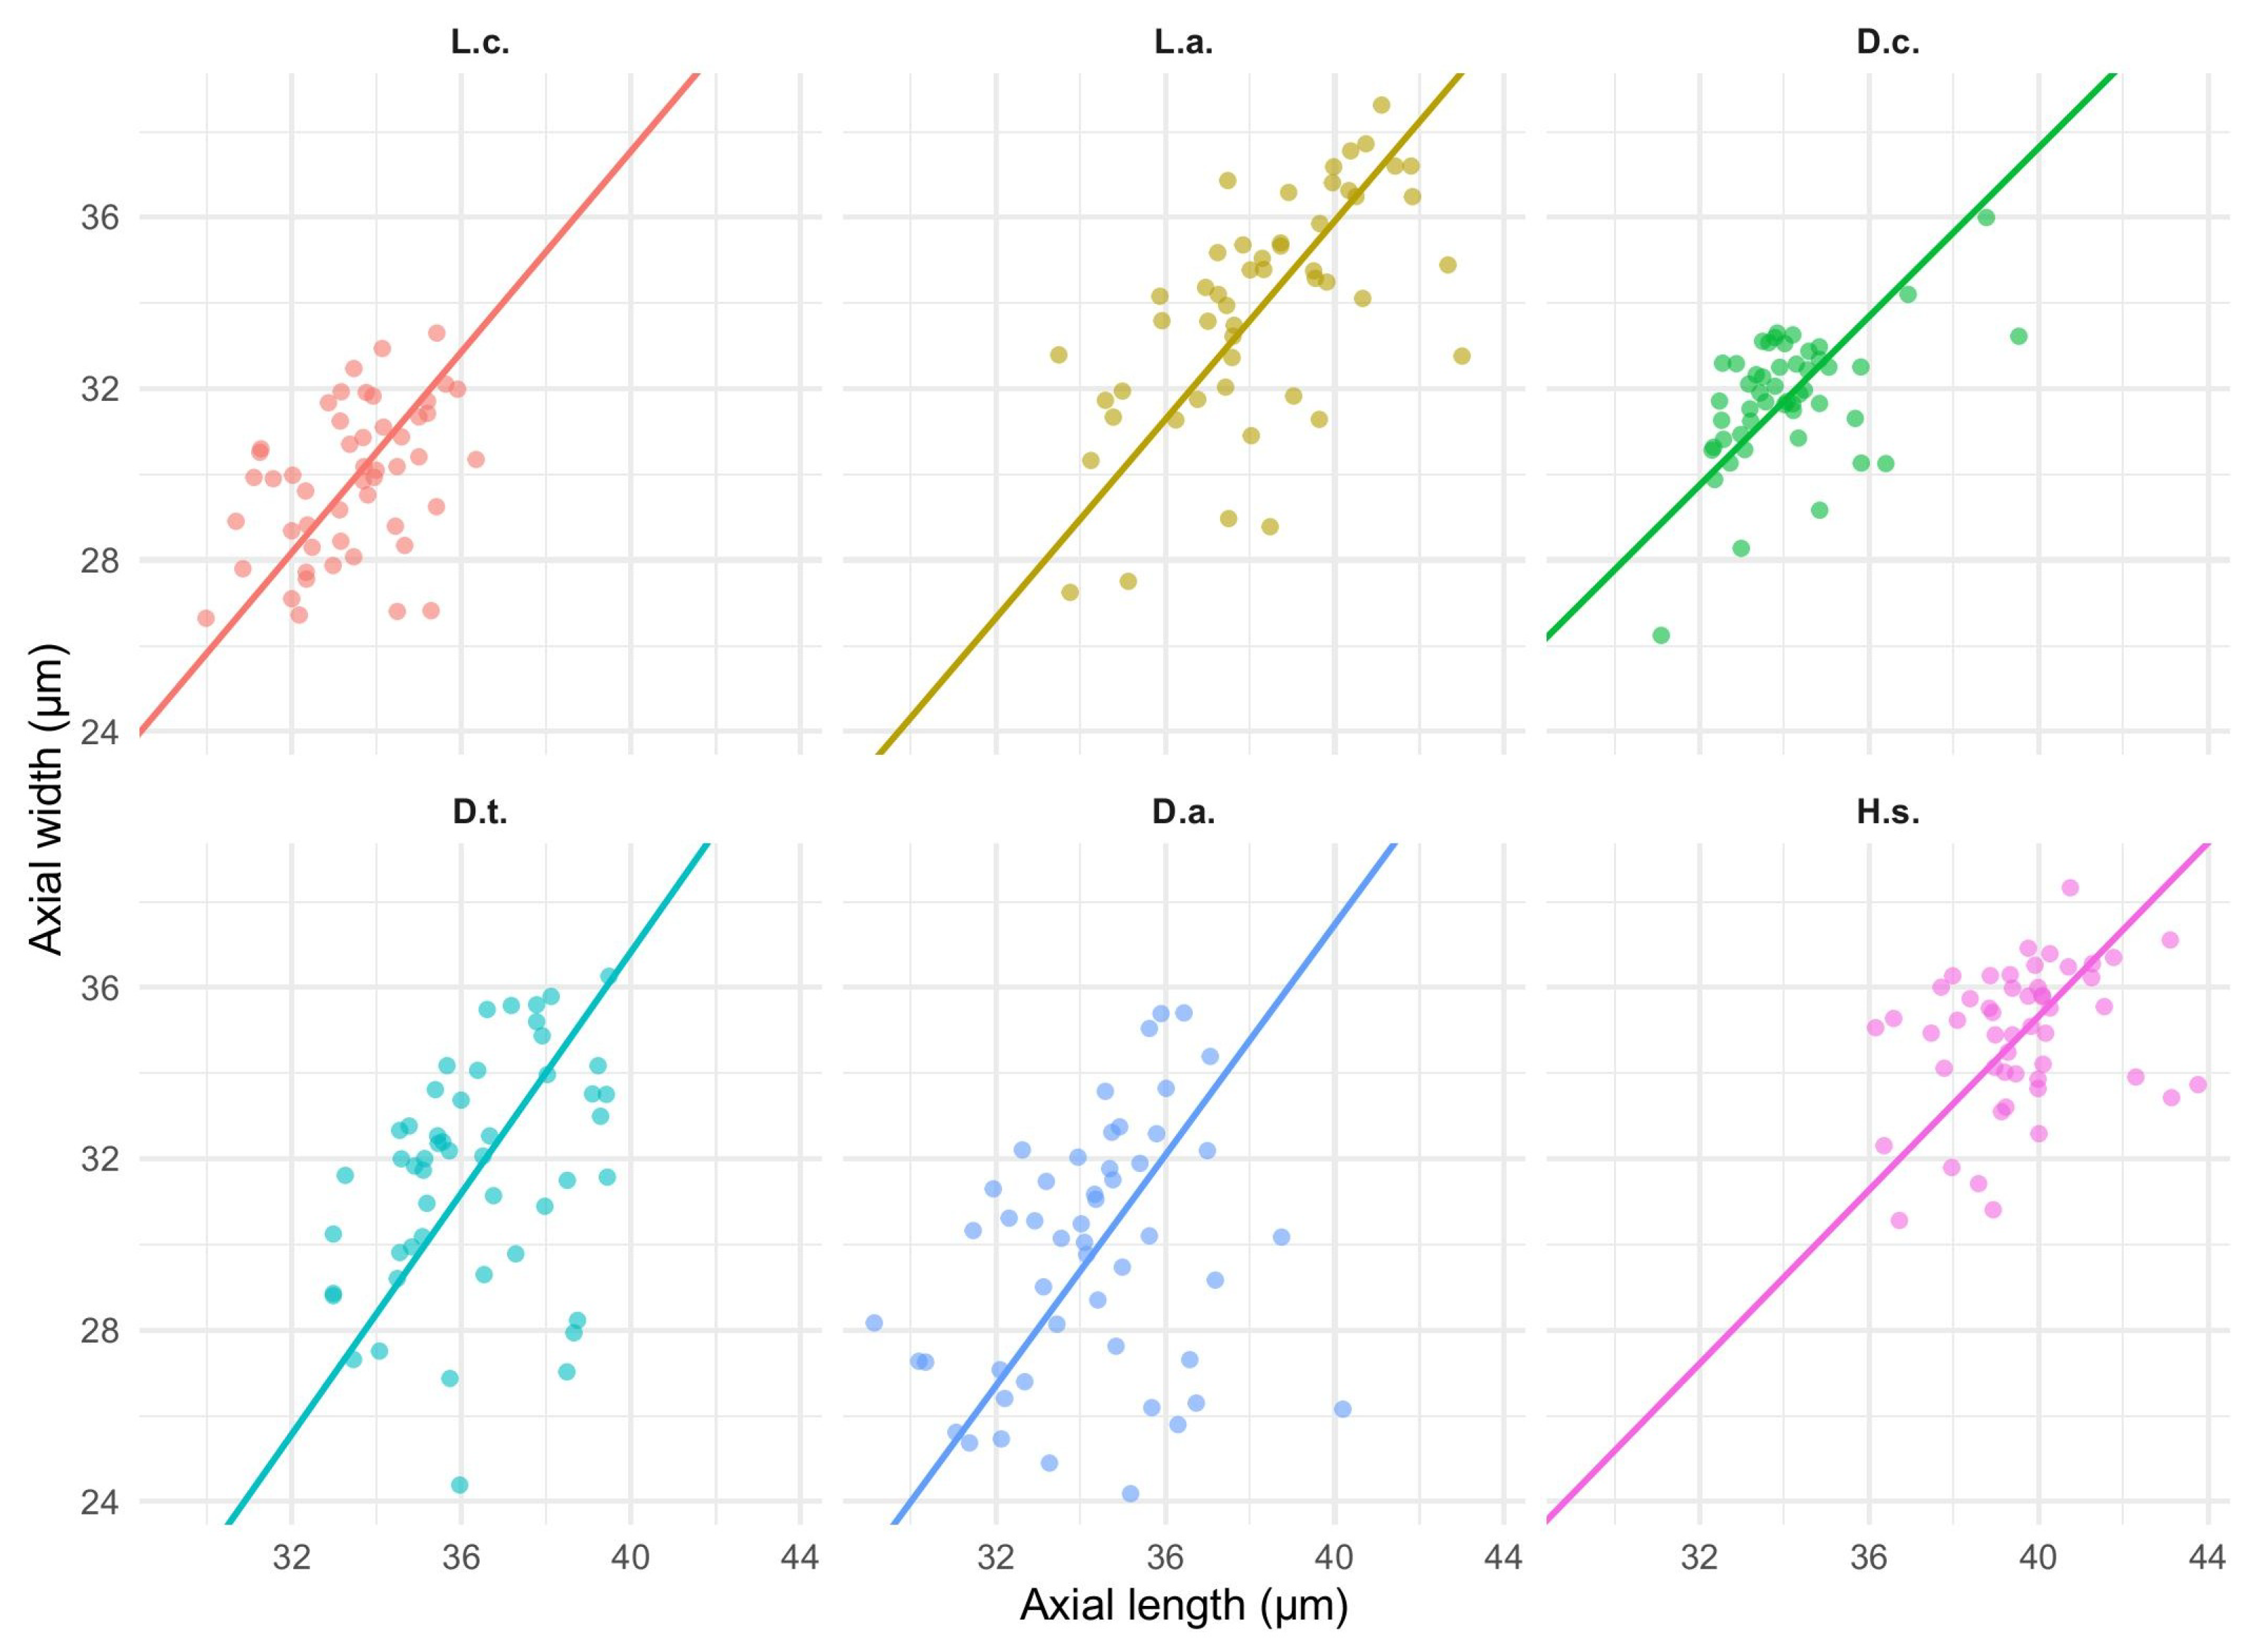
Faceted allometry plots of axial spore length against width for six Lycopodiaceae taxa (labels:
L.c.,
L.a.,
D.c.,
D.t.,
D.a.,
H.s.). Points represent individual spores; regression lines depict the preferred model (SMA, or OLS if SMA could not be estimated). Panel annotations report the sample size (
n) and goodness of fit (
for SMA;
for OLS). Given the scatter observed in some taxa, lines are presented as trend summaries; see
Table 5 for slopes, intercepts, and 95% confidence intervals.
Figure 11.
Spores imaged under transmitted-light microscopy in differential interference contrast (DIC) mode (all panels at ). (A) Lycopodium clavatum; (B) Lycopodium annotinum; (C) Diphasiastrum complanatum; (D) Diphasiastrum tristachyum; (E) Diphasiastrum alpinum; (F) Huperzia selago.
Figure 11.
Spores imaged under transmitted-light microscopy in differential interference contrast (DIC) mode (all panels at ). (A) Lycopodium clavatum; (B) Lycopodium annotinum; (C) Diphasiastrum complanatum; (D) Diphasiastrum tristachyum; (E) Diphasiastrum alpinum; (F) Huperzia selago.
Figure 12.
Backscatteredelectron (BSE) SEM micrographs of Lycopodiaceae spores (imaging mode: BSE, high vacuum; all panels at ). (A) Lycopodium clavatum; (B) Lycopodium annotinum; (C) Diphasiastrum complanatum; (D) D. tristachyum; (E) D. alpinum; (F) Huperzia selago. Characteristic exine ornamentation and aperture architecture are shown.
Figure 13.
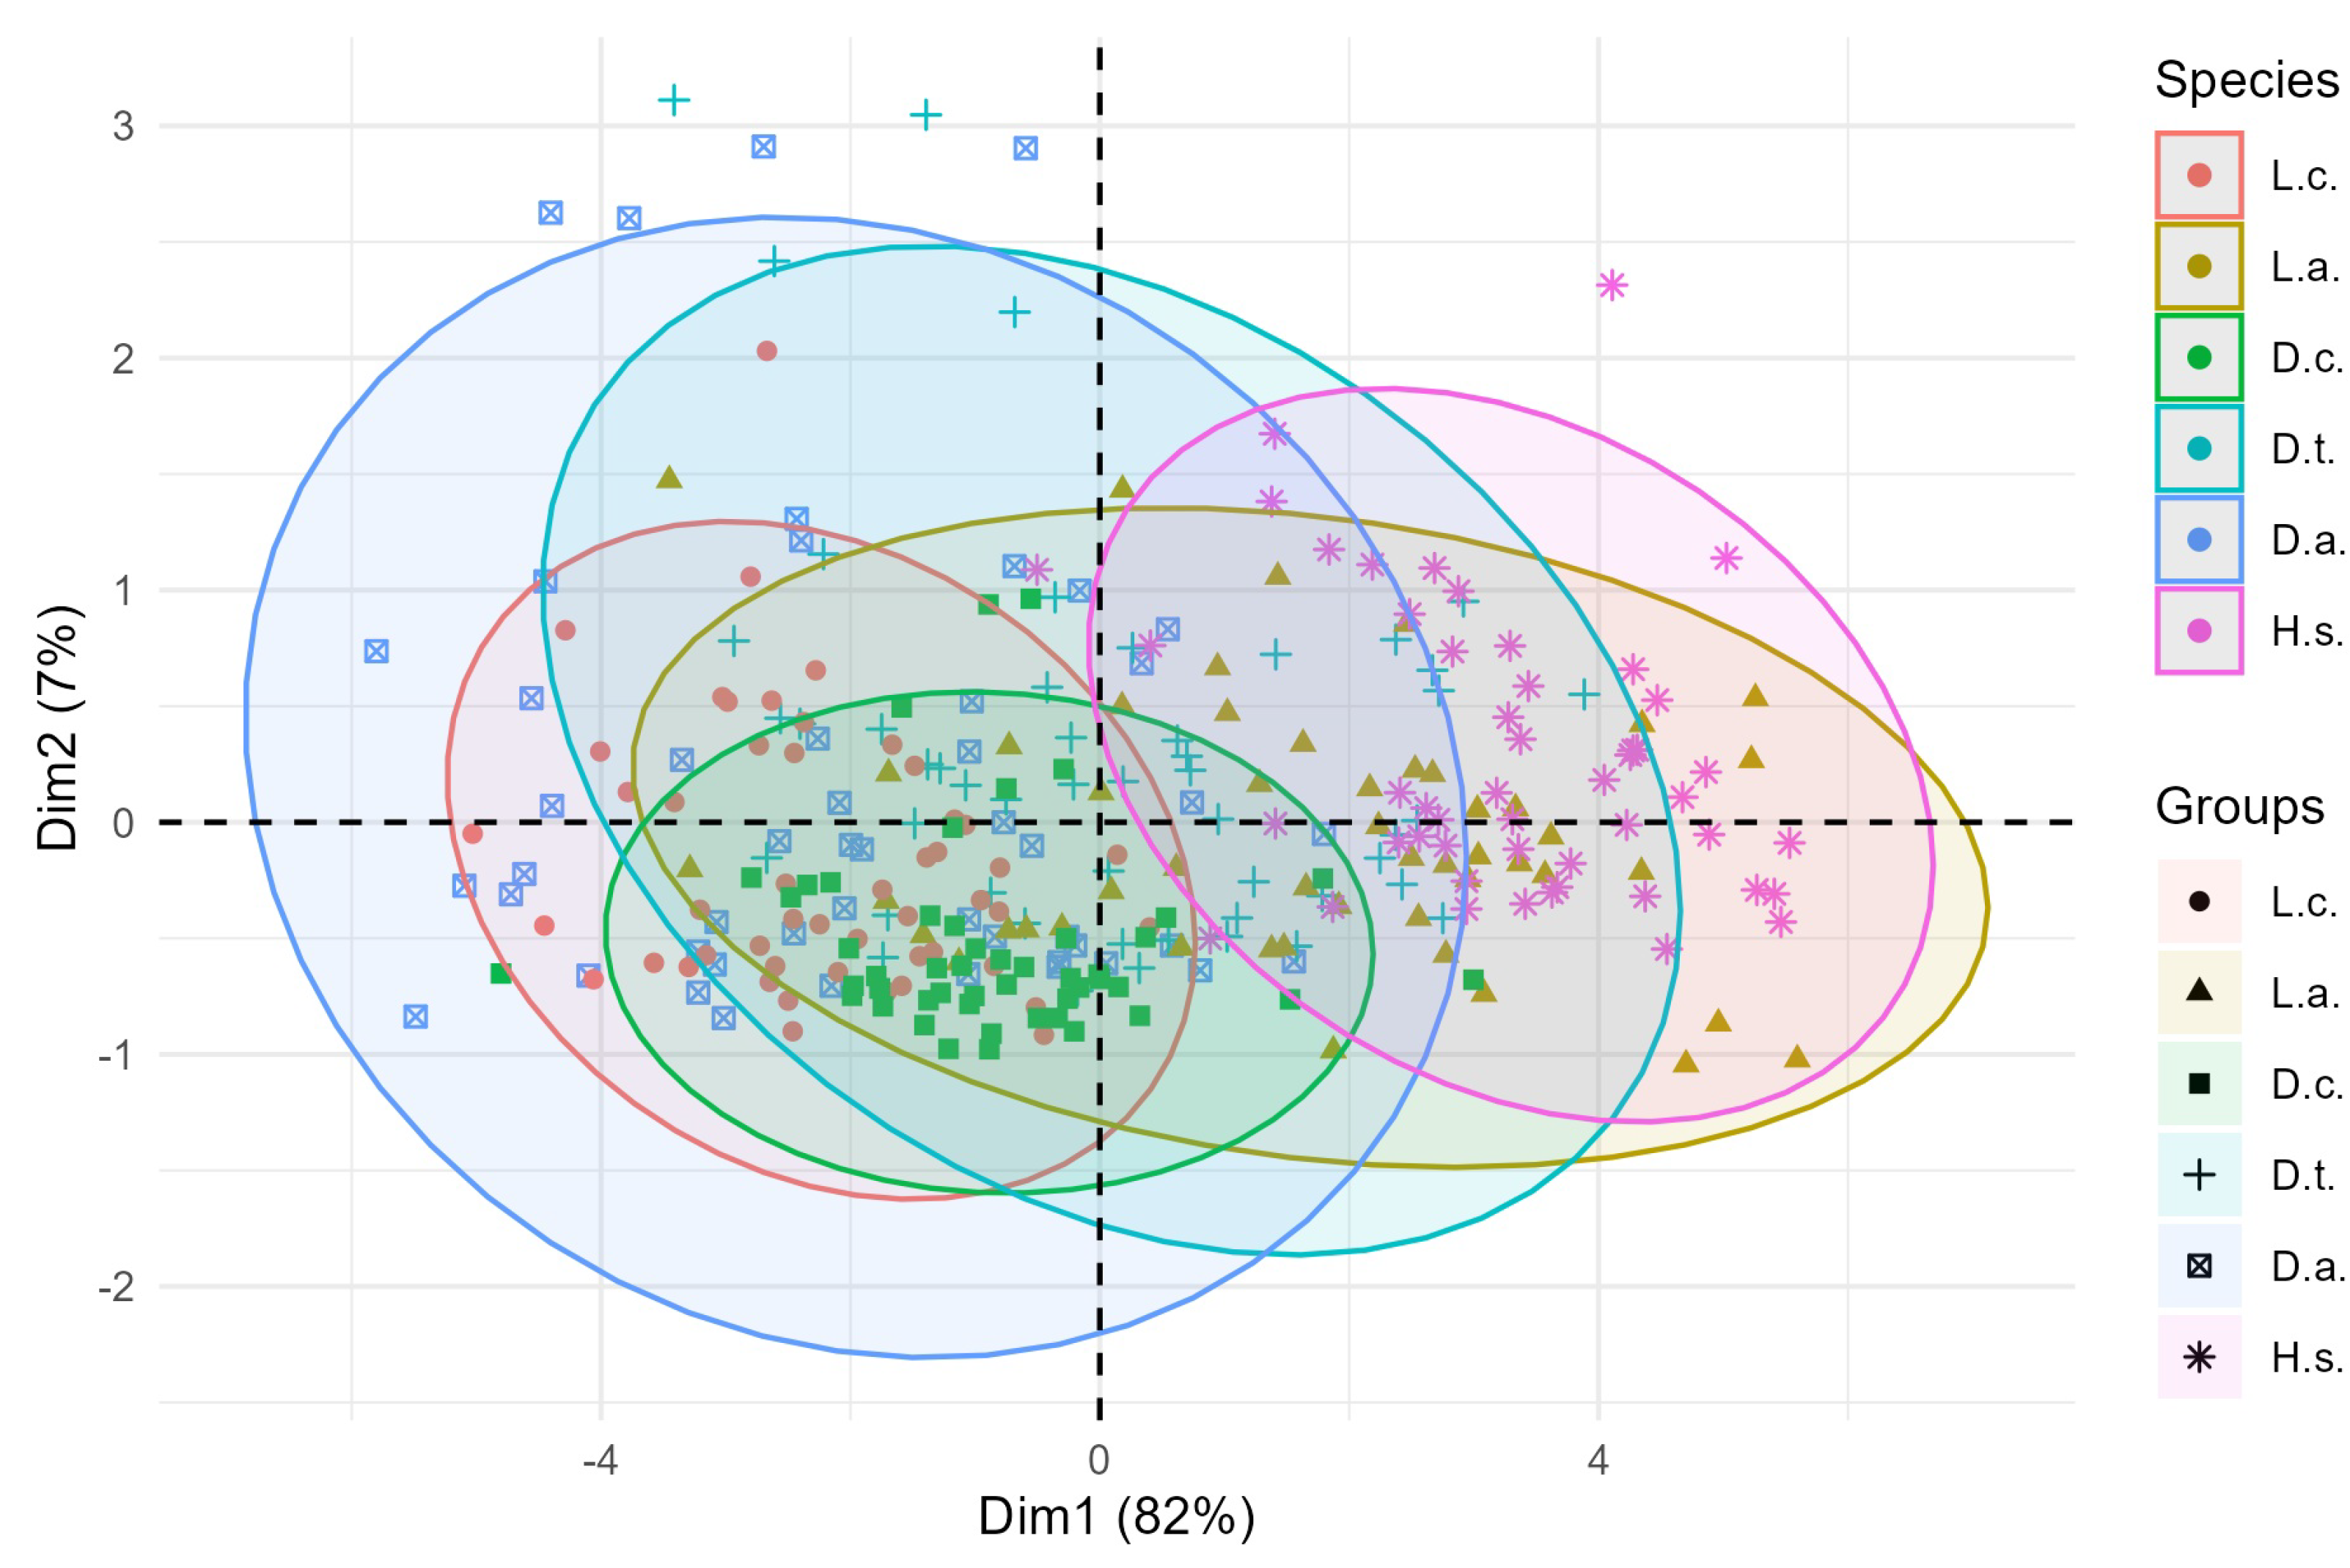
PCA biplot of the first two principal components (Dim1 = 82%, Dim2 = 7%) with 95% confidence ellipses for each species. Vectors indicate variable loadings; symbols denote species. The ellipses overlap to varying degrees.
Figure 13.
PCA biplot of the first two principal components (Dim1 = 82%, Dim2 = 7%) with 95% confidence ellipses for each species. Vectors indicate variable loadings; symbols denote species. The ellipses overlap to varying degrees.
Figure 14.
Ward-linkage dendrogram based on Euclidean distances among z-scored centroid vectors of the six Lycopodiaceae species. Branch lengths confirm the greatest divergence of H.s. and D.t., whereas L.c. and L.a. remain morphometrically closest.
Figure 14.
Ward-linkage dendrogram based on Euclidean distances among z-scored centroid vectors of the six Lycopodiaceae species. Branch lengths confirm the greatest divergence of H.s. and D.t., whereas L.c. and L.a. remain morphometrically closest.
Figure 15.
Bar plot of the mean pairwise Euclidean distance among spores in PCA space (PC1–PC3) for each taxon (n = 50 spores per taxon; 1225 unique pairs). Higher values indicate greater intraspecific morphological dispersion; D.a. shows the widest spread and D.c. the most compact. Convex hull surface areas computed in the same space corroborate this ordering (D.a. largest; D.c. smallest).
Table 1.
Phytosociological affinity of the six Lycopodiaceae species occurring in the Białowieża Forest; after [
22].
Table 1.
Phytosociological affinity of the six Lycopodiaceae species occurring in the Białowieża Forest; after [
22].
| Species | ChCl. | ChO. | ChAll. | ChAss. |
|---|
| Huperzia selago | Juncetea trifidi | - | - | Oreochloo distichae–Juncetum trifidi |
| Lycopodium clavatum | Nardo–Callunetea | - | - | - |
| Lycopodium annotinum | - | Vaccinio–Piceetalia | - | Vaccinio uliginosi–Betuletum pubescentis |
| Diphasiastrum complanatum | - | - | Dicrano–Pinion | - |
| Diphasiastrum tristachyum | - | Calluno–Ulicetalia | - | - |
| Diphasiastrum alpinum | - | - | Nardion | Carici rigidae–Nardetum |
Table 2.
Sample sizes per species and their abbreviations used in all analyses.
Table 2.
Sample sizes per species and their abbreviations used in all analyses.
| Species | Abbreviation | Spores Analysed (n) |
|---|
| Huperzia selago | H.s. | 50 |
| Lycopodium clavatum | L.c. | 50 |
| L. annotinum | L.a. | 50 |
| Diphasiastrum complanatum | D.c. | 50 |
| D. tristachyum | D.t. | 50 |
| D. alpinum | D.a. | 50 |
Table 3.
Morphometric variables recorded for each spore.
Table 3.
Morphometric variables recorded for each spore.
| Variable | Definition |
|---|
| area_um2 | Two-dimensional projected area |
| perimeter_um | Outline perimeter |
| length_um | Maximum Feret length (polar axis) |
| width_um | Minimum Feret length (equatorial axis) |
| feret_h_um | Horizontal Feret diameter |
| feret_v_um | Vertical Feret diameter |
| sieve_diam_um | Diameter of best-fitting sieve circle |
| equiv_diam_um | Diameter of an area-equivalent circle |
Table 4.
Variance inflation factors (VIFs) for the eight morphometric variables.
Table 4.
Variance inflation factors (VIFs) for the eight morphometric variables.
| Variable | VIF |
|---|
| area_um2 | 1852.3 |
| equiv_diam_um | 1741.6 |
| length_um | 264.9 |
| width_um | 213.4 |
| aspect_ratio | 156.2 |
| perimeter_um | 4.7 |
| feret_h_um | 3.9 |
| feret_v_um | 3.4 |
Table 5.
Regression diagnostics for the length–width allometry (preferred per-taxon model). is reported for OLS, for SMA.
Table 5.
Regression diagnostics for the length–width allometry (preferred per-taxon model). is reported for OLS, for SMA.
| Taxon | n | Slope | Intercept | 95% CI (Slope) | | Method |
|---|
| D.a. | 50 | 1.346 | −16.375 | [, ] | 0.07 | SMA |
| D.c. | 50 | 0.984 | −1.741 | [, ] | 0.27 | SMA |
| D.t. | 50 | 1.406 | −19.415 | [, ] | 0.13 | SMA |
| H.s. | 50 | 1.013 | −5.198 | [, ] | 0.08 | SMA |
| L.a. | 50 | 1.158 | −10.410 | [, ] | 0.40 | SMA |
| L.c. | 50 | 1.170 | −9.263 | [, ] | 0.18 | SMA |
Table 6.
Comparative micromorphological traits of spores from six Lycopodiaceae taxa collected in the Białowieża Forest. Ranges are minima–maxima, with the mean in parentheses.
Table 6.
Comparative micromorphological traits of spores from six Lycopodiaceae taxa collected in the Białowieża Forest. Ranges are minima–maxima, with the mean in parentheses.
| Taxon | Spore Type | Diameter | Exine Sculpture | Aperture Features | Ornamentation/Comment | LM Figure | SEM Figure |
|---|
| Lycopodium clavatum | Mesospore, trilete | 27–36 (32) µm | Granulata–reticulate; distal-side reticulate | Trilobed, occasionally unfused; adhesion arms conspicuous | Irregular granules; dorsal elevation diagnostic | Figure 11A | Figure 12A |
| Lycopodium annotinum | Mesospore, trilete; tetrad dispersal | 27–43 (36) µm | Reticulata with variable pentagonal meshes | Adhesion arms well defined; contact lines sharp | Micro-corrugations and fine granulations | Figure 11B | Figure 12B |
| Diphasiastrum complanatum | Mesospore, trilete | 26–40 (33) µm | reticulata plicata; corrugated pentagonal meshes | Conical scars clearly delimited | Microfolds and microgranules around laesura | Figure 11C | Figure 12C |
| Diphasiastrum tristachyum | Mesospore, trilete | 24–39 (34) µm | Reticulata ampla with broad meshes | Aperture rounded, margins smooth | Microgranules and folds distally concentrated | Figure 11D | Figure 12D |
| Diphasiastrum alpinum | Mesospore, trilete | 24–40 (32) µm | Reticulata irregularis | Cross-shaped aperture, fine folds plus granules | Mesh architecture habitat dependent | Figure 11E | Figure 12E |
| Huperzia selago | Mesospore, trilete | 31–44 (37) µm | Even, reticulate meshwork | Adhesion shoulders gently curved | Micropores and microvilli uniformly distributed | Figure 11F | Figure 12F |
Table 7.
One-way ANOVA testing the effect of species on eight morphometric descriptors. All contrasts are highly significant after false-discovery-rate adjustment.
Table 7.
One-way ANOVA testing the effect of species on eight morphometric descriptors. All contrasts are highly significant after false-discovery-rate adjustment.
| Variable | df1 | df2 | F | p |
|---|
| Area () | 5 | 294 | 137.4 | < |
| Perimeter () | 5 | 294 | 162.0 | < |
| Length () | 5 | 294 | 76.3 | < |
| Width () | 5 | 294 | 41.9 | < |
| () | 5 | 294 | 88.4 | < |
| () | 5 | 294 | 115.7 | < |
| Aspect ratio | 5 | 294 | 52.8 | < |
| Equivalent diameter () | 5 | 294 | 149.2 | < |
Table 8.
Percentage of total variance explained by the first three principal components.
Table 8.
Percentage of total variance explained by the first three principal components.
| Component | Variance (%) | Cumulative (%) |
|---|
| PC1 | 82.0 | 82.0 |
| PC2 | 7.0 | 89.0 |
| PC3 | 5.2 | 94.2 |
Table 9.
Summary of the PERMANOVA testing the effect of species on spore morphometry (Euclidean distances; 999 permutations).
Table 9.
Summary of the PERMANOVA testing the effect of species on spore morphometry (Euclidean distances; 999 permutations).
| Source | df | SS | MS | F | |
|---|
| Species | 5 | 1241.55 | 248.31 | 10.17 | 0.52 |
| Residual | 294 | 1146.42 | 3.90 | – | 0.48 |
| Total | 299 | 2387.97 | | | 1.00 |
Table 10.
Confusion matrix for leave-one-out k-NN classification based on the first three principal components (). Diagonal cells (bold) are correct predictions; off-diagonal cells are misclassifications. Overall accuracy computed from this matrix is 67.0%.
Table 10.
Confusion matrix for leave-one-out k-NN classification based on the first three principal components (). Diagonal cells (bold) are correct predictions; off-diagonal cells are misclassifications. Overall accuracy computed from this matrix is 67.0%.
| | Predicted |
|---|
| Actual | Da | Dc | Dt | Hs | La | Lc |
| Da | 26 | 4 | 11 | 0 | 6 | 3 |
| Dc | 2 | 41 | 0 | 1 | 2 | 4 |
| Dt | 8 | 0 | 29 | 0 | 9 | 4 |
| Hs | 0 | 0 | 0 | 43 | 2 | 5 |
| La | 3 | 2 | 8 | 1 | 29 | 7 |
| Lc | 4 | 1 | 3 | 2 | 7 | 33 |
Table 11.
Within-species morphological disparity calculated as the mean pairwise Euclidean distance among spores in PCA space (PC1–PC3).
Table 11.
Within-species morphological disparity calculated as the mean pairwise Euclidean distance among spores in PCA space (PC1–PC3).
| Species | Disparity |
|---|
| Diphasiastrum alpinum | 2.89 |
| Diphasiastrum complanatum | 1.55 |
| Diphasiastrum tristachyum | 2.34 |
| Huperzia selago | 2.08 |
| Lycopodium annotinum | 2.81 |
| Lycopodium clavatum | 1.79 |
