Article

A Novel Approach for Inverting Forest Fuel Moisture Content Utilizing Multi-Source Remote Sensing and Deep Learning

School of Advanced Interdisciplinary Studies, Central South University of Forestry and Technology, Changsha 410004, China
*
Author to whom correspondence should be addressed.
Forests 2025, 16(9), 1423; https://doi.org/10.3390/f16091423
Submission received: 23 June 2025 / Revised: 29 August 2025 / Accepted: 3 September 2025 / Published: 5 September 2025
(This article belongs to the Section Natural Hazards and Risk Management)

Abstract

Fuel Moisture Content (FMC) is a critical indicator for assessing forest fire risk and formulating early warning strategies, as its spatiotemporal dynamics directly influence the accuracy of fire danger rating. To improve the accuracy of forest FMC estimation, this study proposes an innovative deep learning method integrating multi-source remote sensing data. By combining the global feature extraction capability of the Transformer architecture with the local temporal modeling advantages of Gated Recurrent Units (GRU) (referred to as the Transformer-GRU model), a high-precision FMC estimation framework is established. The study focuses on forested areas in California, USA, utilizing ground-measured FMC data alongside multi-source remote sensing datasets from MODIS, Sentinel-1, and Sentinel-2. A systematic comparison was conducted among Transformer-GRU model, standalone Transformer models, single GRU models, and two classical machine learning models (Random Forest, RF, and Support Vector Regression, SVR). Additionally, forward feature selection was employed to evaluate the performance of different models and feature combinations. The results demonstrate that (1) All models effectively utilize the derived features from multi-source remote sensing data, confirming the significant enhancement of multi-source data fusion for forest FMC estimation; (2) The Transformer-GRU model outperforms other models in capturing the nonlinear relationship between FMC and remote sensing data, achieving superior estimation accuracy (R2 = 0.79, MAE = 8.70%, RMSE = 11.44%, rRMSE = 12.60%); (3) The spatiotemporal distribution patterns of forest FMC in California generated by the Transformer-GRU model align well with regional geographic characteristics and climatic variability, while exhibiting a strong relationship with historical wildfire occurrences. The proposed Transformer-GRU model provides a novel approach for high-precision FMC estimation, offering reliable technical support for dynamic forest fire risk early warning and resource management.

1. Introduction

Forest Fuel Moisture Content (FMC), as a core parameter that characterizes the moisture condition of forest vegetation, serves as a critical indicator for evaluating forest fire risks [1]. The accurate monitoring of FMC is essential for forest fire early warning systems and integrated risk management. While traditional FMC measurement methods based on field sampling offer relatively high accuracy, they are inherently limited by low efficiency, potential ecological damage to vegetation, and challenges in acquiring large-scale continuous spatial data, thereby significantly constraining their applicability in regional-scale forest fire risk assessments [2].
The rapid advancement of remote sensing technology has provided a novel technical approach to the dynamic monitoring of Forest FMC. Optical remote sensing, characterized by its well-established technical framework and diverse vegetation indices, has achieved significant progress in FMC inversion research. Research conducted in the 1980s revealed a positive correlation between the Normalized Difference Vegetation Index (NDVI), derived from AVHRR optical remote sensing data, and forest fuel moisture content (FMC) [3]. As remote sensing satellite technology has advanced, an increasing number of optical remote sensing images have been utilized for FMC inversion. Yang et al. [4] introduced an innovative approach to estimate FMC by integrating the Enhanced Vegetation Index (EVI) and the Normalized Difference Moisture Index (NDMI) based on MODIS imagery. Quan et al. [5] applied a radiative transfer model in conjunction with Landsat 8 data to estimate FMC in forests across southwest China, accounting for the two-layer canopy structure comprising both trees and undergrowth vegetation. Rodriguez-Jimenez et al. [6] developed a predictive model for live fuel moisture content during the dry season by combining Sentinel-2 spectral indices with meteorological data, aiming to improve fire forecasting accuracy. Furthermore, Quan et al. [7] achieved sub-daily monitoring of forest FMC using data from the Himawari-8 satellite. Nevertheless, optical remote sensing is susceptible to atmospheric conditions and primarily captures information from the canopy top layer, making it challenging to comprehensively reflect the true moisture status of forest vegetation [8]. By contrast, microwave remote sensing, particularly Synthetic Aperture Radar (SAR) technology, demonstrates distinct advantages. Its all-weather observation capability overcomes the weather-related limitations of optical remote sensing, while its sensitivity to the dielectric properties of moisture offers a new physical foundation for FMC monitoring beneath closed canopies [9,10]. In the early 2000s, Leblon et al. [11] analyzed ERS-1 SAR remote sensing imagery in relation to forest fuel moisture content and identified a significant correlation between the SAR backscatter coefficient and moisture content based on radar image intensity values. Tanase et al. [12] integrated field data from semi-arid forests dominated by white cypress pine in Australia with airborne L-band SAR data, applying linear regression to establish a relationship between SAR backscatter coefficients and polarization decomposition features for FMC estimation. Heffernan et al. [13] employed backscatter information derived from Sentinel-1 radar imagery and demonstrated the potential of SAR to estimate canopy moisture under fresh rainfall conditions during the dry season, based on an evaporation model. Wang et al. [14] combined backscatter models for bare soil and vegetation, such as the linear model and the water cloud model, using C-band Sentinel-1A data, to evaluate the performance of Sentinel-1 in FMC inversion. Moreover, SAR signals can penetrate the canopy to acquire information about the vertical structure of vegetation, which is critical for enhancing the accuracy of FMC inversion. However, due to the issue of mixed surface–canopy signals, single SAR data still encounters challenges in achieving precise FMC inversion.
In recent years, the rapid advancement of multi-source remote sensing data fusion technology has provided a novel approach to overcoming the inherent limitations of single data sources. Within this research context, machine learning such as Random Forest (RF) and Support Vector Regression (SVR) [15] have exhibited significant advantages in processing multi-source heterogeneous remote sensing data and uncovering complex feature relationships, attributed to their superior nonlinear modeling capabilities [16,17,18]. Zhu et al. [19] were the first to estimate FMC using Temporal Convolutional Neural Network (Temp-CNN). Subsequent studies have further refined and expanded upon this approach (Perello et al. [20]; Miller et al. [21]). Wen et al. [22] estimated seven forest fire-related factors, including FMC, surface temperature, and elevation, by utilizing remote sensing data from Landsat 8 OLI/TIRS and Sentinel-1, along with nighttime light data and DEM. Additionally, they developed a forest fire risk assessment system based on the analytic hierarchy process. Xie et al. [23] integrated remote sensing data from MODIS, Landsat-8, and Sentinel-1, employing stacked time series neural network models for ensemble learning. They compared the performance of different models and data combinations in estimating FMC. The results indicated that the stacked ensemble deep learning model, which incorporated all available remote sensing data sources, yielded the most accurate inversion results, thereby confirming the effectiveness of multi-source remote sensing data for FMC estimation in the study area. Nevertheless, existing methods have not paid much attention to the impact of multi-source remote sensing features on the models, and the full potential of emerging deep learning models remains underexplored, especially in the modeling of temporal dynamic features. It is noteworthy that following the breakthroughs of the Transformer architecture in natural language processing (e.g., machine translation and sentiment recognition), its exceptional sequence modeling capability has also demonstrated remarkable performance in handling time series tasks [24,25]. Based on this research context, the present study proposes an innovative deep learning architecture. By effectively integrating the global feature perception capability of Transformer with the local temporal dynamic modeling advantage of Gated Recurrent Unit (GRU), a hybrid Transformer-GRU model is constructed. This study focuses on addressing the following critical scientific challenges: (1) How can the features of multi-source optical and SAR remote sensing data be effectively integrated? (2) How can the variations in FMC be accurately characterized across different temporal and spatial scales? (3) How can we accurately model the complex mapping relationship between remote sensing features and FMC? It is anticipated that this novel model architecture will enable high-precision, spatio-temporally continuous inversion of forest FMC, thereby providing robust technical support for the dynamic risk assessment of forest fires.

2. Materials

2.1. Test Site

This study selects California, located in the United States, as the research area (Figure 1). Situated between 32°40′ N and 42°05′ N latitude, and 114°0′ W and 123°35′ W longitude, the region encompasses a total area of 423,970 square kilometers (including a land area of 403,932 square kilometers). The study area demonstrates pronounced geographical heterogeneity, extending approximately 1240 km from north to south and spanning roughly 300 km from east to west, with an average elevation of 880 m. The climate is predominantly influenced by topographic factors, with the western coast exhibiting a typical Mediterranean climate. In contrast, the eastern portion experiences an arid alpine climate due to the orographic effect of the Sierra Nevada Mountains, which significantly reduces precipitation levels. In recent years, under the backdrop of global climate change, drought events have become increasingly frequent in this region, particularly in the eastern mountainous areas, where forest fires have emerged as a high-incidence phenomenon. The marked separation between the high-fire season (June to October) and the rainy season (winter) has further exacerbated fire risks [26,27]. This distinctive combination of climate and topography, along with its associated ecological impacts, renders California an exemplary location for investigating the spatio-temporal dynamics of forest FMC and its correlation with forest fires.

2.2. Research Data

2.2.1. Sentinel-1 Remote Sensing Data

The SAR data utilized in this study were sourced from the Sentinel-1 satellite within the Copernicus Earth Observation Programme of the European Space Agency (ESA). The Sentinel-1 satellite is equipped with a C-band dual-polarization SAR sensor, supporting two polarization modes: vertical transmit—vertical receive (VV) and vertical transmit—horizontal receive (VH) [28]. With its short revisit time, it can image the same area once every 12 days. The Sentinel-1 satellite supports four imaging modes; in this study, the Interferometric Wide swath (IW) mode was employed for the estimation and inversion of forest FMC [29]. Common data formats of Sentinel-1 include the Single Look Complex (SLC) format and the Ground Range Detected (GRD) format. The SLC format retains the amplitude and phase information of the echo signal, making it suitable for high-precision studies such as interferometry and range analysis. In contrast, the GRD format is generated after multi-look processing and geographical projection, containing backscattering intensity information of ground objects and being applicable to tasks such as surface feature recognition and soil moisture estimation. In this study, Sentinel-1 SAR images at the GRD level were used as one of the primary data sources, and these data were acquired through the Google Earth Engine (GEE) platform. Specific Sentinel-1 image information segments are listed in Table S1.

2.2.2. Sentinel-2 Remote Sensing Data

Sentinel-2 represents a critical class of Earth observation satellites launched by the ESA as part of the Copernicus program. This satellite system comprises two individual satellites, namely Sentinel-2A and Sentinel-2B. Sentinel-2 primarily focuses on optical remote sensing observations and is equipped with a Multispectral Imager (MSI), enabling it to acquire high spatiotemporal resolution multispectral data globally. The revisit cycle for a single satellite is 10 days; when both satellites operate in tandem, this interval can be reduced to 5 days, thereby significantly enhancing the efficiency of data acquisition [30]. Each Sentinel-2 satellite has 13 operational spectral bands that span the visible, near-infrared, and short-wave infrared regions, providing notable advantages in extracting vegetation indices, leaf area index (LAI), and water-related indicators [31]. Consequently, Sentinel-2 exhibits heightened sensitivity in monitoring vegetation conditions and is particularly suited for forest FMC inversion. In this study, the Sentinel-2 image data utilized originates from Level-2A products provided by the GEE platform. Specific Sentinel-2 image information segments are listed in Table S2.

2.2.3. MODIS Remote Sensing Data

In order to precisely retrieve the remotely sensed inversion values of FMC in forested regions, this study utilized the MODIS land cover product to mask non-forest areas in California. Specifically, the MCD12Q1.061 product was employed, which provides annual global-scale surface cover type information at a spatial resolution of 500 m. This dataset incorporates five distinct classification systems: the International Geosphere-Biosphere Programme (IGBP), Annual Leaf Area Index (LAI), Annual Plant Functional Types (PFT), University of Maryland (UMD), and Annual BIOME-Biogeochemical Cycles (BGC). In this research, the IGBP classification system was selected as the criterion for distinguishing land cover types [32]. Based on the findings of Yebra et al., the forested areas considered in this study encompass evergreen broadleaf forests, deciduous broadleaf forests, evergreen needleleaf forests, deciduous needleleaf forests, mixed forests, wooded savannas, and savannas [33].
In addition, to further investigate the relationship between forest FMC and the risk of forest fires, this study analyzed the correlation between FMC and historical fire data using the MODIS burned area product (MCD64A1.061). This product provides global monthly fire history information at a spatial resolution of 500 m. It includes five data layers: fire occurrence date, uncertainty of the burning date, quality control information, and two validation data layers used to assess the reliability of changes. In the “burning date” layer, a pixel value of “0” indicates an unburned area, “−1” indicates no observed data, “−2” represents water bodies, and values ranging from “1” to “366” signify that a fire occurred within the corresponding Julian day [34]. In this study, pixels with values greater than “0” in the “burning date” layer were considered valid fire points, and the monthly burned area was estimated by multiplying the number of valid fire points by the area of a single pixel.

2.2.4. FMC Site Data

The ground data utilized in this study were sourced from the National Fuel Moisture Database (NFMD), which encompasses 976 fixed sampling stations predominantly located in the western United States. The specific NFMD ground station information segments are listed in Table S3. During the actual sampling procedure, plant samples within the sample plots were typically collected in the afternoon on sunny days, ensuring no dew or precipitation was present. Subsequently, the FMC values of the vegetation were calculated by measuring the mass difference in the vegetation samples before and after drying [2]. However, the actual sampling process involves various uncertainties. Although ground stations located in forested areas were selected for this study, variations in vegetation types across the regions may still influence the final FMC ground observations. Therefore, the characteristics of FMCs under different vegetation types should be taken into account as comprehensively as possible. In this study, a total of 1101 sample datasets were obtained from 103 stations in California within the NFMD, spanning from 1 January 2019 to 31 December 2023. The station data included in this study encompass seven distinct vegetation types: Chamise, Douglas-Fir, Fir, Mahogany, Oak, Pine, and Tanoak. Table 1 presents the detailed moisture content for these seven vegetation types. It is evident that the FMC value ranges vary across the seven tree species groups. Chamise exhibits the broadest FMC value range and the highest standard deviation, whereas Mahogany demonstrates relatively more concentrated FMC values with the lowest standard deviation. Only Pine and Douglas-Fir possess a mean moisture content exceeding 100%. Among all tree species, Douglas-Fir has the highest FMC mean at 132.87%, while Mahogany has the lowest FMC mean at 73.64%. The diverse vegetation type coverage and varying FMC value ranges enhance the realism and reliability of this study.

2.3. Remote Sensing Data Preprocessing

Due to the varying spatial and temporal resolutions among different remote sensing satellite datasets, it is essential to conduct spatio-temporal consistency processing on these data. In this study, time-series remote sensing data were obtained from GEE based on the latitude and longitude coordinates of the experimental sites and the specified sampling dates. Professional technicians in the NFMD site database collected fresh fuel samples approximately once a month, which can be considered as sampling at the end of each month [23]. Correspondingly, remote sensing images for the end of each month were downloaded to ensure temporal consistency between ground-measured data and remote sensing images. Given the discrepancies in spatial resolutions among the remote sensing data used in this study, all datasets were uniformly resampled to a spatial resolution of 250 m × 250 m to ensure compatibility with the spatial extent of the NFMD sites, despite the potential for some information loss [23]. Through the matching of latitude and longitude coordinates, spatial synchronization between remote sensing images and ground observation data was achieved. Additionally, this study employed the Min–Max Normalization method to normalize all subsequent input features, thereby enhancing the comparability among data sources and improving the training and prediction performance of the model.

3. Methodology

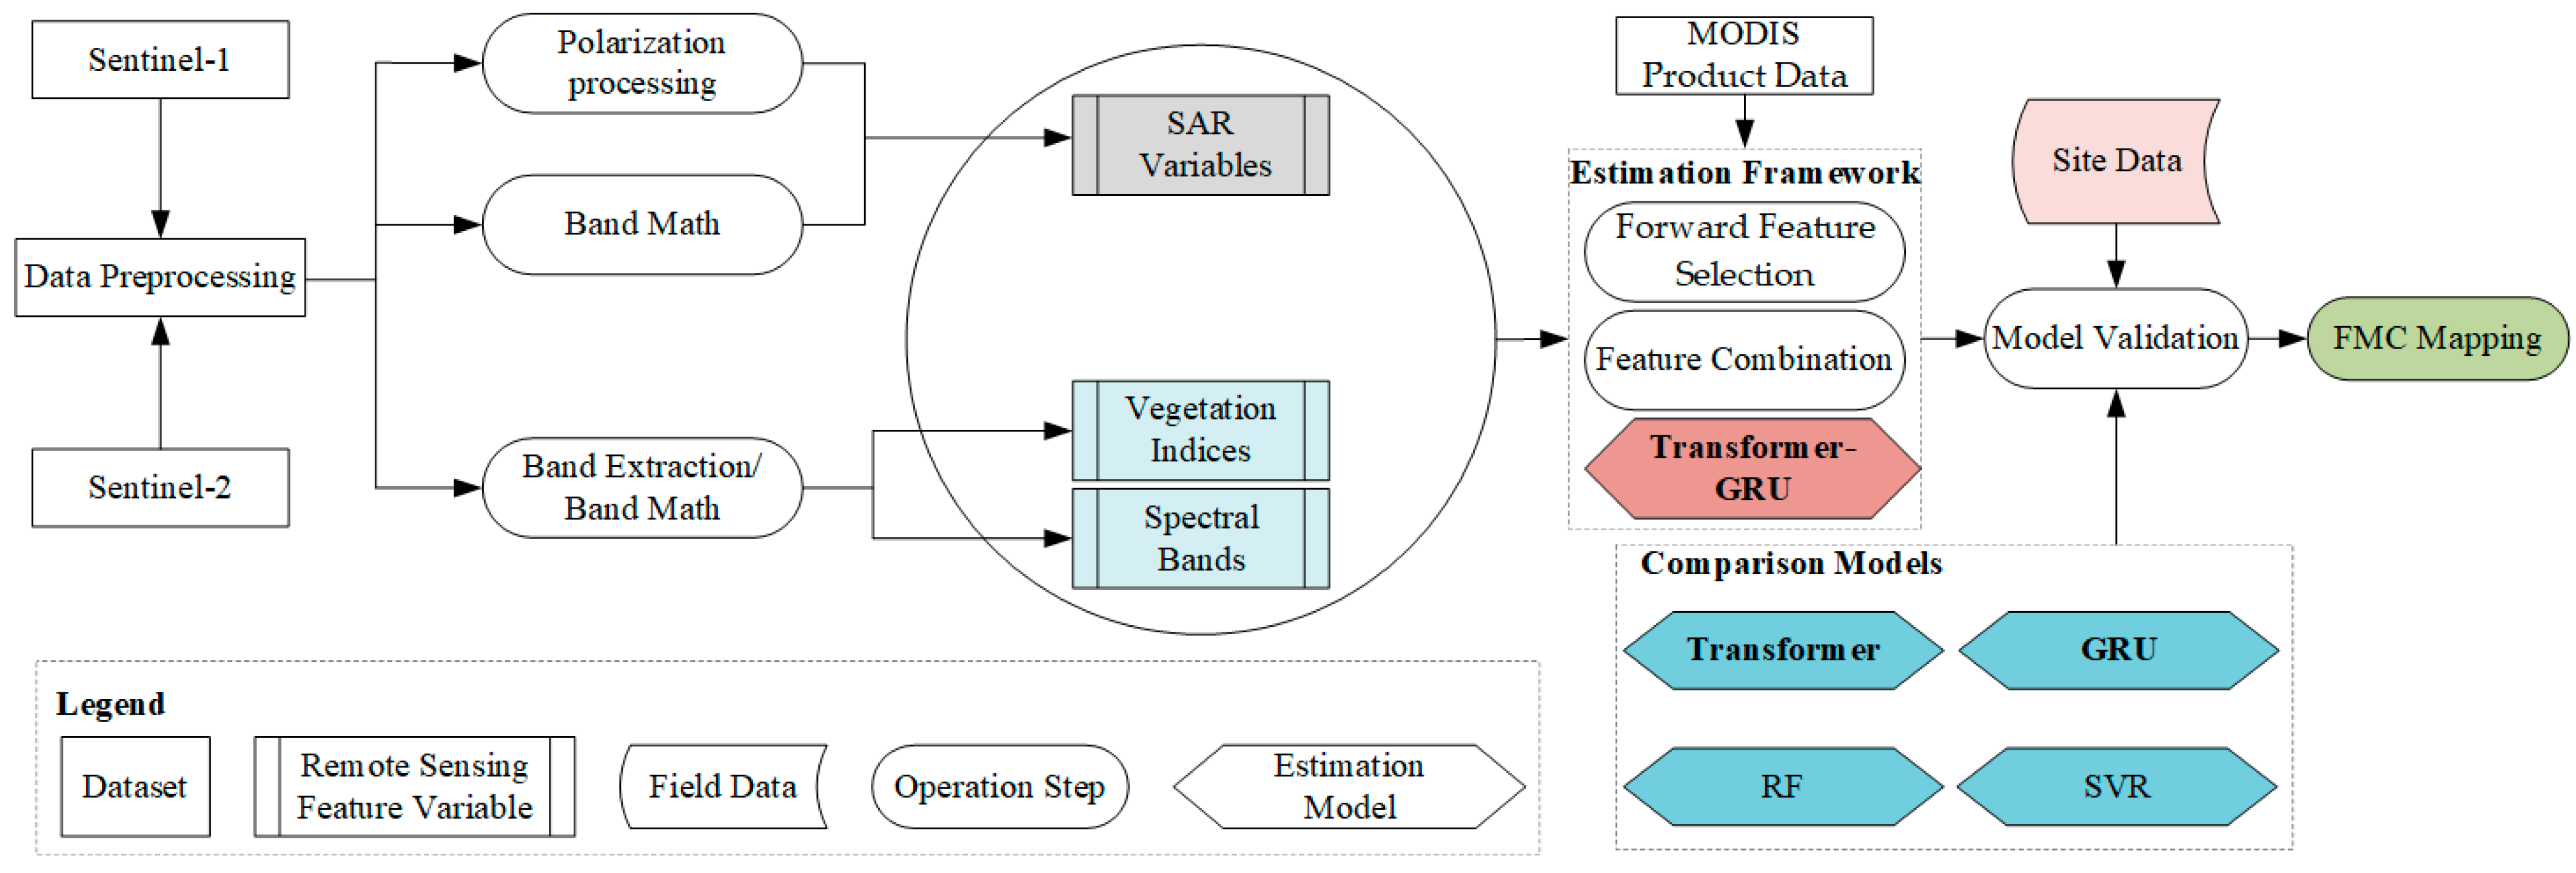
In this study, remote sensing characteristic variables were extracted separately from Sentinel-1 SAR images and Sentinel-2 optical images. A correlation analysis was performed between all characteristic variables and forest FMC to evaluate the sensitivity of each variable to forest FMC. Subsequently, a forward feature selection procedure was implemented based on the degree of correlation to identify the optimal feature combination for each model. The Transformer-GRU model proposed in this study integrates the complementary strengths of both methods in global feature extraction and local temporal sequence modeling, thereby effectively capturing the complex mapping relationship between remote sensing characteristic factors and forest FMC. To validate its accuracy, comparative analyses were conducted using a standalone Transformer model, a single GRU model, as well as two classical machine learning approaches: RF and SVR. The overall workflow of the proposed method is illustrated in Figure 2.

3.1. Correlation Analysis of Features Extracted from Optical and SAR Images

For SAR images, prior studies have shown that microwave backscattering is highly sensitive to the vegetation water content on the ground surface, and the backscattering information in SAR can comprehensively characterize the FMC [11,13]. Moreover, features derived from the SAR backscattering coefficient through a series of mathematical transformations have exhibited significant potential for estimating vegetation parameters [35]. Consequently, to enhance the representativeness of dual-polarization SAR features in this study, we extracted the backscattering coefficients from Sentinel-1 images and employed mathematical methods to construct multiple derived variables associated with these coefficients. Detailed information is provided in Table 2.
For optical images, they typically contain rich spectral dimension information. Even for the same type of vegetation, its spectral characteristics may vary significantly across different bands. Particularly in the near-infrared band, short-wave infrared band, and red band, vegetation exhibits heightened sensitivity. A prominent reflection peak is usually observed in the near-infrared band. The short-wave infrared band primarily reflects variations in vegetation water content, whereas the red band demonstrates strong absorption properties. By performing arithmetic operations such as addition, subtraction, multiplication, or division on these sensitive bands, multiple indices can be constructed to describe vegetation conditions, thereby enhancing vegetation-related information in the image [36,37]. These vegetation indices effectively reflect the growth status and water content characteristics of vegetation and yield favorable results in distinguishing vegetation from other ground objects (e.g., soil, water bodies, or atmospheric interference). In this study, six representative bands and ten typical vegetation indices were extracted from Sentinel-2 images. The detailed information is presented in Table 3.
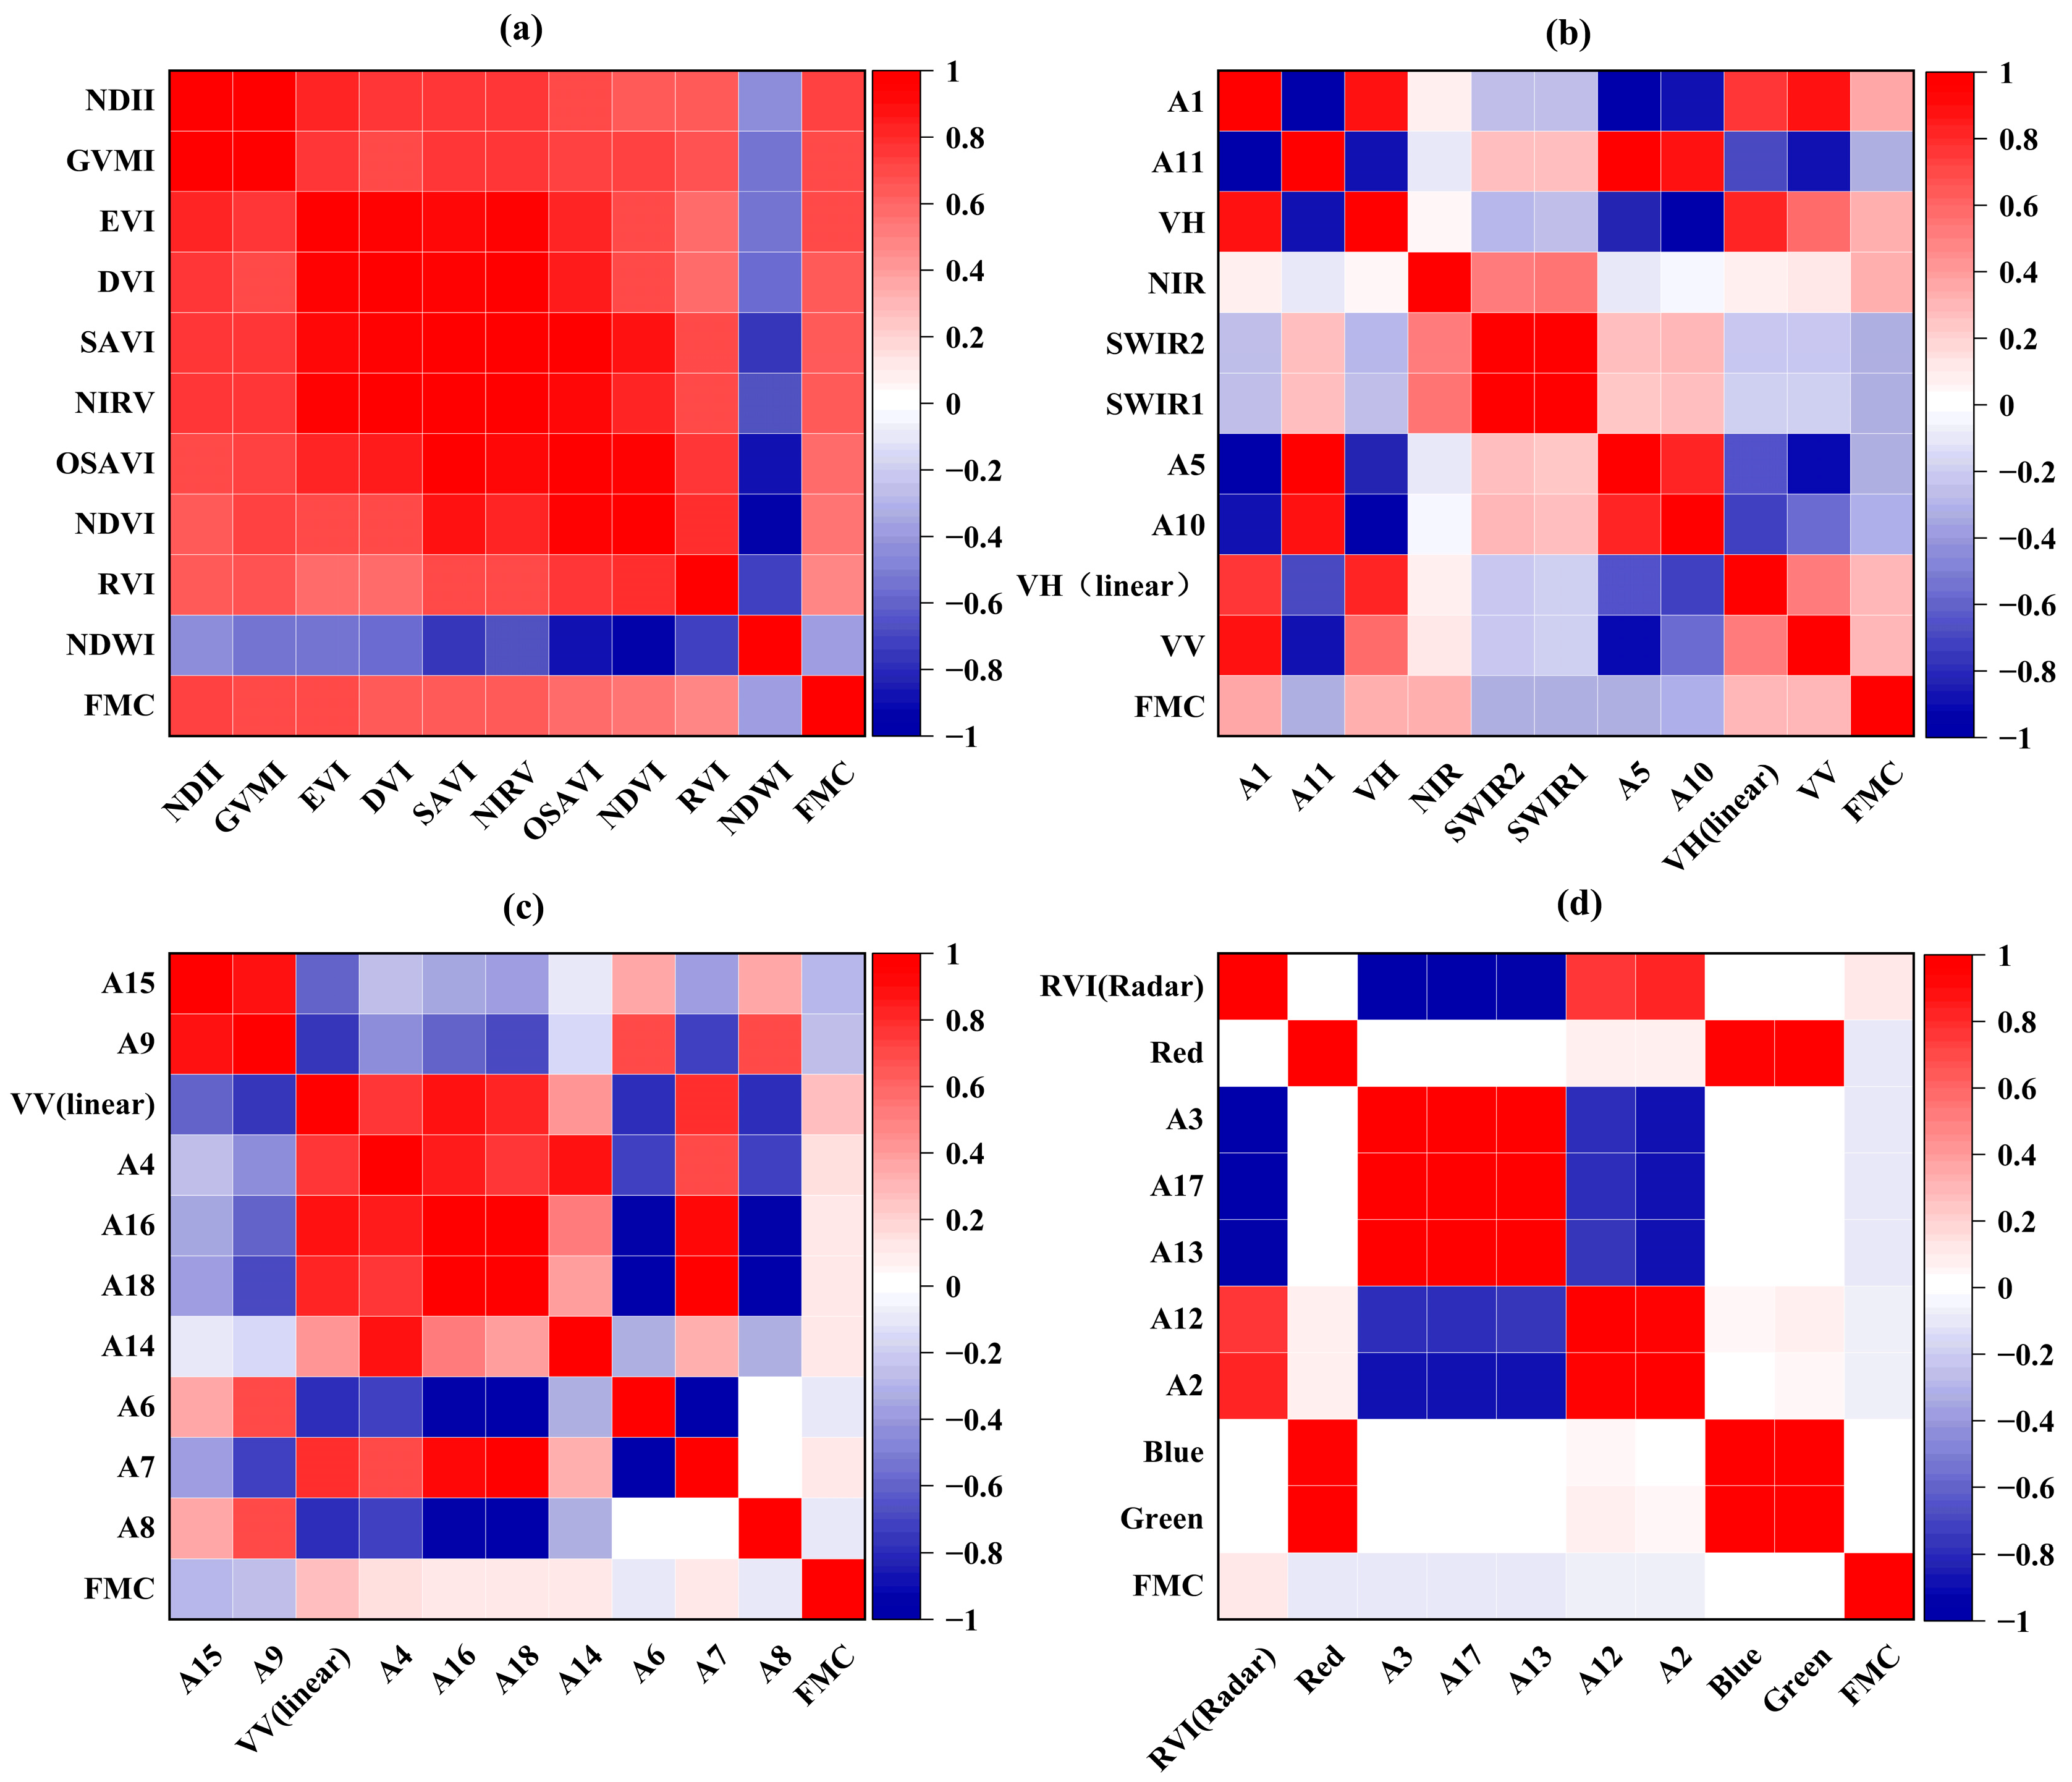
To facilitate a more comprehensive comparison and analysis of the impact of specific optical and SAR features on FMC, a heatmap was constructed based on the absolute values of the Pearson correlation coefficients, sorted in descending order. As illustrated in Figure 3, Figure 3a displays the top 1st–10th feature variables in terms of correlation strength, Figure 3b presents the 11th–20th, Figure 3c illustrates the 21st–30th, and Figure 3d encompasses the remaining 9 features.
The results demonstrate that vegetation indices generally display a strong correlation with FMC. Among all the evaluated features, NDII exhibits the highest correlation coefficient, reaching 0.74. Even the vegetation index with the weakest correlation, NDWI, maintains a relatively high absolute correlation value of 0.37. However, it is important to note that certain optical bands show low correlation with FMC. Specifically, the Blue and Green bands yield the lowest correlation coefficients among all features, at 0.04 and 0.01, respectively, indicating a minimal sensitivity to variations in FMC.
Among SAR features, the backscatter coefficients σVV and σVH exhibit stronger correlations compared to the original VV and VH backscatter intensities. Combined features such as A1 (σVV + σVH) and A11 ((σVV + σVH)2) demonstrate superior performance relative to the individual components σVV and σVH. In contrast, combinations such as A2 (σVVσVH) and A12 ((σVVσVH)2) yield significantly lower correlation values, with absolute values of only 0.07 and 0.08, respectively.
In conclusion, given the significant variability in the impact of remote sensing features on forest FMC, performing correlation analysis on feature variables derived from multiple data sources can provide more effective guidance for subsequent experimental design. Therefore, a more rigorous feature selection process is necessary to identify the most suitable input features for predicting forest FMC.

3.2. Construction of Feature Set

To ensure the accuracy of forest FMC prediction, this study employs a forward feature selection method to determine the optimal feature set for model input. The sensitivity of optical and SAR remote sensing features to FMC is assessed using the Pearson correlation coefficient. Subsequently, all remote sensing features are ranked in descending order based on the absolute value of their Pearson correlation coefficients. A cumulative forward feature selection approach is then applied, incrementally adding one feature variable at a time to the FMC estimation model, following the descending order of importance. With the relative root mean square error (rRMSE) serving as the accuracy metric, the trend in model accuracy as a function of the number of features is analyzed. Each newly added feature’s impact on reducing the error relative to the current model is evaluated. The feature combination yielding the highest accuracy during the selection process is identified as the optimal feature set for each model [35,38]. The detailed procedure is illustrated in Figure 4.

3.3. Development of Forest FMC Model

The Transformer-GRU fusion model proposed in this paper employs a multi-level cascaded architecture, primarily consisting of a Transformer-based feature encoding layer, a Dropout regularization layer, a GRU-based temporal modeling layer, and a fully connected output layer. As depicted in Figure 5, the input data first undergoes dimensionality reduction in the feature space and fusion of high-order features via the attention mechanism within the Transformer layer. Subsequently, the Dropout layer randomly masks neuron nodes to mitigate overfitting. The data is then fed into the GRU layer, where its gating mechanism captures the dynamic evolution characteristics of sequence data. Finally, the fully connected layer performs a linear transformation to map the features onto the target space, thereby generating a one-dimensional prediction result.
Transformer also demonstrates outstanding performance in addressing sequence-to-sequence tasks. As a vegetation parameter that is highly sensitive to external factors, forest FMC exhibits certain variation characteristics across time scales. For the input feature sequences, Transformer can effectively capture the relationships among these features. It is well-suited for extracting complex and high-dimensional remote sensing features, which contributes to enhancing the accuracy of forest FMC estimation. In contrast to traditional Recurrent Neural Networks (RNNs) and Convolutional Neural Networks (CNNs), the Transformer model does not incorporate the recurrent or convolutional structures found in these classical architectures. Instead, it is based on a self-attention mechanism and employs an Encoder–Decoder framework composed of separate Encoder and Decoder modules. Its unique positional encoding mechanism assigns a positional vector (Positional Encoding, PE) to each feature element input into the model. These vectors record the specific positions of the input features or data within the model, thereby endowing the elements in the Transformer’s feature sequence with positional information [24]. Additionally, by incorporating the multi-headed self-attention mechanism (Multi-Headed Attention), the model can analyze the associations among input feature sequences from multiple perspectives and dimensions. This enables the model to comprehensively learn and extract remote sensing features for forest FMC inversion, thereby improving the accuracy of the forest FMC inversion model. In each Encoder–Decoder structure of the Transformer network, the multi-headed self-attention mechanism first computes the dot product of the query (Query) and the key (Key) to obtain the attention score vector (weight value) of the input feature sequence. Subsequently, it multiplies the calculated weight values with the corresponding values in the tuple and sums them up to derive the self-attention vector. The calculation process can be expressed as follows:
A t t e n t i o n ( Q u e r y , K e y , V a l u e ) = s o f t m a x ( Q K T d k ) V
h e a d i = A t t e n t i o n ( Q W i Q , K W i K , V W i V )
M u l t i H e a d ( Q , K , V ) = c o n c a t ( h e a d 1 , h e a d 2 , , h e a d h ) W O
Among them, Query, Key, and Value denote the data vectors of the input sequence. W i Q , W i K , W i V , W O represent weight matrices, while headi signifies the score vector of the i-th attention head. In this process, it is essential to compute the attention score vectors for multiple heads within the mechanism, concatenate these components, and subsequently reduce the dimensionality of the concatenated self-attention vector.
GRU is an advanced variant of the RNNs, designed to mitigate the challenges associated with long-term dependency learning and gradient vanishing in traditional RNNs [39]. Compared to LSTM, GRU enhances training efficiency by simplifying the gating structure and integrating the forget gate and input gate into a single update gate. This structural modification substantially reduces parameter complexity without compromising model performance. While both architectures demonstrate similar predictive accuracy across a wide range of sequence modeling tasks, GRU generally exhibits superior convergence behavior during training [39]. The network structure of GRU incorporates two key components: the reset gate and the update gate, which enhance its ability to model time series relationships within the input data [40]. Their specific functions are as follows: The reset gate integrates the current input information with legacy information from the preceding time step, thereby determining the relevant information to be included in the candidate hidden state at the current time step. This mechanism enables GRU to effectively capture the medium- and short-term characteristics of the time series. The update gate evaluates and selects pertinent characteristic information from the previous hidden state, incorporating it into the current hidden state. Consequently, it dynamically adjusts the extent to which future information is integrated based on the structural requirements of the model. A larger value of the update gate indicates a higher degree of information transmission, thus ensuring a more stable representation of the medium- and long-term dependencies in the time series.
Therefore, the hybrid architecture combining Transformer and GRU can effectively harness the complementary strengths of both models in global feature extraction and local temporal sequence modeling. This facilitates a more precise elucidation of the complex mapping relationship between remote sensing features and forest FMC, thereby enabling more accurate estimation. To validate the efficacy of the proposed method, this study conducted a comparative analysis using a standalone Transformer model, a standalone GRU model, as well as RF and SVR model. The rationale for selecting these models is twofold: first, a single Transformer model and a single GRU constitute the two primary components of the proposed architecture in this paper; second, RF and SVR, as classical machine learning models, have demonstrated consistently strong performance in a variety of prediction tasks.

3.4. FMC Model Validation

In the model validation stage, this study randomly sampled data from a total of 1101 ground-measured datasets within the study area and partitioned them into a training set and a testing set at an approximate ratio of 7:3. To scientifically assess the performance of the regression model, multiple statistical indicators were introduced, including the coefficient of determination (R2), mean absolute error (MAE, unit: %), root mean square error (RMSE, unit: %), and relative root mean square error (rRMSE, unit: %). These metrics were utilized to quantitatively analyze the accuracy and generalization capability of the model’s prediction outcomes. The corresponding calculation formulas are as follows:
R 2 = 1 i = 1 n y i y ^ i 2 i = 1 n y i y ¯ 2
M A E = i = 1 n y i y ^ i n
R M S E = i = 1 n y i y ^ i 2 n
r R M S E = n 1 i = 1 n y i y ^ i 2 y ¯
Among them, y i represents the measured value of forest FMC, y ^ i denotes the predicted value of forest FMC, y ¯ corresponds to the average value of the measured values of forest FMC, and n indicates the sample size.

4. Results

4.1. Model Performance Using Different Feature Groups in FMC Prediction

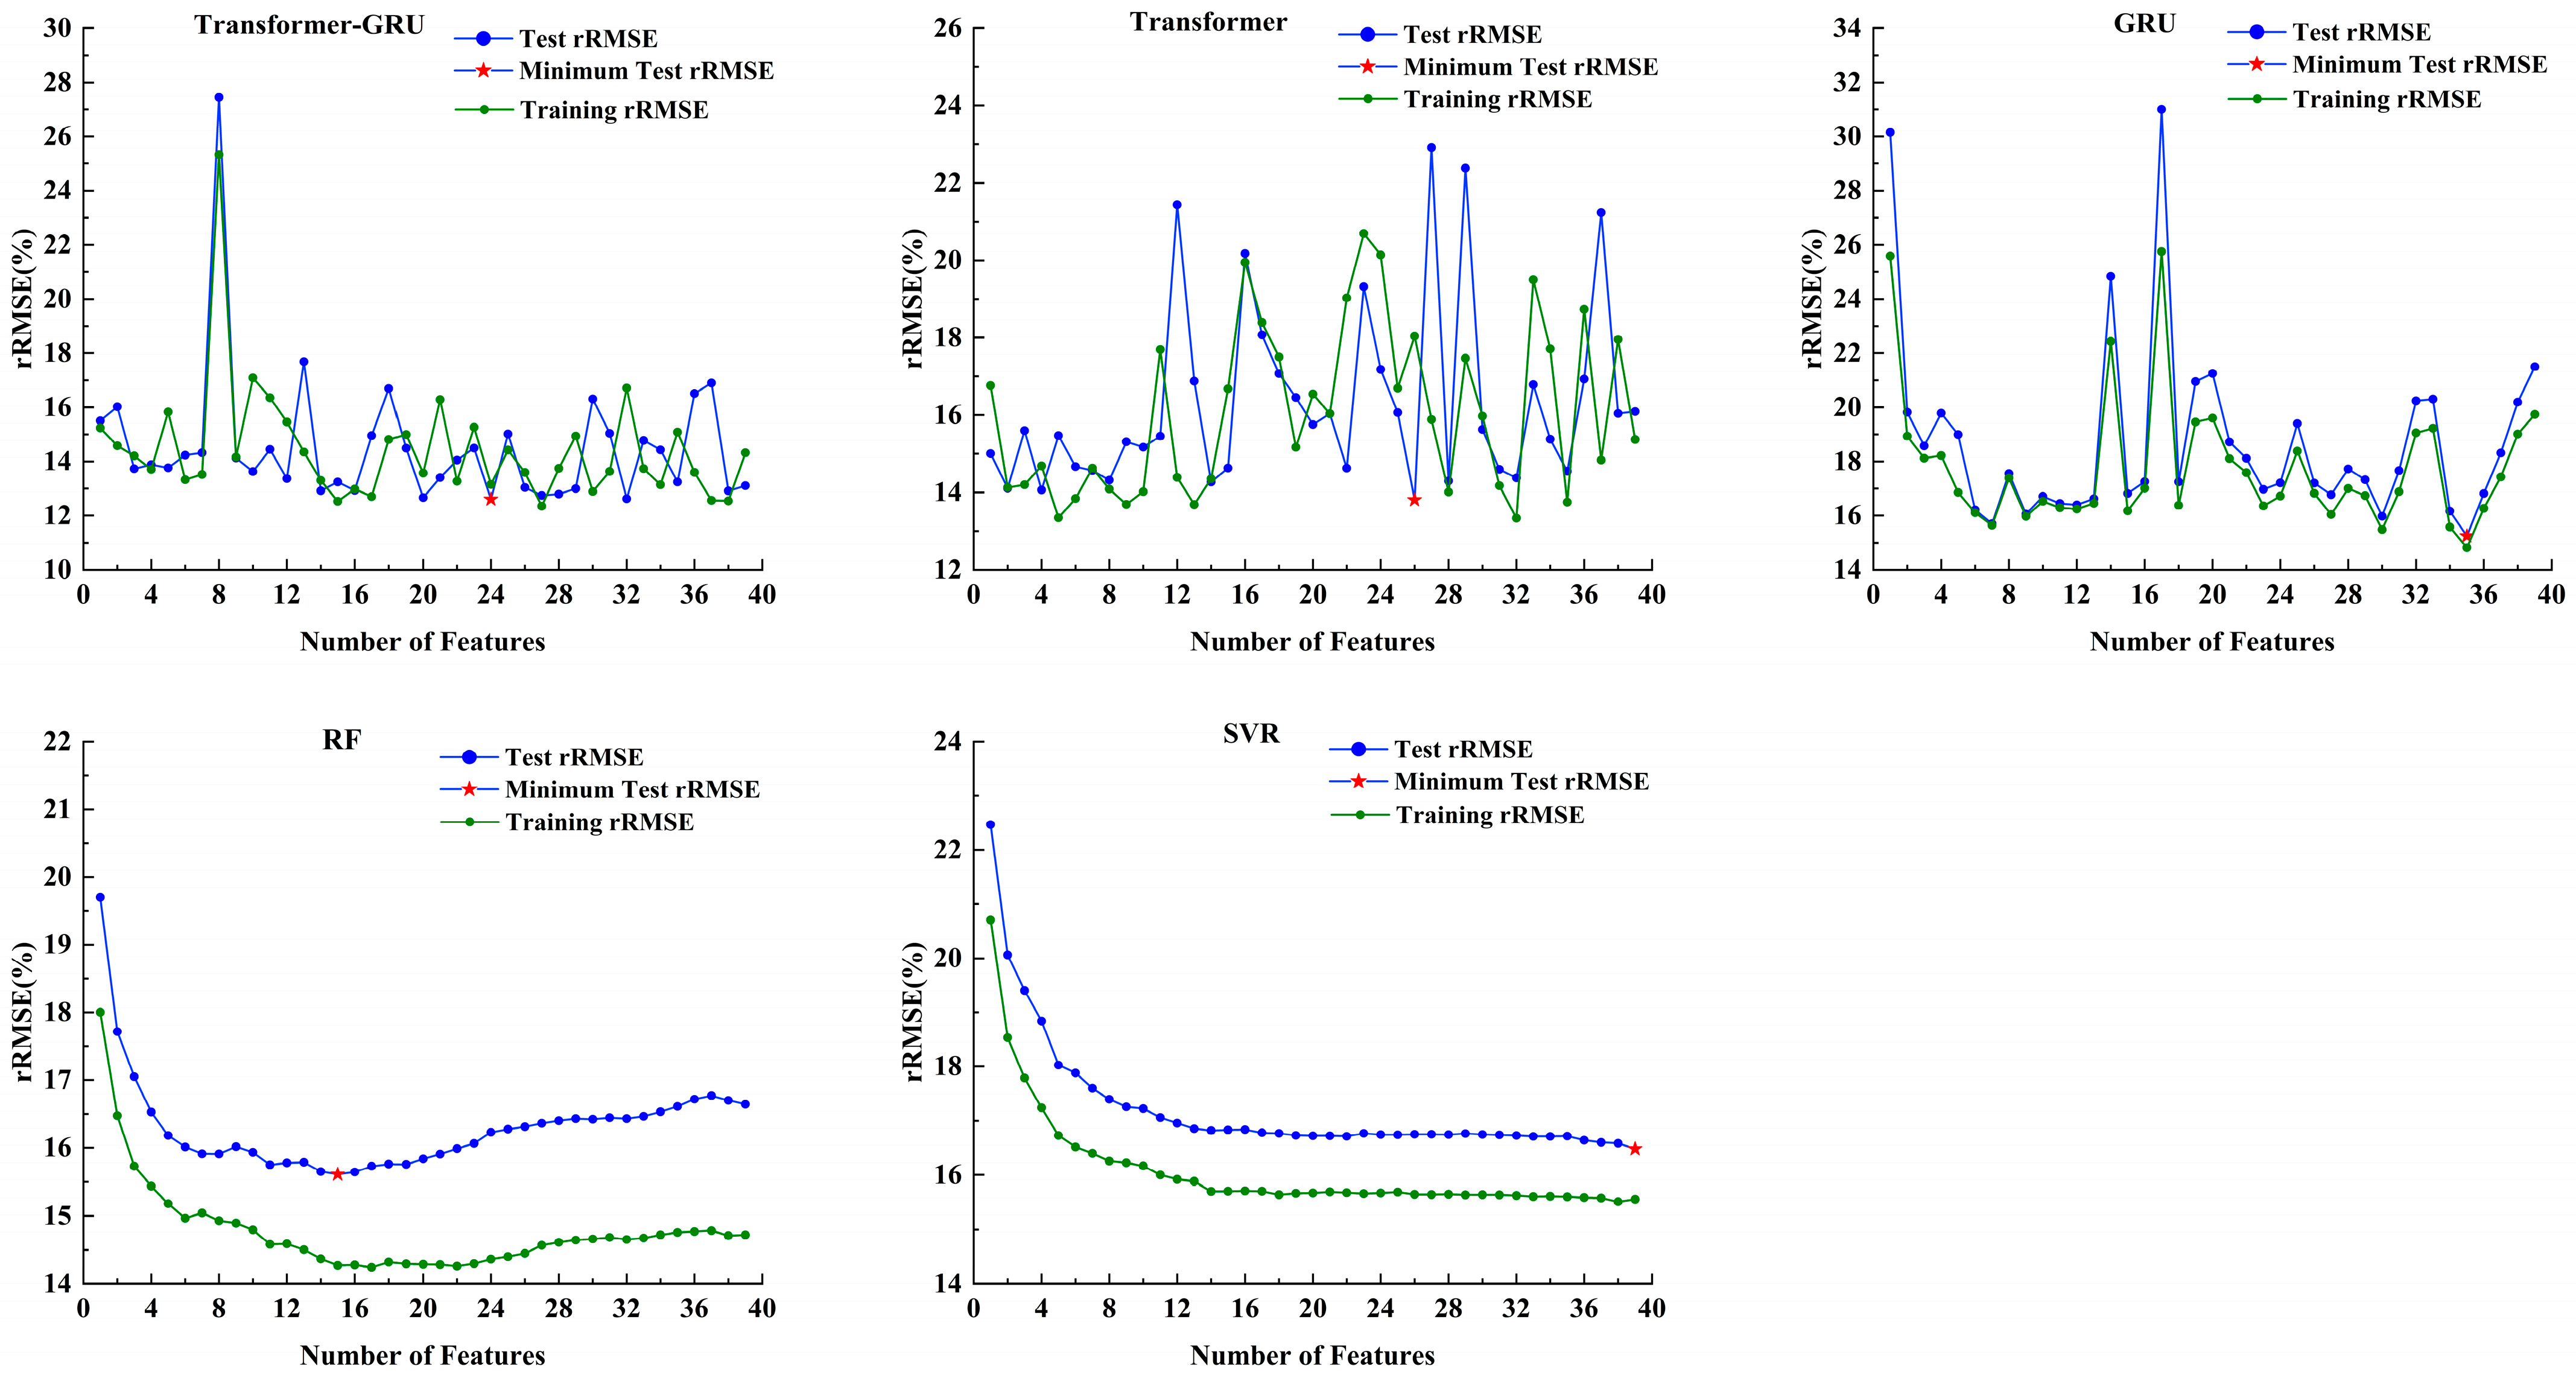
Based on the forward feature selection method described in Section 3.2, this study constructs forest FMC estimation models using SVR, RF, GRU, Transformer, and a hybrid Transformer-GRU algorithm. The feature variables were introduced into the models sequentially, in descending order of their absolute correlation coefficients with FMC. The evolution of model accuracy with respect to the number of selected features was systematically examined. Figure 6 illustrates the variation trends of rRMSE on both the training and test datasets across the five models under different feature subset sizes. This analysis aims to assess the generalization performance, stability, and sensitivity to feature selection of each model, and to identify the most effective feature subset.
The results indicate that all five models display consistent rRMSE trends across both training and test sets, with no notable divergence detected. This uniformity suggests that the models are not prone to overfitting and demonstrate strong generalization performance across different feature set sizes. Moreover, the comparable behavior observed between the two datasets underscores the robustness of the modeling approach and confirms the efficacy of the forward feature selection method employed.
The subsequent analysis is derived from the rRMSE results obtained from the test set. For the SVR model, when the number of features ranges from 1 to 9, rRMSE exhibits a rapid decline. Subsequently, rRMSE generally decreases at a slower rate. When the number of features reaches its maximum of 39, the lowest rRMSE value of 16.4782% across all feature sets is achieved. The RF model shows behavior similar to the SVR model, with rRMSE decreasing rapidly during the early stages of forward feature selection. At 15 features, the model achieves its optimal performance with an rRMSE of 15.61%. Thereafter, as additional feature variables are included, rRMSE gradually increases. For the GRU model, significant fluctuations are observed when the number of feature combinations equals 14 and 17, resulting in rRMSE values of 31.00% and 24.84%, respectively. The lowest error occurs when the 35th variable is introduced, yielding a relative root mean square error of 15.25%. Analyzing the Transformer model comprehensively, when the number of input features varies between 12 and 37, multiple significant fluctuations are observed. This indicates that the model exhibits high sensitivity to variations in the number of features. Specifically, when the number of features is 26, the rRMSE achieves its minimum value at 13.81%, representing a reduction of 9.11% compared to the maximum value, thereby demonstrating an evident error control effect. The Transformer-GRU model integrates the strengths of both preceding models. Its average rRMSE across all feature combinations is the lowest among the four models, suggesting that the Transformer-GRU model is the least susceptible to perturbations in the number of features. Notably, when the number of features reaches 24, the rRMSE decreases to 12.60%, which represents the lowest rRMSE value among all feature combinations for the five models under consideration.

4.2. Model Performance Using Different Methods in FMC Prediction

From the analysis of the overall performance of the models, the evaluation metrics R2, MAE, RMSE, and rRMSE were utilized to comprehensively assess the inversion accuracy of the models. For each model, the indicators of the three groups of feature combinations with the lowest rRMSE were selected for comparative analysis. The results are presented in Table 4. The bold numbers in Table 4 indicate the optimal values of the corresponding metrics.
It is evident that when the SVR model has 39 feature sets, all performance indicators achieve their optimal values among all combinations of this model (R2 = 0.63, MAE = 11.25%, RMSE = 14.95%, rRMSE = 16.48%). For the RF model, the best performance is achieved when the number of input features is 15 (R2 = 0.67, MAE = 10.42%, RMSE = 14.16%, rRMSE = 15.61%). In the case of the GRU model, all four indicators reach their peak performance when the number of input features is 35 (R2 = 0.69, MAE = 10.44%, RMSE = 13.83%, rRMSE = 15.25%). However, for the Transformer model (R2 = 0.74, MAE = 9.37%, RMSE = 12.53%, rRMSE = 13.81%) and the Transformer-GRU model (R2 = 0.79, MAE = 8.70%, RMSE = 11.44%, rRMSE = 12.60%), when the number of features is 26 and 24, respectively, the rRMSE reaches its lowest value, and both R2 and RMSE achieve their best values among all respective combinations. Nevertheless, the MAE for these two models at this point is slightly higher than their minimum values. This discrepancy may arise because R2 and RMSE are more sensitive to extreme errors, whereas MAE is less influenced by such outliers. If there is a large proportion of samples with moderate errors, MAE becomes more significantly affected. Through a comprehensive evaluation of the goodness-of-fit and error control capabilities of these two models, it can be concluded that the feature combination yielding the best R2, RMSE, and rRMSE values, while maintaining an extremely small difference in MAE, represents the optimal feature set for the model. Overall, the proposed Transformer-GRU model demonstrates superior performance compared to the other four models, achieving the lowest error and providing more accurate inversion results for forest FMC.
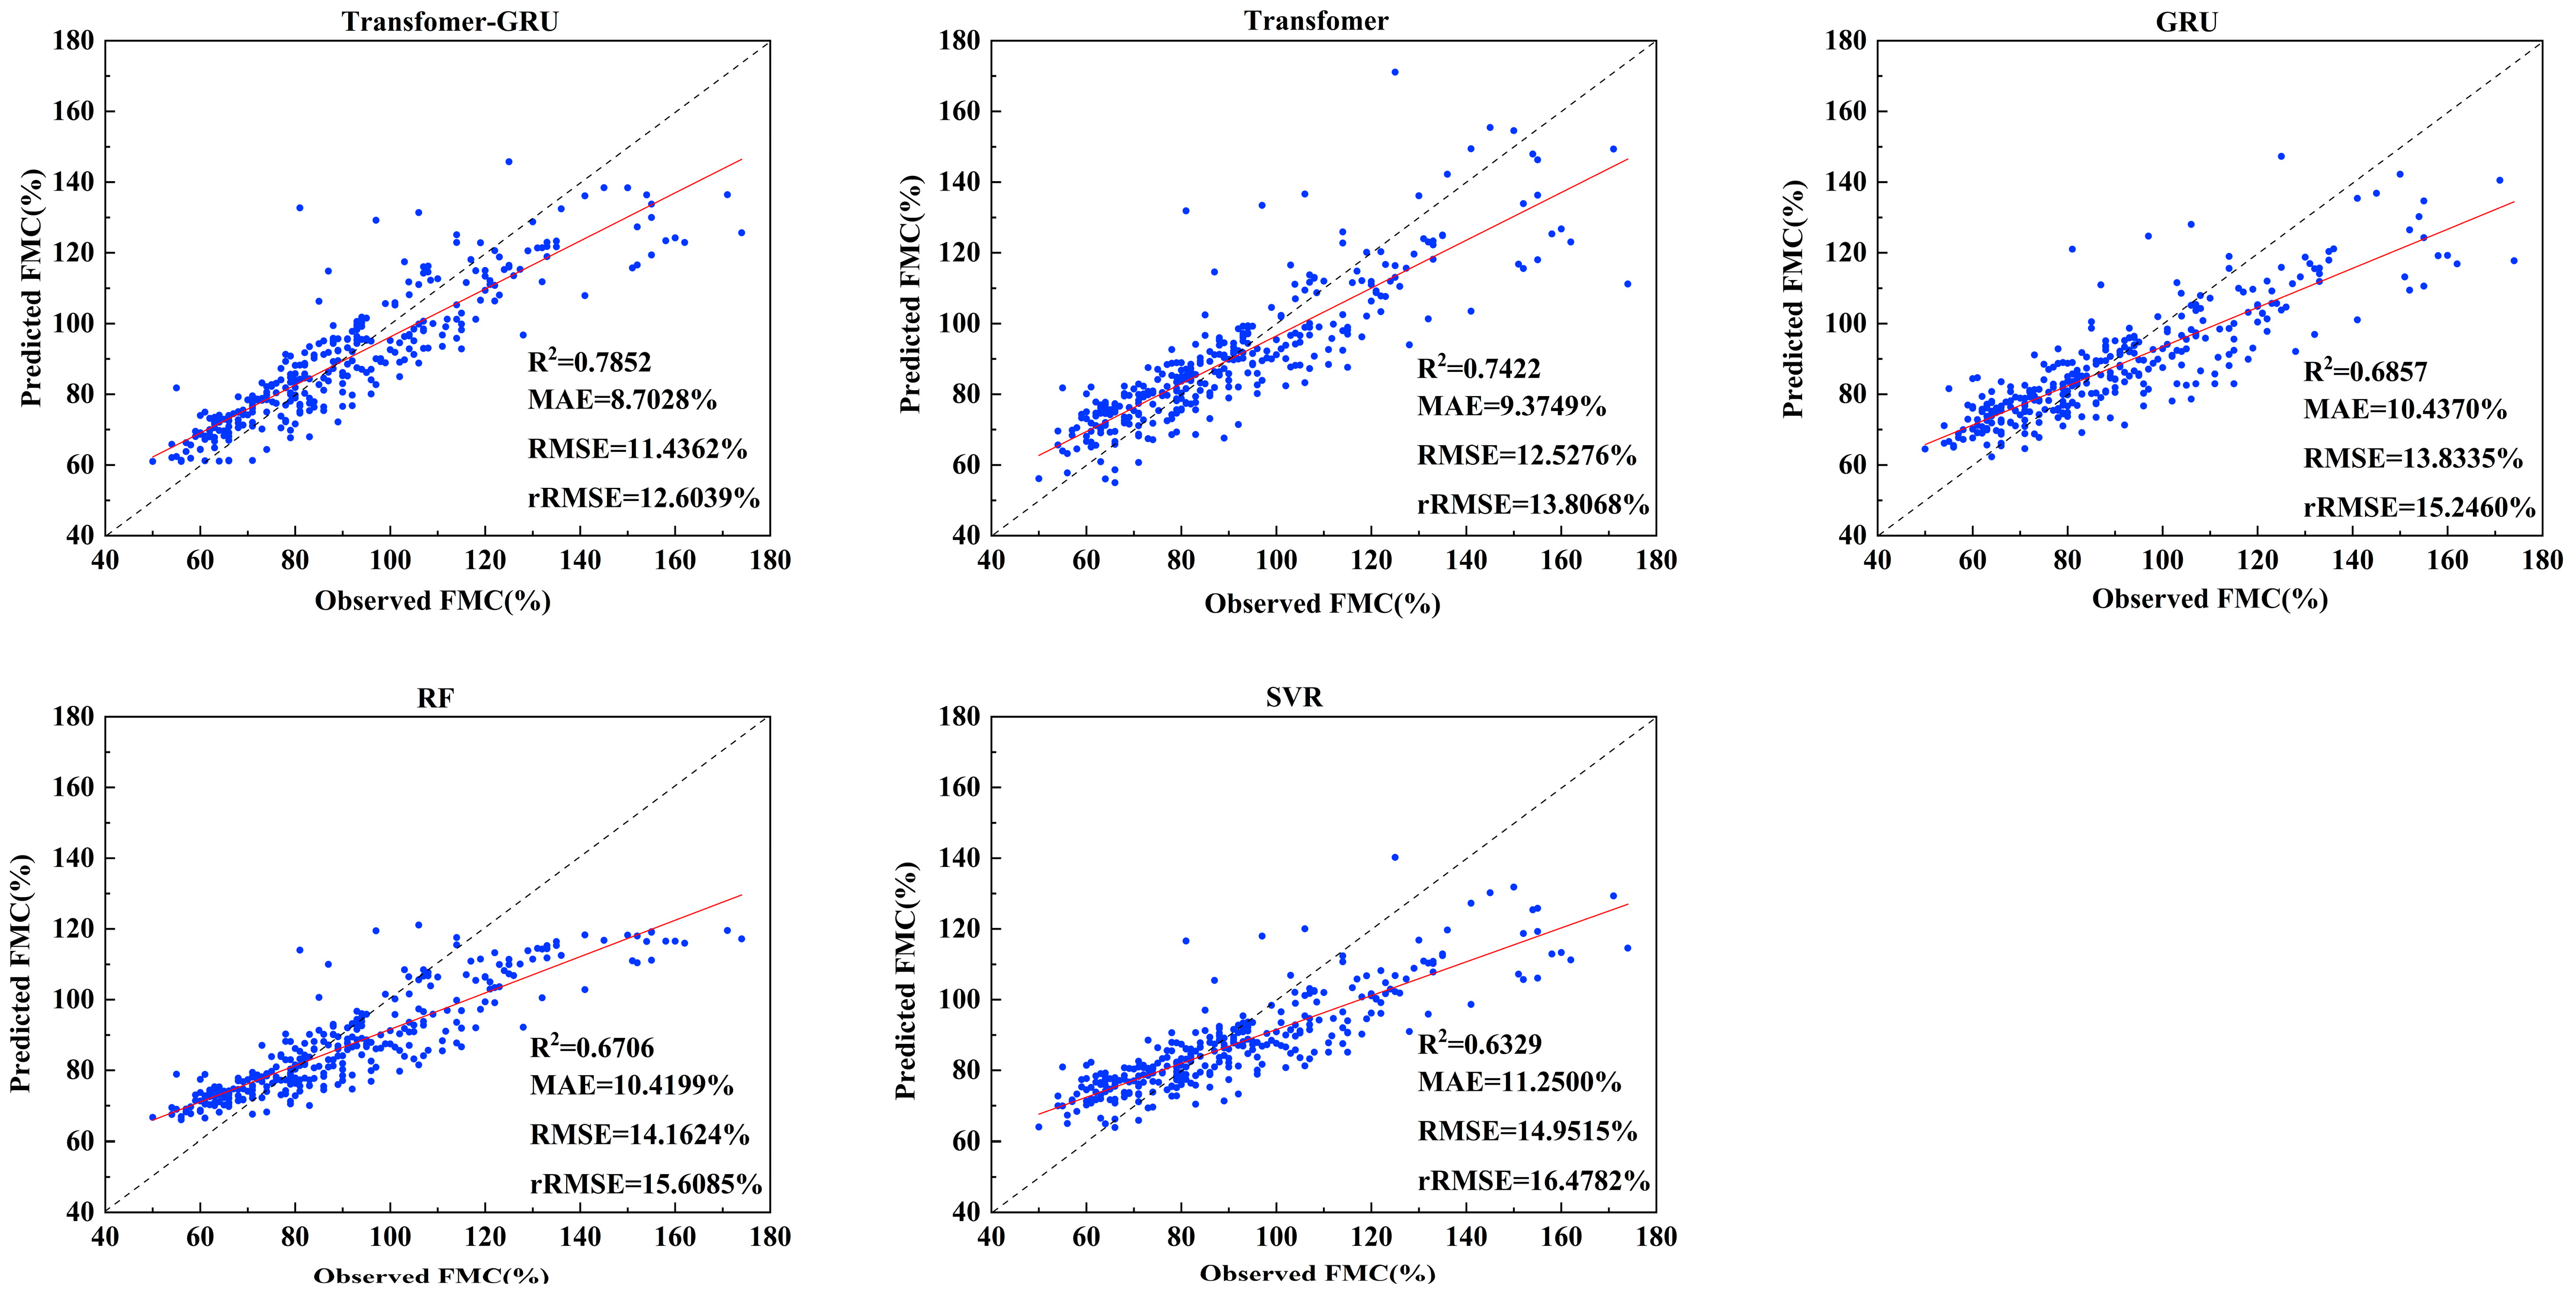
To facilitate a more intuitive understanding of the models’ performance, this paper generated scatter plots for each model under the optimal feature combination to depict the relationship between the predicted and measured values of FMC, as illustrated in Figure 7. The red solid line represents the fitting function of the model, while the black dashed line denotes the 1:1 correspondence between predicted and measured values. Most samples exhibit measured moisture content concentrated within the range of 60% to 120%. During the comparative analysis of multiple models, the Transformer-GRU model demonstrates superior fitting capability in predicting forest FMC. Its prediction results exhibit high consistency with the measured values, and most sample points yield small prediction errors, resulting in an overall fitting effect that surpasses other models. In contrast, the Transformer model performs only slightly less effectively than the Transformer-GRU model. While it achieves satisfactory fitting at certain sample points, noticeable deviations occur in estimating the high and low value intervals of FMC, which compromises its overall prediction performance.
The Transformer-GRU model exhibits certain overestimation and underestimation phenomena during the prediction process. Nevertheless, its error margin remains relatively small, and the overall fitting accuracy surpasses that of the single Transformer model. The single GRU model demonstrates slightly superior prediction performance compared to the two traditional machine learning methods, SVR and RF. When the FMC is within the range of 80% to 130%, the prediction results of the SVR and RF models deviate considerably from the actual observed values, indicating their limitations in capturing the variation characteristics of forest fuel moisture content. A comprehensive analysis reveals significant differences in the estimation accuracy among these five models. Among them, the Transformer-GRU model exhibits superior predictive capability, further underscoring its potential and advantages for the forest FMC inversion task.

4.3. Statistical Significance Test of Model Performance

Although the performance metrics presented in Section 4.2 (i.e., R2, MAE, RMSE, and rRMSE) provide a comprehensive evaluation of model accuracy and prediction error, they do not indicate whether the observed differences between models are statistically significant. To rigorously assess the significance of these differences, this section applies non-parametric statistical tests to the absolute prediction errors of the five models, based on their optimal feature configurations. Given that the test set comprises 330 instances, there are 330 paired absolute errors for each model.
Specifically, the Friedman test was utilized to determine whether there were statistically significant overall differences in the absolute prediction errors across the five models. The Friedman test is a non-parametric counterpart to repeated-measures ANOVA and is suitable for comparing multiple models across various datasets or test samples, particularly under the assumptions of non-normality and homogeneity of variances [41]. This test evaluates whether the rankings of model prediction errors differ significantly across repeated observations. In this study, each observation represented a test instance common to all five models. The test resulted in an overall p-value of 5.62 × 10⁻¹⁶, as presented in Table 5, indicating a highly significant difference among the models. Within the context of the Friedman test, the mean rank represents the average relative ranking of each model across all test instances, with lower values corresponding to superior overall performance. As shown in Table 5, the Transformer-GRU model obtained the lowest mean rank (2.54), indicating the best overall performance, whereas the SVR model exhibited the highest mean rank (3.55), reflecting the least favorable performance among the five models.
To further elucidate the specific performance differences among the models, the Wilcoxon signed-rank test was employed to conduct pairwise comparisons between the proposed Transformer-GRU model and each of the four baseline models. The Wilcoxon signed-rank test is a non-parametric statistical method that serves as an alternative to the paired t-test, particularly suitable for comparing two dependent samples when the assumption of normality is not met [41]. To account for the elevated risk of Type I error arising from multiple comparisons, the Bonferroni correction was employed [42]. The adjusted significance level was calculated as α/k, where α represents the original significance level (0.05) and k denotes the number of comparisons conducted (in this instance, 4), yielding a corrected threshold of 0.0125.
The results indicate that the Transformer-GRU model significantly outperformed each of the other four models, as evidenced by all Bonferroni-adjusted p-values falling below the corrected significance threshold of 0.0125 (see Table 6). These findings provide strong statistical support for the conclusion that the Transformer-GRU model achieves significantly lower prediction errors compared to the baseline models. Furthermore, the outcomes of the statistical analyses corroborate the performance differences reported in Section 4.2, thereby reinforcing the assertion that the Transformer-GRU model demonstrates superior predictive capability for forest FMC.

4.4. Spatiotemporal Distribution Pattern of Forest FMC Inversion

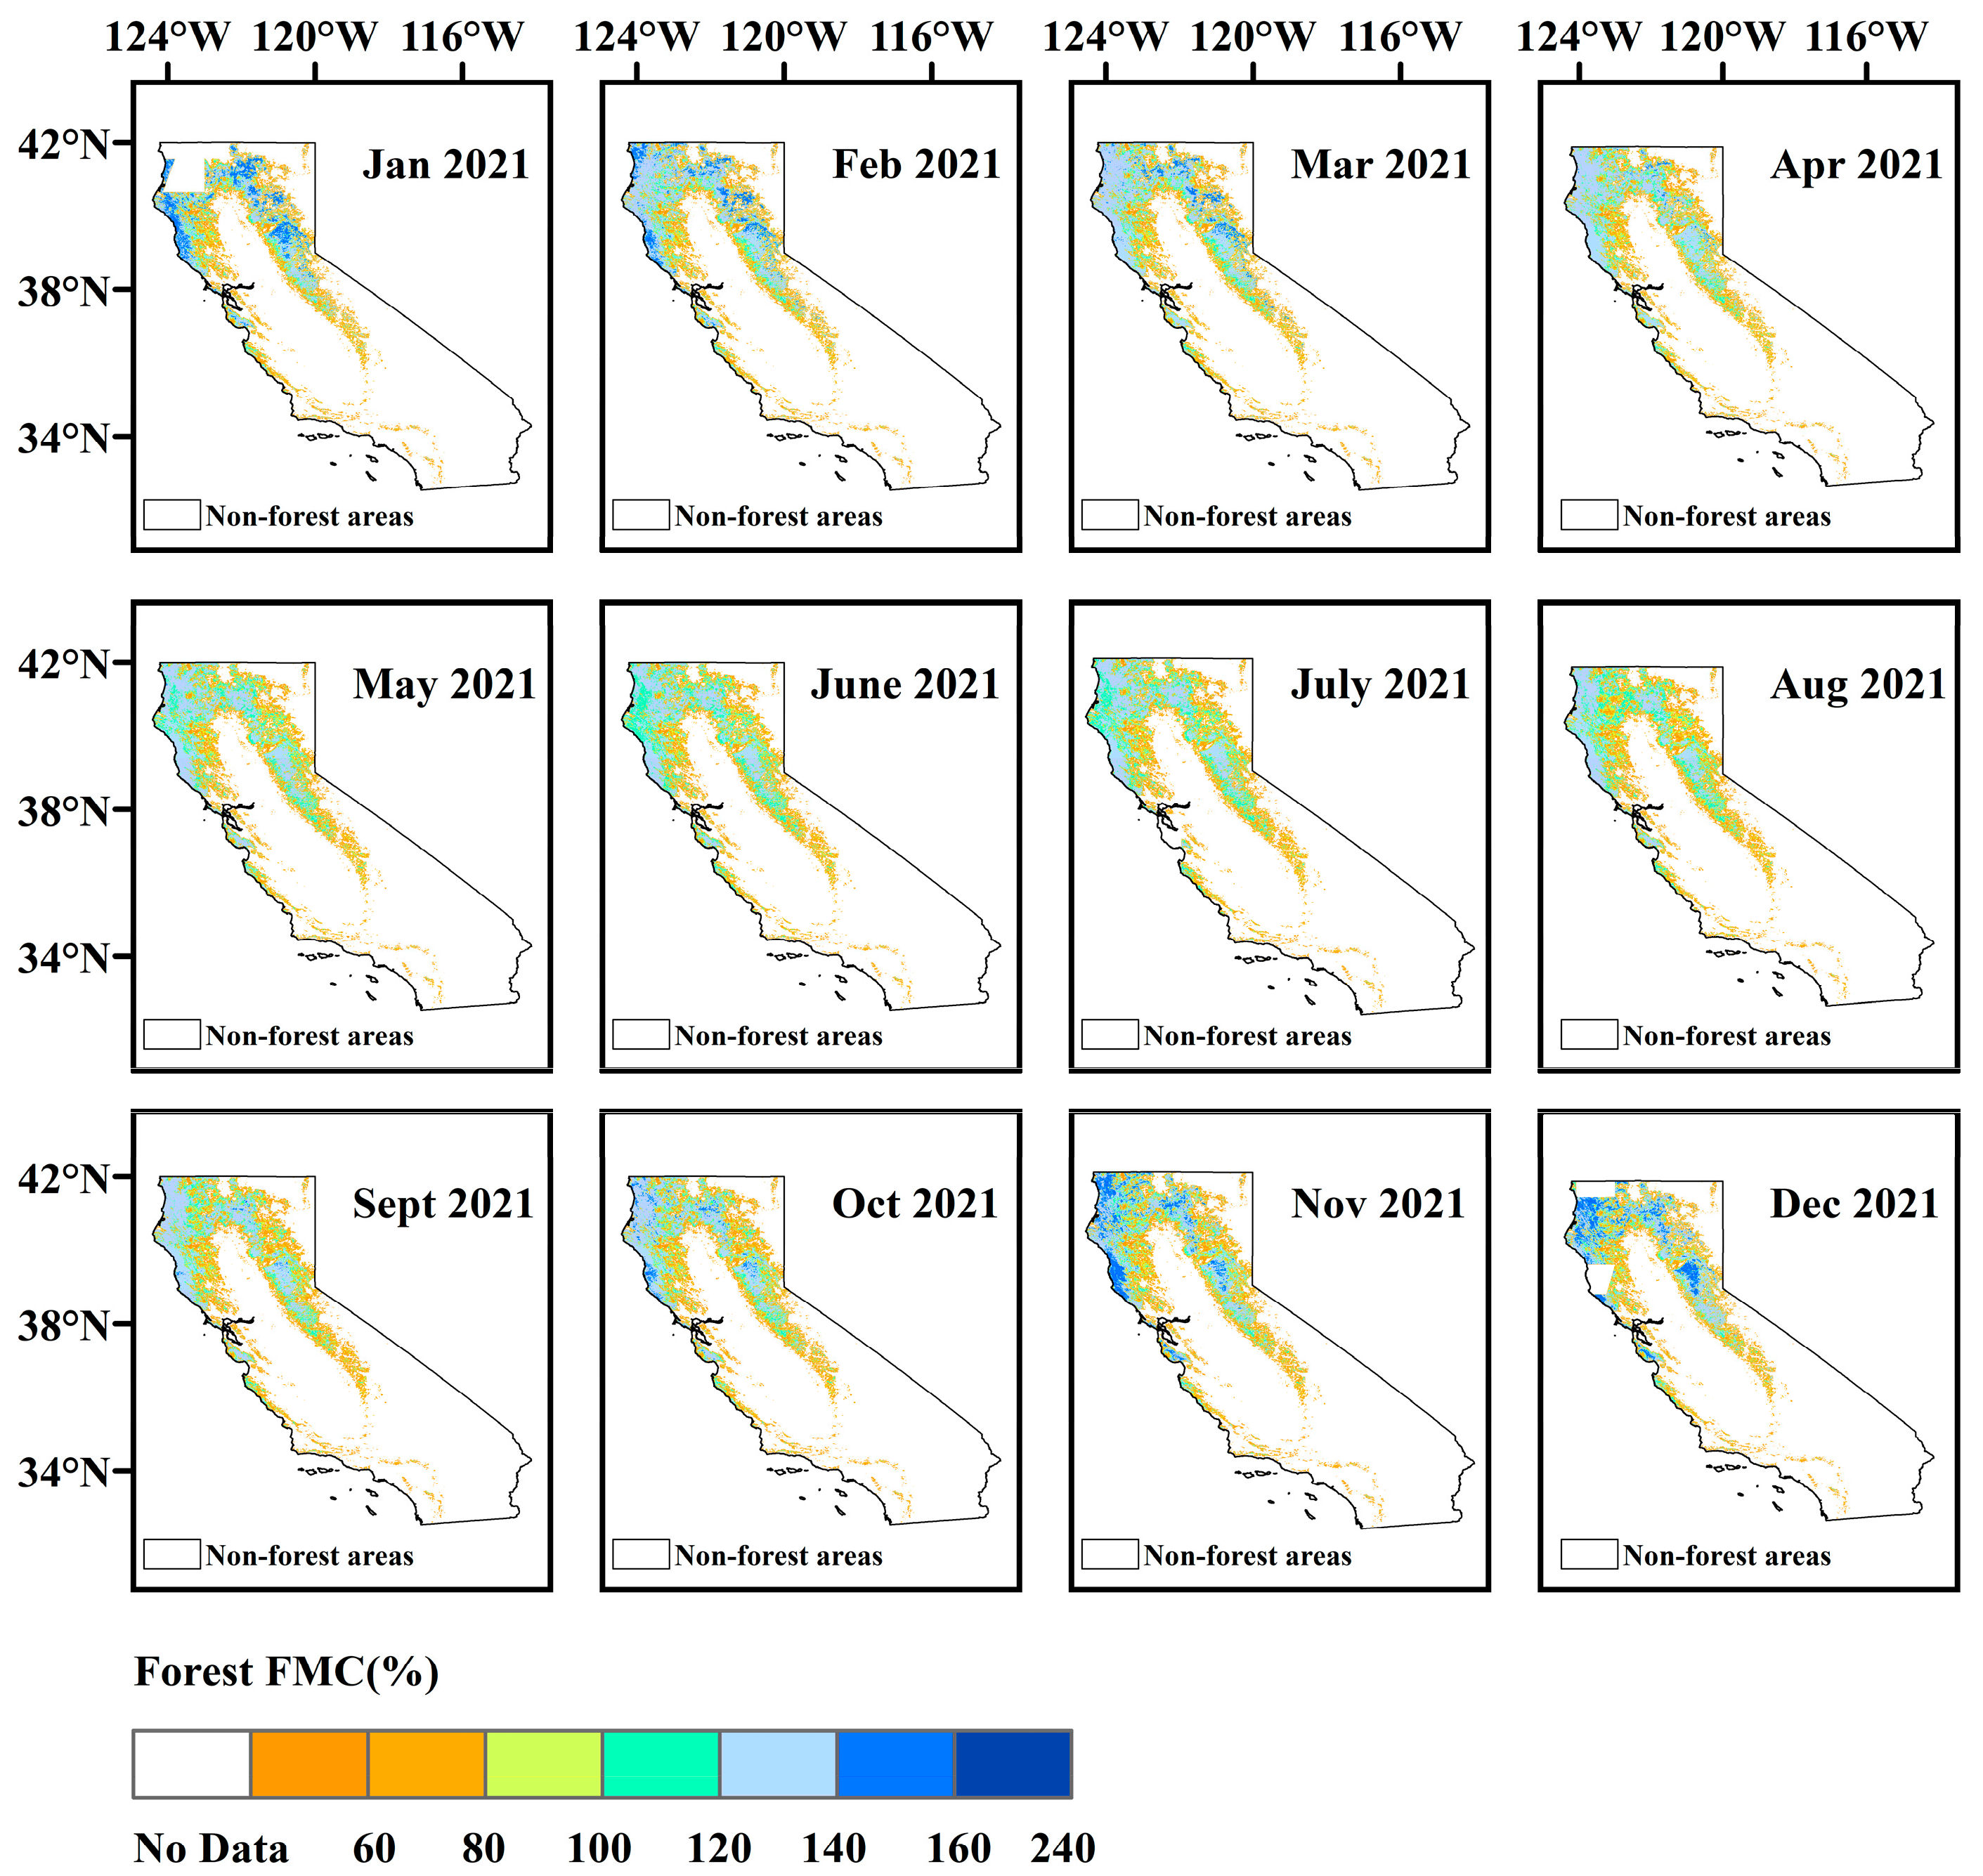
To further investigate the spatio-temporal variation patterns of forest fuel moisture content, this study employed a Transformer-GRU model to invert the forest FMC in California, which demonstrated superior performance compared to other models. The monthly spatio-temporal distribution patterns of forest FMC within the study area during fire-prone years are illustrated, as presented in Figure 8.
The spatial distribution pattern of forest FMC in the study area is well-defined. In northern California, forests are predominantly concentrated and exhibit a relatively high FMC value due to the region’s overall humidity. Conversely, southern California forests display lower FMC values with more scattered distributions. The following analysis elucidates the specific reasons for these patterns: Northern California hosts moisture-tolerant vegetation such as redwoods and oaks. Northwest forests benefit from humid air currents originating from the Pacific Ocean, leading to substantial annual precipitation and ensuring sufficient vegetation moisture. Northeastern forests lie within the transition zone between the Cascade Range and the Sierra Nevada, characterized by higher altitudes and abundant winter snowfall. Even during the summer when precipitation decreases, snowmelt sustains a relatively high FMC. Southwestern forests experience a Mediterranean climate, marked by mild, humid winters and extremely arid summers influenced by subtropical high-pressure systems that introduce dry, hot air, accelerating moisture evaporation and causing significant seasonal declines in FMC. Southeastern California falls within desert and arid/semi-arid climate zones, encompassing the Mojave Desert and the Colorado Desert. These regions endure extreme aridity and heat during the summer, resulting in sparse forest distribution [43,44,45,46].
Analyzed from the temporal dimension, the overall forest FMC in winter, as depicted in Figure 8, is relatively high, evidenced by the extensive dark blue areas (140%–240%) observed in January, November, and December. This phenomenon can be attributed to the fact that the majority of California’s annual precipitation occurs during the winter months. Adequate precipitation infiltrates the soil, thereby enhancing the water content within vegetation. Additionally, the lower temperatures characteristic of winter lead to reduced metabolic and transpiration rates in vegetation, minimizing water loss. These findings indicate that the inversion results align well with the actual variation patterns of local moisture content. Starting in March, there is a marked decline in moisture content. Upon entering summer, the fuel moisture content of combustible materials decreases sharply, reaching its lowest annual values in August. This is primarily due to the high temperatures prevalent during California’s summer months, coupled with intense sunlight and an absence of effective precipitation for several consecutive months, resulting in soil and vegetation desiccation and a consequent drop in FMC to potentially hazardous levels [47,48].
To assess the spatial distribution of prediction errors generated by the model, this study computed the residuals between observed and predicted values from the Transformer-GRU model at stations located in California’s forest regions where observational data were available. These residuals were calculated for each month in 2021, and spatial residual maps were subsequently generated and presented in Figure 9.
From a spatial perspective, the inland and mountainous areas of Northern California typically display small positive residuals, indicating that while the model slightly underestimates FMC in these regions, the predictions are still within an acceptable range. In contrast, the central coastal region consistently exhibits negative residuals (depicted in red and orange) across several months, suggesting a tendency of the model to overestimate FMC in this area.
The temporal analysis reveals that during winter, FMC residuals are primarily represented by dark blue and light blue colors, indicating that the observed FMC values generally exceed model predictions. This suggests that the model underestimates moisture conditions during this season. In spring, the increased occurrence of orange and red points indicates a tendency for the model to overestimate FMC. During summer, the expansion of dark blue areas reflects a more pronounced underestimation of FMC by the model. In autumn, while most regions exhibit smaller residuals, there are still scattered instances of overestimation (red points), particularly evident in the central coastal regions.

5. Discussion

5.1. Multi-Source Remote Sensing Data and Deep Learning in Forest FMC Inversion

In the context of remote sensing feature selection, among the 39 remote sensing features considered, the number of features at which the Transformer-GRU, Transformer, GRU, RF, and SVR models achieve their optimal performance are 24, 26, 35, 15, and 39, respectively. The results demonstrate that all models in this study effectively utilize the majority of the remote sensing features, suggesting that multi-source remote sensing provides valuable information for forest FMC inversion. Determining the optimal feature set for each model via forward feature screening can enhance the accuracy of remote sensing-based forest parameter inversion, which is largely consistent with the findings reported in Ye et al. [35]. However, the results also indicate that for both machine learning and deep learning models, incorporating a larger number of remote sensing features does not necessarily lead to better performance. Excessively high-dimensional feature sets may introduce substantial redundant information, potentially causing overfitting during model training or significant deviations in prediction outcomes [29]. Therefore, in the process of fusing multi-source remote sensing data, it is essential to further investigate and develop efficient and generalizable feature selection strategies to improve the accuracy and generalization capability of forest FMC estimation models.
In the context of the inversion model, the Transformer-GRU model demonstrates superior performance compared to the other four models. Among the top three feature sets ranked by accuracy, its average R2 score reaches 0.78, the MAE is 8.73%, the RMSE is 11.46%, and the rRMSE achieves 12.63%. The integration of Transformer and GRU fully leverages their strengths in global feature extraction and local temporal sequence modeling, thereby enabling more precise utilization of remote sensing features to characterize forest FMC. Additionally, the study reveals that deep learning models outperform two classical machine learning models in forest FMC inversion tasks. Regardless of whether it is the Transformer-GRU coupled model or single Transformer or GRU models, their evaluation metrics consistently surpass those of the RF and SVR models. This advantage may be attributed to the hierarchical neural network architecture of deep learning models, which allows for more comprehensive extraction of internal features and patterns from data. For the two traditional machine learning methods, the RF constructs multiple decision trees using random feature selection and resampling strategies. This approach has been validated as having robust modeling capabilities and stability in numerous studies [49]. However, RF exhibits limitations in regression tasks, primarily due to its discrete output nature, which hinders effective prediction of targets outside the range of the training set. In contrast, the SVR model demonstrates a weaker fitting performance compared to other models, potentially due to its high dependency on the kernel function [50]. When the mapping capability of the selected kernel function in high-dimensional space proves inadequate, the fitting performance of the model will be substantially constrained, consequently impacting its overall predictive efficacy.

5.2. Correlation Analysis Between Forest Fires and Inversion FMC

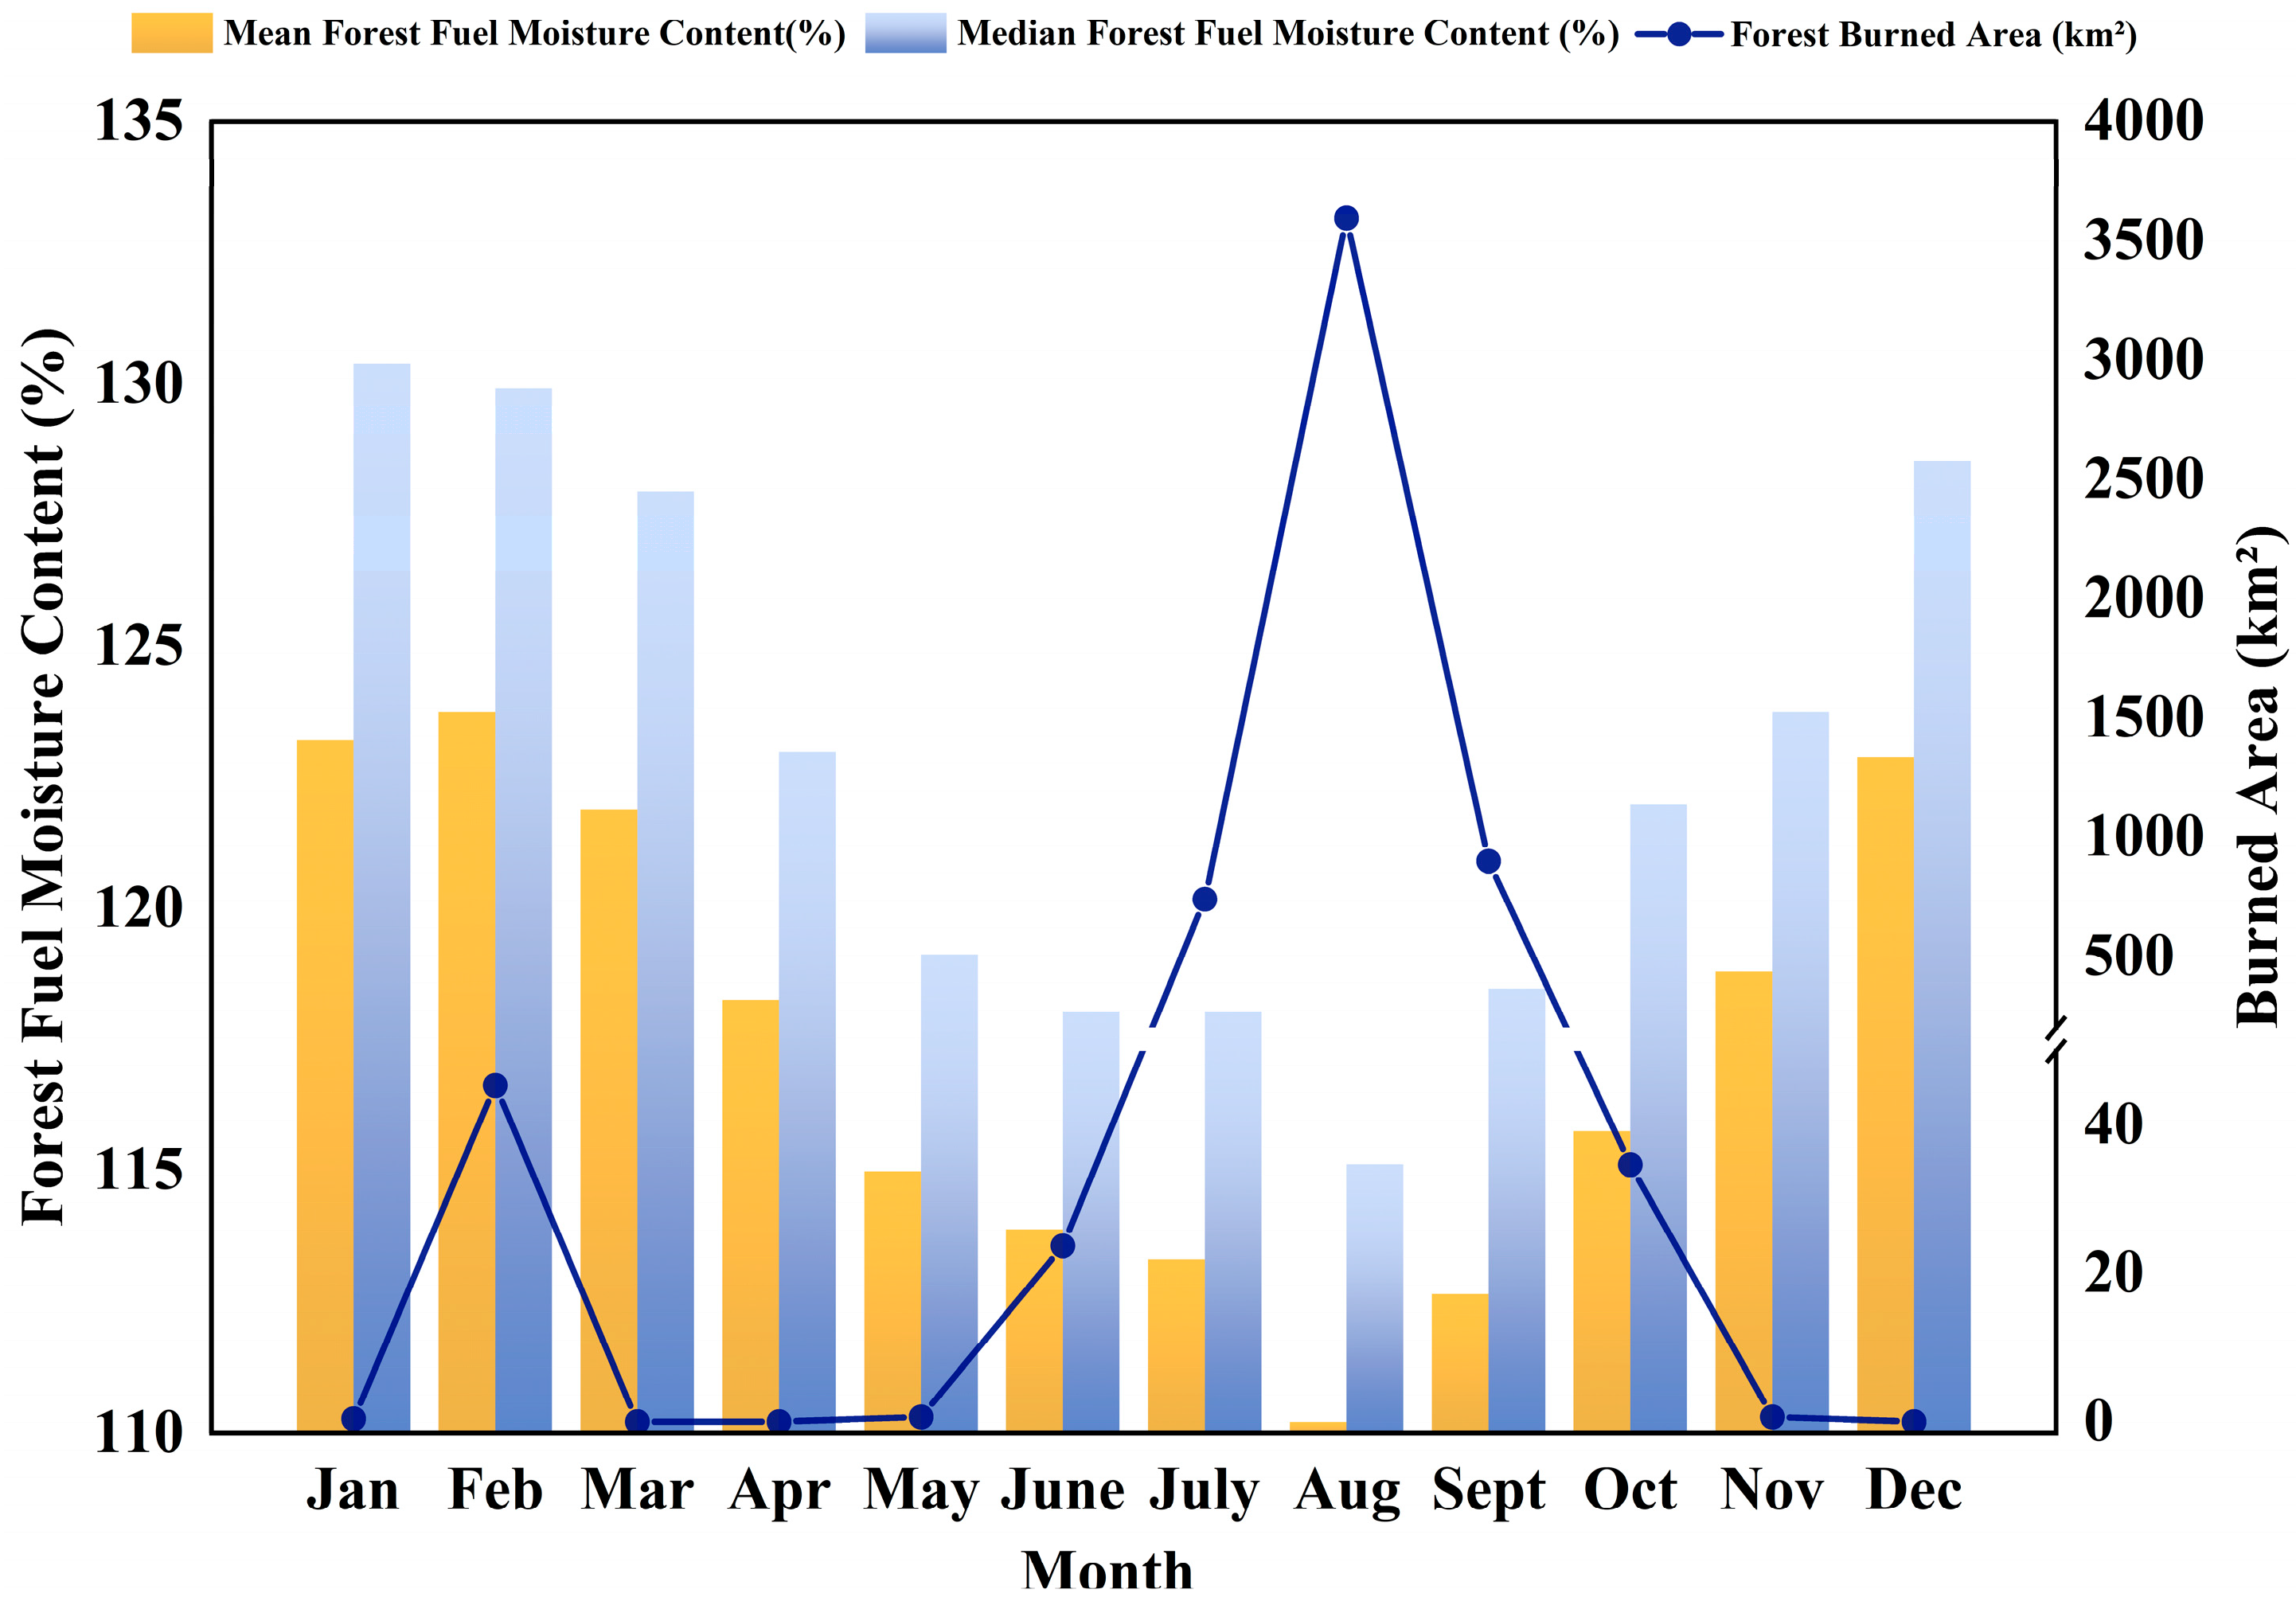
In recent years, large-scale forest fires have occurred with increasing frequency in California. The incidence of these fires is closely associated with the moisture content of forest fuels, presenting profound implications and significant challenges for fire prevention management, ecosystems, and climate policies. This study correlates and maps the spatio-temporal patterns of forest FMC in 2021, as retrieved by the Transformer-GRU model, with the forest fires that occurred during the same period, to explore the practical application value of predicted FMC. The results are presented in Figure 10. The monthly burned area within the study region was calculated by multiplying the monthly number of fire points from the MCD64A1.061 product data by the pixel size. The left y-axis indicates the monthly average and median values of forest fuel moisture content in California, while the right y-axis represents the burned area of forest fires for the corresponding month. Given that the burned area of forest fires remains within the range of 0 to 50 km2 during January to June and October to December, but increases significantly to 500 to 4000 km2 during July to September, a break point between 50 and 200 km2 is introduced on the right y-axis to more clearly illustrate the variations in burned area. The x-axis denotes the months from January to December 2021.
As depicted in Figure 10, the average FMC during January–March exceeded 120%, with the median value remaining above 125%. During this period, except for an increase in small-scale fires in February, the burned area in the other two months was nearly zero, suggesting that when the forest remains relatively moist, wildfires tend to be limited in occurrence and spread. From April to June, FMC declined significantly, yet the burned area remained below 50 km2, indicating that the fire risk had not yet risen substantially. In July, the burned area sharply increased to the range of 500–1000 km2. This sharp increase was mainly attributable to the persistently low forest FMC during the summer months, compounded by a specific ignition event in July, when power lines came into contact with trees in the Feather River Canyon region, generating electric sparks [51], that ignited dry vegetation. Under the combined influence of high temperatures, strong winds, and low FMC, the fire spread rapidly. In August, both the average and median FMC values reached their annual minimums, while the burned area peaked at over 3500 km2. With the recovery of FMC in September, the burned area dropped below 1000 km2, indicating partial containment of the fire situation. From October to December, forest FMC rose to a relatively high level, the forest fire area returned to a lower level, significantly reducing the fire risk.
The aforementioned data and analysis unequivocally indicate that the spatio-temporal patterns of forest FMC obtained in this study are significantly associated with the occurrence of forest fires. To some extent, these findings can serve as valuable reference points for the development of forest fire early warning systems.

5.3. Limitations and Prospects

In terms of validating the model’s applicability, while the study area encompasses typical forest regions in California, the model’s adaptability to different ecosystems or climatic conditions remains insufficiently verified. Factors such as vegetation type, soil properties, climate change, and moisture conditions across different ecosystems can influence FMC performance. For instance, in tropical rainforests or arid regions, the patterns of change and reflectance characteristics of FMC may differ significantly from those in regions like California, primarily due to variations in precipitation regimes, vegetation composition, and climatic conditions. Future research also could be extended to additional global fire-prone areas, including southwestern China, Canada, the Brazilian Amazon rainforest, Australia, and Southeast Asian tropical forests, to further investigate the model’s applicability.
In the study area, the vegetation cover can be further categorized into more specific vegetation types to improve the model’s relevance and adaptability. For instance, forest areas can be subdivided into evergreen broad-leaved forests, deciduous broad-leaved forests, evergreen coniferous forests, deciduous coniferous forests, mixed forests, savanna woodlands, and savannas. Shrub areas can be classified into closed shrublands and open shrublands [33]. Based on these distinct vegetation types, inversion models with characteristic differences can be developed to better reflect their unique properties.
There are several systematic biases inherent in the estimation and inversion processes of forest FMC that contribute to the overall uncertainty of the results. First, uncalibrated measurement instruments and human errors can lead to inaccuracies at the tree level, which propagate through the anisotropic growth model and ultimately affect the reliability of the ground-truthing data [52]. Second, the relatively long temporal resolution interval of the Sentinel satellite series may fail to provide sufficiently frequent spatial-temporal data, thereby limiting the accurate depiction of dynamic changes over space and time. Additionally, in this study, the training and testing datasets were randomly partitioned at a ratio of approximately 7:3 from 1101 ground-measured samples. We did not explicitly account for spatial autocorrelation in this process, which may cause spatial dependence between training and testing samples and slightly overestimate model performance. The randomness in sample selection and dataset partitioning also introduces further variability, potentially increasing uncertainties in the predictive outcomes. These factors inevitably affect the accuracy of model estimations. In future research, spatially explicit sampling strategies (e.g., spatial blocking or buffer-based cross-validation), combined with a comprehensive error analysis of the FMC inversion workflow, could help mitigate these issues and enhance inversion accuracy.
In the realm of applied research, this paper investigates the relationship between the spatio-temporal evolution characteristics of Forest FMC and the occurrence of forest fires. For future research, we recommend incorporating additional fire-driving factors into forest fire risk modeling, such as meteorological variables (e.g., air temperature, precipitation, wind speed), topographic conditions (e.g., slope, aspect, altitude), and ecological elements (e.g., vegetation structure, land use type). By integrating FMC with key environmental variables, future research can conduct an in-depth analysis of the interaction between FMC and fire under varying environmental conditions, thereby providing more accurate predictive models and decision-making support for forest fire early warning systems and response strategies. This multivariate correlation approach not only facilitates a better understanding of the dynamic patterns of FMC, but also enhances the precision of fire risk assessments and the reliability of related predictions.

6. Conclusions

This paper proposes a method for retrieving forest FMC by integrating multi-source remote sensing data and machine learning models. The primary objective is to address common methodological challenges in the remote sensing retrieval of forest FMC, such as reliance on single data sources, ambiguous feature selection, and insufficient model accuracy. The study focuses on the forested regions of California, USA. By combining Sentinel-2 optical imagery, Sentinel-1 SAR imagery, MODIS product data, and ground station FMC observations, a Transformer-GRU FMC estimation model is proposed. This study systematically evaluates the accuracy and applicability of various machine learning models constructed using multi-source remote sensing data for forest FMC retrieval. Results indicate that, using the cumulative forward feature selection method, when optical and SAR feature variables are sequentially input into five machine learning models (SVR, RF, GRU, Transformer, and Transformer-GRU), the root relative mean square error (rRMSE) reaches its lowest values with 39, 15, 35, 26, and 24 feature variables, respectively. A comparative analysis of the goodness-of-fit and error control levels under optimal feature sets reveals that the Transformer-GRU model performs the best, achieving R2 = 0.79, MAE = 8.70%, RMSE = 11.44%, and rRMSE = 12.60%. To validate the potential of the model for estimating forest FMC, a spatio-temporal distribution pattern map of forest FMC in California for the year 2021 was generated. The results demonstrated that the inverted forest FMC aligned well with local historical records, geographical distribution characteristics, and climatic change patterns at the spatio-temporal scale. Furthermore, this study investigated the intrinsic relationship between forest FMC and forest fire occurrences, aiming to provide a reliable reference basis for forest fire prevention, monitoring, and resource management. The findings indicated that the forest FMC estimated by the proposed Transformer-GRU model corresponded closely with the historical occurrence patterns of forest fires, suggesting its significant indicative and predictive value for forest fire monitoring and early warning systems in California. Future research could incorporate a real-time monitoring platform to enable the integration of operationalized pathways into fire warning systems, offering significant potential for monitoring FMC variations across diverse environmental regions.

Supplementary Materials

The following supporting information can be downloaded at: https://www.mdpi.com/article/10.3390/f16091423/s1.

Author Contributions

Conceptualization, W.W. and C.Z.; methodology, W.W., C.Z. and J.Z.; validation, W.W., C.Z., J.Z., Y.L. (Yuanzong Li), Z.C. and Y.L. (Yongfeng Luo); formal analysis, W.W., C.Z. and J.Z.; investigation, W.W., C.Z., J.Z., Y.L. (Yuanzong Li) and Y.L. (Yongfeng Luo); resources, Y.L. (Yuanzong Li); data curation, J.Z.; writing—original draft preparation, W.W.; writing—review and editing, W.W. and C.Z.; supervision, C.Z.; project administration, C.Z., J.Z., Y.L. (Yuanzong Li) and Y.L. (Yongfeng Luo); funding acquisition, C.Z. All authors have read and agreed to the published version of the manuscript.

Funding

This research was funded by the National Natural Science Foundation of China (Nos. 42474052 and 42030112) and the Hunan Science Fund for Distinguished Young Scholars (2024JJ2100).

Data Availability Statement

The Sentinel-1 and Sentinel-2 data that support the findings of this study are available at [Google Earth Engine]; The forest FMC database that support the findings of this study are available on request from the [https://www.wfas.net/nfmd/public/, accessed on 2 September 2025].

Acknowledgments

Many thanks to NASA, GEE for generously providing the datasets free of charge.

Conflicts of Interest

The authors declare no conflicts of interest. There are no known competing financial interests or personal relationships that could have potentially influenced the work reported in this paper.

References

  1. Pyne, S.J.; Andrews, P.L.; Laven, R.D. Introduction to Wildland Fire; John Wiley and Sons: New York, NY, USA, 1996; ISBN 978-0-471-54913-0. [Google Scholar]
  2. Yebra, M.; Dennison, P.E.; Chuvieco, E.; Riaño, D.; Zylstra, P.; Hunt, E.R.; Danson, F.M.; Qi, Y.; Jurdao, S. A Global Review of Remote Sensing of Live Fuel Moisture Content for Fire Danger Assessment: Moving towards Operational Products. Remote Sens. Environ. 2013, 136, 455–468. [Google Scholar] [CrossRef]
  3. Paltridge, G.W.; Barber, J. Monitoring Grassland Dryness and Fire Potential in Australia with NOAA/AVHRR Data. Remote Sens. Environ. 1988, 25, 381–394. [Google Scholar] [CrossRef]
  4. Yang, K.; Tang, B.-H.; Fu, W.; Zhou, W.; Fu, Z.; Fan, D. Estimation of Forest Canopy Fuel Moisture Content in Dali Prefecture by Combining Vegetation Indices and Canopy Radiative Transfer Models from MODIS Data. Forests 2024, 15, 614. [Google Scholar] [CrossRef]
  5. Quan, X.; He, B.; Yebra, M.; Yin, C.; Liao, Z.; Li, X. Retrieval of Forest Fuel Moisture Content Using a Coupled Radiative Transfer Model. Environ. Model. Softw. 2017, 95, 290–302. [Google Scholar] [CrossRef]
  6. Rodriguez-Jimenez, F.; Lorenzo, H.; Novo, A.; Acuña-Alonso, C.; Alvarez, X. Modelling of Live Fuel Moisture Content in Different Vegetation Scenarios during Dry Periods Using Meteorological Data and Spectral Indices. For. Ecol. Manag. 2023, 546, 121378. [Google Scholar] [CrossRef]
  7. Quan, X.; Chen, R.; Yebra, M.; Riaño, D.; de Dios, V.R.; Li, X.; He, B.; Nolan, R.H.; Griebel, A.; Boer, M.M. Sub-Daily Live Fuel Moisture Content Estimation from Himawari-8 Data. Remote Sens. Environ. 2024, 308, 114170. [Google Scholar] [CrossRef]
  8. Al-Moustafa, T.; Armitage, R.P.; Danson, F.M. Mapping Fuel Moisture Content in Upland Vegetation Using Airborne Hyperspectral Imagery. Remote Sens. Environ. 2012, 127, 74–83. [Google Scholar] [CrossRef]
  9. Barrett, B.W.; Dwyer, E.; Whelan, P. Soil Moisture Retrieval from Active Spaceborne Microwave Observations: An Evaluation of Current Techniques. Remote Sens. 2009, 1, 210–242. [Google Scholar] [CrossRef]
  10. Calvet, J.-C.; Wigneron, J.-P.; Walker, J.; Karbou, F.; Chanzy, A.; Albergel, C. Sensitivity of Passive Microwave Observations to Soil Moisture and Vegetation Water Content: L-Band to W-Band. IEEE Trans. Geosci. Remote Sens. 2010, 49, 1190–1199. [Google Scholar] [CrossRef]
  11. Leblon, B.; Kasischke, E.; Alexander, M.; Doyle, M.; Abbott, M. Fire Danger Monitoring Using ERS-1 SAR Images in the Case of Northern Boreal Forests. Nat. Hazards 2002, 27, 231–255. [Google Scholar] [CrossRef]
  12. Tanase, M.A.; Panciera, R.; Lowell, K.; Aponte, C. Monitoring Live Fuel Moisture in Semiarid Environments Using L-Band Radar Data. Int. J. Wildland Fire 2015, 24, 560–572. [Google Scholar] [CrossRef]
  13. Heffernan, S.; Strimbu, B.M. Estimation of Surface Canopy Water in Pacific Northwest Forests by Fusing Radar, Lidar, and Meteorological Data. Forests 2021, 12, 339. [Google Scholar] [CrossRef]
  14. Wang, L.; Quan, X.; He, B.; Yebra, M.; Xing, M.; Liu, X. Assessment of the Dual Polarimetric Sentinel-1A Data for Forest Fuel Moisture Content Estimation. Remote Sens. 2019, 11, 1568. [Google Scholar] [CrossRef]
  15. McCandless, T.C.; Kosovic, B.; Petzke, W. Enhancing Wildfire Spread Modelling by Building a Gridded Fuel Moisture Content Product with Machine Learning. Mach. Learn. Sci. Technol. 2020, 1, 035010. [Google Scholar] [CrossRef]
  16. Bu, L.; Lai, Q.; Qing, S.; Bao, Y.; Liu, X.; Na, Q.; Li, Y. Grassland Biomass Inversion Based on a Random Forest Algorithm and Drought Risk Assessment. Remote Sens. 2022, 14, 5745. [Google Scholar] [CrossRef]
  17. Ghosh, S.M.; Behera, M.D. Aboveground Biomass Estimates of Tropical Mangrove Forest Using Sentinel-1 SAR Coherence Data-The Superiority of Deep Learning over a Semi-Empirical Model. Comput. Geosci. 2021, 150, 104737. [Google Scholar] [CrossRef]
  18. Su, H.; Shen, W.; Wang, J.; Ali, A.; Li, M. Machine Learning and Geostatistical Approaches for Estimating Aboveground Biomass in Chinese Subtropical Forests. For. Ecosyst. 2020, 7, 64. [Google Scholar] [CrossRef]
  19. Zhu, L.; Webb, G.I.; Yebra, M.; Scortechini, G.; Miller, L.; Petitjean, F. Live Fuel Moisture Content Estimation from MODIS: A Deep Learning Approach. ISPRS J. Photogramm. Remote Sens. 2021, 179, 81–91. [Google Scholar] [CrossRef]
  20. Perello, N.; Trucchia, A.; D’Andrea, M.; Degli Esposti, S.; Fiorucci, P.; Gollini, A.; Negro, D. An Adaptable Dead Fuel Moisture Model for Various Fuel Types and Temporal Scales Tailored for Wildfire Danger Assessment. Environ. Model. Softw. 2025, 183, 106254. [Google Scholar] [CrossRef]
  21. Miller, L.; Zhu, L.; Yebra, M.; Rüdiger, C.; Webb, G.I. Projecting Live Fuel Moisture Content via Deep Learning. Int. J. Wildland Fire 2023, 32, 709–727. [Google Scholar] [CrossRef]
  22. Wen, H.; Guo, Q.; Zeng, Y.; Wu, Z.; Sun, Z. Study on Forest Fire Risk in Conghua District of Guangzhou City Based on Multi-Source Data. Nat. Hazards 2022, 114, 3163–3183. [Google Scholar] [CrossRef]
  23. Xie, J.; Qi, T.; Hu, W.; Huang, H.; Chen, B.; Zhang, J. Retrieval of Live Fuel Moisture Content Based on Multi-Source Remote Sensing Data and Ensemble Deep Learning Model. Remote Sens. 2022, 14, 4378. [Google Scholar] [CrossRef]
  24. Vaswani, A.; Shazeer, N.; Parmar, N.; Uszkoreit, J.; Jones, L.; Gomez, A.N.; Kaiser, Ł.; Polosukhin, I. Attention Is All You Need. In Proceedings of the 2017 Conference on Neural Information Processing Systems, Long Beach, CA, USA, 4–9 December 2017; Volume 30. [Google Scholar]
  25. Gillioz, A.; Casas, J.; Mugellini, E.; Abou Khaled, O. Overview of the Transformer-Based Models for NLP Tasks. In Proceedings of the 2020 15th Conference on Computer Science and Information Systems (FedCSIS), Sofia, Bulgaria, 6–9 September 2020; IEEE: Piscataway, NJ, USA; pp. 179–183. [Google Scholar]
  26. Keeley, J.E.; Syphard, A.D. Twenty-First Century California, USA, Wildfires: Fuel-Dominated vs. Wind-Dominated Fires. Fire Ecol. 2019, 15, 24. [Google Scholar] [CrossRef]
  27. Brown, P.T.; Hanley, H.; Mahesh, A.; Reed, C.; Strenfel, S.J.; Davis, S.J.; Kochanski, A.K.; Clements, C.B. Climate Warming Increases Extreme Daily Wildfire Growth Risk in California. Nature 2023, 621, 760–766. [Google Scholar] [CrossRef]
  28. Ma, C.; Johansen, K.; McCabe, M.F. Monitoring Irrigation Events and Crop Dynamics Using Sentinel-1 and Sentinel-2 Time Series. Remote Sens. 2022, 14, 1205. [Google Scholar] [CrossRef]
  29. Phung, H.-P.; Lam-Dao, N.; Nguyen-Huy, T.; Le-Toan, T.; Apan, A.A. Monitoring Rice Growth Status in the Mekong Delta, Vietnam Using Multitemporal Sentinel-1 Data. J. Appl. Remote Sens. 2020, 14, 014518. [Google Scholar] [CrossRef]
  30. Phiri, D.; Simwanda, M.; Salekin, S.; Nyirenda, V.R.; Murayama, Y.; Ranagalage, M. Sentinel-2 Data for Land Cover/Use Mapping: A Review. Remote Sens. 2020, 12, 2291. [Google Scholar] [CrossRef]
  31. Zheng, H.; Du, P.; Chen, J.; Xia, J.; Li, E.; Xu, Z.; Li, X.; Yokoya, N. Performance Evaluation of Downscaling Sentinel-2 Imagery for Land Use and Land Cover Classification by Spectral-Spatial Features. Remote Sens. 2017, 9, 1274. [Google Scholar] [CrossRef]
  32. Sulla-Menashe, D.; Friedl, M.A. User Guide to Collection 6 MODIS Land Cover (MCD12Q1 and MCD12C1) Product. Usgs Rest. Va Usa 2018, 1, 18. [Google Scholar]
  33. Yebra, M.; Quan, X.; Riaño, D.; Larraondo, P.R.; Van Dijk, A.I.; Cary, G.J. A Fuel Moisture Content and Flammability Monitoring Methodology for Continental Australia Based on Optical Remote Sensing. Remote Sens. Environ. 2018, 212, 260–272. [Google Scholar] [CrossRef]
  34. Giglio, L.; Boschetti, L.; Roy, D.P.; Humber, M.L.; Justice, C.O. The Collection 6 MODIS Burned Area Mapping Algorithm and Product. Remote Sens. Environ. 2018, 217, 72–85. [Google Scholar] [CrossRef] [PubMed]
  35. Ye, Z.; Long, J.; Zheng, H.; Liu, Z.; Zhang, T.; Wang, Q. Mapping Growing Stem Volume Using Dual-Polarization GaoFen-3 SAR Images in Evergreen Coniferous Forests. Remote Sens. 2023, 15, 2253. [Google Scholar] [CrossRef]
  36. Badgley, G.; Field, C.B.; Berry, J.A. Canopy Near-Infrared Reflectance and Terrestrial Photosynthesis. Sci. Adv. 2017, 3, e1602244. [Google Scholar] [CrossRef]
  37. Zhang, L.; Shao, Z.; Liu, J.; Cheng, Q. Deep Learning Based Retrieval of Forest Aboveground Biomass from Combined LiDAR and Landsat 8 Data. Remote Sens. 2019, 11, 1459. [Google Scholar] [CrossRef]
  38. Long, J.; Lin, H.; Wang, G.; Sun, H.; Yan, E. Mapping Growing Stem Volume of Chinese Fir Plantation Using a Saturation-Based Multivariate Method and Quad-Polarimetric SAR Images. Remote Sens. 2019, 11, 1872. [Google Scholar] [CrossRef]
  39. Yang, S.; Yu, X.; Zhou, Y. Lstm and Gru Neural Network Performance Comparison Study: Taking Yelp Review Dataset as an Example. In Proceedings of the 2020 International Workshop on Electronic Communication and Artificial Intelligence (IWECAI), Shanghai, China, 12–14 June 2020; IEEE: Piscataway, NJ, USA; pp. 98–101. [Google Scholar]
  40. Mahjoub, S.; Chrifi-Alaoui, L.; Marhic, B.; Delahoche, L. Predicting Energy Consumption Using LSTM, Multi-Layer GRU and Drop-GRU Neural Networks. Sensors 2022, 22, 4062. [Google Scholar] [CrossRef]
  41. Derrac, J.; García, S.; Molina, D.; Herrera, F. A Practical Tutorial on the Use of Nonparametric Statistical Tests as a Methodology for Comparing Evolutionary and Swarm Intelligence Algorithms. Swarm Evol. Comput. 2011, 1, 3–18. [Google Scholar] [CrossRef]
  42. Armstrong, R.A. When to Use the BOnferroni Correction. Ophthalmic Physiol. Opt. 2014, 34, 502–508. [Google Scholar] [CrossRef]
  43. Seager, R.; Cane, M.; Henderson, N.; Lee, D.-E.; Abernathey, R.; Zhang, H. Strengthening Tropical Pacific Zonal Sea Surface Temperature Gradient Consistent with Rising Greenhouse Gases. Nat. Clim. Change 2019, 9, 517–522. [Google Scholar] [CrossRef]
  44. Underwood, E.C.; Hollander, A.D.; Flint, L.E.; Flint, A.L.; Safford, H.D. Climate Change Impacts on Hydrological Services in Southern California. Environ. Res. Lett. 2018, 13, 124019. [Google Scholar] [CrossRef]
  45. Abatzoglou, J.T.; Barbero, R.; Nauslar, N.J. Diagnosing Santa Ana Winds in Southern California with Synoptic-Scale Analysis. Weather Forecast. 2013, 28, 704–710. [Google Scholar] [CrossRef]
  46. Polade, S.D.; Gershunov, A.; Cayan, D.R.; Dettinger, M.D.; Pierce, D.W. Precipitation in a Warming World: Assessing Projected Hydro-Climate Changes in California and Other Mediterranean Climate Regions. Sci. Rep. 2017, 7, 10783. [Google Scholar] [CrossRef]
  47. Williams, A.P.; Abatzoglou, J.T.; Gershunov, A.; Guzman-Morales, J.; Bishop, D.A.; Balch, J.K.; Lettenmaier, D.P. Observed Impacts of Anthropogenic Climate Change on Wildfire in California. Earths Future 2019, 7, 892–910. [Google Scholar] [CrossRef]
  48. Maloney, E.D.; Camargo, S.J.; Chang, E.; Colle, B.; Fu, R.; Geil, K.L.; Hu, Q.; Jiang, X.; Johnson, N.; Karnauskas, K.B. North American Climate in CMIP5 Experiments: Part III: Assessment of Twenty-First-Century Projections. J. Clim. 2014, 27, 2230–2270. [Google Scholar] [CrossRef]
  49. Jeong, J.H.; Resop, J.P.; Mueller, N.D.; Fleisher, D.H.; Yun, K.; Butler, E.E.; Timlin, D.J.; Shim, K.-M.; Gerber, J.S.; Reddy, V.R. Random Forests for Global and Regional Crop Yield Predictions. PLoS ONE 2016, 11, e0156571. [Google Scholar] [CrossRef] [PubMed]
  50. Li, B.; Wang, W.; Bai, L.; Chen, N.; Wang, W. Estimation of Aboveground Vegetation Biomass Based on Landsat-8 OLI Satellite Images in the Guanzhong Basin, China. Int. J. Remote Sens. 2019, 40, 3927–3947. [Google Scholar] [CrossRef]
  51. Taylor, A.H.; Harris, L.B.; Skinner, C.N. Severity Patterns of the 2021 Dixie Fire Exemplify the Need to Increase Low-Severity Fire Treatments in California’s Forests. Environ. Res. Lett. 2022, 17, 071002. [Google Scholar] [CrossRef]
  52. Araza, A.; De Bruin, S.; Herold, M.; Quegan, S.; Labriere, N.; Rodriguez-Veiga, P.; Avitabile, V.; Santoro, M.; Mitchard, E.T.; Ryan, C.M. A Comprehensive Framework for Assessing the Accuracy and Uncertainty of Global Above-Ground Biomass Maps. Remote Sens. Environ. 2022, 272, 112917. [Google Scholar] [CrossRef]
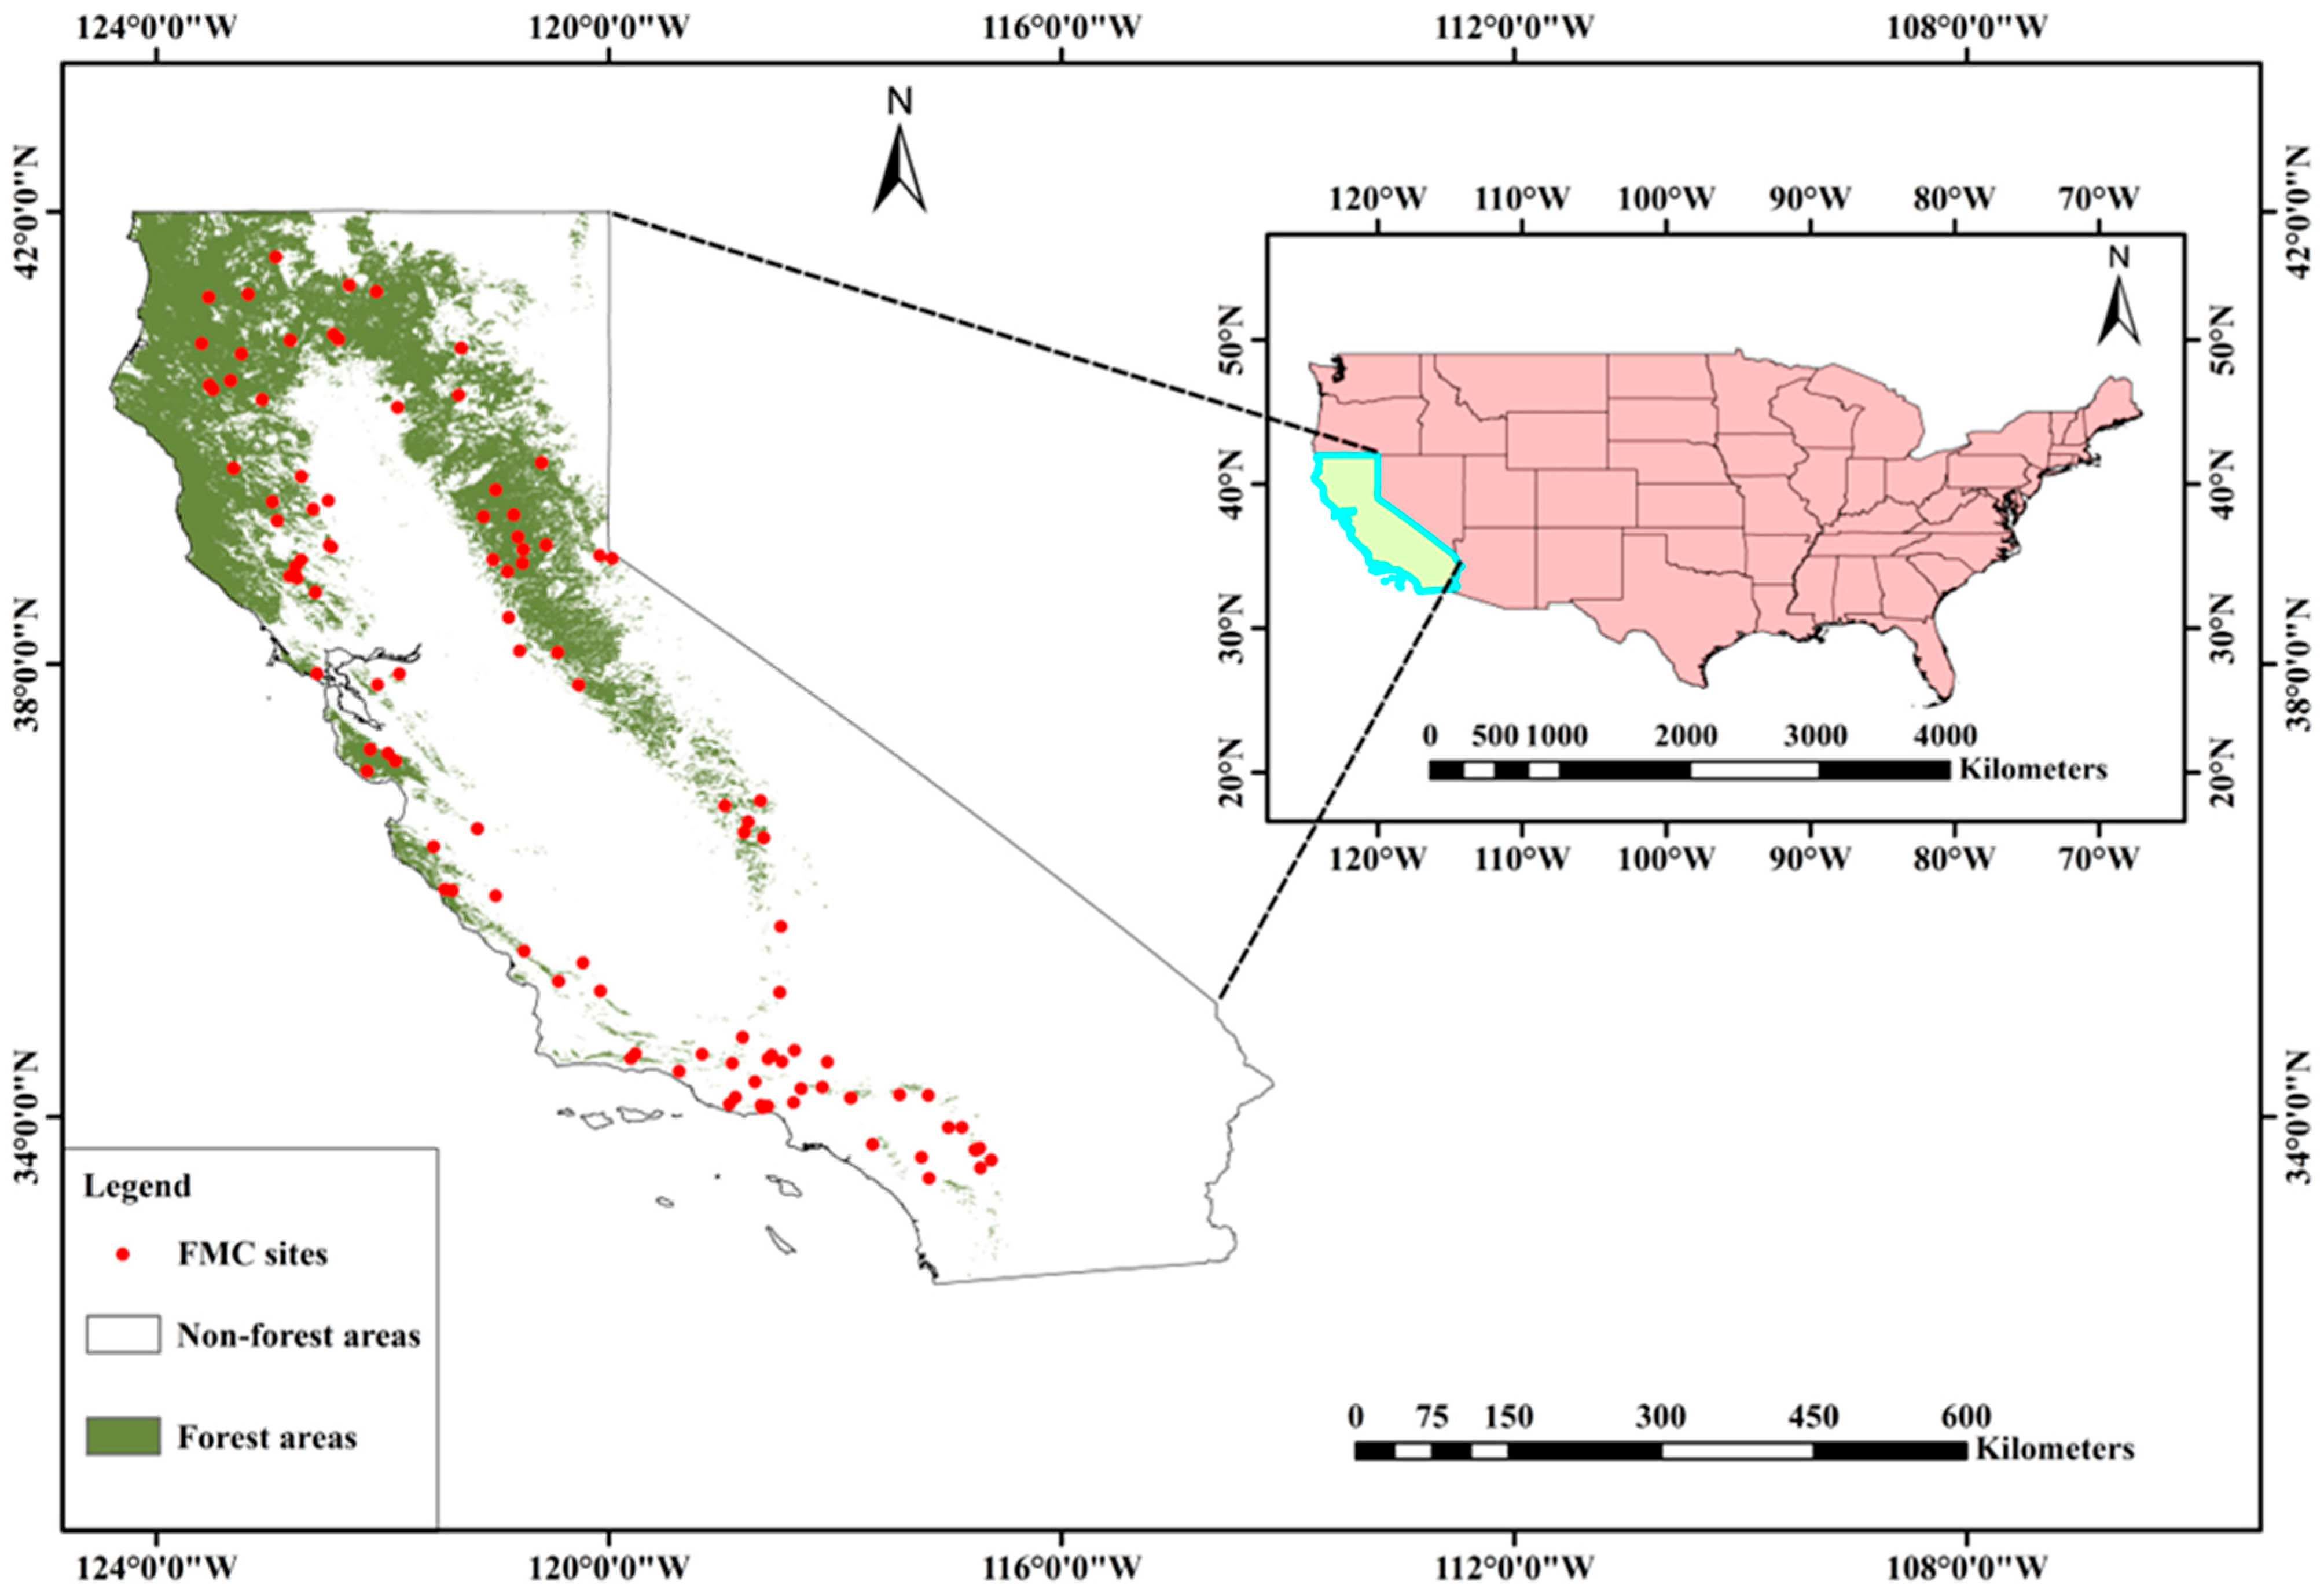
Figure 1. Geographic location and forest distribution in the study area.
Forests 16 01423 g001
Figure 2. Overall flow chart.
Forests 16 01423 g002
Figure 3. Heatmap of the correlation between remote sensing variables and forest FMC.
Forests 16 01423 g003
Figure 4. Schematic diagram of forward feature selection.
Forests 16 01423 g004
Figure 5. Construction process of the Transformer-GRU model.
Forests 16 01423 g005
Figure 6. Trend of error variation with the number of features for the five models.
Forests 16 01423 g006
Figure 7. The scatterplots of the observed forest FMC and model predicted forest FMC using the five methods.
Forests 16 01423 g007
Figure 8. Spatiotemporal distribution pattern of forest FMC in California in 2021 inverted by Transformer-GRU.
Forests 16 01423 g008
Figure 9. Spatial distribution of residuals between observed and predicted forest FMC in California in 2021.
Forests 16 01423 g009
Figure 10. Monthly variation patterns of forest FMC and forest fire burned area during the fire year.
Forests 16 01423 g010
Table 1. Basic characteristics of fuel moisture content site data in California.
Serial NumberVegetation TypeForest FMC (%)Mean (%)Standard
Deviation (%)
1Chamise42.00–144.0079.6972.12
2Douglas-Fir91.00–171.00132.8756.57
3Fir92.00–174.00123.557.98
4Mahogany75.00–83.0073.645.66
5Oak58.00–152.0090.1566.47
6Pine76.00–151.00112.8453.03
7Tanoak90.88–104.6696.139.75
Table 2. Derived Features from Sentinel-1 Data and Pearson Correlation with Forest FMC.
Serial NumberFeature NameCalculation FormulaPearson Correlation Coefficient
1VV (linear) 10 σ V V 10 0.27
2VH (linear) 10 σ V H 10 0.30
3VVdB0.29
4VHdB0.33
5A1 σ V V + σ V H 0.35
6A2 σ V V σ V H −0.07
7A3 σ V V / σ V H −0.11
8A4 σ V H / σ V V 0.15
9A5 σ V V σ V H −0.33
10A6 ( σ V V σ V H ) / ( σ V V + σ V H ) −0.12
11A7 σ V V / ( σ V V + σ V H ) −0.12
12A8 σ V H / ( σ V V + σ V H ) 0.12
13A9(VV(dB))2−0.28
14A10(VH(dB))2−0.32
15A11 ( A 1 ) 2 −0.34
16A12 ( A 2 ) 2 −0.08
17A13 ( A 3 ) 2 −0.09
18A14 ( A 4 ) 2 0.12
19A15 ( A 5 ) 2 −0.29
20A16 ( A 6 ) 2 0.14
21A17 ( A 7 ) 2 −0.11
22A18 ( A 8 ) 2 −0.13
23RVI(Radar) 4 σ V H ( σ V V + σ V H ) 0.12
Table 3. Derived Features from Sentinel-2 Data and Pearson Correlation with Forest FMC.
Serial NumberFeature NameCalculation FormulaPearson Correlation Coefficient
1BlueB(Band 2)0.04
2GreenG(Band 3)0.01
3RedR(Band 4)−0.12
4NIRBand 80.33
5SWIR1Band 11−0.33
6SWIR2Band 12−0.33
7RVI N I R R 0.48
8NDVI N I R R N I R + R 0.54
9EVI 2.5 ( N I R R ) 1 + N I R + 6 R 7.5 B 0.70
10DVI N I R R 0.65
11NDII N I R S W I R 1 N I R + S W I R 1 0.74
12NDWI G N I R G + N I R −0.37
13NIRV N I R R N I R + R N I R 0.64
14GVMI ( N I R + 0.1 ) ( S W I R 1 + 0.02 ) N I R + 0.1 + ( S W I R 1 + 0.02 ) 0.71
15SAVI 1 + 0.5 N I R R N I R + R + 0.5 0.65
16OSAVI 1 + 0.16 N I R R N I R + R + 0.16 0.58
Table 4. Performance of the five methods from the top three best feature group.
ModelNumber of FeaturesR2MAE (%)RMSE (%)rRMSE (%)
SVR390.6311.2514.9516.48
380.6311.3415.0516.58
370.6311.3715.0616.60
RF150.6710.4214.1615.61
160.6710.4614.1915.64
140.6710.5014.2015.65
GRU350.6910.4413.8315.25
70.6710.9714.2415.70
300.6510.9014.5015.98
Transformer260.749.3712.5313.81
40.739.1212.7614.06
20.739.4212.8014.11
Transformer-GRU240.798.7011.4412.60
320.788.6011.4612.62
200.788.9011.4912.66
Table 5. Average ranks of different models based on the Friedman test.
ModelMean Rank
SVR3.55
RF2.93
GRU3.18
Transformer2.81
Transformer-GRU2.54
Note: The overall p-value of the Friedman test is 5.62 × 10⁻¹⁶, indicating a highly significant difference among the models (p < 0.001).
Table 6. Wilcoxon Signed-Rank Test with Bonferroni Correction for Pairwise Model.
Model ComparisonBonferroni-Adjusted
p-Value
Significance
Transformer-GRU vs. SVR2.38 × 10−13Significant
Transformer-GRU vs. RF8.31 × 10−8Significant
Transformer-GRU vs. GRU2.13 × 10−8Significant
Transformer-GRU vs. Transformer3.26 × 10−4Significant
Note: “Significant” indicates Bonferroni-adjusted p-value < 0.0125.
Disclaimer/Publisher’s Note: The statements, opinions and data contained in all publications are solely those of the individual author(s) and contributor(s) and not of MDPI and/or the editor(s). MDPI and/or the editor(s) disclaim responsibility for any injury to people or property resulting from any ideas, methods, instructions or products referred to in the content.