Article

Spatiotemporal Heterogeneity of Forest Park Soundscapes Based on Deep Learning: A Case Study of Zhangjiajie National Forest Park

1
College of Intelligent Construction, Jishou University, Zhangjiajie 427000, China
2
College of Tourism and Urban Planning, Jishou University, Zhangjiajie 427000, China
*
Author to whom correspondence should be addressed.
Forests 2025, 16(9), 1416; https://doi.org/10.3390/f16091416
Submission received: 23 July 2025 / Revised: 30 August 2025 / Accepted: 2 September 2025 / Published: 4 September 2025
(This article belongs to the Section Forest Ecology and Management)

Abstract

As a perceptual representation of ecosystem structure and function, the soundscape has become an important indicator for evaluating ecological health and assessing the impacts of human disturbances. Understanding the spatiotemporal heterogeneity of soundscapes is essential for revealing ecological processes and human impacts in protected areas. This study investigates such heterogeneity in Zhangjiajie National Forest Park using deep learning approaches. To this end, we constructed a dataset comprising eight representative sound source categories by integrating field recordings with online audio (BBC Sound Effects Archive and Freesound), and trained a classification model to accurately identify biophony, geophony, and anthrophony, which enabled the subsequent analysis of spatiotemporal distribution patterns. Our results indicate that temporal variations in the soundscape are closely associated with circadian rhythms and tourist activities, while spatial patterns are strongly shaped by topography, vegetation, and human interference. Biophony is primarily concentrated in areas with minimal ecological disturbance, geophony is regulated by landforms and microclimatic conditions, and anthrophony tends to mask natural sound sources. Overall, the study highlights how deep learning-based soundscape classification can reveal the mechanisms by which natural and anthropogenic factors structure acoustic environments, offering methodological references and practical insights for ecological management and soundscape conservation.

1. Introduction

In forest ecosystems, soundscapes can effectively reveal the underlying structure and function of the environment [1,2]. As an integrated product of ecological perception, soundscapes have gradually become a novel pathway for understanding the dynamics of natural systems [3,4]. Research has shown that a well-preserved natural soundscape is not only essential for maintaining biodiversity but also significantly enhances human psychological restoration and emotional stability [5,6]. Amid accelerating urbanization and ongoing fragmentation of natural habitats, forest parks have increasingly become primary venues for urban residents to connect with nature. In this context, soundscape quality carries dual significance: it contributes both to the maintenance of ecological health and to the optimization of recreational experiences [7,8]. Moreover, due to its high sensitivity to changes in ecosystem structure and function, the soundscape demonstrates considerable value in ecological monitoring, assessment, and early warning efforts [9,10]. As an auditory representation of the ecological patterns in forest parks, the soundscape is gradually emerging as a key indicator for assessing the health of forest ecosystems [11,12].
Previous studies have shown that the composition and variation of biophony, geophony, and anthrophony can serve as potential proxies for evaluating biodiversity, ecological integrity, and the intensity of human disturbance [13,14]. For instance, biophony exhibits marked temporal variations: bird songs are most concentrated during early mornings and breeding seasons, while diminishing noticeably around midday or outside the breeding period [15]. Chirp, conversely, is predominantly observed in summer and at night, demonstrating distinct diurnal and seasonal rhythms [16,17]. Geophony also demonstrates spatial heterogeneity, with water sounds being most prominent near valleys and streams, gradually attenuating in ridge areas or regions with dense vegetation [18]. Anthrophony is typically concentrated spatially along roads and near core scenic spots, decaying with distance and becoming significantly reduced in remote areas; temporally, it fluctuates in intensity corresponding to tourism peaks and off-seasons [19]. These examples illustrate that soundscapes vary not only in intensity and proportion but also exhibit significant heterogeneity in temporal rhythms and spatial patterns. The identification of these spatiotemporal differences in soundscapes contributes to a deeper understanding of ecological processes and anthropogenic disturbances, thereby providing a scientific basis for zoning management and disturbance control in forest parks.
Current quantitative ecological acoustics research typically relies on acoustic indicators such as the acoustic diversity index (ADI) and the bioacoustic index (BIO). These indicators perform well in capturing general soundscape patterns, but they are not directly linked to specific sound source types, which limits their ability to accurately describe the spatial structure and dynamics of soundscapes [20,21,22]. As research perspectives shift from static descriptions to dynamic processes, the spatiotemporal heterogeneity of soundscapes has received increasing attention from the academic community [23]. Studies have shown that soundscapes typically exhibit pronounced diel and seasonal rhythms [24], which are closely associated with the periodicity of biological activities [25]. In terms of spatial distribution, soundscape variations among ecological patches—driven by factors such as topography, vegetation, and landscape configuration—often reflect habitat quality and the degree of disturbance [26,27,28]. At the same time, subjective evaluation methods such as questionnaires and interviews provide valuable insights into how people perceive the acoustic environment and its restorative effects. For example, bird songs are often regarded as restorative sounds [29], whereas mechanical noise or tourist chatter is typically perceived as disturbing factors [30]. However, despite their advantages, these methods are constrained by temporal limitations, environmental noise, and individual variability, which makes it difficult to conduct large-scale, long-term monitoring and analysis of soundscape dynamics [31,32].
The rapid advancement of artificial intelligence, particularly deep learning, has opened new technological pathways for soundscape analysis. Models represented by Convolutional Neural Networks (CNNs) have demonstrated excellent classification performance and environmental adaptability in tasks such as environmental sound classification [33], bird species recognition [34], and biodiversity monitoring [35]. However, most existing studies remain focused on the level of sound source classification, paying less attention to how deep learning can be utilized to reveal the spatiotemporal heterogeneity of forest park soundscapes [36]. This gap needs to be urgently addressed, as understanding the dynamic changes of sound sources across time and space is key to linking acoustic patterns to ecological processes and human disturbances. Compared to traditional subjective assessment methods, deep learning can automatically learn multi-level representations directly from spectrograms, demonstrating higher classification accuracy and robustness in complex and noisy environments. Concurrently, emerging research is exploring directions such as model lightweighting and edge deployment [37,38], providing potential pathways for its large-scale application in ecological monitoring.
Nevertheless, applying deep learning to natural soundscape analysis still faces two main challenges. First, the limitations of existing public datasets make it difficult to capture the diverse acoustic characteristics of forest park environments, which restricts model generalization. Second, public datasets often suffer from uneven sample distribution, environmental noise interference, and incomplete labels, further weakening model performance in real-world scenarios. These dataset-related shortcomings, rather than the deep learning models themselves, are the main reason why deep learning has not yet fully realized its potential in spatiotemporal soundscape analysis. Therefore, improving data quality and coverage is a key direction for advancing this field.
This study aims to fill the research gap in the identification and spatiotemporal analysis of soundscapes in Zhangjiajie National Forest Park, and proposes a framework based on deep learning. The innovation of this study lies not only in applying the CNN model for sound source identification, but also in extending its application to explore the spatiotemporal heterogeneity of soundscapes and the underlying ecological response mechanisms. Specifically, this study aims to reveal whether the noise generated by human activities causes a masking effect on the natural soundscape, thereby reducing acoustic diversity (acoustic competition). By linking acoustic patterns with ecological and human factors, this study provides a new perspective for revealing the dynamic process that shapes the forest soundscape. The research results are expected to enhance the understanding of the ecosystem’s response to human disturbances and provide scientific basis for the protection and management of soundscapes in the park.
Zhangjiajie National Forest Park holds a unique triple designation as a United Nations Educational, Scientific and Cultural Organization (UNESCO) Global Geopark [39], a World Natural Heritage Site [40], and China’s first national forest park. In recent years, the area has experienced increasing tourism pressure and intensified human activity, resulting in a more complex soundscape structure where ecologically sensitive zones and areas of anthropogenic disturbance increasingly overlap. This unique setting makes it an ideal site for studying the spatiotemporal heterogeneity of soundscapes and the driving factors behind it. In this study, Zhangjiajie National Forest Park is used as a case study to explore soundscape patterns through the integration of deep learning methods. The research is structured around three key components: data, model, and application. First, a soundscape classification scheme tailored to forest park environments was developed, along with a corresponding dataset. A deep learning-based soundscape recognition model was then trained and applied to identify and classify soundscape data across the study area. Finally, the model outputs were used to analyze the spatiotemporal heterogeneity of the forest park soundscape and to examine the mechanisms of anthropogenic disturbance influencing its structure.

2. Data and Methods

2.1. Study Area

Zhangjiajie National Forest Park features a complex and multi-layered natural soundscape, shaped by its iconic sandstone peak forest landforms and subtropical evergreen broadleaf forest ecosystem. The park is rich in both natural and cultural landscape elements, and tourism activities within it exhibit pronounced spatiotemporal variations in intensity. These characteristics make it a highly representative site for investigating the spatiotemporal heterogeneity of soundscapes. Prior to formal data collection, the research team conducted multiple field surveys along the park’s main tourist trails. Soundscape sampling points were selected based on the following criteria: (1) the sampling sites had to be located along representative tourist routes within the park, covering typical natural and cultural landscape nodes. (2) the sites needed to ensure spatial representativeness, including diverse terrain types and varying levels of tourist activity intensity. Based on these principles, the walking route “Oxygen Bar Plaza–Meet from Afar–Four Gates Waterside–Enchanted Stand” was ultimately selected. This route is one of the officially recommended main hiking trails in the forest park, located near the park entrance and capable of reflecting typical visitor experiences. Additionally, the route splits at “Meet from Afar”: one section follows a mountain path with low visitor density, while the other extends along a streamside trail with high visitor density, providing a unique opportunity to compare soundscape differences under varying levels of visitor activity. A total of 12 sampling points were established along this route (Figure 1 and Table 1), covering diverse environmental settings and providing a comprehensive representation of the spatial distribution of ecological and anthropogenic soundscape features.

2.2. Data Sources

To enable accurate recognition and typological analysis of soundscapes in the forest park, this study adopted an environmental sound classification framework based on existing taxonomies [41]. Collected audio samples were processed using Adobe Audition 2022 for spectrogram visualization, and classification was further supported by manual auditory verification. Environmental sounds within the park were categorized into three major groups—biophony, geophony, and anthrophony—which were then further subdivided into eight representative sound source types (Table 2). This classification scheme provided the foundational basis for subsequent dataset construction, label annotation, and model training throughout the study.
Based on the above classification scheme, a training and Validation dataset was constructed for the development of the soundscape recognition model. The dataset comprises two primary sources: field-recorded audio and publicly available online audio. Field recordings were collected from multiple locations within Zhangjiajie National Forest Park to improve the model’s adaptability to real-world environmental conditions and enhance its ability to learn the complex characteristics of local soundscapes. Online audio data were obtained from the BBC Sound Effects Archive (https://sound-effects.bbcrewind.co.uk, accessed on 5 March 2025) and Freesound (https://freesound.org, accessed on 5 March 2025), covering all three major categories and eight representative sound source types. These data offer broad coverage, standardized labeling, and detailed metadata, and were primarily used to improve the model’s classification accuracy and generalization capability—particularly for underrepresented sound source types in the field recordings, such as birds and monkeys. To ensure ecological relevance, the online recordings were cross-checked against species distribution records and ecological survey results from Zhangjiajie National Forest Park, confirming that the included species (chirp, bird and monkey) are consistent with those known to inhabit the study area. Before model training, all audio samples were standardized, including uniform sampling rate, bit depth, and frequency range. A spectral structure compatibility check was conducted by comparing the dominant frequency bands and spectral energy distribution between online and field recordings. Samples exhibiting significant spectral deviations or labeling inconsistencies were excluded to ensure label integrity and feature alignment across the dataset.
For data analysis, a 12-h recording period from 07:00 to 19:00 on 1 April 2025, corresponding to the park’s official opening hours, was selected under clear weather with a light breeze. A single-day synchronized recording strategy was adopted to minimize the influence of weather and temporal variations across the 12 sampling points, thereby enabling analysis of diurnal rhythm patterns within a stable day. To minimize interference from non-target sound sources, all recording devices were placed in locations away from densely populated areas and other sources of strong acoustic disturbance. Devices were uniformly installed at a height of 1.7 m to simulate human ear level and reduce ground reflection noise. Audio was recorded using ICD-PX470 devices (Sony Corporation, Tokyo, Japan) in MP3 stereo format with a sampling rate of 44.1 kHz. In preprocessing, a sound intensity-based filtering strategy was applied to ensure data validity and analytical feasibility. The complete recordings contained a large number of low-intensity segments, most of which consisted of background or equipment noise with no prominent acoustic events and low confidence outputs, potentially increasing uncertainty in the results. Considering both visitor perception experience and model recognition efficiency, each hour of continuous recordings was divided into 12 groups, and the top 50% of segments ranked by sound intensity were selected for analysis. To evaluate the potential impact of this filtering on ecological information, a subset of samples was analyzed using the full audio without filtering. The results showed that the spatiotemporal distributions of the main biophonic types (e.g., bird and monkey calls) were consistent with those from the filtered data, indicating that the method effectively reduced noise while preserving key ecological soundscape features. In total, 129,600 audio clips were obtained for subsequent analysis.

2.3. Data Preprocessing and Feature Extraction

When constructing the training dataset, to ensure label consistency and single-source characteristics, only segments that could be clearly assigned to a single sound source type were selected using spectrogram visualization combined with manual auditory interpretation. This step was applied solely to the training materials and did not involve removal of the entire collected dataset, and thus does not affect the completeness of the experimental data. The sampling rate of all audio samples was standardized to 44.1 kHz, and volume normalization was applied to standardize audio energy levels to −20 dB, minimizing amplitude differences caused by variable recording environments [19]. All audio files were then converted to WAV format and subjected to a unified framing process, in which each sample was segmented into fixed 2 s clips. Samples shorter than 2 s were discarded to maintain temporal consistency across training samples. The choice of 2 s segment length was made based on its ability to effectively capture discriminative acoustic features suitable for model training. Shorter segments (1 s) often fail to provide sufficient information for accurate classification, while longer segments (5 s) may include more information but reduce the number of training samples and are more likely to contain multiple overlapping sound sources, which can decrease recognition accuracy.
To mitigate the class imbalance issue caused by the insufficient number of minority class samples in the training set, data augmentation was applied to the audio segments of the monkey category. This category contained only 500 samples in the original training data, while all other categories reached 800 samples each. Given that monkey audio is relatively scarce in both field-recorded audio and publicly available online audio, waveform-level augmentation techniques—including Additive Noise (AL), Pitch Shifting (PS), Time Stretch (TS), and Echo (EC)—were employed to expand the monkey category to 800 samples [42]. This generated multiple augmented samples to balance the class distribution (Table 3). It is important to note that data augmentation was applied only to the training set; the validation set strictly retained the original unaugmented data to avoid introducing bias. The final dataset comprised 6400 audio segments, each 2 s in length, which were split into training and validation sets at an 8:2 ratio.
All preprocessed audio segments were subjected to feature extraction, using Mel spectrograms as the input features for model training. Mel spectrograms represent the time–frequency structure of audio signals in a two-dimensional image format, effectively capturing dynamic acoustic patterns and making them well-suited for processing by CNN [43]. In a Mel spectrogram, the horizontal axis represents time, the vertical axis corresponds to Mel frequency, and the color intensity of each pixel reflects the energy level at a given time–frequency point—where brighter colors indicate higher energy. As illustrated in the 5 s Mel spectrograms of typical sound source categories derived from raw audio samples (Figure 2), biophony (chirp, bird, and monkey) show distinct frequency bands and pronounced temporal discontinuities, characterized by intermittent, rhythmic bright bands along the time axis. Geophony (stream, wind and rustle) exhibited continuous and stable spectral patterns, characterized by evenly distributed color bands and a lack of distinct frequency concentrations. In contrast, anthrophonic sounds (mechanical and crowd) showed concentrated energy and broad frequency distributions, with irregular, high-entropy spectrograms that lack clear structural patterns.

2.4. Deep Learning Model Construction

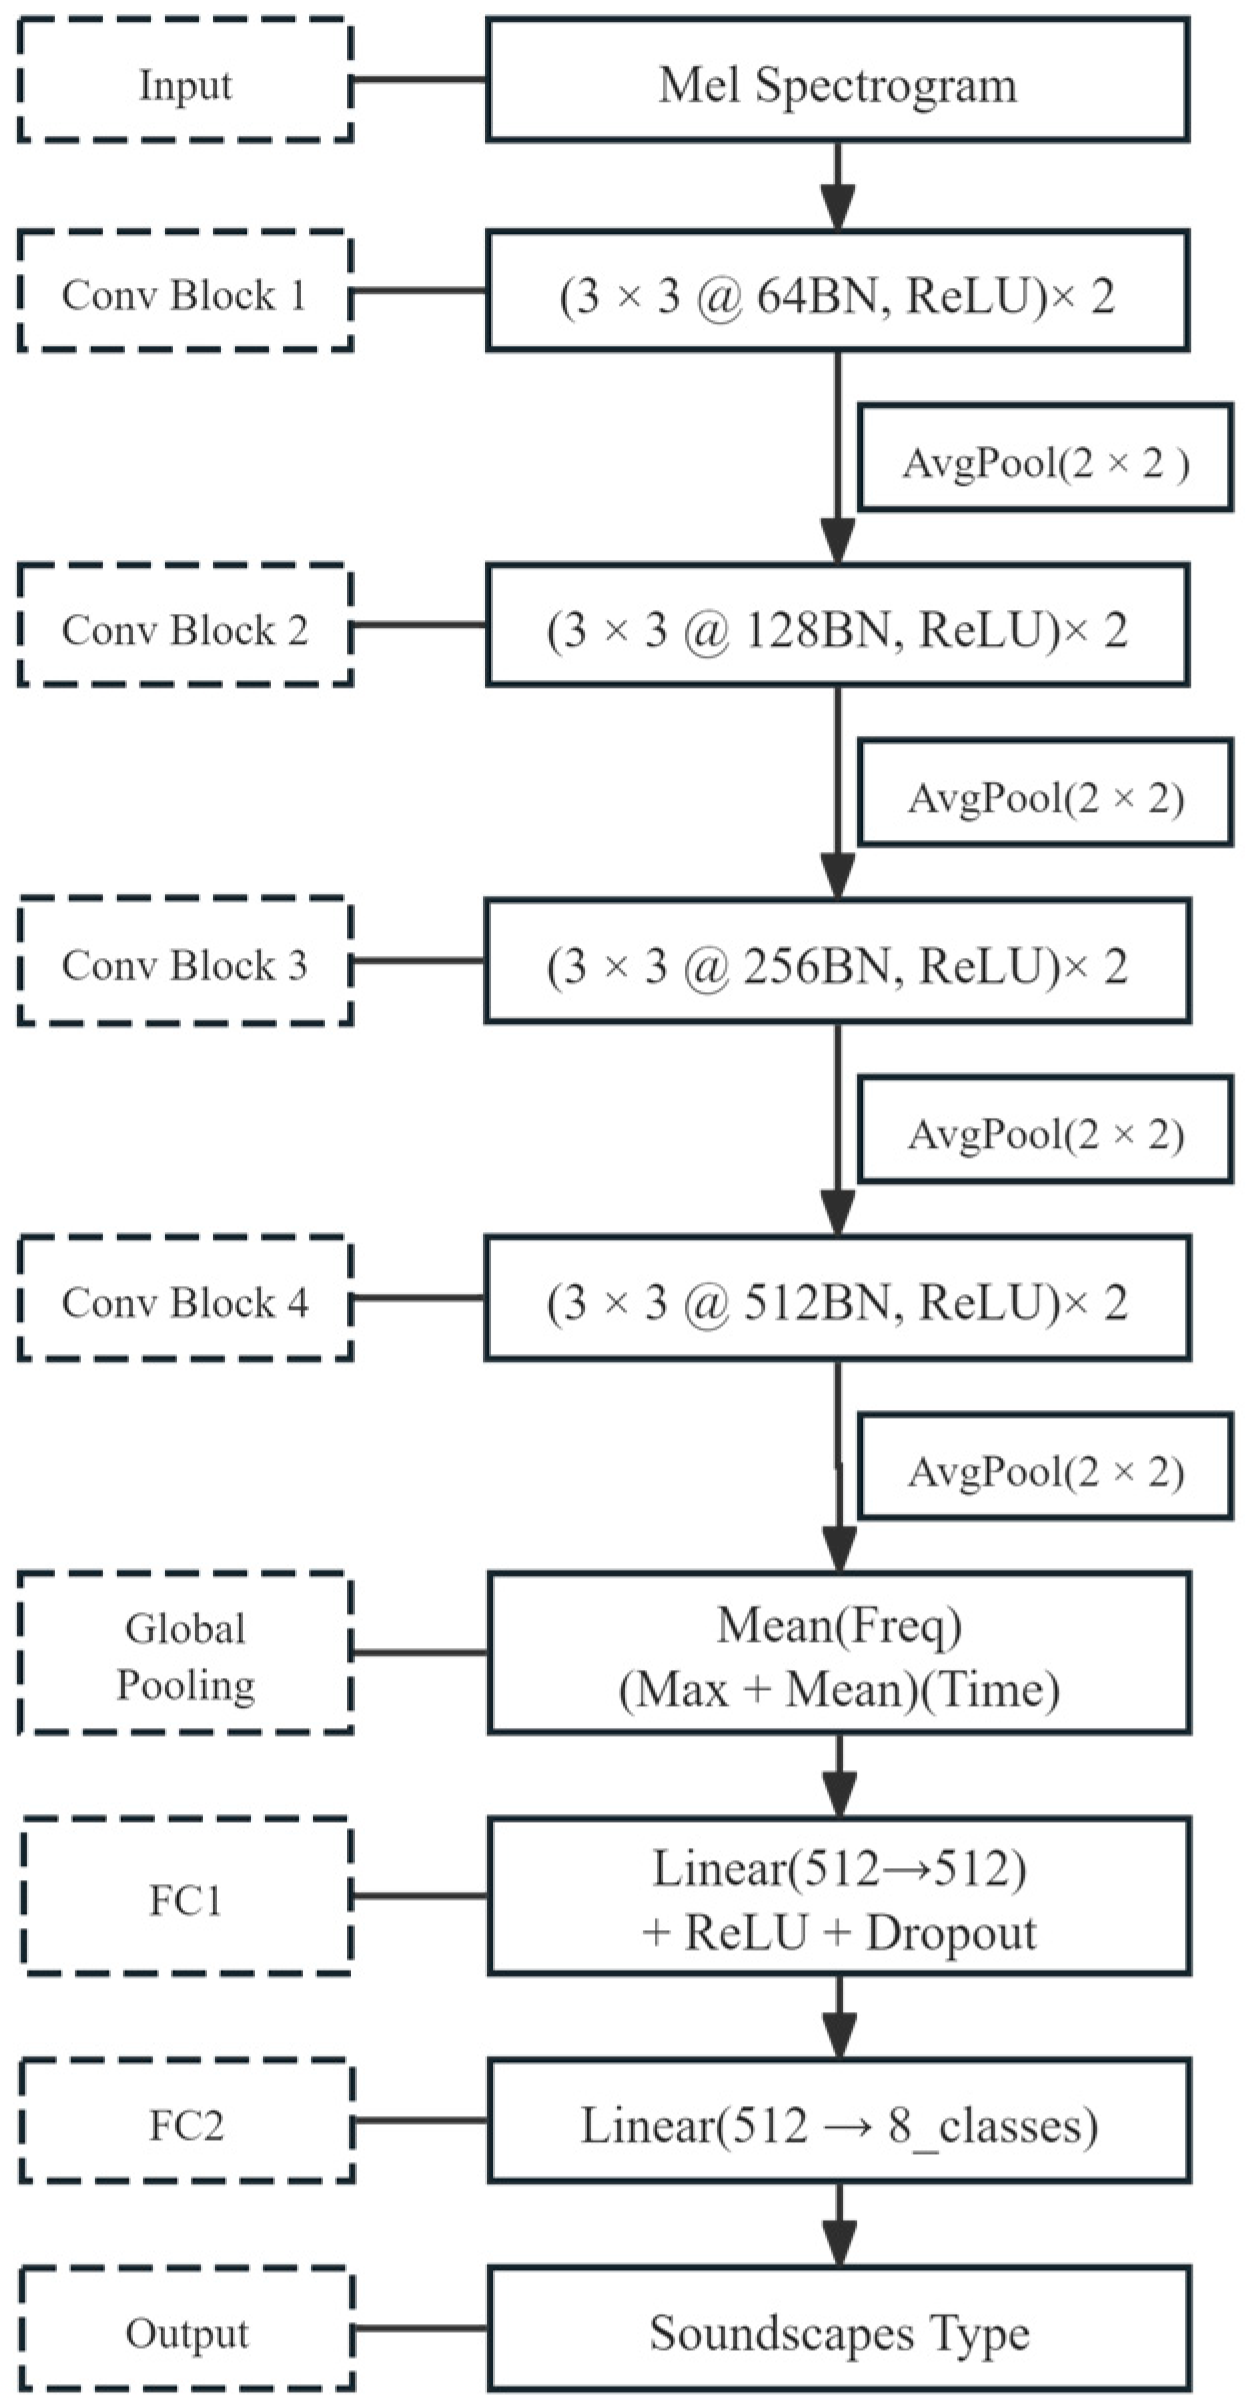
The constructed soundscape recognition model adopts a CNN architecture that takes Mel spectrograms as input. The overall design is based on the PANNs framework [44] and consists of four convolutional blocks followed by two fully connected layers. Each convolutional block contains two 3 × 3 convolutional layers, combined with Batch Normalization (BN) and ReLU activation functions. After each block, a 2 × 2 average pooling operation is applied to progressively compress the time–frequency dimensions, thereby enhancing the model’s translation invariance and generalization capability. In the feature aggregation stage, the model first applies global average pooling along the frequency dimension, followed by a fusion of max pooling and average pooling along the time dimension to capture temporal dependencies. The aggregated feature vector is then passed through a fully connected layer with an output size of 512, enabling the embedding of high-level semantic features. This is followed by a Dropout layer and a final classification layer that outputs the predicted sound source category (Figure 3).

2.5. Model Training and Evaluation

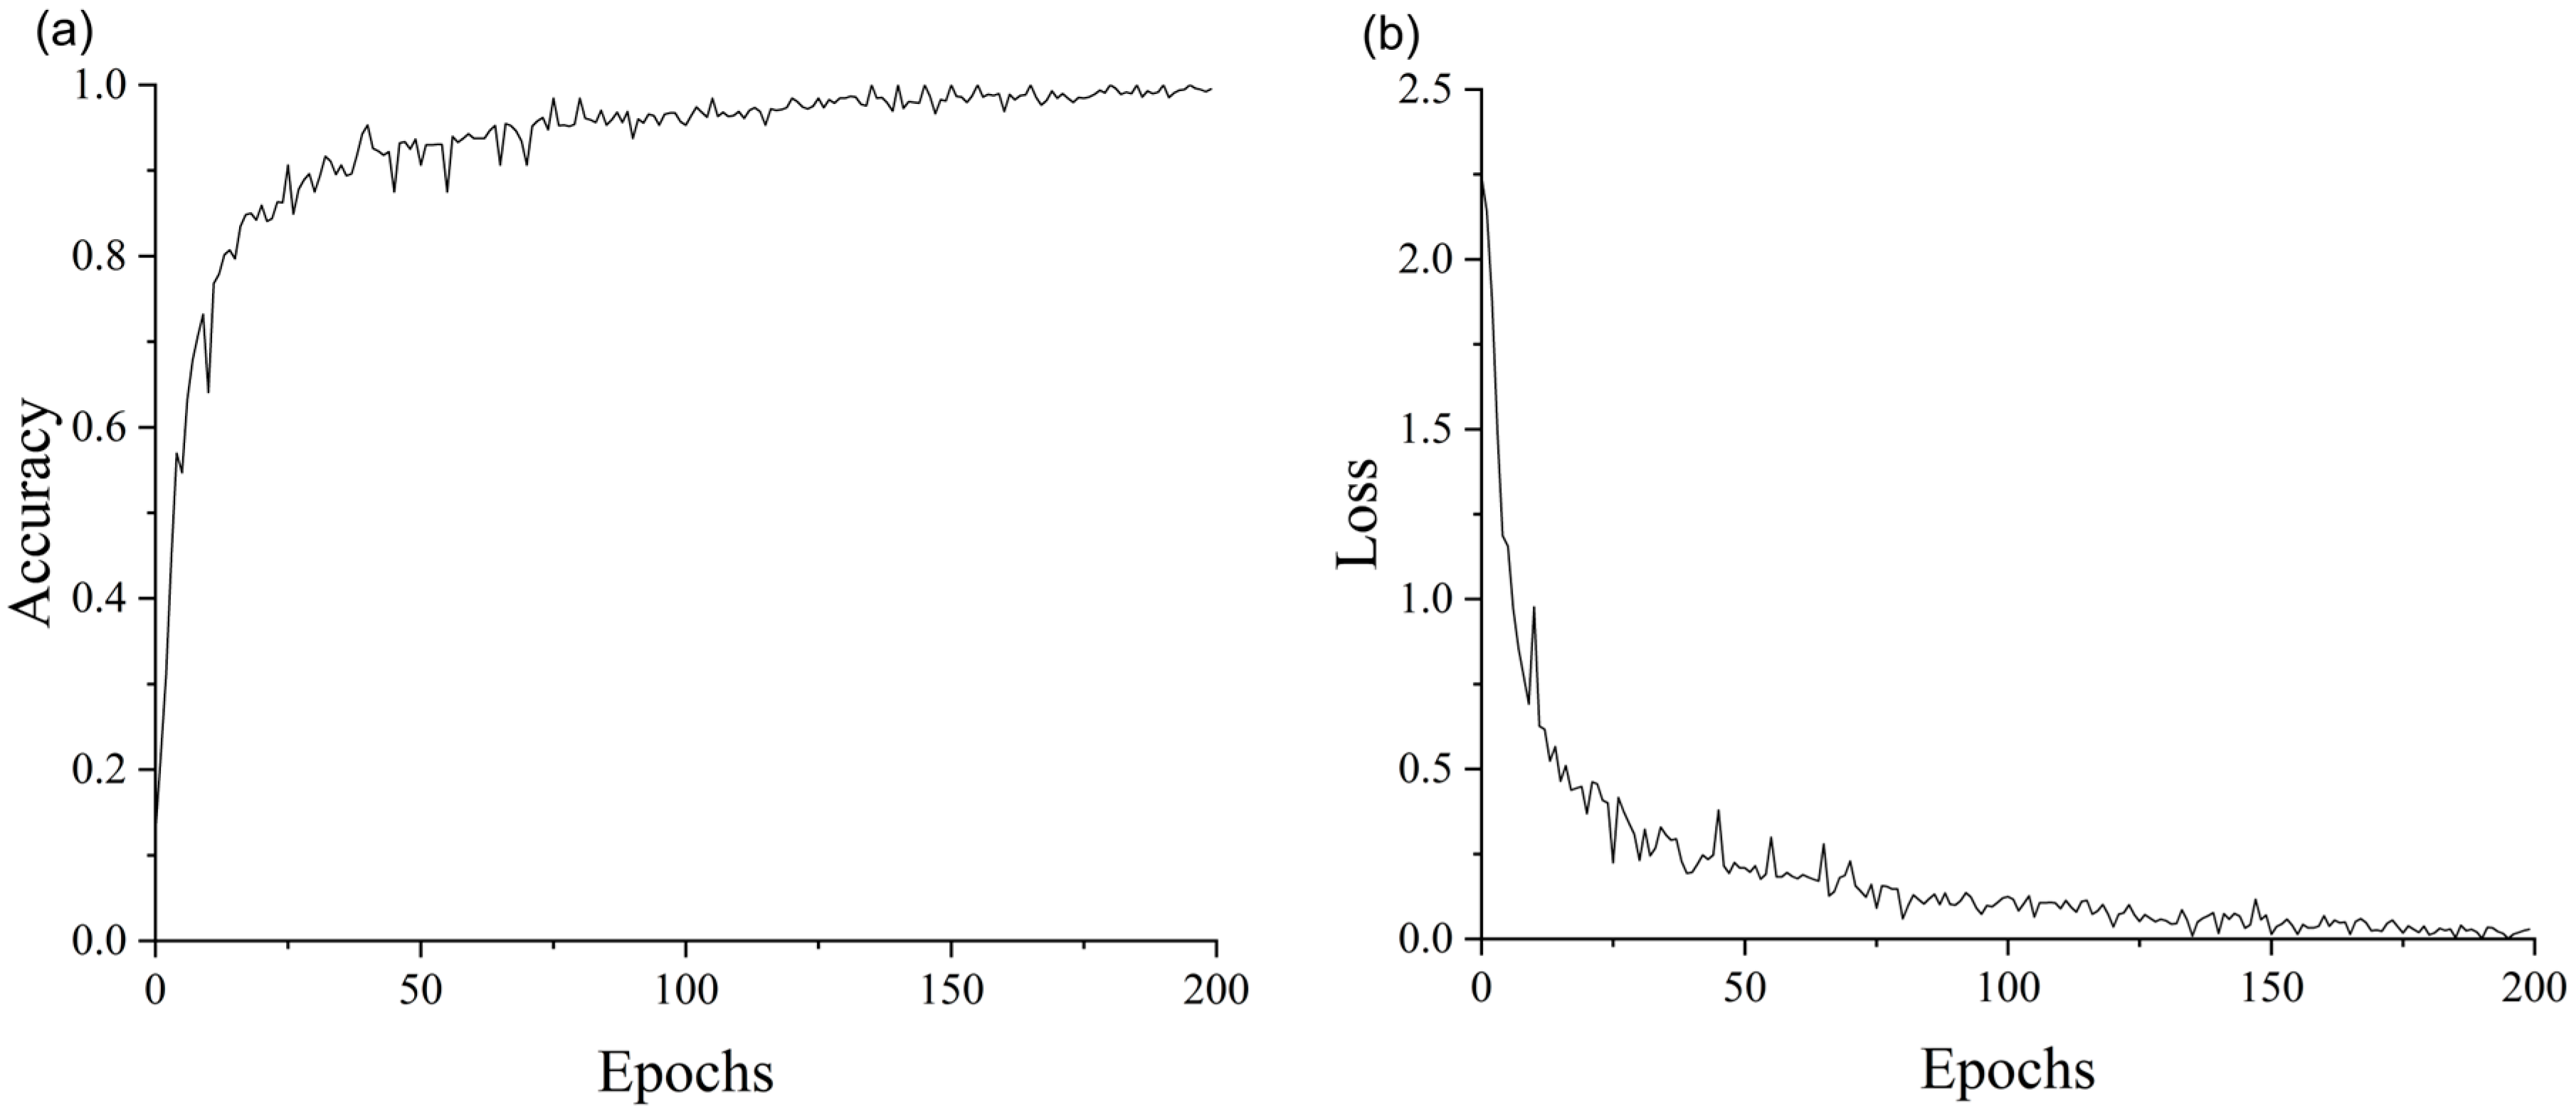
The soundscape recognition model was implemented using Python 3.12 and PyTorch 2.3.1. Training was conducted on a system equipped with an Intel Core i5-12400F CPU (Intel Corporation, Santa Clara, CA, USA) and an NVIDIA GeForce RTX 4070 12 GB GPU (NVIDIA Corporation, Santa Clara, CA, USA). Key training parameters included epochs, batch size, learning rate, and dropout rate. Considering the characteristics and size of the training dataset, available computational resources, and the complexity of the network architecture, the model was trained with the following settings: epochs of 200, batch size of 64, learning rate of 0.001, and a dropout rate of 0.1. The Adam optimizer was employed for gradient updates throughout the training process.
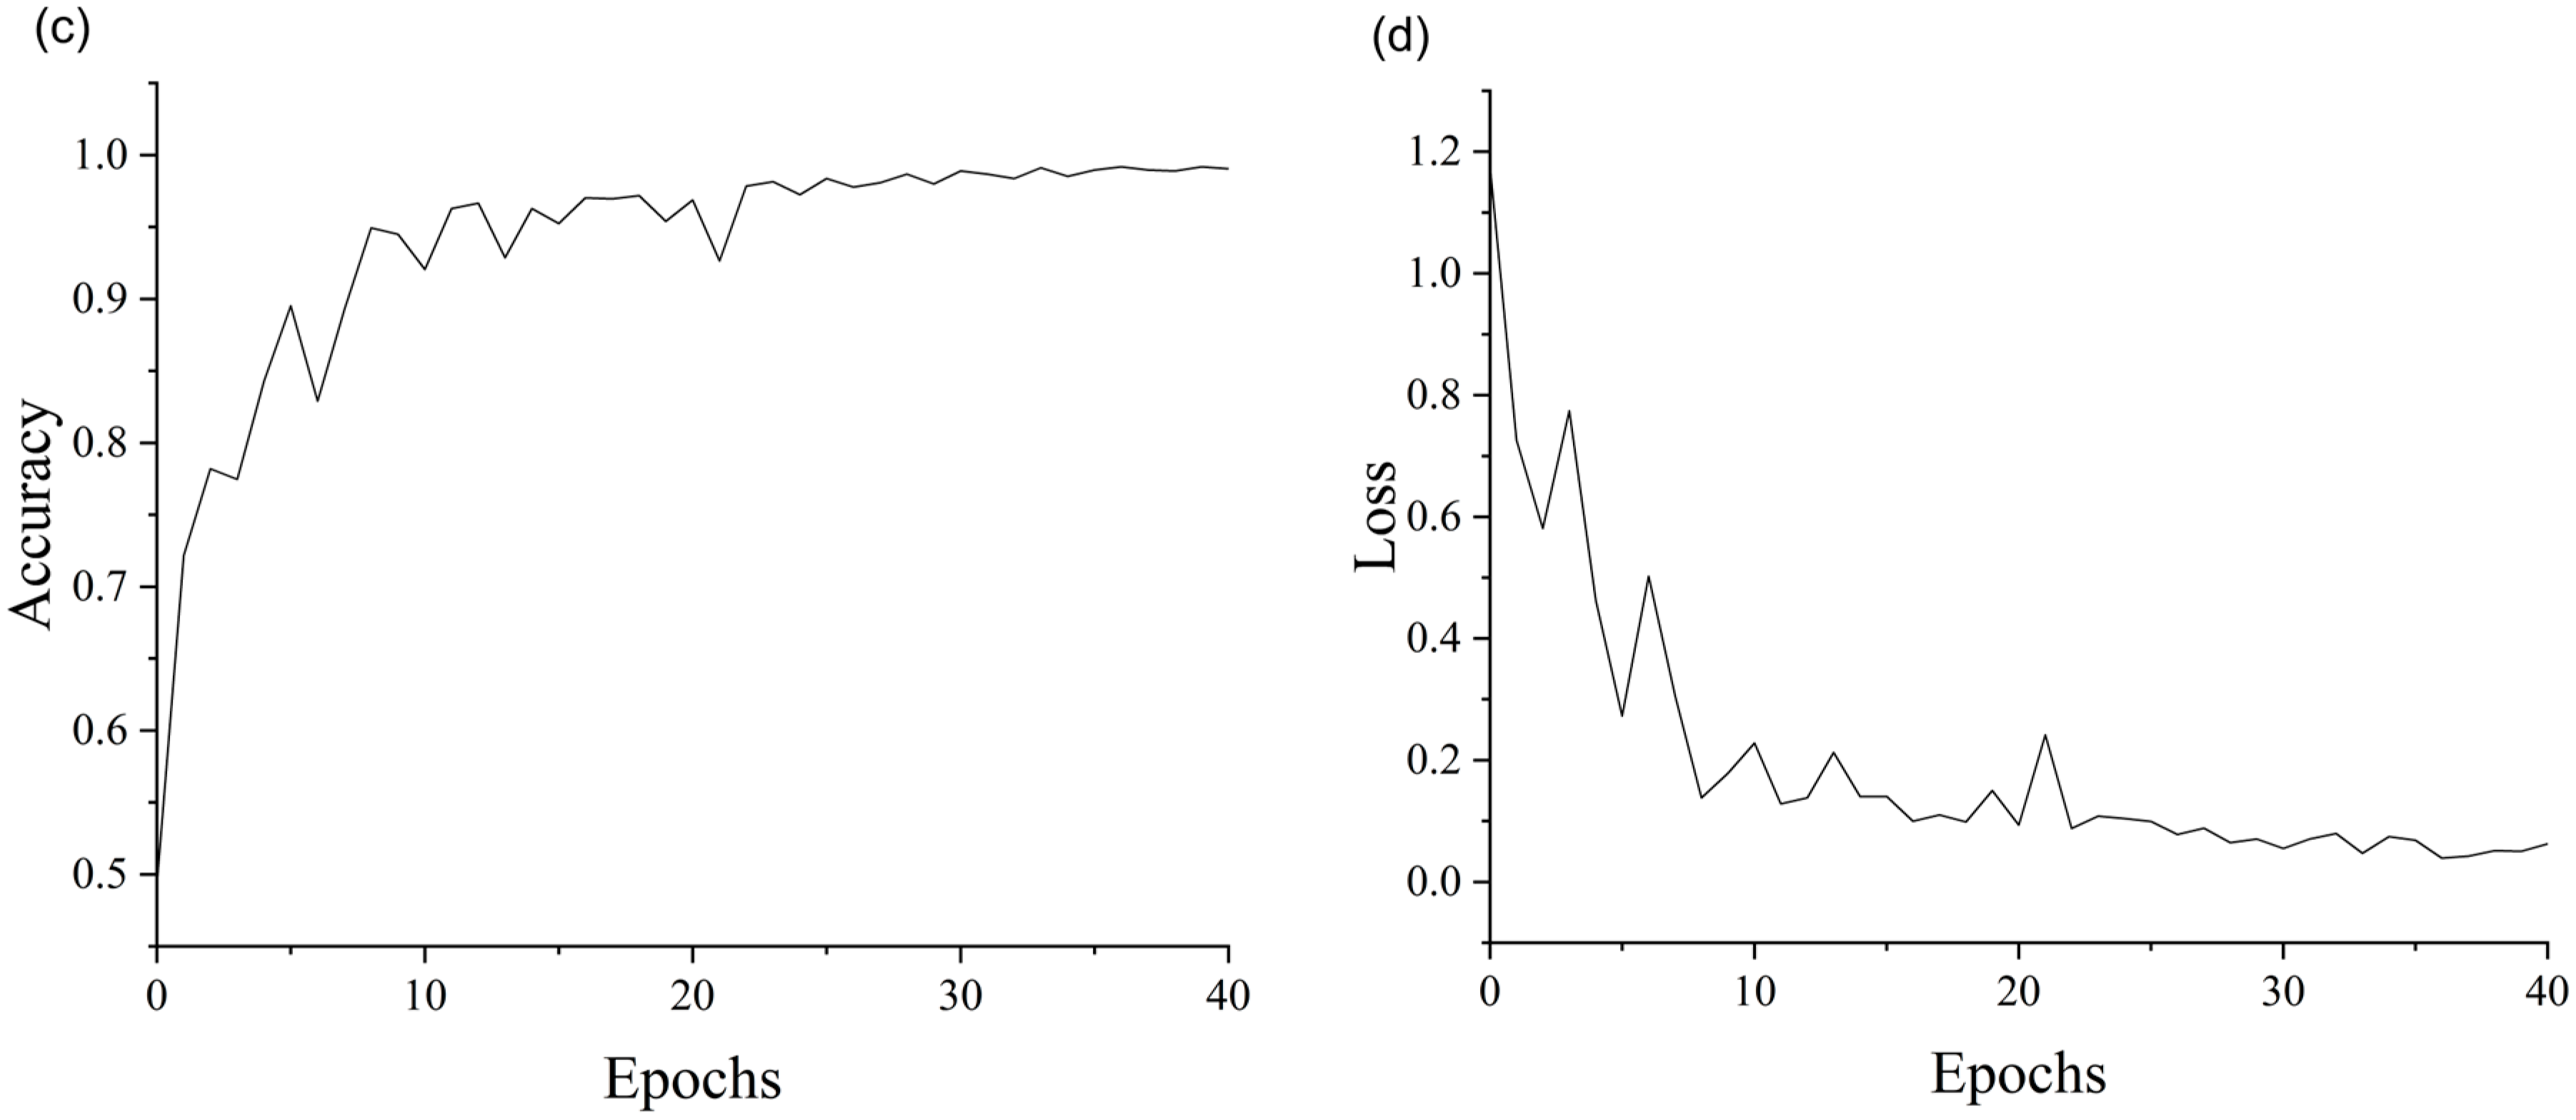
Based on the training configuration described above, the model’s performance during training is illustrated in (Figure 4). Figure 4a,b present the accuracy and loss curves for the training set, while Figure 4c,d display the corresponding results for the validation set. In the early training stage (first 50 epochs), both accuracy and loss exhibited significant fluctuations, indicating that the model was in a rapid learning phase. Between epochs 50 and 150, the rate of change in both curves noticeably decreased, suggesting that the model’s learning process was gradually stabilizing. After 150 epochs, the training accuracy and loss curves generally demonstrated a convergent trend with minor oscillations.
On the validation set, both accuracy and loss showed substantial changes within the first 10 epochs, began to stabilize between epochs 10–30, and remained largely stable after 30 epochs. It is worth noting that a transient decline in validation accuracy and a corresponding rise in validation loss occurred between epochs 20–25, which may be attributed to differences in data distribution or instability during early-stage weight updates. However, this phenomenon was short-lived, and the curves quickly returned to stability. Overall, the validation curves align well with the training curves in terms of trend, and both converge smoothly in later stages without showing a divergence where training performance keeps improving while validation performance deteriorates—demonstrating satisfactory learning capability and generalization performance.
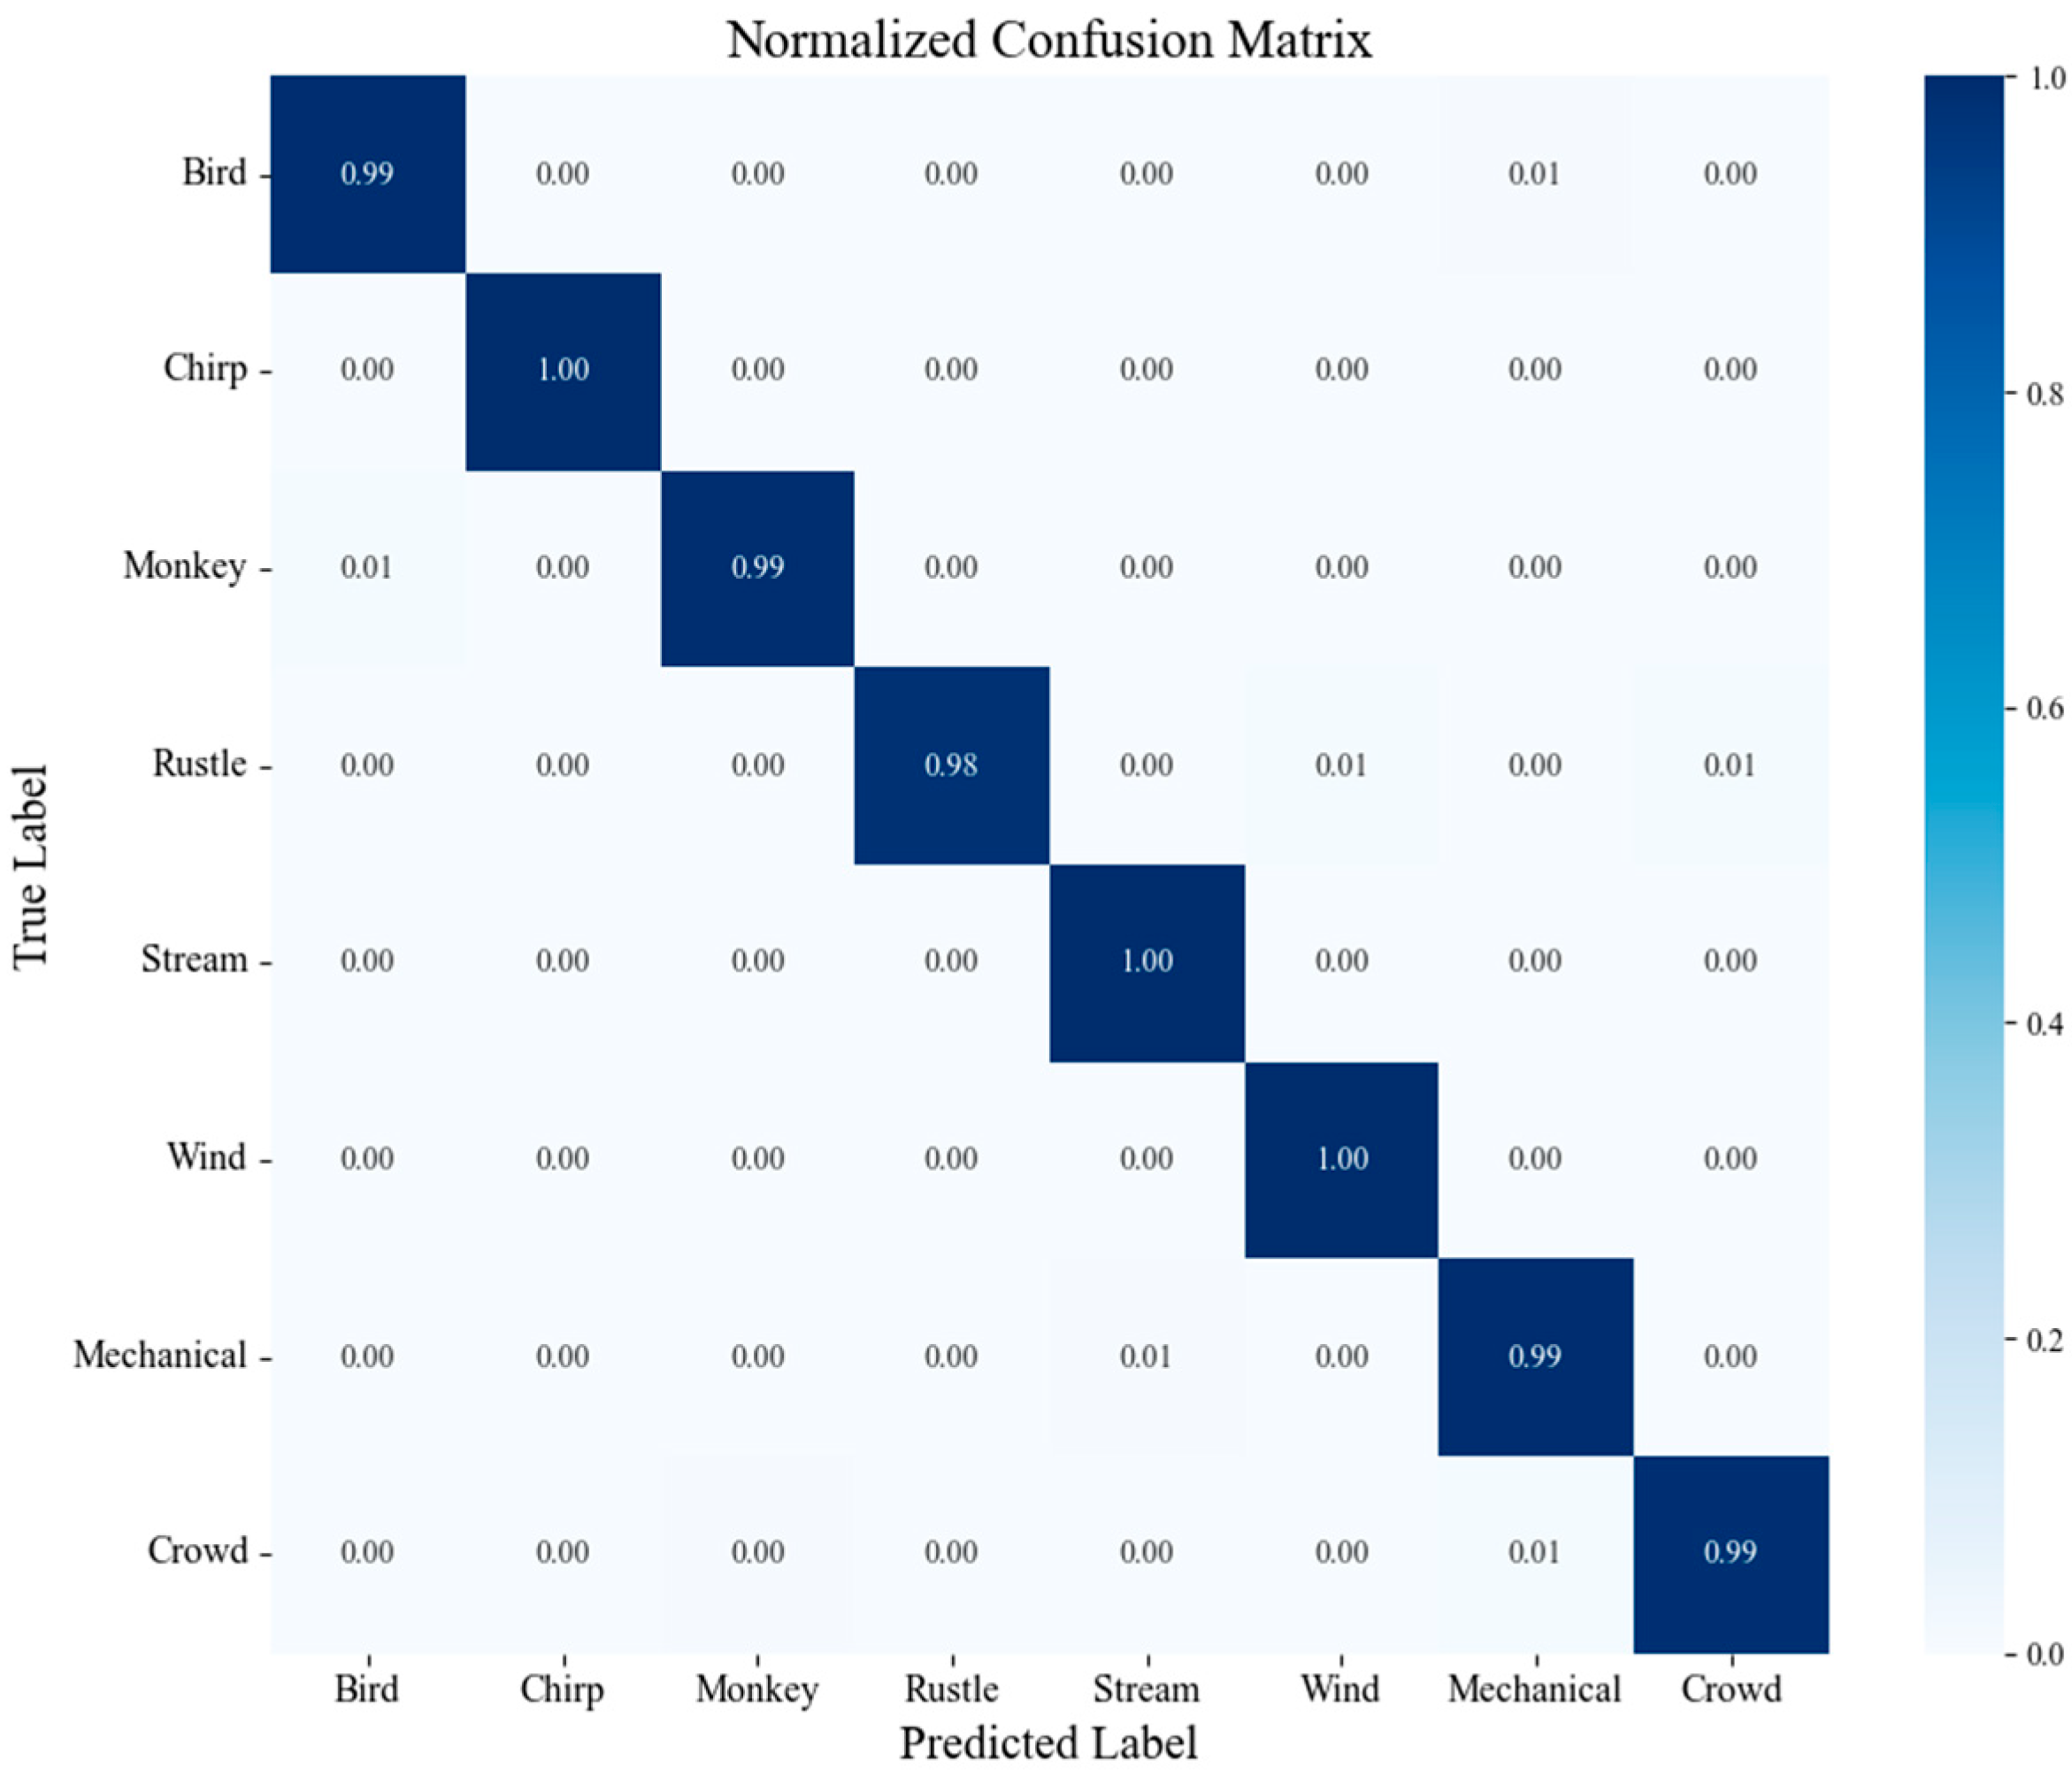
As shown in the confusion matrix (Figure 5), the model achieved perfect recognition of validation samples for chirp, stream, and wind. It also demonstrated high recognition accuracy for bird, monkey, rustle, mechanical, and crowd. Misclassifications primarily stem from overlapping acoustic features among different sound sources. For example, confusion between monkey and bird may arise because high-pitched vocalizations from juvenile macaques overlap with birds in frequency distribution, thereby reducing the model’s ability to distinguish between these two categories. Similarly, rustle was sometimes misclassified as wind, likely because rustle is often generated by wind blowing through foliage—making the two acoustically similar in origin. In addition, certain human activities (e.g., clothing friction, stepping on fallen leaves) produce sound patterns that closely resemble rustle in their spectral texture, further interfering with accurate classification. This overlap partially explains why the accuracy for rustle was slightly lower than other classes, registering at 0.98.
To comprehensively evaluate the classification performance of the selected model on the forest park soundscape dataset, we conducted a comparative experiment using three deep learning models: PANNs, CAM++, and ECAPA-TDNN, all tested on the same validation dataset. The main evaluation metrics included the weighted average values of Precision, Recall, and F1-Score. Precision measures the proportion of correctly predicted samples among all instances predicted as a certain class. Recall assesses the proportion of actual class instances that were correctly identified by the model. F1-Score, as the harmonic mean of precision and recall, reflects the overall balance between the two metrics. All validation data used for evaluation were entirely independent of the training set and served exclusively for final performance testing, ensuring the fairness and generalizability of the results. As shown in (Table 4), the PANNs model outperformed both CAM++ and ECAPA-TDNN in terms of precision, recall, and F1-score. Its superior performance demonstrates stronger stability and robustness in handling natural soundscape data, making it particularly well-suited for the relatively stable and continuous acoustic patterns found in forest environments as investigated in this study.

3. Results and Analysis

3.1. Temporal Dynamics of Forest Park Soundscapes

3.1.1. Temporal Characteristics of Soundscapes Under Different Dominant Sound Source Types

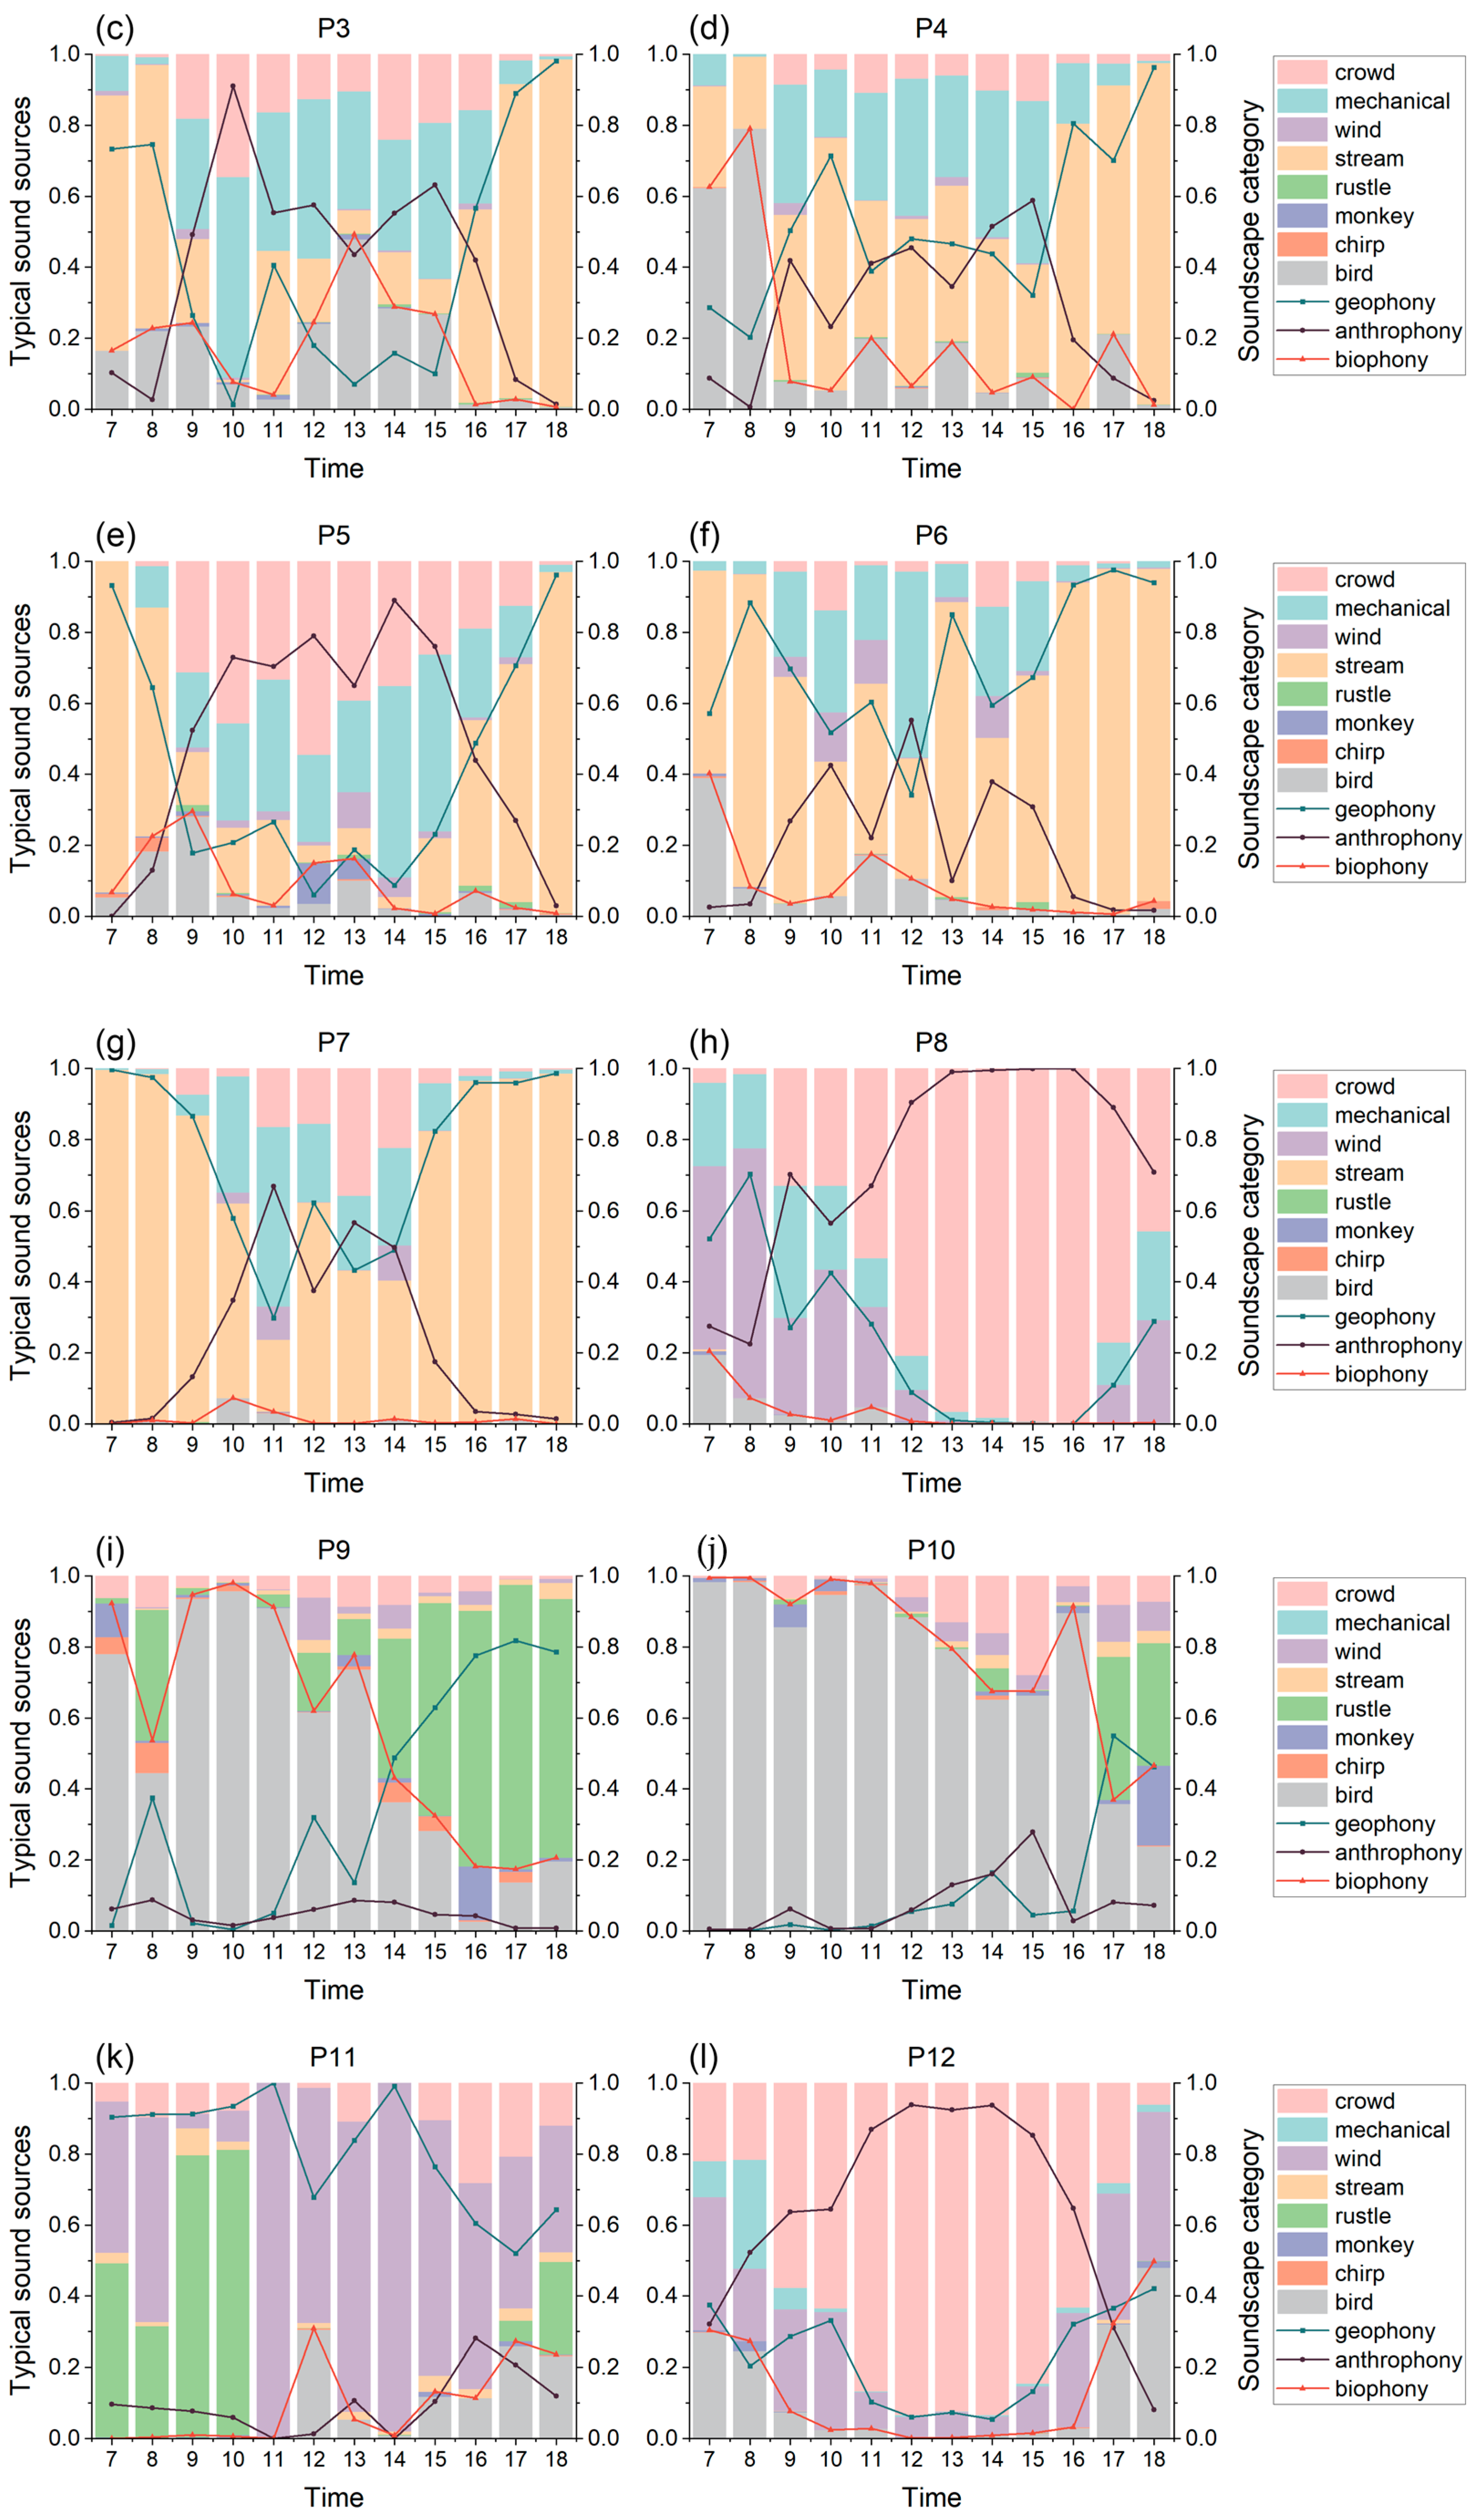
The preprocessed audio segments collected from the 12 sampling points during park opening hours were input into the trained soundscape recognition model for classification. The results revealed significant differences in both sound source composition and temporal variation across sampling sites. The temporal dynamics of the 12 sampling points, which serve as the basis for soundscape categorization, are presented in Figure 6. According to the proportion of soundscape categories presented in Figure 6, the sampling points were further categorized into four types: biophony-dominant, geophony-dominant, anthrophony-dominant, and composite-type.
Sampling points P9 and P10 were classified as biophony-dominated sites. The typical sound source at both points was bird, which exhibited a distinct morning peak pattern. Biophony accounted for the highest proportion of the soundscape during the morning hours, followed by a gradual and fluctuating decline throughout the day. In contrast, the proportion of geophony increased steadily over time, indicating a dynamic substitution relationship between biological and geophysical sounds. Meanwhile, the proportion of anthrophony remained consistently low and exhibited minimal fluctuation, suggesting limited human disturbance in this area. Field observations further confirmed that both sampling points are located at the edge of dense forest areas, characterized by high vegetation cover and strong ecological connectivity, providing favorable and stable conditions for bird habitation and activity. The low intensity of human activity in these areas reinforces the biophony-dominated soundscape characteristics.
The geophony-dominated sampling points included P6, P7, and P11. The typical sound sources at P6 and P7 were primarily stream, and the geophony proportions at both sites exhibited a “low in the middle, high at both ends” temporal pattern over the course of the day. Specifically, geophony accounted for a higher proportion during the early hours (07:00–09:00) and late hours before park closure (16:00–19:00), while it declined significantly during the midday period when tourist activity was at its peak. This trend was found to be negatively correlated with the temporal pattern of anthrophony, which showed an opposite “high in the middle, low at both ends” distribution. This indicates that the influx of human activity sounds can mask or suppress the perception of geophony, thereby reducing their perceived dominance within the soundscape during periods of high tourist density. In contrast, P11 remained geophony-dominated throughout the entire operating period. Neither biophony nor anthrophony significantly altered the dominant sound source type at this location. Situated on a mountaintop viewing platform, the site features open terrain and minimal obstructions, with typical sound sources including wind and rustle. Tourist behavior at this location generally involves short-term stops, and visitor density is relatively low, resulting in limited anthropogenic interference and allowing geophony to maintain its stable dominance throughout the day.
The anthrophony-dominated sampling points included P1, P2, P5, P8, and P12. Except for P1, all other sites exhibited a typical “high in the middle, low at both ends” pattern in the proportion of anthrophony. Specifically, the proportion of anthrophony was relatively low during the early opening period (07:00–09:00) and the late closing period (17:00–19:00), but increased sharply during the peak visitation period (09:00–17:00), peaking during this time. This pattern aligns well with the general behavioral process of entry–visiting–departure, indicating that human activity is the dominant acoustic driver in these areas. In contrast, P1 exhibited a different pattern, with consistently high levels of anthrophony throughout the day, without a distinct peak. Both auditory inspection and field observations indicated that this sampling point is located near a visitor convergence zone, where continuous crowd presence, tour guide narration, and vendor calls collectively contribute to a persistent anthrophony-dominated soundscape. These results suggest that in some areas, soundscape characteristics are more strongly influenced by site function and crowd density than by temporal dynamics alone.
The composite-type sampling points included P3 and P4. These sites did not exhibit a clearly dominant sound source category; rather, their soundscape composition was closely linked to fluctuations in visitor numbers. Both points were located near streams and walking trails, often adjacent to small facilities designed for short-term visitor rest or stops. Due to the semi-enclosed spatial configuration and lack of large open areas, these sites are not suitable for long-term crowd aggregation. In terms of sound composition, biophony (bird) and geophony (stream) persist as stable components of the acoustic background. However, anthrophony is introduced periodically as visitors pass by or pause briefly, leading to a cyclical shift in sound source dominance throughout the day. This interaction results in a typical composite soundscape, in which biophony, geophony, and anthrophony alternate as dominant contributors depending on the time of day and transient human activity patterns.

3.1.2. Temporal Characteristics of Soundscapes Across Different Time Periods

The park’s operating hours were divided into three distinct time periods: the early opening period (07:00–09:00), the peak visitation period (09:00–17:00), and the late closing period (17:00–19:00). This division was based on official park visitor traffic statistics and preliminary observational data, which indicated a significant increase in visitor numbers after 09:00, followed by a gradual decrease after 17:00, forming distinct peaks and troughs. The dominant soundscape features observed during each time period are summarized as follows.
During the early opening period, morning activity among biological communities exhibited high temporal synchronicity, with biophony dominating most sampling sites. Notably, sampling points such as P4, P9, and P10, located near the edges of dense forest, showed distinct morning chorus peaks during this period. In contrast, geophony—due to its relatively stable and continuous nature—remained consistent across sites such as P3, P7, and P11, showing only minor fluctuations in relative proportion. At this stage, anthrophony remained low at most sites, as the majority of tourists had not yet entered the park. However, P1, P2, P8, and P12, which are situated near trail entrances, showed perceptible levels of anthrophony, reflecting the influence of early-arriving visitors. At these locations, the proportion of anthrophony generally exhibited an upward trend. Overall, the early morning period was dominated by biophony and geophony, representing the ecologically richest phase of the forest soundscape throughout the day.
As visitors gradually entered the park and dispersed throughout various areas, the soundscape during the peak visitation period exhibited a general pattern of anthrophony increasing and then decreasing across all sampling points. This trend was especially pronounced at P1, P2, P5, P8, and P12, which are located near visitor hubs and main walking trails. In areas where anthrophony was not originally dominant—such as P2, P5, P8, and P12—the increase in human activity sounds produced a notable masking effect on biophony and geophony, resulting in a weakening or displacement of the dominant natural sound sources during this period. Moreover, sampling points such as P3, P4, and P7 also exhibited periodic increases in anthrophony, further reinforcing the conclusion that tourist activity is a key driver of the diurnal dynamics of the forest soundscape.
During the late closing period, the number of visitors gradually decreased, and the proportion of anthrophony declined accordingly across all sampling points. In contrast, biophony and geophony showed an upward trend at most sites, gradually regaining prominence within the soundscape. At P3 and P5, stream once again became dominant. At P2, P4, and P9, natural sounds reemerged as the primary acoustic components following a reduction in human disturbance. However, the frequency of bird calls during this period was lower than that observed during the early morning peak, indicating that while natural sounds regained dominance, the composition of dominant sound sources differed from the early opening hours. In contrast, P1 and P8, located near park exits or transportation nodes, remained relatively high in anthrophony proportion, despite a decrease from the daytime peak. This reflects the lingering impact of departing visitor flows on the acoustic environment in these transitional zones.

3.2. Spatial Pattern of Forest Park Soundscapes

3.2.1. Spatial Distribution Patterns of Typical Sound Sources

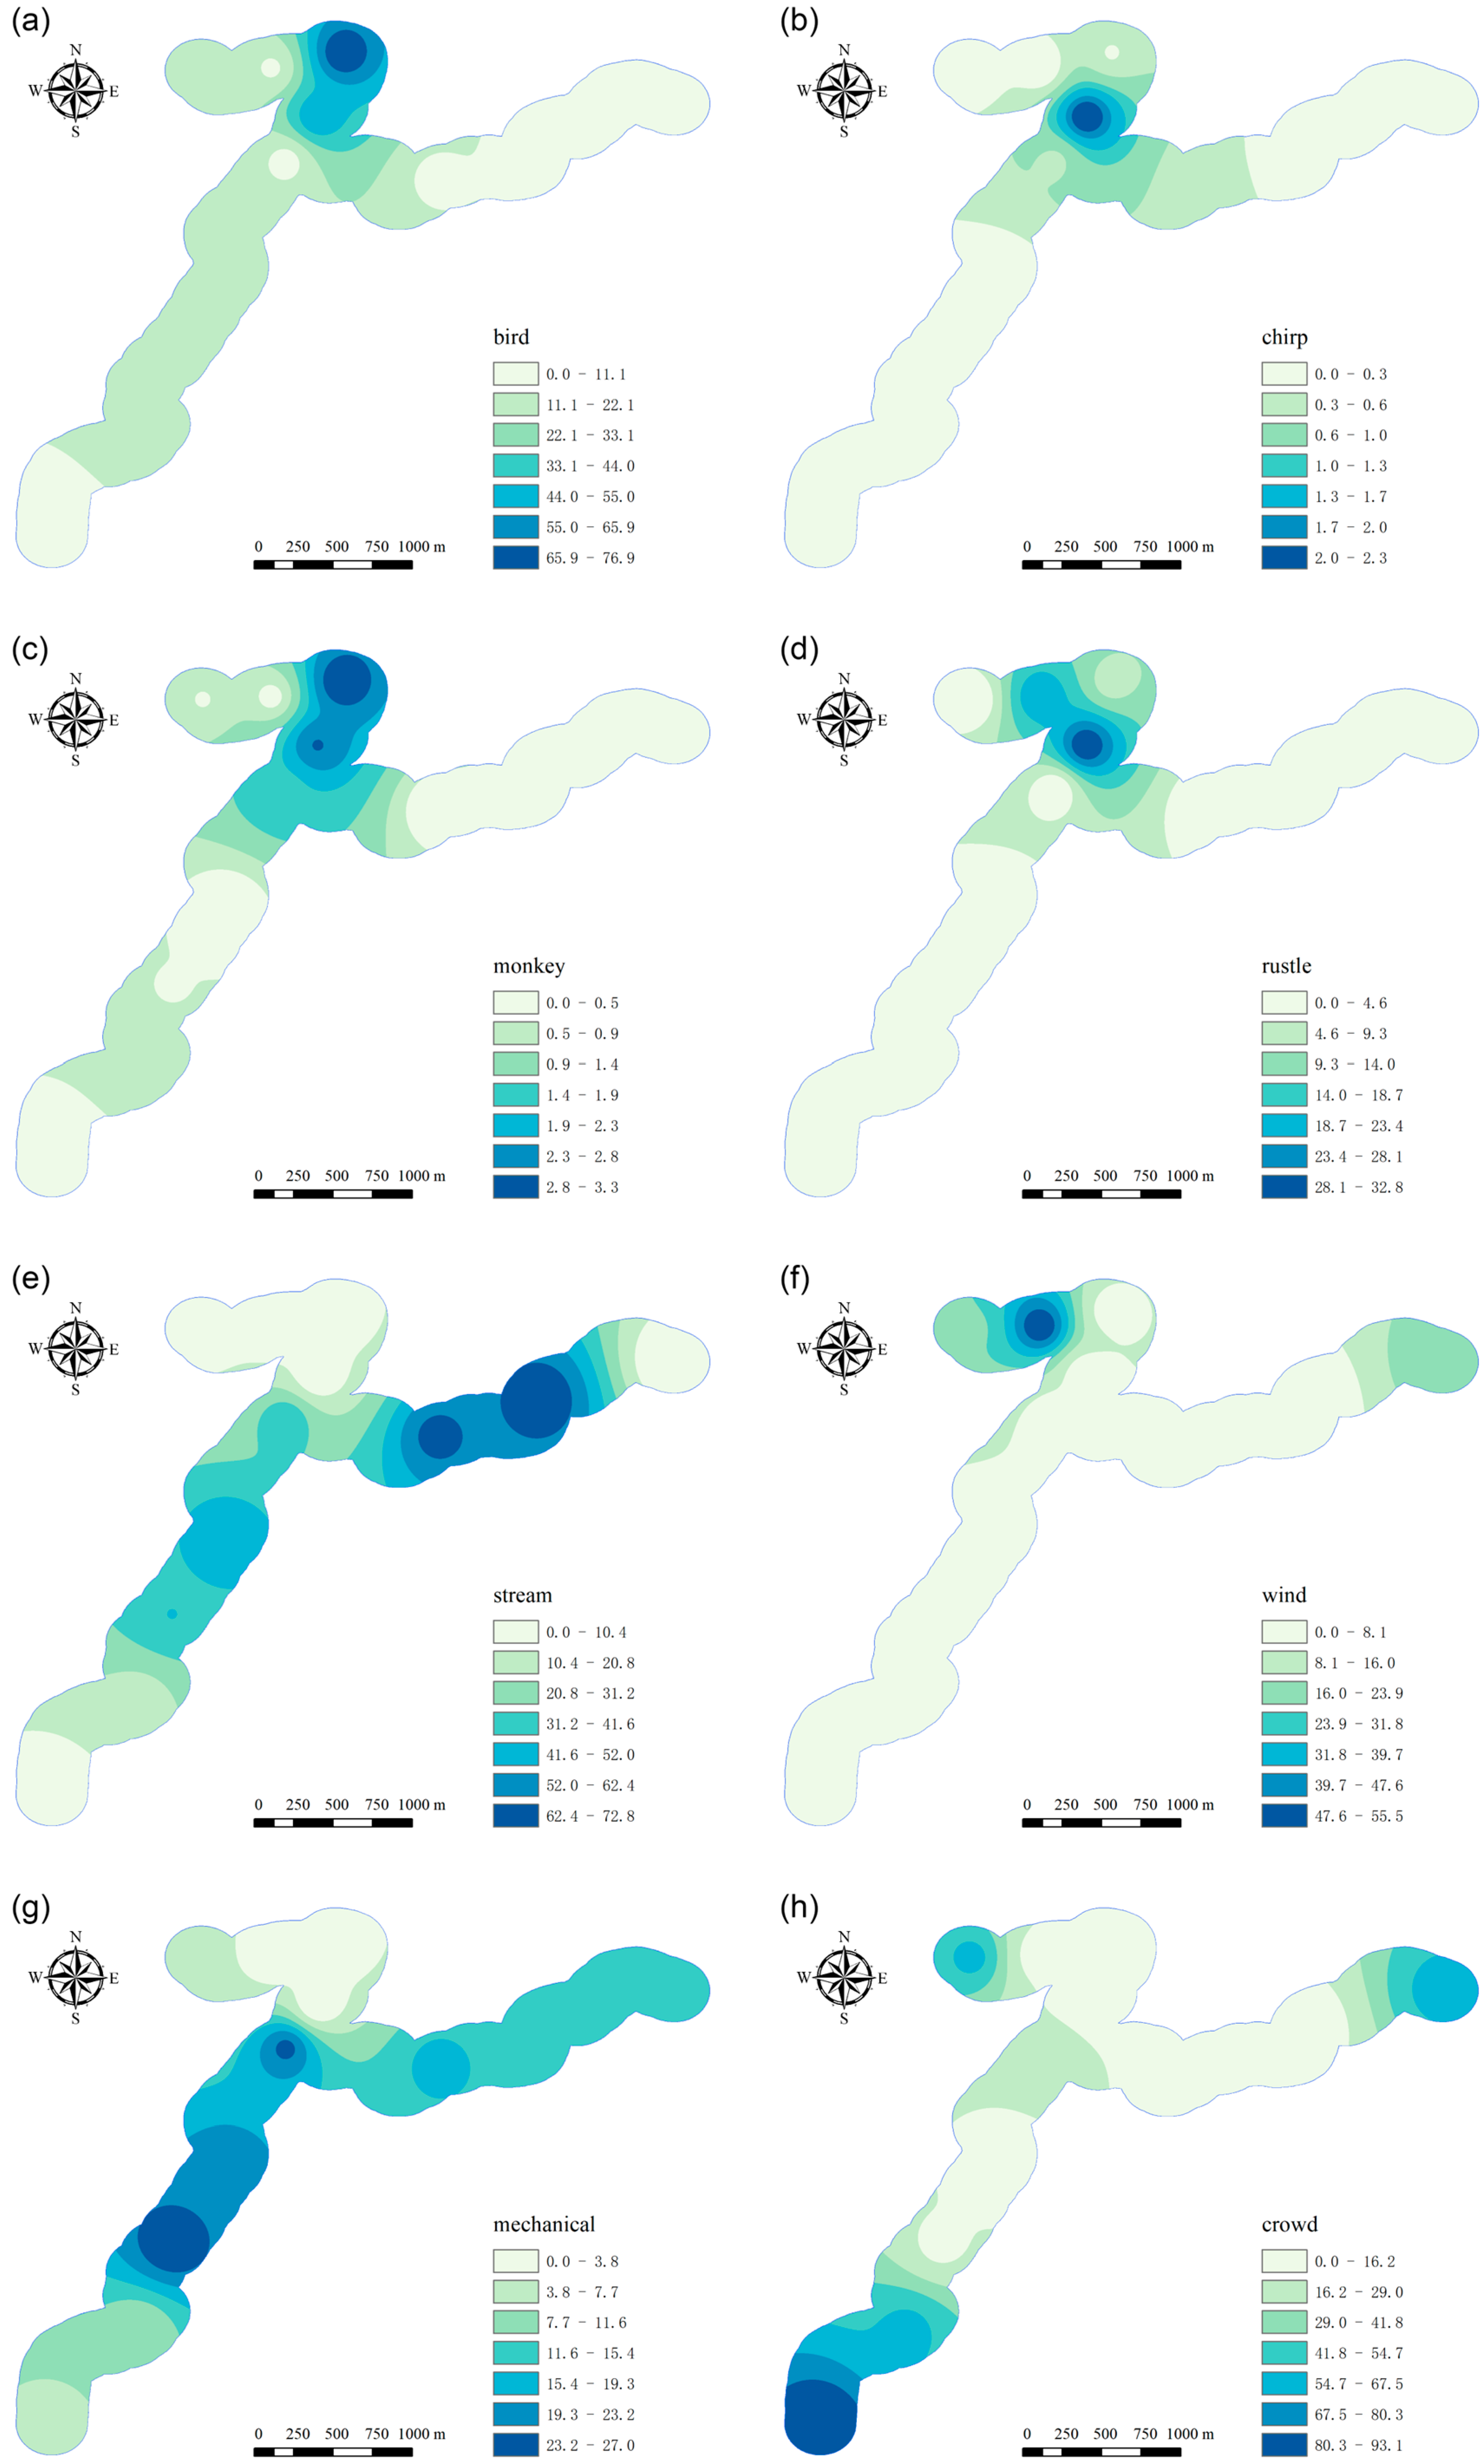
A 200-m buffer zone was established along the main walking route. This distance was determined based on field surveys, which revealed that the composition of sound sources remains relatively stable within approximately 200 m, while a larger range would introduce excessive heterogeneity due to the influence of surrounding topography and sound propagation patterns [45]. Within this zone, the daily average proportions of typical sound sources at each sampling point during park opening hours were calculated. Spatial visualization was performed using the Inverse Distance Weighted (IDW) interpolation method (Figure 7). The interpolation results revealed distinct spatial clustering and dispersion patterns of different sound source types across the park. Bird showed the highest proportion at P10, where the surrounding environment is enclosed, vegetation is diverse, and tourist activity is relatively low-highlighting the dominance of bird vocalizations in areas with minimal human disturbance. Chirp was most prominent around P9, a valley encircled by mountains. The surrounding topography likely produces echo effects, which enhance the propagation and perceptibility of chirp. Notably, there was a clear temporal separation between the high-value zones of chirp and bird, suggesting possible ecological niche partitioning or acoustic competition between species. Monkey were most apparent around the P9–P10 corridor, a segment of the hiking trail characterized by rich natural resources and low visitor density. This area appears to function as an ecological buffer zone for primate activity, aggregation, and movement. These results reflect the sensitivity of primate species to human disturbance, as well as their dependence on suitable habitat conditions for acoustic expression and social behavior.
Rustle were concentrated in P9, an area characterized by an enclosed environment and low background noise, offering ideal natural conditions for the generation and transmission of rustle. Stream was highly concentrated in the Golden Whip Stream, particularly at P6 and P7, where the water flow is fast-moving and the terrain is steep and undulating. Low levels of human disturbance in this section allow geophony to maintain high acoustic intensity, making it the dominant contributor to the soundscape structure in the area. Wind was mainly distributed in ridge areas, with the highest proportion observed at P11. Although P12 has similar topographical features, the frequent tourist activity there partially masked wind. P8, with its open terrain and relatively high wind speeds, also exhibited a comparatively high proportion of wind. These observations collectively indicate that the spatial distribution of wind is influenced by a combination of topographical conditions and anthropogenic disturbance.
Mechanical were primarily concentrated along the Golden Whip Stream corridor, particularly at P3 and P5, which lie along major tourist pathways and also serve as logistical access routes for support vehicles. The spatial distribution of mechanical noise closely aligned with road accessibility and the layout of functional nodes, indicating a strong correlation between infrastructure and mechanical sound intensity. It is noteworthy that crowds are not solely generated by individual visitor behavior; it is also influenced by indirect factors, such as tour guide activity. Field observations revealed that during group tours, guides often follow predefined itineraries based on time schedules, directing groups to move quickly through certain scenic spots or retrace their steps. This results in concentrated crowd gatherings and localized peaks in human acoustic intensity at specific nodes, such as P2, P7, and P12. Conversely, in mid-route sections or non-core scenic areas, both visitor density and anthrophony intensity were significantly lower. This tour guide-driven flow management model contributes to a “high at both ends, low in the middle” spatial pattern of anthrophony along the route. Such a pattern plays a key role in shaping non-natural dominant soundscape disturbances, reflecting the behavioral imprint of organized tourism on the acoustic environment.

3.2.2. Analysis of Topographic Characteristics of Soundscape Distribution

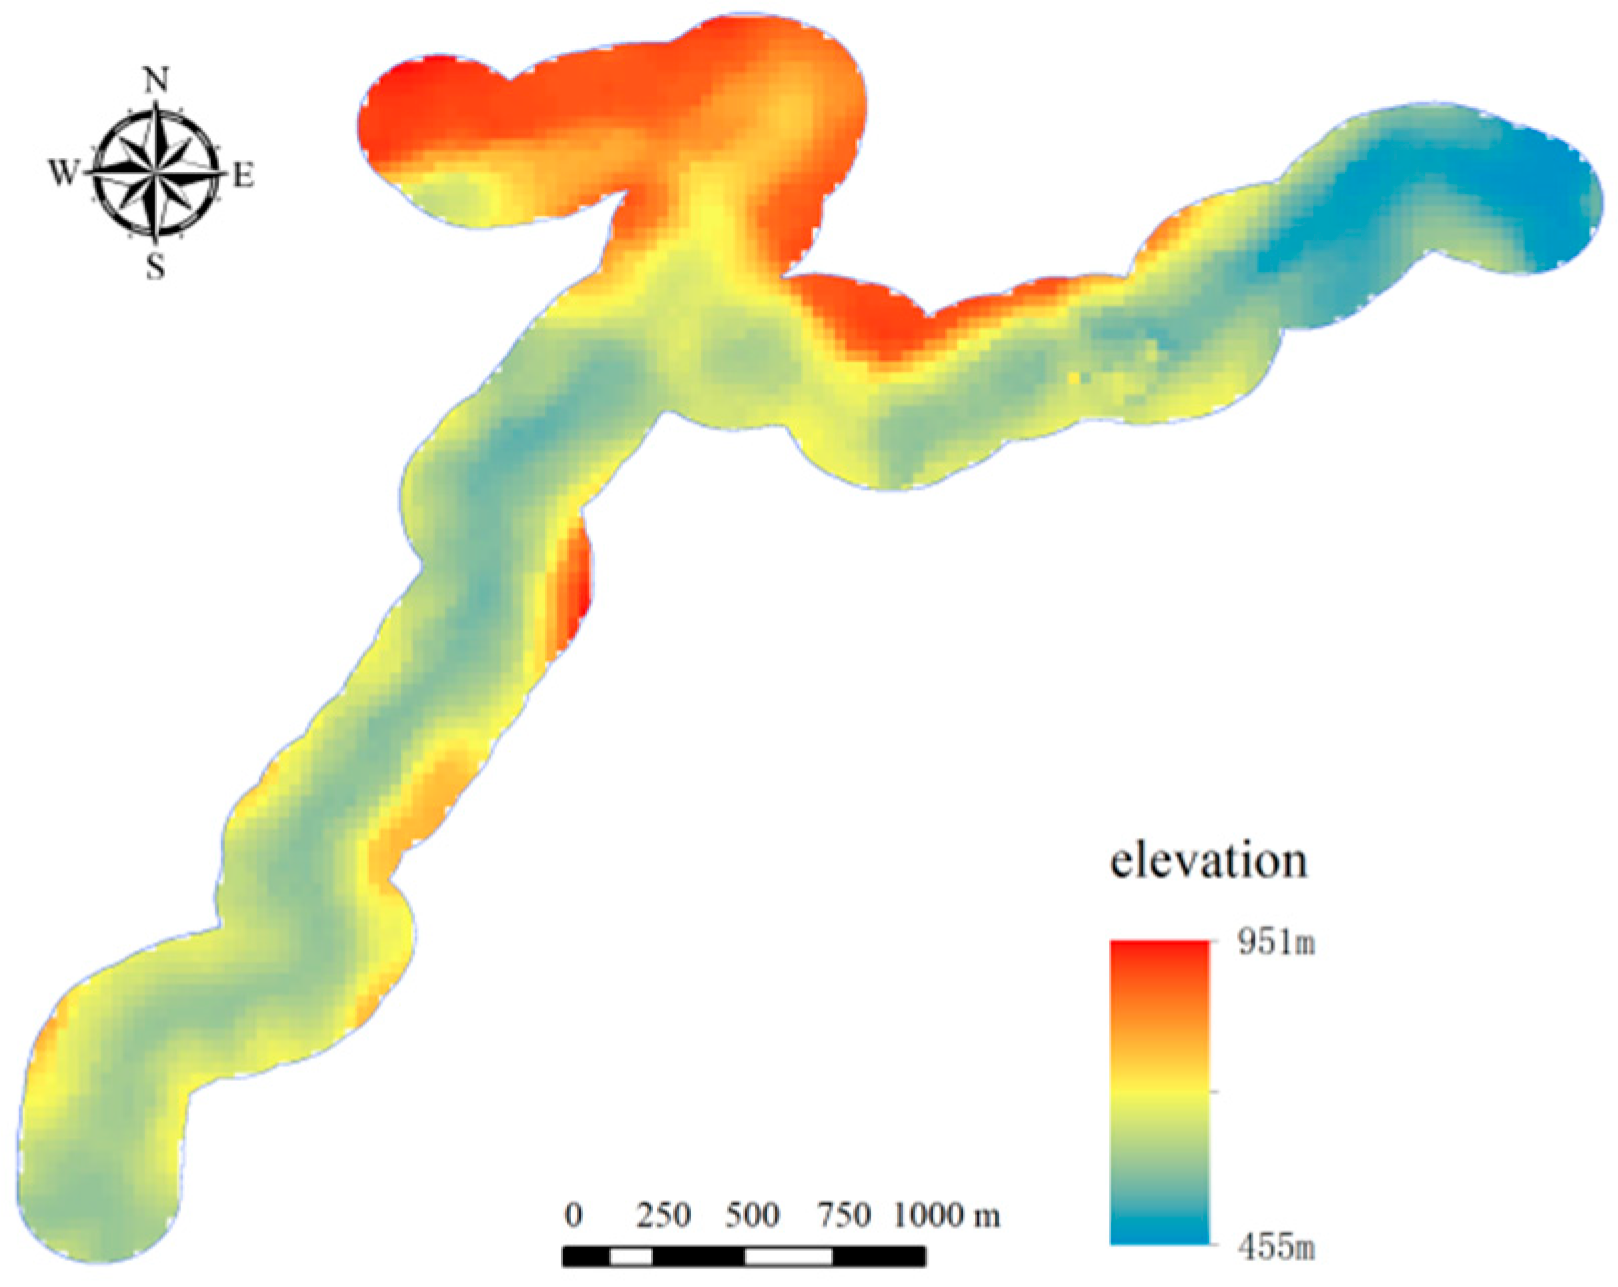
The elevation of the Golden Whip Stream trail gradually decreases from Oxygen Bar Square (588 m) to Shuiranshi Gate (460 m), while the mountain climbing trail ascends from the Viewing Platform (720 m) to Luanchuanpo (810 m), Hough Garden (870 m), and finally to the highest point, Mihun Platform (920 m). The Digital Elevation Model (Figure 8) was compared with the IDW interpolation results of soundscape types (Figure 9). The results indicate that geophony was widely distributed across the area and was more prominent in sections of the Golden Whip Stream with greater elevation drop (P6, P7). This is likely because the stream sound intensity increases in these areas due to faster flow velocity and stronger turbulence. In high-altitude, open ridge areas, wind noise was frequently perceived, potentially influenced by wind corridors formed by the topography. Although biophony was generally less dominant than geophony and anthrophony, high-value zones were observed in valley areas, particularly those near mountain trails (P9, P10). In these areas, the acoustic amplification effect caused by echoes from rock walls alongside the trails may create favorable conditions for the transmission and perception of biological sounds. In contrast, anthrophony was clearly concentrated in areas with flat terrain, high accessibility, and frequent tourist activity around functional nodes. These areas often featured overlapping sound sources such as crowd noise and mechanical noise, forming primary hotspots of soundscape disturbance. Overall, topography not only shapes the physical pathways of sound propagation but also indirectly influences the formation of dominant soundscape types and their spatial clustering characteristics.

4. Discussion and Conclusions

This study applied a deep learning model with Mel spectrograms as input features to classify eight representative sound source categories in a forest park. The model demonstrated higher efficiency and stability compared to traditional manual interpretation, confirming the feasibility of automatic soundscape recognition.
From a temporal perspective, biophony and anthrophony exhibited a clear inverse relationship. Bird choruses were observed during the early opening hours (07:00–09:00) and late closing period (16:00–19:00), consistent with previous studies [15]. Biophony peaked in the morning but declined sharply as tourist activity increased, while anthrophony showed the opposite trend. These patterns suggest possible temporal shifts and spatial avoidance behaviors among birds and monkeys in response to human disturbance [46,47]. Although a partial recovery of biophony was noted in the late afternoon, it did not return to morning levels, indicating a lag in soundscape recovery.
From a spatial perspective, the distribution of sound sources showed strong coupling with topography, vegetation, and infrastructure layout. High-value biophony zones were concentrated in valleys and dense forests with high ecological connectivity and low disturbance. Geophony (e.g., wind, streams) was strongly influenced by elevation and vegetation openness, while anthrophony was mainly distributed in visitor hubs, along major trails, and near transportation nodes. During the peak visitation period (09:00–17:00), acoustic masking effects were evident: both biophony and geophony were suppressed, and in some locations (e.g., P1), anthrophony remained persistently high, reducing the perceptibility of natural sounds. These spatiotemporal patterns are consistent with previous findings on the relationship between terrain, vegetation, and acoustic indices [48], and provide further empirical support for the acoustic niche hypothesis at specific temporal scales.
Based on these findings, several policy implications and future research directions are proposed. First, incorporating soundscape heterogeneity into spatial planning is essential. Biophony-dominated zones should be designated as soundscape conservation areas, with measures such as noise control and visitor behavior regulation to maintain acoustic quality. Second, areas where biophony and geophony predominate could be developed into natural sound experience trails to enhance visitor immersion and ecological awareness. In contrast, in anthrophony-dominated areas, improvements in tour guidance and sound management should be considered to reduce auditory disturbance.
Despite these advances, certain limitations remain. The current classification framework primarily operates at the second level, limiting species-level identification of bird vocalizations. Future work should integrate visual monitoring and species inventories to enhance fine-grained recognition of specific sound sources. Additionally, the dataset used here mainly covers typical daytime periods, lacking long-term seasonal monitoring. Expanding temporal sampling would allow the investigation of climate and seasonal effects on soundscape dynamics, providing a more comprehensive understanding of ecological acoustic processes.

Author Contributions

Conceptualization, D.Z., C.Y. and W.X.; methodology, D.Z.; formal analysis, C.Y.; investigation, C.Y., Z.H. (Zheqian He) and Z.H. (Zhongyu Hu); resources, D.Z. and W.X.; data curation, C.Y. and Z.H. (Zheqian He); writing—original draft preparation, D.Z. and C.Y.; writing—review and editing, W.X.; funding acquisition, D.Z. All authors have read and agreed to the published version of the manuscript.

Funding

This work was supported by the National Natural Science Foundation of China (No. 52268049), the Philosophical and Social Sciences Project of Zhangjiajie City (No. zjjskl2024044), and the Jishou University Scientific Research Project (No. Jdy23050).

Data Availability Statement

The raw data supporting the conclusions of this article will be made available by the authors on request.

Conflicts of Interest

The authors have no conflicts of interest to declare that are relevant to the content of this article.

References

  1. Huisman, E.R.C.M.; Morales, E.; Van Hoof, J.; Kort, H.S.M. Healing environment: A review of the impact of physical environmental factors on users. Build. Environ. 2012, 58, 70–80. [Google Scholar] [CrossRef]
  2. Kang, J.; Aletta, F.; Gjestland, T.T.; Brown, L.A.; Botteldooren, D.; Schulte-Fortkamp, B.; Lercher, P.; van Kamp, I.; Genuit, K.; Fiebig, A.; et al. Ten questions on the soundscapes of the built environment. Build. Environ. 2016, 108, 284–294. [Google Scholar] [CrossRef]
  3. Kogan, P.; Arenas, J.P.; Bermejo, F.; Hinalaf, M.; Turra, B. A Green Soundscape Index (GSI): The potential of assessing the perceived balance between natural sound and traffic noise. Sci. Total Environ. 2018, 642, 463–472. [Google Scholar] [CrossRef] [PubMed]
  4. Lawrence, B.T.; Hornberg, J.; Schröer, K.; Djeudeu, D.; Haselhoff, T.; Ahmed, S.; Moebus, S.; Gruehn, D. Linking ecoacoustic indices to psychoacoustic perception of the urban acoustic environment. Ecol. Indic. 2023, 155, 111023. [Google Scholar] [CrossRef]
  5. Haselhoff, T.; Schuck, M.; Lawrence, B.T.; Fiebig, A.; Moebus, S. Characterizing acoustic dimensions of health-related urban greenspace. Ecol. Indic. 2024, 166, 112547. [Google Scholar] [CrossRef]
  6. Zhong, B.; Xie, H.; Zhang, Z.; Wen, Y. Non-linear effects of ecoacoustic indices on urban soundscape assessments based on gradient boosting decision trees in summer Chongqing, China. Build. Environ. 2025, 278, 112984. [Google Scholar] [CrossRef]
  7. Wang, J.; Li, C.; Yao, Z.; Cui, S. Soundscape for urban ecological security evaluation. Basic Appl. Ecol. 2024, 76, 50–57. [Google Scholar] [CrossRef]
  8. Jia, Y.; Ma, H.; Kang, J. Characteristics and evaluation of urban soundscapes worthy of preservation. J. Environ. Manag. 2020, 253, 109722. [Google Scholar] [CrossRef]
  9. Ng, M.L.; Butler, N.; Woods, N. Soundscapes as a surrogate measure of vegetation condition for biodiversity values: A pilot study. Ecol. Indic. 2018, 93, 1070–1080. [Google Scholar] [CrossRef]
  10. Borker, A.L.; Buxton, R.T.; Jones, I.L.; Major, H.L.; Williams, J.C.; Tershy, B.R.; Croll, D.A. Do soundscape indices predict landscape-scale restoration outcomes? A comparative study of restored seabird island soundscapes. Restor. Ecol. 2020, 28, 252–260. [Google Scholar] [CrossRef]
  11. Xu, X.; Wu, H. Audio-visual interactions enhance soundscape perception in China’s protected areas. Urban For. Urban Green. 2021, 61, 127090. [Google Scholar] [CrossRef]
  12. Francis, C.D.; Newman, P.; Taff, B.D.; White, C.; Monz, C.A.; Levenhagen, M.; Petrelli, A.R.; Abbott, L.C.; Newton, J.; Burson, S.; et al. Acoustic environments matter: Synergistic benefits to humans and ecological communities. J. Environ. Manag. 2017, 203, 245–254. [Google Scholar] [CrossRef]
  13. Burivalova, Z.; Maeda, T.M.; Purnomo; Rayadin, Y.; Boucher, T.; Choksi, P.; Roe, P.; Truskinger, A.; Game, E.T. Loss of temporal structure of tropical soundscapes with intensifying land use in Borneo. Sci. Total Environ. 2022, 852, 158268. [Google Scholar] [CrossRef]
  14. Chen, Z.; Hermes, J.; von Haaren, C. Mapping and assessing natural soundscape quality: An indicator-based model for landscape planning. J. Environ. Manag. 2024, 354, 120422. [Google Scholar] [CrossRef] [PubMed]
  15. Schlicht, L.; Schlicht, E.; Santema, P.; Kempenaers, B. A dawn and dusk chorus will emerge if males sing in the absence of their mate. Proc. R. Soc. B 2023, 290, 20232266. [Google Scholar] [CrossRef]
  16. Yang, Y.; Ye, Z.; Zhang, Z.; Xiong, Y. Investigating the drivers of temporal and spatial dynamics in urban forest bird acoustic patterns. J. Environ. Manag. 2025, 376, 124554. [Google Scholar] [CrossRef]
  17. Davies, B.F.R.; Attrill, M.J.; Holmes, L.; Rees, A.; Witt, M.J.; Sheehan, E.V. Acoustic Complexity Index to assess benthic biodiversity of a partially protected area in the southwest of the UK. Ecol. Indic. 2020, 111, 106019. [Google Scholar] [CrossRef]
  18. Lu, X.; Li, G.; Song, X.; Zhou, L.; Lv, G. Concept, Framework, and Data Model for Geographical Soundscapes. ISPRS Int. J. Geo-Inf. 2025, 14, 36. [Google Scholar] [CrossRef]
  19. Hao, Z.; Wang, C.; Sun, Z.; Konijnendijk van den Bosch, C.; Zhao, D.; Sun, B.; Xu, X.; Bian, Q.; Bai, Z.; Wei, K.; et al. Soundscape mapping for spatial-temporal estimate on bird activities in urban forests. Urban For. Urban Green. 2021, 57, 126822. [Google Scholar] [CrossRef]
  20. Doser, J.W.; Finley, A.O.; Kasten, E.P.; Gage, S.H. Assessing soundscape disturbance through hierarchical models and acoustic indices: A case study on a shelterwood logged northern Michigan forest. Ecol. Indic. 2020, 113, 106244. [Google Scholar] [CrossRef]
  21. Zhao, Y.; Sheppard, S.; Sun, Z.; Hao, Z.; Jin, J.; Bai, Z.; Bian, Q.; Wang, C. Soundscapes of urban parks: An innovative approach for ecosystem monitoring and adaptive management. Urban For. Urban Green. 2022, 71, 127555. [Google Scholar] [CrossRef]
  22. Bian, Q.; Wang, C.; Sun, Z.; Yin, L.; Jiang, S.; Cheng, H.; Zhao, Y. Research on spatiotemporal variation characteristics of soundscapes in a newly established suburban forest park. Urban For. Urban Green. 2022, 78, 127766. [Google Scholar] [CrossRef]
  23. Quinn, C.A.; Burns, P.; Gill, G.; Baligar, S.; Snyder, R.L.; Salas, L.; Goetz, S.J.; Clark, M.L. Soundscape classification with convolutional neural networks reveals temporal and geographic patterns in ecoacoustic data. Ecol. Indic. 2022, 138, 108831. [Google Scholar] [CrossRef]
  24. Scarpelli, M.D.A.; Roe, P.; Tucker, D.; Fuller, S. Soundscape phenology: The effect of environmental and climatic factors on birds and insects in a subtropical woodland. Sci. Total Environ. 2023, 878, 163080. [Google Scholar] [CrossRef]
  25. Sun, Y.; Wang, S.; Feng, J.; Ge, J.; Wang, T. Free-ranging livestock changes the acoustic properties of summer soundscapes in a Northeast Asian temperate forest. Biol. Conserv. 2023, 283, 110123. [Google Scholar] [CrossRef]
  26. Yue, R.; Meng, Q.; Yang, D.; Wu, Y.; Liu, F.; Yan, W. A visualized soundscape prediction model for design processes in urban parks. Build. Simul. 2023, 16, 337–356. [Google Scholar] [CrossRef]
  27. Hong, J.Y.; Jeon, J.Y. Exploring spatial relationships among soundscape variables in urban areas: A spatial statistical modelling approach. Landsc. Urban Plan. 2017, 157, 352–364. [Google Scholar] [CrossRef]
  28. Barbaro, L.; Sourdril, A.; Froidevaux, J.S.P.; Cauchoix, M.; Calatayud, F.; Deconchat, M.; Gasc, A. Linking acoustic diversity to compositional and configurational heterogeneity in mosaic landscapes. Landsc. Ecol. 2022, 37, 1125–1143. [Google Scholar] [CrossRef]
  29. Guo, X.; Jiang, S.Y.; Liu, J.; Chen, Z.; Hong, X.C. Understanding the Role of Visitor Behavior in Soundscape Restorative Experiences in Urban Parks. Forests 2024, 15, 1751. [Google Scholar] [CrossRef]
  30. Bian, Q.; Zhang, C.; Wang, C.; Yin, L.; Han, W.; Zhang, S. Evaluation of soundscape perception in urban forests using acoustic indices: A case study in Beijing. Forests 2023, 14, 1435. [Google Scholar] [CrossRef]
  31. Luo, L.; Zhang, Q.; Mao, Y.; Peng, Y.; Wang, T.; Xu, J. A Study on the Soundscape Preferences of the Elderly in the Urban Forest Parks of Underdeveloped Cities in China. Forests 2023, 14, 1266. [Google Scholar] [CrossRef]
  32. Xu, X.; Baydur, C.; Feng, J.; Wu, C. Integrating spatial-temporal soundscape mapping with landscape indicators for effective conservation management and planning of a protected area. J. Environ. Manag. 2024, 356, 120555. [Google Scholar] [CrossRef]
  33. Xu, H.; Tian, Y.; Ren, H.; Liu, X. A lightweight channel and time attention enhanced 1D CNN model for environmental sound classification. Expert Syst. Appl. 2024, 249, 123768. [Google Scholar] [CrossRef]
  34. Xie, J.; Hu, K.; Zhu, M.; Yu, J.; Zhu, Q. Investigation of different CNN-based models for improved bird sound classification. IEEE Access 2019, 7, 175353–175361. [Google Scholar] [CrossRef]
  35. Ecke, S.; Stehr, F.; Frey, J.; Tiede, D.; Dempewolf, J.; Klemmt, H.-J.; Endres, E.; Seifert, T. Towards operational UAV-based forest health monitoring: Species identification and crown condition assessment by means of deep learning. Comput. Electron. Agric. 2024, 219, 108785. [Google Scholar] [CrossRef]
  36. Meedeniya, D.; Ariyarathne, I.; Bandara, M.; Jayasundara, R.; Perera, C. A survey on deep learning based forest environment sound classification at the edge. ACM Comput. Surv. 2023, 56, 1–36. [Google Scholar] [CrossRef]
  37. Paranayapa, T.; Ranasinghe, P.; Ranmal, D.; Meedeniya, D.; Perera, C. A comparative study of preprocessing and model compression techniques in deep learning for forest sound classification. Sensors 2024, 24, 1149. [Google Scholar] [CrossRef] [PubMed]
  38. Ranmal, D.; Ranasinghe, P.; Paranayapa, T.; Meedeniya, D.; Perera, C. Esc-nas: Environment sound classification using hardware-aware neural architecture search for the edge. Sensors 2024, 24, 3749. [Google Scholar] [CrossRef] [PubMed]
  39. List of UNESCO Global Geoparks and Regional Networks. Available online: https://www.unesco.org/en/iggp/geoparks (accessed on 5 March 2025).
  40. Wulingyuan Scenic and Historic Interest Area. Available online: https://whc.unesco.org/en/list/640 (accessed on 5 March 2025).
  41. Pijanowski, B.C.; Farina, A.; Gage, S.H.; Dumyahn, S.L.; Krause, B.L. What is soundscape ecology? An introduction and overview of an emerging new science. Landsc. Ecol. 2011, 26, 1213–1232. [Google Scholar] [CrossRef]
  42. Salamon, J.; Bello, J.P. Deep convolutional neural networks and data augmentation for environmental sound classification. IEEE Signal Process. Lett. 2017, 24, 279–283. [Google Scholar] [CrossRef]
  43. Zhang, T.; Feng, G.; Liang, J.; An, T. Acoustic scene classification based on Mel spectrogram decomposition and model merging. Appl. Acoust. 2021, 182, 108258. [Google Scholar] [CrossRef]
  44. Kong, Q.; Cao, Y.; Iqbal, T.; Wang, Y.; Wang, W.; Plumbley, M.D. Panns: Large-scale pretrained audio neural networks for audio pattern recognition. IEEE/ACM Trans. Audio Speech Lang. Process. 2020, 28, 2880–2894. [Google Scholar] [CrossRef]
  45. Scarpelli, M.D.A.; Tucker, D.; Doohan, B.; Roe, P.; Fuller, S. Spatial dynamics of soundscapes and biodiversity in a semi-arid landscape. Landsc. Ecol. 2023, 38, 463–478. [Google Scholar] [CrossRef]
  46. Mendes, C.P.; Carreira, D.; Pedrosa, F.; Beca, G.; Lautenschlager, L.; Akkawi, P.; Bercê, W.; Ferraz, K.M.P.M.B.; Galetti, M. Landscape of human fear in Neotropical rainforest mammals. Biol. Conserv. 2020, 241, 108257. [Google Scholar] [CrossRef]
  47. Lewis, J.S.; Spaulding, S.; Swanson, H.; Keeley, W.; Gramza, A.R.; VandeWoude, S.; Crooks, K.R. Human activity influences wildlife populations and activity patterns: Implications for spatial and temporal refuges. Ecosphere 2021, 12, e03487. [Google Scholar] [CrossRef]
  48. He, X.; Deng, Y.; Dong, A.; Lin, L. The relationship between acoustic indices, vegetation, and topographic characteristics is spatially dependent in a tropical forest in southwestern China. Ecol. Indic. 2022, 142, 109229. [Google Scholar] [CrossRef]
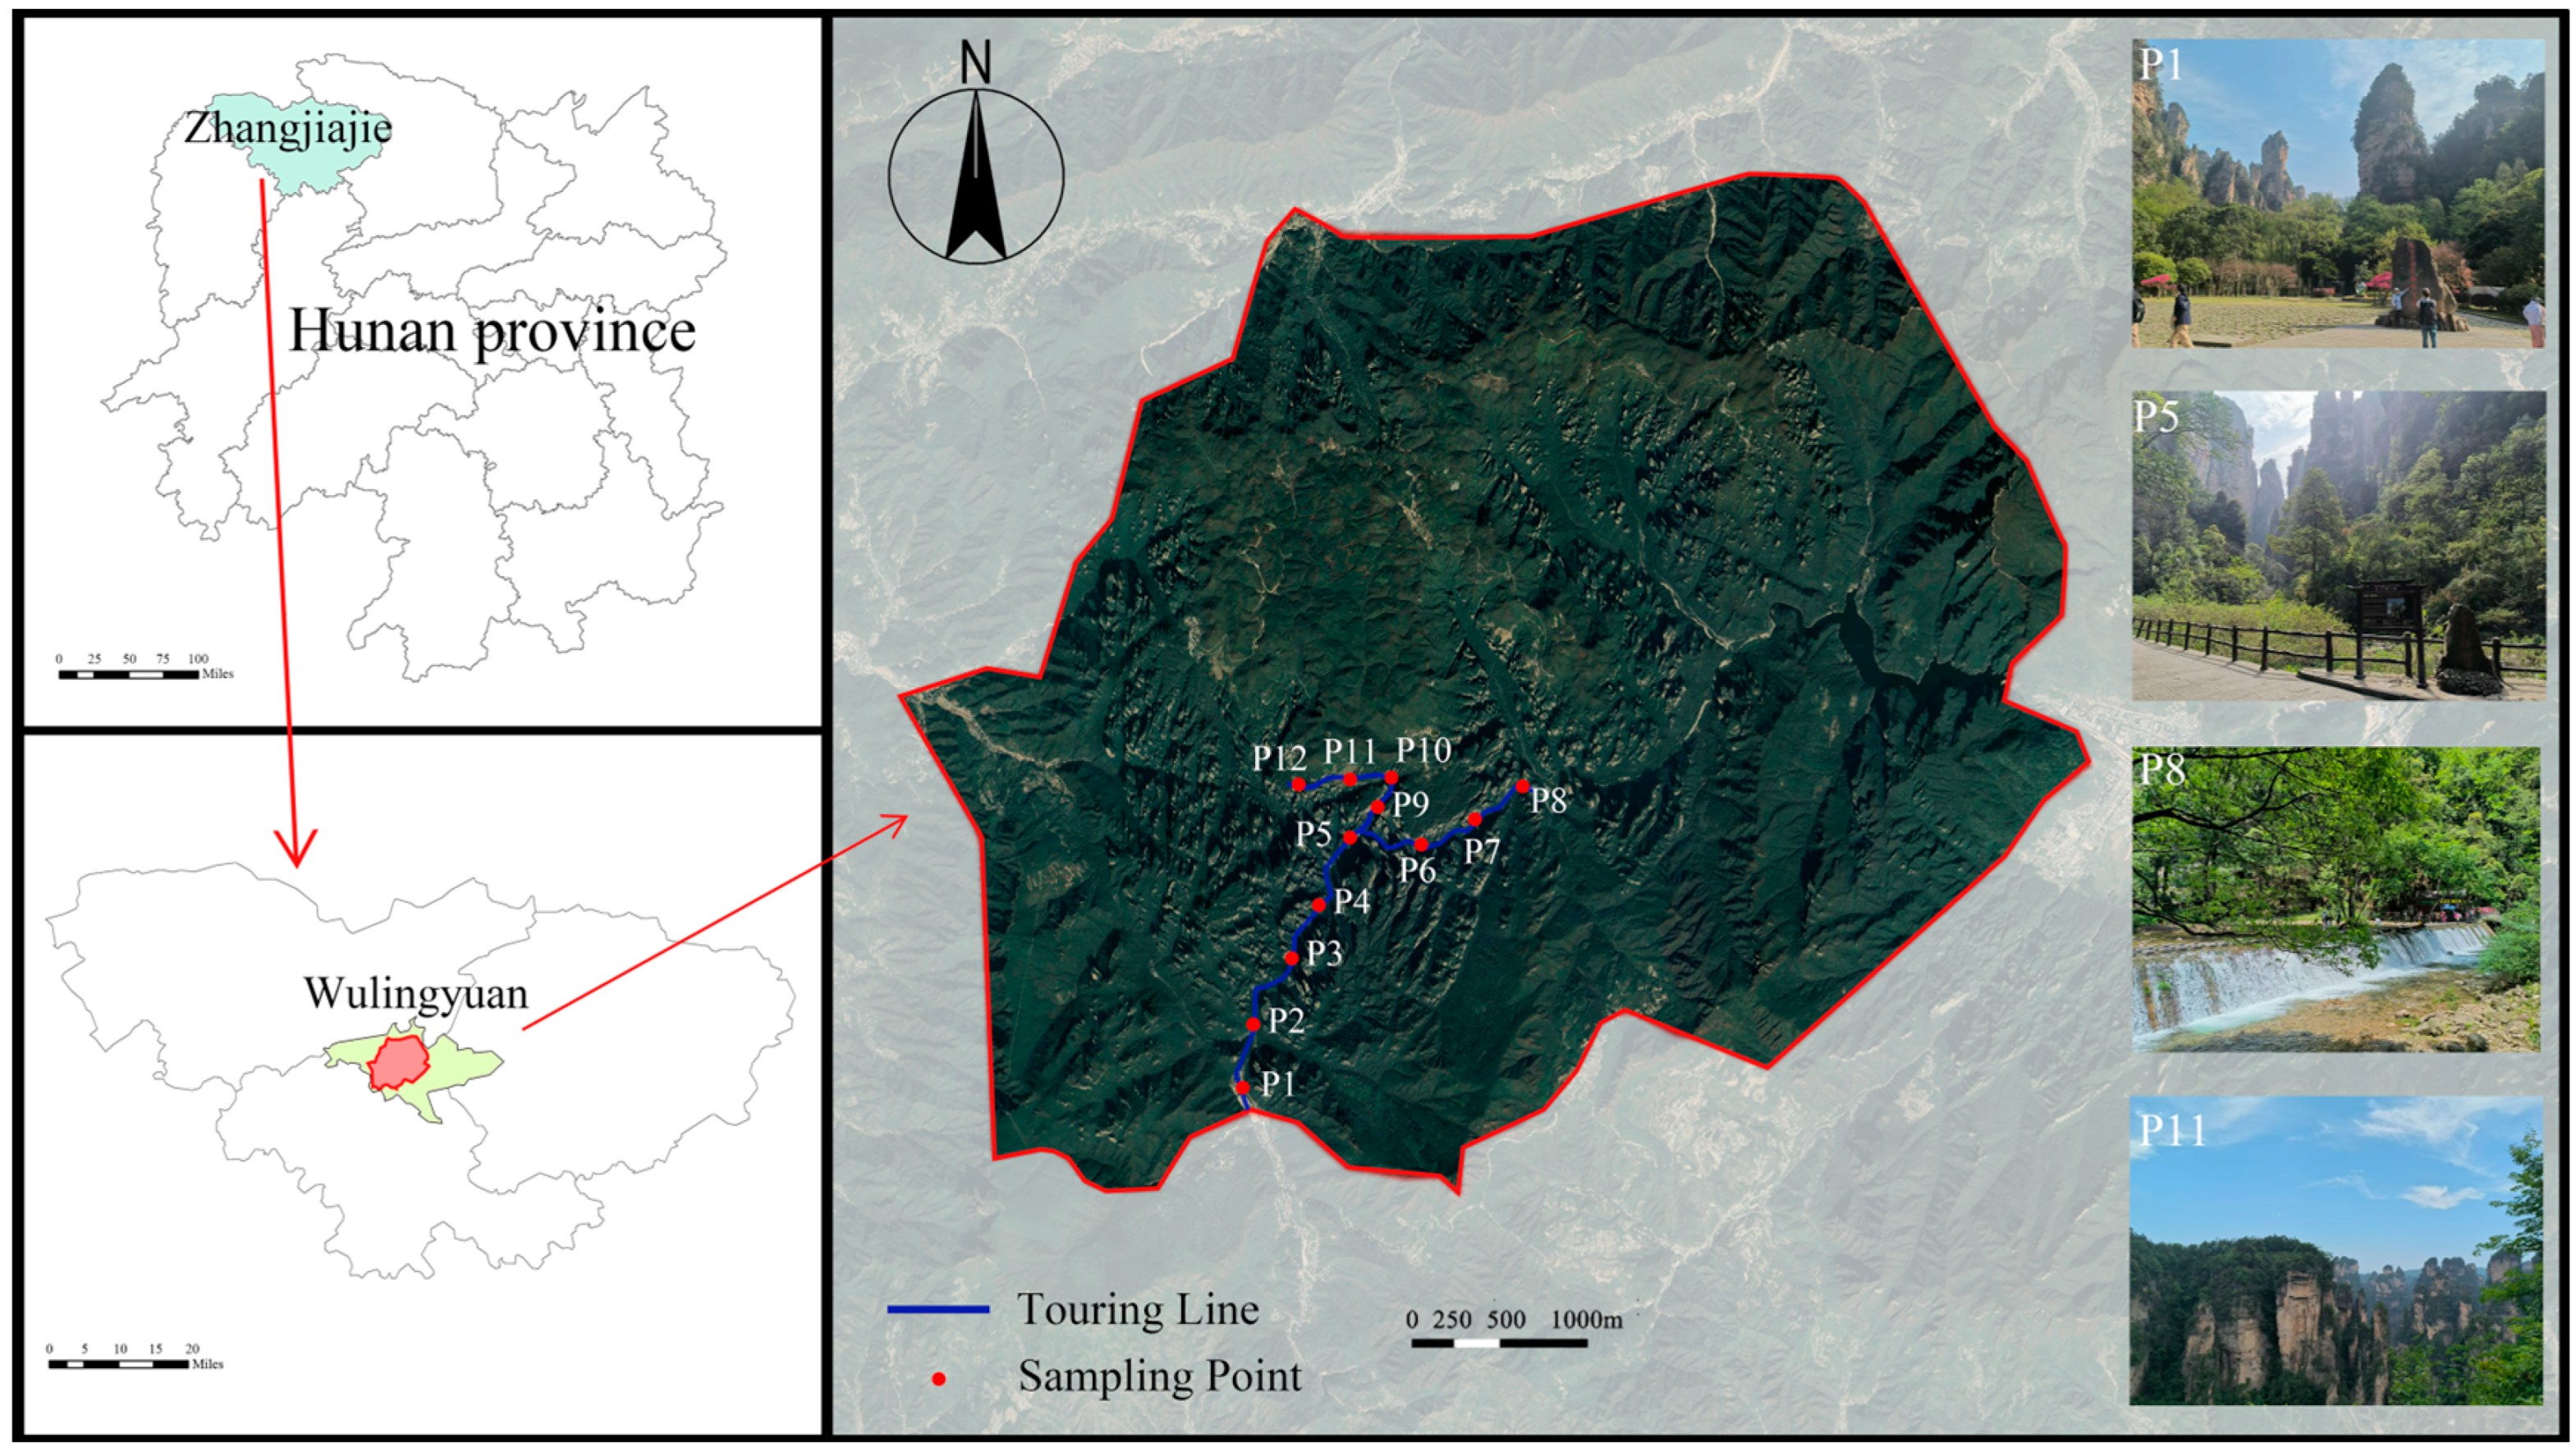
Figure 1. Schematic diagram of sampling points.
Forests 16 01416 g001
Figure 2. Typical sound source spectrum diagram.
Forests 16 01416 g002aForests 16 01416 g002b
Figure 3. Deep learning model framework.
Forests 16 01416 g003
Figure 4. Training performance of the soundscape recognition model: (a) training accuracy, (b) training loss, (c) validation accuracy, and (d) validation loss.
Forests 16 01416 g004aForests 16 01416 g004b
Figure 5. Confusion matrix model.
Forests 16 01416 g005
Figure 6. Trends in soundscape changes over time at 12 sampling points. (a) P1, (b) P2, (c) P3, (d) P4, (e) P5, (f) P6, (g) P7, (h) P8, (i) P9, (j) P10, (k) P11, (l) P12.
Forests 16 01416 g006aForests 16 01416 g006b
Figure 7. Typical spatial distribution of sound source proportions: (a) bird, (b) chirp, (c) monkey, (d) rustle, (e) stream, (f) wind, (g) mechanical, (h) crowd.
Forests 16 01416 g007
Figure 8. Topographical distribution map.
Forests 16 01416 g008
Figure 9. Spatial distribution maps of soundscape categories: (a) geophony, (b) biophony, and (c) anthrophony.
Forests 16 01416 g009
Table 1. Overview of sampling site information.
NumberSampling PointEnvironmental Characteristics
P1Oxygen Bar PlazaLocated at the entrance to the park, with a large open plaza as the starting point for visitors’ distribution and guided tour.
P2Divine Eagle Protecting the WhipVisit iconic viewpoints and popular tourist attractions on the route.
P3Golden Whip
Stream Poetry
Dense vegetation, close to streams, complete natural surroundings.
P4Rock of
Literary Star
The understory is open with several sets of seating facilities for short stopovers.
P5Meet from AfarOpen terrain, the intersection of two tour routes, frequent visitor traffic and stops.
P6Jumping Fish PoolClose to a body of water with strong currents and a resting pavilion.
P7Sandstone Peak ForestComplex terrain, strong currents, vending machines available.
P8Four Gates WatersideA junction of multiple routes with outstanding scenery, where tourists tend to linger.
P9Viewing PlatformThe platform is large with a wide view and is equipped with benches and other facilities for visitors to rest.
P10Winding SlopeThe trail is narrow, the terrain is uneven, and the vegetation coverage is high. It is a transitional type of scenic spot.
P11Rear GardenLocated on the edge of the forest, away from the main tourist route, the environment is relatively quiet.
P12Enchanted
Stand
Located at a high vantage point, it is one of the important thoroughfares and is frequently visited by tourists.
Table 2. Classification of soundscape types in the study area.
Soundscape CategoryTypical Sound Source
BiophonyChirp, Bird, Monkey
GeophonyStream, Wind, Rustle
AnthrophonyMechanical, Crowd
Table 3. Training set construction.
LabelField RecordedOnline AudioData AugmentationTotal
Chirp400400////800
Bird400400////800
Monkey200200AL100PS100TS100EC100800
Stream400400////800
Wind400400////800
Rustle400400////800
Mechanical400400////800
Crowd400400////800
Total300030004006400
Table 4. Comparison of the performance of the three models on the validation set.
ModelPrecisionRecallF1-Score
PANNs0.994050.993760.99376
CAM++0.991820.991420.99139
ECAPA-TDNN0.983630.982840.98282
Disclaimer/Publisher’s Note: The statements, opinions and data contained in all publications are solely those of the individual author(s) and contributor(s) and not of MDPI and/or the editor(s). MDPI and/or the editor(s) disclaim responsibility for any injury to people or property resulting from any ideas, methods, instructions or products referred to in the content.