Article

Fire Danger Climatology Using the Hot–Dry–Windy Index: Case Studies from Portugal

by
Cristina Andrade
1,2,* and
Lourdes Bugalho
3
1
Natural Hazards Research Center (NHRC.ipt), Instituto Politécnico de Tomar, Quinta do Contador, Estrada da Serra, 2300-313 Tomar, Portugal
2
Centre for the Research and Technology of Agroenvironmental and Biological Sciences (CITAB), Inov4Agro, Universidade de Trás-os-Montes e Alto Douro (UTAD), Quinta de Prados, 5000-801 Vila Real, Portugal
3
Portuguese Institute of Sea and Atmosphere (IPMA, I.P.), Rua C do Aeroporto, 1749-077 Lisboa, Portugal
*
Author to whom correspondence should be addressed.
Forests 2025, 16(9), 1417; https://doi.org/10.3390/f16091417 (registering DOI)
Submission received: 7 July 2025 / Revised: 19 August 2025 / Accepted: 26 August 2025 / Published: 4 September 2025

Abstract

Wildfires in Portugal have become increasingly frequent and severe, driven by a combination of fuel accumulation, extreme meteorological conditions, and topographic complexity. This study assesses the applicability of the Hot–Dry–Windy (HDW) index in characterizing fire-weather conditions during five major wildfires: Chamusca (2003), Pedrógão Grande and Lousã (2017), Monchique (2018), and Covilhã (2022). HDW values were computed at sub-daily resolution and compared against a 1991–2020 climatology. This study also evaluates the HDW index as a high-resolution fire danger indicator in Portugal and compares it with the traditional FWI using percentile-based climatology. The findings indicate that during 12 and 15 UTC, HDW in the wildfires in Chamusca (2003) and Lousã (2017) exceeded 180–370 units, suggesting extreme air conditions driven by hot, dry, and windy weather patterns. These values denoted extremely flammable conditions since they were significantly higher than the 95th percentile. A distinct peak at 15 UTC for Pedrógão Grande (2017) topped 140 units (>P95), which is consistent with the ignition timing and a rapid beginning spread. A continuous HDW anomaly that peaked above 200 units between 2 August and 5 August preceded the Monchique (2018) event, suggesting extended heat stress and increased wind contribution. While not as severe as in previous instances, HDW at Covilhã (2022) was above the 75th percentile in the early afternoon (12–18 UTC). Results show that in all cases, HDW values exceeded the 90th and 95th percentiles during the hours of ignition and early fire spread, with the most critical anomalies occurring between 12 UTC and 18 UTC. Spatial analyses revealed regional-scale patterns of HDW exceedance, aligning with observed ignition zones. Comparisons with the Canadian Fire Weather Index (FWI) revealed that while the FWI captured seasonal fuel aridity, the HDW more effectively resolved short-term meteorological extremes, particularly wind and atmospheric dryness. The HDW index was found to identify high-risk conditions even when FWI values were moderate, highlighting its added diagnostic value. These results support the inclusion of HDW in operational fire danger rating systems for Portugal and other Mediterranean countries, where compound fire-weather extremes are becoming more frequent due to climate change.

1. Introduction

Wildfires represent a significant and recurring hazard in Mediterranean ecosystems, with Portugal being one of the most affected countries in southern Europe [1,2]. Over the past decades, the frequency, intensity, and spatial extent of wildfires in Portugal have increased markedly, driven by a complex interplay of climatic, ecological, and socio-economic factors. The combination of hot, dry summers, flammable vegetation, and shifting land use patterns—such as rural depopulation and the abandonment of traditional agricultural practices—has rendered the Portuguese landscape increasingly fire-prone.
Portugal experiences some of the highest fire densities in Europe, with particularly severe fire seasons occurring in years marked by prolonged drought and heatwaves, as evidenced in 2003, 2017, and more recently in 2022. These events have not only caused extensive ecological damage and loss of biodiversity but also resulted in substantial socio-economic losses and tragic human casualties. Ruffault et al. [3] in Scientific Reports conclude that climate change is likely to increase the frequency and extent of large wildfires in the Mediterranean region due to rising temperatures and drier conditions. Specifically, the study projects an increase in the occurrence of heat-induced fire-weather types, which are associated with large wildfires. Therefore, as climate change continues to amplify temperature extremes and prolong drought periods, the frequency of severe fire weather events is expected to increase, necessitating more robust and reliable fire danger assessment tools [4,5,6].
Recent years have witnessed increasingly destructive wildfires in southern Europe, underscoring the need for improved fire danger assessment tools. Historically, the Canadian Fire Weather Index (FWI) has been the primary system used for operational fire risk assessment in Portugal and across much of southern Europe [1,2]. While the FWI captures key meteorological variables—such as temperature, relative humidity, wind speed, and precipitation—and is useful for general fire danger rating, its performance under extreme and fast-evolving fire conditions has been called into question. Specifically, FWI integrates weather-driven fuel moisture and wind conditions but lacks sensitivity to high-frequency meteorological variability, especially under short-term, high-impact synoptic events involving strong winds, low humidity, and elevated temperatures. These rapidly evolving scenarios, often characteristic of extreme wildfires, may be underrepresented by daily average indices, such as FWI [4,5]. Particularly during events like the June and October 2017 wildfires, FWI values did not fully reflect the extreme fire behaviour observed on the ground [6,7,8]. These shortcomings have highlighted the need for supplementary or alternative indices that can better represent compound meteorological extremes and fire-conducive atmospheric conditions.
To address these limitations, recent research has focused on incorporating additional fire weather metrics that emphasize compound extremes. A promising alternative is the Hot–Dry–Windy (HDW) index, which was first presented by Srock et al. [9]. To represent fire-conducive conditions in the lower troposphere, it combines wind speed and atmospheric dryness, which is measured by the vapour pressure deficit (VPD). HDW is especially relevant for predicting extreme fire outbreaks because it more directly incorporates atmospheric instability and drying potential than the FWI, which depends on surface-level factors and fuel moisture modelling. Studies have demonstrated the effectiveness of HDW in identifying large fire days in regions such as the western United States and Canada [9,10,11] and parts of southern Europe [12], but its application in Portugal remains limited and understudied. Furthermore, compound indicators, which combine multiple meteorological drivers (heat, dryness, wind), are gaining recognition for their predictive power in complex fire regimes [5,13,14,15].
There is growing recognition that compound fire weather indicators, which combine multiple fire-conducive meteorological variables in a physically meaningful way, outperform traditional single-variable indices under extreme conditions. For example, Ruffault et al. [5] advocate the use of compound metrics to address compound dry-hot-windy extremes in Mediterranean climates. Similarly, Andrade and Bugalho [8] applied a multi-indicator approach to analyze Portugal’s catastrophic 2017 fires, showing that wind-related variables, while underweighted in FWI, were dominant drivers of spread in Pedrógão Grande and Lousã. Therefore, this study will evaluate the HDW index in a percentile-climatological framework and compare its diagnostic value against the FWI across five major wildfire events at their ignition points.
The usefulness and implementation of the HDW index in Portugal are evaluated by looking at how well it performed during some of the country’s most significant wildfire episodes over the past 20 years. Towards this aim, HDW sub-daily resolution values and observed fire activity during large occurrences, such as those in 2003, 2017, 2018, and 2022, will be compared with the HDW climatological percentiles. To align with reported ignition zones, the spatial analyses seek to identify regional-scale patterns of HDW exceeding the 90th percentile. Another objective of this study is to determine how the HDW index might enhance early warning capabilities and complement existing fire danger assessment systems. It provides fresh perspectives on compound hazard circumstances and their operational relevance by contrasting its behaviour with the FWI. A correlation analysis between the two indices will aim to determine whether HDW offers complementary or redundant information relative to the more established FWI. These findings are expected to provide a novel approach to the role of surface-air meteorological conditions in driving wildfire extremes and to inform improvements in operational fire forecasting and management in Portugal.

2. Materials and Methods

2.1. Study Area and Event Selection

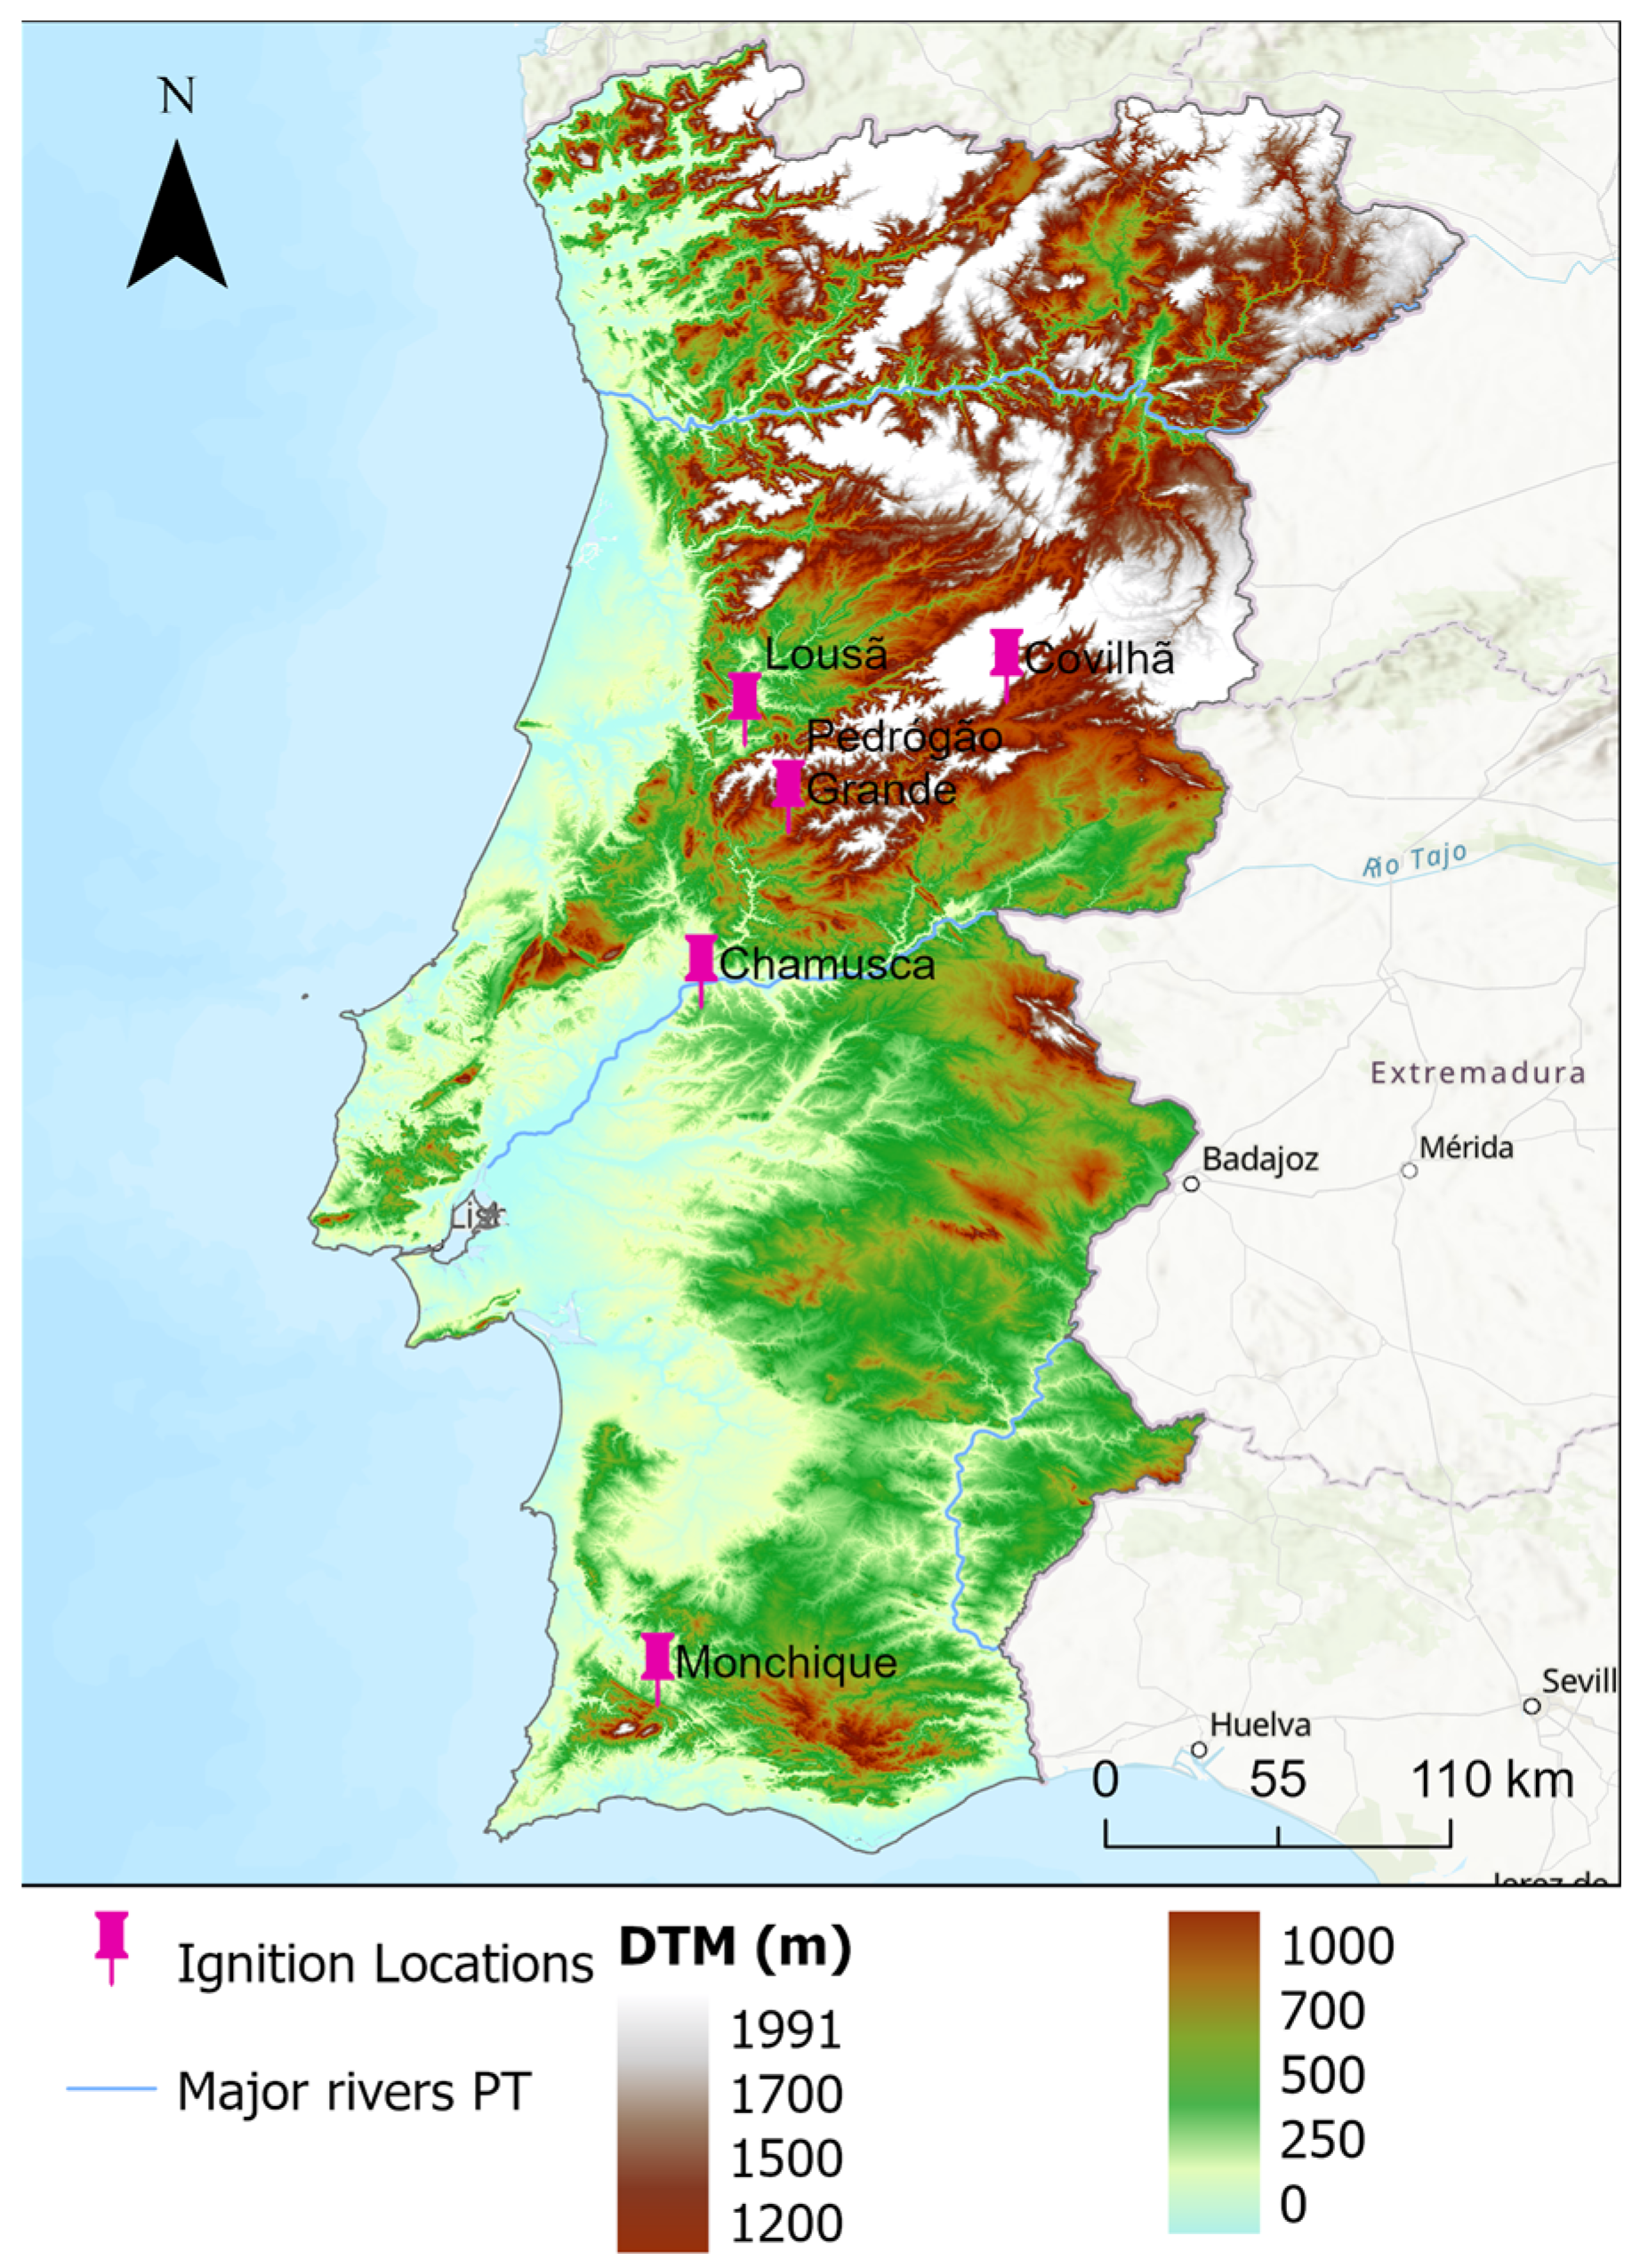
Portugal, located in southwestern Europe, is characterized by a Mediterranean climate with hot, dry summers and mild, wet winters, conditions that strongly influence wildfire behaviour. This study focuses on five major wildfire events that occurred between 2003 and 2022, selected based on their total burned area (>1000 ha), high intensity, societal impact, and geographical diversity. These fires are also associated with different periods (Table 1), geographical locations, and types of cause (Table 2) in mainland Portugal (Figure 1), including
  • Chamusca (2003)—Occurred during one of the most destructive fire seasons in recent Portuguese history, with over 425,000 ha burned nationally.
  • Pedrógão Grande (2017)—A catastrophic June wildfire that caused 66 fatalities and rapid fire spread due to extreme weather conditions.
  • Lousã/Coimbra (2017)—Part of the October 2017 firestorm, exacerbated by strong winds and dry fuels, burning over 200,000 ha in 24 h.
  • Monchique (2018)—A prolonged fire in the Algarve region, fueled by persistent high temperatures and complex terrain.
  • Covilhã (2022)—A major wildfire in central Portugal, occurring during an intense summer heatwave, affected protected natural areas.
Table 1. Ignition location, day, hour, and extinction day of the historical fires analyzed in this study [16,17,18].
Wildfire Event
Location of the Ignition
Ignition Day
(Alert)
Extinction Day
DistrictMunicipalityParishLocationDate/HourDate/Hour
SantarémChamuscaUlmePoldro2 August 2003, 11:207 August 2003, 20:00
LeiriaPedrógão GrandePedrógão GrandeEscalos Fundeiros17 June 2017, 14:4322 June 2017, 09:22
CoimbraLousãVilarinhoPrilhão, Vilarinho15 October 2017, 08:4117 October 2017, 02:31
FaroMonchiqueMonchiquePerna da Negra3 August 2018, 13:3211 August 2018, 21:50
Castelo BrancoCovilhãVila do CarvalhoGarrucho6 August 2022, 03:182 September 2022, 21:00
Table 2. Designation, coordinates, total burnt area (ha), and type of cause of the historical fires analyzed in this study [16,17,18].
Wildfire Event
Designation
Fire Location 1Total Burnt Area (ha)Type of Cause
Chamusca39.35° N; 8.39° W22,190.00Natural (lightning)
Pedrógão Grande39.875° N; 8.125° W30,358.84 Negligent
Lousã40.13° N; 8.21° W53,618.81 Negligent
Monchique37.40° N; 8.59° W26,763.83 Unknown
Covilhã40.31° N; 7.50° W24,333.24 Intentional
1 Approximate fire ignition coordinates.
Figure 1. Digital terrain model (DTM) and ignition location of the historical fires analyzed in this study (DTM retrieved from the European Data website).
Forests 16 01417 g001
These events represent a range of fire-prone conditions, meteorological drivers, and biogeographic contexts across mainland Portugal. Individual fire data, such as date, duration, location, and size in Table 1 and Table 2, and Figure 2, were retrieved from ICNF, the Portuguese rural fire database ([16,17,18], accessed on 5 May 2025)

2.2. Meteorological Data

To assess meteorological conditions during each event, several datasets from 1990 to 2022 were retrieved from the ERA5 reanalysis dataset, provided by the European Centre for Medium-Range Weather Forecasts (ECMWF). ERA5 surface data were used, every 3 h, for atmospheric variables with a spatial resolution of 0.25° × 0.25°. To compute HDW, the primary variables used were wind speed (m/s) at 10 m for HDW, air temperature (°C) and dew point at the surface, and 2 m (for calculating the vapor pressure deficit). Surface data with a spatial resolution of 0.125° × 0.125° from the ECMWF operational model Integrated Forecasting System (IFS) at 12 UTC were used to calculate FWI.
The HDW values were calculated from 1990 to 2022 based upon the formulation by Srock et al. [9], which uses maximum wind speed (U) and vapor pressure deficit (VPD) and integrated over a 3 h time window, e.g., 00 UTC, 03 UTC, 06 UTC, 09 UTC, 12 UTC, 15 UTC, 18 UTC, and 21 UTC. For succinctness purposes, we will only present results from 09 UTC to 18 UTC. Percentile criteria (such as the 25th, 50th, 75th, 90th, and 95th percentiles) were calculated for each index grid point using a 30-year climatological baseline (1991–2020) in order to make comparison analysis easier. The use of percentiles facilitates normalization across spatial and temporal variability, enabling the identification of extreme but context-sensitive fire weather conditions. Therefore, to compare HDW values to the percentile-based climatology, a more representative comparison sample was retrieved. To achieve this aim, for each day in the climatology, a 15-day window, encompassing 7 days before and 7 days after the ignition date of each case study wildfire event, will be analyzed and presented for all 30 years.
FWI values were computed from the ECMWF (IFS) operational model at a daily resolution, for 12 UTC, between 2001 and 2022, with a spatial resolution of 0.125° × 0.125° in latitude and longitude. Further details will be addressed in the next section.
Both HDW and FWI data were interpolated to the ignition coordinates of each fire event. Since the grid data does not coincide with the ignition points, the closest grid point was found by using the square Euclidean distance and then selecting the minimum distance to retrieve the time series. All spatial and temporal processing was conducted in MATLAB R2022a, ensuring consistency in coordinate projections and time zones.
Finally, for each grid point, the probability of HDW values for the ignition point above the 90th percentile was calculated. The associated spatial representation will also be shown here.

2.3. The Hot–Dry–Windy Index (HDW) and the Fire Weather Index (FWI)

This study uses the HDW, introduced by Srock et al. [9] in 2018, which combines three main state variables—wind, temperature, and moisture—thus allowing meteorologists to assess how the atmosphere typically impacts a fire. Wind has a simple influence on large-scale fires; a greater wind usually means that a wildland fire will spread faster and be harder to prevent or control. Although wind shifts have a substantial impact on fire behaviour as well, this formulation of HDW does not incorporate them because of their intrinsic lower scale. Since air heat and moisture do not affect a fire independently, it is more challenging to measure their effects on a fire. Rather, the main impact of both air heat and moisture on a fire is to change the rate at which moisture evaporates from fuels, which influences fuel consumption, fire intensity, and fire spread, as stated by Rothermel [19]. To incorporate atmospheric heat and moisture into a single quantity, HDW uses a variable.
Relative humidity (RH) has long been the fire community’s chosen metric for combining humidity and temperature into a single phrase. RH is calculated as the ratio of the saturation vapor pressure (es), which is a variable that depends only on temperature (T), times 100%, to the vapor pressure (e) (corresponds to the saturation vapor pressure at the dew point temperature), which is a variable that depends only on absolute moisture content (q):
R H T , q = e ( q ) e s ( T ) × 100 % ,
A crucial component of our HDW formulation is the fact that the difference, not the ratio, between (es) and (e) at a specific temperature is the primary metric for estimating the amount of potential evaporation; in plant environments, greater differences between (es) and (e) are linked to higher evaporation rates. The VPD is a frequently used quantity to evaluate the impact of the difference between (es) and (e) in a fire environment:
V P D T , q = e s T e q .
Because a bigger (smaller) VPD immediately connects to a quicker (slower) evaporation rate, which is in turn linked to a greater (lesser) possibility for the atmosphere to affect a fire, VPD better accounts for the combined effect of temperature and moisture. Therefore, we only multiply U by the VPD to get HDW:
H D W = U × V P D T , q .
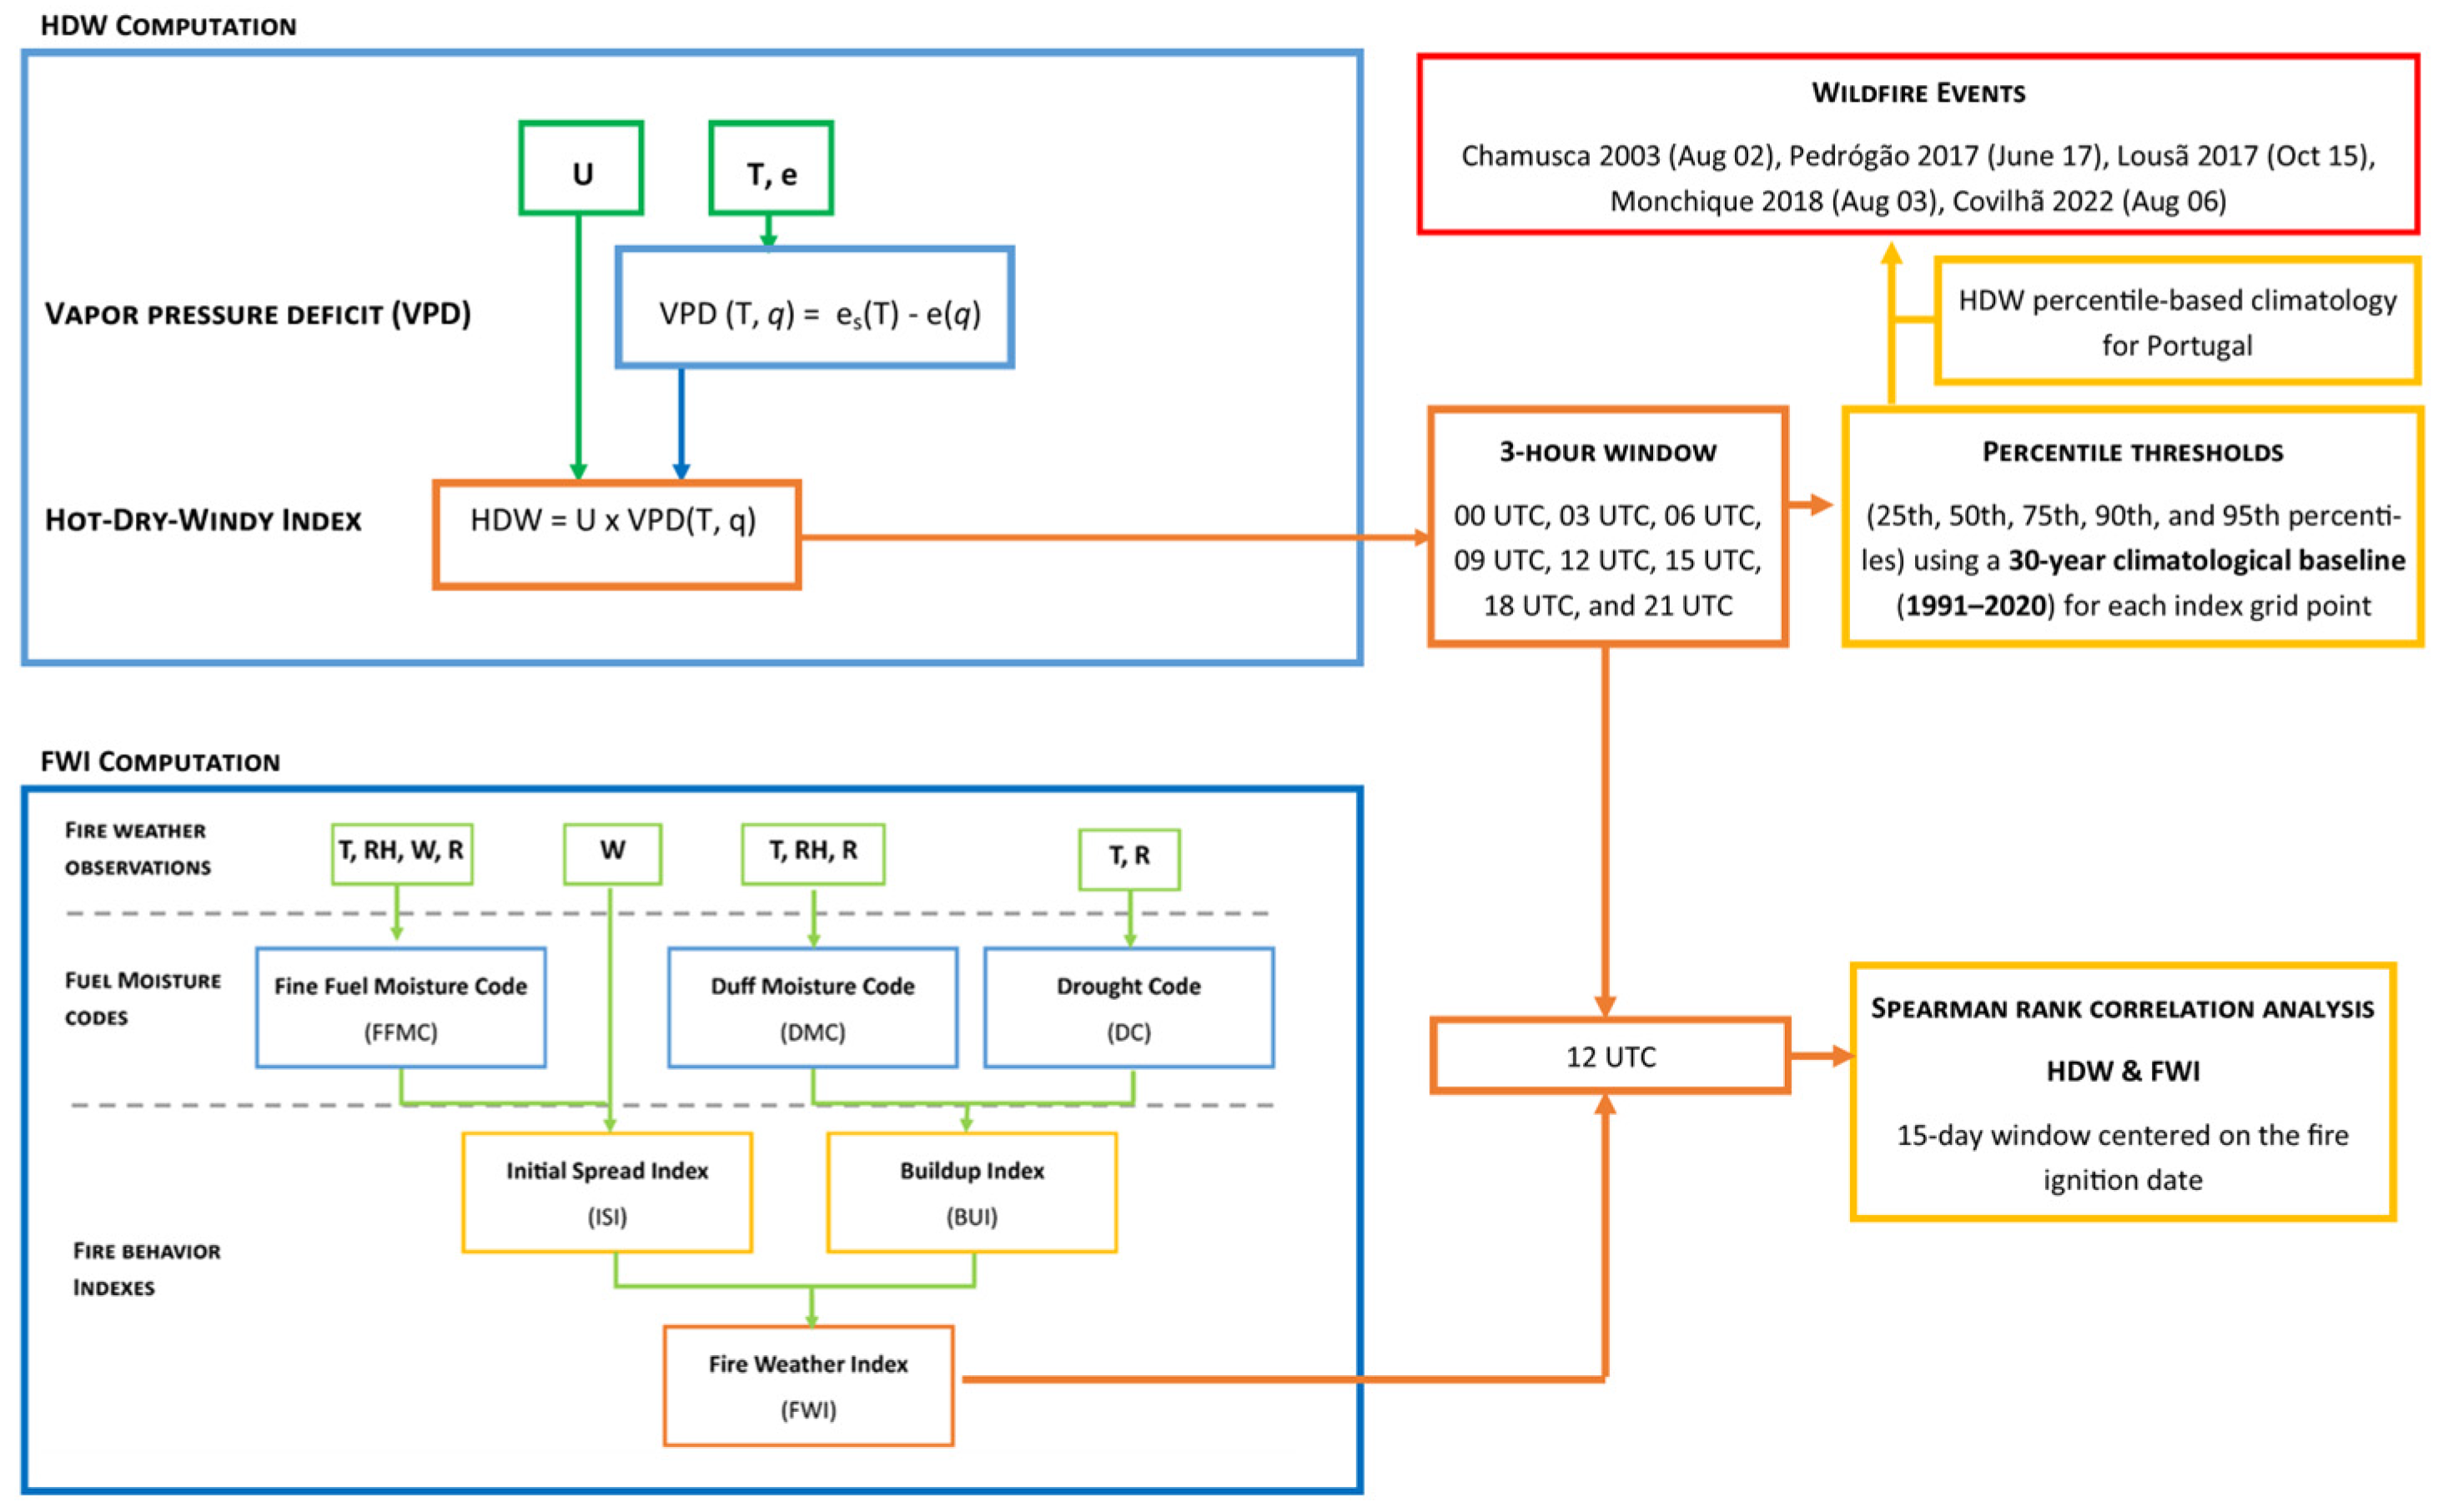
Since temperature, humidity, and wind speed can all be measured or simulated at any location in the Earth’s atmosphere, using an index based on wind speed multiplied by the VPD guarantees that HDW will be relevant everywhere. HDW values will always be greater than or equal to zero since U and VPD are continually fluctuating variables greater than or equal to zero. Additionally, HDW will be continuous, devoid of any contrived breakpoints or sign shifts that are present in other indices (such as the National Fire Danger Rating System [20], the Fosberg Fire Weather Index [21], and the Haines Index [22]). Even though it is acknowledged that HDW is constrained by just multiplying U and VPD, several studies have demonstrated [9,11,23] that this simple formula may differentiate between the “worst” days on a certain fire, indicating that it operates at a basic level. Additional testing of different formulations may be conducted to determine whether there are more suitable combinations of U and VPD. HDW uses standard meteorological units, such as ms−1 for wind speed and hPa for VPD. Further insights related to HDW computation, and this study workflow can be depicted in Figure A1.
HDW was developed to consider the weather conditions that are most likely to interact with the surface throughout the burning period on a given day, since the depth of the atmosphere that would affect a fire might vary significantly from one fire to another. Studies have shown that HDW can identify days when physical processes on a synoptic and mesoscale contribute to especially dangerous fire behaviour [9,23,24].
The FWI is a widely used meteorological index that estimates potential fire danger based on weather conditions affecting fuel moisture and fire behaviour. At its core, the FWI combines the effects of temperature, relative humidity, wind speed, and precipitation; and includes several sub-components to reflect surface fuel dryness, spread potential, and fire intensity. These inputs are used to compute three fuel moisture codes (for fine, medium, and deep fuels) and three fire behaviour indices:
  • Initial Spread Index (ISI)—driven by wind and fine fuel moisture.
  • Buildup Index (BUI)—reflects fuel availability and dryness.
  • Fire Weather Index (FWI)—combines ISI and BUI into a single, dimensionless index representing fire intensity under open, level terrain.
Higher FWI values indicate greater fire danger, with thresholds often defined locally or climatologically. Unlike the HDW index, FWI is more sensitive to fuel conditions and seasonality than short-term wind or atmospheric dryness variability. Aiming at comparing with HDW at the ignition points, the FWI and its subcomponents were computed using ECMWF (IFS)-derived surface data following standard Canadian FWI system procedures [20]. The FWI scale and interpretation are shown in Table 3. Further details regarding this index computation can be found in Andrade and Bugalho [8] and Figure A1.

2.4. Spearman Rank Correlation Analysis

To evaluate the relationship between HDW and FWI, a non-parametric Spearman rank correlation analysis was conducted (with a 5% significance level) for each of the five wildfire events. This method was selected due to its robustness against non-linear relationships and its ability to assess monotonic associations between variables.
Daily time series of HDW and FWI were extracted for each ignition location over a 15-day window centred on the fire ignition date. For each fire, the Spearman correlation coefficient (ρ) and associated p-value were calculated. The purpose of this analysis was to assess the extent to which HDW and FWI covary during critical fire weather periods and to identify potential discrepancies that may reflect different sensitivity to fire-conducive atmospheric conditions. This correlation approach supports the broader goal of evaluating the complementarity or redundancy of HDW relative to FWI in diagnosing extreme fire risk scenarios.
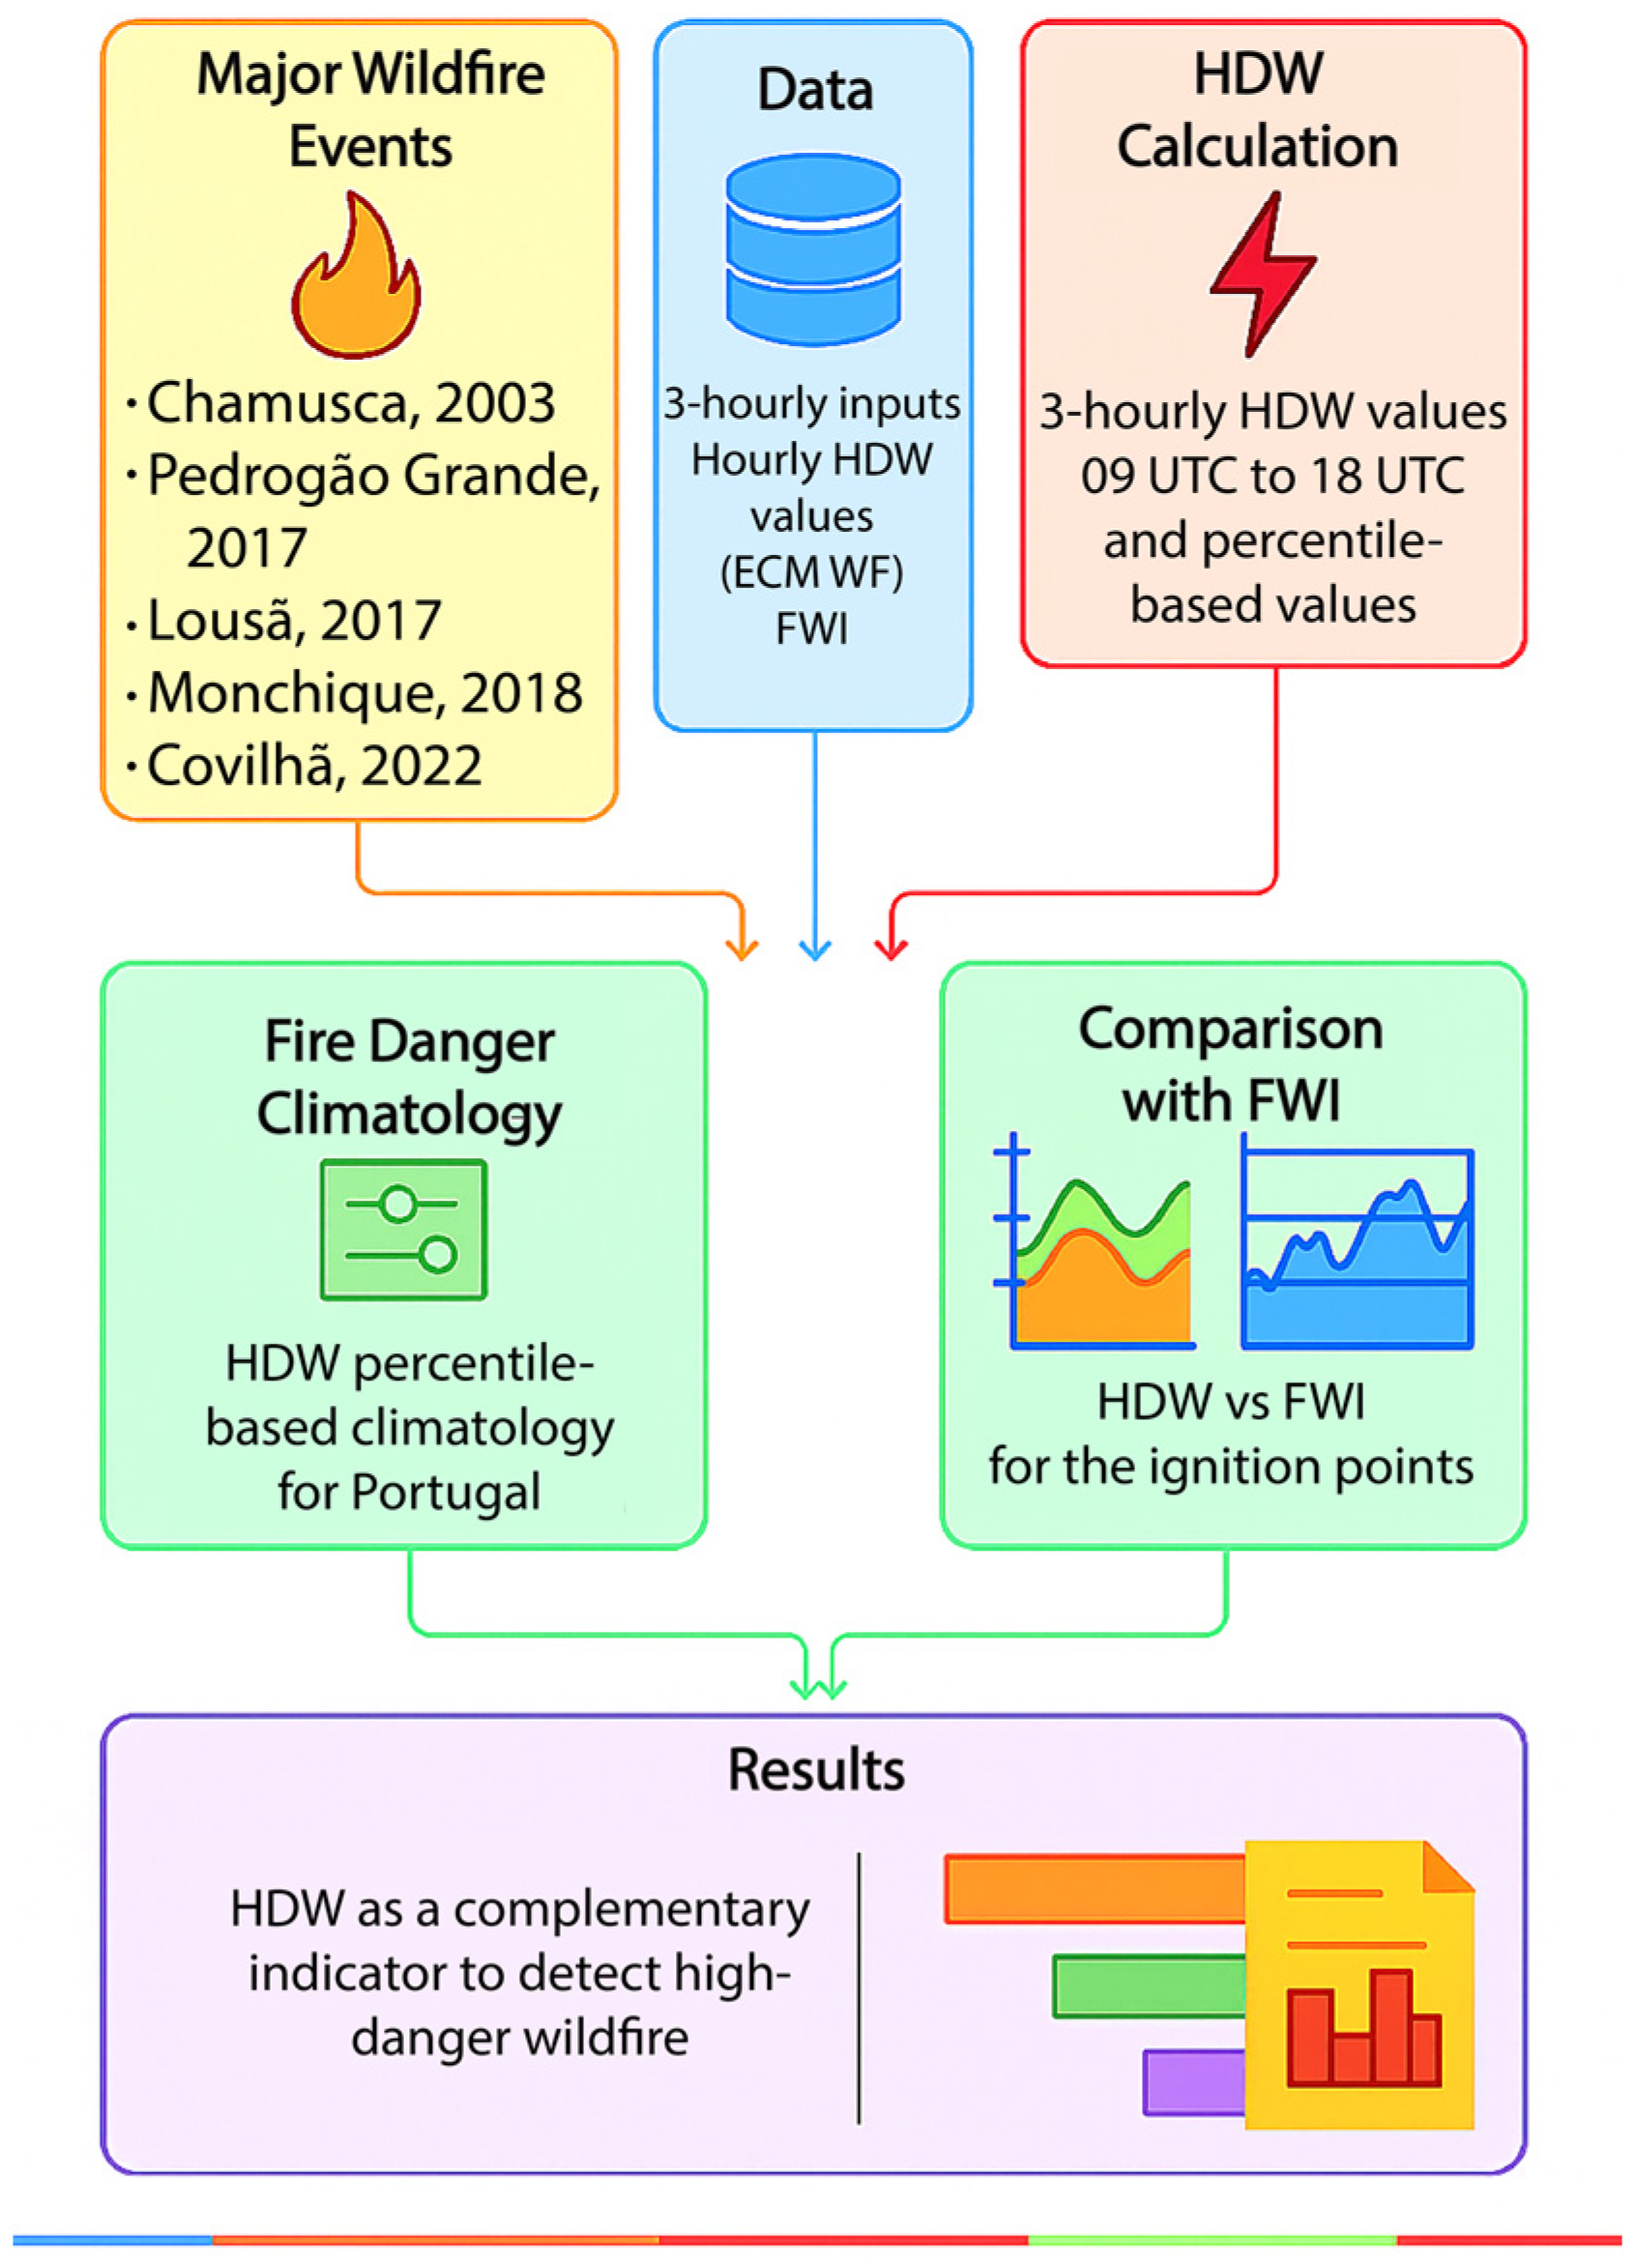
Figure 3 presents a summary of this study workflow, for which a more thorough overall methodological resume can be depicted in Figure A1.

3. Results

The results are structured as five case studies (Section 3.1, Section 3.2, Section 3.3, Section 3.4 and Section 3.5), each corresponding to a major wildfire in Portugal. HDW behaviour is analyzed using hourly climatology, short-term trends, and spatial probability of percentile exceedance at the ignition location. A sixth section (Section 3.6) provides a cross-case comparison and discusses HDW performance relative to FWI. In Section 3.1, Section 3.2, Section 3.3, Section 3.4 and Section 3.5, for each event, a brief description of the synoptic and overall meteorological conditions is provided, followed by an analysis of the HDW index for each case study event.

3.1. The Chamusca Fire (2 August 2003)

The Chamusca wildfire, which ignited on 2 August 2003, developed under an extraordinary set of synoptic and mesoscale meteorological conditions that significantly enhanced fire danger and promoted rapid spread. The summer of 2003 was characterized by persistent drought and anomalous heat across southern Europe. A relatively wet winter was followed by a dry spring and early summer, particularly in central Portugal, resulting in highly flammable vegetation by early August [25,26].
At the synoptic scale, a cyclonic depression off the western Iberian Peninsula interacted with the Azores High, establishing a strong southeasterly flow over Portugal. This circulation facilitated the advection of hot and dry air masses from North Africa. At mid-tropospheric levels (~500 hPa), a thermal ridge associated with subsidence suppressed cloud formation and intensified surface heating. Temperatures at 850 hPa reached 22–26 °C, the highest recorded in the region since at least 1958 [27,28].
Surface meteorological conditions on 2 August were extreme. Maximum air temperatures exceeded 40 °C across large areas of the interior, and nighttime minimum temperatures remained unusually high, locally surpassing 30 °C. Relative humidity dropped below 20%, and surface winds, enhanced by the synoptic pressure gradient, further contributed to the rapid drying of fuels and the ventilation of fire fronts [28,29,30].
These combined conditions—exceptional heat, critically low humidity, and sustained dry winds—produced an environment highly conducive to extreme fire behaviour. The Chamusca event exemplifies a characteristic synoptic fire-weather pattern in Portugal: a cyclonic system to the west, advecting Saharan air masses into the Iberian Peninsula. This configuration has been widely recognized as one of the most hazardous patterns associated with major wildfire events in the region [25,26,27,30].
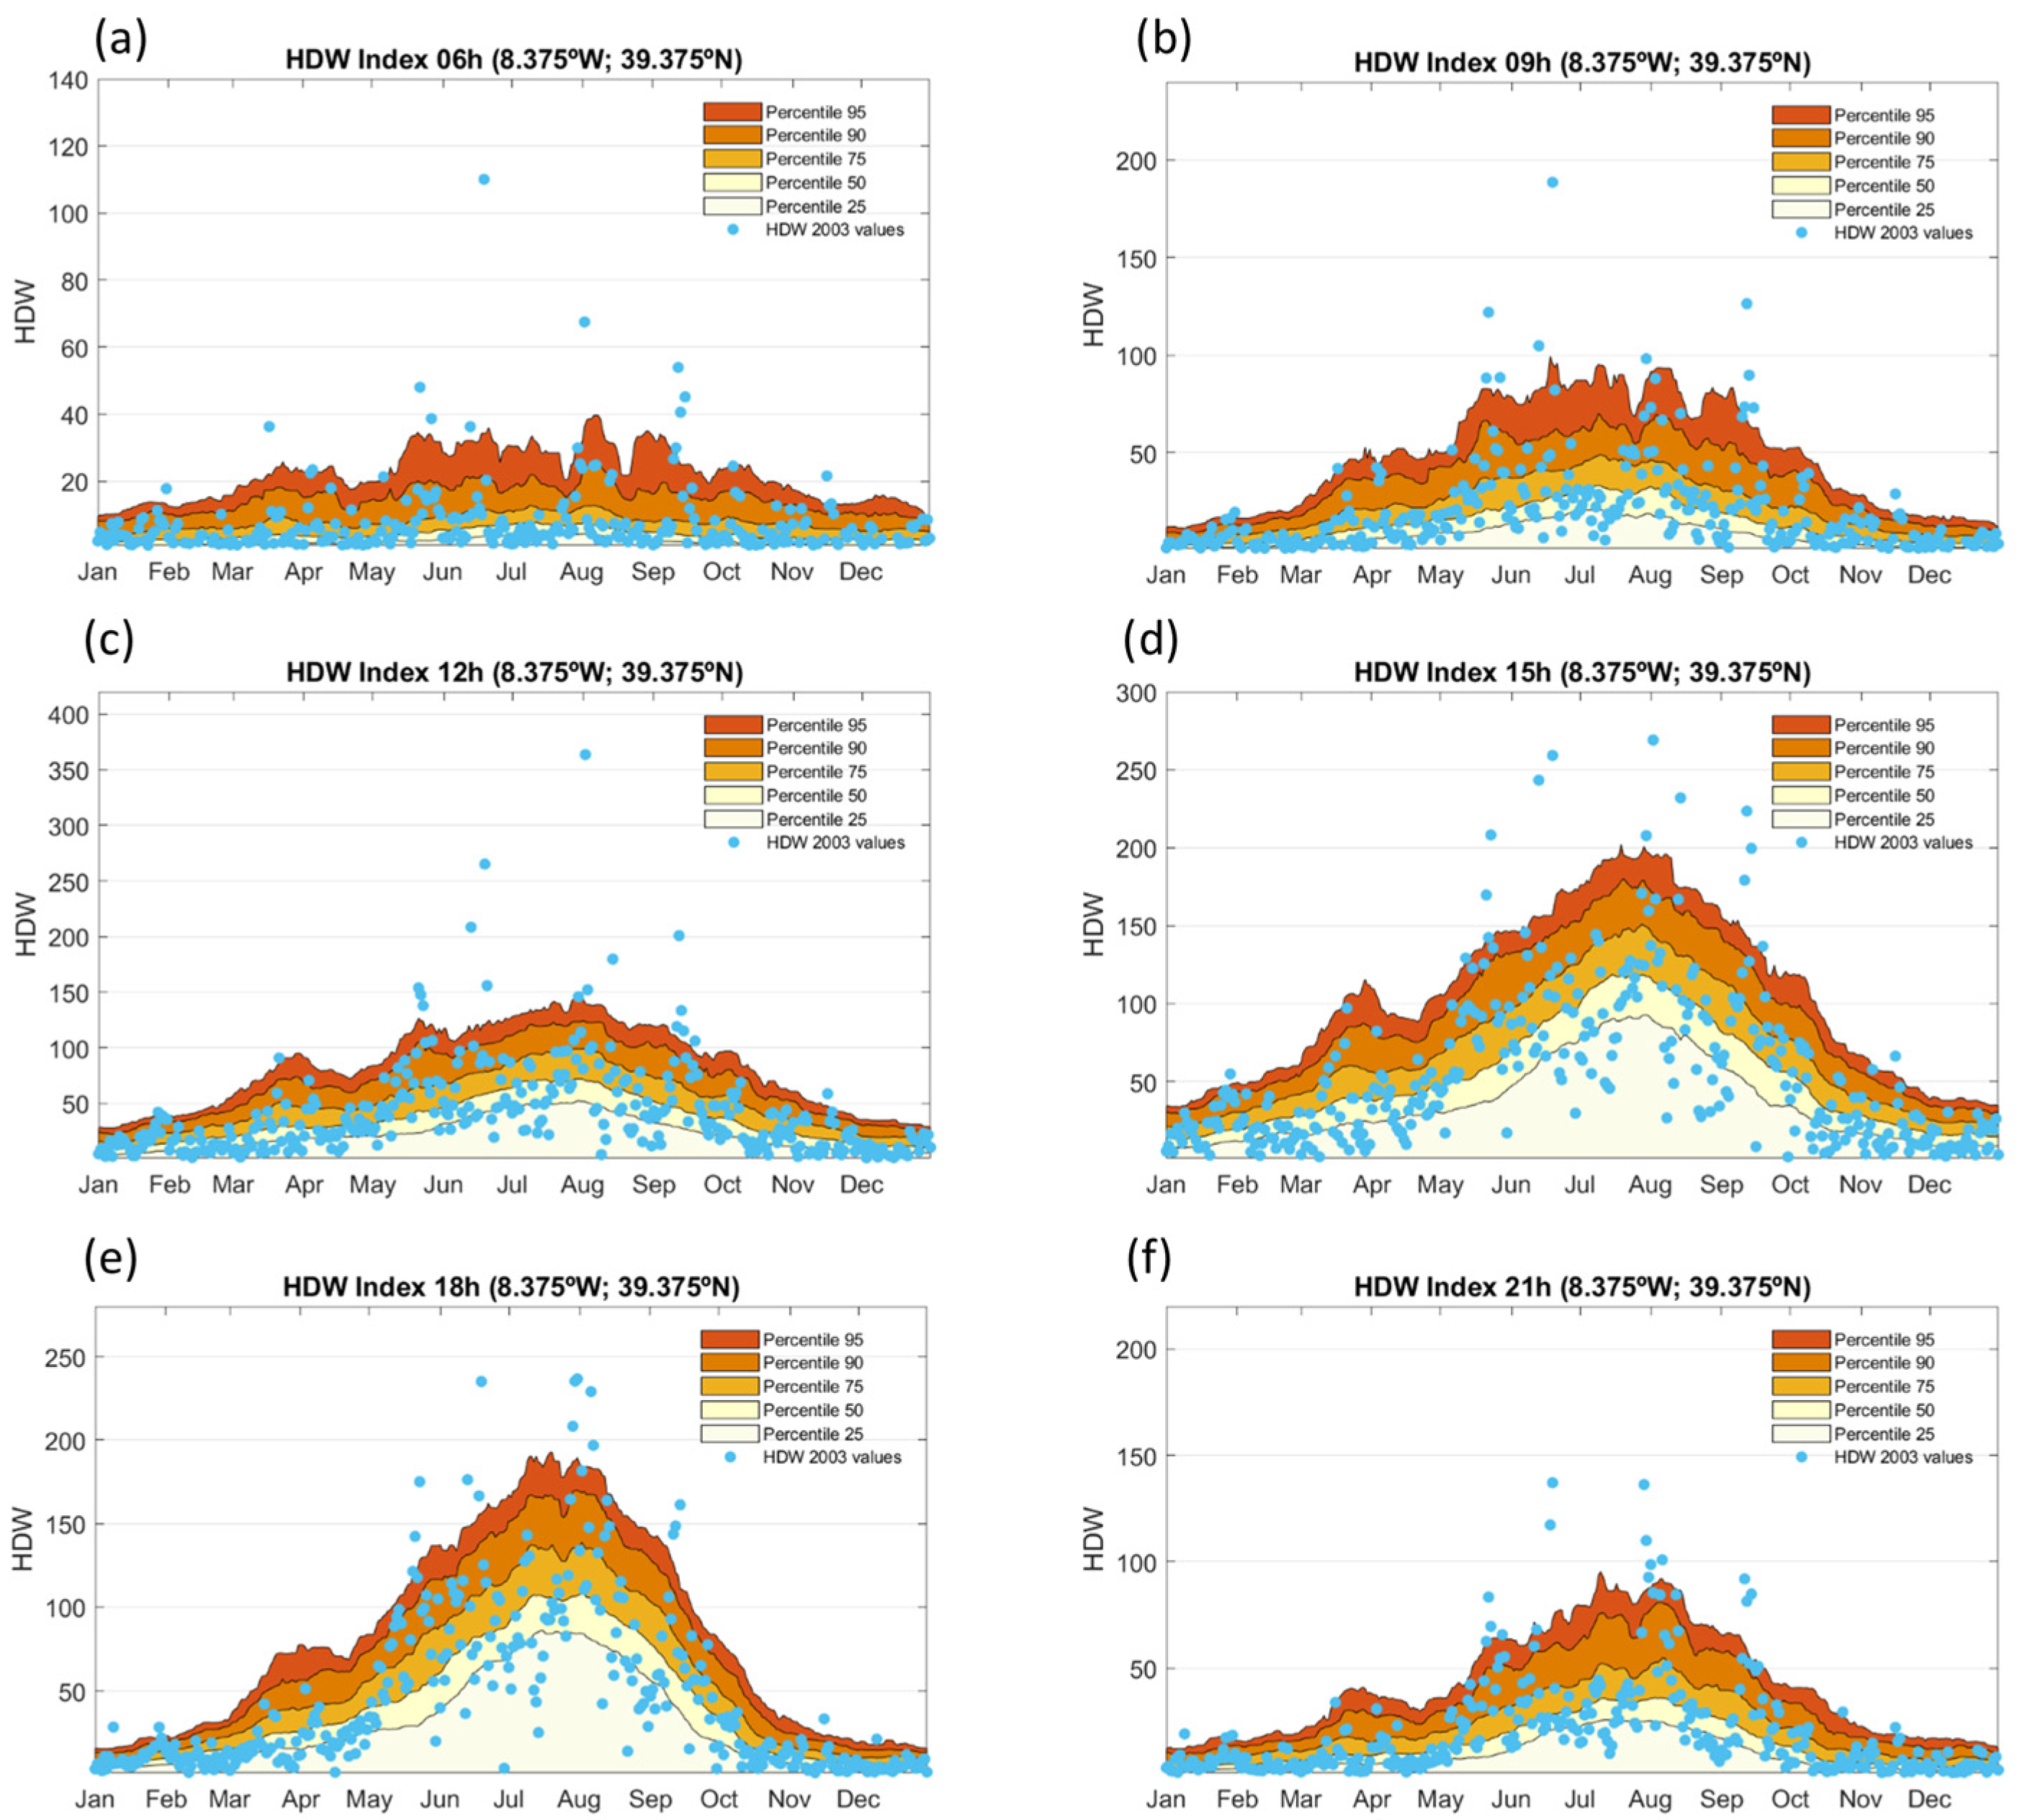
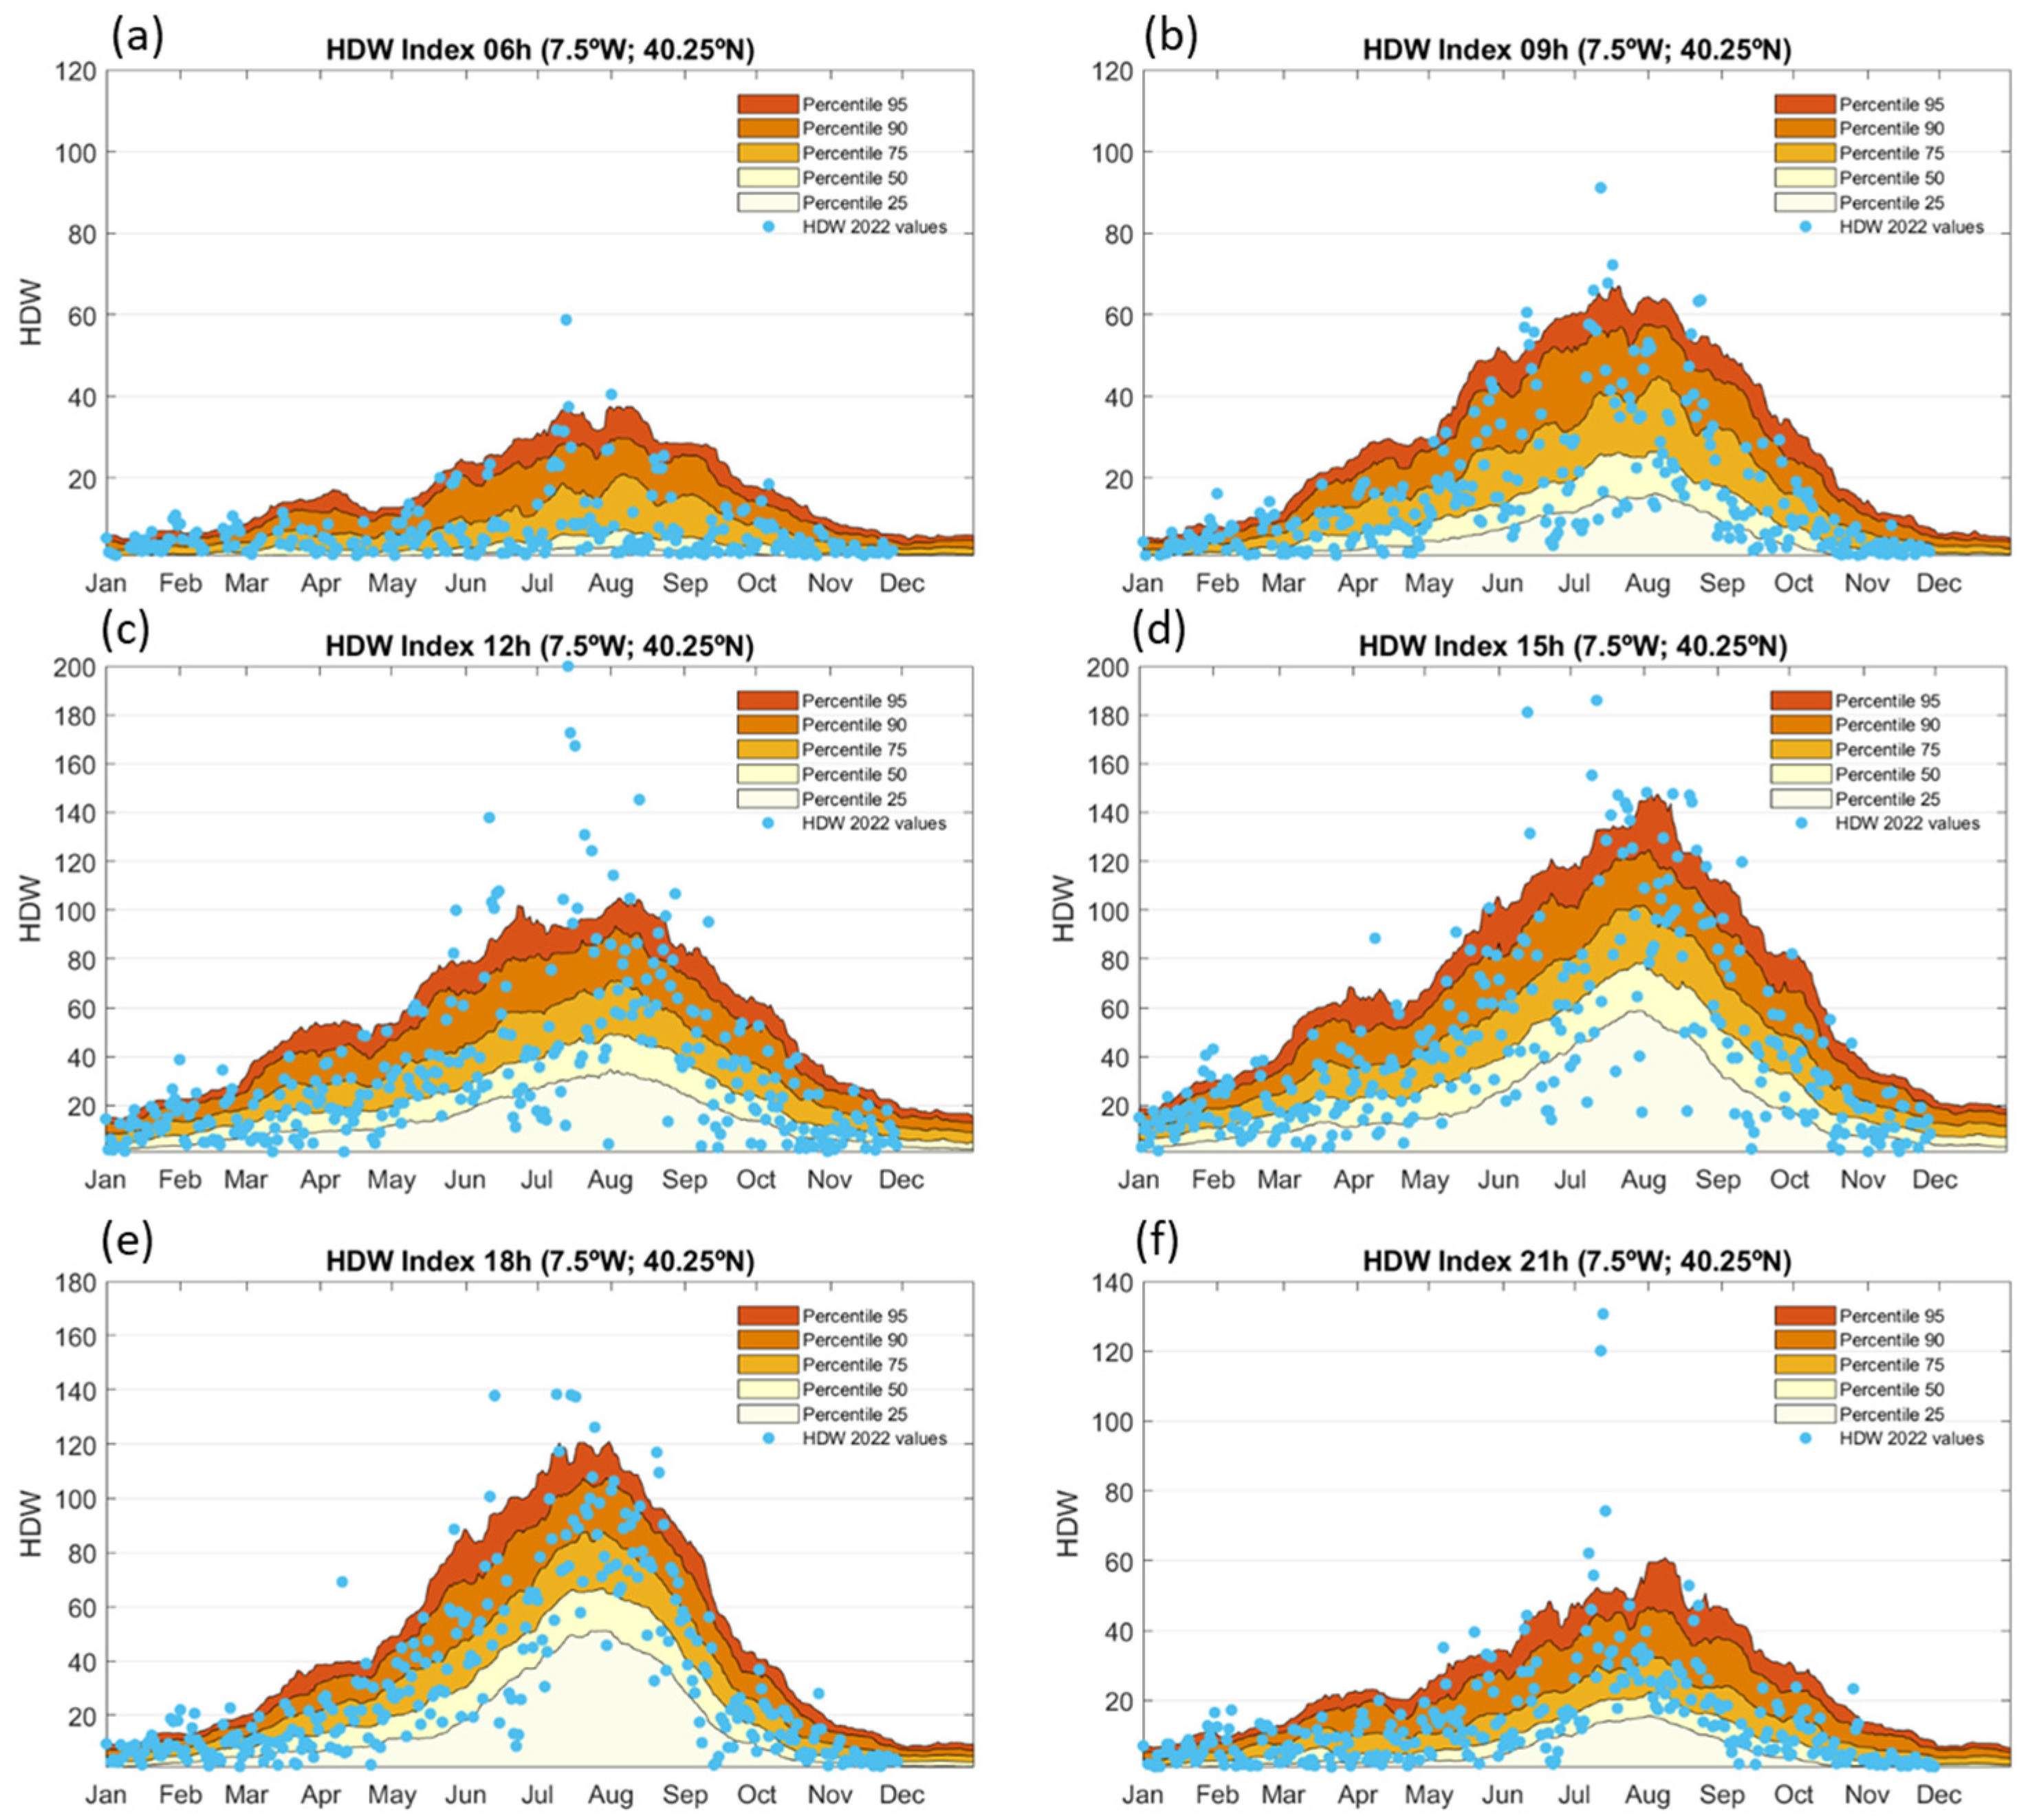
To assess the atmospheric conditions during the 2003 Chamusca wildfire, we computed the HDW index at the ignition location (8.375° W, 39.375° N) for six synoptic times (06 UTC, 09 UTC, 12 UTC, 15 UTC, 18 UTC, and 21 UTC) and compared the 2003 values against the HDW climatology (1991–2020) (Figure 4). Results indicate that the HDW index exhibited a clear seasonal and diurnal pattern, with peak climatological values occurring between May and September, and reaching maximum intensity during afternoon hours (12–18 UTC).
In 2003, a year characterized by extreme fire activity across Portugal, HDW values for multiple days exceeded the 90th and 95th percentiles, especially during the summer peak. Critically, on 2 August 2003, the day of the Chamusca ignition, the HDW index at 12 UTC, 15 UTC, and 18 UTC exceeded the 95th climatological percentile, indicating highly anomalous and conducive fire weather conditions. This pattern highlights the temporal alignment between peak HDW values and the most active fire-spread window, which is consistent with the fire’s rapid progression observed during the early afternoon.
The strong diurnal modulation of HDW, combined with its ability to capture percentile exceedances during critical fire events, underscores the utility of HDW as a complementary metric to the FWI. In this case, HDW provided robust temporal resolution and synoptic context that reinforced the interpretation of 2003 as a year of elevated fire-weather hazard in central Portugal.
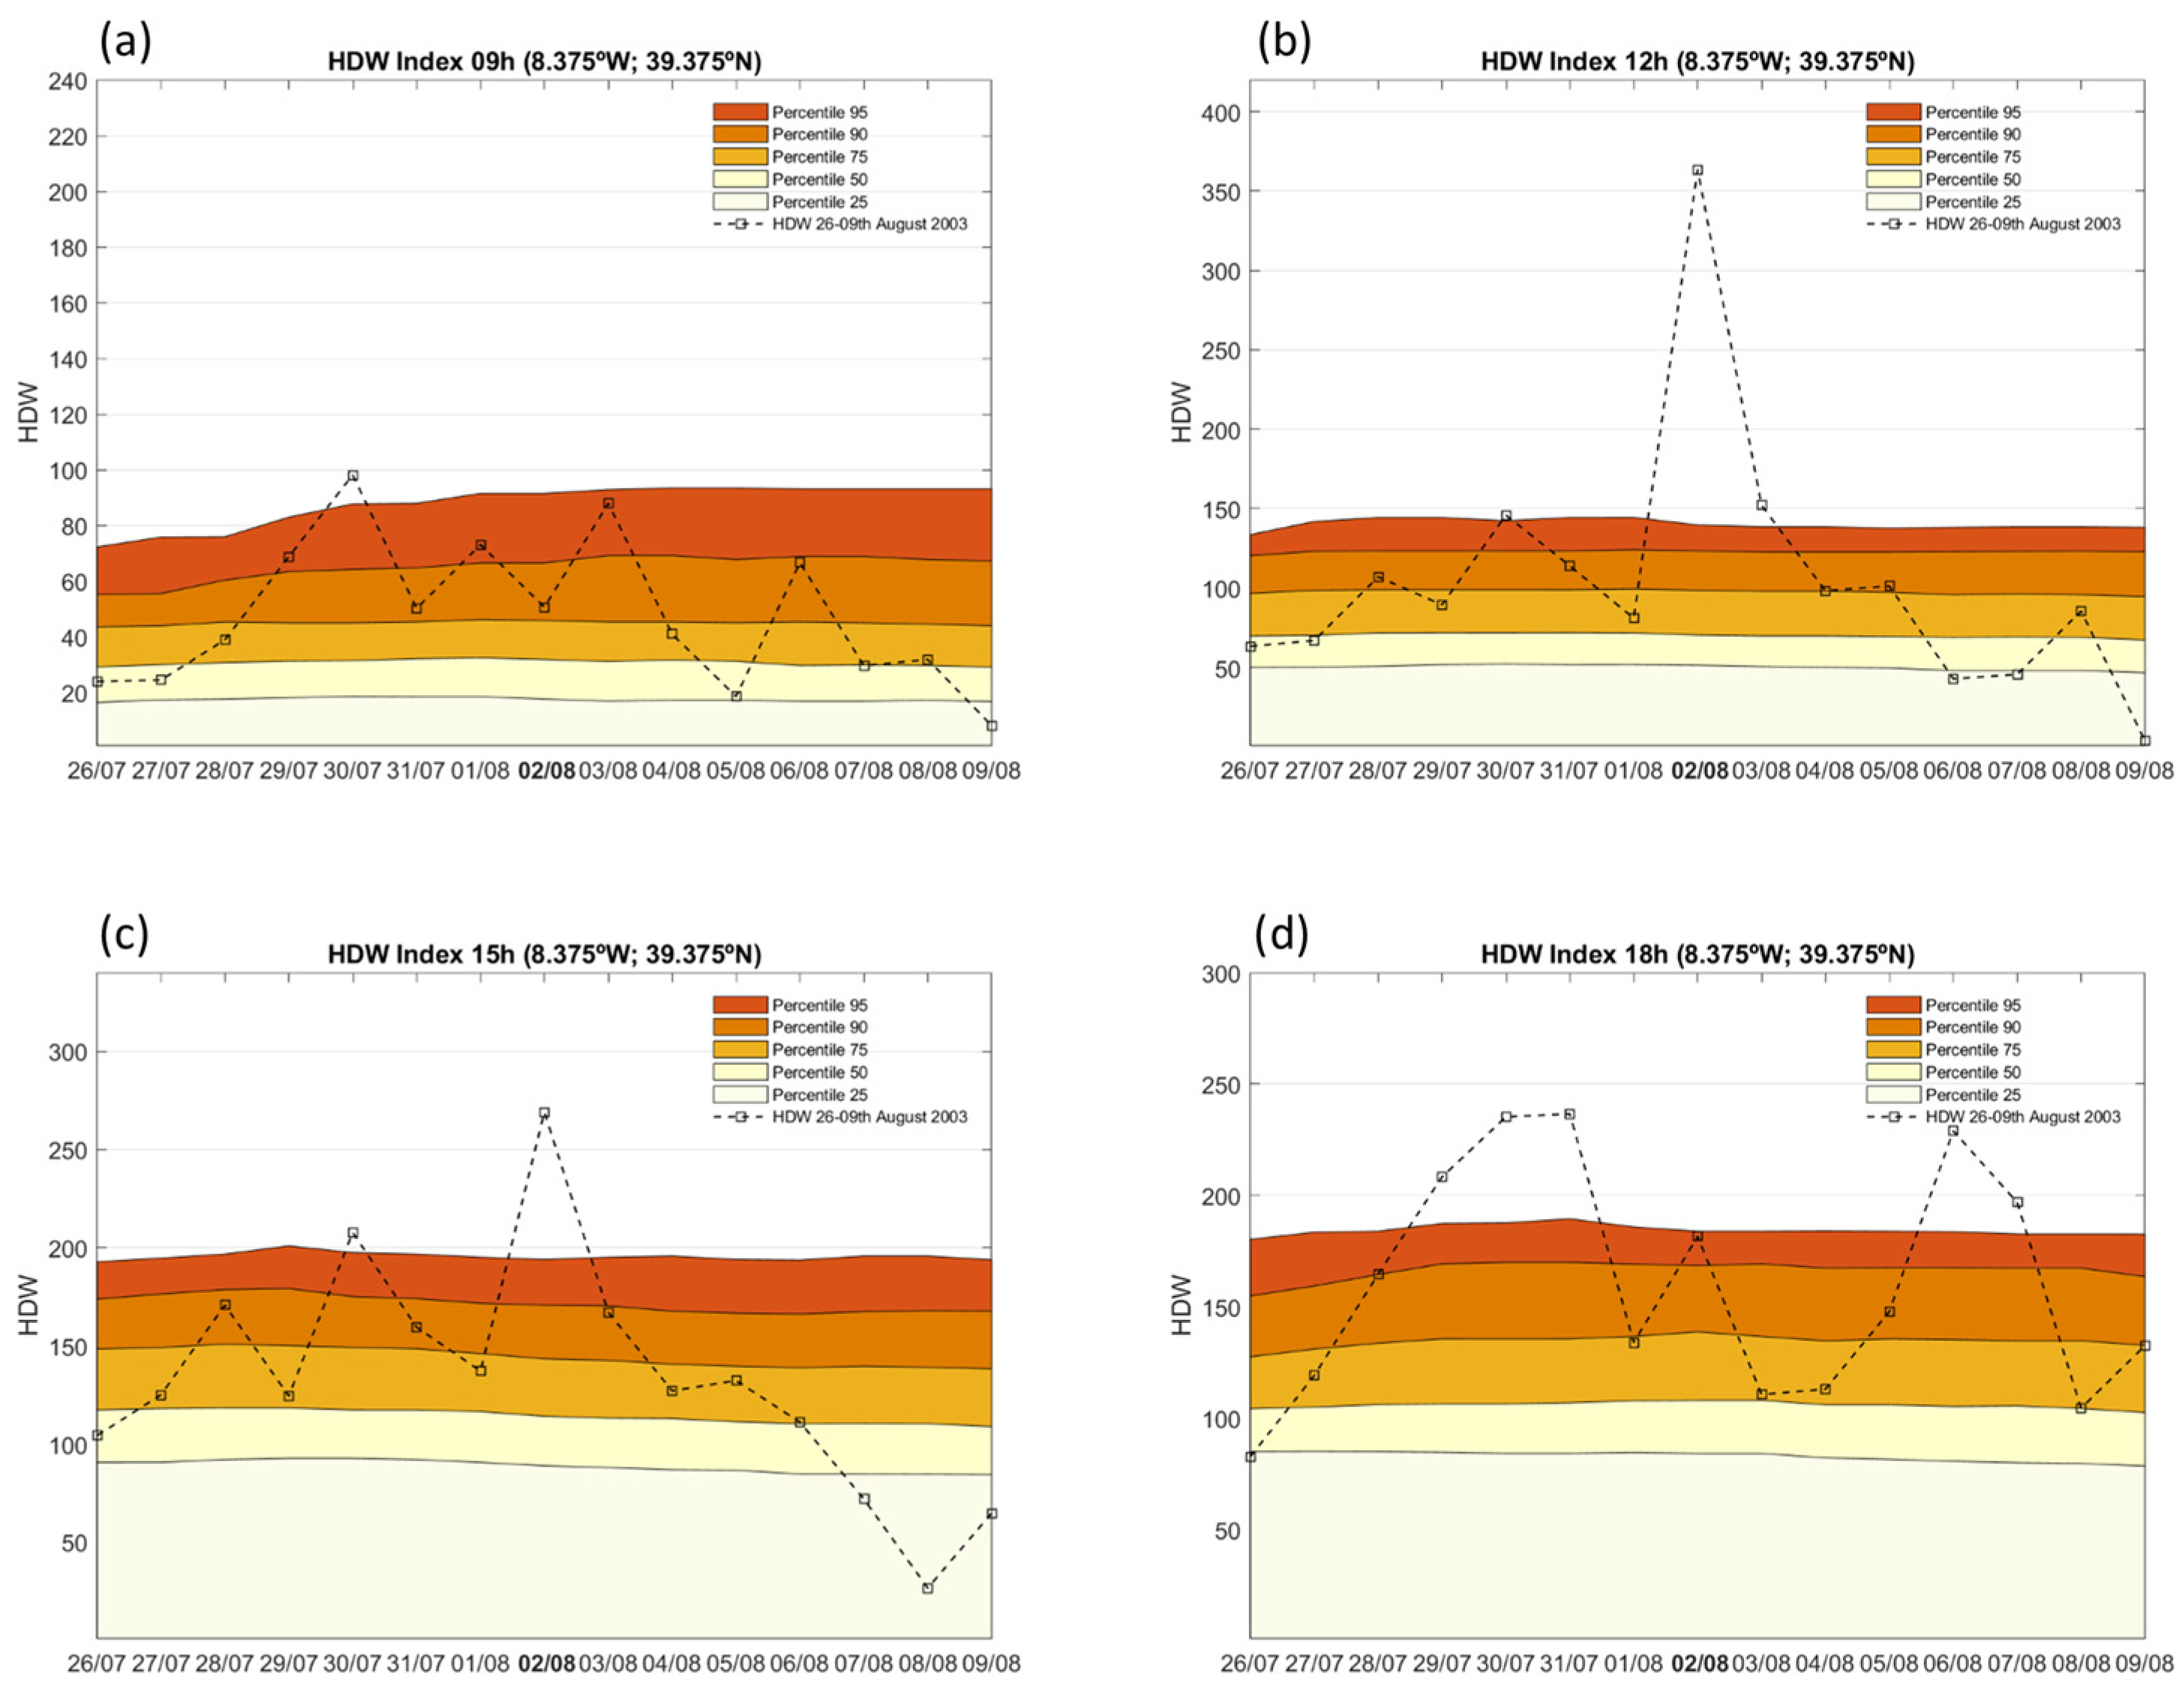
As shown in Figure 5, the HDW index reached exceptionally high values between 12 UTC and 18 UTC, peaking above the 95th climatological percentile, particularly at 12 UTC, which coincides with the afternoon period typically associated with intense fire activity. These values stand out sharply relative to the baseline climatology, indicating a synoptically driven spike in fire-weather potential.
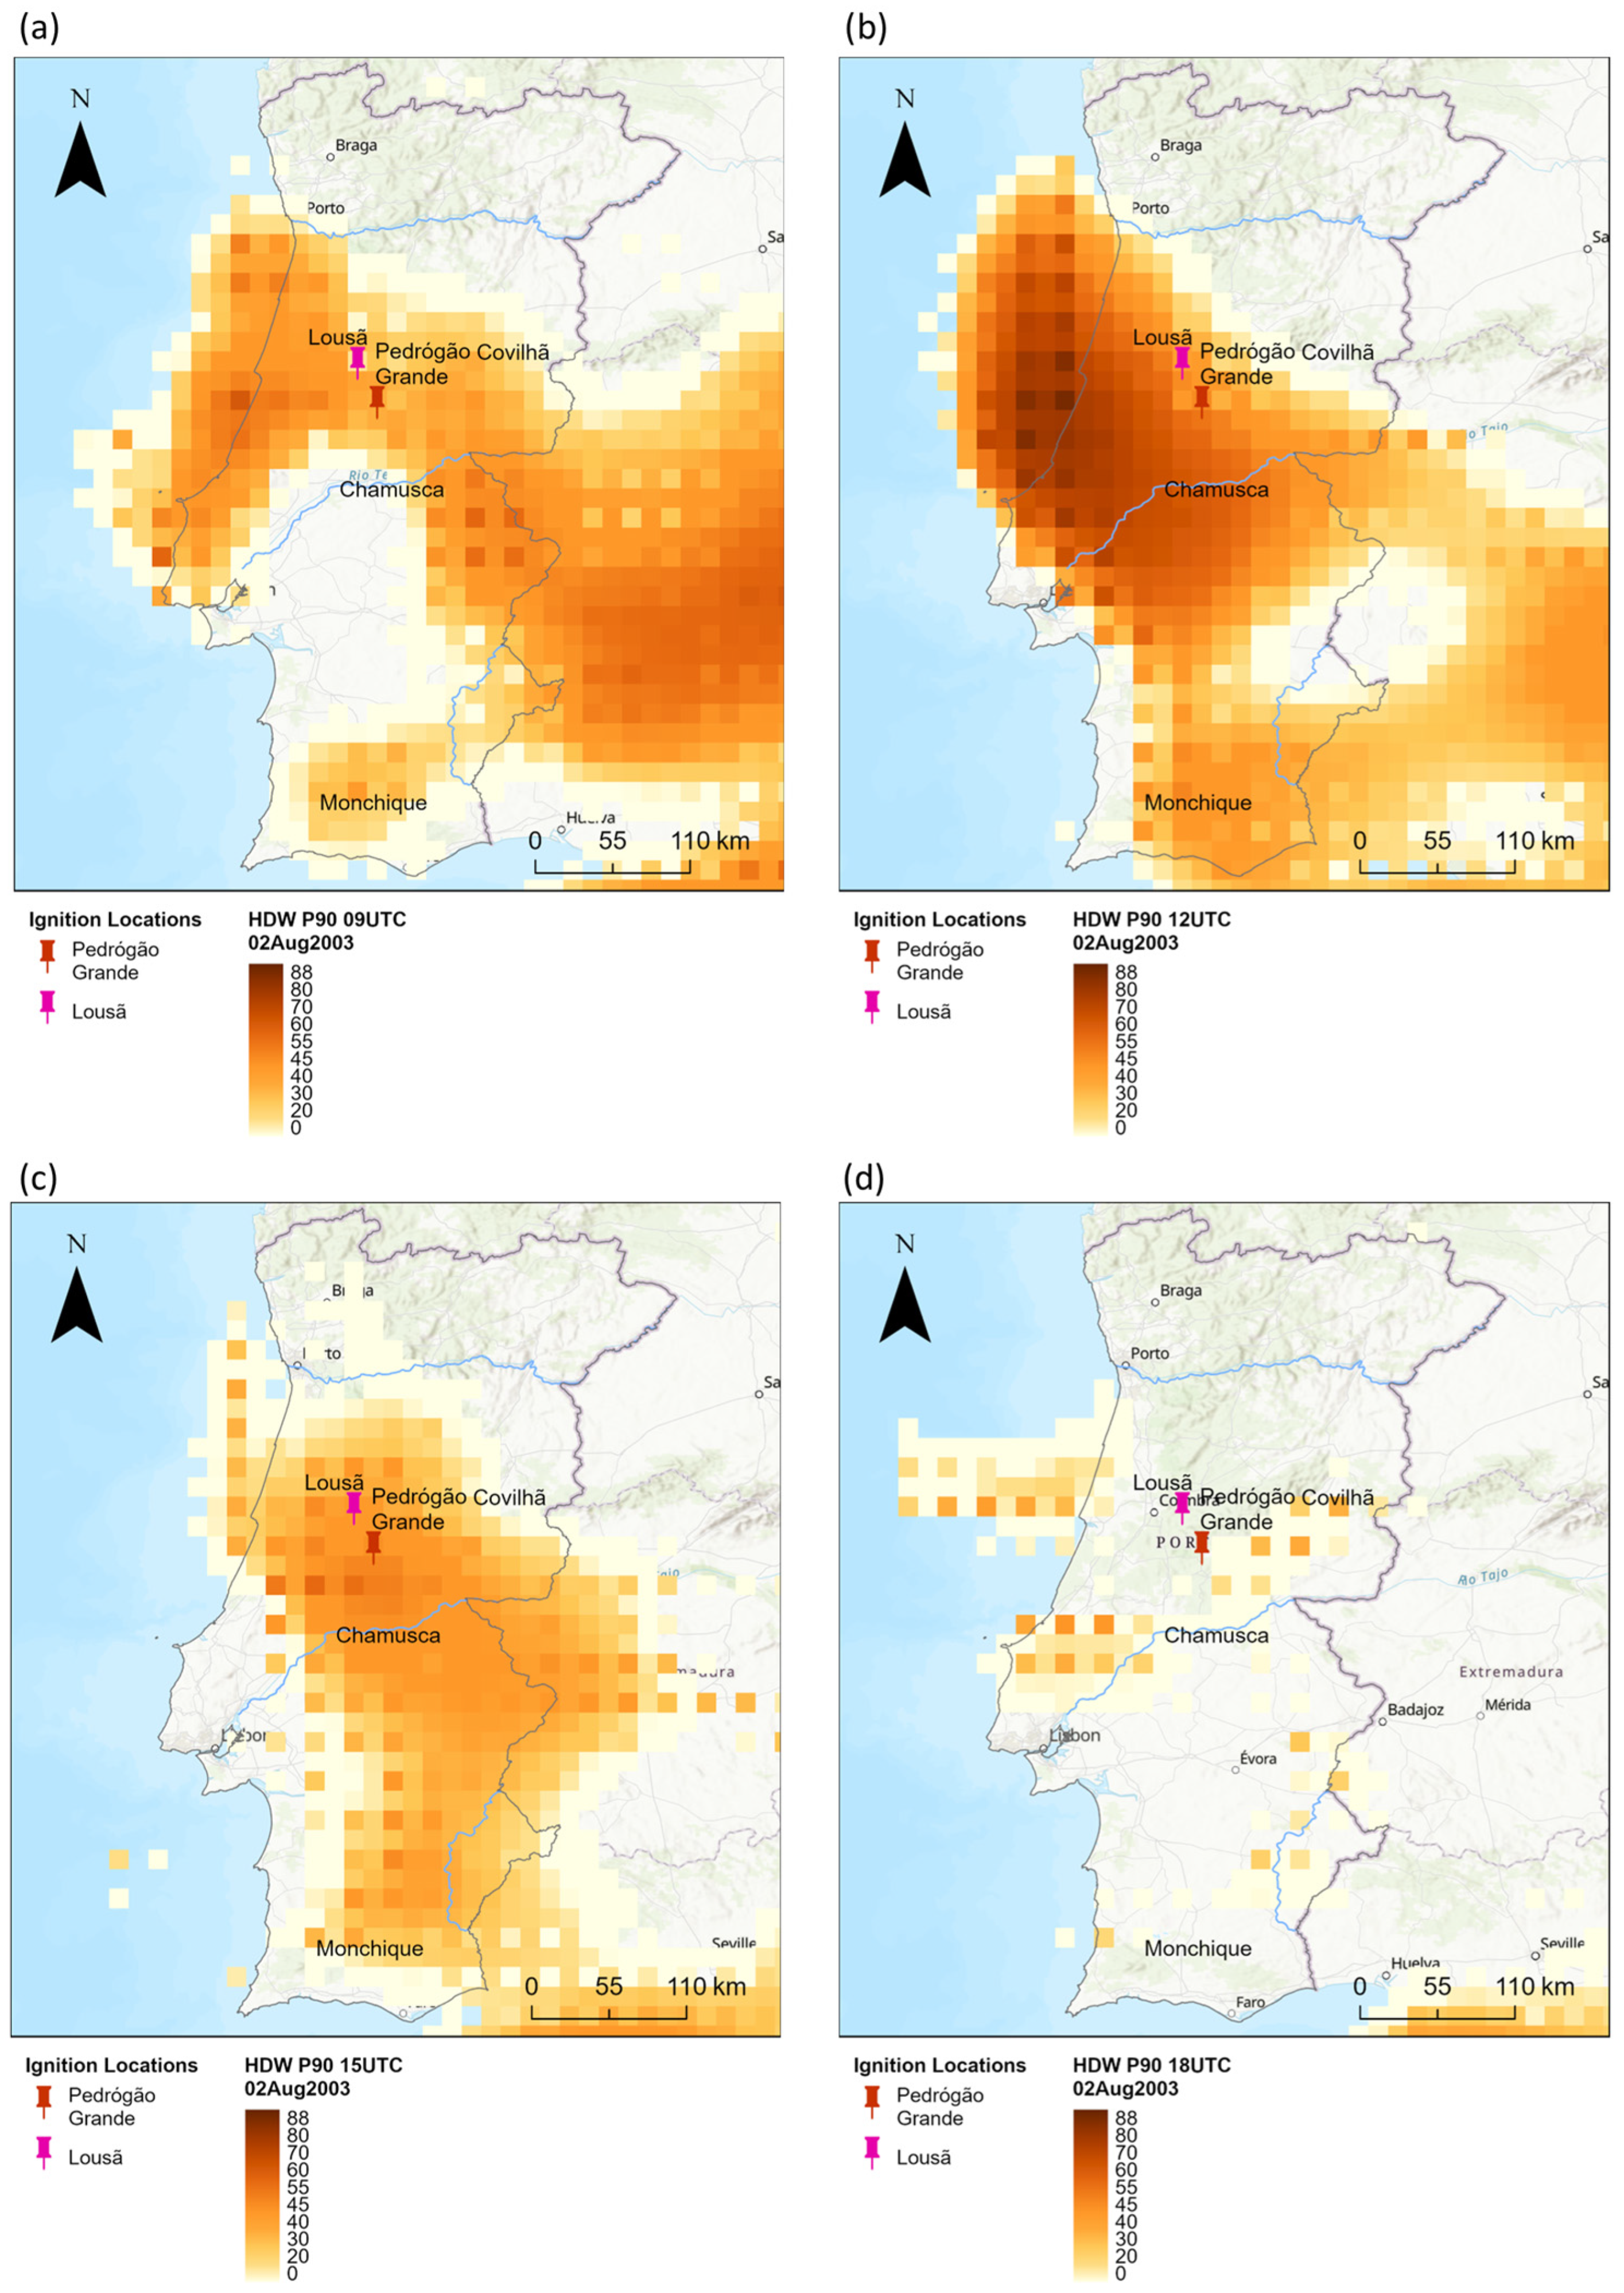
Furthermore, a spatial analysis of HDW values exceeding the 90th climatological percentile (Figure 6) reveals widespread anomalous conditions across central Portugal on the same day. At 09 UTC and 12 UTC, elevated HDW exceedance probabilities (exceeding 70%–80%) encompassed large portions of the Ribatejo and Beira regions, including the Chamusca ignition site. By 15 UTC, the area of extreme HDW probabilities expanded, indicating widespread, synchronously elevated fire-weather danger across much of the interior and central-western sectors. The anomaly diminished by 18 UTC, suggesting that the most critical window for fire initiation and rapid spread was during the early to mid-afternoon.
These combined temporal and spatial diagnostics emphasize that HDW captured the timing and intensity of critical fire-weather conditions more responsively than traditional daily averaged indices. The strong alignment between HDW peaks and the timing of fire ignition and spread reinforces the index’s value for operational early warning systems and retrospective wildfire attribution in Portugal’s complex Mediterranean-influenced climate.

3.2. The Pedrógão Grande Fire (17 June 2017)

The Pedrógão Grande wildfire, which ignited on 17 June 2017, was precipitated by a confluence of extreme synoptic and convective weather conditions, resulting in Portugal’s deadliest modern wildfire. A persistent heatwave brought temperatures exceeding 40 °C across central Portugal, combined with prolonged drought, notably drying out flammable pine and eucalyptus forests in the Pinhal Interior Norte region [31,32,33,34,35].
Synoptically, a thermal low developed over the Iberian Peninsula due to exceptional surface heating, inducing a strong southerly advection of hot, dry air from North Africa at the 850 hPa level [34]. Enhanced mid-tropospheric instability fostered by a thermal ridge and associated subsidence further elevated surface temperatures [32]. Surface observations at 18 UTC (19 local time) recorded air temperatures around 40 °C, low relative humidity, and initially moderate winds that intensified later in the firefight [34,36].
Crucially, the wildfire was embedded within a mesoscale convective system (MCS), formed by a dry thunderstorm that produced lightning and generated downburst winds [32,33,34]. During the event’s mature stage, the MCS induced strong surface wind episodes via organized downflows—front-to-rear convective inflows and rear-to-front mid-level inflows descending with acceleration—which dramatically influenced fire behaviour [36]. These convective outflows not only increased lateral fire spread but also contributed to rapid spot-fire generation and the merging of multiple ignitions into a firestorm [32].
This convergence of conditions—extreme heat, drought, southeasterly hot advection, and convectively driven intense wind—culminated in a highly destructive wildfire. Over five days, the fire consumed approximately 45,000 ha, claimed 66 lives, and injured more than 250 individuals [32,35,36]. The Pedrógão Grande event exemplifies an atypical yet increasingly recognized synoptic pattern in Portugal’s wildfire climatology: heat-induced enhancement of lower-atmosphere instability coexisting with mesoscale convective activity, which together yield explosive and deadly fire behaviour.
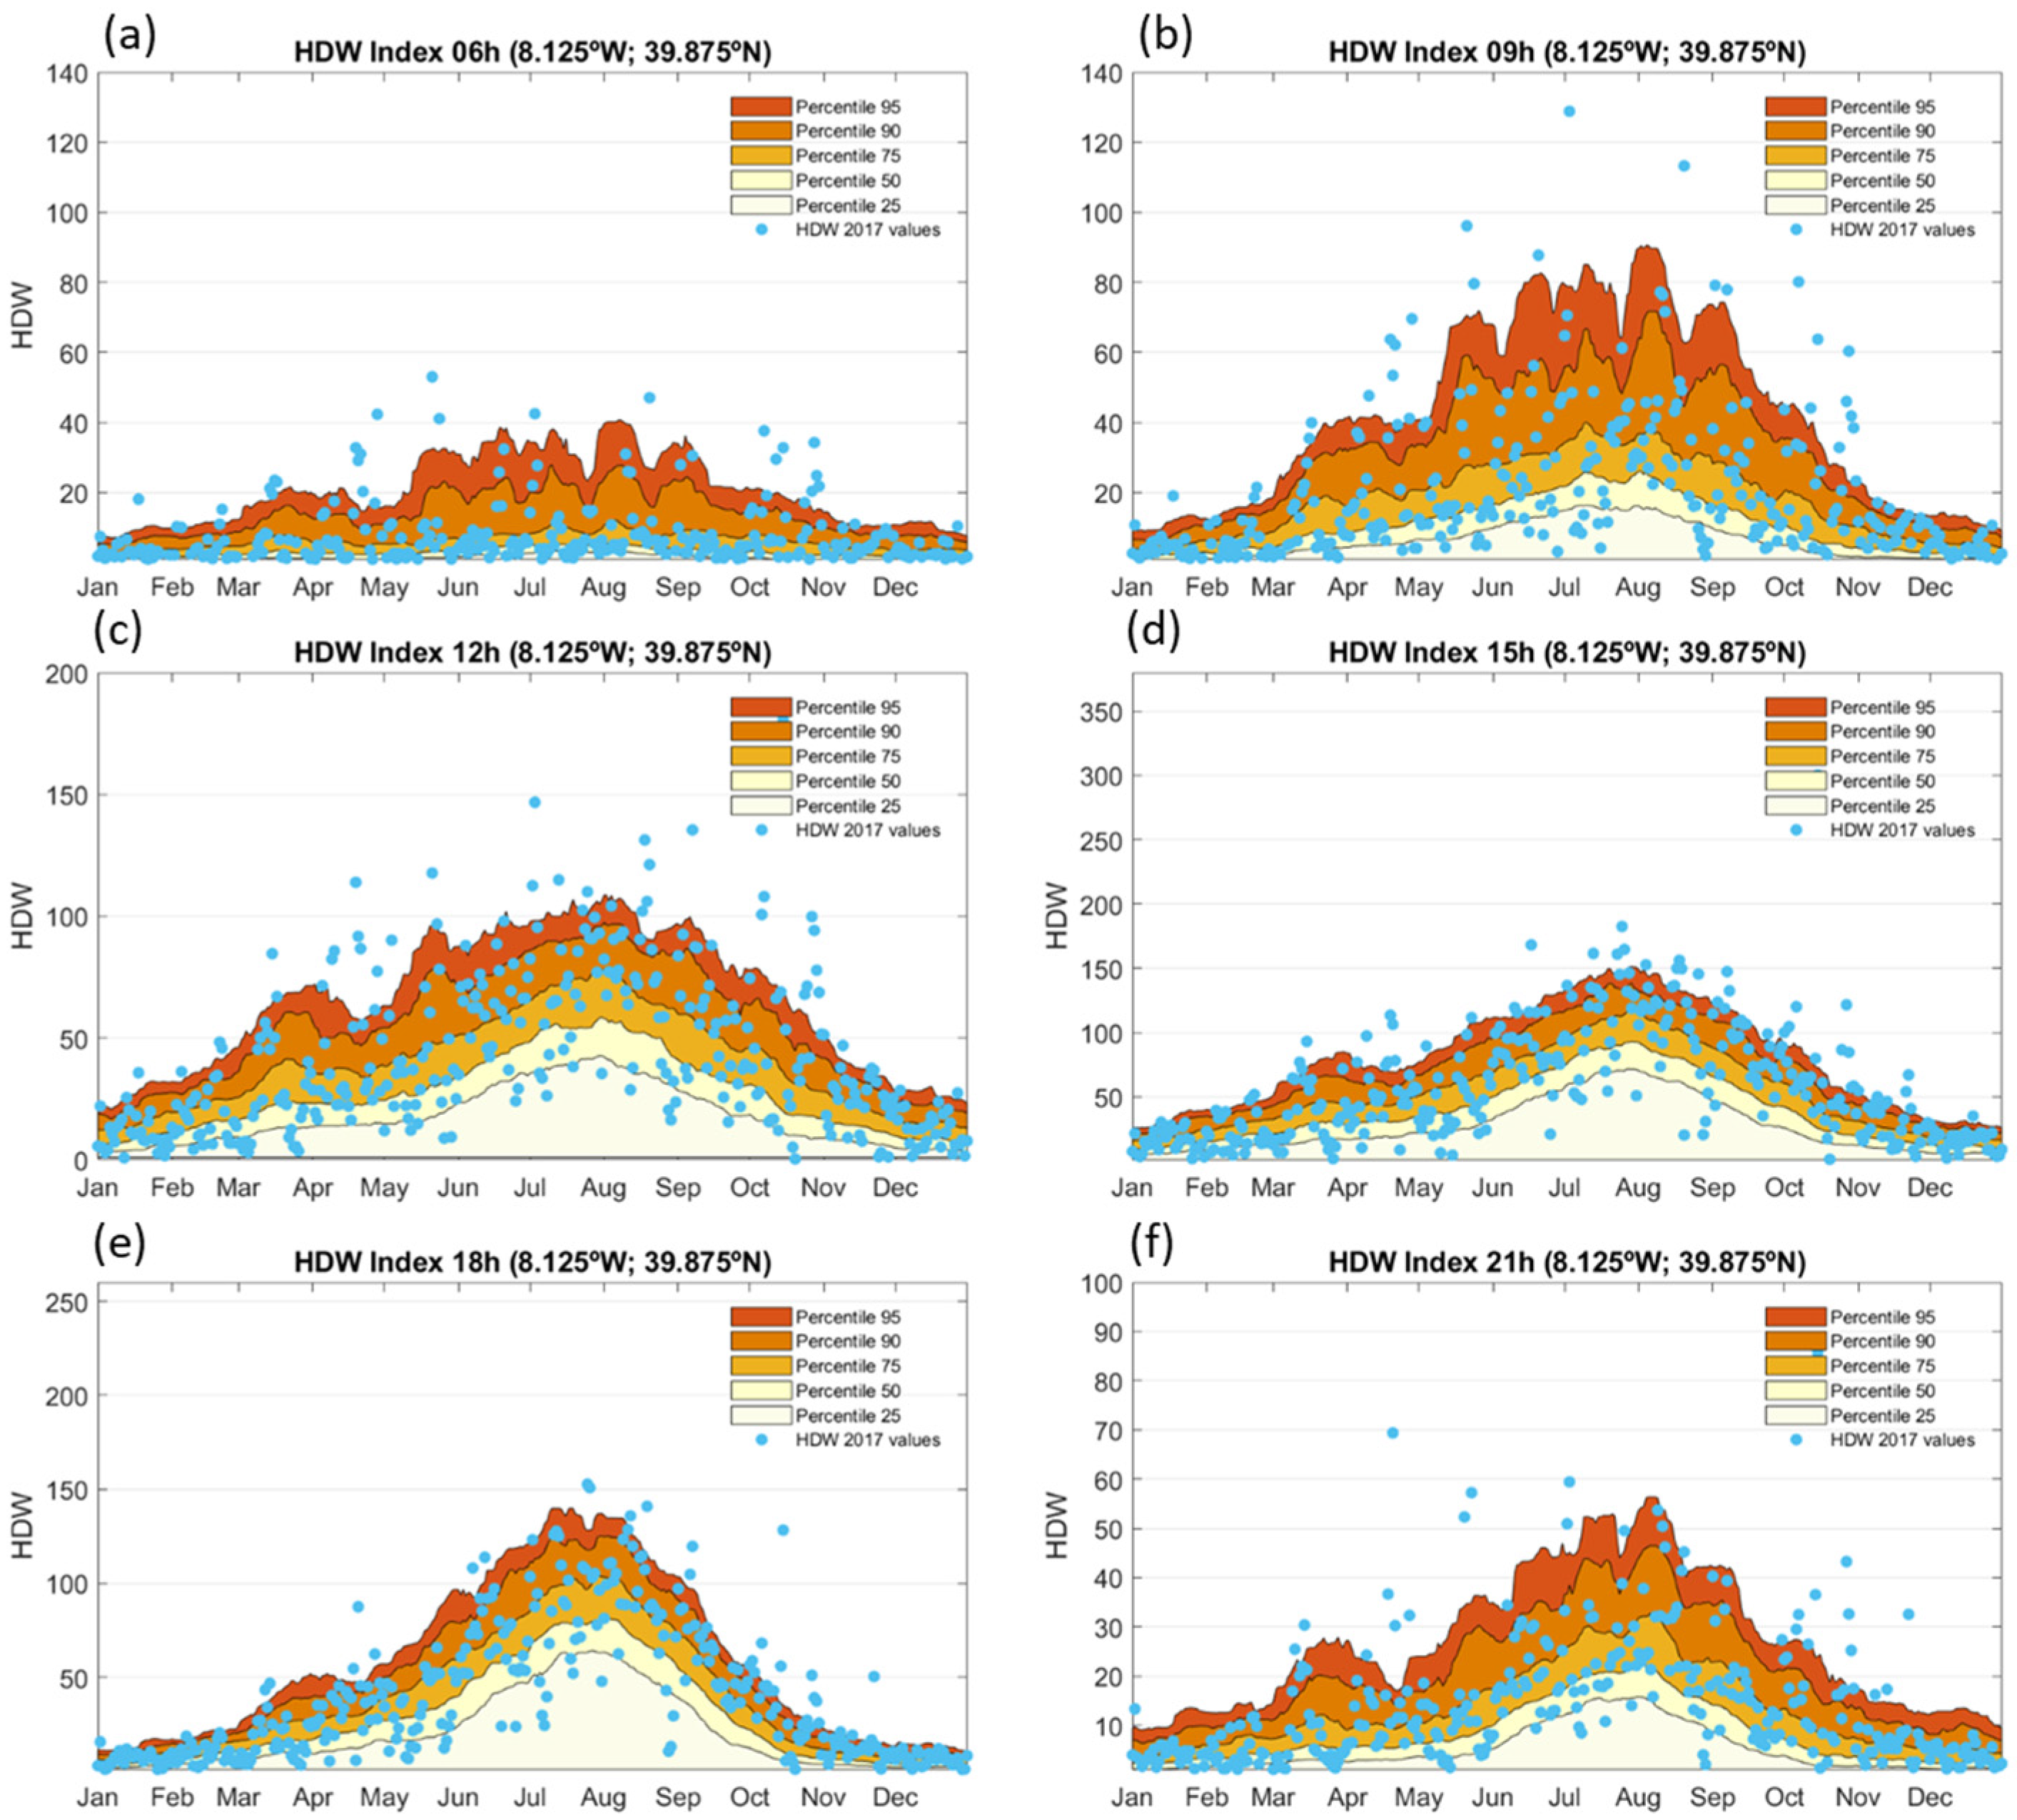
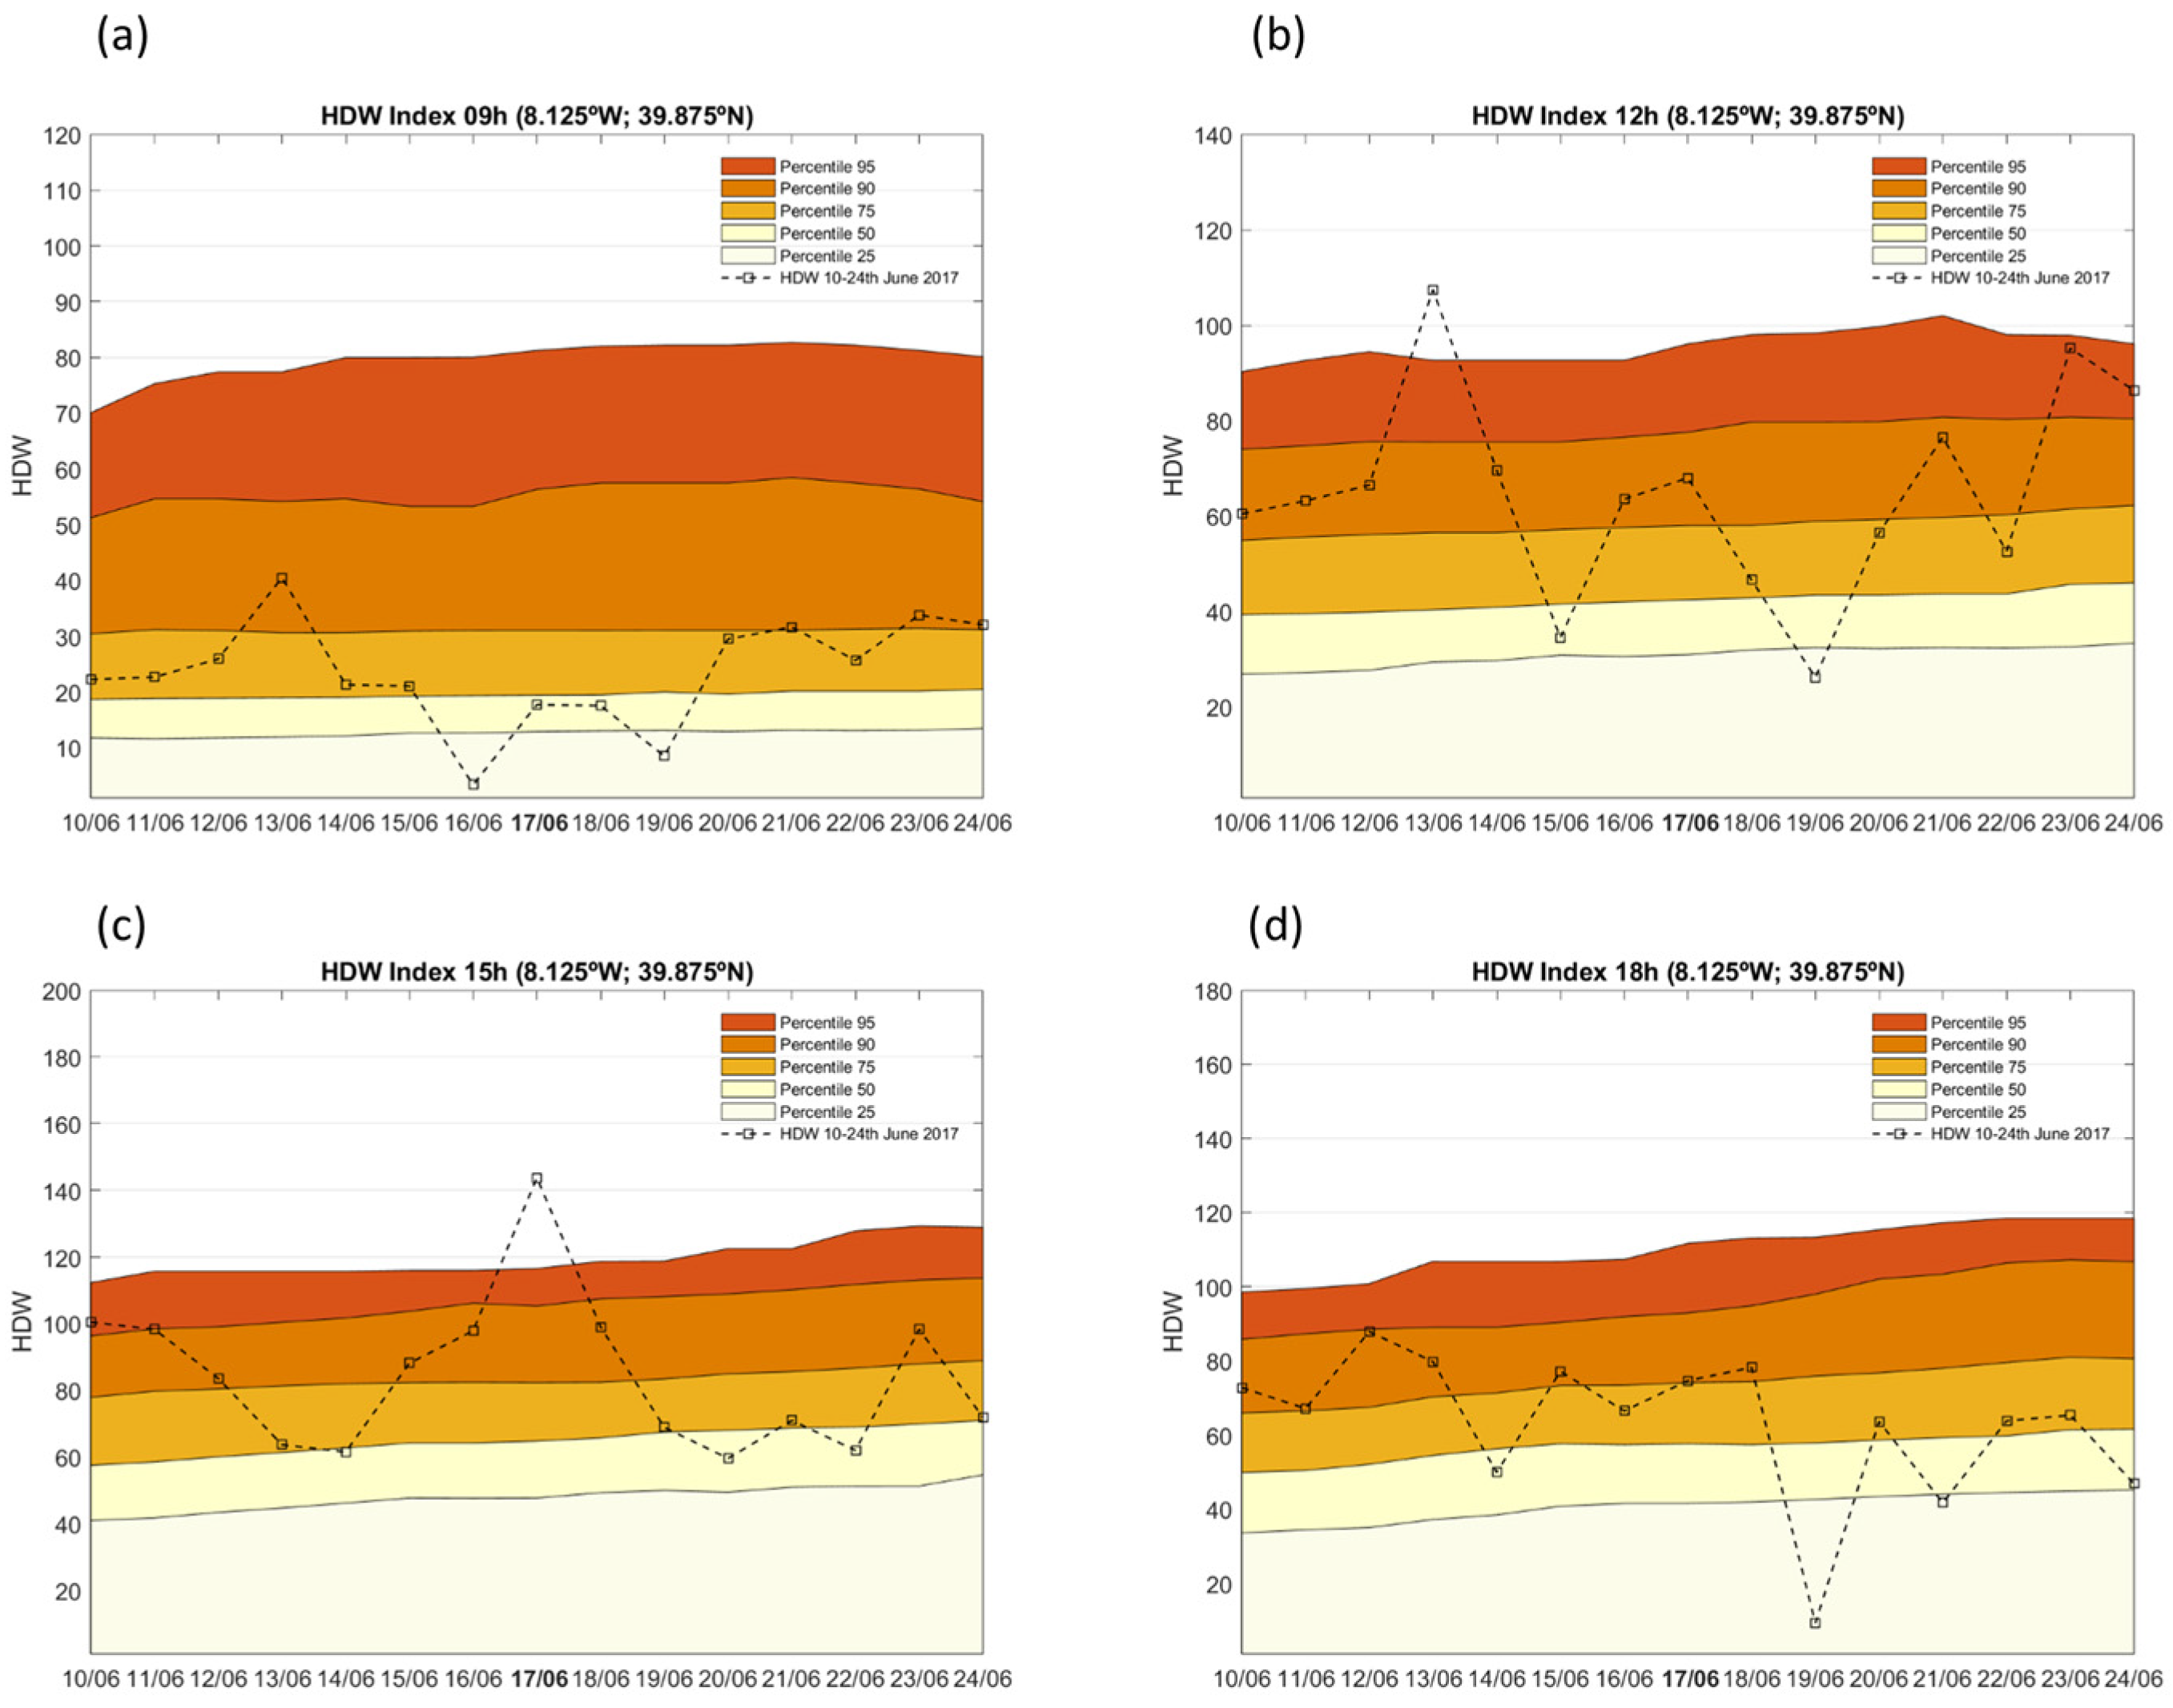
Figure 7 shows the daily HDW index values for the year 2017 (blue dots) at the ignition location of the Pedrógão Grande fire (8.125° W, 39.875° N), for six synoptic hours (06–21 UTC), alongside the 1991–2020 climatological percentiles. Notably, HDW values on 17 June 2017 exceed the 90th and 95th percentiles from 12 UTC to 18 UTC, indicating highly anomalous and hazardous fire-weather conditions during the key window of fire ignition and early spread.
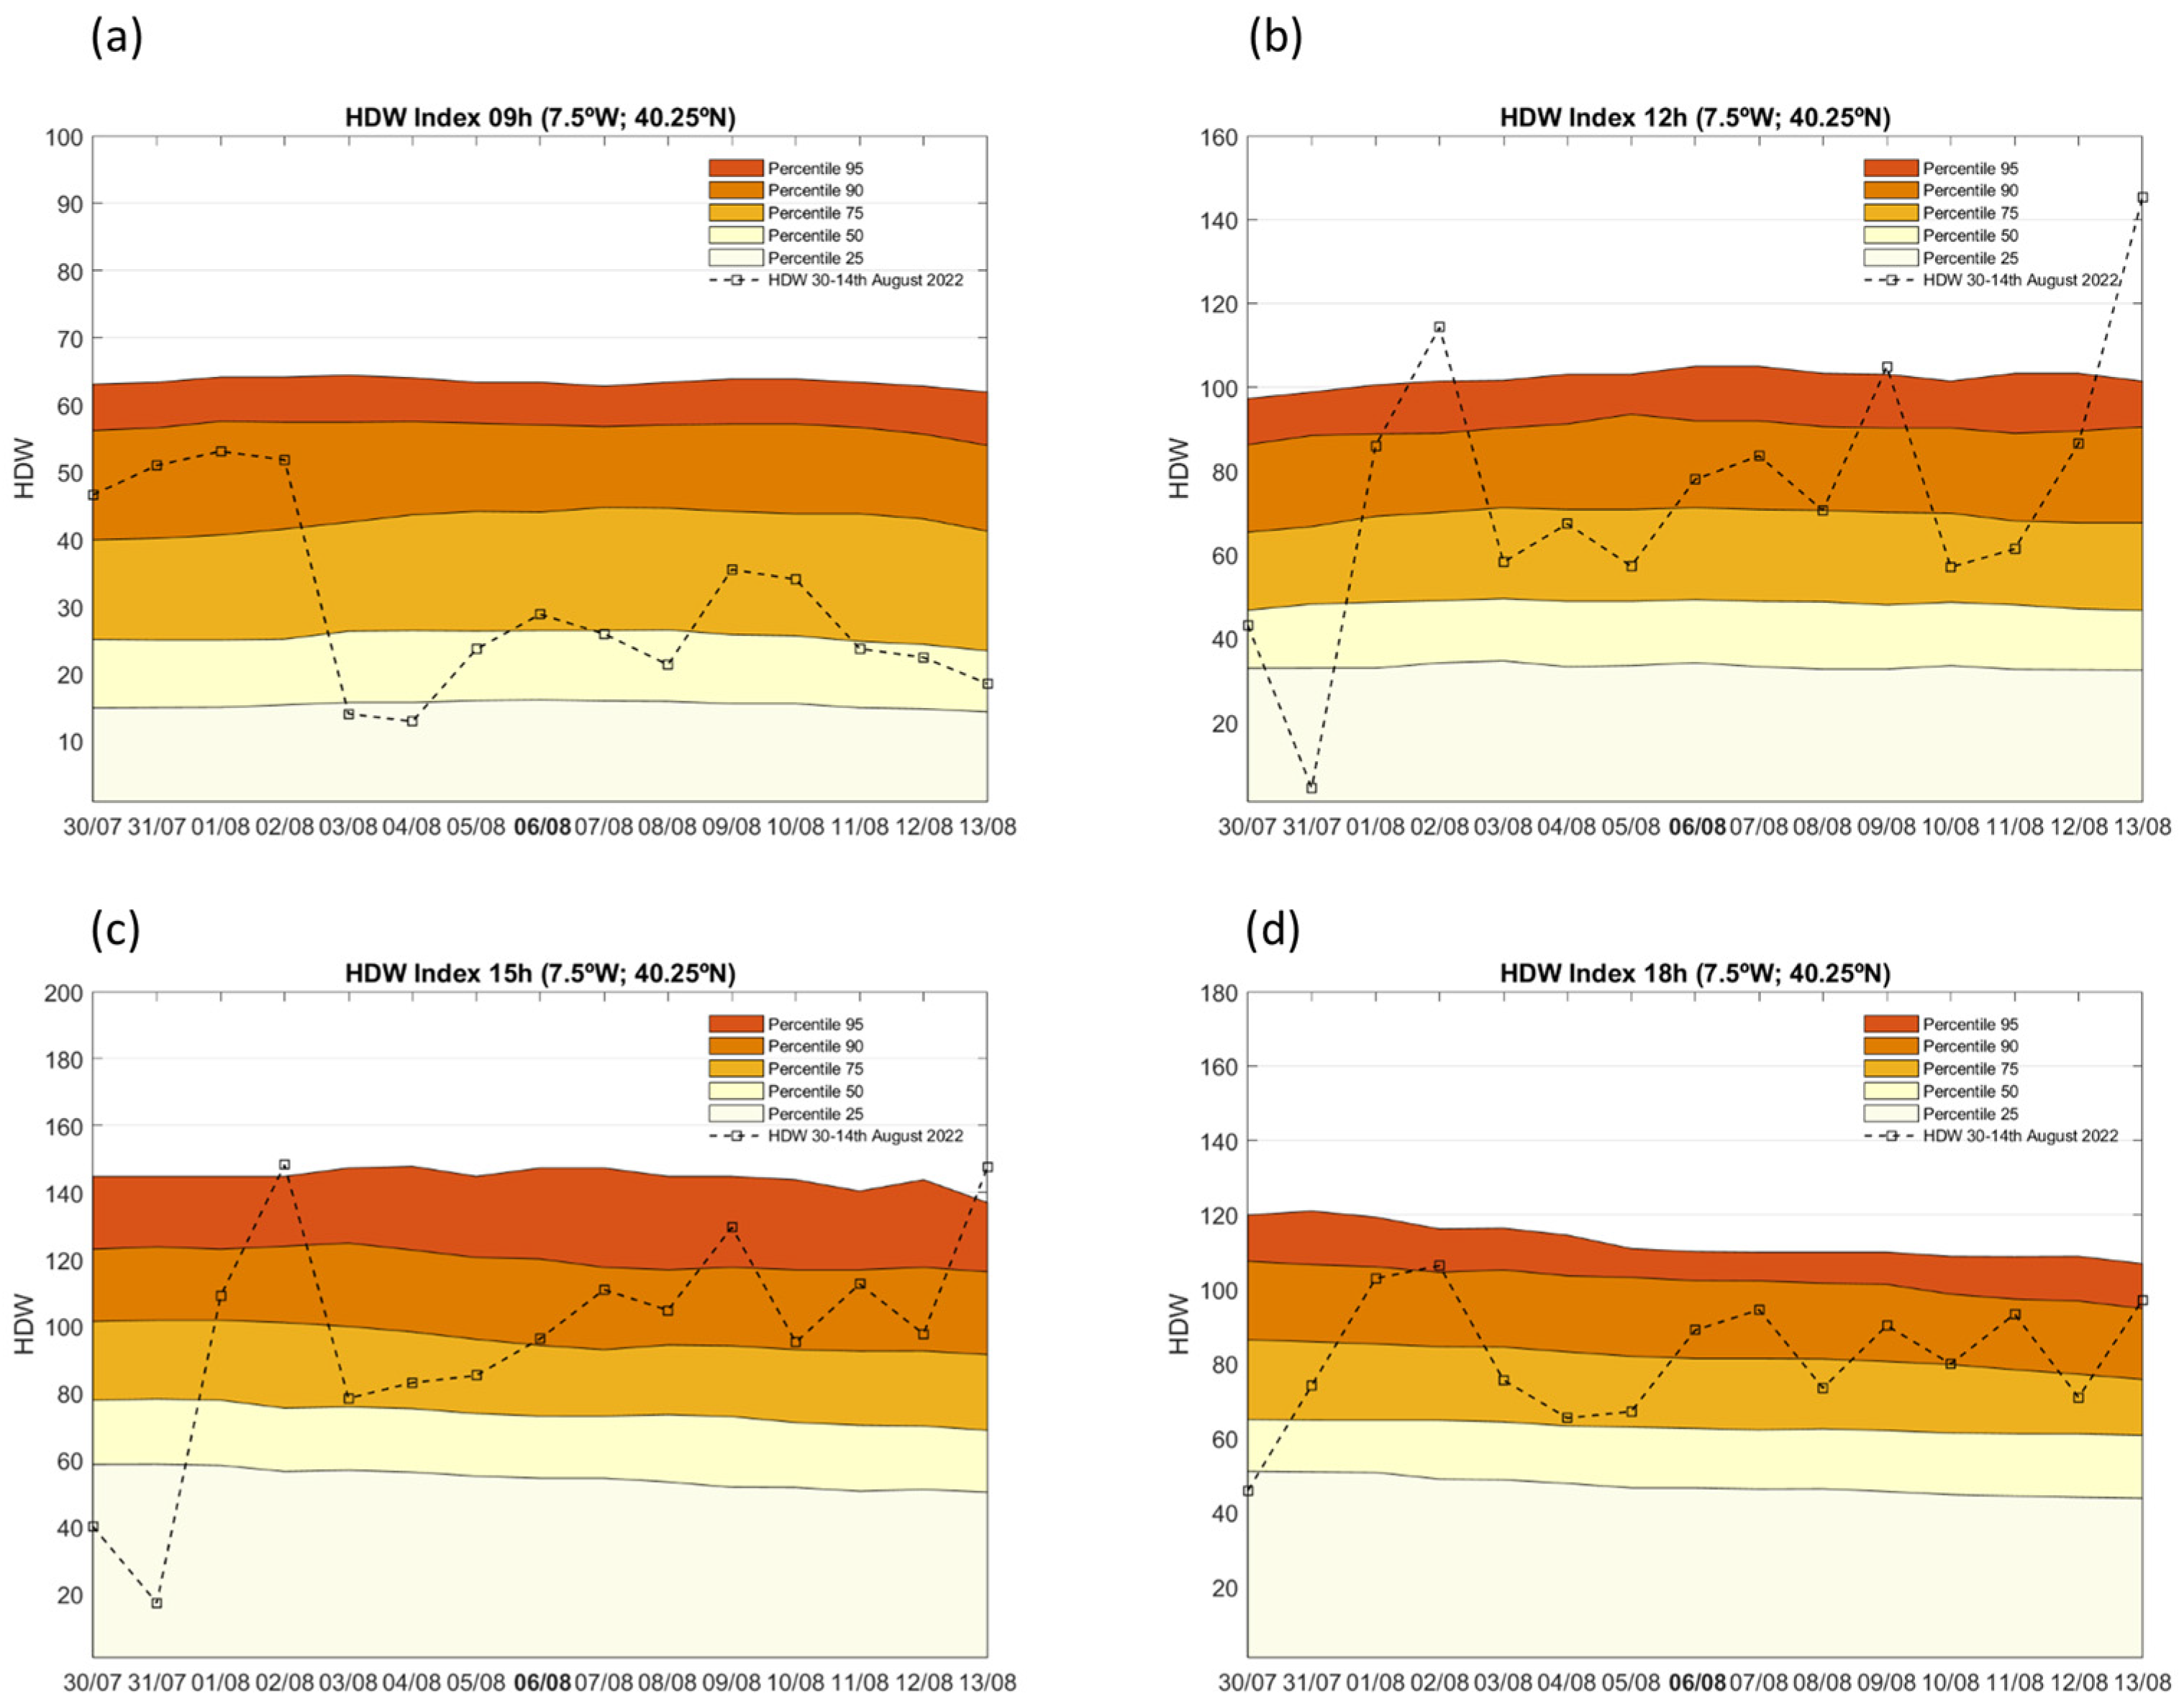
To explore this in finer temporal detail, Figure 8 presents a 15-day time series of HDW leading up to and following the fire. The spike in HDW on 17 June is evident, particularly at 15 UTC (panel c), where the index sharply exceeds the 95th percentile threshold. This highlights the rarity and intensity of the fire-weather setup on the ignition day and supports prior characterizations of the 2017 event as a compound meteorological extreme.
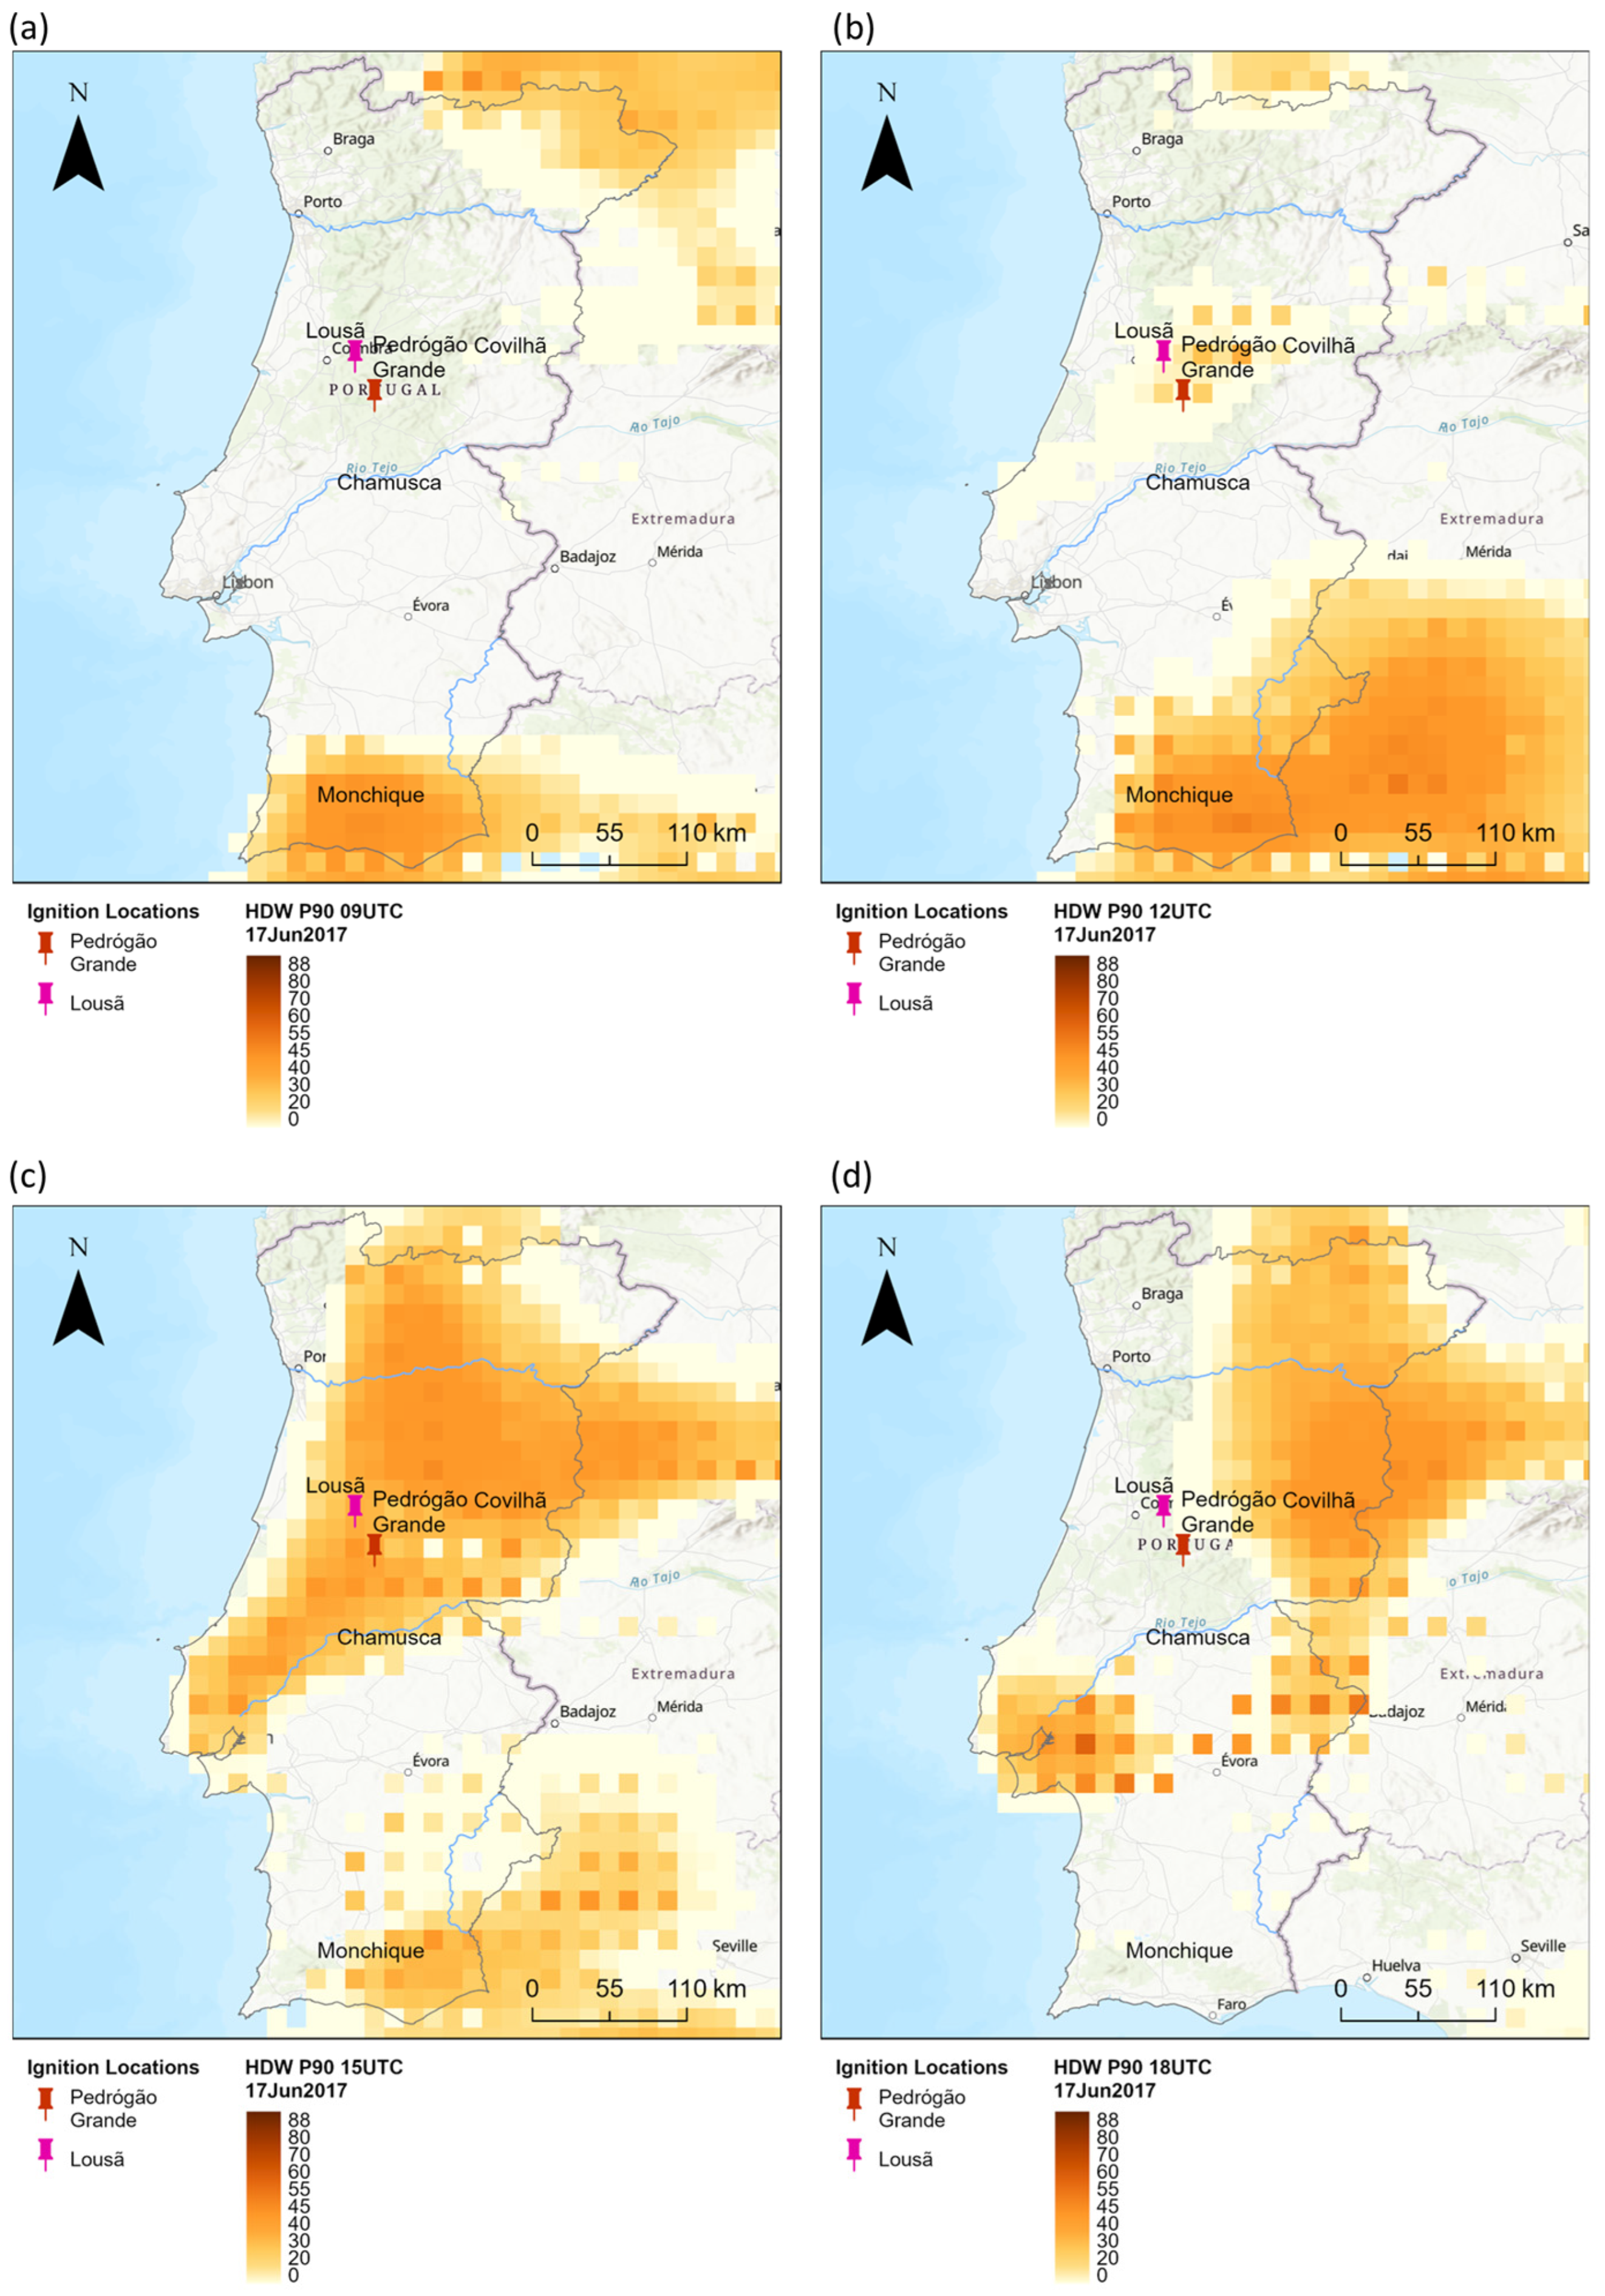
Complementing the temporal analysis, Figure 9 displays the spatial distribution of the probability of HDW exceeding the 90th percentile on 17 June 2017. At 09 UTC, elevated HDW anomalies are evident in the central interior, but by 12 UTC and 15 UTC, the region surrounding Pedrógão Grande is embedded within a large zone of elevated exceedance probability (>75%), encompassing Coimbra, Leiria, and northern Santarém districts. These widespread anomalies correspond with the synoptic-scale advection of hot, dry air from the southeast and coincide with a documented mesoscale convective system, which further exacerbated fire spread dynamics later in the day.
Taken together, these figures demonstrate that the HDW index effectively captured both the precursors and peak conditions associated with the Pedrógão Grande fire. The strong diurnal signal (Figure 7 and Figure 8) and coherent spatial footprint of exceedance probabilities (Figure 9) underscore HDW’s potential to inform both operational early-warning systems and retrospective ‘forensic’ analyses of extreme wildfire events.

3.3. The Lousã Fire (15 October 2017)

On 15 October 2017, a cluster of severe wildfires erupted across central Portugal, including the Lousã–Coimbra region, marking one of the most destructive autumnal fire episodes in Europe. These fires consumed hundreds of thousands of hectares in the Central region of Portugal—particularly in the Lousã complex (covering up to ~48,500 ha)—within mere hours, demonstrating extreme fire behaviour driven by unprecedented weather conditions [37,38].
A key driver was Hurricane “Ophelia,” which moved northeast of the Azores, generating a strong southerly to southwesterly flow over Iberia. This flow advected hot, dry air originating from northern Africa, resulting in abrupt and severe atmospheric drying. Afternoon wind speeds in central Portugal ranged from 30 to 40 km/h, with gusts up to 50–80 km/h, while surface relative humidity plunged below 20%, and temperatures exceeded 30 °C—strikingly high for mid-October in this region [39,40,41].
Satellite observations confirm that fire danger, measured via FWI, reached extraordinary levels. FWI values on 15 October exceeded 50 across much of the country—and peaked above 80 in Coimbra—indicating conditions where fires could not be contained through conventional ground or air suppression [37,40].
The fires exhibited rapid initial spread, with estimated hourly rates of spread (RoS) between 5 and 9 km/h, and average spread rates of about 10,000 ha/hour between 16:00 on 15 October and 04:00 on 16 October [37,40]. The combination of strong synoptic winds, critically low fine fuel moisture (<6%), and abundant pyrogenic heat facilitated multiple crown fires, extensive spotting, and the formation of pyro-convective plumes, which further destabilized fire spread [37,40,42].
This conflation of extreme drought (following a record dry September—the driest in 87 years), hurricane-induced wind, high temperatures, and accelerated fire behaviour constituted a compound and unprecedented wildfire event. The Lousã fires reflect a synoptic pattern increasingly likely under climate change: autumnal storms with tropical cyclone origin driving anomalous wildfire conditions well outside the traditional fire season [39].
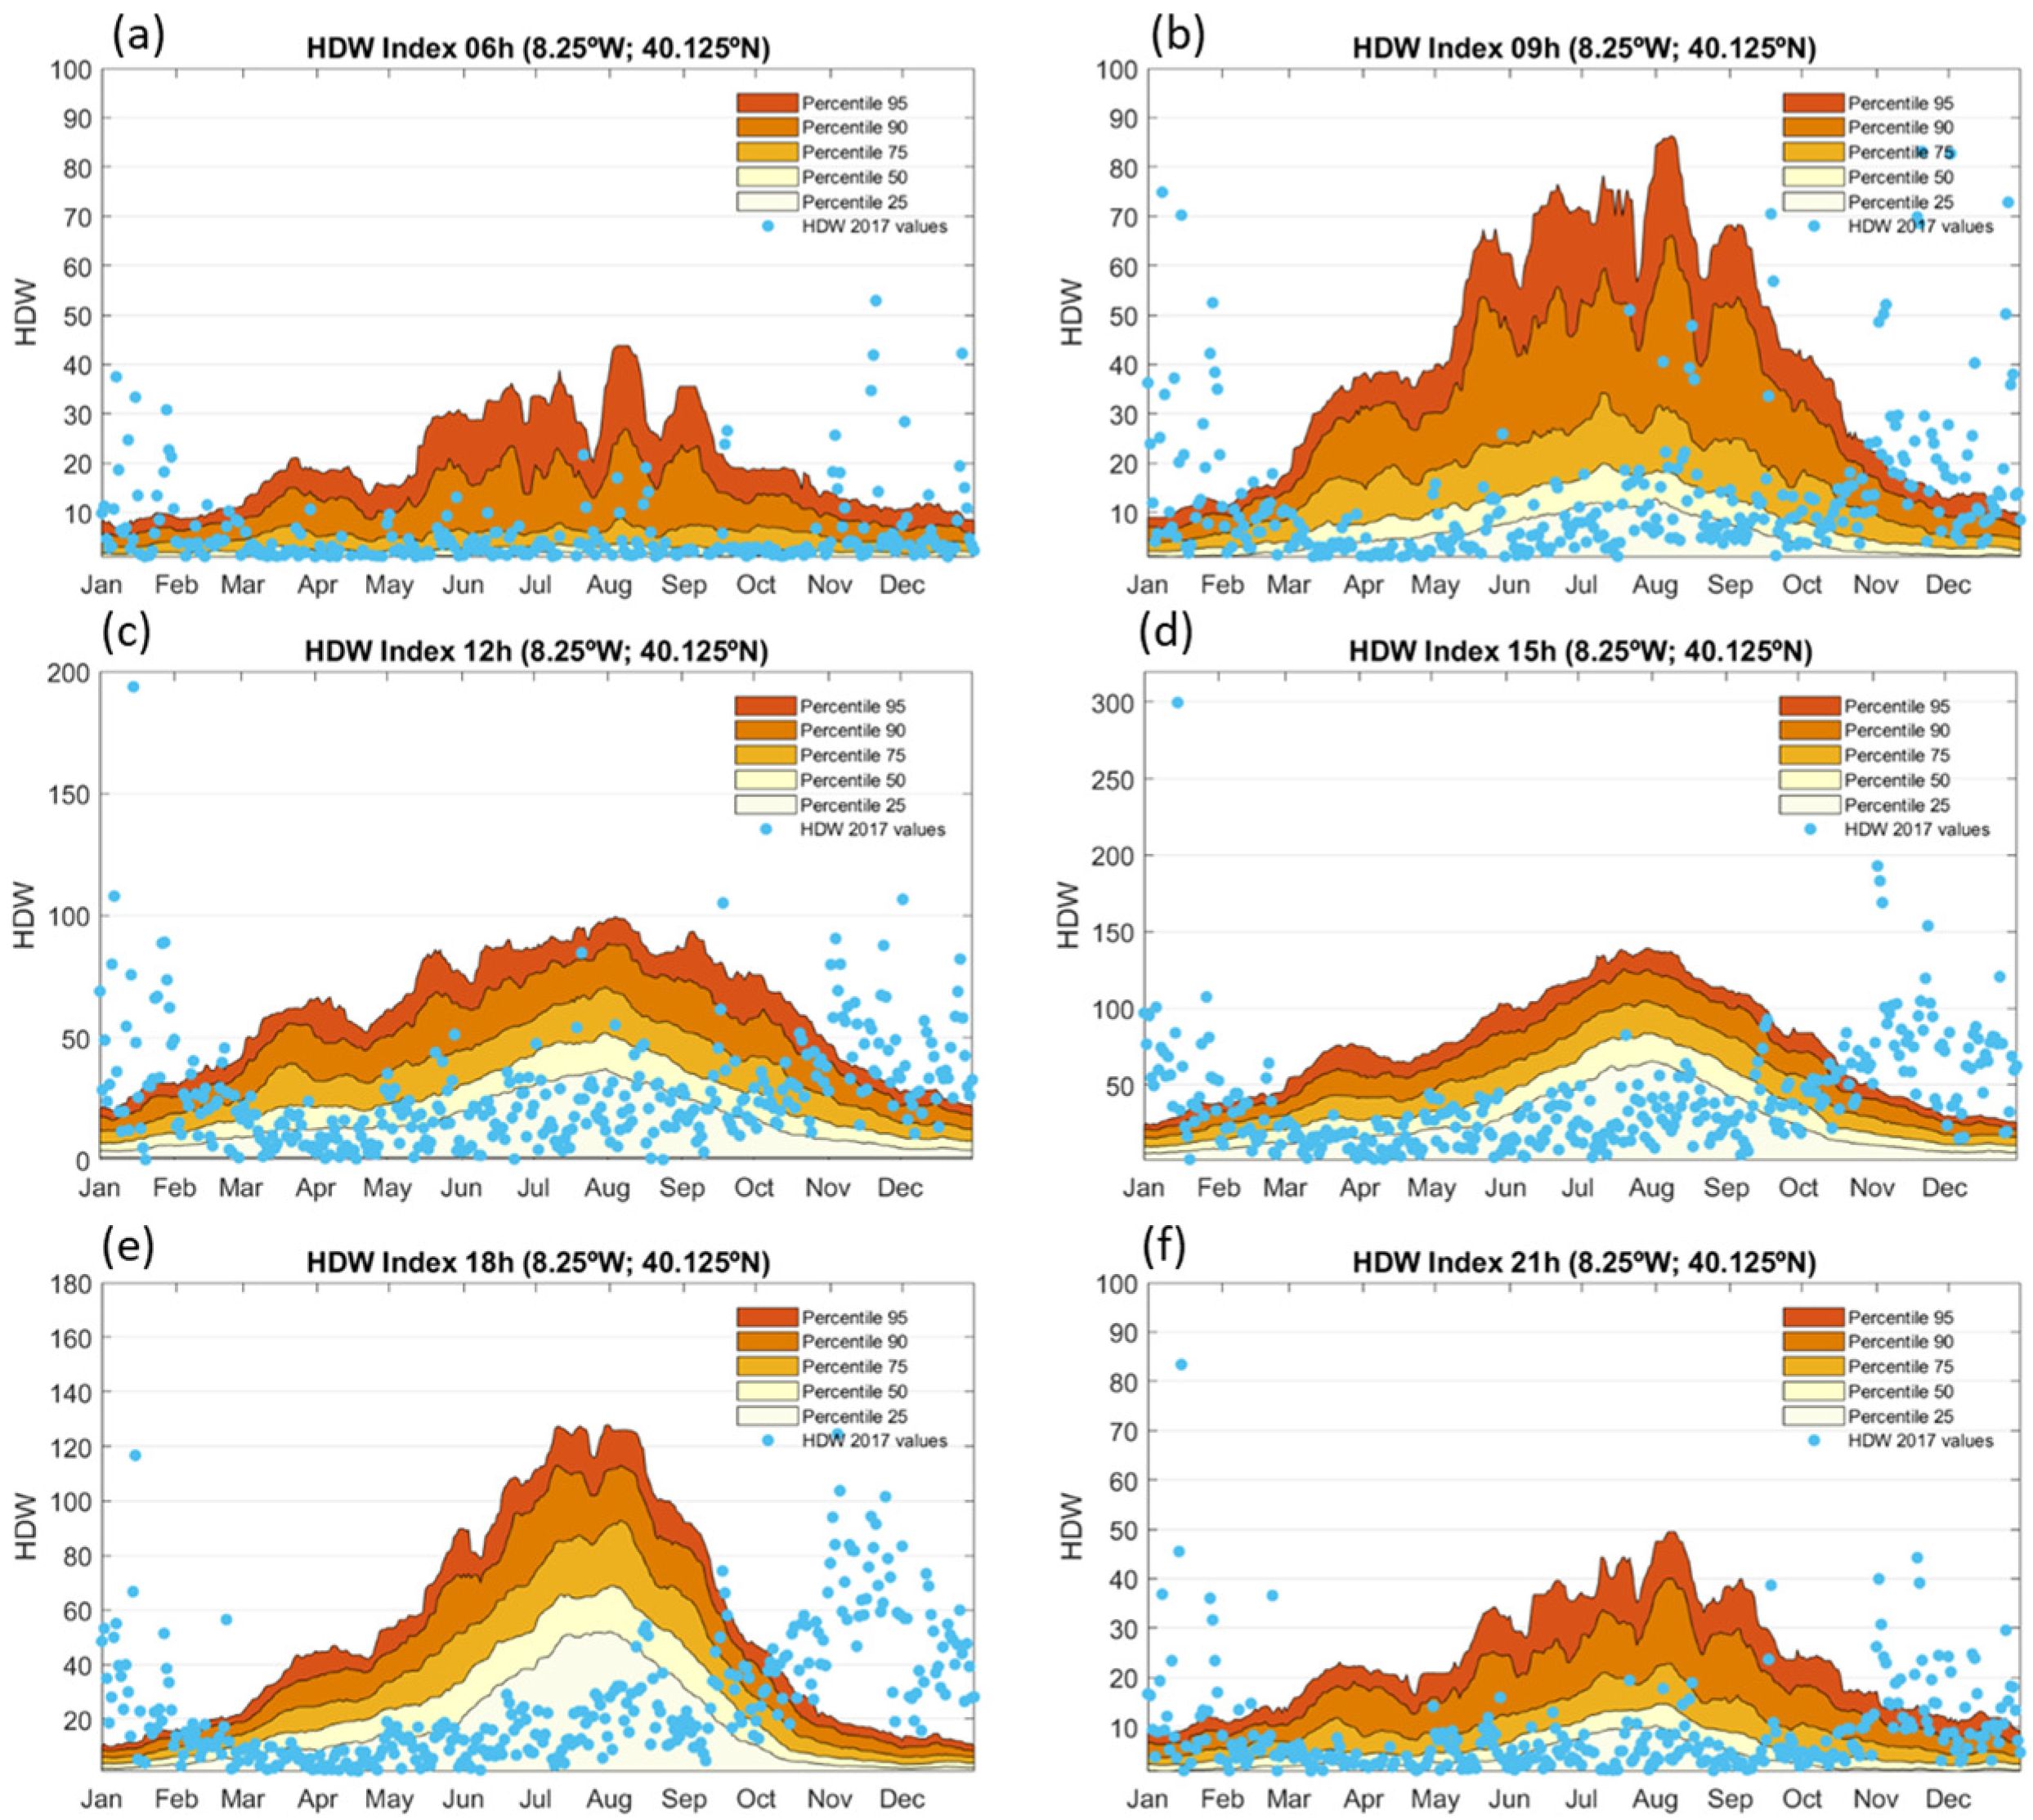
The Lousã fire, which ignited on 15 October 2017, occurred under an exceptional fire-weather regime. Figure 10 displays the HDW index values at the ignition location (8.25° W, 40.125° N) throughout 2017 across six synoptic hours, contrasted with the 1991–2020 climatology. On the ignition day, HDW values markedly exceeded the 95th percentile threshold from 12 UTC to 18 UTC, particularly at 15 UTC, where HDW reached one of the highest values in the annual record.
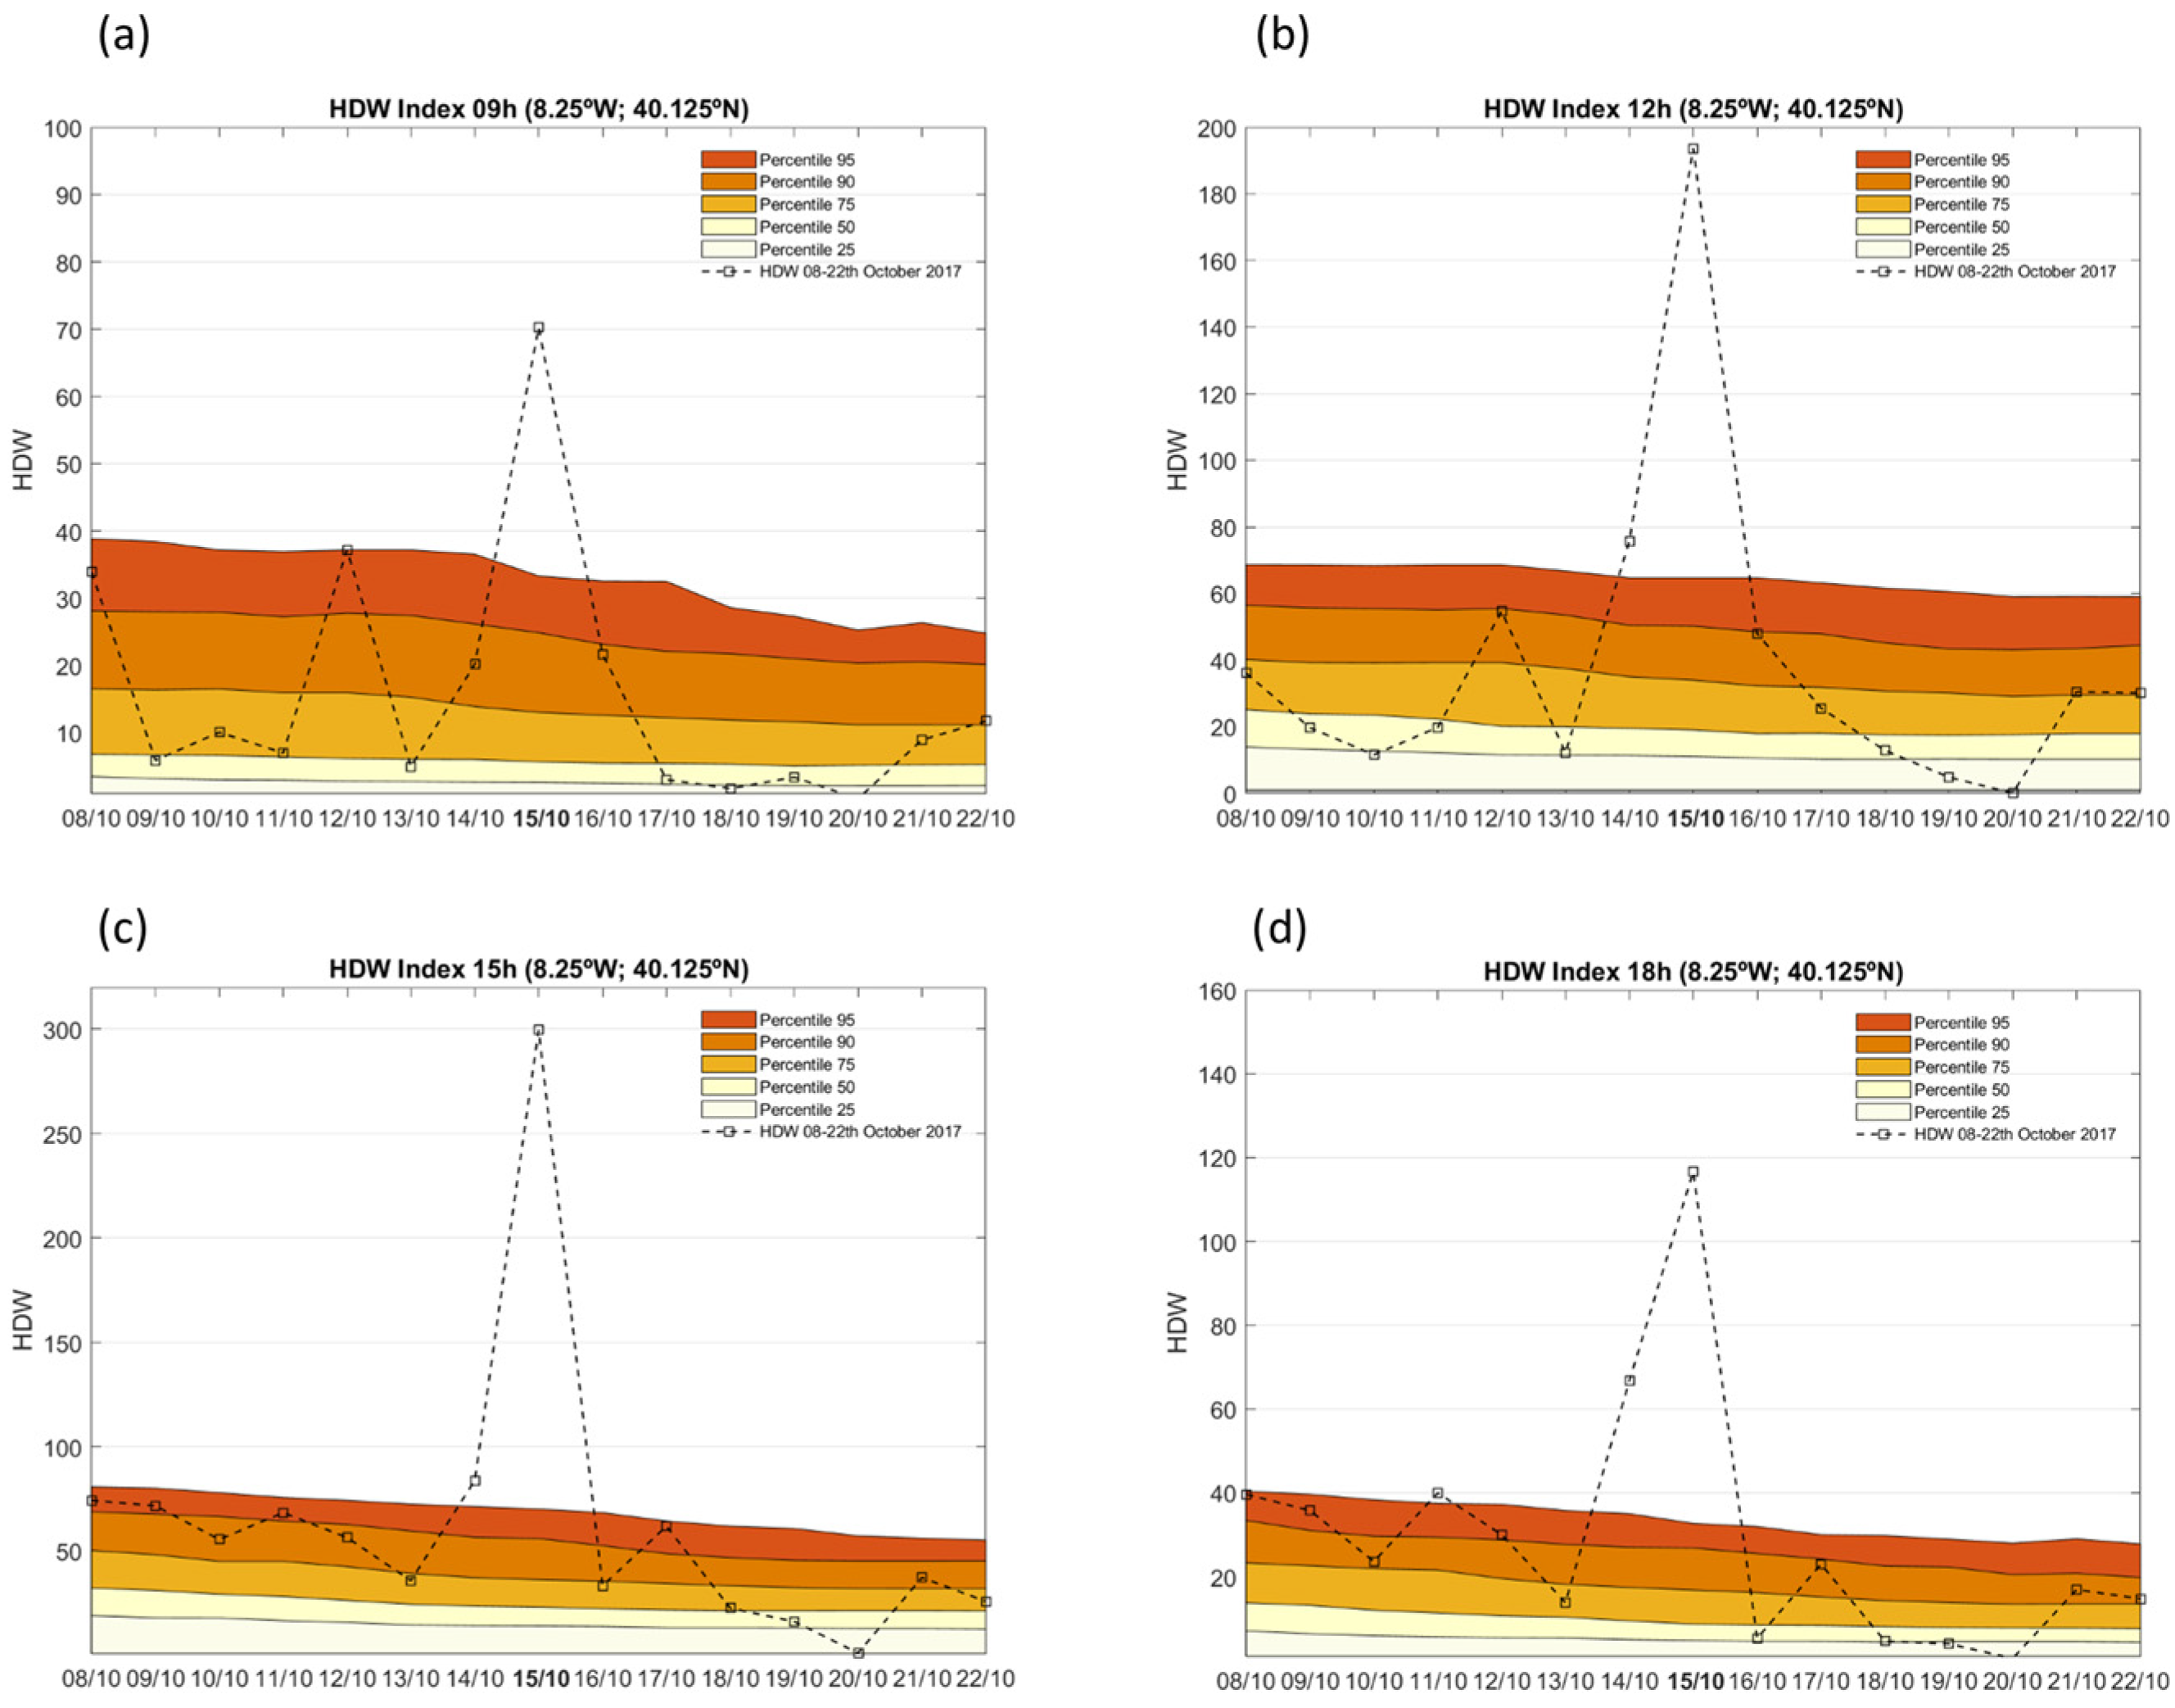
A closer view of HDW evolution around this date is shown in Figure 11, which presents a 15-day temporal window. The HDW spike on 15 October is distinct at all examined hours, with the 15 UTC value peaking dramatically to nearly 300 units, far surpassing the climatological maximum. The days prior showed only modest HDW levels, indicating a sudden and extreme synoptic transition that sharply increased fire potential.
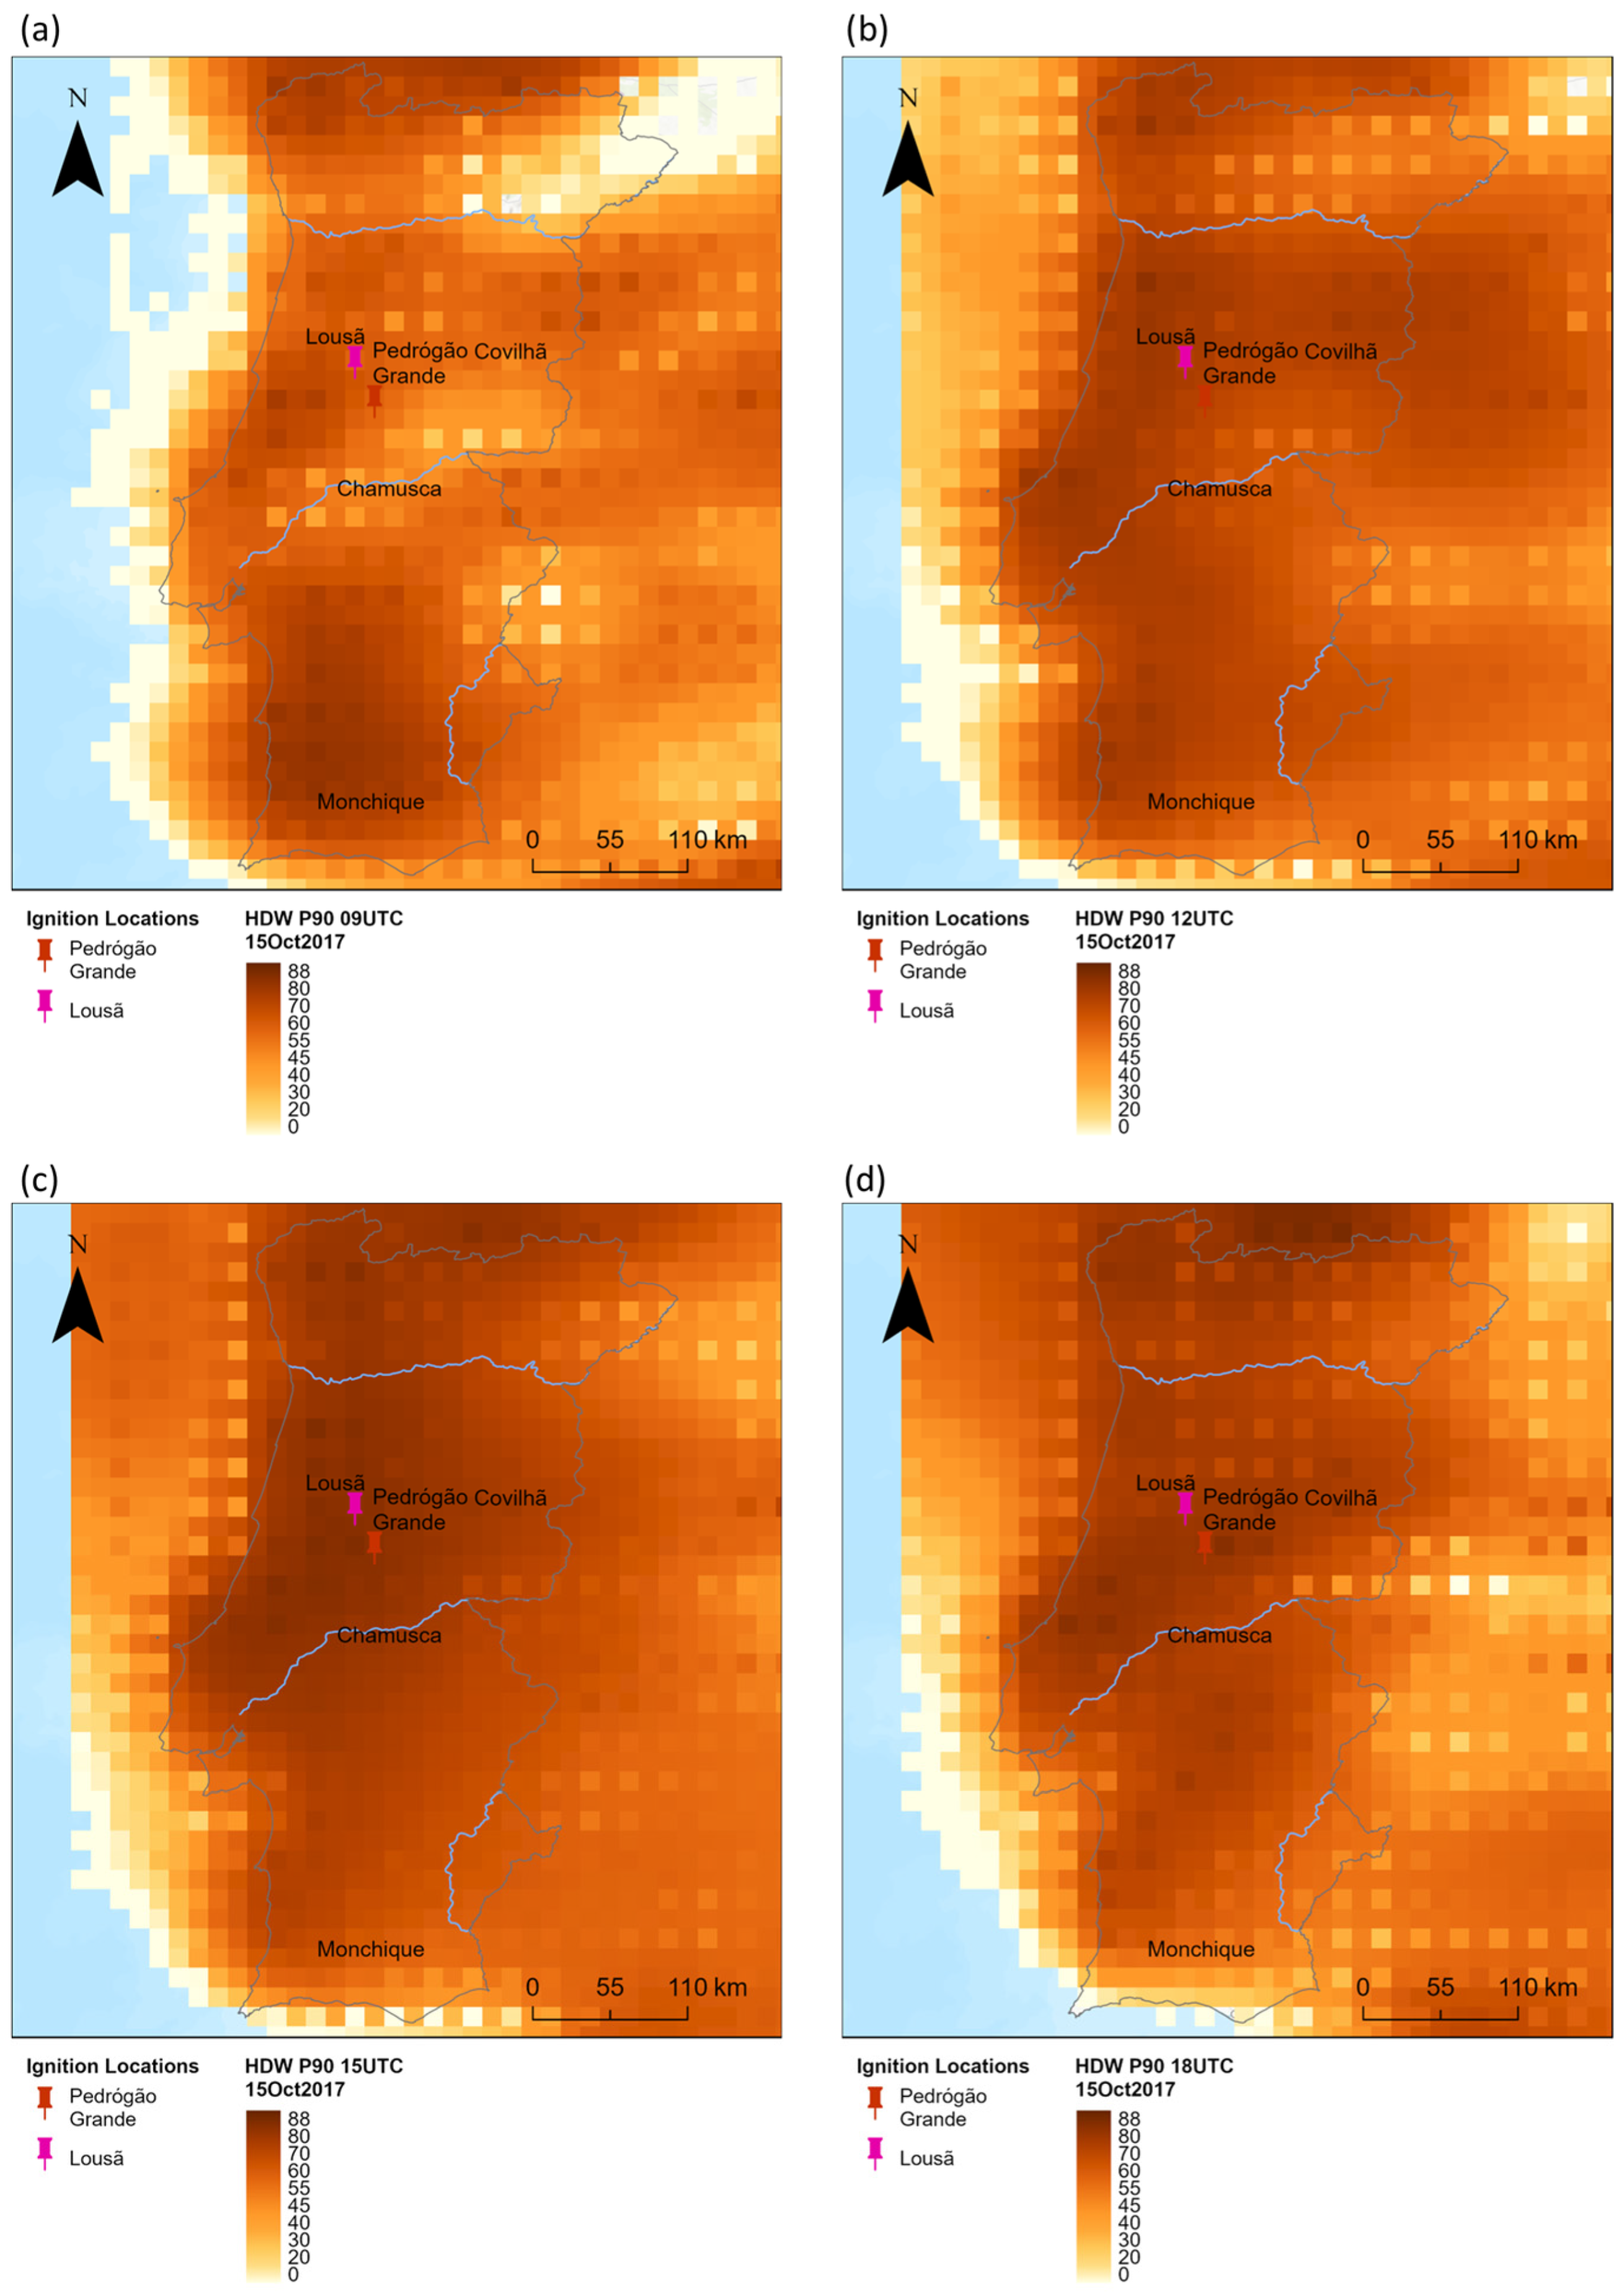
Spatially, Figure 12 maps the probability of HDW exceeding the 90th percentile on 15 October across four synoptic hours. A remarkable finding is the synoptic-scale spatial coherence of this HDW exceedance: nearly the entire western and central Iberian Peninsula shows widespread values exceeding 70%–80% probability, peaking over the Centro region and precisely over the Lousã and Pedrógão zones. This large-scale anomaly is consistent with the passage of Hurricane Ophelia, which brought dry continental air, strong southerly winds, and record-breaking heat across western Iberia.
These results confirm that the Lousã fire occurred under an extreme and highly unusual synoptic setup, captured robustly by the HDW index in both its magnitude and spatial extent. The extreme HDW values—tied to tropical–extratropical interactions—highlight the relevance of transitional-season meteorological phenomena in driving fire risk and underscore the utility of HDW for identifying rapid-onset, high-impact fire-weather windows outside the traditional summer peak.

3.4. The Monchique Fire (3 August 2018)

The Monchique wildfire, ignited on 3 August 2018, was one of the most devastating events in Portugal that year, consuming approximately 27,000 hectares and persisting for seven days. It occurred under exceptionally severe meteorological conditions marked by a prolonged heatwave and intense drought [43,44,45,46].
At the synoptic scale, between 1 and 3 August, anomalously hot and dry air masses were advected from the Sahara into southern Portugal. ERA5-derived anomaly fields revealed significant positive temperature deviations at both 850 hPa and 500 hPa levels (T850, T500), coupled with negative relative humidity anomalies at 850 hPa (RH850), indicating extreme fire-weather conditions and widespread atmospheric drying [44]. These thermodynamic anomalies corresponded with enhanced geopotential heights at 500 hPa and 850 hPa, signalling a strong ridge aloft that suppressed convection and promoted persistent surface heating [44].
Surface data from Algarve weather stations (e.g., Fóia, Faro) confirmed the severity of conditions: air temperatures soared above 40 °C, relative humidity plummeted below 15%–20%, and gusty winds persisted across the mountainous terrain [44,46]. Complex topography further exacerbated wind-driven fire spread through funnelling and dynamic channelling, as indicated by high-resolution analyses using the Meso-NH model. These mechanisms created localized strong wind flow, sustaining rapid head-fire advancement [44,46].
The convergence of extreme heat, critically low humidity, drought-preconditioned fuels (eucalyptus-dominated forests with high continuity), and wind-driven propagation culminated in a wildfire that was exceptionally difficult to control [44,46]. The event highlights the compounding effects of synoptic-scale climate anomalies, mesoscale topographical influences, and fuel vulnerability—demonstrating how such convergences create conditions conducive to prolonged and high-intensity wildfire outbreaks.
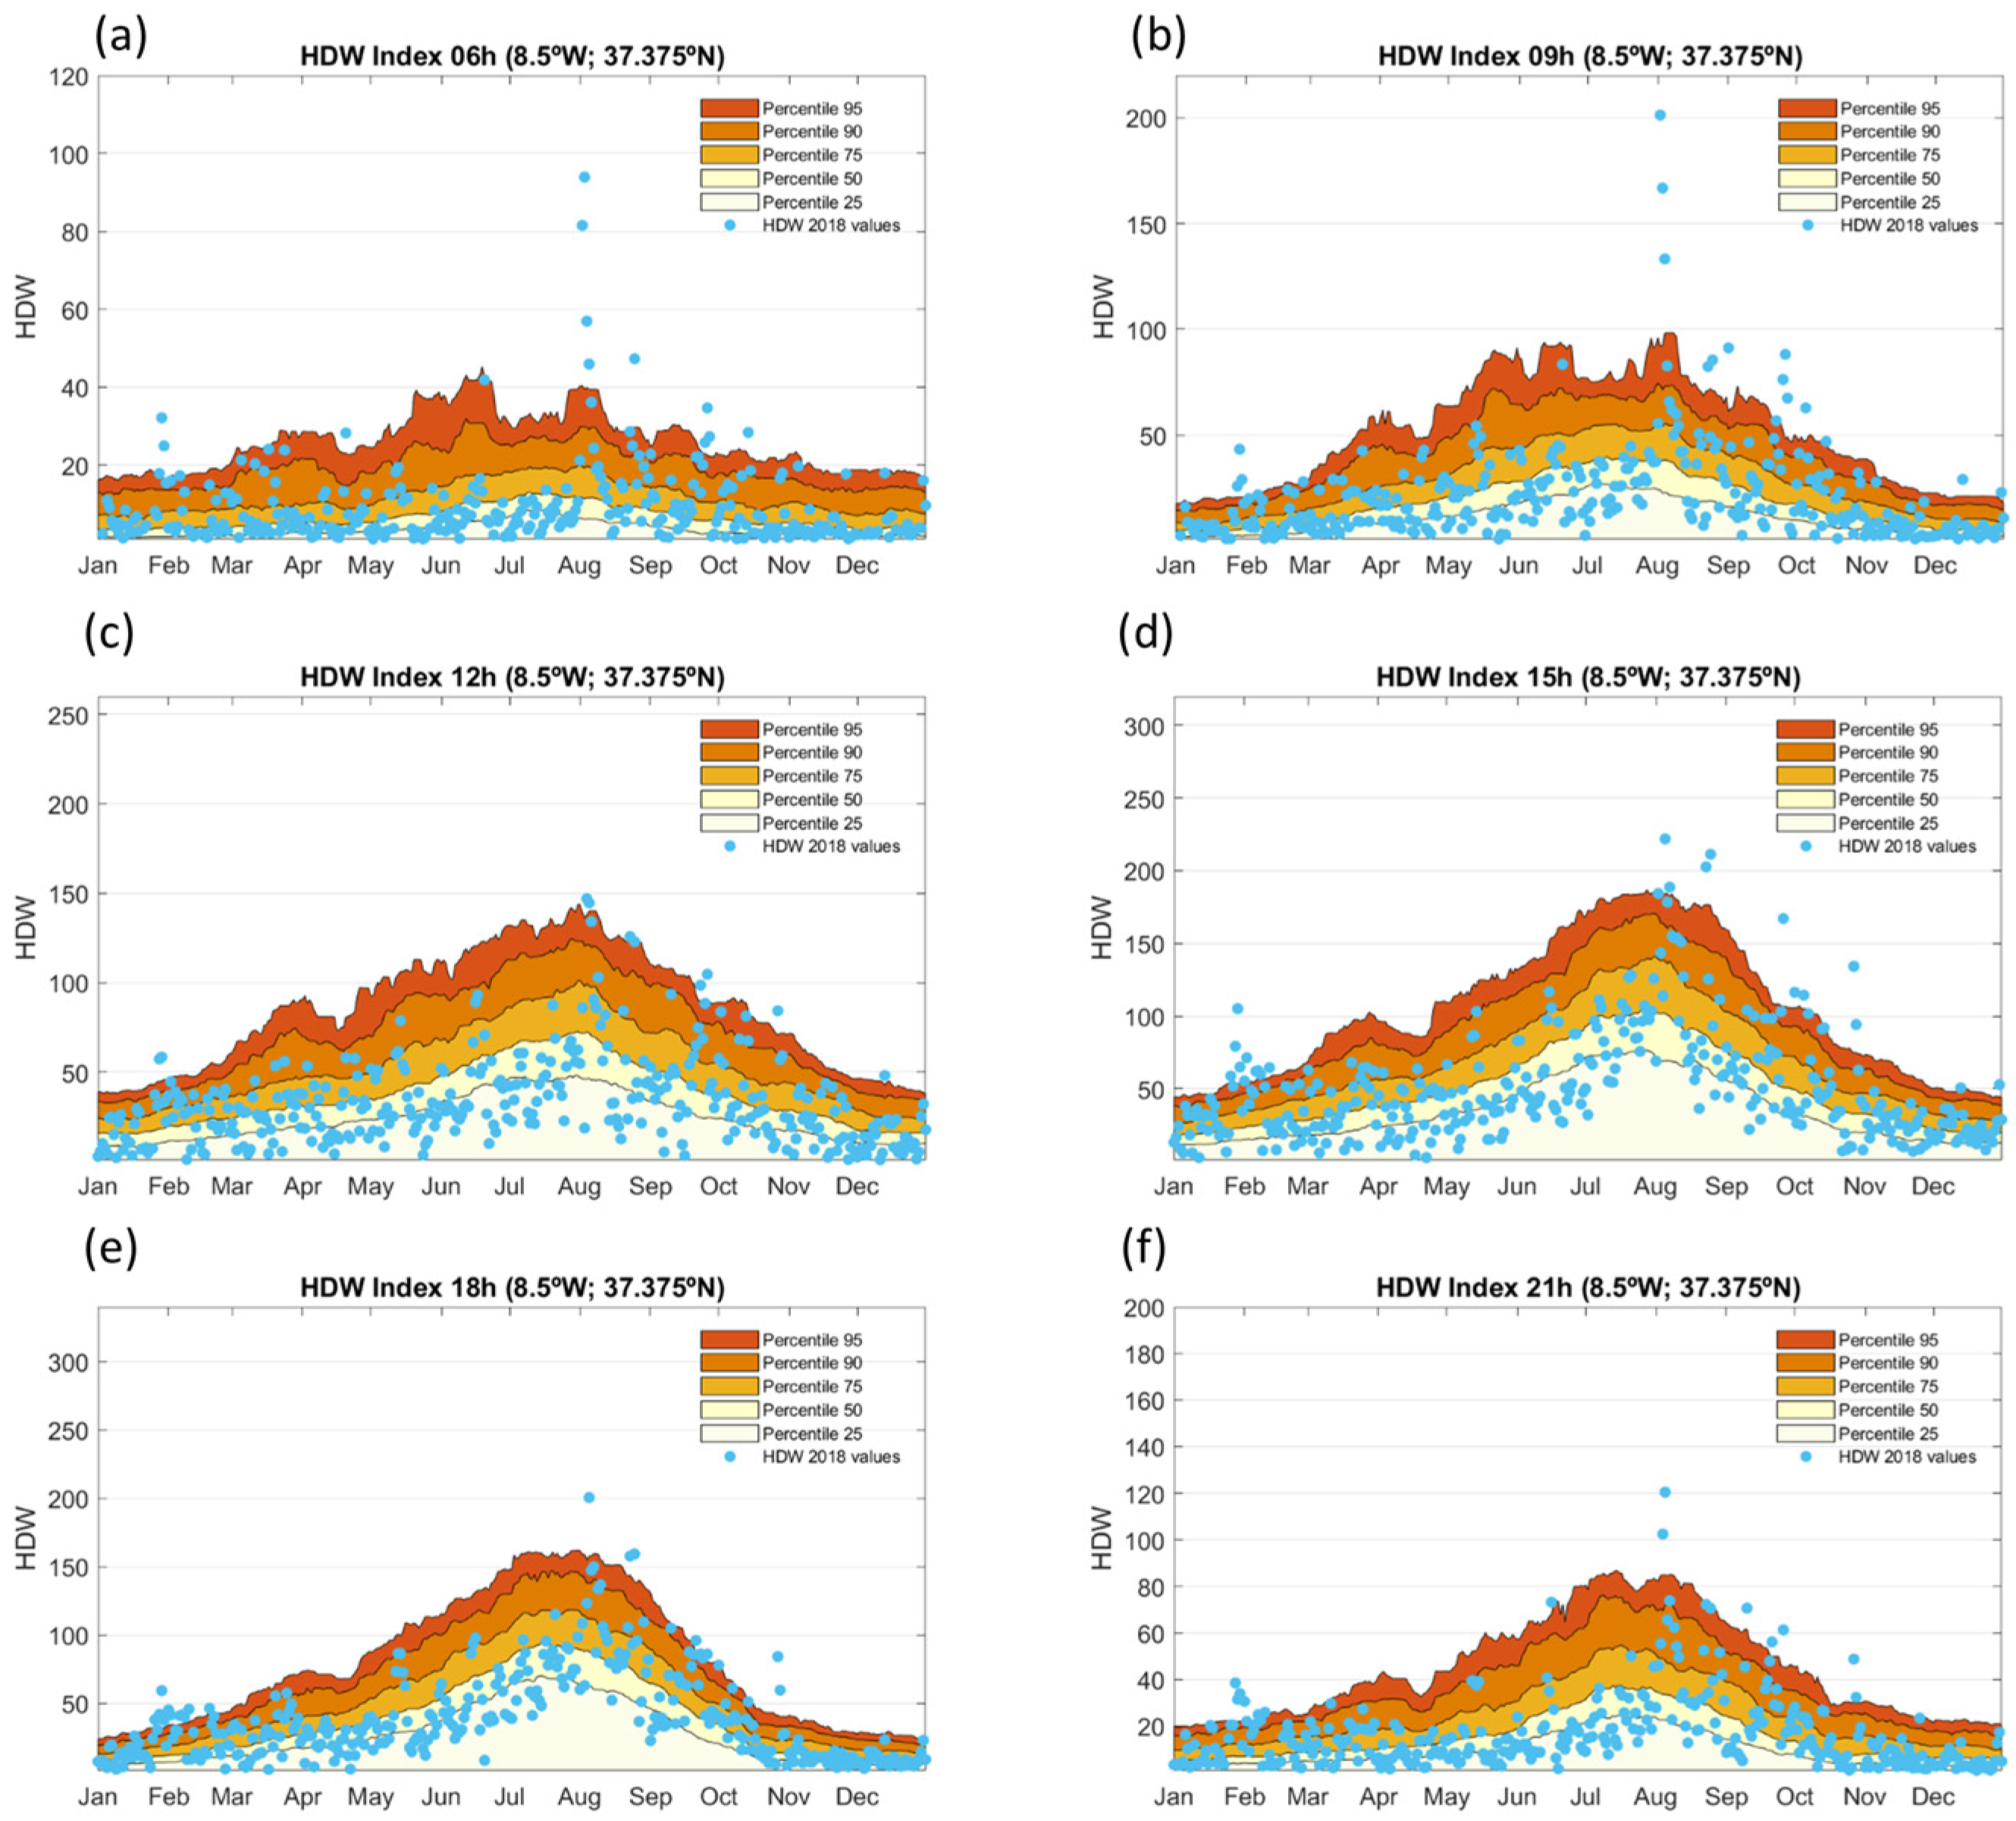
The Monchique fire, ignited on 3 August 2018, developed under a pronounced and sustained fire-weather anomaly captured well by the HDW index. Figure 13 shows the HDW values throughout 2018 (blue dots) at the ignition site (8.5° W, 37.375° N), along with the historical percentile distribution (1991–2020). Between 12 UTC and 18 UTC, the HDW values on the ignition day fluctuated, notably peaking around 18 UTC, far exceeding the 95th percentile, coinciding with the early explosive growth phase of the fire.
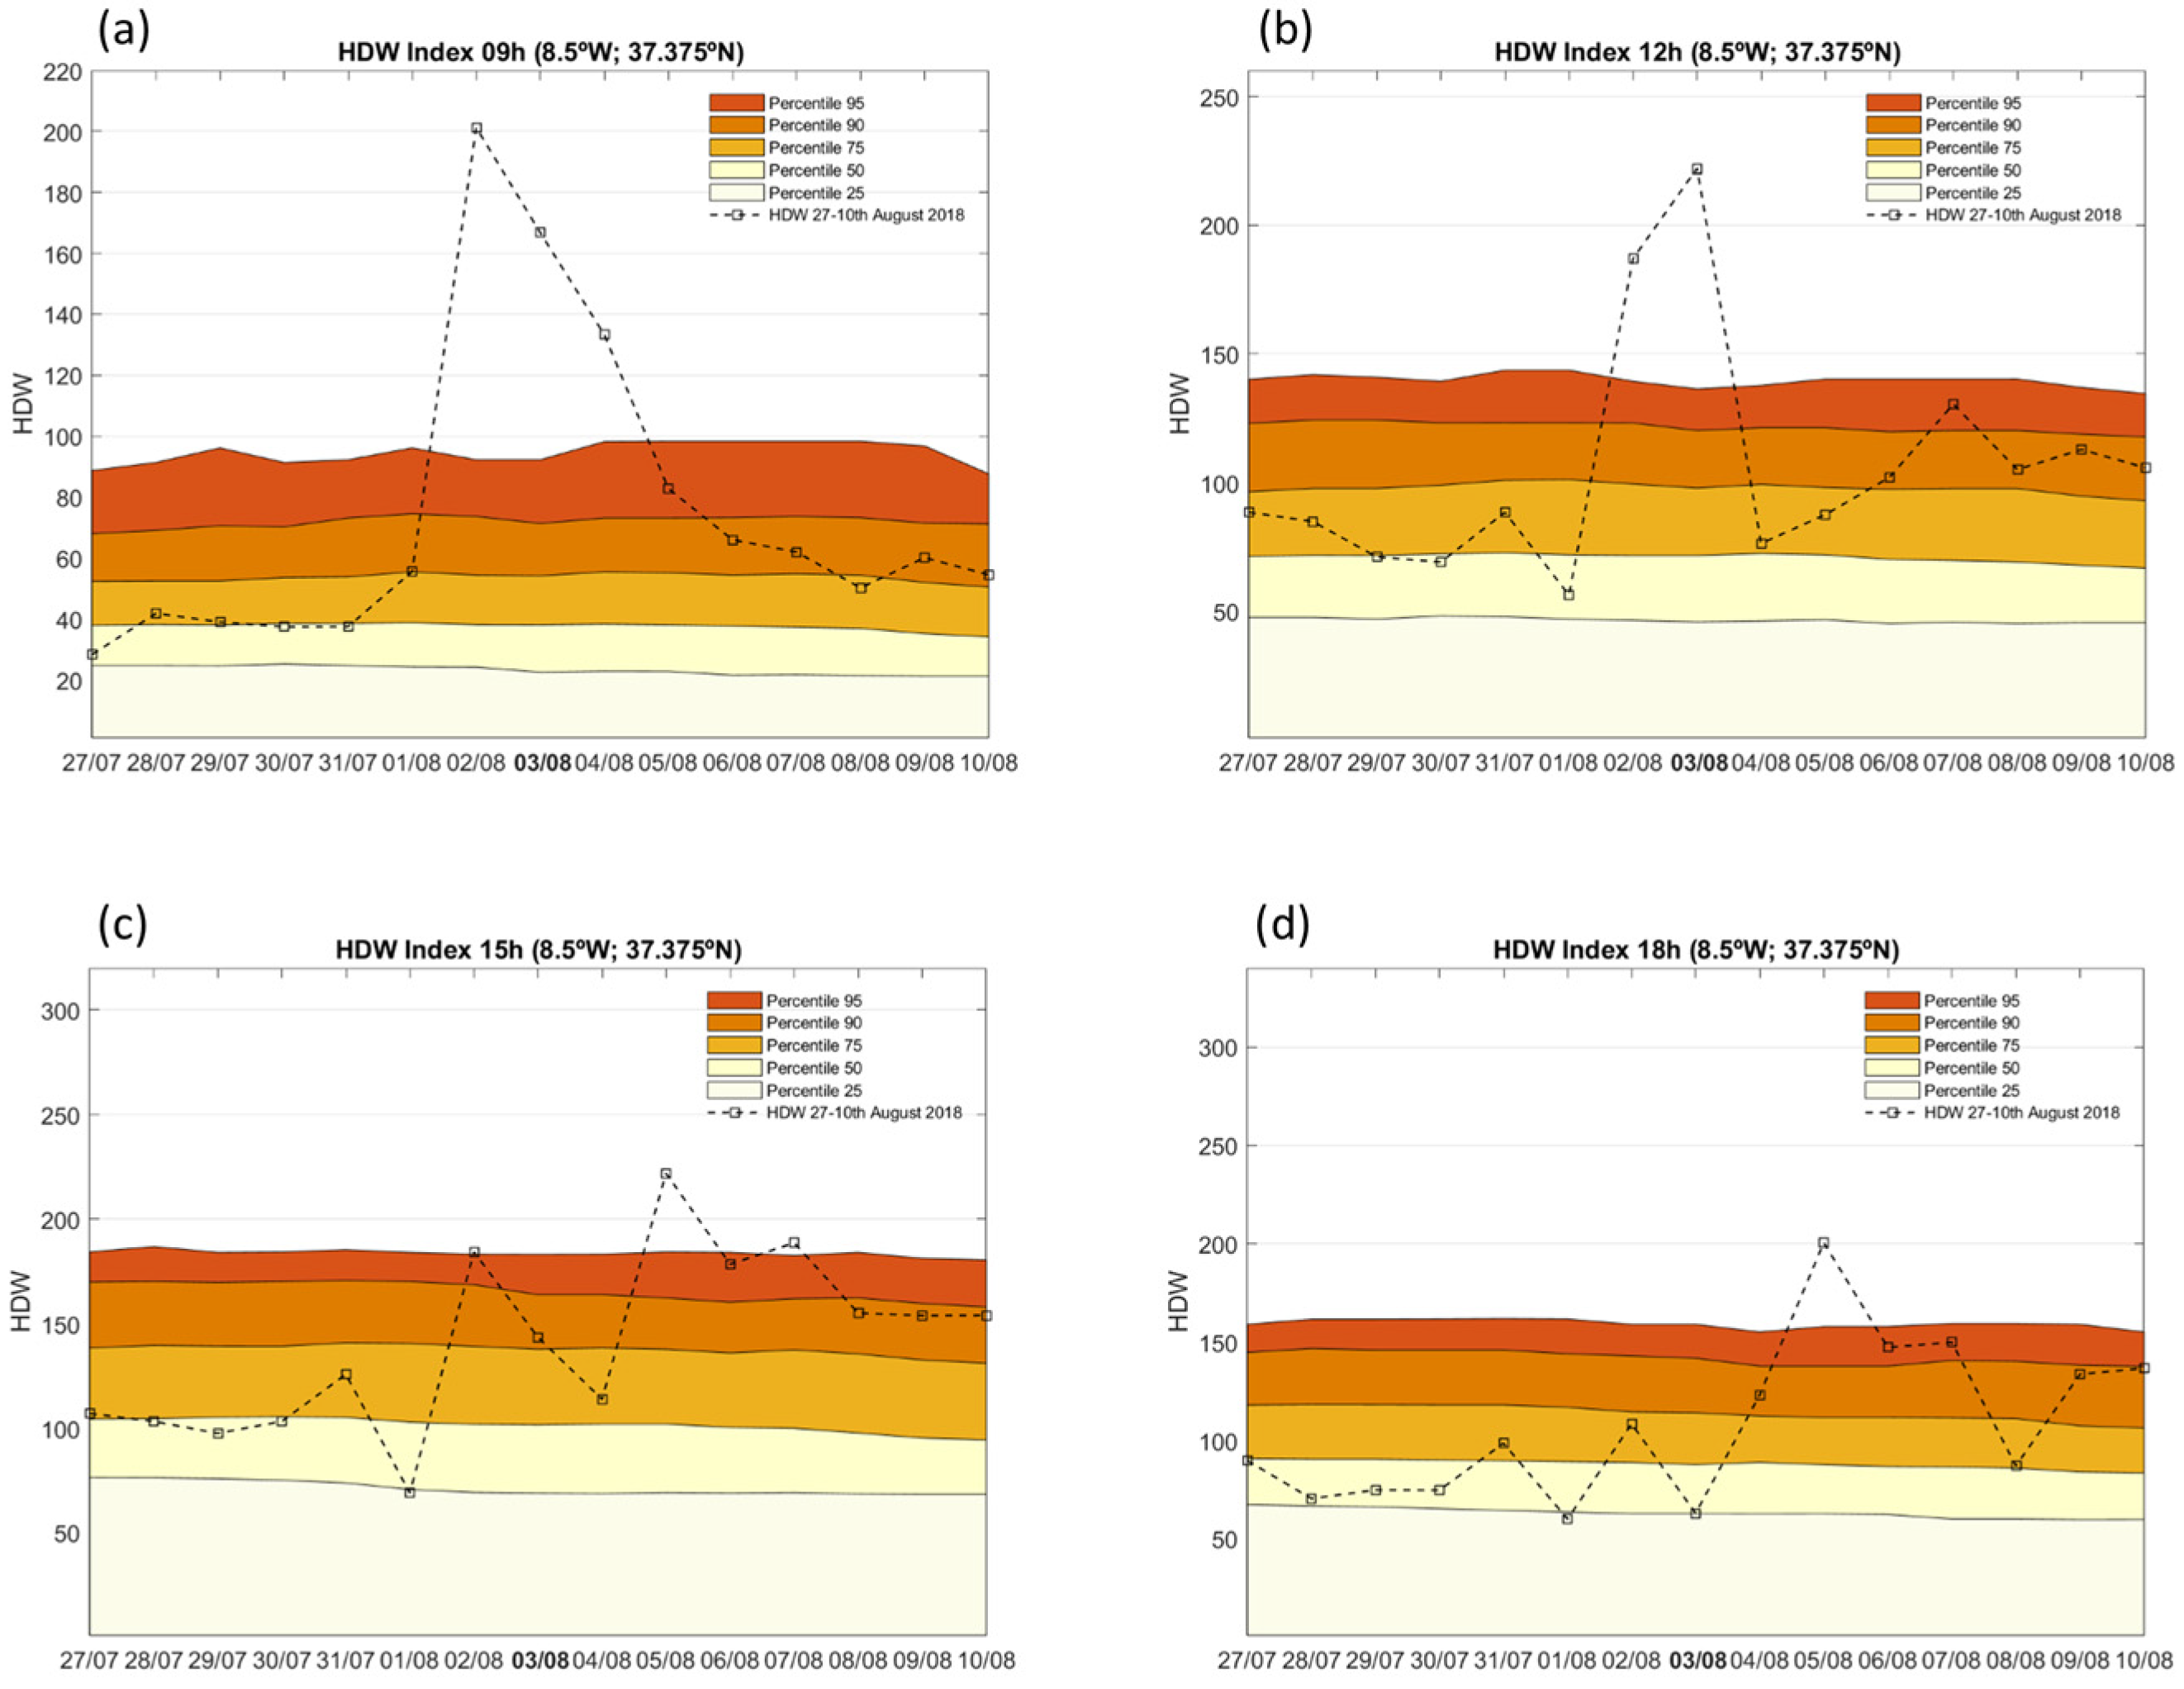
In Figure 14, the 15-day period centred around 03 August confirms the singularity of this peak. The HDW index on the three days after the ignition date stands out as the highest across the entire period at all hours analyzed. Notably, the HDW value at 18 UTC reaches nearly 300 units on 4 August, far above any value in the surrounding days, indicating an abrupt spike in fire-conducive meteorological conditions and strongly reinforcing the event’s classification as an extreme wildfire.
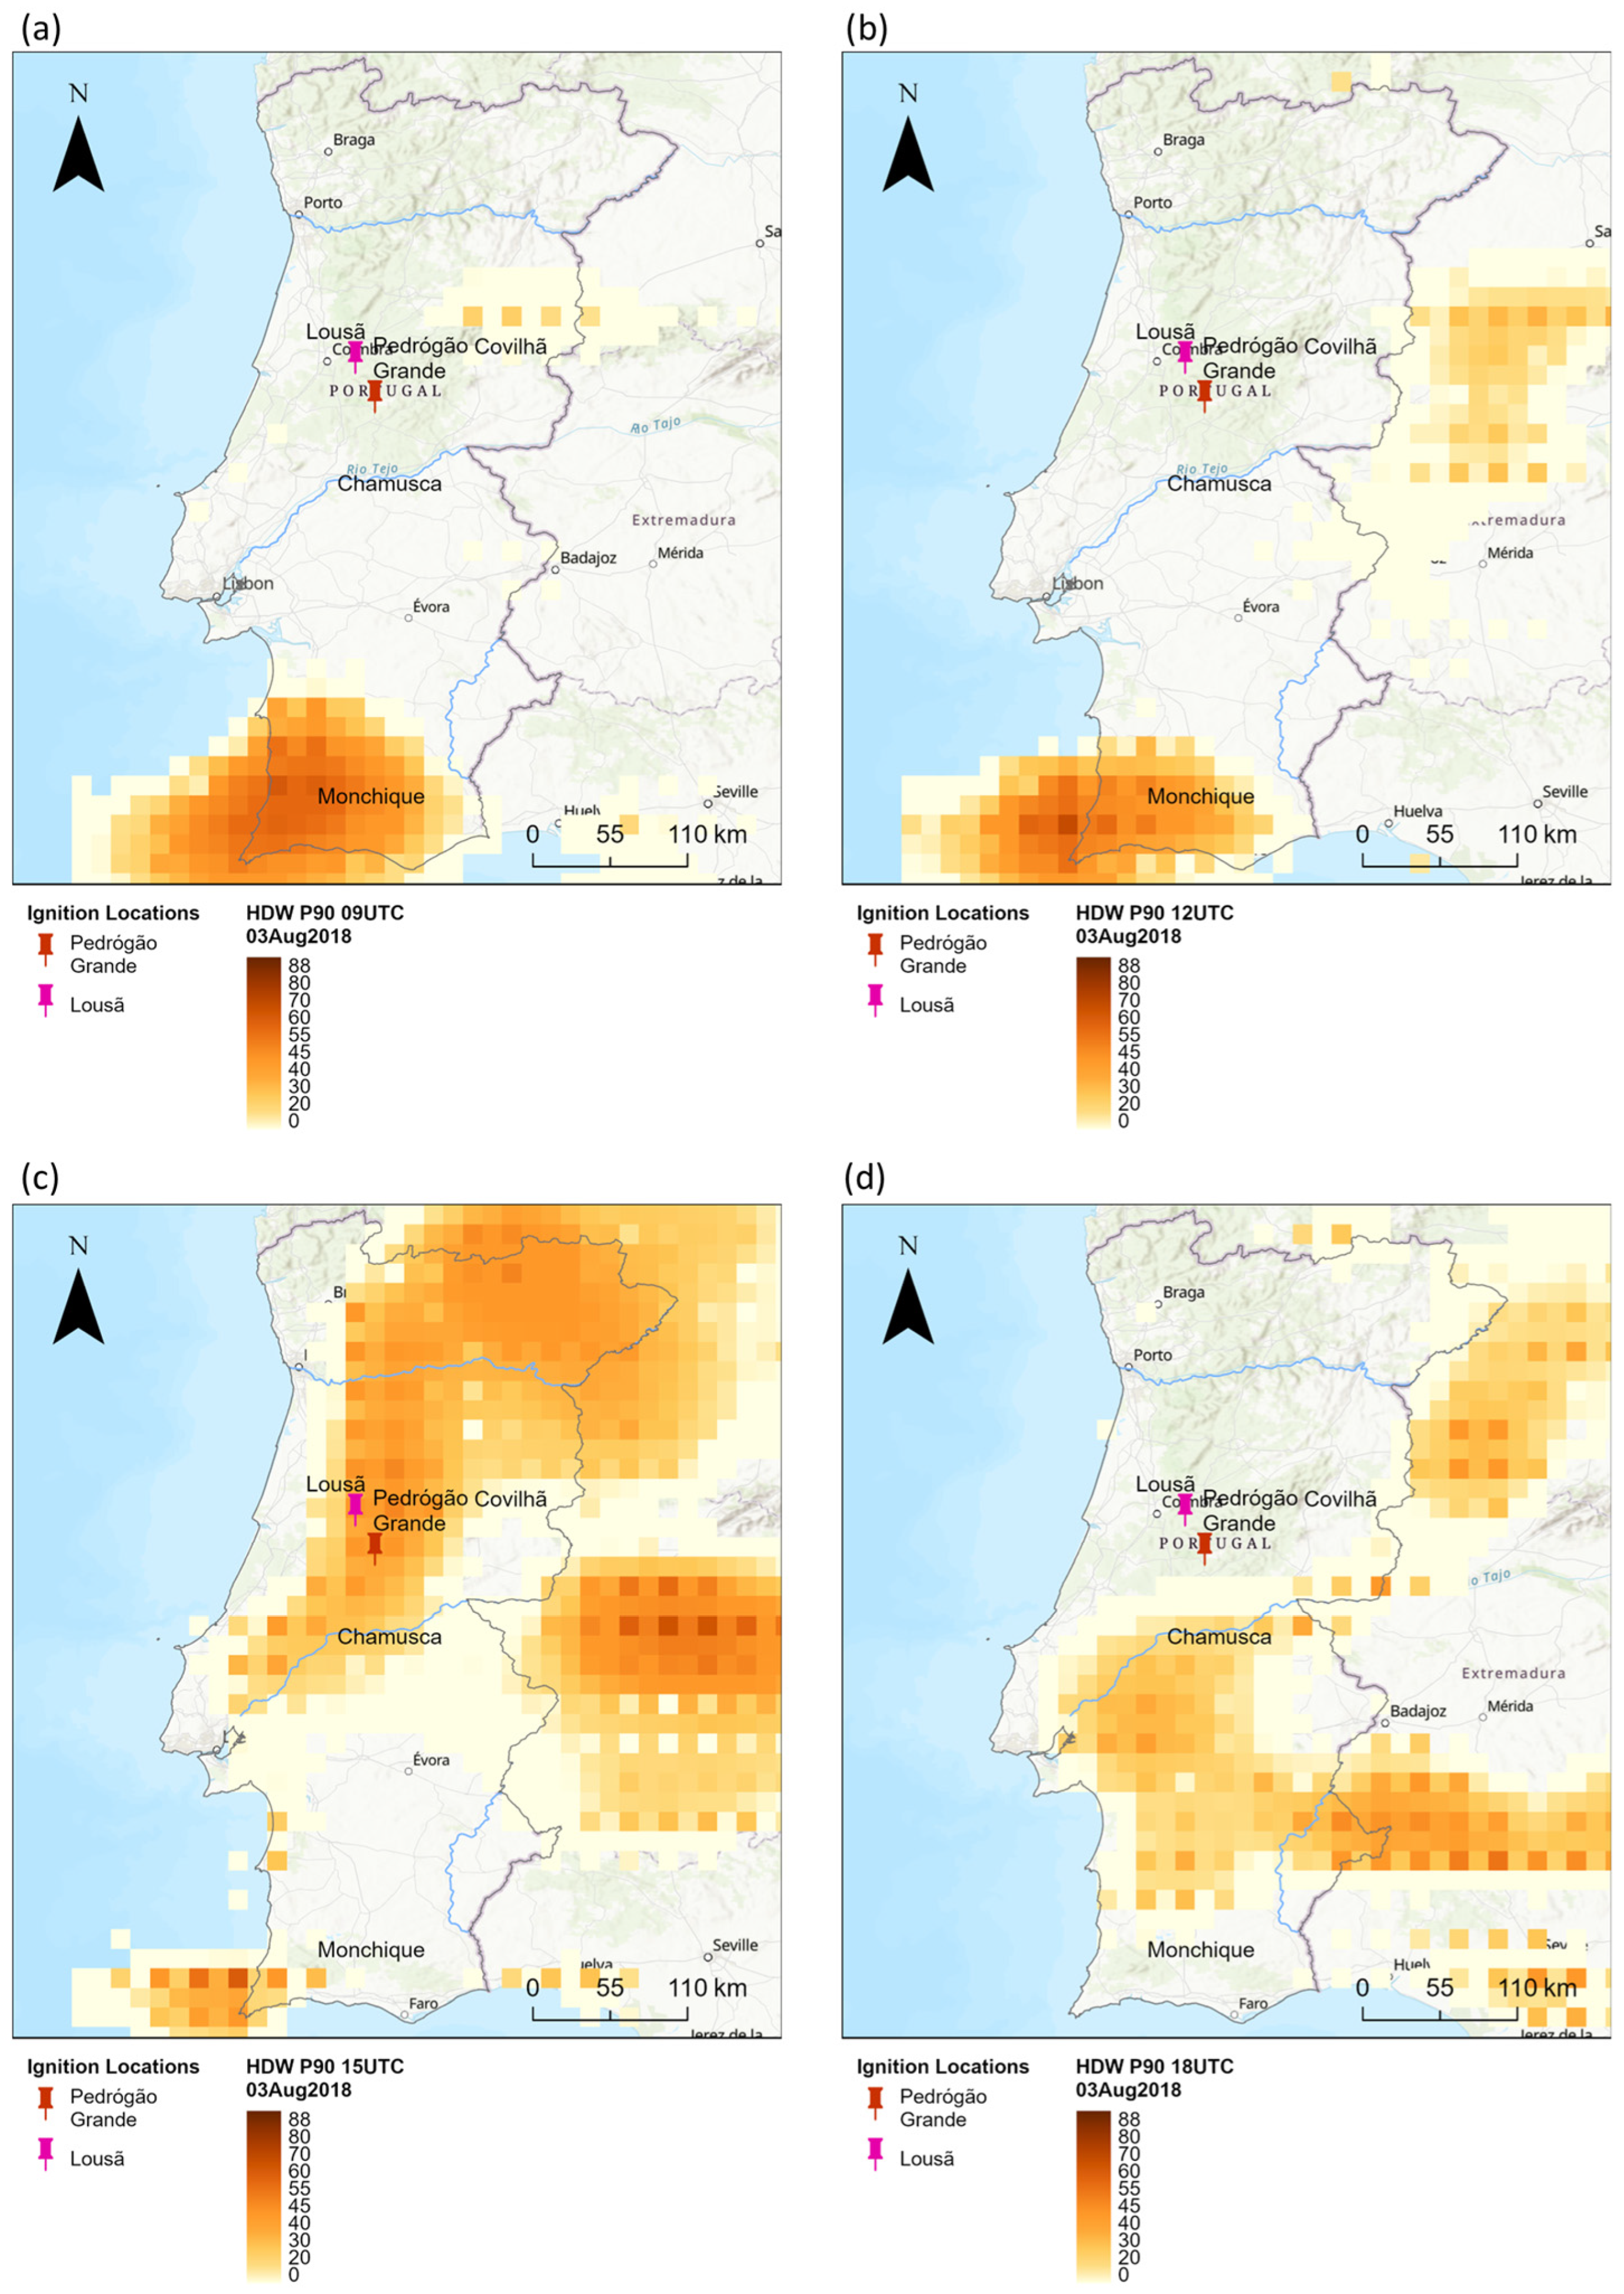
The spatial context provided by Figure 15 further underscores this anomaly. The HDW exceedance probabilities (>90th percentile) on 3 August 2018 are centred over southwestern Portugal, with a distinct core of maximum values directly overlapping the Monchique region at 09 and 12 UTC. This signature gradually dissipates eastward by 18 UTC.
The concentration of high HDW exceedance in this area suggests that the Monchique fire was driven by localized but intense fire-weather conditions, likely enhanced by regional terrain effects and the Atlantic-influenced dry air advection.
Taken together, the HDW signal at Monchique aligns with observed fire behaviour and timing. The results reinforce the applicability of HDW to southern Portuguese regions, where convective instability and orographic acceleration may augment fire-weather extremes, and where traditional indices often underperform due to their reliance on broader-scale parameters.

3.5. The Covilhã (Serra da Estrela) Fire (6 August 2022)

On 6 August 2022, a major wildfire ignited near Covilhã at the entrance to the Serra da Estrela Natural Park, rapidly escalating into Portugal’s largest wildfire of the year, burning over 28,000 ha within 11 days and prompting a national “State of Calamity” declaration to mobilize extensive recovery support for affected habitats and municipal infrastructure [47,48,49,50].
The event unfolded against a backdrop of exceptional heat, with Portugal enduring one of its most severe heatwaves on record during summer 2022, including daily peaks near 40 °C, and persistent drought conditions that spanned weeks [47,50]. Terrain complexity in the mountainous Serra da Estrela exacerbated the difficulty of terrain access and firefighting, while continuous wind-driven spread allowed flames to reach populated areas with a huge detrimental impact on Estrela UNESCO Global Geopark [47,50].
Fuel moisture levels measured around 6%–10% during the fire, with very low moisture between midday and early evening, significantly increasing flammability of dead fine fuels and facilitating sustainment of the fire under high-temperature, low-humidity conditions [47]. Surface meteorological records confirm extreme daytime temperatures and suppressed humidity, aligning with prolonged upper-air subsidence and anticyclonic ridging characteristic of heatwave-associated fire weather in Portugal [47].
Operationally, firefighting efforts were hampered by rugged topography, limited water-bombing capacity, and strategic challenges acknowledged by authorities, with over 1500 personnel, 518 ground vehicles, and up to 16 aerial assets deployed [47,48,50]. Subsequent heavy post-fire rainfall triggered soil erosion and flood risk in burned areas, underscoring the integrated hazards of wildfire and hydrological disruption [47,48,50].
This fire exemplifies a compound natural disaster—a heatwave-induced wildfire amplified by terrain, low fuel moisture, prolonged high heat, and post-burn environmental degradation. Strategically, it underscores the necessity for pre-fire fuel management, robust aerial firefighting capacity, and integrated risk mitigation, including post-fire landscape stabilization and ecosystem restoration.
The Covilhã fire ignited at 03h18 (cause intentional) on 6 August 2022 in the Serra da Estrela region, a mountainous zone particularly sensitive to fire-weather dynamics due to complex terrain and vegetation patterns. As shown in Figure 16, the HDW index values for that year (blue dots) exceeded the 75th percentile across several daytime hours, particularly at 15 UTC, with values exceeding 100 units, a clear signal of critical fire-weather conditions. While the peak is less extreme than in previous case studies (e.g., Monchique 2018 or Lousã 2017), it still represents a high anomaly against the climatological baseline.
The 15-day temporal analysis centred on the fire date (Figure 17) reveals a fluctuation in HDW values on 6 August and days after, reaching the 90th percentile envelope, especially during the afternoon (e.g., from 12 UTC to 18 UTC). This reinforces the timing correspondence between elevated HDW values and the ignition and initial spread of the wildfire. Interestingly, the HDW pattern after 06 August also exhibits a marked fluctuation with values above the 95th percentile by 13 August at both 12 UTC and 15 UTC, paralleling the containment phase of the fire.
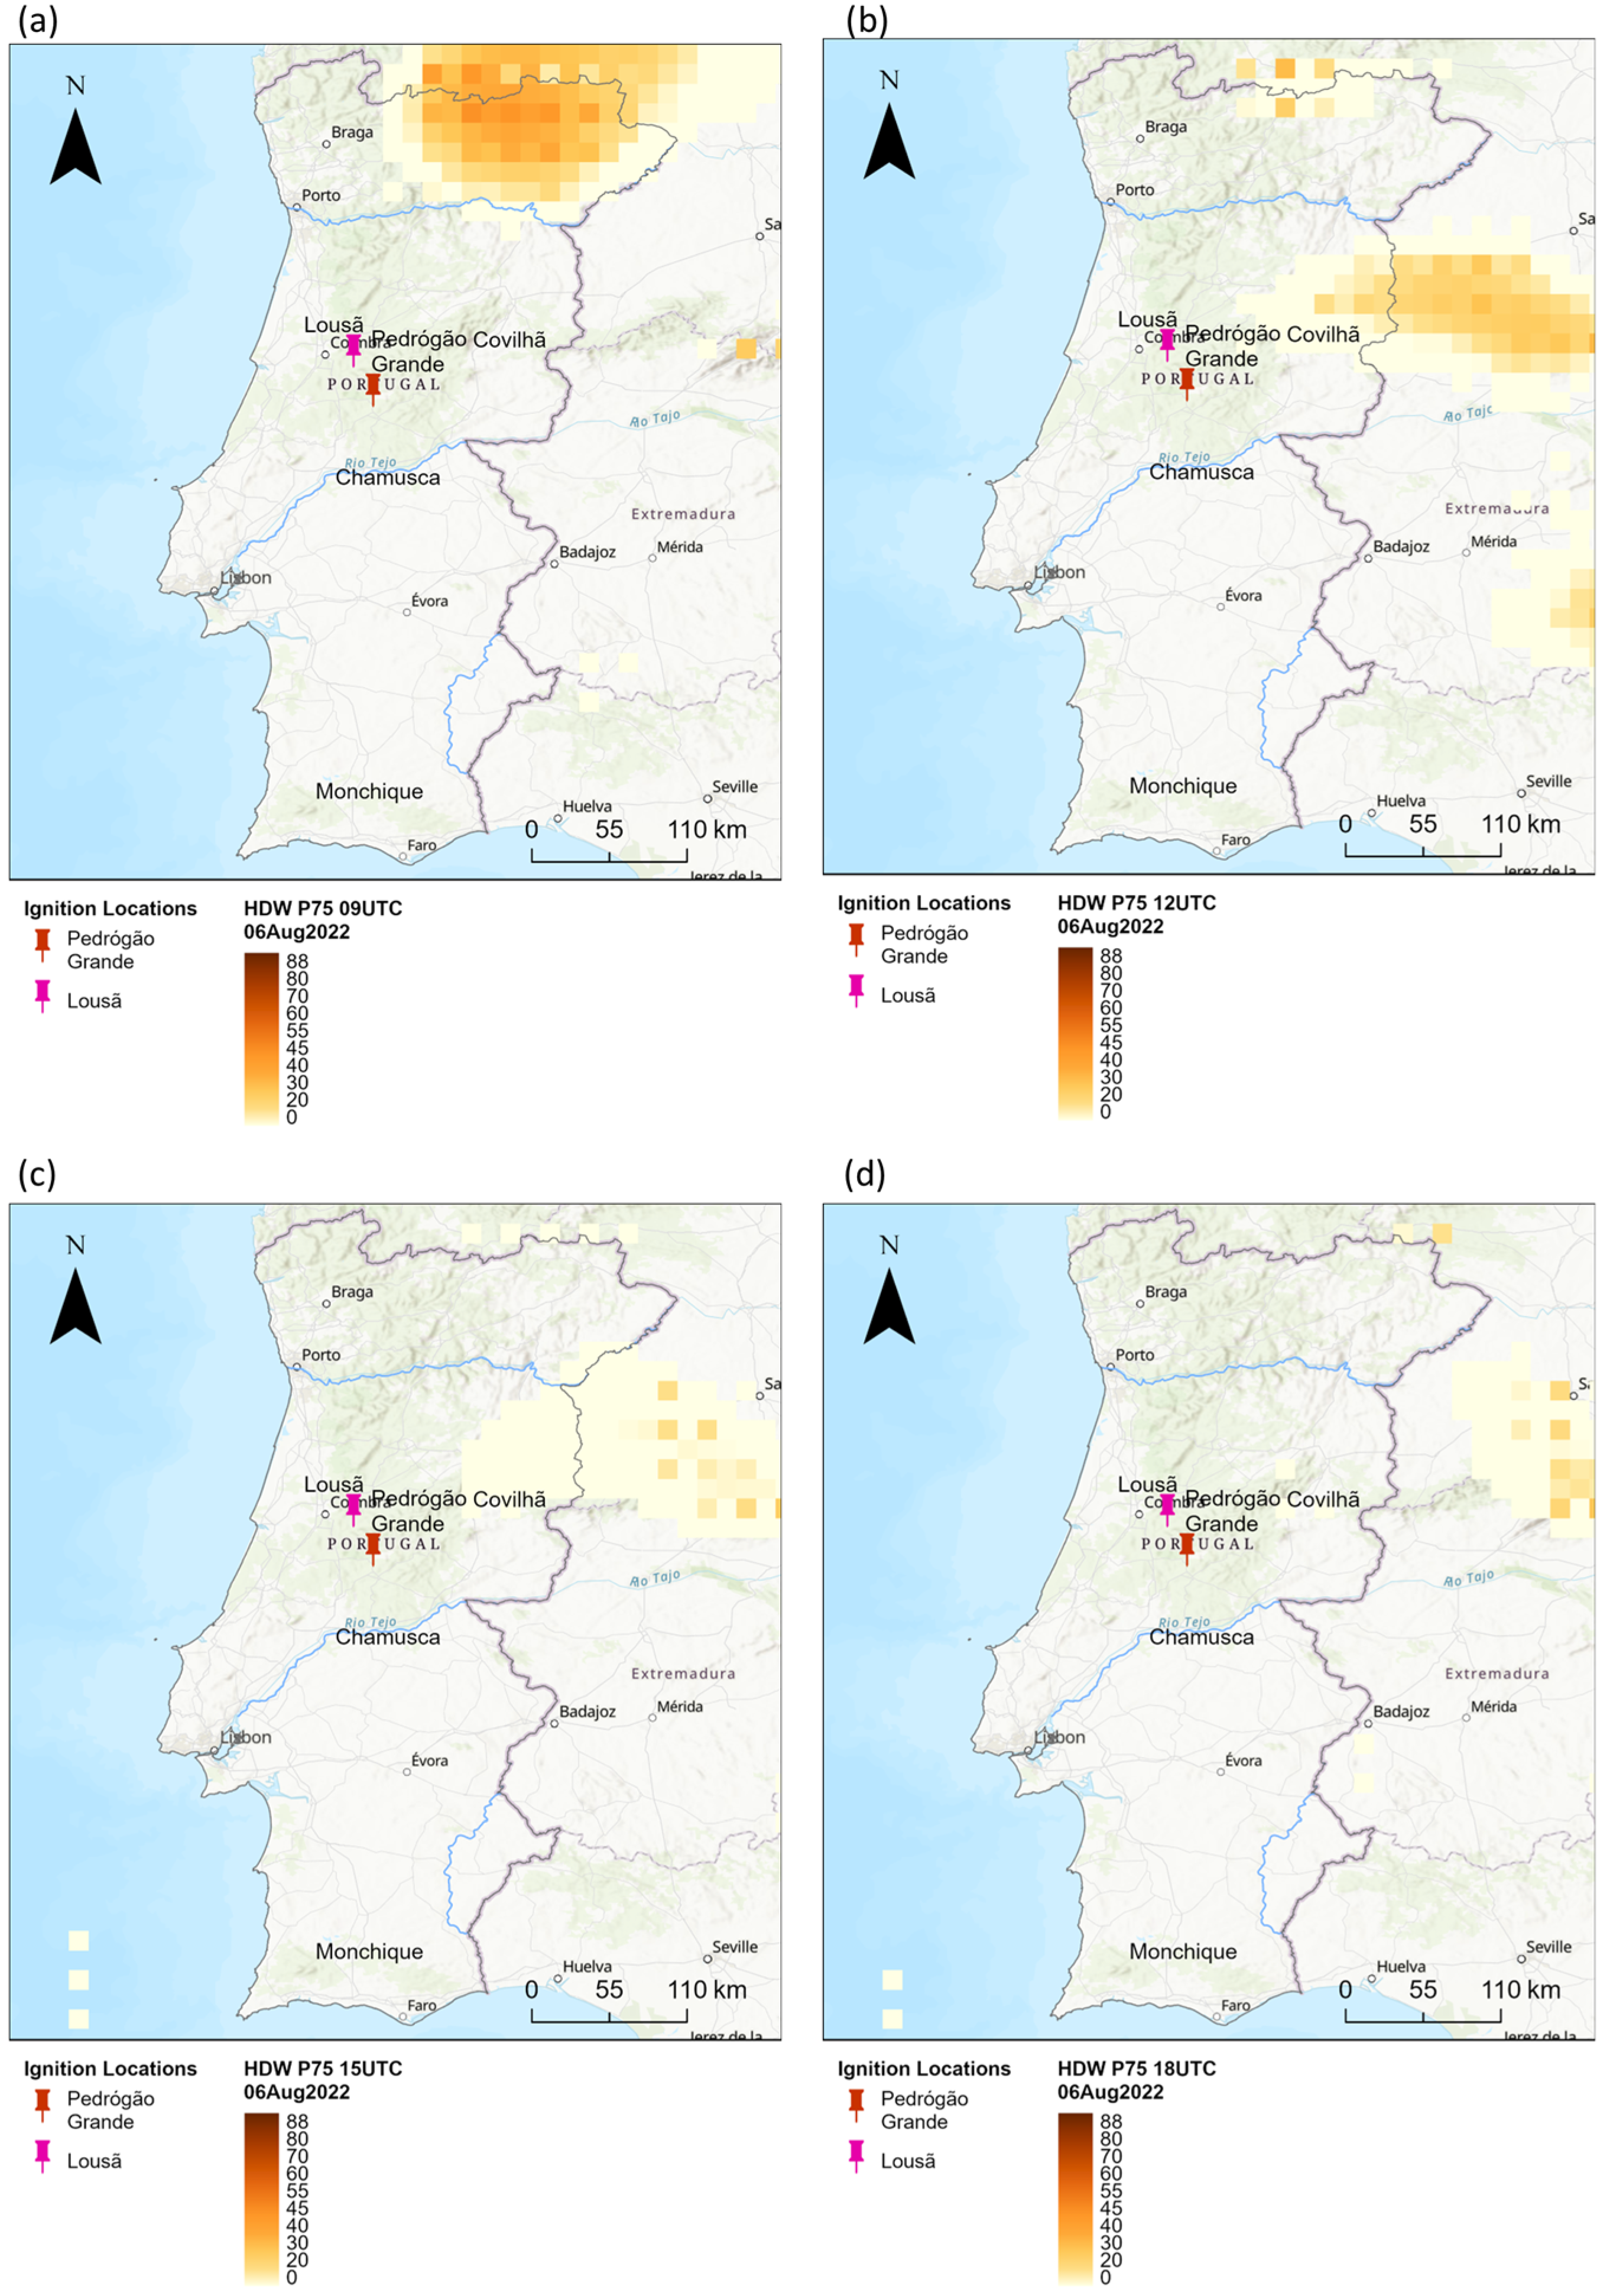
It is also noteworthy to emphasize that, though no areas for which the probability of HDW index values exceeding the 90th percentile for the ignition location of the Covilhã fire were found during 6 August 2022; these areas can be found for HDW values exceeding the 75th percentile for both 12 UTC and 15 UTC (Figure A2). Although the overall HDW intensity for this event is somewhat lower than in the most extreme historical cases, the alignment of peak HDW values with fire ignition and expansion underscores the utility of HDW for early warning, particularly in mountainous regions where mesoscale influences and fuel exposure create elevated fire risk.

3.6. Cross-Case Comparison

A comparative analysis of the five selected wildfire events—Chamusca (2003), Pedrógão Grande (June 2017), Lousã (October 2017), Monchique (2018), and Covilhã (2022)—reveals consistent patterns in the behaviour of the HDW index and its climatological anomalies, underscoring its value as a fire danger indicator.
In all cases, the HDW index exceeded the 90th percentile during the days leading up to and on the ignition date, particularly during the afternoon hours (12–18 UTC), which correspond to peak atmospheric instability and thermal stress (Figure 5, Figure 8, Figure 11, Figure 14 and Figure 16). The Lousã (2017) event showed the most extreme HDW anomalies, with values reaching above the 95th percentile across all time slots, indicating exceptional compound heat, dryness, and wind conditions. Notably, the HDW values during the Lousã fire were the highest among the case studies, with several time slots surpassing the 99th climatological percentile.
The Pedrógão Grande fire in June 2017 exhibited a significant spike in HDW at 15 UTC on the day of ignition, aligning with synoptic features such as a strong ridge aloft and a dry air intrusion [8]. When compared to FWI, HDW provided a complementary perspective. While FWI values on 17 June 2017 were also very high (39.2), HDW offered a clearer indication of the timing and severity of the fire-conducive conditions, particularly capturing the role of wind and vertical atmospheric mixing, which are not explicitly included in FWI.
For the Chamusca fire in 2003, the HDW peaked at 12 UTC on the ignition day, reaching the highest value among all case studies, aligning with the arrival of hot, dry northerly winds and high surface temperatures. Despite limitations in reanalysis resolution for this earlier event, the index effectively captured the hazardous fire weather conditions.
In the Covilhã 2022 case, while the HDW anomalies were less extreme compared to other fires, the persistent values above the 90th percentile across multiple days highlighted cumulative fire weather stress, suggesting that prolonged moderate anomalies can also be conducive to large fire development in fuel-rich and topographically complex areas.
Table 4 summarizes the percentile-based classification of HDW values across four daily time steps, thus illustrating the temporal progression of fire-conducive atmospheric conditions.
This cross-case synthesis confirms that the HDW index is a valuable diagnostic and predictive tool, especially when analyzed in conjunction with local climatology. Its ability to differentiate fire-conducive days from climatological noise makes it particularly useful in operational settings, especially when integrated with other fire danger metrics such as FWI. These findings support the inclusion of the HDW index in multi-index early warning systems for fire risk monitoring in Mediterranean regions.

3.7. Comparison Between HDW and FWI for Major Wildfire Events

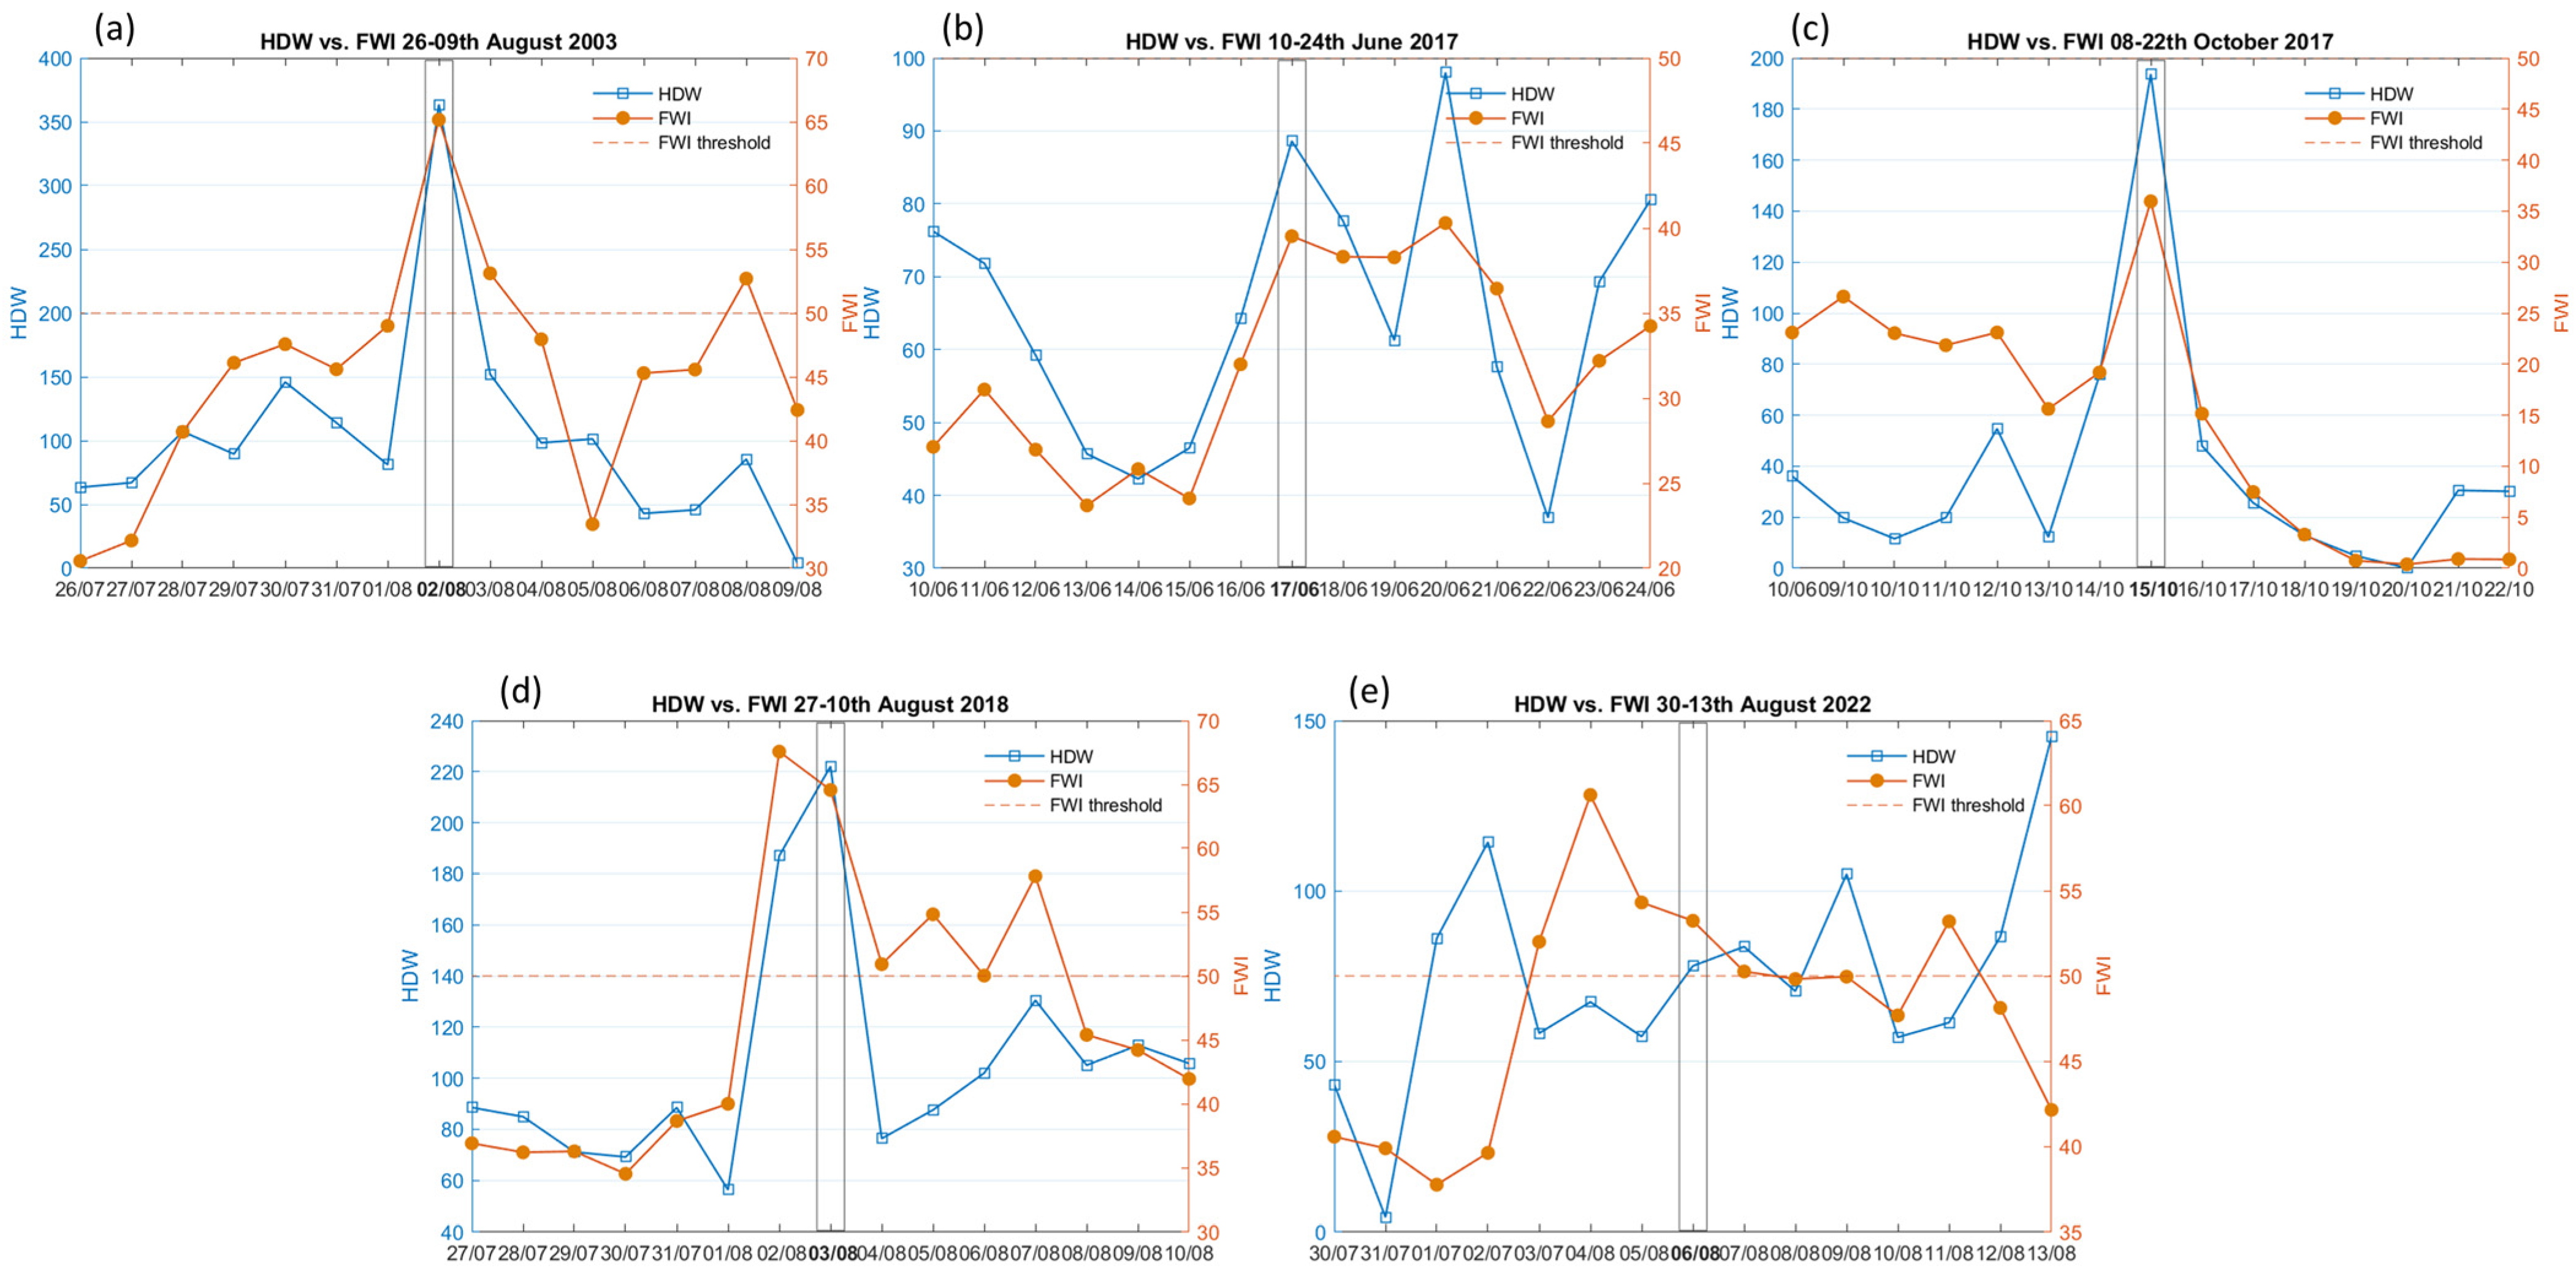
To assess the complementarity and potential advantages of the HDW index over the widely used FWI, we compared daily HDW and FWI values during the critical periods of the five major wildfires: Chamusca (2003), Pedrógão Grande (June 2017), Lousã (October 2017), Monchique (2018), and Covilhã (2022). The analysis spanned approximately two weeks around the ignition dates of each event, with ignition days highlighted in the graphs (see Figure 18).
Figure 18 and Table 5 present a comparative analysis of the Hot–Dry–Windy (HDW) index and the Fire Weather Index (FWI) for five historically significant wildfire events in mainland Portugal. The analysis focuses on daily values at 12 UTC over a 15-day window around each ignition date and evaluates each index’s ability to detect and characterize critical fire weather conditions.
The event-by-event analysis showed that Chamusca (2003) demonstrates a strong alignment between HDW and FWI. On the ignition day, HDW reached 363.6, well above the 90th percentile threshold, and remained above that level for two consecutive days. FWI peaked at 65.2, far exceeding its critical threshold, and remained above 50 for four days. This joint elevation of both indices confirms the presence of extreme meteorological conditions and underscores their complementary validation.
For Pedrógão (2017) fire, HDW was elevated (88.6) but fell below the threshold of 135, while FWI was also below the operational threshold (39.5). Despite neither index exceeding critical levels, the event was catastrophic, suggesting that factors beyond meteorology—such as fuel continuity and ignition sources—played a role. Notably, the sharp HDW peak one day before ignition (not captured in the table) and high wind speeds may not be fully represented by FWI, highlighting HDW’s potential to detect short-term wind-driven risk.
For Lousã (2017), fire HDW was 193.7, exceeding the 135 thresholds, while FWI was only 35.96—underestimating the fire danger. This decoupling indicates that FWI failed to capture short-term extreme atmospheric conditions, especially those involving wind and instability. HDW, which integrates vertical atmospheric dynamics, identified this critical episode more effectively, reinforcing its added value in wind-sensitive fire events.
Both indices showed excellent agreement for the Monchique (2018) event, with HDW reaching 222.1 and FWI peaking at 64.6. The persistence was also strong—HDW exceeded the threshold for three days, and FWI remained above 50 for five. This case reinforces confidence in the complementary robustness of both indices, particularly under compound fire-conducive weather scenarios dominated by heatwaves and synoptic ridging.
Covilhã (2022) represents the most notable divergence: FWI was elevated at 53.2 and remained above 50 for six days, suggesting sustained high fire danger. However, HDW remained below the threshold (77.9). This suggests an environment dominated by dry fuels and cumulative heat, which FWI captures, but lacking strong wind or vertical instability that HDW is sensitive to. Thus, FWI alone may overestimate meteorological danger in low-wind situations unless interpreted with caution.
The comparative assessment reveals three key insights:
  • Complementarity of HDW and FWI: While FWI captures fuel dryness and temperature effects, HDW provides a unique perspective on wind and vertical atmospheric structure, which are essential for forecasting erratic fire behaviour, especially in wind-driven scenarios. Their combined use can offer a more comprehensive situational awareness of fire danger.
  • Divergences are informative: Events such as Lousã (2017) and Covilhã (2022) show how either index may fail in isolation: FWI can miss sudden wind-driven extremes, and HDW may not detect slow-onset heat/drought-driven risks. These divergences underscore the need for multi-indicator fire danger systems.
  • Temporal persistence matters: Not only peak values but also the duration of exceedance is a critical indicator of fire potential. As shown in Table 5, persistent exceedances (e.g., Monchique, Covilhã) align with prolonged suppression challenges and large burn areas, emphasizing the importance of tracking multi-day danger windows.
The results indicate that HDW and FWI are complementary rather than redundant indicators. FWI excels in capturing fuel moisture and cumulative fire potential, while HDW adds critical information on short-term wind-driven fire danger and vertical instability. Their integration is especially beneficial for anticipating fast-spreading, wind-driven fires that may otherwise be underestimated by FWI alone.
Moreover, the duration of threshold exceedance proved as important as the peak values, revealing prolonged periods of elevated fire danger in events like Monchique and Covilhã. These patterns align with observed fire growth and suppression challenges.
Overall, this comparison supports the incorporation of HDW into operational fire danger systems as a supplementary tool that enhances the early detection of compound or dynamic fire weather extremes, particularly in transitional seasons or atypical wind regimes.
To further evaluate the relationship between two key fire danger indicators—HDW and FWI—a correlation analysis (at a 5% confidence level) was conducted for each wildfire event (Table 6). The goal was to assess whether both indices respond similarly to compound fire-conducive conditions in the days surrounding ignition. Using Spearman’s rank correlation coefficient (ρ), we examined the degree of monotonic association between daily HDW and FWI values at 12 UTC within a 15-day window centered on each ignition date. These events span diverse climatic contexts and ignition mechanisms, providing a robust test for index alignment. This analysis helps determine whether HDW offers complementary or redundant information relative to the more established FWI, particularly under varying synoptic regimes and fire types. The results also inform the potential value of combining indices for operational fire danger forecasting.
The results show that three of the five wildfire events—Chamusca 2003 (ρ = 0.525, p = 0.0471), Pedrógão Grande 2017 (ρ = 0.725, p = 0.0031), and Monchique 2018 (ρ = 0.6857, p = 0.0062)—exhibited statistically significant positive correlations between HDW and FWI (Table 6). These findings suggest a general agreement between the indices in capturing elevated fire danger, with both responding to overlapping fire-conducive meteorological patterns such as heat and dryness.
In contrast, Lousã 2017 (ρ = 0.500, p = 0.0602) showed a moderate but statistically non-significant correlation, reflecting partial synchrony between indices yet underscoring potential divergence during rapid or compound extremes. Notably, Covilhã 2022 (ρ = −0.168, p = 0.5493) revealed a weak and non-significant negative correlation, suggesting that HDW and FWI diverged in their assessment of fire danger during that event. This misalignment highlights the added value of HDW in capturing wind-driven or compound heat–dryness dynamics that may not be fully encapsulated in FWI alone.
Correlation analysis using Spearman’s rho confirms that HDW and FWI are not always linearly or monotonically related across events. While some cases (e.g., Pedrógão Grande 2017, and Monchique 2018) show strong, statistically significant associations, others like Covilhã (2022) exhibit decoupled behavior. These results highlight the added diagnostic value of HDW in identifying fire-conducive conditions not captured by FWI alone, particularly in events characterized by rapid atmospheric transitions or wind-driven dynamics.
Overall, the HDW index consistently outperformed FWI in identifying short-term, synoptically driven extreme fire danger episodes. While FWI remains effective in reflecting cumulative dryness and long-term fire potential, HDW better captures the role of wind and thermal extremes in triggering high-impact fire behaviour. These results advocate for the operational use of HDW as a complementary indicator to traditional fire danger rating systems, particularly in a Mediterranean context where rapid-onset fire weather is increasingly common.

4. Discussion

This study assessed the performance of the HDW index in characterizing fire danger conditions during five major wildfires in Portugal between 2003 and 2022. The results demonstrate that HDW provides valuable high-temporal-resolution information on atmospheric conditions conducive to large fire spread, often exceeding the 95th percentile of the climatology during critical ignition periods. The integration of HDW with other operational indices, particularly FWI, reveals important synergies and complementary strengths for fire danger assessment.

4.1. Temporal Dynamics and HDW Extremes

Across all five events, HDW values exhibited sharp increases coinciding with or preceding fire ignition:
  • In Chamusca (2003) and Lousã (2017), HDW exceeded 180–370 units during 12 and 15 UTC (Figure 5 and Figure 11), indicating extreme atmospheric conditions driven by hot, dry, and windy weather patterns. These values were well above the 95th percentile, suggesting highly flammable environments.
  • For Pedrógão Grande (2017), a clear peak at 15 UTC (Figure 8c) exceeded 140 units (>P95), consistent with the timing of ignition and rapid initial spread. Notably, this period was also identified by Andrade and Bugalho [8] as one of the highest FWI days of the season, with values over 50 (considered very high) sustained across central Portugal.
  • The Monchique (2018) event was preceded by a persistent HDW anomaly between 2 and 5 August, peaking above 200 units (Figure 14c), indicating prolonged heat stress and enhanced wind contribution.
  • In Covilhã (2022), although less extreme than other cases, HDW surpassed the 75th percentile (Figure 17) during early afternoon hours (12–18 UTC), aligning with synoptic-scale dry air advection and elevated FWI, confirming a moderately high to very high fire danger level.
These patterns underscore the diurnal concentration of HDW danger between 12 and 18 UTC, which consistently overlapped with ignition windows and peak fire spread times in the ignition points.

4.2. HDW vs. FWI: Complementary Indicators

The FWI has been widely used in Portugal as part of the Canadian Forest Fire Danger Rating System. While FWI excels in capturing the effects of cumulative drying on surface fuels, it can underrepresent short-lived but extreme conditions of heat, dryness, and wind—especially in rapidly evolving synoptic contexts. The HDW index, in contrast, is explicitly designed to reflect such compound extremes by integrating vapor pressure deficit and wind speed.
For example, Andrade and Bugalho [8] showed that in both Pedrógão Grande and Lousã fires, FWI was indeed elevated, reaching its seasonal peak due to accumulated dryness. However, the HDW index provided a finer resolution of hourly atmospheric instability and dangerous wind-driven conditions, which FWI did not resolve at such temporal granularity.
A comparison between FWI and HDW for the ignition locations revealed that HDW consistently peaked on or before ignition days, effectively signalling high-risk windows. In contrast, FWI failed to exceed critical thresholds in two of the four events (notably June and October 2017), underestimating the extreme risk.
These findings are consistent with studies by Srock et al. [9], MacDonald et al. [10], and Elliot et al. [11], who emphasized the value of HDW in identifying volatile fire behaviour windows under synoptic ridging or dry cold-frontal intrusions—conditions typical in Iberian heatwaves. Therefore, integrating both indices offers a robust framework to assess fire potential across different spatial and temporal scales.

4.3. Spatial Footprints and Synoptic Drivers

Spatial probability maps of HDW exceedance (Figure 6, Figure 9, Figure 12 and Figure 15) highlight regional-scale atmospheric alignment with ignition locations. On 15 October 2017, for instance, the HDW probability of exceeding the 90th percentile was over 70%–80% across much of central Portugal, matching widespread fire activity in Lousã and surrounding areas. These anomalies coincided with a strong pressure gradient and dry Foehn-type downslope winds behind an extratropical cyclone, conditions also noted in Di Giuseppe et al. [51] and Cardil et al. [52] as catalysts for fast-moving crown fires.
In Monchique (2018) and Covilhã (2022), HDW probability fields revealed mesoscale hotspots of atmospheric danger driven by thermal low formation, easterly flow, and upper-level subsidence—features consistent with elevated fire growth potential despite fuel types or terrain.

4.4. Operational Implications and Forecast Utility

The findings support the usefulness of HDW as a near-real-time operational indicator, especially for predicting on a daily and sub-daily basis. It is a perfect complement to longer-timescale indices like FWI because of its responsiveness to transient but highly influential situations. HDW correctly detected or forewarned of the fire’s onset in each of the five incidents, indicating that adding HDW to early warning systems could support fire managers and civil protection organisations in more effectively allocating resources and getting ready for escalation situations.
Unlike FWI, which primarily reflects fuel moisture conditions and fire behaviour potential, HDW emphasizes the atmospheric drivers of rapid fire spread—specifically high wind speeds and vapor pressure deficits. This makes HDW particularly effective in identifying high-impact fire weather scenarios often associated with extreme, fast-moving wildfires. Its integration into existing early warning systems, such as the European Forest Fire Information System (EFFIS) or Portugal’s Índice Meteorológico de Risco de Incêndio (IPMA), may enhance responsiveness to high-risk, short-term conditions that fuel-based indices would miss.
Internationally, there is growing interest in incorporating compound fire weather indicators, such as HDW, into alert systems. For instance, the U.S. National Weather Service has used HDW to supplement Red Flag Warnings in complex terrain and drought-affected areas [9,10]. Fire managers may be able to get a more comprehensive picture of atmospheric fire potential from similar applications in Mediterranean regions. The HDW index’s continuous formulation, use of standard meteorological inputs, and demonstrated relevance across multiple fire events suggest strong potential for real-time application and multi-index integration in operational contexts, even though more regional calibration and validation are required. Moreover, the HDW index may prove especially beneficial under climate change conditions, where fire seasons are lengthening, and compound Hot–Dry–Windy extremes are increasing in frequency [51,52,53]. Future work should focus on integrating HDW into ensemble forecast products and regional wildfire outlook systems, alongside remote-sensing and machine learning tools for dynamic fire risk mapping.

5. Conclusions

This study evaluated the performance of the HDW index in characterizing the atmospheric conditions associated with five major wildfires in Portugal: Chamusca (2003), Pedrógão Grande (2017), Lousã (2017), Monchique (2018), and Covilhã (2022). The HDW index effectively captured key periods of elevated fire danger, frequently exceeding the 90th and 95th climatological percentiles in the hours preceding ignition.
The main findings can be summarized as follows:
  • On the day of fire ignition, HDW values consistently peaked in the afternoon (12–18 UTC), which coincided with the most volatile phases for fire spread and highlighted the significance of sub-daily monitoring.
  • HDW values consistently exceeded high climatological percentiles, illustrating the ability to identify compound extremes in wind, heat, and dryness—conditions that daily averaged indices frequently overlook.
  • By emphasizing regional-scale atmospheric anomalies that strengthened local fire potential, the HDW index demonstrated strong spatial coherence with ignition zones.
  • HDW consistently signalled high fire danger on ignition days across all events, often more clearly than FWI. When compared with the FWI, particularly for the 2017 fires (FWI underestimated fire risk in the June and October 2017 events, staying below critical thresholds despite extreme fire behaviour), HDW provided higher temporal sensitivity and greater responsiveness to dynamic weather events, reinforcing its value as a complementary tool to existing fire danger metrics.
  • FWI is sensitive to fuel moisture dynamics, while HDW is driven by atmospheric forcing, making them complementary rather than redundant.
These results support the integration of HDW into fire weather monitoring systems in Portugal and other Mediterranean countries. HDW better captures compound conditions of heat, dryness, and wind, especially relevant in fast-developing fire scenarios. FWI is more fuel-moisture dependent, while HDW reflects real-time atmospheric stress, making them complementary. HDW’s high temporal resolution and sensitivity to dangerous fire-conducive conditions make it especially useful for real-time forecasting, operational planning, and early warning. It is recommended to use sub-daily HDW forecasts to inform early warning alerts and decision-making by civil protection authorities. The co-use of HDW and FWI is also recommended for operational fire forecasting in Mediterranean climates, particularly under future climate change scenarios where compound extremes may become more frequent.
Future research should expand the sample of wildfire events and conduct long-term retrospective analyses. It should also examine how HDW may be used in ensemble-based predictive models and assess how well it works with different fuel kinds and topographies. Exploring compound fire-weather indicators that combine HDW and FWI using multivariate or machine learning approaches is advised, since tools like HDW may become crucial for reducing the danger of wildfires in Southern Europe due to the increased frequency of intense fire weather occurrences brought on by climate change. Overall, the findings point to the need for more testing in other fire-prone areas and to justify the incorporation of HDW into multi-index early warning systems.

Author Contributions

Conceptualization, C.A. and L.B.; methodology, C.A.; software, C.A. and L.B.; validation, C.A. and L.B.; formal analysis, C.A. and L.B.; investigation, C.A. and L.B.; resources, C.A. and L.B.; data curation, C.A. and L.B.; writing—original draft preparation, C.A.; writing—review and editing, C.A. and L.B.; visualization, C.A.; funding acquisition, C.A. All authors have read and agreed to the published version of the manuscript.

Funding

This work is supported by National Funds by FCT—Portuguese Foundation for Science and Technology, under the projects UID/04033 and LA/P/0126/2020 (https://doi.org/10.54499/LA/P/0126/2020).

Data Availability Statement

Not applicable.

Conflicts of Interest

The authors declare no conflicts of interest.

Abbreviations

The following abbreviations are used in this manuscript:
BUIBuildup Index
CFFDRSCanadian Forest Fire Danger Rating System
DTM Digital Terrain Model
ECMWFEuropean Centre for Medium-Range Weather Forecasts
ERA5ECMWF Reanalysis v5
ET0Reference Evapotranspiration
FWIFire Weather Index
HDWHot–Dry–Windy Index
IFSIntegrated Forecasting System
IPMAInstituto Português do Mar e da Atmosfera
ISIInitial Spread Index
RHRelative humidity
TTemperature
UWind Speed
UTCCoordinated Universal Time
VPDVapor Pressure Deficit

Appendix A

Appendix A.1

Figure A1. Methodological framework of the study. The top panel shows the computation of the Hot–Dry–Windy (HDW) index as the product of wind speed (U, m/s) and vapor pressure deficit (VPD, hPa), derived from air temperature (T, °C) and water vapor pressure (e). The lower panel illustrates the Fire Weather Index (FWI) system, including the calculation of its fuel moisture codes (FFMC, DMC, DC) and fire behaviour indexes (ISI, BUI), based on meteorological variables: temperature (T, °C), relative humidity (RH, %), wind speed (W, km/h), and rainfall (R, mm) (Adapted from Van Wagner [54]).
Forests 16 01417 g0a1
The framework also highlights the use of 3-hourly data (00 UTC to 21 UTC) with a focus on 12 UTC for direct comparison, and the percentile-based HDW climatology (1991–2020) used to evaluate exceedance thresholds for five major wildfire events in Portugal (Chamusca 2003, Pedrógão 2017, Lousã 2017, Monchique 2018, Covilhã 2022). A Spearman rank correlation analysis (at a 5% confidence level) between HDW and FWI was applied using a 15-day window centered on each ignition date to assess co-variability and temporal alignment of fire danger signals.

Appendix A.2

Figure A2. Probability (%) of the Hot–Dry–Windy (HDW) index exceeding the 90th percentile on 6 August 2022—the ignition date of the Covilhã fire. Panels (ad) illustrate HDW exceedance probabilities at 09 UTC, 12 UTC, 15 UTC, and 18 UTC, respectively. Colored contours highlight areas with elevated fire-weather conditions, while ignition points for Chamusca, Lousã, and Pedrógão Grande are shown for spatial context.
Forests 16 01417 g0a2

References

  1. Carvalho, A.; Flannigan, M.D.; Logan, K.A.; Miranda, A.I.; Borrego, C. Fire activity in Portugal and its relationship to weather and the Canadian Fire Weather Index System. Int. J. Wildland Fire 2008, 17, 328–338. [Google Scholar] [CrossRef]
  2. Bedia, J.; Herrera, S.; Camia, A.; Moreno, J.M.; Gutiérrez, J.M. Forest fire danger projections in the Mediterranean using ENSEMBLES regional climate change scenarios. Clim. Chang. 2014, 122, 185–199. [Google Scholar] [CrossRef]
  3. Ruffault, J.; Curt, T.; Moron, V.; Trigo, R.M.; Mouillot, F.; Koutsias, N.; Pimont, F.; Martin-StPaul, N.; Barbero, R.; Dupuy, J.-L.; et al. Increased Likelihood of Heat-Induced Large Wildfires in the Mediterranean Basin. Sci. Rep. 2020, 10, 13790. [Google Scholar] [CrossRef] [PubMed]
  4. Jolly, W.M.; Cochrane, M.A.; Freeborn, P.H.; Holden, Z.A.; Brown, T.J.; Williamson, G.J.; Bowman, D.M.J.S. Climate-induced variations in global wildfire danger from 1979 to 2013. Nat. Commun. 2015, 6, 7537. [Google Scholar] [CrossRef] [PubMed]
  5. Ruffault, J.; Curt, T.; Martin-StPaul, N.; Moron, V.; Trigo, R.M. Extreme wildfire events are linked to global-change-type droughts in the northern Mediterranean. Nat. Hazards Earth Syst. Sci. 2018, 18, 847–856. [Google Scholar] [CrossRef]
  6. Turco, M.; Jerez, S.; Augusto, S.; Tarín-Carrasco, P.; Ratola, N.; Jiménez-Guerrero, P.; Trigo, R.M. Climate drivers of the 2017 devastating fires in Portugal. Sci. Rep. 2019, 9, 13886. [Google Scholar] [CrossRef]
  7. San-Miguel-Ayanz, J.; Oom, D.; Artes, T.; Viegas, D.X.; Fernandes, P.; Faivre, N.; Freire, S.; Moore, P.; Rego, F.; Castellnou, M. Forest Fires in Portugal in 2017. In Science for Disaster Risk Management 2020: Acting Today, Protecting Tomorrow, EUR 30183 EN; Casajus Valles, A., Marin Ferrer, M., Poljanšek, K., Clark, I., Eds.; Publications Office of the European Union: Luxembourg, 2020; ISBN 978-92-76-18182-8. [Google Scholar] [CrossRef]
  8. Andrade, C.; Bugalho, M.N. Multi-indices diagnosis of the conditions that have led to the two 2017 major wildfires in Portugal. Fire 2023, 6, 56. [Google Scholar] [CrossRef]
  9. Srock, A.F.; Charney, J.J.; Potter, B.E.; Goodrick, S.L. The Hot-Dry-Windy Index: A new fire weather index. Atmosphere 2018, 9, 279. [Google Scholar] [CrossRef]
  10. McDonald, J.M.; Srock, A.F.; Charney, J.J. Development and Application of a Hot-Dry-Windy Index (HDW) Climatology. Atmosphere 2018, 9, 285. [Google Scholar] [CrossRef]
  11. Elliott, K.G.; Flannigan, M.D.; Tymstra, C. Enhanced prediction of extreme fire weather conditions in spring using the Hot-Dry-Windy Index in Alberta, Canada. Int. J. Wildland Fire 2024, 33, WF24015. [Google Scholar] [CrossRef]
  12. Feng, Y.; Sun, F. Changes in the severity of compound hot-dry-windy events over global land areas. Ecol. Indic. 2024, 165, 112207. [Google Scholar] [CrossRef]
  13. Dupuy, J.L.; Fargeon, H.; Martin-StPaul, N.; Pimont, F.; Ruffault, J.; Guijarro, M.; Hernando, C.; Madrigal, J.; Fernandes, P. Climate change impact on future wildfire danger and activity in southern Europe: A review. Ann. For. Sci. 2020, 77, 35. [Google Scholar] [CrossRef]
  14. Bedia, J.; Herrera, S.; Martín, D.S.; Koutsias, N.; Gutiérrez, J.M. Robust Projections of Fire Weather Index in the Mediterranean Using Statistical Downscaling. Clim. Chang. 2013, 120, 229–247. [Google Scholar] [CrossRef]
  15. Hantson, S.; Hamilton, D.S.; Burton, C. Changing fire regimes: Ecosystem impacts in a shifting climate. One Earth 2024, 7, 942–945. [Google Scholar] [CrossRef]
  16. ICNF. Available online: https://fogos.icnf.pt/sgif2010/ (accessed on 5 May 2025).
  17. ICNF. Available online: http://www2.icnf.pt/portal/florestas/dfci/inc/estat-sgif (accessed on 5 May 2025).
  18. ICNF—Cartografia da Área Ardida. Available online: http://www2.icnf.pt/portal/florestas/dfci/inc/mapas (accessed on 5 May 2025).
  19. Rothermel, R.C. A Mathematical Model for Predicting Fire Spread in Wildland Fuels; Research Paper INT-115; USDA Forest Service: Washington, DC, USA, 1972; p. 40. [Google Scholar]
  20. Cohen, J.D.; Deeming, J.E. The National Fire-Danger Rating System: Basic Equations; General Technical Reports INT-84; USDA Forest Service, Intermountain Forest and Range Experiment Station: Ogden, UT, USA, 1985. [Google Scholar] [CrossRef]
  21. Fosberg, M.A. Weather in wildland fire management: The Fire Weather Index. In Proceedings of the Conference on Sierra Nevada Meteorology of the American Meteorological Society and the USDA Forest Service, South Lake Tahoe, CA, USA, 19–21 June 1978; American Meteorological Society: Boston, MA, USA, 1978. 4p. [Google Scholar]
  22. Haines, D.A. A lower atmosphere severity index for wildland fires. Natl. Weather. Dig. 1988, 13, 23–27. [Google Scholar]
  23. Giannaros, T.M.; Papavasileiou, G. Changes in European fire weather extremes and related atmospheric drivers. Agric. For. Meteorol. 2023, 342, 109749. [Google Scholar] [CrossRef]
  24. Dowdy, A.J. Climatological Variability of Fire Weather in Australia. J. App. Meteorol. Clim. 2018, 57, 221–234. [Google Scholar] [CrossRef]
  25. Trigo, R.M.; Garcia-Herrera, R.; Díaz, J.; Trigo, I.F.; Valente, M.A. How exceptional was the early August 2003 heatwave in France? Geophys. Res. Lett. 2005, 32, L10701. [Google Scholar] [CrossRef]
  26. Pereira, M.G.; Gonçalves, N.; Amraoui, M. The Influence of Wildfire Climate on Wildfire Incidence: The Case of Portugal. Fire 2024, 7, 234. [Google Scholar] [CrossRef]
  27. Pereira, M.G.; Trigo, R.M.; da Camara, C.; Pereira, J.; Leite, S.M. Synoptic patterns associated with large summer forest fires in Portugal. Agric. For. Meteorol. 2005, 129, 11–25. [Google Scholar] [CrossRef]
  28. Trigo, R.M.; Pereira, J.; Pereira, M.; Mota, B.; Calado, T.; Da Camara, C.; Santo, F.E. Atmospheric conditions associated with the exceptional fire season of 2003 in Portugal. Int. J. Climatol. 2006, 26, 1741–1757. [Google Scholar] [CrossRef]
  29. Pereira, M.; Parente, J.; Amraoui, M.; Oliveira, A.; Fernandes, P. The role of weather and climate conditions on extreme wildfires. In Extreme Wildfire Events and Disasters; Tedim, F., Leone, V., McGee, T.K., Eds.; Elsevier: Amsterdam, The Netherlands, 2020; pp. 55–72. ISBN 9780128157213. [Google Scholar] [CrossRef]
  30. Menezes, L.; Russo, A.; Libonati, R.; Trigo, R.M.; Pereira, J.; Benali, A.; Ramos, A.; Gouveia, C.; Rodriguez, C.; Deus, R. Lightning-induced fire regime in Portugal based on satellite-derived and in situ data. Agric. For. Meteorol. 2024, 355, 110108. [Google Scholar] [CrossRef]
  31. Silva, P.; Carmo, M.; Rio, J.; Novo, I. Changes in the Seasonality of Fire Activity and Fire Weather in Portugal: Is the Wildfire Season Really Longer? Meteorology 2023, 2, 74–86. [Google Scholar] [CrossRef]
  32. Pinto, P.; Silva, Á.P.; Viegas, D.X.; Almeida, M.; Raposo, J.; Ribeiro, L.M. Influence of Convectively Driven Flows in the Course of a Large Fire in Portugal: The Case of Pedrógão Grande. Atmosphere 2022, 13, 414. [Google Scholar] [CrossRef]
  33. Menezes, I.C.; Lopes, D.; Fernandes, A.P.; Borrego, C.; Viegas, D.X.; Miranda, A.I. Atmospheric dynamics and fire-induced phenomena: Insights from a comprehensive analysis of the Sertã wildfire event. Atmos. Res. 2024, 310, 107649. [Google Scholar] [CrossRef]
  34. Kew, S.; Philip, S.; Oldenborgh, G.; der Schier, G.; Otto, F.; Vautard, R. The Exceptional Summer Heat Wave in Southern Europe 2017. Bull. Meteorol. Soc. 2019, 100, S49–S53. [Google Scholar] [CrossRef]
  35. IPMA. Boletim Climatológico Maio 2017; IPMA: Lisbon, Portugal, 2017; Available online: https://www.ipma.pt/resources.www/docs/im.publicacoes/edicoes.online/20170626/aVLpiPPRcjMelDFtWLhz/cli_20170501_20170531_pcl_mm_co_pt.pdf (accessed on 5 May 2025). (In Portuguese)
  36. FRAMES Catalog. Influence of MCS in Pedrógão Grande Fire Spread. FRAMES 2022, Record No. 65433. Available online: https://www.frames.gov/catalog/65433 (accessed on 5 May 2025).
  37. Castellnou, M.; Guiomar, N.; Rego, F.; Fernandes, P.M. Fire growth patterns in the 2017 mega fire episode of October 15, central Portugal. In Advances in Forest Fire Research 2018; Imprensa da Universidade de Coimbra: Coimbra, Portugal, 2018. [Google Scholar] [CrossRef]
  38. Thomas, D. Five years on … remembering the fires of October 2017. Portugal Resident, 13 October 2022. Available online: https://www.portugalresident.com/five-years-on-remembering-the-fires-of-october-2017/ (accessed on 5 May 2025).
  39. Ramos, A.M.; Russo, A.; DaCamara, C.C.; Nunes, S.; Sousa, P.; Soares, P.M.M.; Lima, M.M.; Hurduc, A.; Trigo, R.M. The compound event that triggered the destructive fires of October 2017 in Portugal. iScience 2023, 26, 106141. [Google Scholar] [CrossRef]
  40. Viegas, D.X.; Almeida, M.F.; Ribeiro, L.M. (Eds.) Análise dos Incêndios Florestais Ocorridos a 15 de Outubro de 2017. In Centro de Estudos Sobre Incêndios Florestais ADAI/LAETA; Universidade de Coimbra: Coimbra, Portugal, 2019. [Google Scholar]
  41. Campos, C.; Couto, F.T.; Filippi, J.-B.; Baggio, R.; Salgado, R. Modelling pyro-convection phenomenon during a mega-fire event in Portugal. Atmos. Res. 2023, 290, 106776. [Google Scholar] [CrossRef]
  42. Calheiros, T.; Nunes, J.P.; Pereira, M. Recent evolution of spatial and temporal patterns of burnt areas and fire weather risk in the Iberian Peninsula. Agric. For. Meteorol. 2020, 287, 107923. [Google Scholar] [CrossRef]
  43. Durão, R.M.; Alonso, C.; Gouveia, C.M. The performance of ECMWF Ensemble Prediction System for European extreme fires: Portugal/Monchique in 2018. Atmosphere 2022, 13, 1239. [Google Scholar] [CrossRef]
  44. Santos, F.L.; Couto, F.T.; Salgueiro, V.; Potes, M.; João Costa, M.; Bortoli, D.; Salgado, R. Fire weather risk analysis over Portugal in recent decades: Monchique case study. In Proceedings of the EGU General Assembly 2022, Vienna, Austria, 23–27 May 2022; p. EGU22-11616. [Google Scholar] [CrossRef]
  45. Purificação, C.; Santos, F.; Henkes, A.; Kartsios, S.; Couto, F.T. Fire-weather conditions during two fires in Southern Portugal: Meteorology, Orography, and Fuel Characteristics. Model. Earth Syst. Environ. 2025, 11, 135. [Google Scholar] [CrossRef]
  46. Carmo, M.; Ferreira, J.; Mendes, M.; Silva, A.; Silva, P.; Alves, D.; Reis, L.; Novo, I.; Xavier Viegas, D. The climatology of extreme wildfires in Portugal, 1980–2018: Contributions to forecasting and preparedness. Int. J. Climatol. 2022, 42, 3123–3146. [Google Scholar] [CrossRef]
  47. Rodrigues, M.; Camprubí, A.C.; Balaguer-Romano, R.; Megía, C.; Castañares, F.; Ruffault, J.; Fernandes, P.; Resco de Dios, V. Drivers and implications of the extreme 2022 wildfire season in Southwest Europe. Sci. Total Environ. 2023, 59 Pt 2, 160320. [Google Scholar] [CrossRef]
  48. Wikipedia contributors. Grande Incêndio da Covilhã e Crise na Serra da Estrela; Grandes Incêndios de Portugal de 2022. Available online: https://pt.wikipedia.org/wiki/Grandes_Inc%C3%AAndios_de_Portugal_de_2022 (accessed on 10 June 2025).
  49. Copernicus. Disastrous Fire in Central Portugal; Copernicus Emergency Management Service. Image of the Day, 17 August 2022. Available online: https://www.copernicus.eu/en/media/image-day-gallery/disastrous-fire-central-portugal (accessed on 5 May 2025).
  50. Gonçalves, J.; Castro, E.; Loureiro, F.; Pereira, P. Assessment of forest fires impacts on geoheritage: A study in the Estrela UNESCO Global Geopark, Portugal. Int. J. Geoherit. Parks 2024, 12, 580–605. [Google Scholar] [CrossRef]
  51. Fernandes, P.M.; Barros, A.M.G.; Pinto, A.; Santos, J.A. Characteristics and controls of extremely large wildfires in the western Mediterranean Basin. J. Geophys. Res. Biogeosci. 2016, 121, 2141–2157. [Google Scholar] [CrossRef]
  52. El Garroussi, S.; Di Giuseppe, F.; Barnard, C.; Wetterhall, F. Europe faces up to tenfold increase in extreme fires in a warming climate. Npj Clim. Atmos. Sci. 2024, 7, 30. [Google Scholar] [CrossRef]
  53. Bedia, J.; Golding, N.; Casanueva, A.; Iturbide, M.; Buontempo, C.; Gutiérrez, J.M. Seasonal predictions of Fire Weather Index: Paving the way for their operational applicability in Mediterranean Europe. Clim. Serv. 2018, 9, 101–110. [Google Scholar] [CrossRef]
  54. Van Wagner, C.E.; Pickett, T.L. Equations and FORTRAN Program for the Canadian Forest Fire Weather Index System; Forestry Technical Report 33; Canadian Forestry Service, Petawawa National Forestry Institute: Chalk River, ON, Canada, 1985; p. 18. [Google Scholar]
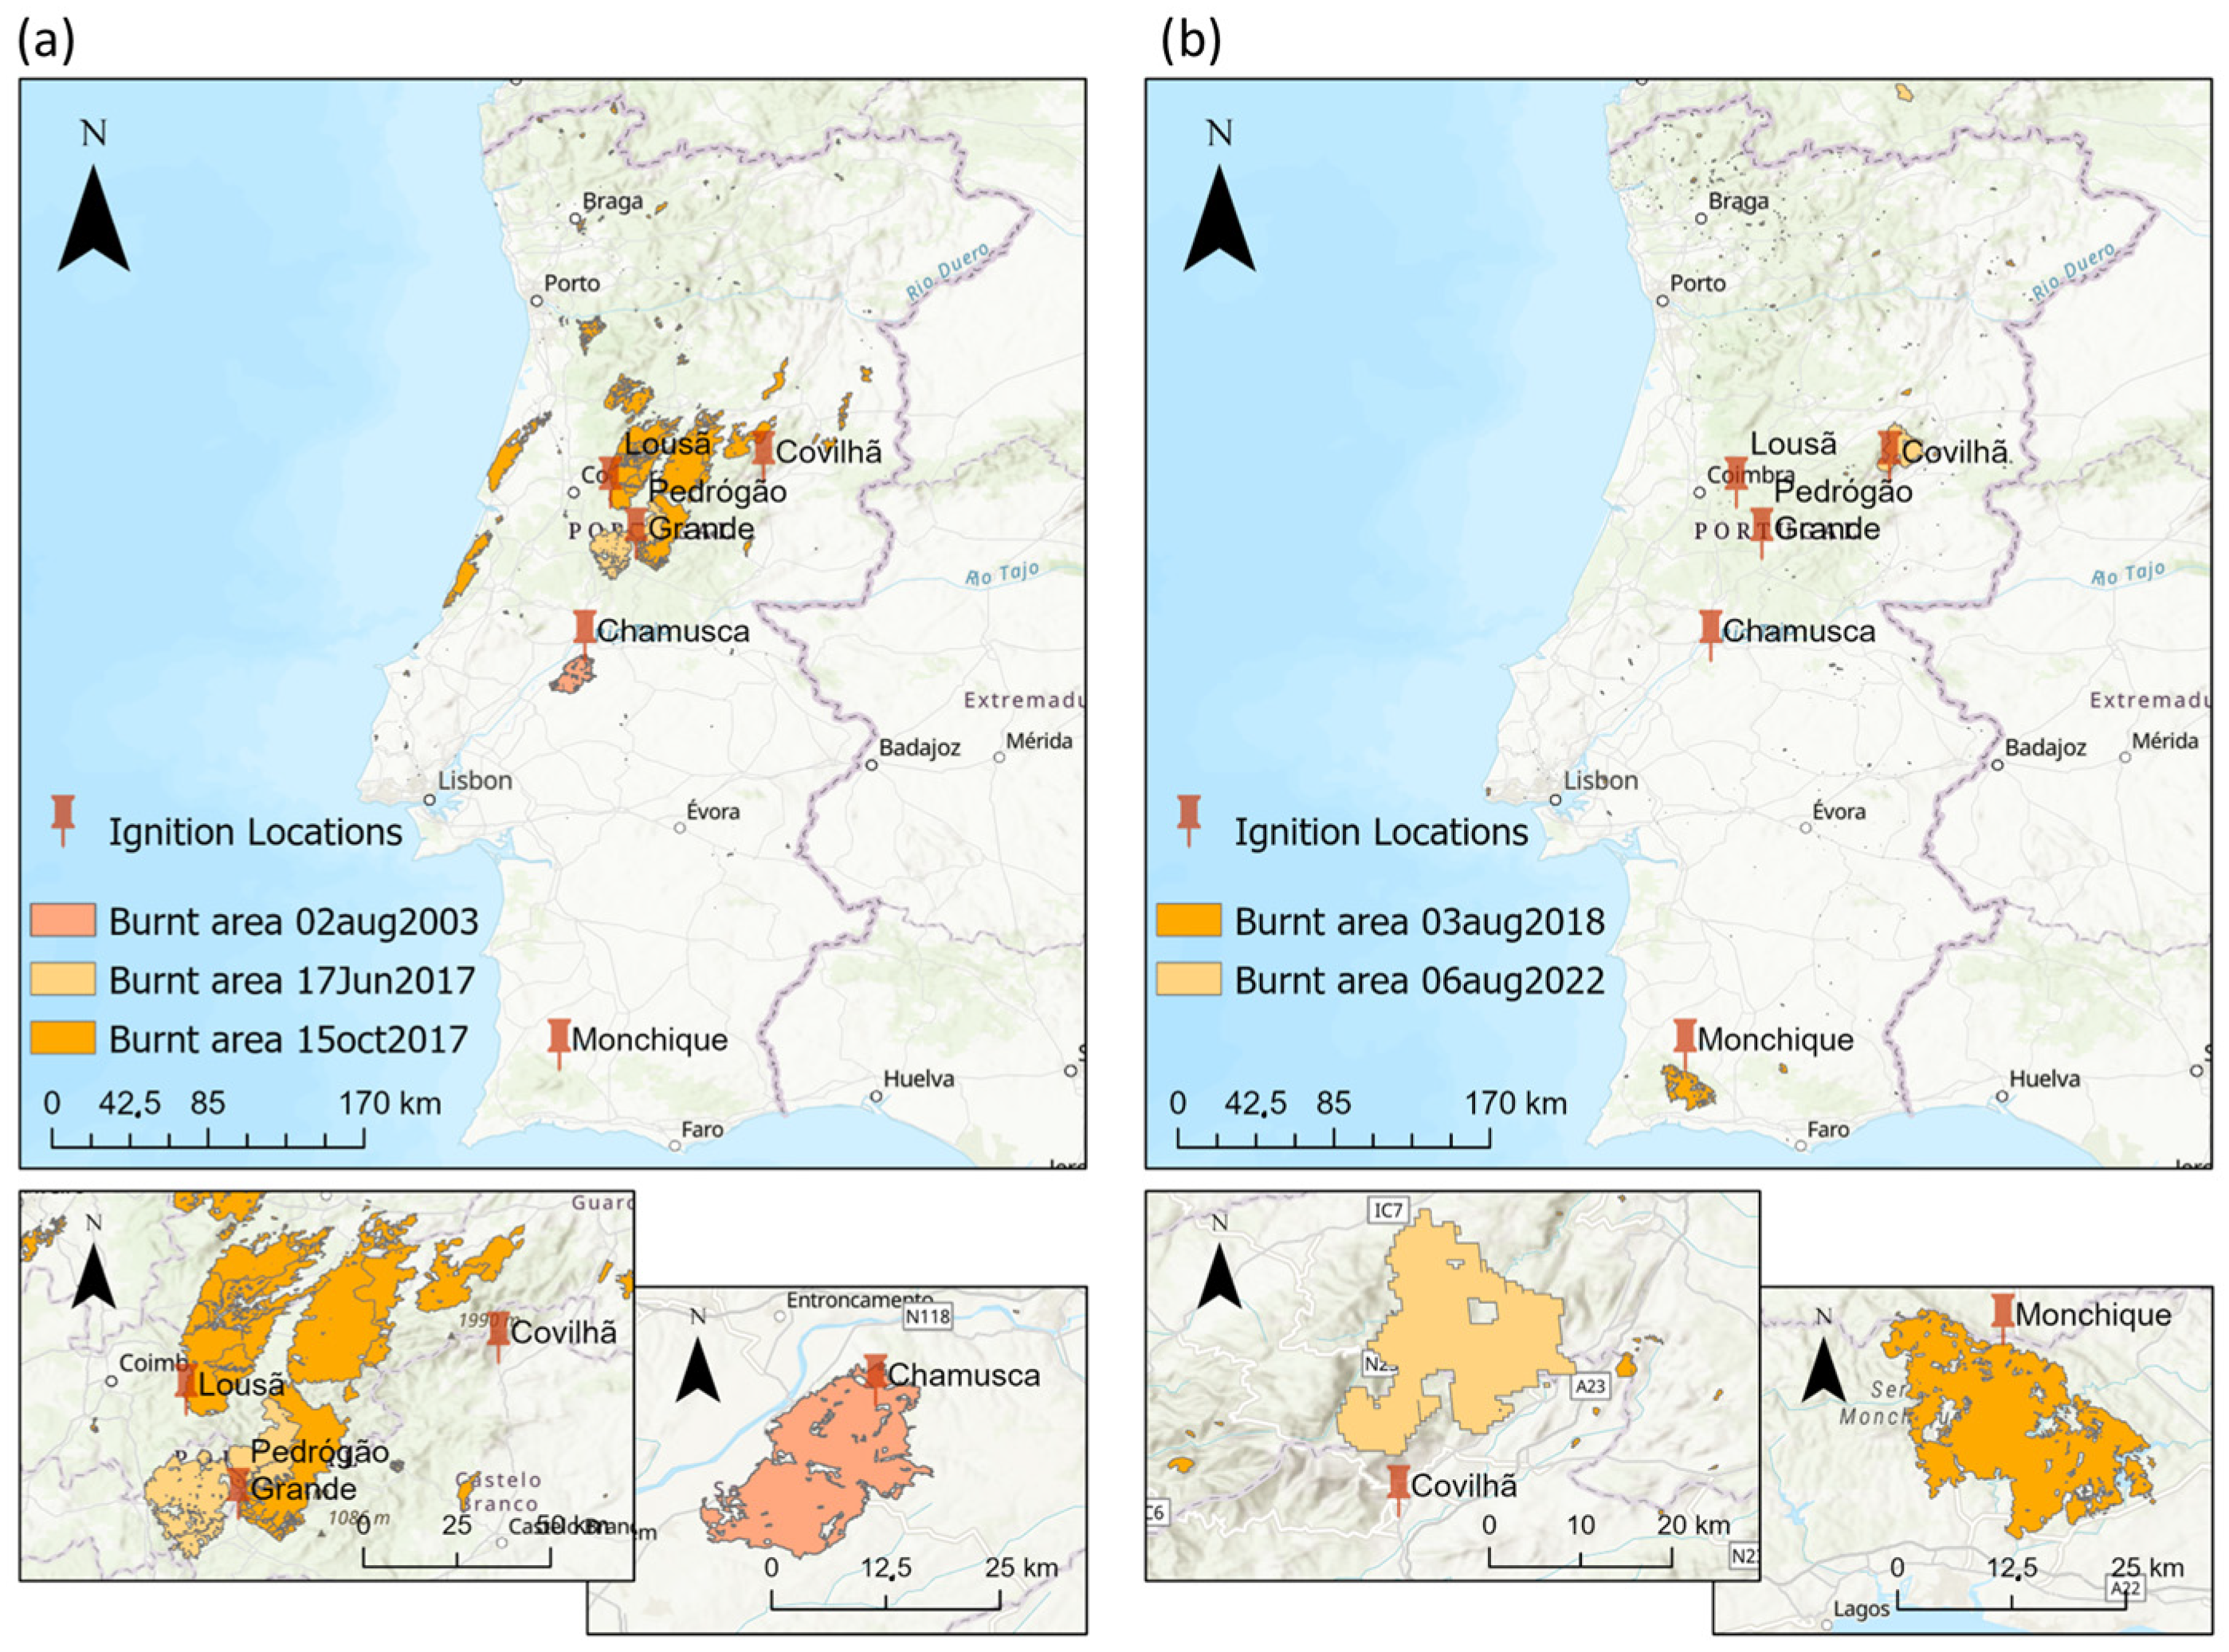
Figure 2. Burnt areas for the historical fires (a) 2 August 2003, 17 June 2017, 15 October 2017, and (b) 3 August 2018, 6 August 2022 [16,17,18].
Forests 16 01417 g002
Figure 3. Schematics of this study workflow.
Forests 16 01417 g003
Figure 4. Hourly evolution of the Hot–Dry–Windy (HDW) index at the ignition location of the Chamusca 2003 wildfire (8.375° W, 39.375° N). Blue dots indicate daily HDW values during 2003, overlaid on the climatological HDW percentiles (1991–2020) at: (a) 06 UTC, (b) 09 UTC, (c) 12 UTC, (d) 15 UTC, (e) 18 UTC, and (f) 21 UTC. Shaded areas represent the 25th, 50th, 75th, 90th, and 95th percentiles, highlighting sub-daily variability in HDW behaviour relative to long-term climatology.
Forests 16 01417 g004
Figure 5. Hot–Dry–Windy (HDW) index evolution during the 15-day window surrounding the Chamusca 2003 fire (26 July to 9 August), at the ignition location (8.375° W, 39.375° N). The HDW daily values (dashed black line) are shown for (a) 09 UTC, (b) 12 UTC, (c) 15 UTC, and (d) 18 UTC, superimposed on the HDW climatological percentiles (shaded bands: 25th, 50th, 75th, 90th, 95th) from 1991 to 2020. The peak on 2 August corresponds to the fire ignition day, highlighting its extremeness relative to long-term variability.
Forests 16 01417 g005
Figure 6. Probability (%) of the Hot–Dry–Windy (HDW) index exceeding the 90th percentile on 2 August 2003—the ignition date of the Chamusca fire. Panels (ad) illustrate HDW exceedance probabilities at 09 UTC, 12 UTC, 15 UTC, and 18 UTC, respectively. Colored contours highlight areas with elevated fire-weather conditions, while ignition points for Chamusca, Lousã, and Pedrógão Grande are shown for spatial context.
Forests 16 01417 g006
Figure 7. Hourly evolution of the Hot–Dry–Windy (HDW) index at the ignition location of the Pedrógão Grande wildfire (8.125° W, 39.875° N). Blue dots indicate daily HDW values during 2017, overlaid on the climatological HDW percentiles (1991–2020) at: (a) 06 UTC, (b) 09 UTC, (c) 12 UTC, (d) 15 UTC, (e) 18 UTC, and (f) 21 UTC. Shaded areas represent the 25th, 50th, 75th, 90th, and 95th percentiles, highlighting sub-daily variability in HDW behaviour relative to long-term climatology.
Forests 16 01417 g007
Figure 8. Hot–Dry–Windy (HDW) index evolution during the 15-day window surrounding the Pedrógão 2017 fire (10 June to 24 June), at the ignition location (8.125° W, 39.875° N). The HDW daily values (dashed black line) are shown for (a) 09 UTC, (b) 12 UTC, (c) 15 UTC, and (d) 18 UTC, superimposed on the HDW climatological percentiles (shaded bands: 25th, 50th, 75th, 90th, 95th) from 1991 to 2020. The ignition date (17 June) coincides with a sharp HDW peak, especially at 15 UTC, exceeding the 95th percentile threshold.
Forests 16 01417 g008
Figure 9. Probability (%) of the Hot–Dry–Windy (HDW) index exceeding the 90th percentile on 17 June 2017—the ignition date of the Pedrógão Grande fire. Panels (ad) illustrate HDW exceedance probabilities at 09 UTC, 12 UTC, 15 UTC, and 18 UTC, respectively. Colored contours highlight areas with elevated fire-weather conditions, while ignition points for Chamusca, Lousã, and Pedrógão Grande are shown for spatial context.
Forests 16 01417 g009
Figure 10. Hourly evolution of the Hot–Dry–Windy (HDW) index at the ignition location of the Lousã 2017 wildfire (8.25° W, 40.125° N). Blue dots indicate daily HDW values during 2017, overlaid on the climatological HDW percentiles (1991–2020) at: (a) 06 UTC, (b) 09 UTC, (c) 12 UTC, (d) 15 UTC, (e) 18 UTC, and (f) 21 UTC. Shaded areas represent the 25th, 50th, 75th, 90th, and 95th percentiles, highlighting sub-daily variability in HDW behaviour relative to long-term climatology.
Forests 16 01417 g010
Figure 11. Hot–Dry–Windy (HDW) index evolution during the 15-day window surrounding the Lousã 2017 fire (6–22 October), at the ignition location (8.25° W, 40.125° N). The HDW daily values (dashed black line) are shown for (a) 09 UTC, (b) 12 UTC, (c) 15 UTC, and (d) 18 UTC, superimposed on the HDW climatological percentiles (shaded bands: 25th, 50th, 75th, 90th, 95th) from 1991 to 2020. The ignition date (15 October) coincides with a sharp HDW peak, exceeding the 95th percentile threshold.
Forests 16 01417 g011
Figure 12. Probability (%) of the Hot–Dry–Windy (HDW) index exceeding the 90th percentile on 15 October 2017—the ignition date of the Lousã fire. Panels (ad) illustrate HDW exceedance probabilities at 09 UTC, 12 UTC, 15 UTC, and 18 UTC, respectively. Colored contours highlight areas with elevated fire-weather conditions, while ignition points for Chamusca, Lousã, and Pedrógão Grande are shown for spatial context.
Forests 16 01417 g012
Figure 13. Hourly evolution of the Hot–Dry–Windy (HDW) index at the ignition location of the Monchique 2018 wildfire (8.5° W, 37.375° N). Blue dots indicate daily HDW values during 2018, overlaid on the climatological HDW percentiles (1991–2020) at: (a) 06 UTC, (b) 09 UTC, (c) 12 UTC, (d) 15 UTC, (e) 18 UTC, and (f) 21 UTC. Shaded areas represent the 25th, 50th, 75th, 90th, and 95th percentiles, highlighting sub-daily variability in HDW behaviour relative to long-term climatology.
Forests 16 01417 g013
Figure 14. Hot–Dry–Windy (HDW) index evolution during the 15-day window surrounding the Monchique 2018 fire (27 July to 10 August), at the ignition location (8.5° W, 37.375° N). The HDW daily values (dashed black line) are shown for (a) 09 UTC, (b) 12 UTC, (c) 15 UTC, and (d) 18 UTC, superimposed on the HDW climatological percentiles (shaded bands: 25th, 50th, 75th, 90th, 95th) from 1991 to 2020. The ignition date (3 August) coincides with a sharp HDW peak, exceeding the 95th percentile threshold at 18 UTC.
Forests 16 01417 g014
Figure 15. Probability (%) of the Hot–Dry–Windy (HDW) index exceeding the 90th percentile on 3 August 2018—the ignition date of the Monchique fire. Panels (ad) illustrate HDW exceedance probabilities at 09 UTC, 12 UTC, 15 UTC, and 18 UTC, respectively. Colored contours highlight areas with elevated fire-weather conditions, while ignition points for Chamusca, Lousã, and Pedrógão Grande are shown for spatial context.
Forests 16 01417 g015
Figure 16. Hourly evolution of the Hot–Dry–Windy (HDW) index at the ignition location of the Covilhã 2022 wildfire (7.5° W, 40.25° N). Blue dots indicate daily HDW values during 2022, overlaid on the climatological HDW percentiles (1991–2020) at: (a) 06 UTC, (b) 09 UTC, (c) 12 UTC, (d) 15 UTC, (e) 18 UTC, and (f) 21 UTC. Shaded areas represent the 25th, 50th, 75th, 90th, and 95th percentiles, highlighting sub-daily variability in HDW behaviour relative to long-term climatology.
Forests 16 01417 g016
Figure 17. Hot–Dry–Windy (HDW) index evolution during the 15-day window surrounding the Covilhã 2022 fire (30 July to 13 August), at the ignition location (7.5° W, 40.25° N). The HDW daily values (dashed black line) are shown for (a) 09 UTC, (b) 12 UTC, (c) 15 UTC, and (d) 18 UTC, superimposed on the HDW climatological percentiles (shaded bands: 25th, 50th, 75th, 90th, 95th) from 1991–2020.
Forests 16 01417 g017
Figure 18. Daily HDW (blue line) and FWI (orange line) values at 12 UTC for a 15-day window surrounding the ignition date of each major wildfire event: (a) 2 August 2003 (Chamusca), (b) 17 June 2017 (Pedrógão Grande), (c) 15 October 2017 (Lousã), (d) 3 August 2018 (Monchique), and (e) 6 August 2022 (Covilhã). The vertical grey line marks the ignition date. The dashed horizontal line at FWI = 50 indicates “Very High” to “Extreme” fire danger levels (>50) based on Table 3.
Forests 16 01417 g018
Table 3. Fire Weather Index (FWI) scale and interpretation.
FWIInterpretation
0–8.5Very low
8.5–17.3Low
17.3–24.7Moderate
24.7–38.3High
38.3–50.1Very high
50.1–64Extreme/Maximum
>64
Table 4. Percentile-based classification of HDW values across four daily time steps (09 UTC, 12 UTC, 15 UTC, and 18 UTC) for the ignition days of five major wildfire events in Portugal. Color shading represents the HDW intensity level: from light (P50) to dark (>P95), illustrating the temporal progression of fire-conducive atmospheric conditions.
Fire Event09 UTC12 UTC15 UTC18 UTC
Chamusca 2003P95>P95>P95P95
Pedrógão 2017P50P90>P95P90
Lousã 2017>P95>P95>P95>P95
Monchique 2018>P95>P95P90P50
Covilhã 2022P75P90P90P90
Table 5. Summary of Hot–Dry–Windy (HDW) and Fire Weather Index (FWI) values at 12 UTC and corresponding duration of exceedance above critical thresholds for five major wildfire events in Portugal. HDW exceedance is based on the 90th percentile climatology, while FWI is evaluated against the operational fire danger threshold of 50. The table indicates whether each index surpassed its threshold at the time of ignition and the number of consecutive days each remained elevated, reflecting both the intensity and persistence of fire-conducive conditions.
Event (Date)RegionHDW
at Ignition
FWI
at Ignition
InterpretationFWI
Duration > 50 (Days)
Chamusca (2 August 2003)Santarém363.5765.16Extreme4
Pedrógão (17 June 2017)Leiria/Castelo Branco88.6139.53Very high2
Lousã (15 October 2017)Coimbra193.7035.96High1
Monchique (3 August 2018)Algarve222.0764.57Extreme5
Covilhã (6 August 2022)Serra da Estrela77.9453.24Extreme6
Table 6. Spearman rank correlation (ρ) between Hot–Dry–Windy (HDW) Index and Fire Weather Index (FWI) values at 12 UTC during five major wildfire events in Portugal. Correlation strength and statistical significance (α = 0.05) are interpreted alongside the consistency or divergence between HDW and FWI trends. The table emphasizes each index’s role in capturing fire danger signals and their potential complementarity.
Fire EventSpearman rho
(HDW vs. FWI)
p-ValueInterpretation
Chamusca 20030.52500.0471Moderate positive correlation, statistically significant at α = 0.05. HDW and FWI concurrently before ignition, capturing the fire danger consistently. This suggests some agreement between HDW and FWI trends but also highlights periods where they diverge.
Pedrógão Grande 20170.72500.0031Strong positive correlation and statistically significant, showing that FWI and HDW co-varied closely, supporting a robust alignment of both indices during this event.
Lousã 20170.50.0602Moderate positive correlation, with no significance, showing that FWI and HDW co-varied closely, indicating some decoupling between HDW and FWI.
Monchique 20180.68570.0062Moderate-to-strong, significant positive correlation, indicating that HDW and FWI consistently reflected elevated fire danger. This case strengthens confidence in the compound indicator coherence.
Covilhã 2022−0.16790.5493Weak negative correlation, not statistically significant, highlighting an inverse relationship. FWI remained high while HDW declined, revealing sensitivity to different fire weather drivers. This implies that the HDW peak did not coincide with FWI extremes, again suggesting that HDW adds unique information not captured by FWI.
Disclaimer/Publisher’s Note: The statements, opinions and data contained in all publications are solely those of the individual author(s) and contributor(s) and not of MDPI and/or the editor(s). MDPI and/or the editor(s) disclaim responsibility for any injury to people or property resulting from any ideas, methods, instructions or products referred to in the content.