Article

Effect of Differential Growth Dynamics Among Dominant Species Regulates Species Diversity in Subtropical Forests: Empirical Evidence from the Mass Ratio Hypothesis

1
College of Forestry, Fujian Agriculture and Forestry University, Shangxiadian Road 15, Fuzhou 350002, China
2
Guangdong Provincial Key Laboratory of Applied Botany, Key Laboratory of National Forestry and Grassland Administration on Plant Conservation and Utilization in Southern China, South China Botanical Garden, Chinese Academy of Sciences, Xingke Road 723, Guangzhou 510650, China
3
Shaowu Helin State-Owned Forest Farm Company Limited, Wusi Road 6, Shaowu 354000, China
4
Fujian Forestry Survey and Design Institute, Fuzhong Road 118, Fuzhou 350001, China
*
Authors to whom correspondence should be addressed.
Forests 2025, 16(8), 1357; https://doi.org/10.3390/f16081357
Submission received: 12 June 2025 / Revised: 29 July 2025 / Accepted: 15 August 2025 / Published: 21 August 2025

Abstract

The Mass Ratio Hypothesis states that the growth dynamics of dominant species influence forest species diversity by regulating the niches of subordinate and transient species. However, this prediction has not yet been empirical confirmed in subtropical forests over long term. Using data from 1995 to 2017, we examined how dominant tree species regulate species evenness and richness by analyzing their height and diameter growth in three clear-cut forests (Castanopsis carlesii (Hemsl.) Hayata, Castanopsis fissa (Champ. ex Benth.) Rehder & E. H. Wilson, and Cunninghamia lanceolata (Lamb.) Hook. stands), combined with the mean value of species niche breadth (measures the diversity of resources a species utilizes) across the community, including separate analyzes for subordinate (persistently coexisting with dominants species) and transient species (temporarily occurring species). Our results showed that an increase in height and diameter growth of dominant species had a negative effect on niche breadth of subordinate species, which in turn reduced species evenness (p < 0.01) but showed no significant relationship with species richness (p ≥ 0.05). Growth dynamics of dominants had no significant influence on the niche breadth of transient species. The early-fast growing dominant C. lanceolata significantly restricted the niche breadth of subordinate species (1.16 ± 0.23), resulting in relatively low evenness (0.49 ± 0.11). Conversely, the late-fast growing dominant C. carlesii promoted niche expansion (6.62 ± 1.20), resulting in higher evenness (0.81 ± 0.02). C. fissa -dominated strands with intermediate growth increments, exhibited moderate species evenness. These findings provide long-term empirical support for the Mass Ratio Hypothesis by demonstrating that growths of dominant species modulate niche partitioning in subordinates and thereby shape species diversity in subtropical forest communities.

1. Introduction

The restoration of biodiversity in disturbed forests is essential for maintenance of ecosystem functions and services [1,2]. This restoration process involves complex ecological mechanisms, including abiotic filters, dispersal limitation and source effects, as well as species interactions [3,4,5,6,7]. Within the domain of species interactions, the Mass Ratio Hypothesis remains a central framework [8,9]. Grime’s theory posits that ecosystem processes are primarily governed by the biological traits of dominant species [10,11,12]. For instance, the height and diameter growth of dominant species may alter understory microenvironments, thereby shaping species coexistence patterns and community diversity [13,14,15,16]. Despite the theoretical and practical significance of understanding how the growth dynamics of dominant species influence biodiversity, empirical knowledge on this relationship remains scarce [17,18]. This knowledge gap substantially hinders the formulation of sustainable management strategies.
According to Grime’s theory, the regulatory effects of dominant tree species on forest biodiversity are primarily expressed through their dual influence on the ecological niches of subordinate species and transient species. Subordinate species, though consistently present in the community, are not dominant and often exploit unoccupied resources through niche complementarity with dominant species [19]. Transient species, on the other hand, are typical opportunists that depend on disturbance events, especially the period before dominant trees achieve full canopy closure, to expand their ecological niches [8]. The theory predicts that there are two main consequences when dominant species have strategies for early and fast growth. First, stronger resource competition narrows the niche breadth available of subordinate species [20]. Second, rapid canopy closure shortens the window during which transient species can access light and space [21]. In contrast, when dominant species grow later and more slowly, these two regulatory pathways may promote species diversity [22]. Although these predictions are theoretically compelling and supported by short-term studies of ecosystem recovery [6,23,24,25,26], there is limited long-term evidence [19]. Some changes in species diversity, such as increases in species evenness, may take decades to manifest following disturbance [27]. Thus, understanding how the growth dynamics of dominant species regulate species diversity requires long-term ecological monitoring, which can clarify how shifts in subordinate and transient niches influence species diversity.
In subtropical regions, forests are dominated by late-fast growing and early-fast growing tree species. Compared to late-fast growing species, early-fast growing species typically reach rapid growth phases in height and diameter at earlier stage [28,29,30,31]. Based on the Mass Ratio Hypothesis, these differences in growth increments may influence forest species diversity by altering resource niches available to subordinate species [8,20] and changing the temporal window during which transient species can expand their ecological niches [21]. Existing studies generally support that early-fast growing forests tend to have lower species diversity compared to those dominated by late-fast growing species [32,33,34]. However, most studies have attributed these differences primarily to regeneration modes [35,36], while potential role of dominant species growth dynamics, particularly height and diameter, in shaping diversity patterns has received little attention [37,38]. This gap limits our ability to effectively guide forest ecosystem restoration and sustainable management.
To address this, we stduied subtropical forests in eastern China to (i) assess how the growth strategies of dominant tree species influence the recovery of species diversity and (ii) explore the underlying mechanisms based on changes in niche breadth of subordinate and transient species. We established 216 plots (5 × 5 m) across three clear-cut forests [39,40], each dominated by one of the three tree species with distinct growth increments: C. carlesii (late-fast growing), C. fissa (intermediate-fast growing), and C. lanceolata (early-fast growing). Forest regeneration was monitored from 1995 to 2017 through repeated community inventories and destructive sampling of dominant species in 2019 quantified their growth dynamics.Based on Grime’s theory [8] and the known growth patterns of subtropical tree species [28,30], we hypothesized that (i) late-fast growing species would be more effectively to restore species richness and evenness than early-fast growing dominant species, because their delayed diameter growth reduces competition for resources, while their late height growth postpones canopy closure, thereby promoting species coexistence; and (ii) dominant species influence forest species diversity by simultaneously modifying the niche breadths of subordinate and transient species.

2. Materials and Methods

2.1. Study Area

The study site is located in Wuping County, Fujian Province, at the southernmost extent of the Wuyi Mountains (25°9′ N, 116°4′ E), with elevations ranging from 400 to 650 m. The region lies at at the southern boundary boundary of the mid-subtropical zone, where the South Subtropical Rainforest and Mid-Subtropical Evergreen Broadleaf Forest vegetation zones converge. It has a mean annual temperature of 18.2 °C, average annual precipitation of 1542 mm, and mean relative humidity of 80% [39]. Under natural conditions, the tree layer is dominated by species plants such as C. carlesii, Castanopsis fargesii Franch., Pinus massoniana Lamb., Machilus versicolora S. K. Lee & F. N. Wei, and Elaeocarpus decipiens Hemsl. The shrub layer commonly includes like Syzygium buxifolium Hook. et Arn, Loropetalum chinense (R. Br.) Oliver, Sapium discolor (Champ.ex Benth.) Muell.-ARG., Rhaphiolepis indica (Linnaeus) Lindley, and Ilex pubescens Hook. et Arn. The herbaceous layer is dominated by Dicranopteris dichotoma (Houtt.) Nakaike, Gahnia tristis Nees, and Alpinia japonica Hayata [40].

2.2. Experiment Design and Surveys

This experiment began in February 1993 with pre-logging assessments of community structure in permanent plots [41]. Clear-cutting was carried out in 1994 using chainsaws for tree felling and bucking, and with logs removed by skidder tractors. Following slash-and-burn treatment, three different regeneration strategies were applied. In the C. carlesii forest, regeneration was left to occur naturally without further human intervention. The canopy is characterized by C. fargesii, C. fissa, M. versicolora, and Castanopsis faberi Hance. Typical shrub species include S. buxifolium, Tarenna mollissima (Hook. et Arn.) Robins., and I. pubescens, while herbaceous species include G. tristis and Woodwardia japonica (L. f.) Sm. In the C. fissa forest, regeneration was assisted—naturally regenerated C. fissa seedlings were retained as much as possible while fewer than 300 stems ha−1 of C. lanceolata were planted. From 1995 to 1998, brush clearing was conducted every May, including cutting woody shrubs at ground level and trimming herbaceous vegetation to a height of less than 5 cm. Typical tree species in this forest include C. lanceolata, Choerospondias axillaris (Roxb.) B. L. Burtt & A. W. Hill, C. carlesii, and C. faberi. The shrub layer is dominated by Pseudosasa cantori (Munro) Keng f. and T. mollissima, while herbaceous species are presented by Dicranopteris pedata and W. japonica. In the C. lanceolata forest, regeneration was entirely artificial. From September to December 1994, surface vegetation (logging residues, shrubs, etc.) was removed and site preparation was carried out to a depth of 30–50 cm. In March to April 1995, C. lanceolata seedlings were planted at a density of 2500 stems ha−1. Brush clearing was conducted twice a year (May and September) from 1995 to 1998, within a radius of 0.5–1 m around each target tree. The dominant tree species in this forest are C. lanceolata and C. axillaris, with P. cantori dominating the shrub layer and D. pedata and W. japonica as representative herbaceous species. Perminant plot locations of these three types of forests are shown in Figure 1. Photos of forest landscapes and dominant tree species for each forest type can be found in the Supplementary Figure S1.
Vegetation surveys in the permanent plots were conducted in 1993 (pre-logging baseline), 1995, 1998, 2000, 2005, and 2017. All woody plants were identified using the Flora of China http://www.iplant.cn/foc (accessed from 1 June 2017 to 30 September 2017) and the taxonomic literature [42]. For each survey, individuals with a diameter at breast height (DBH) ≥ 2 cm and height (H) ≥ 2 m were tagged, mapped, and assigned unique identification numbers. Based on species ranking by basal area and abundance prior to clear-cutting, all species were classified into three functional groups: dominant, subordinate, and transient species [8,19]. Detailed classifications are provided in Supplementary Table S1.

2.3. Growth Analysis of Dominant Species

The analysis of the growth dynamics of height and diameter of dominant trees was conducted in October 2019. For this purpose, we harvested trees to examine their growth patterns. In order to minimize the disturbance of the permanent monitoring forests while fulfilling the minimum statistical requirements, three dominant trees were harvested from each forest plots of the C. carlesii, C. fissa, and C. lanceolata. We selected trees that were healthy, free of pests and diseases, located in the canopy layer, and whose diameter at breast height (DBH) and total height were close to the stand average. After felling, we measured the diameter at breast height (DBH), crown length, total tree height, and stem diameter at one-quarter, one-half, and three-quarters of total height. Stems were sectioned at 2-meter intervals; for basal segment, the central cross-section was used due to collar swelling. The tree age was determined from annual rings on breast-height disc [43] and cross-validated with DBH records from community surveys (see Figure S2 and Table S2 for details) and previous studies [44,45]. Due to the narrow and unclear tree-ring widths of C. carlesii and C. lanceolata during the first and second decades of monitoring, respectively (Supplementary Figure S2), the age interval was determined to be 2 years. In contrast, C. fissa exhibited consistently wider and clearer tree rings, allowing use of a 1 year interval. Diameters for each age class were measured directly from discs using a ruler. The age at each sampling height was calculated by subtracting the number of rings at that disc from the total tree age. Following Pretzsch [46], annual growth increments for tree height and DBH (θ) were calculated using the formula:
θ = ( V a V b ) / ( a b ) ,
where Vₐ and Vb is the tree height or cumulative radial growth at age a and b and a = 1, 2, …, n, b = 1, 2, …, n.

2.4. Statistical Analysis

Species diversity was assessed based on species richness and evenness. Species richness (S) was defined as the total number of woody plant species recorded across all forest plots (72 plots of 5 × 5 m each). Species evenness (J) was calculated using the following formula:
J = ( i = 1 S P i ln P i ) / l n S ,
where S is the total number of species, and Pi is the proportion of individuals of the i-th species relative to the total number of individuals [47].
Niche breadth (B) is calculated as:
B = 1 i = 1 n p i 2 ,
where pi is the relative abundance of a given species in the i-th plot, and n is the number of plots, i = 1,2,3…n [48].
To obtain data on the growth of dominant species corresponding to the temporal dynamics of niche breadth in associated and transient species, we divided the annual growth data of tree height and diameter at breast height (DBH) into three time periods corresponding to the community surveys: 1995–2000, 2000–2005, and 2005–2017. For each dominant species (C. carlesii, C. fissa, and C. lanceolata), the mean annual increments in tree height and DBH were calculated for each time period. Principal component analysis (PCA) was then used to evaluate how these two growth metrics influenced the mean niche breadth of associate and transient species. Subsequently, linear mixed-effects models (LMMs) were applied to examine the relationships between factor loadings on the first two principal component axes and species richness and evenness. The basic form of the model was:
y i j = β 0 + β 1 · x i j + μ i 1 + μ i 2 + ϵ i j ,
where y i j is the annual growth in height or DBH of the dominant tree species, x i j is the mean niche breadth of different functional groups, β 0 is the global intercept, β 1 is the fixed-effect coefficient. The random intercepts were specified as u i 1 ~ N ( 0 , σ u 2 ) representing temporal variation, and, u i 2 ~ N ( 0 , σ u 2 )   , representing the effect of different regeneration modes on species richness or evenness. The residual error was modeled as ϵ i ~ N ( 0 , σ 2 ) is the residual error term. Hierarchical partitioning analysis was further employed to estimate the relative contributions of dominant species growth dynamics, subordinate and transient mean niche breadth and regeneration mode to species diversity [49]. Model validation included tests for normality of residuals (Shapiro–Wilk test, p ≥ 0.05; confirmed by Q–Q plots) and homogeneity of variance (Levene’s test, p ≥ 0.05; no trends observed in residuals vs. fitted values). When assumptions of normality were violated (e.g., annual height and diameter growth of C. carlesii from 1995 to 2000, species richness, and species evenness; Shapiro–Wilk test, p < 0.05), non-parametric tests Kruskal–Wallis test were applied. These were used to compare annual height and diameter growth among dominant species across different time periods, as well as differences in average niche breadth of subordinate species, average niche breadth of temporary species, species richness, and species evenness among forest types. All statistical analyses were conducted using R software (v. 4.1.2), and all graphical outputs were generated using SigmaPlot (v. 14.0).

3. Results

3.1. Growth Dynamics of Three Dominant Tree Species

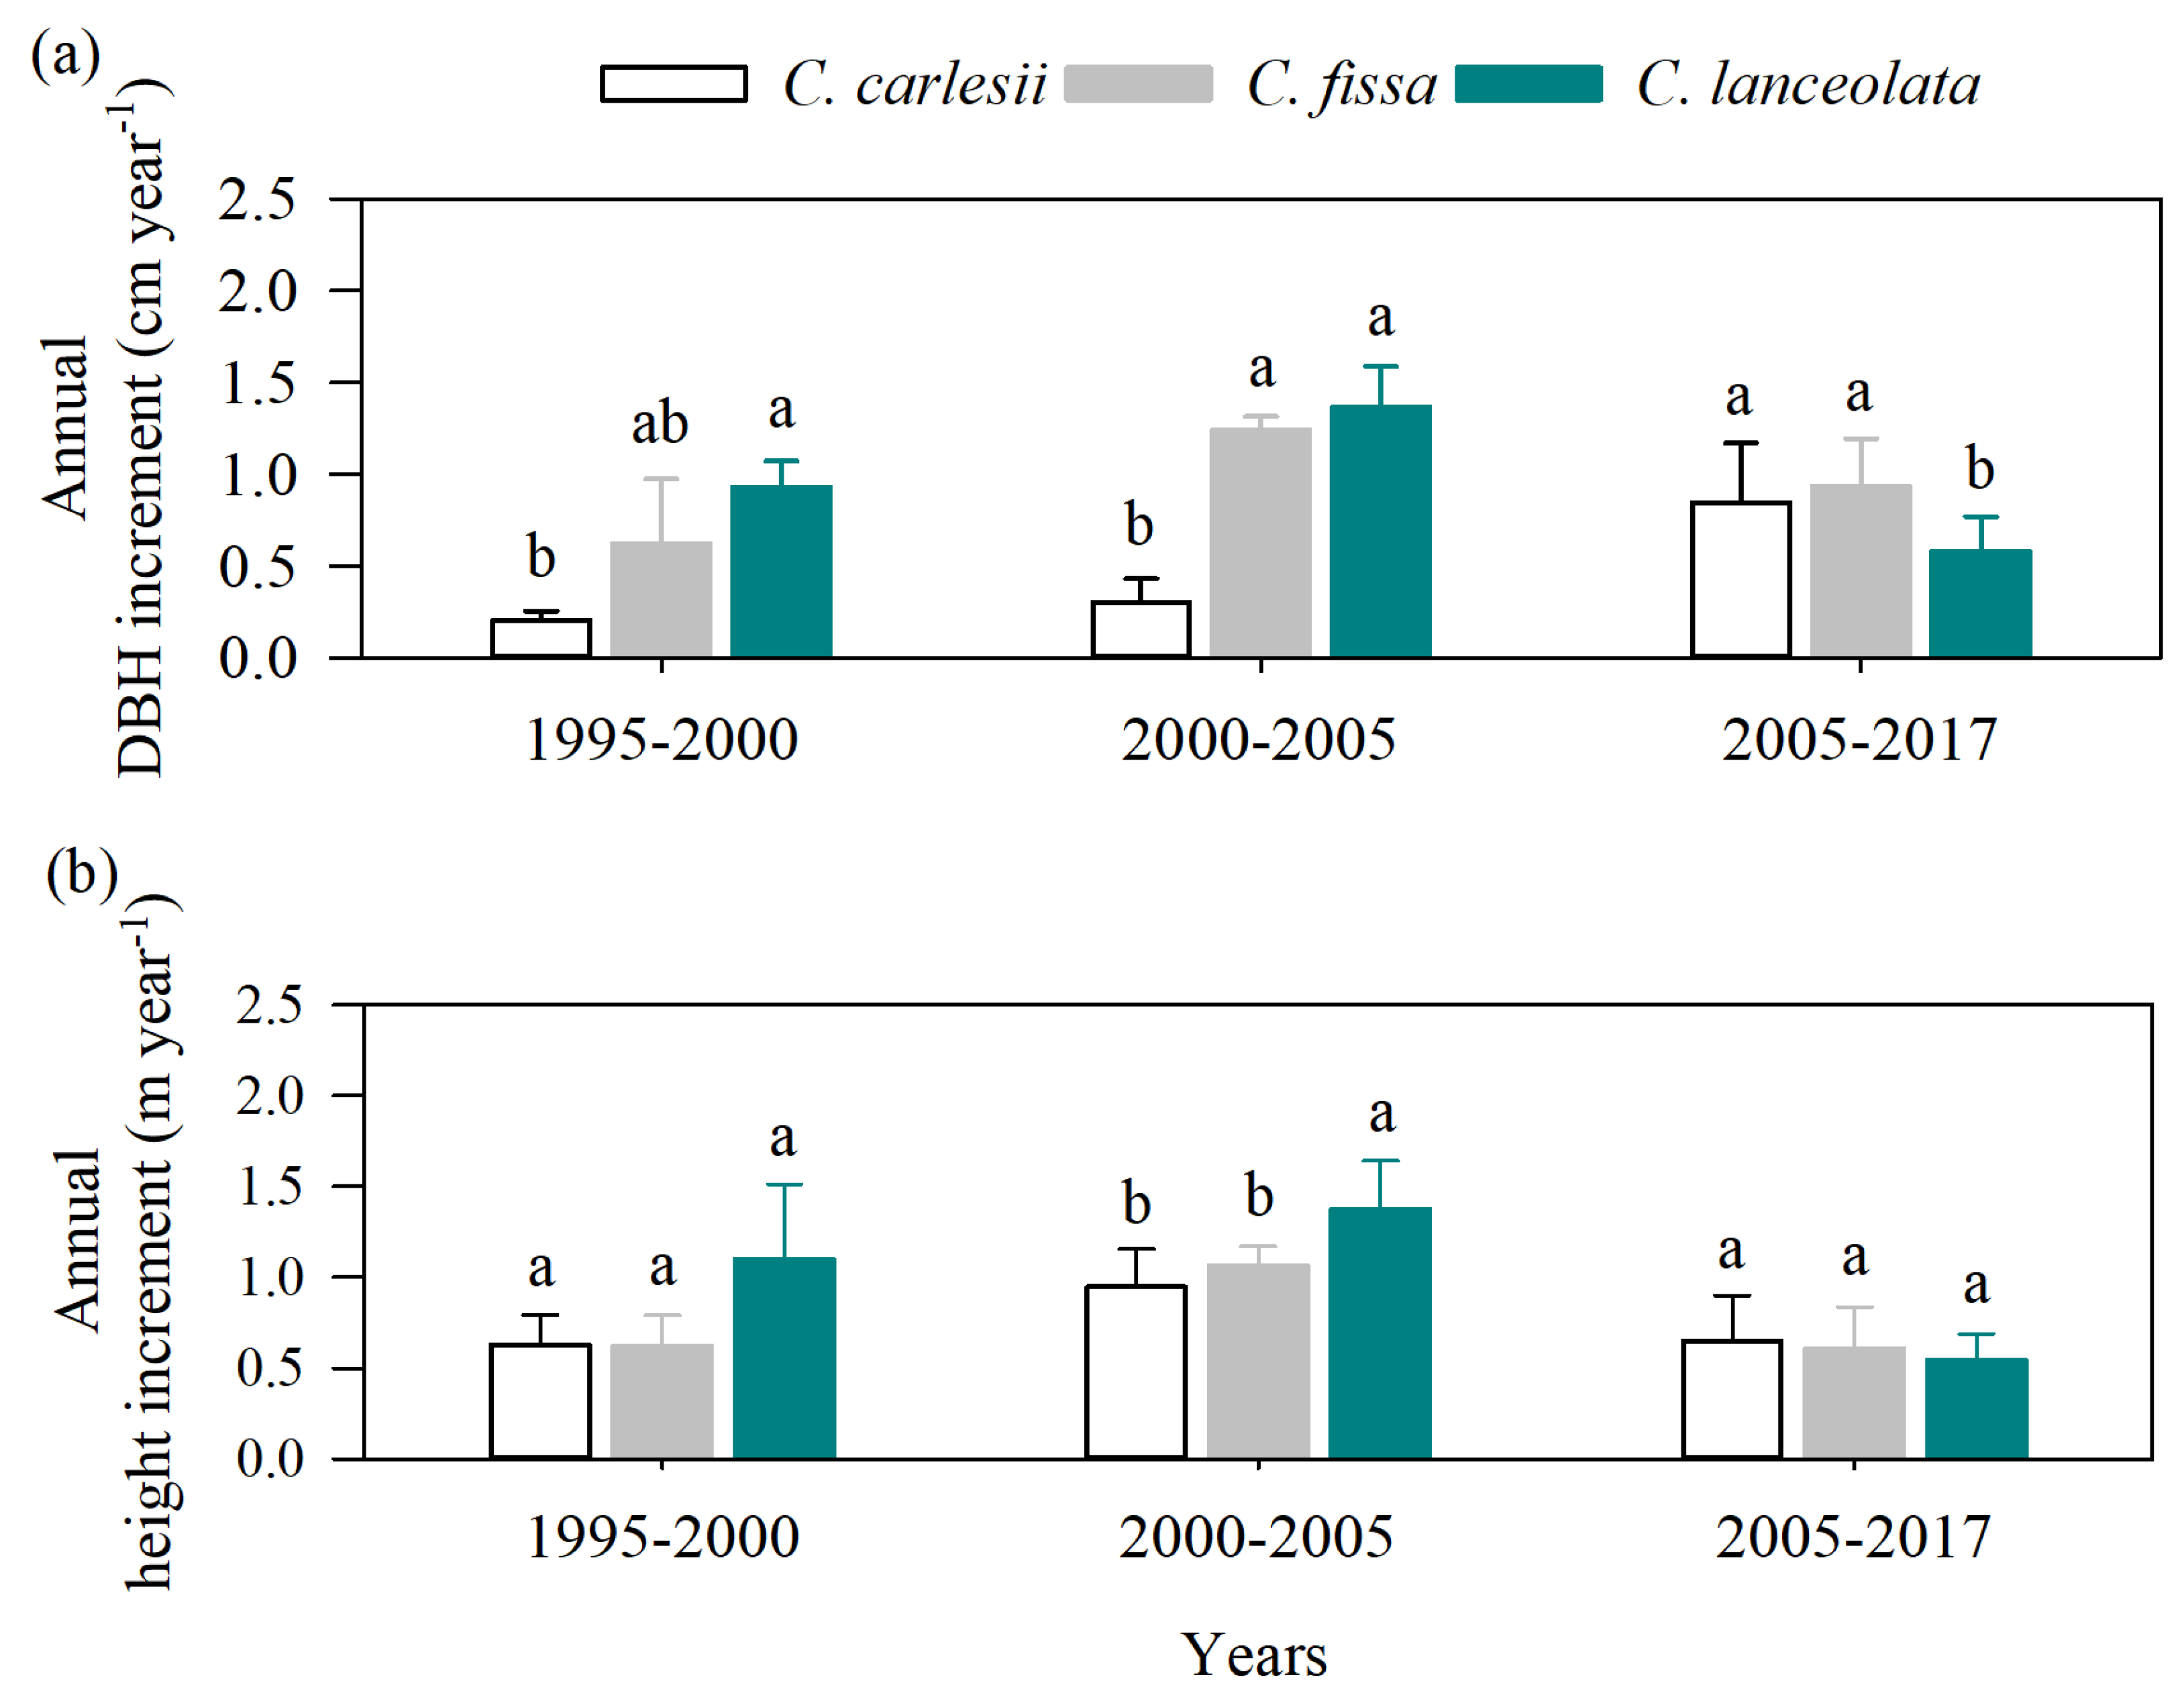
As shown in Figure 2a, C. lanceolata entered its rapid diameter growth phase earliest, followed by C. fissa, while C. carlesii entered last. This temporal differentiation resulted in distinct diameter growth dynamics among the three species from 1995 to 2017. During 1995–2000, C. lanceolata exhibited a clear advantage in annual diameter increment (0.93 ± 0.13 cm year−1; p < 0.05). Between 2000 and 2017, growth patterns reversed, with C. fissa gradually became dominant (2000–2005: 1.24 ± 0.07 cm year−1; 2005–2017: 0.93 ± 0.25 cm year−1). Meanwhile, C. carlesii accelerated (2000–2005: 0.30 ± 0.12 cm year−1; 2005–2017: 0.84 ± 0.32 cm year−1) but remained comparatively lower. In terms of height growth (Figure 2b), C. lanceolata also entered the fast-growth stage earlier than the other two species. Species differences were generally small, except during 2000–2005, when the annual height increment of C. lanceolata was significantly higher than that of C. fissa and C. carlesii (p < 0.05). These interspecific differences in diameter and height increment dynamics reflect distinct growth patterns: late-fast growth in C. carlesii, mid-fast growth in C. fissa, and early-fast growth in C. lanceolata.

3.2. Effect of Dominant Species Growth Dynamics on Subordinate and Transient Species Niche Breadth

Based on principal component analysis, we evaluated how differences in growth dynamics (height and diameter) among dominant tree species influence the mean niche breadths of subordinate and transient species. The first two principal components explained 97.63% of the total variance. The first principal component (PC1) accounted for 87.33% of the variation and primarily reflected the influence of dominants’ growth dynamics on the mean niche breadth of subordinate species (Figure 3a). The second principal component (PC2) explained 10.60% of the variation and, mainly represented the effects on the niche breadth of transient specie. The three dominant species were clearly separated along PC1 (Figure 3b,c). Compared to C. carlesii, which entered the fast growth phase later, the early-fast growth of C. lanceolata significantly reduced the mean niche breadth of subordinate species (see Supplementary Figure S3). In contrast, the effects of dominants growth dynamics on PC2 showed no significant differences among the species (Figure 3d).

3.3. Relationship Between Effect of Dominant Tree Growth and Species Diversity

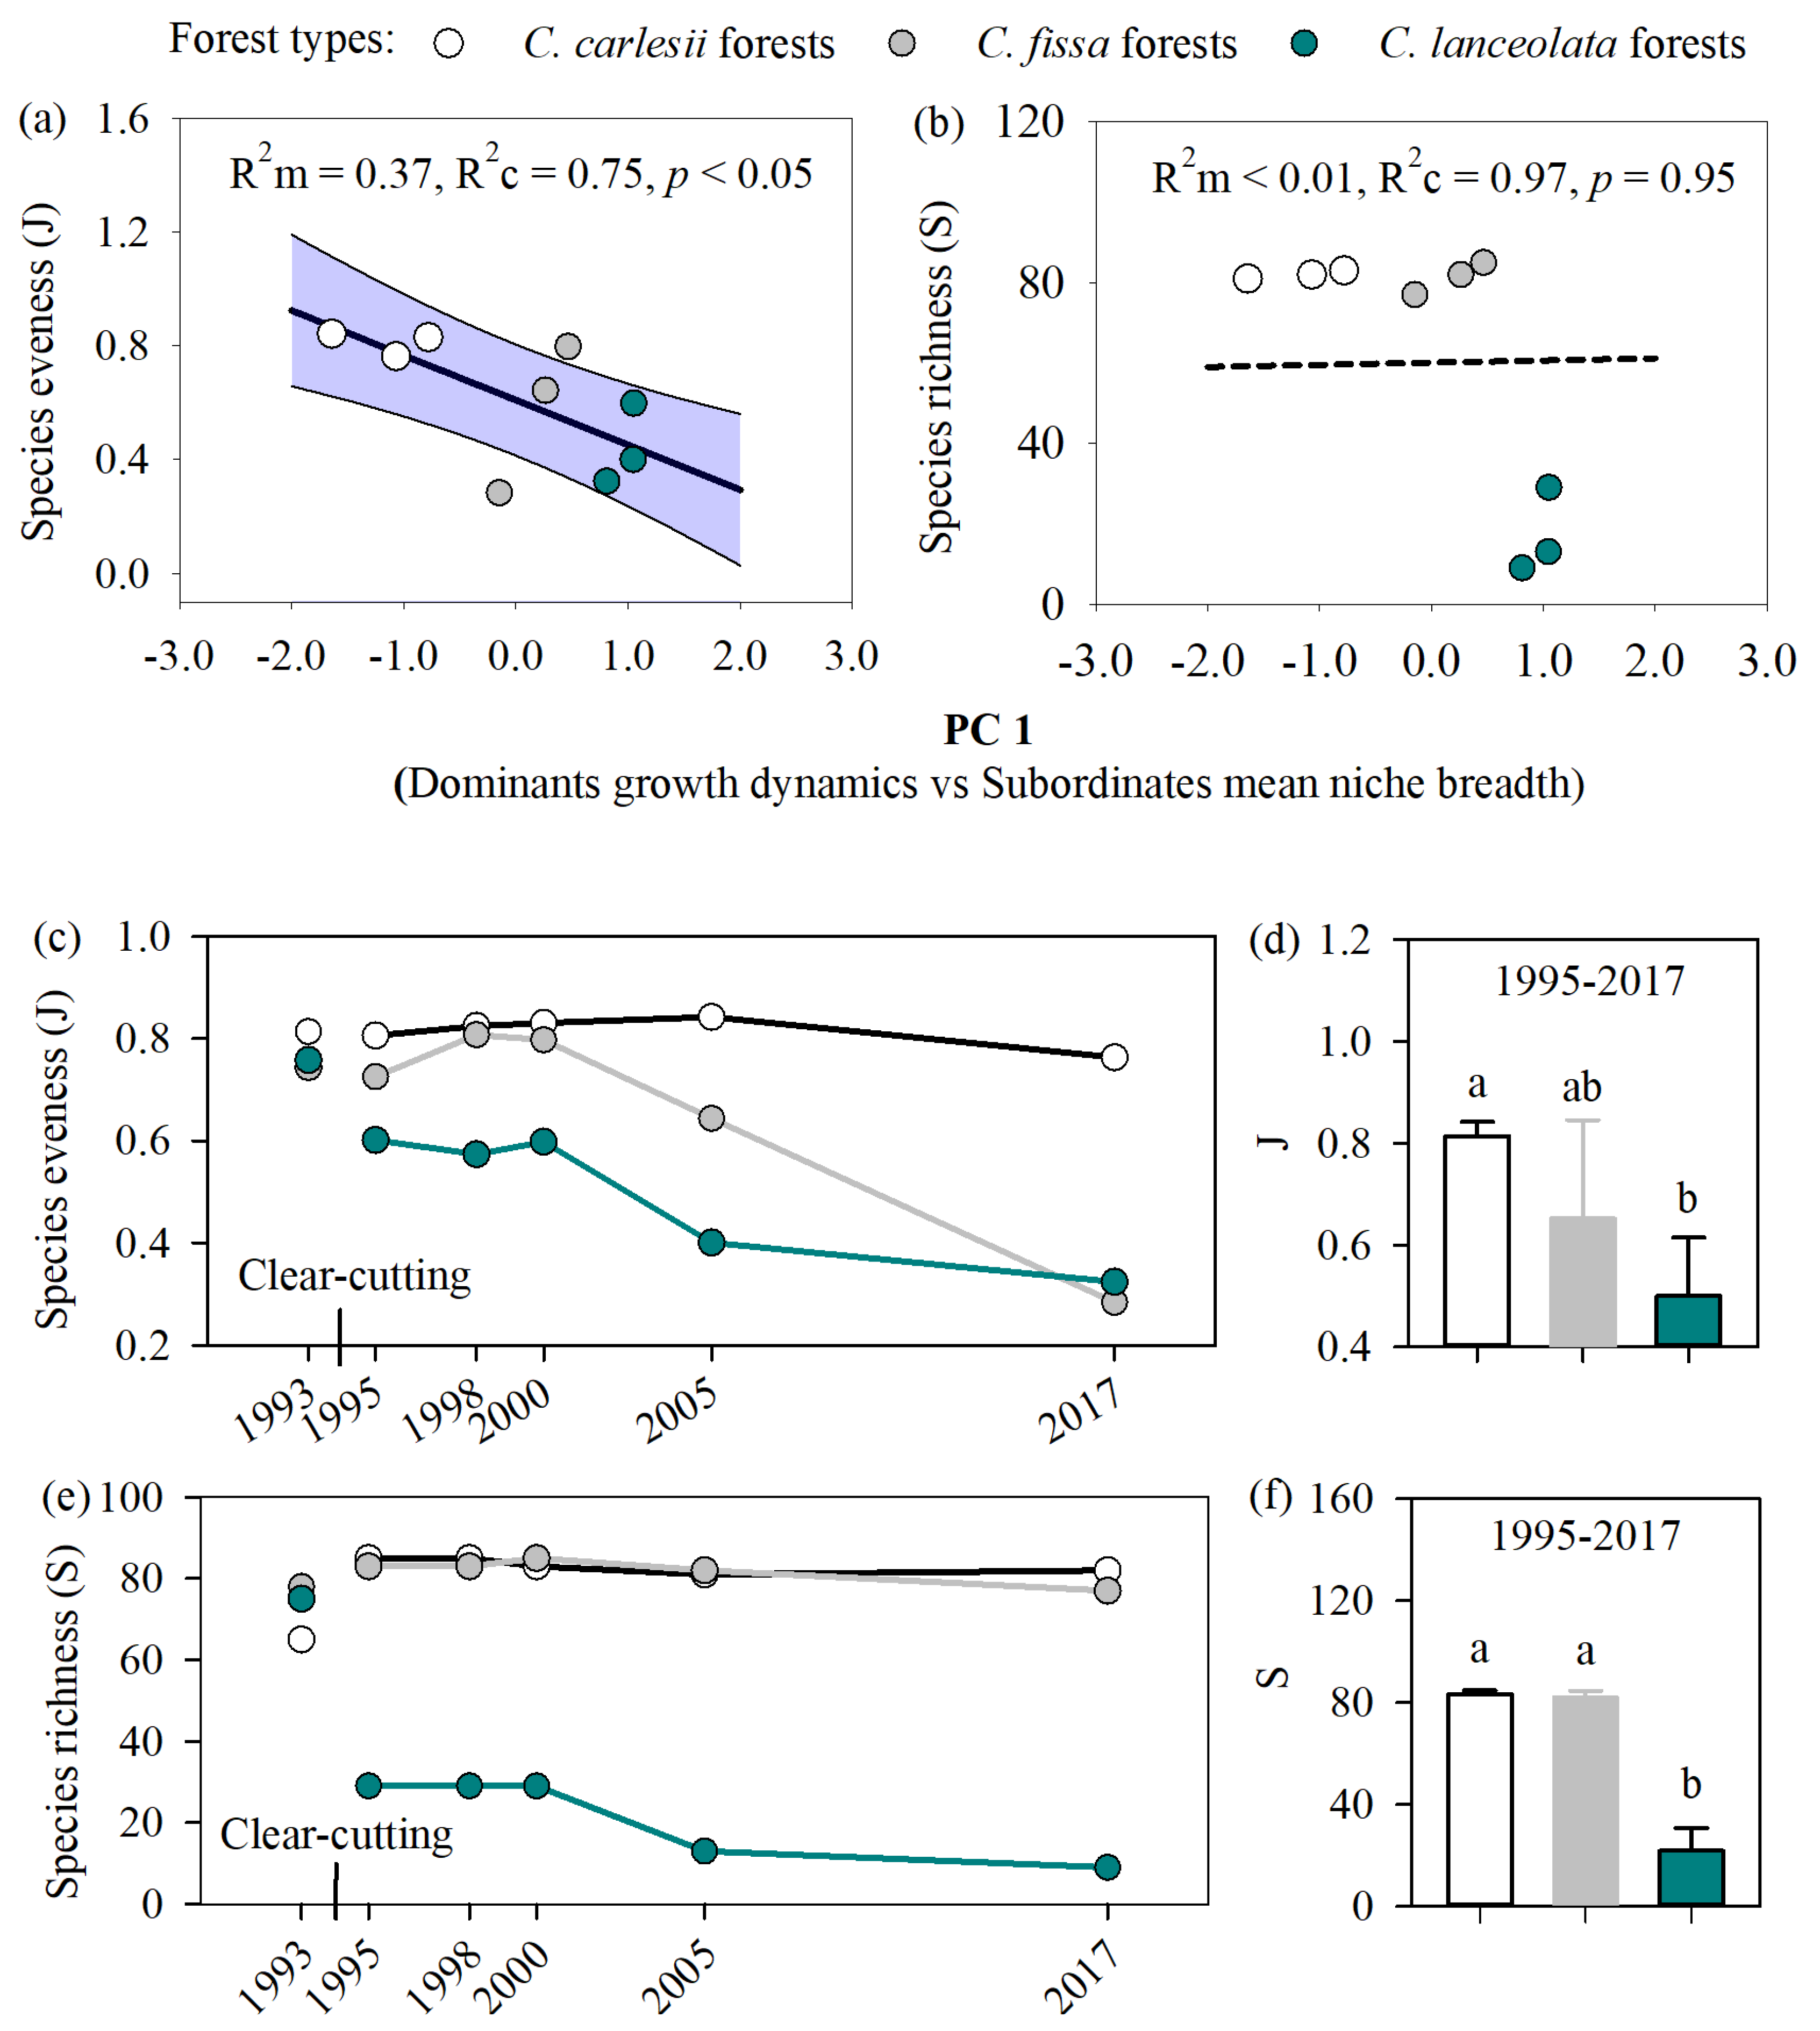
Mixed-effects linear regression analysis revealed a significant negative correlation between species evenness and PC1 (Figure 4a, R2marginal = 0.37, R2conditional= 0.75, p < 0.01). This relationship indicates that lower species evenness is associated with dominance by early-fast growing species and a consequent narrowing of subordinate species niche breadth (Figure 4c). However, there was no significant correlation between species evenness and PC2 (Figure S4, R2marginal = 0.02, R2conditional = 0.67). Although species richness in C. lanceolata forests was significantly lower than that in C. carlesii and C. fissa forests (Figure 4d), this variation was not related to the effects of dominant species growth dynamics (Figure 4b and Figure S4).

4. Discussion

4.1. The Differential Growth Dynamics Among Dominant Tree Species Affect the Species Evenness

Our results demonstrate that the growth dynamics of dominant species are a key driver of species evenness, providing experimental evidence in support of Grime’s hypothesis [8]. Consistent with our first hypothesis, the late-fast growing dominant species C. carlesii was more conducive to enhancing forest species evenness than the early-fast growing C. lanceolata. This difference is primarily attributable to their contrasting effects on the niche breadth of subordinate species. The rapid growth of C. lanceolata may restrict niche expansion of subordinate species through multiple pathways: (1) its early-fast height growing accelerates canopy closure, creating a steep vertical light gradient [50,51]; (2) rapid stem thickening with crown expansion intensifies interspecific competition [15,52]; and (3) coordinated root and stem development reduces the availability of spatial, water, and soil nutrients [53,54,55]. In contrast, the late-fast growth strategy of C. carlesii may provide a more stable resource supply and a longer window of opportunity for niche differentiation between subordinate species [56], thereby supporting higher species evenness in forests it dominates. These findings contribute to a better understanding of the mechanisms that maintain biodiversity in subtropical forests and, more importantly, provide practical insights for biodiversity conservation. In logged forest ecosystems, promoting the dominance of late-fast growing species may represent a more effective strategy for fostering species-diverse forests than traditional management approaches that favor early-fast grower.
Contrary to our second hypothesis, dominant species growth dynamics had no significant effect on the niche breadth of transient species. This finding contradicts with previous studies [21,37]. For example, Falster and Westoby [21] proposed that early-fast vertical growth of dominant species accelerates canopy closure, thereby narrowing the temporal window for transient species to access resources and restricting their niche expansion. Such a pattern was not observed in this study, which may be explained by the specific leaf morphological traits of the dominant species investigated. Field observations revealed that C. carlesii and C. fissa possess broad, ovate to elliptic leaves arranged in dense layers, whereas C. lanceolata has slender needles with a sparser leaf arrangement (Figure S1). Thus, although C. lanceolata exhibited earlier height growth, its narrow leaves and sparse canopy structure may have permitted greater light to penetrate penetration, sustaining light gaps that supported transient species [57,58]. In contrast, despite the slower height growth of C. carlesii and C. fissa in the early phases, their broader leaves and denser foliage might have created an understory light conditions no more favorable than that under C. lanceolata canopies [59]. Additionally, the gradient in height growth increments among the three dominant species may not have been sufficiently pronounced to generate detectable differences in the response of transient species. Although C. lanceolata showed a significantly greater height increment than the other two species between 2000 and 2005, height growth dynamics differences in other periods, limiting the overall effect on transient niche breadth. Our results suggest, the suppressive effect of dominants on the niche expansion of transient species’ niche expansion is not universal, but context-dependent. Multiple interacting factors, including leaf morphology, canopy structure, and magnitude of interspecific growth differentiation shape the outcomes. These findings offer new insight into species coexistence mechanisms following forest disturbance and provide practical guidance for selecting and configuring of dominant species in ecological restoration.

4.2. Changes in Species Richness Were Unrelated to the Dominant Species Growth Dynamics

This study found that the effect of growth of the dominant species on the niche breadth of subordinate and transient species did not significantly explain the changes in species richness. This pattern is probably due to the fact that the impact of the dominant species on the forest ecosystem did not reach critical thresholds. Previous studies have shown that dominant species begin to affect local species richness when their biomass reaches 60% of total forest biomass, with significant effects emerging above 85% [60,61,62]. In our study systems, the basal area proportions of C. carlesii (10.37–27.80%) and C. fissa (1.55–52.77%) within their respective stands (Supplementary Table S3) remained below these thresholds, which may explain why the growth dynamics of dominant species did not show a significant influence on species richness.
Our findings indicate that regeneration mode accounted for most of the variation in species richness (Supplementary Table S4), suggesting that it may be the primary driver underlying differences in species richness among C. carlesii, C. fissa, and C. lanceolata forests. Naturally regenerated C. carlesii forests exhibited high species richness, likely due to post-logging cessation of human disturbance. This recovery strategy promotes stable habitats that enhance subordinate species sprouting and seed germination of subordinate species while facilitating transient species colonization [63,64]. In contrast, assisted natural regenerated C. fissa forests involved low-frequency understory clearing (once annually from 1995 to 1998), which may have suppressed sprouting regeneration of some subordinate species (e.g., Castanopsis, Machilus, and Ormosia) while having a relatively minor effect on seed-dispersed transient species [65,66]. As a result, the forests still maintained relatively high species richness. By comparison, C. lanceolata were managed with intensive site preparation (1994) and high-frequency understory clearing (twice annually from 1995 to 1998). Both practices are known to substantially damage subordinate regeneration and reduce transient species density [67,68], leading to a continuous decline in species richness following clear-cutting.
It is important to note that this study did not account for several environmental variables that may influence species richness, such as spatial distance from reference vegetation, the distribution of logging residues, and the availability of seed resources in the soil [27,69,70]. These factors may indirectly regulate forest species richness by shaping dispersal capacity and germination potential. Future studies should incorporate these environmental drivers to better elucidate the mechanisms underlying species richness maintenance in logged forests.

4.3. Implications for Forest Management

Understanding how dominant tree species shape community diversity is critical for sustainable forest management. In subtropical regions, increasing demand for forest products has led to the conversion of most forests into timber plantations, leaving only strictly forests largely intact [71]. These plantations are commonly established with early-fast growing species such as C. lanceolata and C. fissa [72]. Although this approach ensures high timber yields in the short term, our findings show that it constrains the community niche space and ultimately lowers species diversity over the long-term. For logged forests, promoting communities dominated by late-fast growing species (e.g., C. carlesii) could provide an effective complement to current forest management practices. This study highlights the importance long-term monitoring of forest community dynamics under diverse management regimes, with particular attention to the population trajectories of late-fast growing species, to guide strategies that reconcile timber production with biodiversity conservation.

5. Conclusions

Based on 22-years of long-term monitoring of subtropical forests in eastern China, this study demonstrated the regulatory mechanism of dominant species’ the growth dynamics in shaping community biodiversity. Consistent with our hypothesis, late-fast growing dominant species were more effective than early-fast growing species in enhancing species evenness, primarily by expanding the niche breadth of subordinate species. These results provide empirical supports for the Mass Ratio theory in subtropical forest ecosystems and underscore the pivotal role of dominant species in regulating biodiversity. Our results provide not only an important theoretical understanding, but also practical guidance for ecological restoration, by suggesting that prioritizing late-fast growing species may be a more effective strategy to promote stable and species-rich forests in the region.

Supplementary Materials

The following supporting information can be downloaded at: https://www.mdpi.com/article/10.3390/f16081357/s1, Figure S1: Representative stand landscapes and morphological features of dominant tree species in the study area; Figure S2: Growth dynamics data of C. carlesii, C. fissa, and C. lanceolata from 1995 to 2017.; Figure S3: Niche breadths of subordinate and transient species across different forest types; Figure S4: Relationship between effects of Dominants growth on Transients niche breadth and species biodiversity changes.; Table S1: Basic species information; Table S2: Correspondence between tree-ring width and DBH survey Data; Table S3: Basal area percentage of dominants species in three types forests; Table S4: Contribution of dominant species growth dynamics and regeneration modes to species richness change.

Author Contributions

Conceptualization, methodology, S.Y.; formal analysis, Z.Y.; data curation, S.Y. and Z.Y.; writing—original draft preparation, S.Y. and Z.Y.; writing—review and editing, P.W., E.P.B. and L.Z.; visualization, L.J.; funding acquisition, P.W. All authors have read and agreed to the published version of the manuscript.

Funding

This research was funded by the Science and Technology Innovation Special Fund Project of Fujian Agricultural and Forestry University, grant number KFB24068.

Data Availability Statement

All of the data in this paper were downloaded from the publicly accessible websites cited in the main text. The species basal area and frequency data are available on request from the corresponding author.

Conflicts of Interest

Author Lifu Zhang was employed by the company Shaowu Helin State-Owned Forest Farm Company Limited. The remaining authors declare that the research was conducted in the absence of any commercial or financial relationships that could be construed as a potential conflict of interest.

References

  1. Hua, F.; Bruijnzeel, L.A.; Meli, P.; Martin, P.A.; Zhang, J.; Nakagawa, S.; Miao, X.; Wang, W.; McEvoy, C.; Peña-Arancibia, J.L.; et al. The biodiversity and ecosystem service contributions and trade-offs of forest restoration approaches. Science 2022, 376, 839–844. [Google Scholar] [CrossRef]
  2. Marsh, C.J.; Turner, E.C.; Blonder, B.W.; Bongalov, B.; Both, S.; Cruz, R.S.; Elias, D.M.O.; Hemprich-Bennett, D.; Jotan, P.; Kemp, V.; et al. Tropical forest clearance impacts biodiversity and function, whereas logging changes structure. Science 2025, 387, 171–175. [Google Scholar] [CrossRef]
  3. Conradi, T.; Kollmann, J. Species pools and environmental sorting control different aspects of plant diversity and functional trait composition in recovering grasslands. J. Ecol. 2016, 104, 1314–1325. [Google Scholar] [CrossRef]
  4. Harrison, S.; LaForgia, M. Seedling traits predict drought-induced mortality linked to diversity loss. Proc Natl Acad Sci USA 2019, 116, 5576–5581. [Google Scholar] [CrossRef] [PubMed]
  5. Chazdon, R.L.; Norden, N.; Colwell, R.K.; Chao, A. Monitoring recovery of tree diversity during tropical forest restoration: Lessons from long-term trajectories of natural regeneration. Philos. Trans. R. Soc. B Biol. Sci. 2022, 378, 20210069. [Google Scholar] [CrossRef] [PubMed]
  6. Wassel, A.C.; Myers, J.A. Pawpaws prevent predictability: A locally dominant tree alters understory beta-diversity and community assembly. Ecosphere 2025, 16, e70115. [Google Scholar] [CrossRef]
  7. Norden, N.; Angarita, H.A.; Bongers, F.; Martínez-Ramos, M.; Granzow-de la Cerda, I.; van Breugel, M.; Lebrija-Trejos, E.; Meave, J.A.; Vandermeer, J.; Williamson, G.B.; et al. Successional dynamics in Neotropical forests are as uncertain as they are predictable. Proc. Natl. Acad. Sci. USA 2015, 112, 8013–8018. [Google Scholar] [CrossRef]
  8. Grime, J. Benefits of Plant Diversity to Ecosystems: Immediate, Filter and Founder Effects. J. Ecol. 1998, 86, 902–910. [Google Scholar] [CrossRef]
  9. Kershaw, H.M.; Mallik, A.U. Predicting Plant Diversity Response to Disturbance: Applicability of the Intermediate Disturbance Hypothesis and Mass Ratio Hypothesis. Crit. Rev. Plant Sci. 2013, 32, 383–395. [Google Scholar] [CrossRef]
  10. Garnier, E.; Cortez, J.; Navas, M.-L.; Roumet, C.; Debussche, M.; Rard Laurent, G.; Blanchard, A.; Aubry, D.; Bellmann, A.; Neill, C.; et al. Plant functional markers capture ecosystem properties during secondary succession. Ecology 2004, 85, 2630–2637. [Google Scholar] [CrossRef]
  11. Vile, D.; Shipley, B.; Garnier, E. Ecosystem productivity can be predicted from potential relative growth rate and species abundance. Ecol. Lett. 2006, 9, 1061–1067. [Google Scholar] [CrossRef]
  12. Mokany, K.; Ash, J. Are traits measured on pot grown plants representative of those in natural communities? J. Veg. Sci. 2008, 19, 119–126. [Google Scholar] [CrossRef]
  13. Mulder, C.P.H.; Bazeley-White, E.; Dimitrakopoulos, P.G.; Hector, A.; Scherer-Lorenzen, M.; Schmid, B. Species evenness and productivity in experimental plant communities. Oikos 2004, 107, 50–63. [Google Scholar] [CrossRef]
  14. Falster, D.S.; Brännström, Å.; Dieckmann, U.; Westoby, M. Influence of four major plant traits on average height, leaf-area cover, net primary productivity, and biomass density in single-species forests: A theoretical investigation. J. Ecol. 2011, 99, 148–164. [Google Scholar] [CrossRef]
  15. Iida, Y.; Kohyama, T.S.; Kubo, T.; Kassim, A.R.; Poorter, L.; Sterck, F.; Potts, M.D. Tree architecture and life-history strategies across 200 co-occurring tropical tree species. Funct. Ecol. 2011, 25, 1260–1268. [Google Scholar] [CrossRef]
  16. Kohyama, T.S.; Takada, T.; Canham, C. One-sided competition for light promotes coexistence of forest trees that share the same adult height. J. Ecol. 2012, 100, 1501–1511. [Google Scholar] [CrossRef]
  17. Chen, Y.; Wright, S.J.; Muller-Landau, H.C.; Hubbell, S.P.; Wang, Y.; Yu, S. Positive effects of neighborhood complementarity on tree growth in a Neotropical forest. Ecology 2016, 97, 776–785. [Google Scholar] [CrossRef]
  18. Bongers, F.J.; Schmid, B.; Sun, Z.; Li, Y.; Härdtle, W.; Oheimb, G.; Li, Y.; Li, S.; Staab, M.; Ma, K.; et al. Growth–trait relationships in subtropical forest are stronger at higher diversity. J. Ecol. 2019, 108, 256–266. [Google Scholar] [CrossRef]
  19. Avolio, M.L.; Forrestel, E.J.; Chang, C.C.; La Pierre, K.J.; Burghardt, K.T.; Smith, M.D. Demystifying dominant species. New Phytol. 2019, 223, 1106–1126. [Google Scholar] [CrossRef]
  20. Campbell, B.D.; Grime, J.P.; Mackey, J.M.L. A trade-off between scale and precision in resource foraging. Oecologia 1991, 87, 532–538. [Google Scholar] [CrossRef]
  21. Falster, D.S.; Westoby, M. Tradeoffs between height growth rate, stem persistence and maximum height among plant species in a post-fire succession. Oikos 2005, 111, 57–66. [Google Scholar] [CrossRef]
  22. Koorem, K.; Moora, M. Positive association between understory species richness and a dominant shrub species (Corylus avellana) in a boreonemoral spruce forest. For. Ecol. Manag. 2010, 260, 1407–1413. [Google Scholar] [CrossRef]
  23. Mariotte, P.; Buttler, A.; Johnson, D.; Thébault, A.; Vandenberghe, C.; Bruun, H.H. Exclusion of root competition increases competitive abilities of subordinate plant species through root–shoot interactions. J. Veg. Sci. 2012, 23, 1148–1158. [Google Scholar] [CrossRef]
  24. Torrez, V.; Mergeay, J.; De Meester, L.; Honnay, O.; Helsen, K. Differential effects of dominant and subordinate plant species on the establishment success of target species in a grassland restoration experiment. Appl. Veg. Sci. 2017, 20, 363–375. [Google Scholar] [CrossRef]
  25. Khalil, M.I.; Gibson, D.J.; Baer, S.G.; Jones, H. Functional response of subordinate species to intraspecific trait variability within dominant species. J. Ecol. 2019, 107, 2040–2053. [Google Scholar] [CrossRef]
  26. Arnillas, C.A.; Borer, E.T.; Seabloom, E.W.; Alberti, J.; Baez, S.; Bakker, J.D.; Boughton, E.H.; Buckley, Y.M.; Bugalho, M.N.; Donohue, I.; et al. Opposing community assembly patterns for dominant and nondominant plant species in herbaceous ecosystems globally. Ecol. Evol. 2021, 11, 17744–17761. [Google Scholar] [CrossRef]
  27. Poorter, L.; Craven, D.; Jakovac, C.C.; van der Sande, M.T.; Amissah, L.; Bongers, F.; Chazdon, R.L.; Farrior, C.E.; Kambach, S.; Meave, J.A.; et al. Multidimensional tropical forest recovery. Science 2021, 374, 1370–1376. [Google Scholar] [CrossRef]
  28. Zhou, H.; Meng, S.; Liu, Q. Diameter Growth, Biological Rotation Age and Biomass of Chinese Fir in Burning and Clearing Site Preparations in Subtropical China. Forests 2016, 7, 177. [Google Scholar] [CrossRef]
  29. Zhou, H.; Meng, S.; Liu, Q. Long-term response of living forest biomass to extensive logging in subtropical China. J. For. Res. 2019, 30, 1679–1687. [Google Scholar] [CrossRef]
  30. Yang, Y.S.; Guo, J.; Chen, G.; Xie, J.; Gao, R.; Li, Z.; Jin, Z. Carbon and nitrogen pools in Chinese fir and evergreen broadleaved forests and changes associated with felling and burning in mid-subtropical China. For. Ecol. Manag. 2005, 216, 216–226. [Google Scholar] [CrossRef]
  31. Chen, H. Biomass and nutrient distribution in a Chinese-fir plantation chronosequence in Southwest Hunan, China. For. Ecol. Manag. 1998, 105, 209–216. [Google Scholar] [CrossRef]
  32. Lin, K.; Huang, B. Studies on β-diversity index of undergrowth plant in Chinese fir plantation. Biodivers. Sci. 2001, 9, 157–161. [Google Scholar] [CrossRef]
  33. Fang, Y. Species composition and diversity of evergreen broad-leaved forest of Castanopsis carlesii and C. eyrei in Wuyishan National Nature Reserve, Fujian, China. Biodivers. Sci. 2005, 13, 148. [Google Scholar] [CrossRef]
  34. Hu, J.; Zhou, H.; Huang, Y.; Yao, X.; Ye, S.; Yu, S. A study on plant species diversity and soil carbon and nitrogen in different Cunninghamia lanceolata stand types. Ecol. Environ. 2022, 31, 451. [Google Scholar] [CrossRef]
  35. Wu, Y.; Zheng, Y.; Wang, Y.; Wei, B.; Wu, C.; Shen, A.; Lu, X.; Zheng, F.; Yu, Z.; Ni, J. Relationship between the number of Cunninghamia lanceolata and community species diversity in abandoned Chinese fir forests. Acta Ecol. Sin. 2022, 42, 884–894. [Google Scholar] [CrossRef]
  36. Wu, Q.; Lin, H.; Chen, C.; Fan, H.; Zhang, B.; He, J.; Fang, C.; Yuan, F.; Wang, Y.; Wu, C. Ecological niche characteristics and spatial distribution patterns of woody plants in the understory of Castanopsis fissa forest after clearcutting. Chin. J. Ecol. 2025, 44, 21. [Google Scholar] [CrossRef]
  37. Mensah, S.; Veldtman, R.; Assogbadjo, A.E.; Glèlè Kakaï, R.; Seifert, T. Tree species diversity promotes aboveground carbon storage through functional diversity and functional dominance. Ecol. Evol. 2016, 6, 7546–7557. [Google Scholar] [CrossRef]
  38. Vallet, P.; Perot, T. Tree diversity effect on dominant height in temperate forest. For. Ecol. Manag. 2016, 381, 106–114. [Google Scholar] [CrossRef]
  39. You, S. The Effects of Different Artificial Disturbance on the Flora and Speceis Diversity of Tree Layer in Castanopsis Carlesii forest in Wupin, Fujian. Sci. Silvae Sin. 2001, 37, 106–110. [Google Scholar] [CrossRef]
  40. Chen, S.; You, S.; Chen, Z.; You, Z. Effect of different regeneration modes on height class and species diversity of Castanopsis carlesii community by using β-diversity. J. Plant Resour. Environ. 2013, 22, 62–69. [Google Scholar] [CrossRef]
  41. Wu, M.; You, S.; Yang, Y.S.; HE, Y.; Li, F. Phytocoenological Characters of the Evergreen Broad-leaf Forest Castanopsis Carlesii Form in Wuping Maobu Area, Fujian. J. Fujian Coll. For. 1994, 2, 157–162. [Google Scholar]
  42. You, S.; Lan, S.; Chen, S.; You, Z. Keys of Woody Plants in Fujian; China Forestry Publishing House: Beijing, China, 2013. [Google Scholar]
  43. Speer, J.H. Fundamentals of Tree-Ring Research; University of Arizona Press: Tucson, AZ, USA, 2010; Volume 1. [Google Scholar]
  44. Tong, W.; Yujun, S.; Jingjing, Q. Response of Pinus massoniana tree-ring width in the Jiangle Area of Fujian Province to climate change. J. Beijing For. Univ. 2019, 41, 30–39. [Google Scholar] [CrossRef]
  45. Xinguang, C.; Hongbing, H.; Yingjun, L.; Zhipeng, D.; Xiaorong, L.; Maowei, B.; Zhuangpeng, Z.; Keyan, F. Differences in the ecological resilience of planted and natural Pinus massoniana and Cunninghamia lanceolata forests in response to drought in subtropical China. Chin. J. Appl. Ecol. 2022, 32, 3531–3538. [Google Scholar] [CrossRef]
  46. Pretzsch, H. Forest Dynamics, Growth, and Yield: From Measurement to Model; Springer: Berlin/Heidelberg, Germany, 2009; Volume 1. [Google Scholar]
  47. Peet, R.K. The measurement of species diversity. Annu. Rev. Ecol. Syst. 1974, 5, 285–307. [Google Scholar] [CrossRef]
  48. Levins, R. Evolution in Changing Environments: Some Theoretical Explorations; Princeton University Press: Princeton, NJ, USA, 1968; Volume 1. [Google Scholar]
  49. Lai, J.; Zou, Y.; Zhang, S.; Zhang, X.; Mao, L.; Zhang, W.-H. glmm.hp: An R package for computing individual effect of predictors in generalized linear mixed models. J. Plant Ecol. 2022, 15, 1302–1307. [Google Scholar] [CrossRef]
  50. Matsuo, T.; Martinez-Ramos, M.; Bongers, F.; van der Sande, M.T.; Poorter, L. Forest structure drives changes in light heterogeneity during tropical secondary forest succession. J. Ecol. 2021, 109, 2871–2884. [Google Scholar] [CrossRef] [PubMed]
  51. Matsuo, T.; Martinez-Ramos, M.; Onoda, Y.; Bongers, F.; Lohbeck, M.; Poorter, L. Light competition drives species replacement during secondary tropical forest succession. Oecologia 2024, 205, 1–11. [Google Scholar] [CrossRef]
  52. Sterck, F.J.; Bongers, F. Crown development in tropical rain forest trees: Patterns with tree height and light availability. J. Ecol. 2001, 89, 1–13. [Google Scholar] [CrossRef]
  53. Coutts, M.P. Developmental processes in tree root systems. Can. J. For. Res. 1987, 17, 761–767. [Google Scholar] [CrossRef]
  54. Gilliam, F.S. The Ecological Significance of the Herbaceous Layer in Temperate Forest Ecosystems. BioScience 2007, 57, 845–858. [Google Scholar] [CrossRef]
  55. Uriarte, M.; Swenson, N.G.; Chazdon, R.L.; Comita, L.S.; John Kress, W.; Erickson, D.; Forero-Montaña, J.; Zimmerman, J.K.; Thompson, J. Trait similarity, shared ancestry and the structure of neighbourhood interactions in a subtropical wet forest: Implications for community assembly. Ecol. Lett. 2010, 13, 1503–1514. [Google Scholar] [CrossRef]
  56. Liu, T.-Y.; Lin, K.-C.; Vadeboncoeur, M.A.; Chen, M.-Z.; Huang, M.-Y.; Lin, T.-C. Understorey plant community and light availability in conifer plantations and natural hardwood forests in Taiwan. Appl. Veg. Sci. 2015, 18, 591–602. [Google Scholar] [CrossRef]
  57. Yang, X.-D.; Yan, E.-R.; Chang, S.X.; Da, L.-J.; Wang, X.-H. Tree architecture varies with forest succession in evergreen broad-leaved forests in Eastern China. Trees 2014, 29, 43–57. [Google Scholar] [CrossRef]
  58. Plaga, B.N.E.; Bauhus, J.; Pretzsch, H.; Pereira, M.G.; Forrester, D.I. Influence of crown and canopy structure on light absorption, light use efficiency, and growth in mixed and pure Pseudotsuga menziesii and Fagus sylvatica forests. Eur. J. For. Res. 2023, 143, 479–491. [Google Scholar] [CrossRef]
  59. Sercu, B.K.; Baeten, L.; van Coillie, F.; Martel, A.; Lens, L.; Verheyen, K.; Bonte, D. How tree species identity and diversity affect light transmittance to the understory in mature temperate forests. Ecol. Evol. 2017, 7, 10861–10870. [Google Scholar] [CrossRef] [PubMed]
  60. Gaertner, M.; Den Breeyen, A.; Hui, C.; Richardson, D.M. Impacts of alien plant invasions on species richness in Mediterranean-type ecosystems: A meta-analysis. Prog. Phys. Geogr. Earth Environ. 2009, 33, 319–338. [Google Scholar] [CrossRef]
  61. Powell, K.I.; Chase, J.M.; Knight, T.M. A synthesis of plant invasion effects on biodiversity across spatial scales. Am. J. Bot. 2011, 98, 539–548. [Google Scholar] [CrossRef] [PubMed]
  62. Akatov, V.V.; Akatova, T.V.; Eskina, T.G.; Sazonets, N.M.; Chefranov, S.G. Dominants in Plant Communities: The Nature of Impact on Biomass Determines the Thresholds of Impact on Local Species Richness. Biol. Bull. Rev. 2025, 15, 12–23. [Google Scholar] [CrossRef]
  63. Kopecký, M.; Hédl, R.; Szabó, P.; Hooftman, D. Non-random extinctions dominate plant community changes in abandoned coppices. J. Appl. Ecol. 2012, 50, 79–87. [Google Scholar] [CrossRef]
  64. Müllerová, J.; Hédl, R.; Szabó, P. Coppice abandonment and its implications for species diversity in forest vegetation. For. Ecol. Manag. 2015, 343, 88–100. [Google Scholar] [CrossRef]
  65. Pausas, J.G.; Lamont, B.B.; Paula, S.; Appezzato-da-Glória, B.; Fidelis, A. Unearthing belowground bud banks in fire-prone ecosystems. New Phytol. 2018, 217, 1435–1448. [Google Scholar] [CrossRef] [PubMed]
  66. De Lombaerde, E.; Baeten, L.; Verheyen, K.; Perring, M.P.; Ma, S.; Landuyt, D. Understorey removal effects on tree regeneration in temperate forests: A meta-analysis. J. Appl. Ecol. 2021, 58, 9–20. [Google Scholar] [CrossRef]
  67. Bell, F.W.; Newmaster, S.G. The effects of silvicultural disturbances on the diversity of seed-producing plants in the boreal mixedwood forest. Can. J. For. Res. 2002, 32, 1180–1191. [Google Scholar] [CrossRef]
  68. Eycott, A.E.; Watkinson, A.R.; Dolman, P.M. Ecological patterns of plant diversity in a plantation forest managed by clearfelling. J. Appl. Ecol. 2006, 43, 1160–1171. [Google Scholar] [CrossRef]
  69. Norden, N.; Chazdon, R.L.; Chao, A.; Jiang, Y.H.; Vilchez-Alvarado, B. Resilience of tropical rain forests: Tree community reassembly in secondary forests. Ecol. Lett. 2009, 12, 385–394. [Google Scholar] [CrossRef]
  70. Jakovac, C.C.; Peña-Claros, M.; Kuyper, T.W.; Bongers, F. Loss of secondary-forest resilience by land-use intensification in the Amazon. J. Ecol. 2015, 103, 67–77. [Google Scholar] [CrossRef]
  71. Li, W. Degradation and restoration of forest ecosystems in China. For. Ecol. Manag. 2004, 201, 33–41. [Google Scholar] [CrossRef]
  72. Dai, L.; Wang, Y.; Su, D.; Zhou, L.; Yu, D.; Lewis, B.J.; Qi, L. Major Forest Types and the Evolution of Sustainable Forestry in China. Environ. Manag. 2011, 48, 1066–1078. [Google Scholar] [CrossRef]
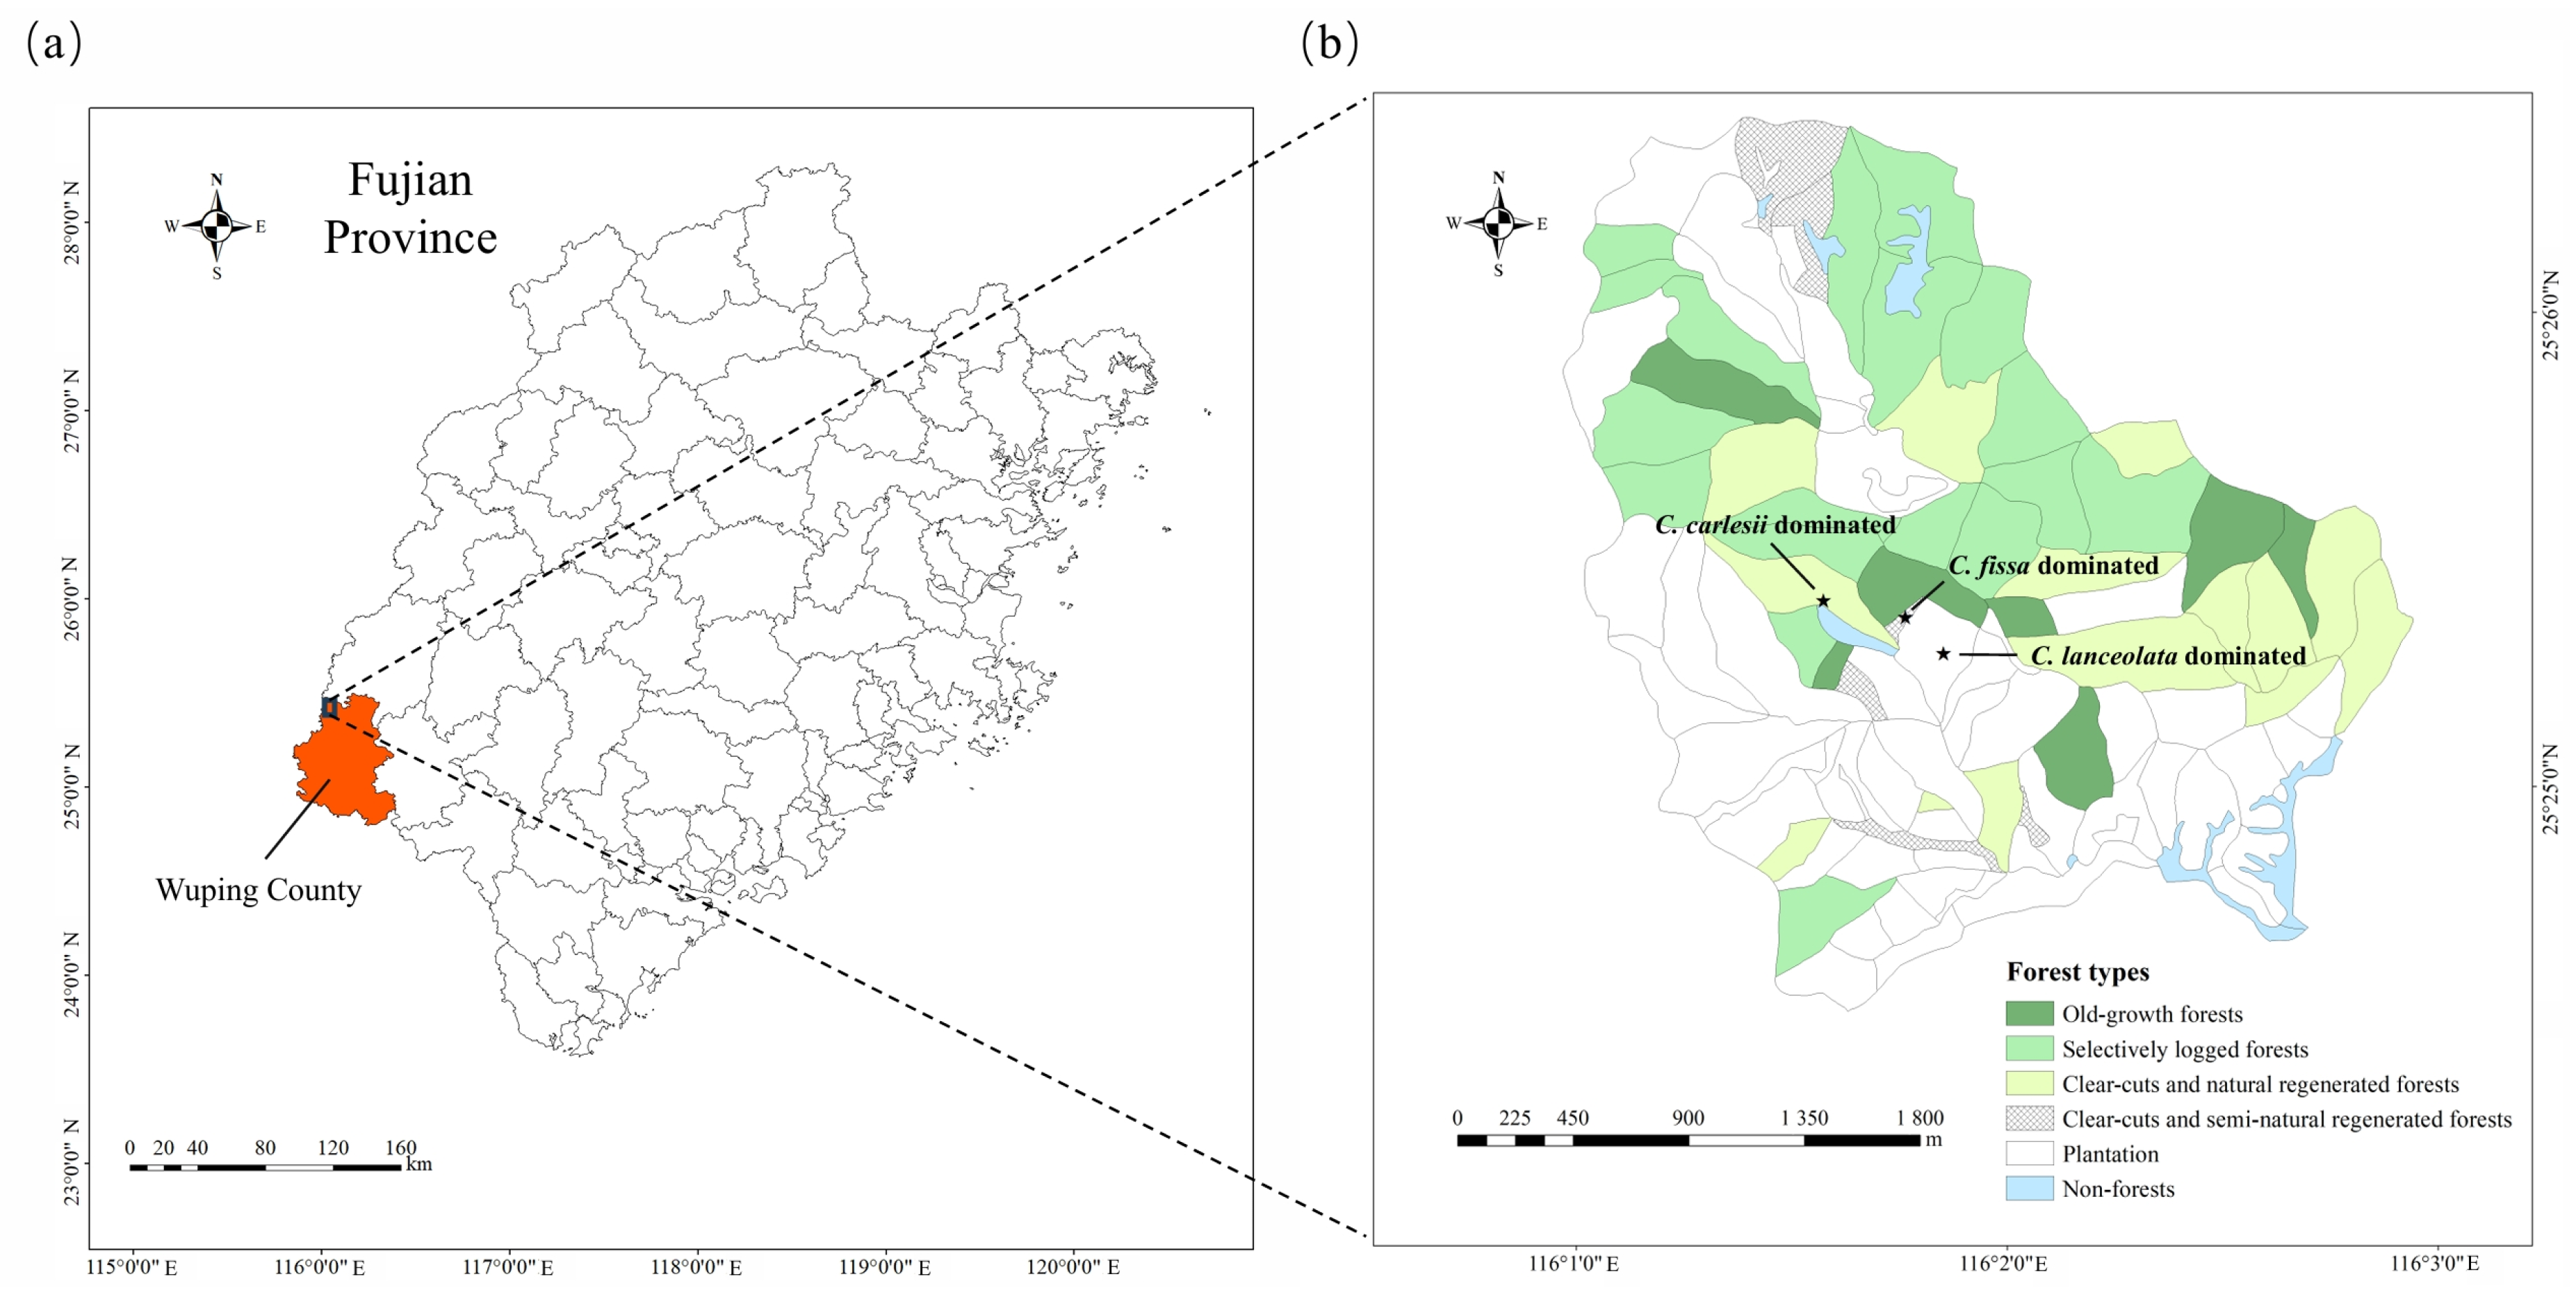
Figure 1. Location and forest types in the study area. (a) Wuping County in Fujian Province, southeastern China; (b) spatial distribution of forest types and dominant species in the study area.
Forests 16 01357 g001
Figure 2. Growth dynamics of different dominant tree species during 1995–2017. (a) Annual diameter at breast height (DBH) increment; (b) annual height increment. White bars with black solid lines represent C. carlesii, gray bars represent C. fissa, and teal bars represent C. lanceolata. Error bars indicate standard errors, and different letters above columns denote significant differences among groups (p < 0.05).
Forests 16 01357 g002
Figure 3. Principal component analysis (PCA) of the effects of growth dynamics (height and diameter) of the three dominant tree species on the mean niche breadths of two functional groups (subordinate and transient species). (a) Loading plot of the first two principal components; (b) loadings of growth dynamics for the three dominant species on PC1 and PC2; (c) differences in the loadings of growth dynamics on PC1 among the three dominant species; (d) differences in the loadings on PC2 among the three dominant species. White bars and dots represent C. carlesii, gray bars and dots represent C. fissa, and teal bars and dots represent C. lanceolata. Red arrows represent annual growth of dominant species, black arrows represent mean niche breadth of subordinate and trasient species. Error bars indicate standard errors. Different letters above the bars indicate significant differences among groups (p < 0.05).
Forests 16 01357 g003
Figure 4. The relationship between the effects of dominant species growth dynamics on the niche breadth of subordinate species and changes in species diversity. (a) Loadings of dominant species growth dynamics on the first principal component (PC1) vs. species evenness; (b) PC1 loadings vs. species richness; (c) changes in species evenness from 1993 to 1995–2017; (d) mean species evenness during 1995–2017; (e) changes in species richness from 1993 to 1995–2017; (f) mean species richness during 1995–2017. White dots and bars represent C. carlesii forests, gray represent C. fissa forests, and teal represent C. lanceolata forests. Error bars indicate standard errors. Different letters above bars denote significant differences among groups (p < 0.05). Solid lines indicate statistically significant regression relationships (p < 0.05), while dashed lines indicate non-significant relationships (p ≥ 0.05). Blue shaded areas represent 95% confidence intervals, reflecting the uncertainty around the regression lines. R2m denotes marginal R2, and R2c denotes conditional R2.
Forests 16 01357 g004
Disclaimer/Publisher’s Note: The statements, opinions and data contained in all publications are solely those of the individual author(s) and contributor(s) and not of MDPI and/or the editor(s). MDPI and/or the editor(s) disclaim responsibility for any injury to people or property resulting from any ideas, methods, instructions or products referred to in the content.