Article

Monitoring and Influencing Factors Analysis of Urban Vegetation Changes in the Plateau-Mountainous City

1
State Key Laboratory for Vegetation Structure, Function and Construction (VegLab), Yunnan University, Kunming 650500, China
2
Erhai Watershed Ecological Environment Quality Testing Engineering Research Center of Yunnan Provincial Universities, Erhai Research Institute, West Yunnan University of Applied Sciences, Dali 671000, China
3
Institute of International Rivers and Eco-Security, Yunnan University, Kunming 650500, China
4
College of Urban and Environmental Sciences, Northwest University, Xi’an 710127, China
*
Authors to whom correspondence should be addressed.
Forests 2025, 16(8), 1339; https://doi.org/10.3390/f16081339 (registering DOI)
Submission received: 7 July 2025 / Revised: 12 August 2025 / Accepted: 14 August 2025 / Published: 17 August 2025

Abstract

It is of great importance to study the spatiotemporal variation in vegetation and its influencing factors at a regional scale in plateau mountainous cities for ecological restoration and management and maintenance of ecosystem stability. This study employed MODIS NDVI data to construct a kNDVI dataset for the growing season in Kunming, with the aim of exploring the spatiotemporal variations in vegetation more precisely. The study analyzed the trends and stability of kNDVI and investigated the primary drivers of kNDVI dynamics in Kunming. The results show that the regional proportion of higher-level kNDVI is more than half, and vegetation in the growing season has shown an improvement trend. The primary factors influencing kNDVI variations in Kunming include soil type, landform type, nighttime light intensity, and slope gradient. The pairwise interactions among factors have a more substantial impact on vegetation dynamics compared to individual factors, with the interaction between soil type and nighttime light intensity being particularly pronounced. The results offer scientific bases for assessing and managing ecological environment quality in plateau-mountainous cities.

1. Introduction

The dynamic patterns of vegetation exert impacts on the global carbon cycle, water cycle, and energy transfer processes [1]. They are considered to be amongst the key indicators for assessing ecosystem health [2,3]. They are of utmost importance for regulating the material exchange between land and atmosphere [4]. Results from satellite-based monitoring indicate that a notable global greening trend has emerged, with China and India being the primary contributors [5]. Monitoring vegetation changes and analyzing the influencing factors are of paramount importance for comprehending global extreme climate change and for ecological conservation and restoration endeavors [6,7].
The rapid development of remote sensing technology is providing a series of continuous spatio-temporal observation datasets for vegetation remote sensing research [8]. Because of their wide spatial coverage, continuous temporal scale, and abundant information, remote sensing data have become an important data source for long-term monitoring of large-scale vegetation growth [9]. There are many vegetation indices calculated based on these data products, including NDVI and EVI, which are widely used in many studies [10,11]. However, some vegetation indices, such as NDVI, may be saturated, which will reduce the sensitivity to high vegetation cover areas and make it difficult to capture vegetation growth dynamics in time [12,13,14]. A new vegetation index kNDVI is proposed based on machine learning principles and kernel method theory [15], in which kNDVI can improve sensitivity to growth changes, reflect subtle changes in the vegetation life cycle more accurately, and effectively solve problems such as saturation and noise. Kunming City, a highland mountainous city, has complex topography, densely distributed green areas, forests, and many wetland parks. NDVI tends to saturate in areas with high vegetation cover (such as dense forests). kNDVI could effectively stretch the dynamic range of high-value areas through kernel function transformation, solve the saturation problem of NDVI, and could provide richer details and higher sensitivity [15,16].
The interactions between the dynamic characteristics of vegetation and a diverse range of influencing factors are intricate and multifaceted [17]. Previous studies have predominantly utilized residual and correlation analyses to elucidate the factors influencing vegetation changes [18,19], with most focusing on the responses of vegetation to natural variables, including temperature, precipitation, and sunshine duration [8,16]. Nevertheless, these traditional approaches are insufficient for elucidating the nonlinear interrelationships among diverse influencing factors, especially those associated with human impacts and climate oscillations. To overcome this limitation, Wang et al. [20] proposed the Geographical Detector Method (GDM). The GDM serves as an effective means for detecting spatial heterogeneity and quantifying the explanatory power and interactions of factors. This model is capable of effectively identifying potential influencing factors and uncovering the interactions among diverse influencing factors [21]. In recent years, GDM has been widely applied in studies that investigate the determinants of vegetation dynamics. For example, Liu et al. [22] employed GDM to analyze the influencing factors of vegetation cover in a highland lake basin. Zhang et al. [23] used GDM to investigate the factors affecting NDVI in Inner Mongolia. Their research unveiled the spatiotemporal variations in vegetation characteristics and the optimal conditions conducive to promoting vegetation growth within the region. GDM, which accounts for the inherent spatial heterogeneity of geographical phenomena, is particularly apt for providing robust explanations for changes in vegetation cover.
However, a significant portion of related research emphasizes the utilization of annual NDVI and EVI for investigations at watershed or larger scales. In contrast, there remains a lack of comprehensive studies examining vegetation dynamics and the factors influencing them in plateau mountainous urban areas, particularly through the application of novel vegetation indices during the growing season. Kunming, located in the eastern region of the Yunnan Plateau in southwestern China, displays intricate topographical characteristics and a variety of climatic conditions. The region has experienced an increase in both the frequency and intensity of drought-related disasters [24], which will inevitably exert substantial impacts on the ecological environment of Kunming. To comprehensively analyze the spatiotemporal patterns and underlying mechanisms influencing vegetation growth in plateau mountainous cities, this study utilized Kunming City as a case study. We constructed a kNDVI dataset for the growing season from April to October, covering the period from 2000 to 2023. Various methodologies, including trend analysis, coefficient of variation, and GDM, were employed to examine the spatiotemporal characteristics and developmental trends of kNDVI in Kunming. Additionally, the study aimed to quantify the effects of natural factors, anthropogenic activities, and their interactions on the dynamic changes in vegetation. The results of this research are intended to offer practical recommendations for the sustainable development, ecological conservation, and restoration of urban areas situated in plateau mountainous regions.

2. Materials and Methods

2.1. Study Area

Kunming City is situated in the central region of the Yunnan-Guizhou Plateau, with a terrain that is relatively low on both the eastern and western sides. It has a subtropical highland monsoon climate, with the northern mountain ranges blocking cold air from the north. Under the influence of the Bay of Bengal monsoon, the presence of Dianchi Lake and Yangzonghai Lake (both highland lakes) helps regulate the temperature, earning the region the reputation of having a “spring-like climate all year round”. Kunming is a famous tourist destination in China, with an average annual sunshine duration of around 2200 h and strong ultraviolet radiation. The city experiences significant annual precipitation of about 1000 mm, with distinct dry and wet seasons. The rainy season lasts from April to October. The vegetation is diverse, dominated by semi-humid evergreen broad-leaved forests. In 2023, the resident population of Kunming City was about 8.68 million. It comprises 14 districts: Anning District (AN), Chenggong District (CG), Dongchuan District (DC), Fumin County (FM), Guandu District (GD), Jinning District (JN), Luquan County (LQ), Panlong District (PL), Shilin County (SL), Songming County (SM), Wuhua District (WH), Xishan District (XS), Xundian County (XD), and Yiliang County (YL). The study area is shown in Figure 1.

2.2. Data Sources

The data sources and processing of this article are shown in Table 1.

2.3. Research Methods

2.3.1. Establishment of the kNDVI Dataset

In the study, the monthly kNDVI within the growing season was computed via a simplified algorithm. Subsequently, the annual kNDVI values for the growing season in Kunming from 2000 to 2023 were statistically processed using the mean value method to represent the vegetation status of the region using Formula (1) [8].
k N D V I = t a n h ( N D V I 2 )

2.3.2. Trend Analysis

The Theil–Sen Median method assesses the trend changes in time-series or spatial data, based on the median of the slopes of all the data pairs in the dataset. It does not require making specific assumptions about the data distribution. It is a robust non-parametric statistical approach, which is also insensitive to the impact of outliers and measurement errors on samples in trend analysis. The Mann–Kendall test is a non-parametric statistical test method used to examine whether there are significant trend changes in time-series data. The advantage of this test is that it does not require the samples to conform to a specific distribution [25,26,27]. The combination of the two methods can be used to test and determine the change trend in kNDVI in Kunming. The calculation formulas are presented in Formulas (2)–(6).
β k N D V I = M e d i a n k N D V I j k N D V I i j i , 2000 i < j 2023
S = i = 1 n 1 j = i + 1 n s g n k N D V I j k N D V I i
s g n k N D V I j k N D V I i = 1 ,   kNDVI j kNDVI i > 0 0 ,   kNDVI j kNDVI i = 0 1 ,   kNDVI j kNDVI i < 0
Z = ( S 1 ) / V a r ( S ) , S > 0 0 , S = 0 ( S + 1 ) / V a r ( S ) , S < 0
V a r ( S ) = n ( n 1 ) ( 2 n + 5 ) 18
where kNDVIi and kNDVIj represent datasets for year i and year j, respectively. n is the number of data in the sequence. A two-sided trend test was used in this study. We set α = 0.05 and the corresponding critical value Z1 − α/2 = ±1.96. When |Z| exceeds 1.96, the trend passes the significant test with 95% confidence. We then classified the trends into five categories: slightly degraded, severely degraded, stable, slightly improved, and significantly improved (Table 2).

2.3.3. Stability Analysis

The coefficient of variation (CV) is a relative statistical measure for quantifying the degree of data dispersion. It is obtained by dividing the standard deviation of the data by its mean value, thereby eliminating the influence of dimensions. It is able to reflect the fluctuation of kNDVI over time and effectively represents the dispersion and mean level of kNDVI data in the time series, making it suitable for evaluating vegetation stability [28,29,30]. The formula for the calculation is delineated in Formula (7).
C v = σ / μ

2.3.4. GDM Analysis

The Geographical Detector is a statistical method used to detect spatial heterogeneity and reveal the factors influencing it. It assumes that when an independent variable exerts a substantial impact on a dependent variable, a corresponding resemblance should exist in the spatial distributions of both the independent and dependent variables [31]. Furthermore, GDM is able to quantify the impact of potential interactions among these factors on the response variable. In this study, in order to obtain comprehensive sample data of Kunming City for geo-detector analysis, the study area was divided into a 2 km × 2 km grid. A total of 5043 valid data values were retained after removing missing data from middle point data. Classification variables (soil types, geomorphological type, and land use type) retained their original classification, and the remaining continuous variables were divided into 10 categories according to the natural breakpoint method. Geo-detector analysis was carried out applying Formulas (8)–(10).
q = 1 h = 1 L N h σ h 2 N σ 2 = 1 S S W S S T
S S W = h = 1 L N h σ h 2
S S T = N σ 2
where the q-value serves as a measure of the explanatory capacity of each factor in relation to kNDVI, with values ranging from 0 to 1. A higher q-value signifies more pronounced spatially stratified heterogeneity and an enhanced explanatory influence of the factor on kNDVI. Here, h represents the stratification of independent variable X (h = 1, 2, ..., L); N are the unit numbers of layer h and the whole region, respectively; σ2 is the overall variance; SSW and SST represent the aggregate of variances within individual layers and the overall regional variance, respectively.

3. Results

3.1. Spatio-Temporal Variations in kNDVI

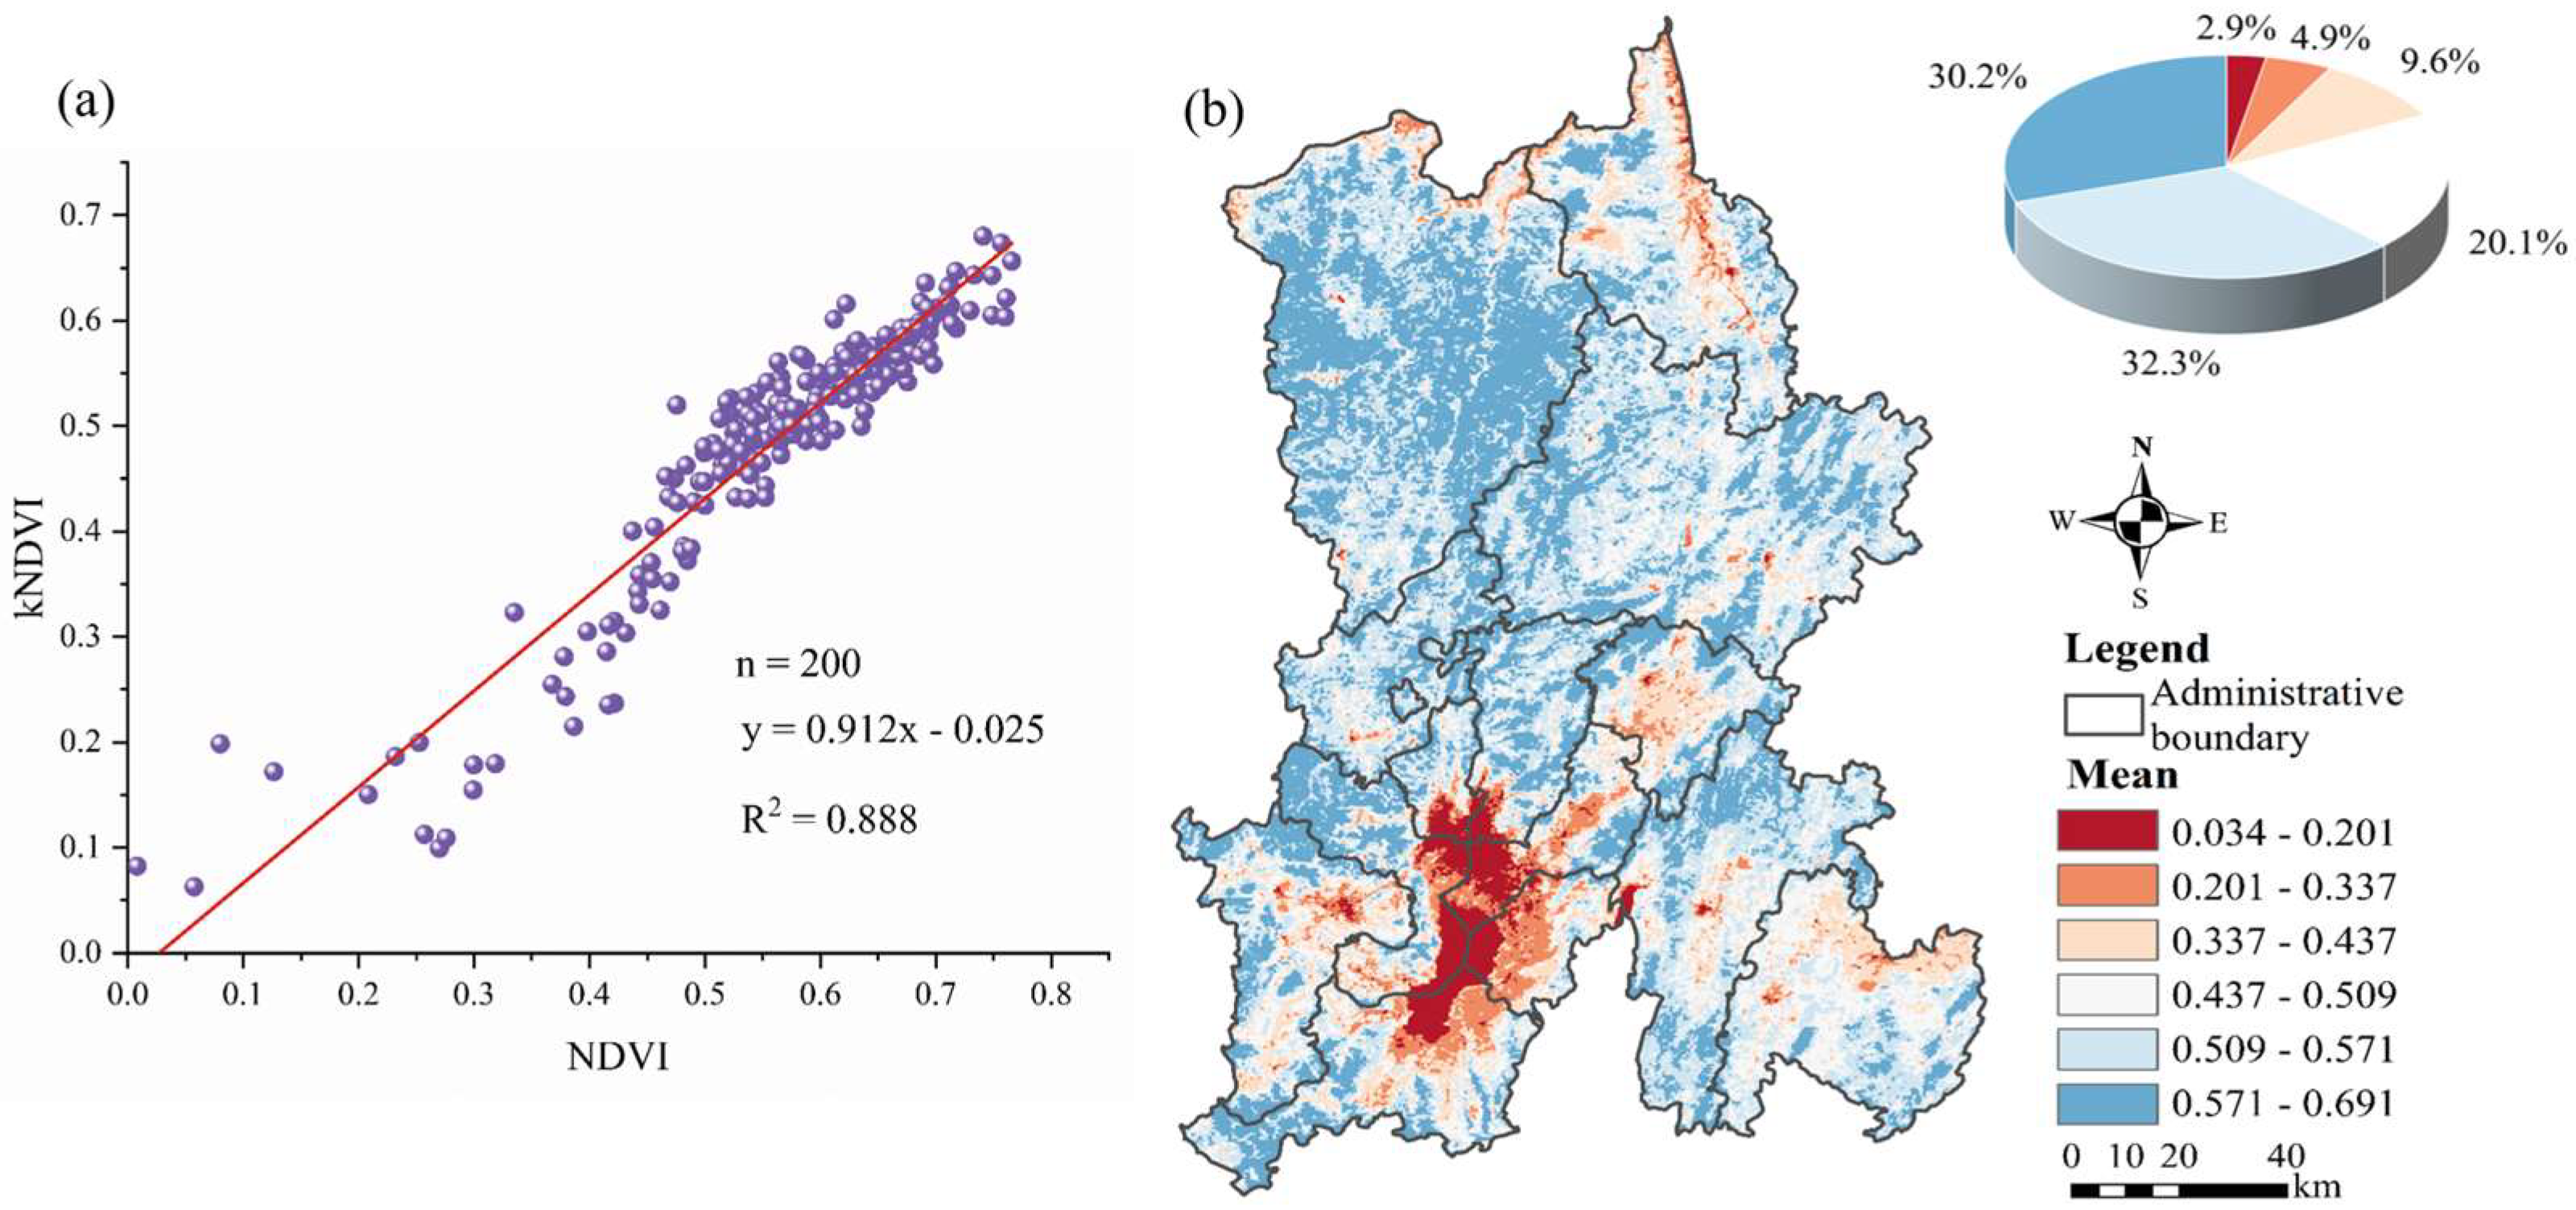
A total of 200 sample points were randomly arranged in five benchmark years (within the growing season), and the constructed kNDVI and original NDVI were collected and analyzed. It was found that they have a good fitting effect, with the R2 value reaching 0.888 (Figure 2a). Among the 200 samples, 41.0% of the samples were in areas with higher vegetation coverage (NDVI > 0.600). NDVI values ranging from 0.711 to 0.718 corresponded to kNDVI values ranging from 0.593 to 0.647. The NDVI range for the high vegetation area could be effectively extended using kNDVI based on kernel function transformation. It is effective and reliable to use the kNDVI index to evaluate vegetation dynamic change in Kunming City. This study reconstructed the kNDVI of Kunming City from 2000 to 2023. Figure 2b depicts the spatial distribution of the average kNDVI values during the 24-year period. A spatial pattern is exhibited characterized by higher values in the northern part and lower values in the southern part. The average kNDVI values throughout Kunming City ranged from 0.034 to 0.691, with marked differences in kNDVI between the northern and southern regions. Employing the natural breaks method, kNDVI was categorized into six classes. High kNDVI values (0.571–0.691) constitute 30.2% of the total area. These values were predominantly distributed in the northwestern part of Kunming, specifically in LQ. Low kNDVI values (0.034–0.201) account for 2.9% of the area and were mainly distributed in WH, XS, CG, and GD, where the highland lake Dianchi and numerous residential areas are situated.

3.1.1. Interannual Variations in kNDVI

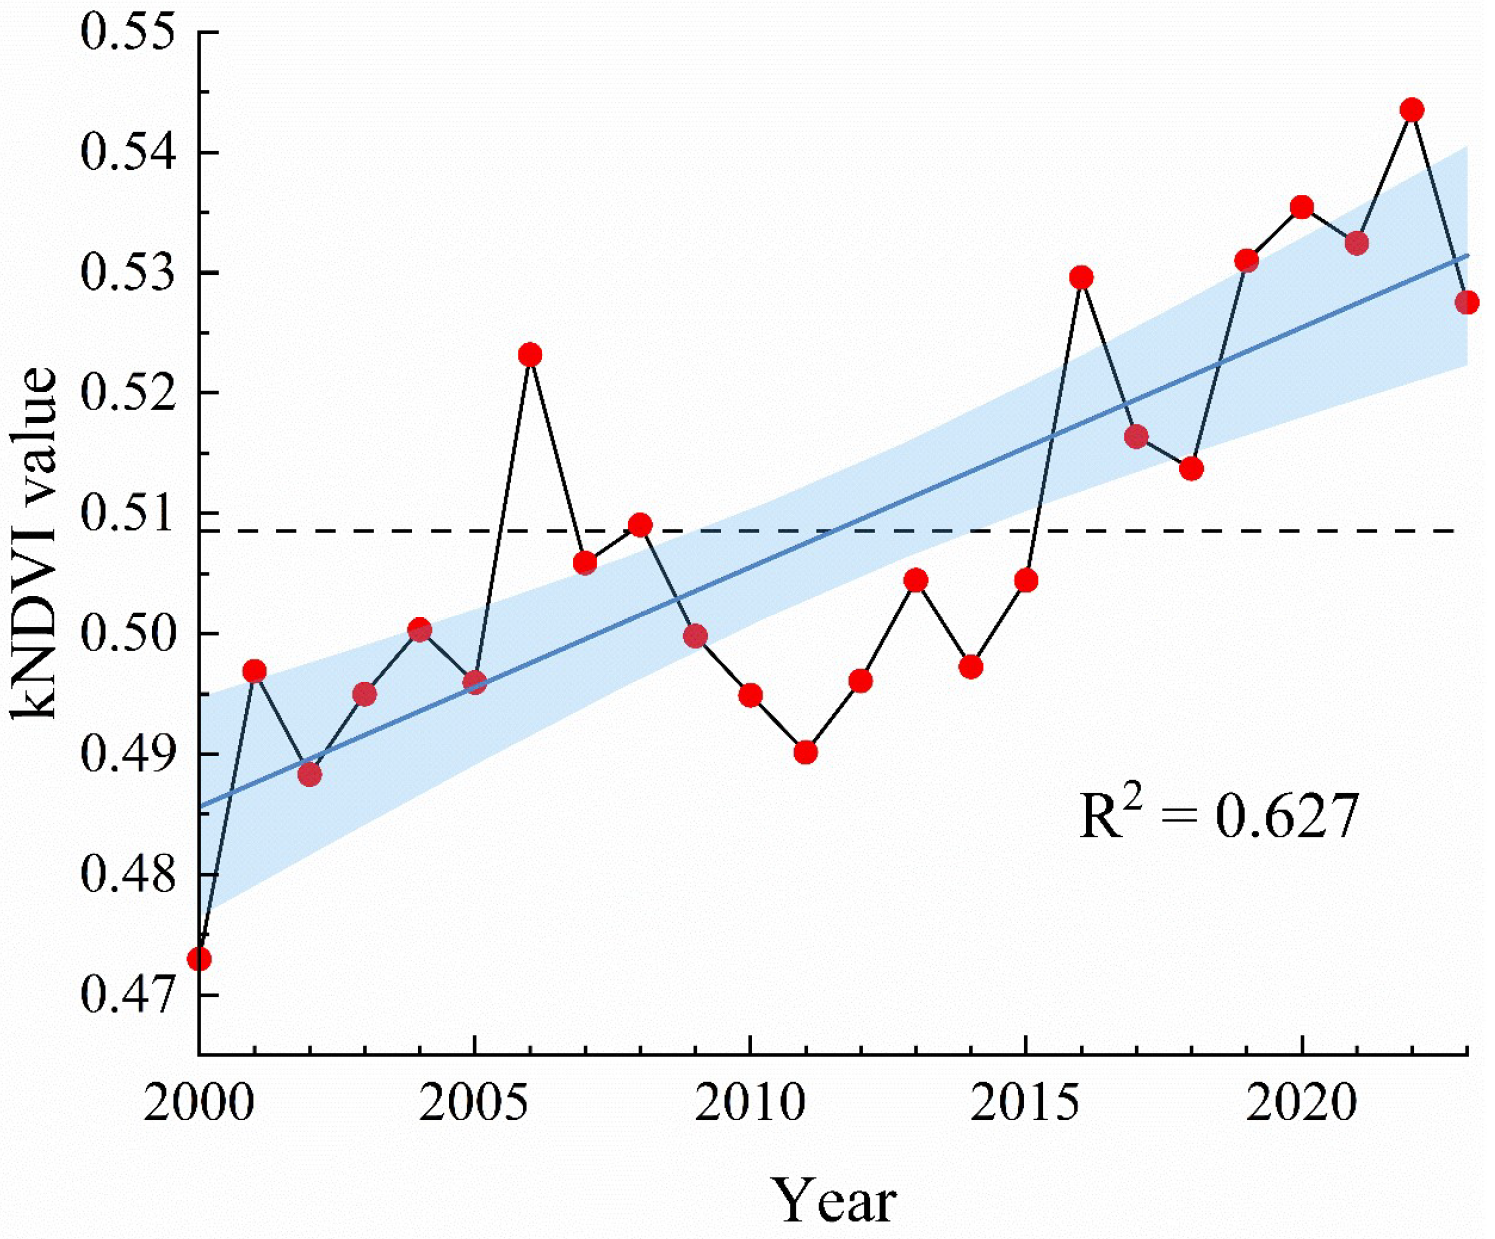
The kNDVI attained peak values in 2001, 2004, 2006, 2008, 2013, 2016, 2020, and 2022, with a maximum value of 0.544 documented in 2022. The mean kNDVI values observed subsequent to 2006, 2008, and 2016 were all higher than the long-term average kNDVI. Although the vegetation kNDVI values in Kunming City fluctuated up and down during the study period, the average kNDVI values in the study area were greater than the multi-annual average values from 2016 to 2023. Generally, the vegetation showed a gradually improving trend (Figure 3).

3.1.2. Monthly Variations in kNDVI

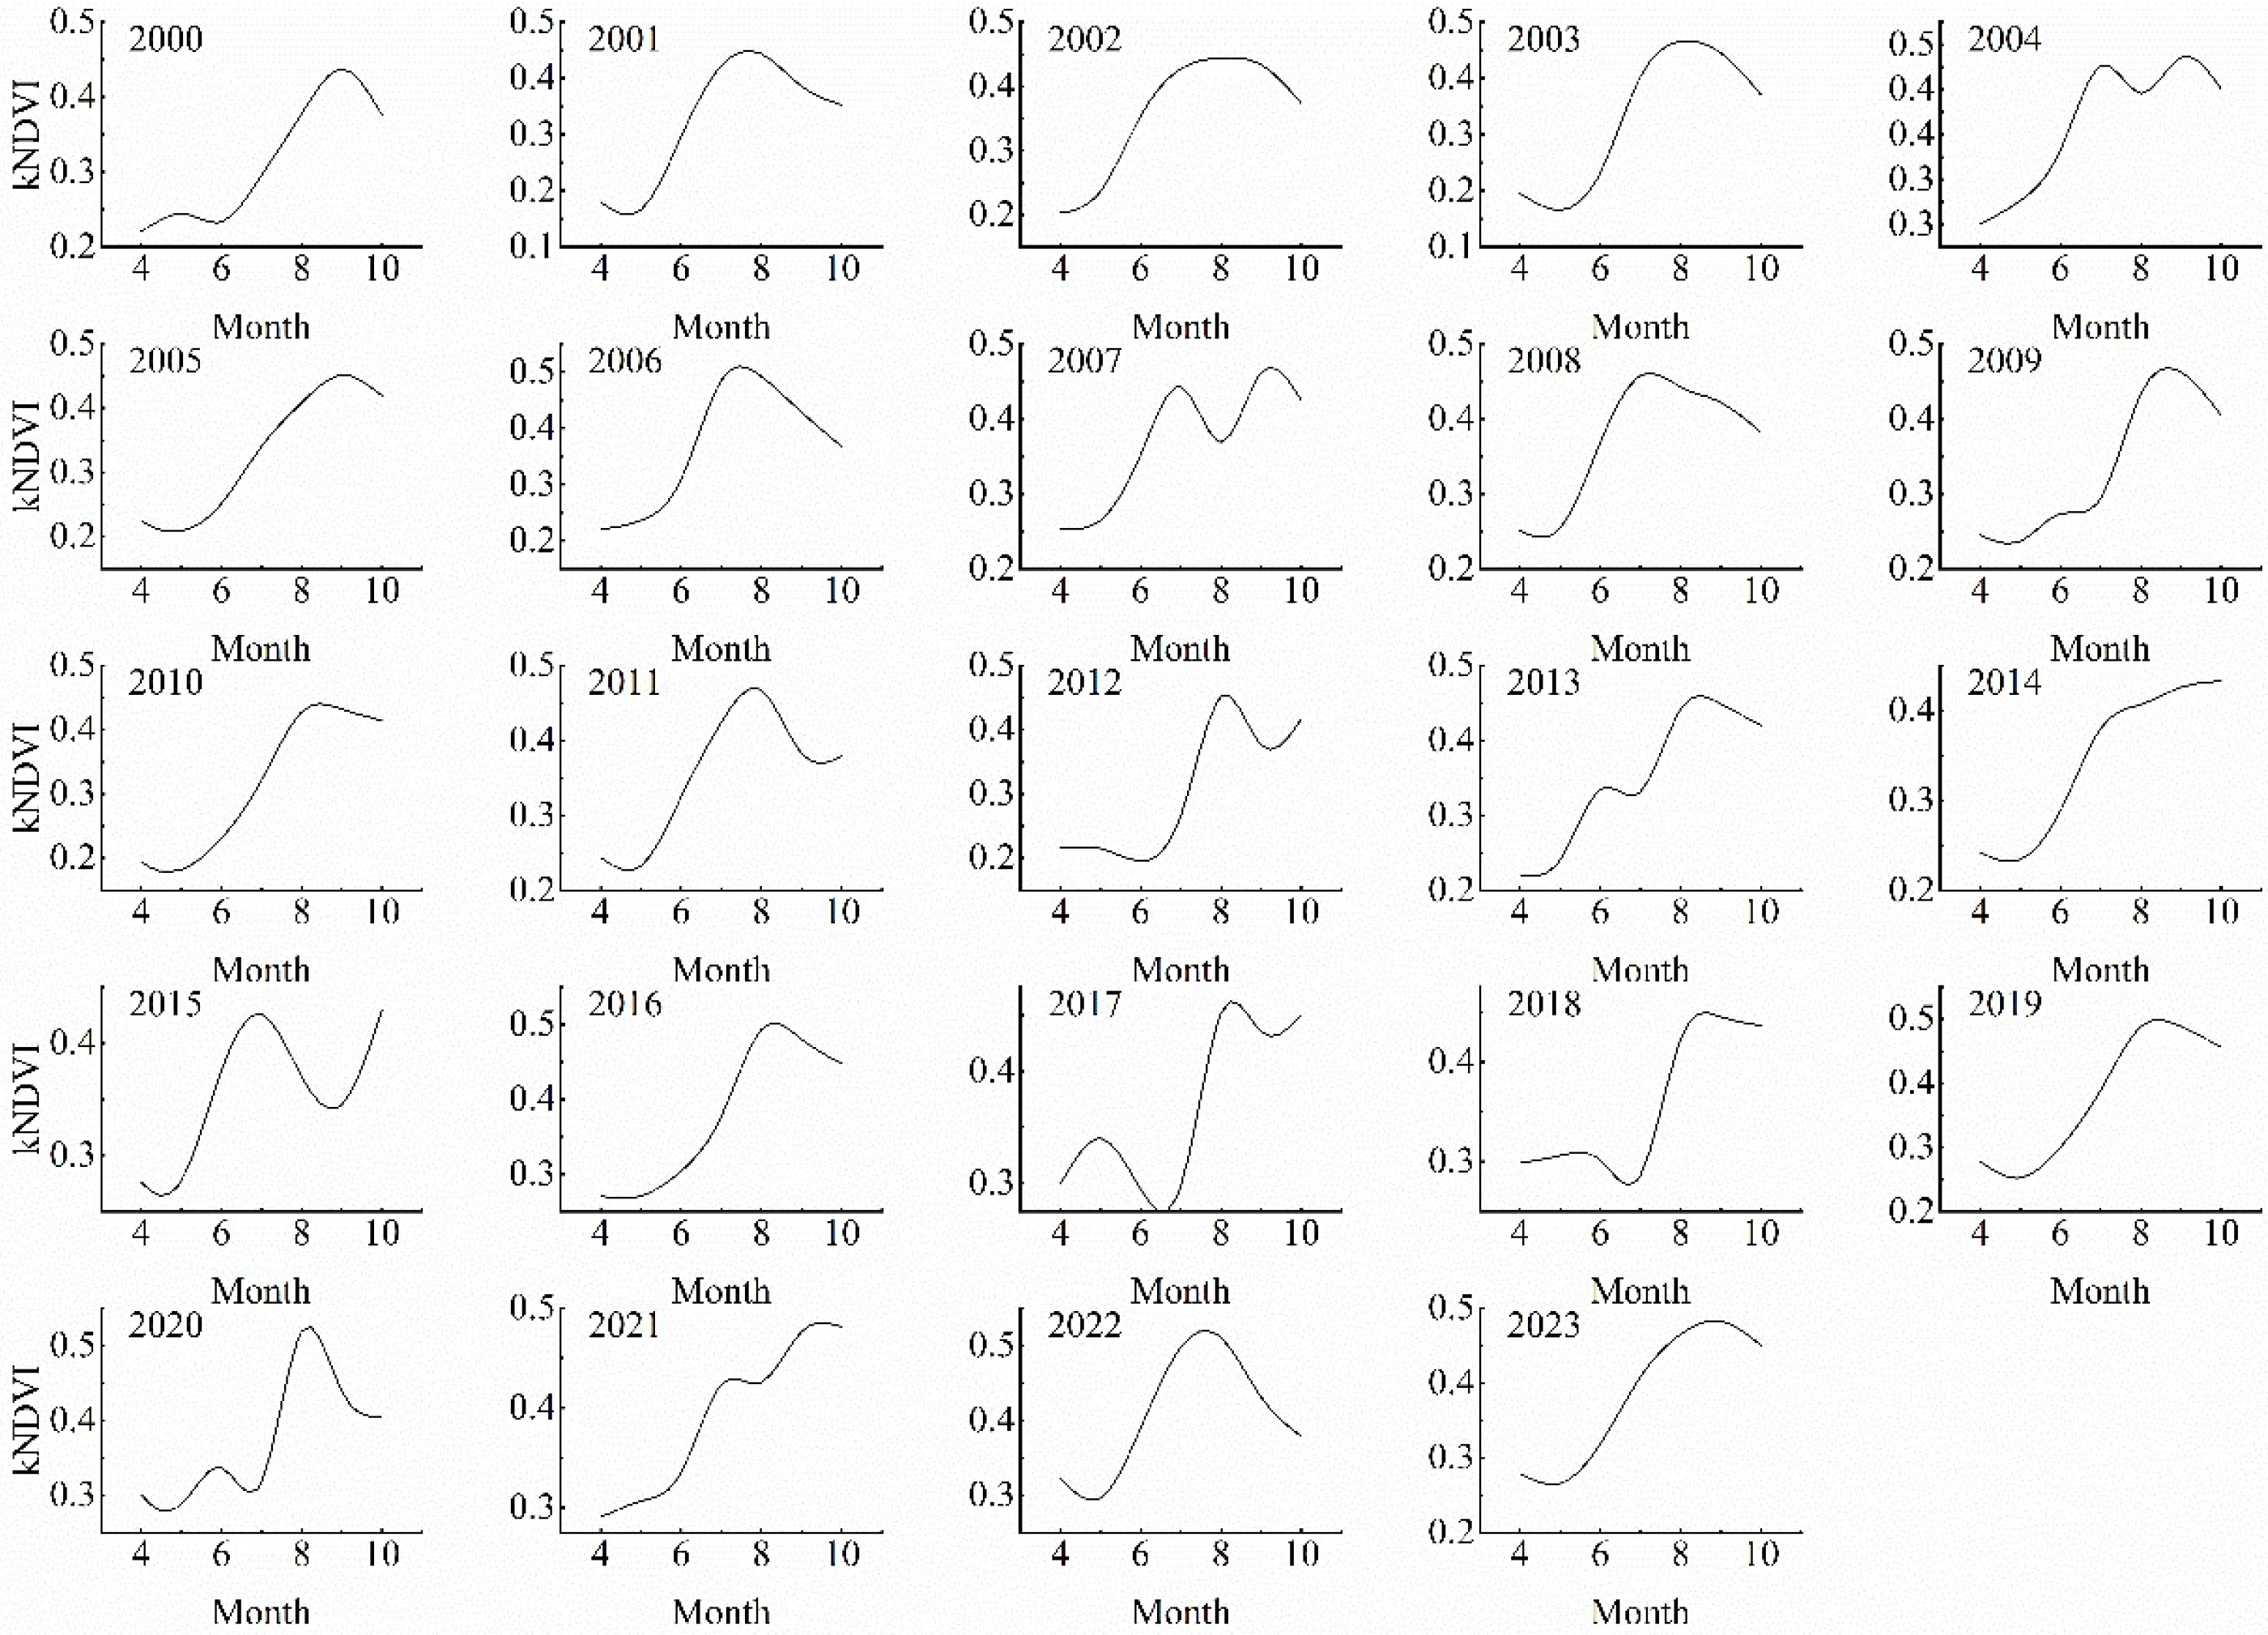
Figure 4 depicts the monthly variations in kNDVI during the growing season in Kunming City from 2000 to 2023. Overall, the kNDVI exhibits a trend featuring an initial increase, followed by a subsequent decrease, with substantial fluctuations, reaching its peak from August to October. From 2000 to 2011, monthly kNDVI values exhibited a progressive upward trend, with peak monthly values ranging from 0.432 to 0.492. During 2012–2023, monthly kNDVI values showed a pronounced increase, reaching a maximum value of 0.510. This sustained growth signifies gradual ecological recovery, reflecting improved vegetation conditions in the study area.

3.1.3. Regional Changes in kNDVI

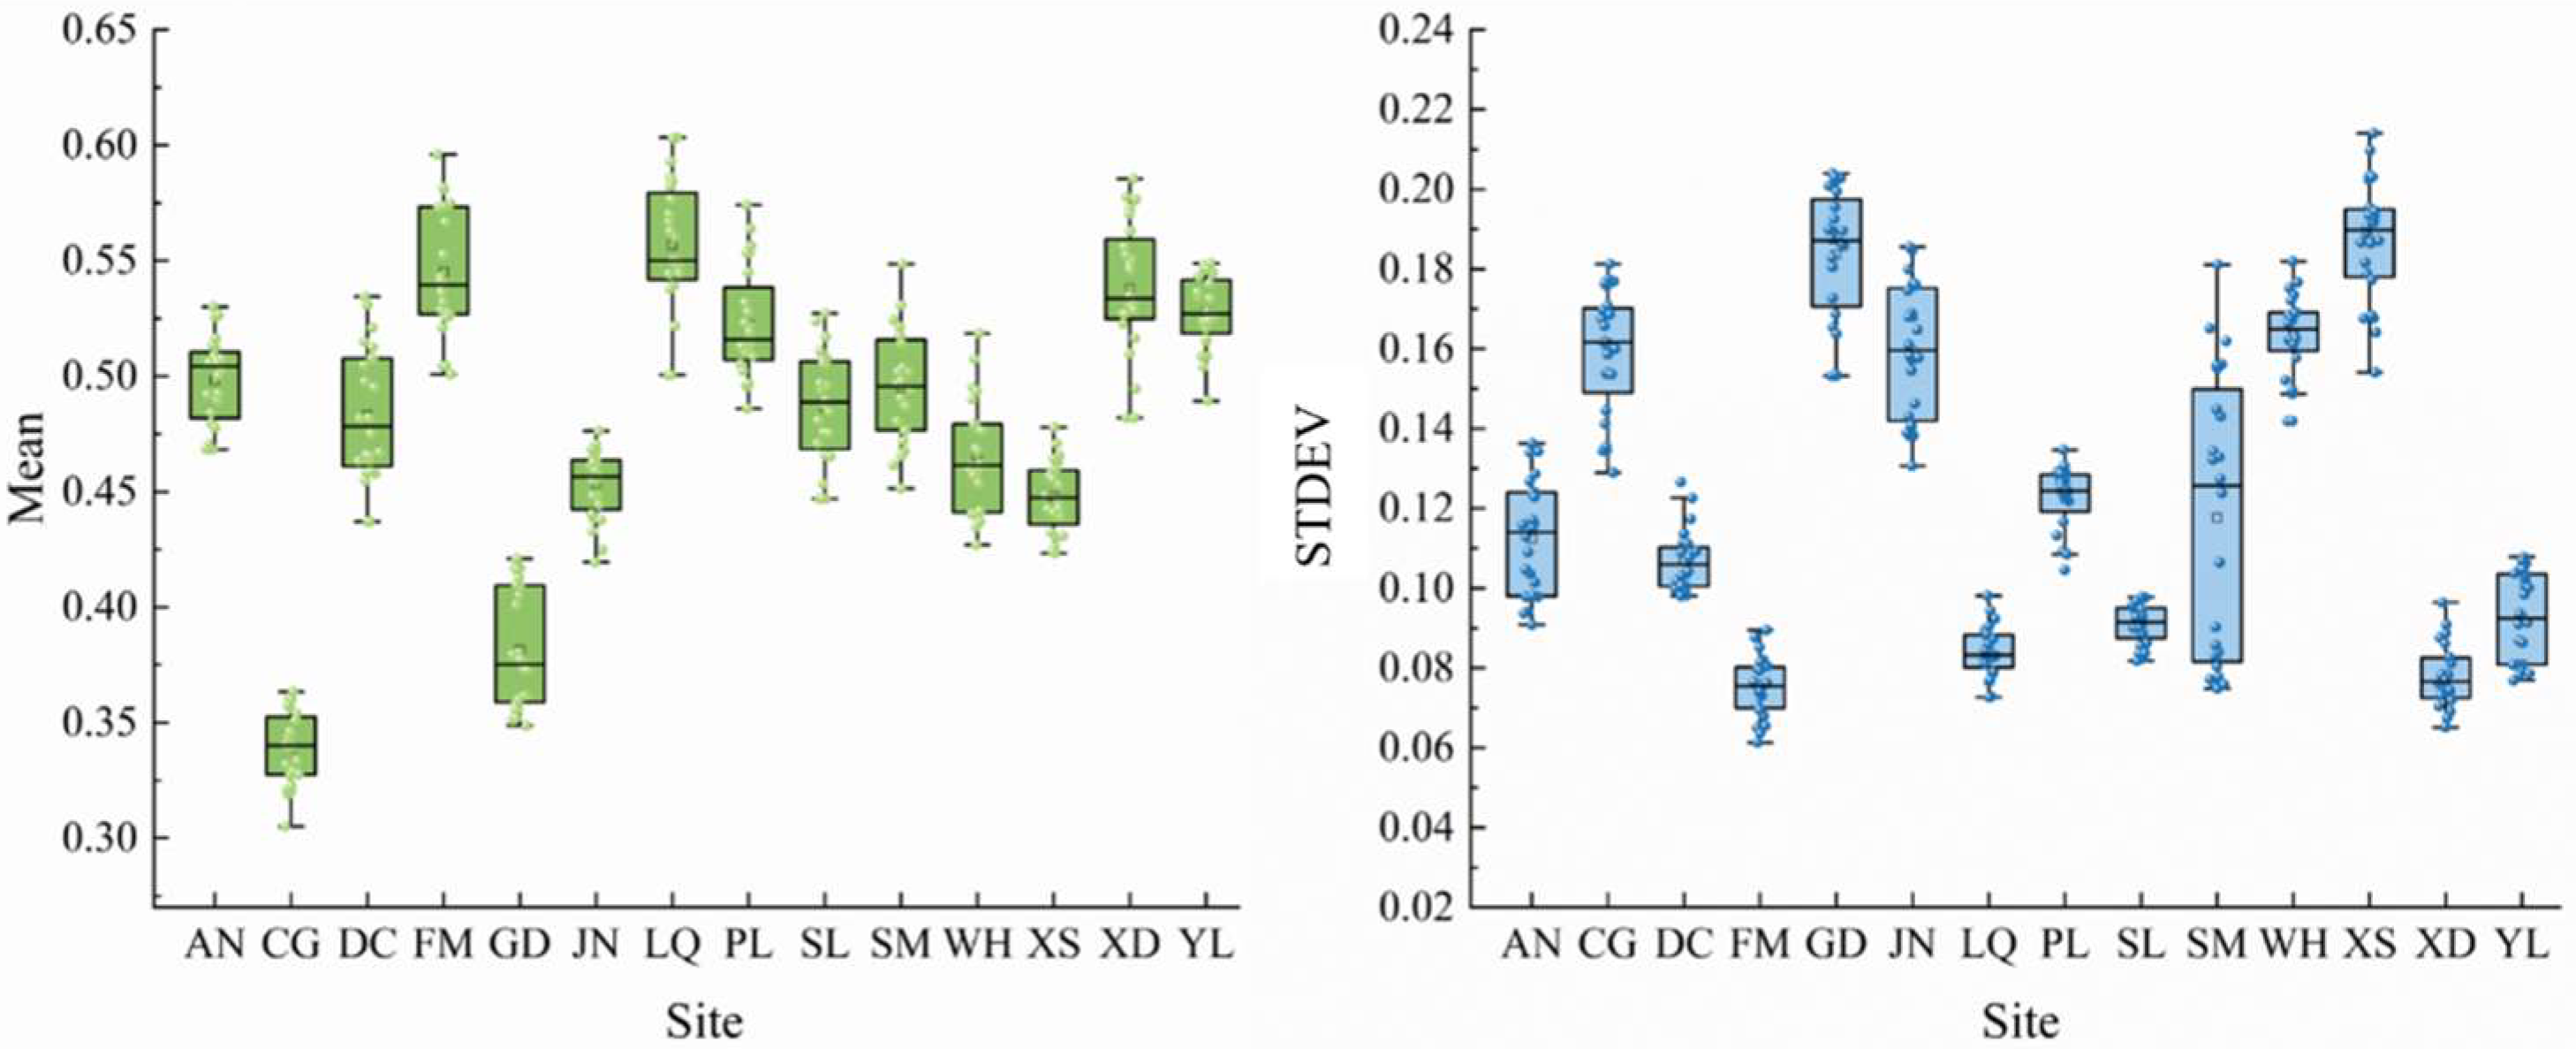
Figure 5 depicts the spatial distribution characteristics of the mean and standard deviation of kNDVI across 14 districts and counties in Kunming City over a 24-year study period. As shown in the figure, during the time span from 2000 to 2023, LQ had the highest multi-year average vegetation coverage value of 0.557 in Kunming City, followed successively by FM, XD, and YL. In contrast, CG had the lowest such value, which was 0.339. Standard deviation analysis revealed that, over the mentioned period, FM showed the least degree of variability, and XD, LQ, SL, YL, DC, and PL exhibited relative stability in vegetation coverage. By contrast, SM, CG, GD, JN, and XS were characterized by more significant fluctuations, indicating greater dynamism in their vegetative states during this study period.

3.2. Stability Analysis of kNDVI

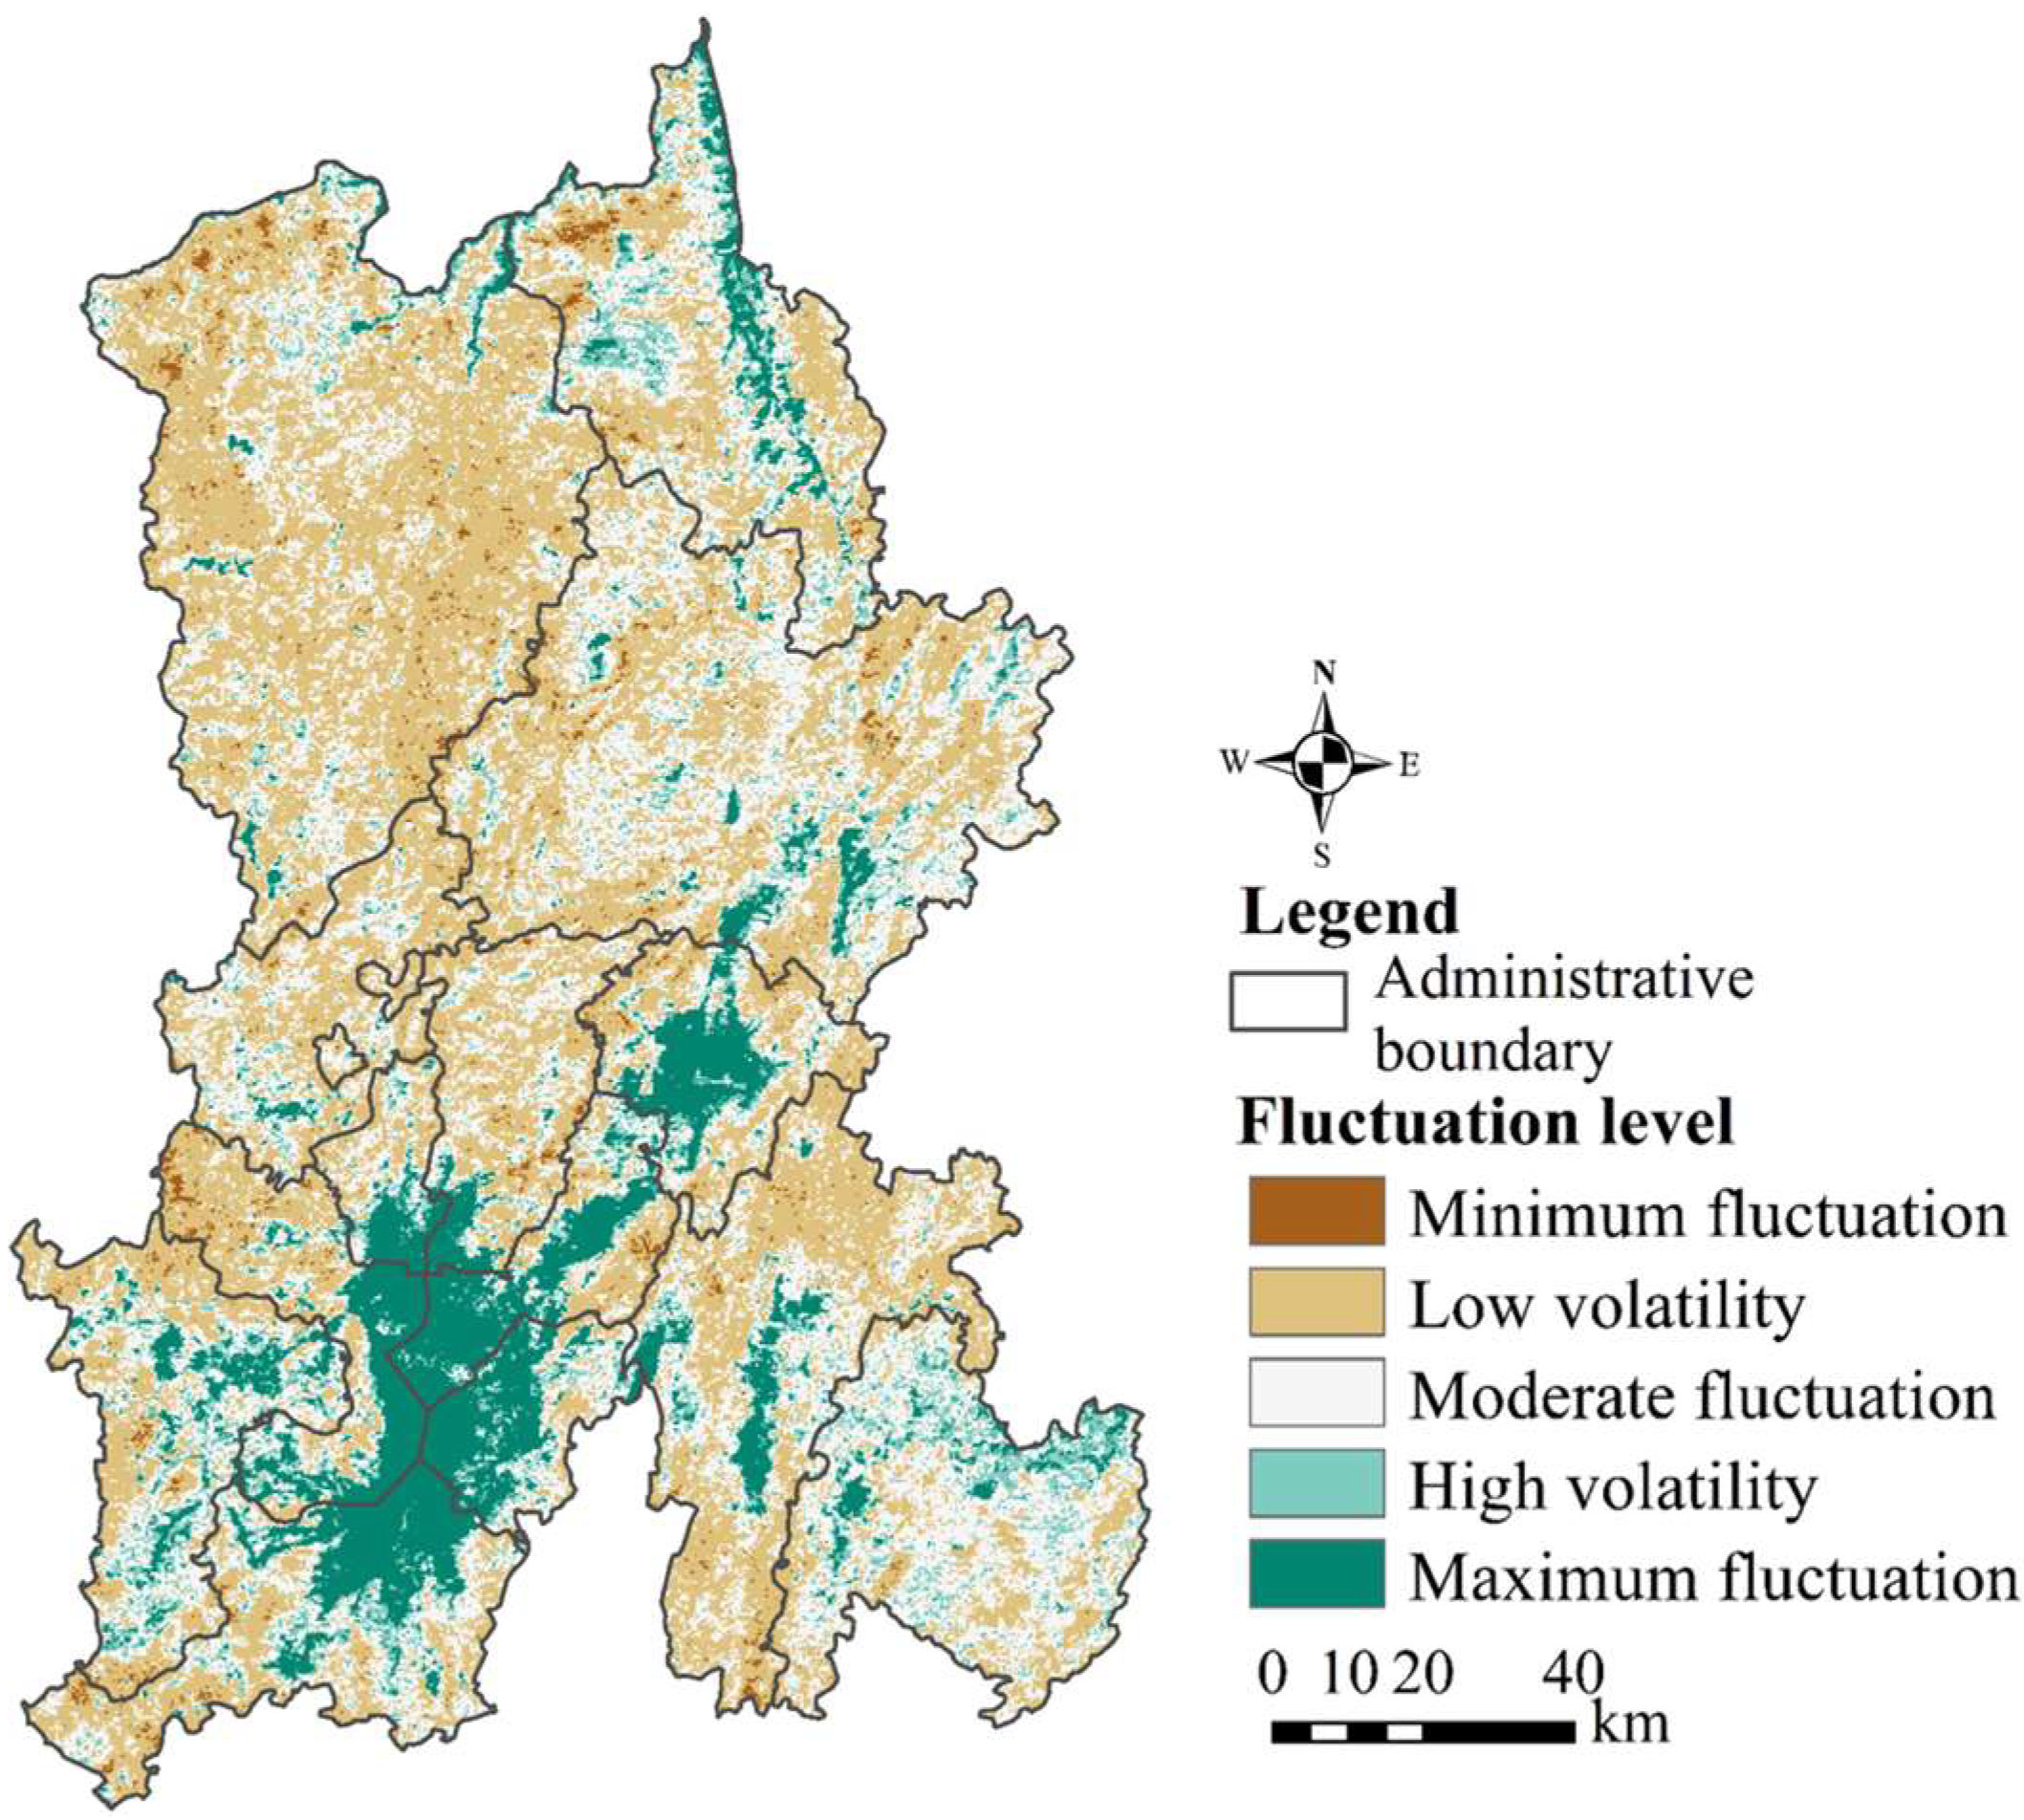
The CV can describe the degree of dispersion of a set of data. In this research, the CV was computed for each pixel of the growing-season kNDVI in Kunming City to determine the distribution of kNDVI stability. Overall, the kNDVI stability within the study area from 2000 to 2023 demonstrated mild and moderate fluctuations (Figure 6 and Table 3). Based on the statistical outcomes of the CV classification, areas with mild fluctuations accounted for 44.0%. These areas were mainly distributed in the northern forested regions of Kunming, where human activities have less impact. Regions with the most significant fluctuations constituted 11.0% of the total area. They were predominantly located around Dianchi Lake and in the central parts of GD, SM, and YL. The primary cause of these significant fluctuations is likely regional development and urban expansion. These factors have led to substantial changes in the land surface, resulting in the most remarkable variations in vegetation coverage. Areas with moderate fluctuations accounted for 34.8%. Notably, in DC, AN, and SL, regions with moderate and high fluctuations were interspersed, indicating that these areas may be affected by urbanization and development.

3.3. Trends Analysis of kNDVI

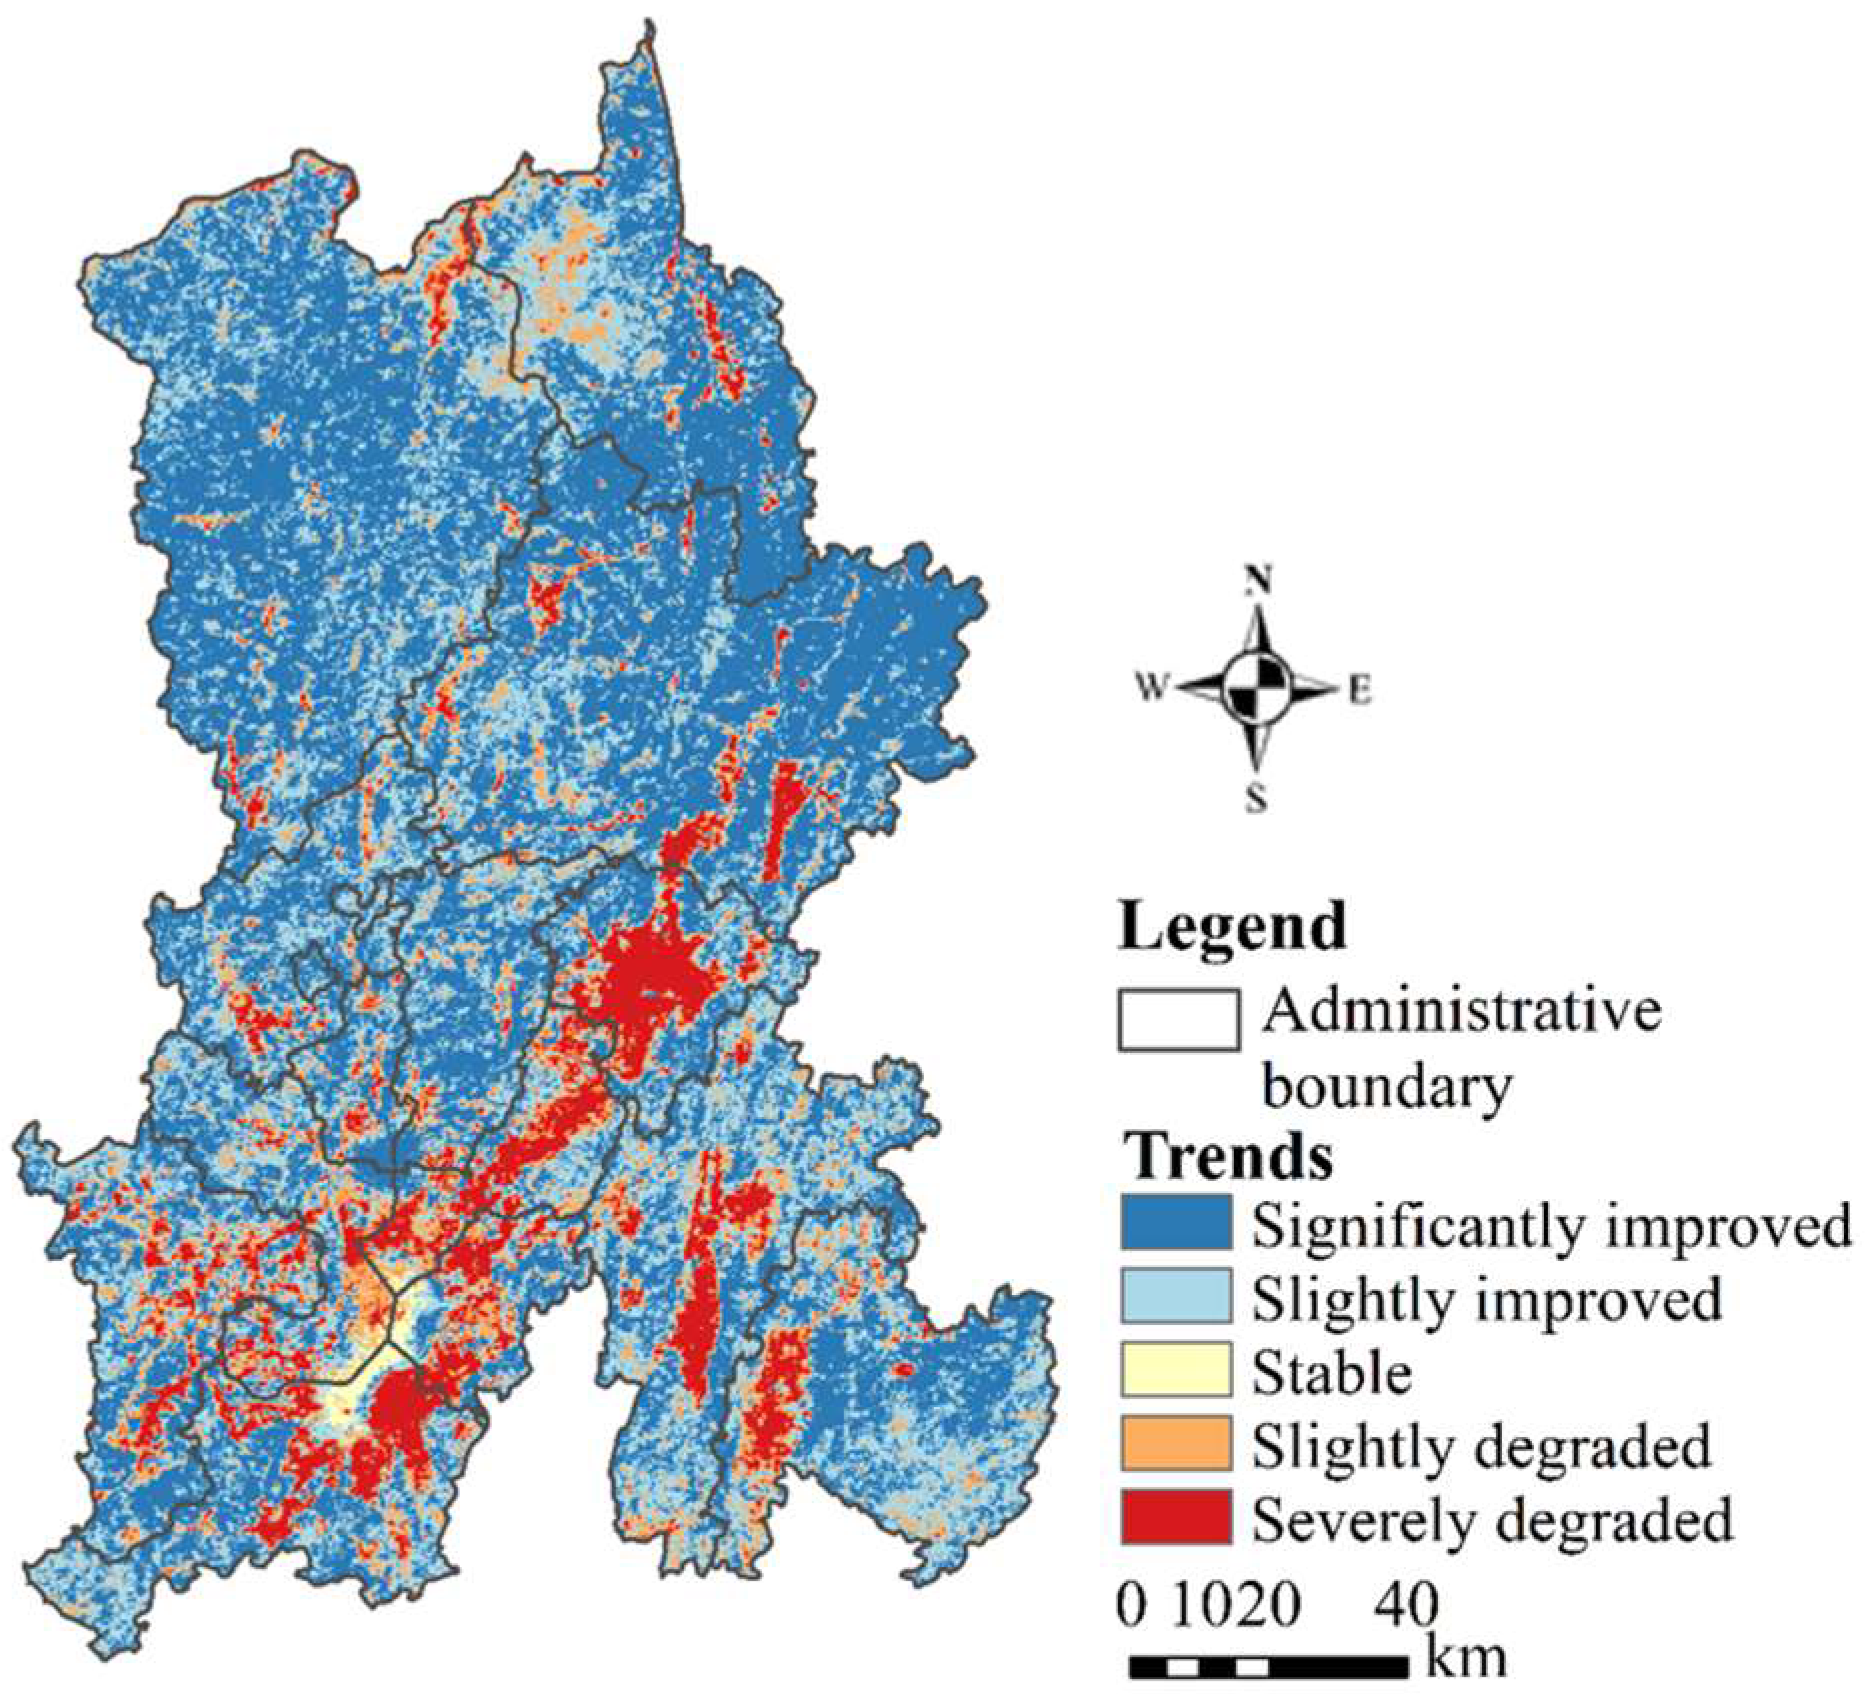
This research utilized trend analysis to investigate the spatial distribution trends of growing-season kNDVI alterations in Kunming City from 2000 to 2023. The results of the significance tests for vegetation coverage changes reveal that the kNDVI exhibited a highly significant increase in 49.8% of the area in Kunming, a significant increase in 30.4%, a significant decrease in 10.8%, and a highly significant decrease in 8.509% (Figure 7). Overall, the area demonstrating a remarkable increase in kNDVI exceeded the area undergoing a decline, with a difference of 61.0%. Moreover, 0.5% of the area showed no significant change in kNDVI. The regions with enhanced vegetation were mainly distributed in the northern parts of LQ, DC, and XD. Regions with stable kNDVI were mainly located in the border areas of CG, JN, and XS. The areas exhibiting degradation were primarily located within the central urban zone of Kunming, as well as in SM, YL, SL, and GD.

3.4. GDM Analysis of kNDVI

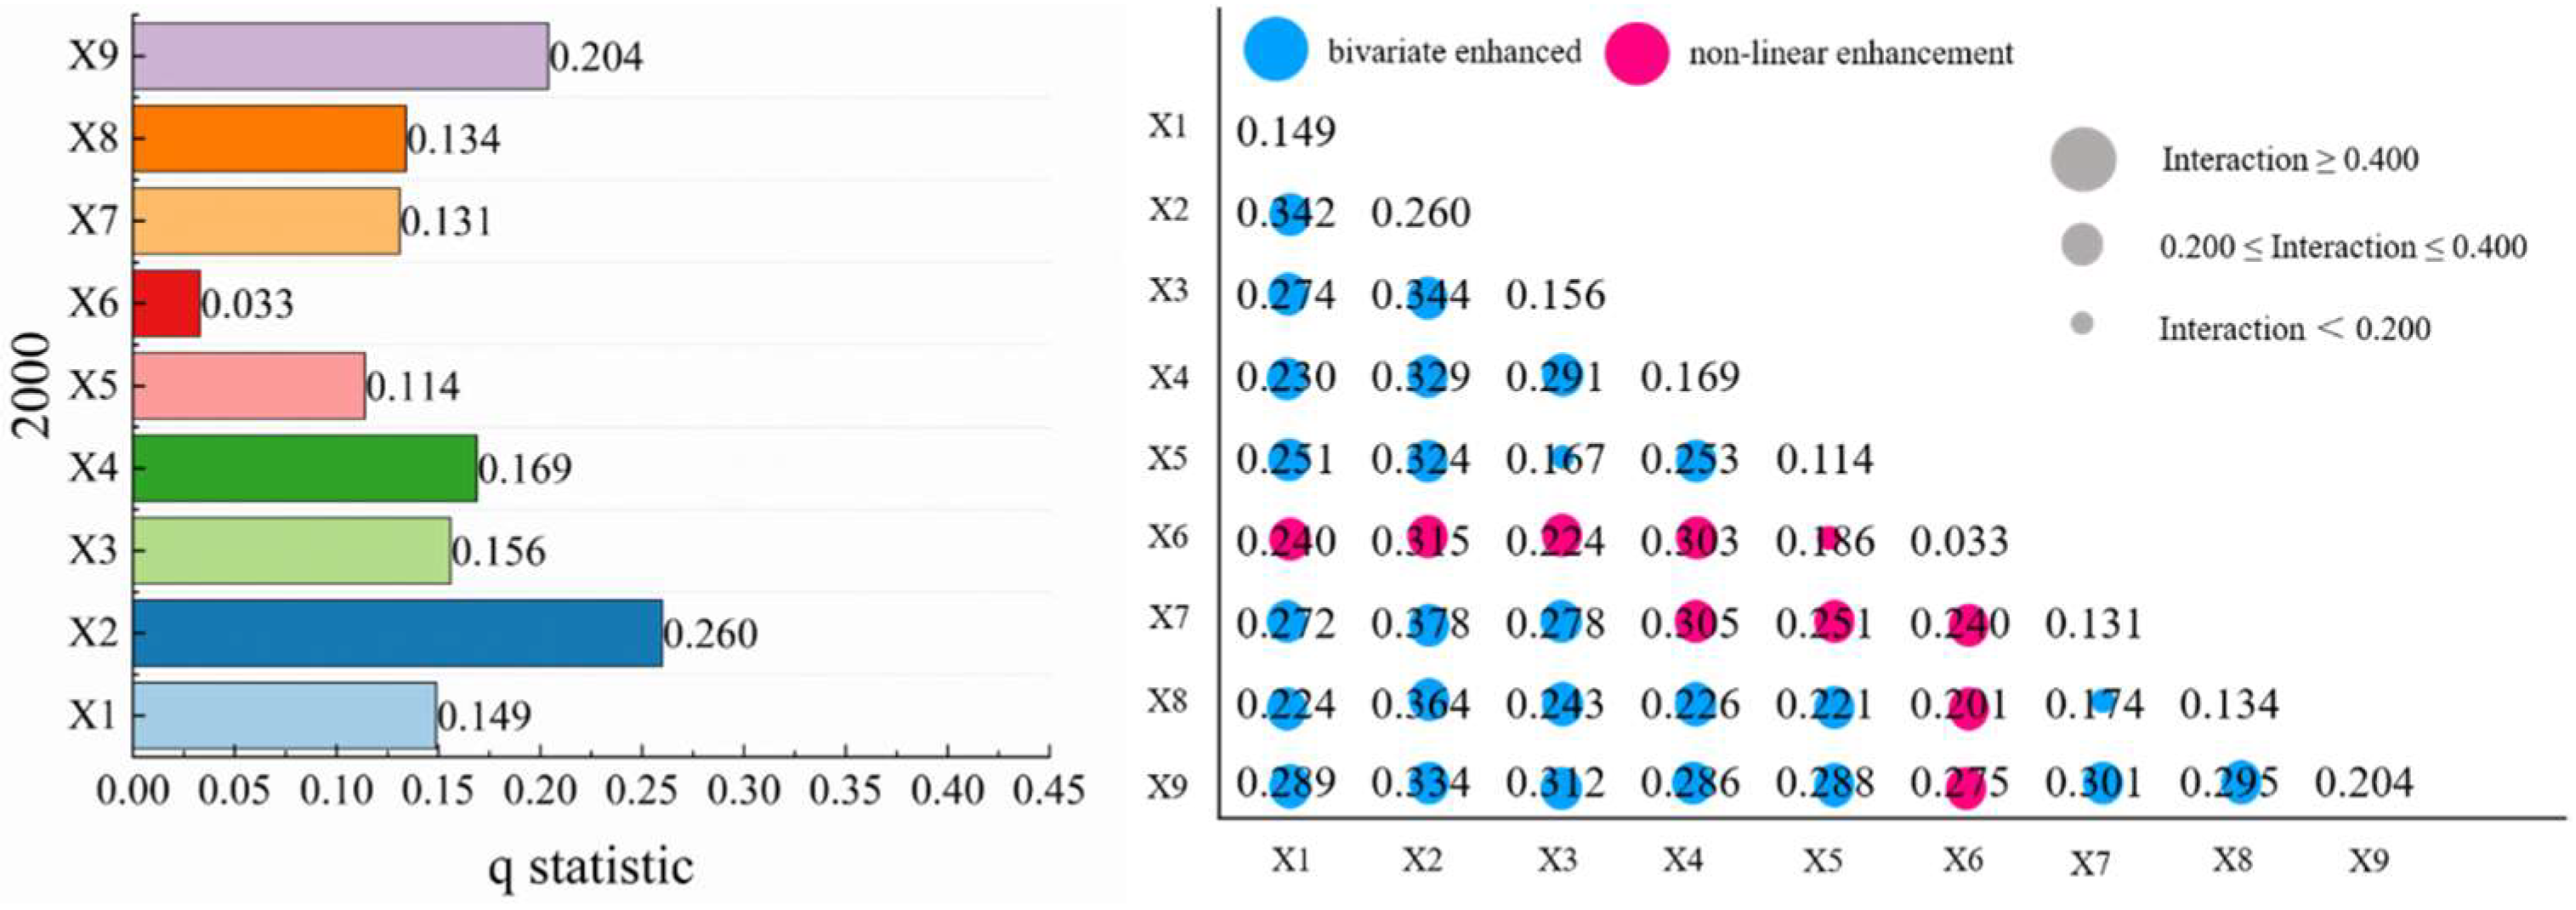
The factor detector was employed to calculate the q-statistics for nine factors, quantifying their relative influence on vegetation kNDVI. A higher q-value indicates a stronger explanatory power of the factor on vegetation dynamics. Results from the figure show that p-values were less than 0.001 for all five base years analyzed. Based on the mean q-statistic values across these five years, soil type demonstrated the highest explanatory power (29.5%), followed by landform type (29.1%), nighttime light intensity (28.1%), and slope (25.2%). Rainfall exhibited the lowest explanatory power (7.6%), indicating its relatively weak influence on vegetation dynamic changes.
The interaction detector was employed to quantify the interactive effects of each factor on vegetation dynamics. Results demonstrate that the interaction q-statistic for any two factors consistently exceeded that of their single factor (Figure 8), indicating that synergistic interactions amplify the explanatory power beyond single-factor effects. Across all analyses, interactions predominantly exhibited bivariate enhancement. Notably, the interaction between annual rainfall and other factors frequently manifested nonlinear enhancement. Specifically, interaction effects between soil type and nighttime light consistently surpassed 0.364, while the slope–nighttime light interaction in 2020 peaked at 0.558. These findings identify soil type, landform type, nighttime light, and slope as the dominant influencing factor of vegetation change in Kunming City.

4. Discussion

In recent years, China has been attending to the construction of ecological civilization, with the vegetation coverage rate increasing at a rate of 0.09%/a [32]. With the continuous improvement in satellite remote sensing technology, it is possible to collect vegetation remote sensing data with real-time updates, wide coverage, and a continuous time scale [33]. The long-term dynamic change in the vegetation coverage rate has been well recorded in previous studies [34,35,36]. Huo et al. found that the area of decreasing vegetation was twice as large as the area of increasing vegetation in northwest Yunnan, evidencing a decreasing trend [37]. However, in our study, vegetation showed an overall improving trend although it fluctuated during the study period. Our results showed spatial and temporal heterogeneity of the vegetation dynamics in Kunming City, similar to those reported in other plateau regions, such as the Qinghai-Tibet Plateau [38]. Soil types, topographical features, climate, study areas, and study periods in different regions may influence the different trends observed [37,39].
The dynamic changes in kNDVI in Kunming City exhibit spatiotemporal heterogeneity. The elevated temperatures and reduced precipitation levels in Yunnan Province during the spring and summer seasons have impeded the growth of vegetation, resulting in a delayed response in precipitation patterns [40]. This may be the reason for the lower kNDVI values observed in April and June. Over the past two decades, with the relocation of university towns to CG, an increase in the migrant population, and economic development, areas such as CG, GD, and XS have experienced significant vegetation fluctuations. These factors may also be responsible for the kNDVI values in Kunming city being below the multi-year average during 2009–2015 [41]. Yunnan has encountered several instances of drought events over the past 24 years, with a notable prevalence of such events occurring between the years 2009 and 2012 [42,43]. The occurrence of droughts is likely a primary factor contributing to the notable variations and reductions in the kNDVI values observed in Kunming City during this timeframe. From an interannual perspective, the kNDVI values observed in Kunming City are relatively good, with a mean kNDVI value of 0.509. The vegetation kNDVI exhibited a progressive improvement trend, aligning with findings from prior studies [44,45,46]. Overall, the kNDVI values in Kunming City have exhibited an increasing trajectory over the past 24 years, with significant improvements in the ecological environment. The area showing significant improvement accounts for 49.8% of the total.
Kunming is a highland mountainous city with complex and diverse topography. The study period saw significant climate changes [42,47]. The evolution of kNDVI is affected to varying degrees by diverse climatic factors and human activities. Based on the results of the Geographical Detector Method (GDM), from 2000 to 2023, factors identified annually, including soil type, nighttime light, slope, landform type, and land-cover type, consistently ranked among the top influencing factors. Among natural factors, soil type had the highest multi-year average q-values of 0.295. Among anthropogenic factors, nighttime light and land-cover type had the highest multi-year average q-values, with values of 0.281 and 0.233, respectively. Furthermore, the study revealed that the q-values associated with the influencing factors demonstrated significant temporal variations, generally presenting an upward trend. Nighttime light serves as an evaluation index for regional economic development and at the same time reflects the intensity of human activities. Although its standalone influence on vegetation is limited, nighttime light demonstrates significantly enhanced explanatory power when interacting with natural factors (e.g., soil type, slope). This synergistic effect underscores the multi-factorial nature of vegetation dynamics in Kunming, where anthropogenic and natural factors jointly shape ecological patterns. Although we constructed a long time series of vegetation monitoring data in the growing season of plateau cities and used various methods to study its spatial and temporal dynamics and influencing factors, there are still some uncertainties and limitations. Firstly, due to the complex terrain and prolonged cloud cover characteristic of plateau cities, we used vegetation coverage data with a resolution of 250 m. Higher resolution monitoring data will be essential in the future to mitigate the effects of mixed pixels. Moreover, the response of vegetation to current climate change may be affected by temporal lags and cumulative effects. In future studies, we also need to consider the lag between the years for covariate and vegetation observations.

5. Conclusions

By employing the NDVI dataset in conjunction with nine categories of influencing-factor data sources, this study investigated the spatiotemporal evolution characteristics and underlying mechanisms that affect the growing-season kNDVI in the highland mountainous urban region. The results indicate:
(1)
The kNDVI in Kunming City demonstrated a favorable condition and exhibited an upward trend, with an annual growth rate of 2.4% per decade. Areas with high kNDVI (0.571–0.691) account for 30.2% of the total area of Kunming, indicating overall good vegetation status.
(2)
Over the past 24 years, approximately 49.8% of the area in Kunming has seen significant improvement, which is significantly greater than the 19.3% of the area experiencing vegetation degradation. Spatial heterogeneity is reflected in vegetation fluctuation characteristics. Areas with larger fluctuations tend to be more densely populated, while regions with smaller fluctuations are mainly forested areas.
(3)
The detection results for the influencing factors reveal that soil type has an average explanatory power of 29.5% over a five-year period and is the primary influencing factor. Landform type, nighttime light, and slope are secondary influencing factors. The interactions among factors exhibit greater explanatory power than individual factors independently. They indicate a bivariate enhanced and nonlinear enhancement relationship when two factors act in combination.

Author Contributions

Conceptualization, Z.L. and W.W.; methodology, Z.L.; software, Z.L. and W.W.; validation, W.H., Z.L. and W.W.; formal analysis, Z.L. and W.W.; investigation, Z.L.; resources, Z.L.; data curation, Z.L.; writing—original draft preparation, Z.L. and W.W.; writing—review and editing, Z.L., Y.D., W.H. and W.W.; visualization, Z.L.; supervision, W.H.; project administration, Y.D.; funding acquisition, Y.D. All authors have read and agreed to the published version of the manuscript.

Funding

This research was funded by the National Key R&D Program of China (Grant Number: 2024YFF1306705) and the Fundamental Research Project of Yunnan Province (Grant number: 202201AT070208).

Data Availability Statement

The original contributions presented in this study are included in the article. Further inquiries can be directed to the corresponding author.

Acknowledgments

We thank Liming Ma for helping to collect part of the data and for support in the field. We also thank Liuming Wang and Yungang Li (Institute of International Rivers and Eco-Security, Yunnan University, Kunming, China) for the valuable suggestions.

Conflicts of Interest

The authors declare no conflicts of interest.

References

  1. Fu, B.-J.; Wang, S.; Liu, Y.; Liu, J.; Liang, W.; Miao, C. Hydrogeomorphic Ecosystem Responses to Natural and Anthropogenic Changes in the Loess Plateau of China. Annu. Rev. Earth Planet. Sci. 2017, 45, 223–243. [Google Scholar] [CrossRef]
  2. Hua, W.; Chen, H.; Zhou, L.; Xie, Z.; Qin, M.; Li, X.; Ma, H.; Huang, Q.; Sun, S. Observational Quantification of Climatic and Human Influences on Vegetation Greening in China. Remote Sens. 2017, 9, 425. [Google Scholar] [CrossRef]
  3. Ding, Z.; Peng, J.; Qiu, S.; Zhao, Y. Nearly Half of Global Vegetated Area Experienced Inconsistent Vegetation Growth in Terms of Greenness, Cover, and Productivity. Earth’s Future 2020, 8, e2020EF001618. [Google Scholar] [CrossRef]
  4. Bonan, G.; Pollard, D.; Thompson, S. Effects of Boreal Forest Vegetation on Global Climate. Nature 1992, 359, 716–718. [Google Scholar] [CrossRef]
  5. Chen, C.; Park, T.; Wang, X.; Piao, S.; Xu, B.; Chaturvedi, R.; Fuchs, R.; Brovkin, V.; Ciais, P.; Fensholt, R.; et al. China and India Lead in Greening of the World through Land-Use Management. Nat. Sustain. 2019, 2, 122–129. [Google Scholar] [CrossRef]
  6. Liu, H.; Zhang, M.; Lin, Z.; Xu, X. Spatial Heterogeneity of the Relationship between Vegetation Dynamics and Climate Change and Their Driving Forces at Multiple Time Scales in Southwest China. Agric. For. Meteorol. 2018, 256–257, 10–21. [Google Scholar] [CrossRef]
  7. Xie, B.; Jia, X.; Qin, Z.; Shen, J.; Chang, Q. Vegetation Dynamics and Climate Change on the Loess Plateau, China: 1982–2011. Reg. Environ. Change 2016, 16, 1583–1594. [Google Scholar] [CrossRef]
  8. Xue, Y.; Zhang, B.; He, C.; Shao, R. Detecting Vegetation Variations and Main Drivers over the Agropastoral Ecotone of Northern China through the Ensemble Empirical Mode Decomposition Method. Remote Sens. 2019, 11, 1860. [Google Scholar] [CrossRef]
  9. Hu, M.; Xia, B. A Significant Increase in the Normalized Difference Vegetation Index during the Rapid Economic Development in the Pearl River Delta of China. Land Degrad. Dev. 2019, 30, 359–370. [Google Scholar] [CrossRef]
  10. Fensholt, R.; Proud, S.R. Evaluation of Earth Observation Based Global Long Term Vegetation Trends—Comparing GIMMS and MODIS Global NDVI Time Series. Remote Sens. Environ. 2012, 119, 131–147. [Google Scholar] [CrossRef]
  11. Jiao, W.; Wang, L.; Smith, W.; Chang, Q.; Wang, H.; D’Odorico, P. Observed Increasing Water Constraint on Vegetation Growth over the Last Three Decades. Nat. Commun. 2021, 12, 3777. [Google Scholar] [CrossRef]
  12. Gao, X.; Huete, A.R.; Ni, W.; Miura, T. Optical–Biophysical Relationships of Vegetation Spectra without Background Contamination. Remote Sens. Environ. 2000, 74, 609–620. [Google Scholar] [CrossRef]
  13. Alencar, A.; Shimbo, J.Z.; Lenti, F.; Balzani Marques, C.; Zimbres, B.; Rosa, M.; Arruda, V.; Castro, I.; Fernandes Márcico Ribeiro, J.P.; Varela, V.; et al. Mapping Three Decades of Changes in the Brazilian Savanna Native Vegetation Using Landsat Data Processed in the Google Earth Engine Platform. Remote Sens. 2020, 12, 924. [Google Scholar] [CrossRef]
  14. Thenkabail, P.S.; Smith, R.B.; De Pauw, E. Hyperspectral Vegetation Indices and Their Relationships with Agricultural Crop Characteristics. Remote Sens. Environ. 2000, 71, 158–182. [Google Scholar] [CrossRef]
  15. Camps-Valls, G.; Campos-Taberner, M.; Moreno, A.; Walther, S.; Duveiller, G.; Cescatti, A.; Mahecha, M.; Muñoz, J.; García-Haro, F.; Guanter, L.; et al. A Unified Vegetation Index for Quantifying the Terrestrial Biosphere. Sci. Adv. 2021, 7, eabc7447. [Google Scholar] [CrossRef]
  16. Feng, X.; Tian, J.; Wang, Y.; Wu, J.; Liu, J.; Ya, Q.; Li, Z. Spatio-Temporal Variation and Climatic Driving Factors of Vegetation Coverage in the Yellow River Basin from 2001 to 2020 Based on kNDVI. Forests 2023, 14, 620. [Google Scholar] [CrossRef]
  17. Zhao, L.; Dai, A.; Dong, B. Changes in Global Vegetation Activity and Its Driving Factors during 1982–2013. Agric. For. Meteorol. 2018, 249, 198–209. [Google Scholar] [CrossRef]
  18. Zhao, Y.; Feng, Q.; Lu, A. Spatiotemporal Variation in Vegetation Coverage and Its Driving Factors in the Guanzhong Basin, NW China. Ecol. Inform. 2021, 64, 101371. [Google Scholar] [CrossRef]
  19. Jiang, H.; Xu, X.; Zhang, T.; Xia, H.; Huang, Y.; Qiao, S. The Relative Roles of Climate Variation and Human Activities in Vegetation Dynamics in Coastal China from 2000 to 2019. Remote Sens. 2022, 14, 2485. [Google Scholar] [CrossRef]
  20. Wang, J.-F.; Zhang, T.-L.; Fu, B.-J. A Measure of Spatial Stratified Heterogeneity. Ecol. Indic. 2016, 67, 250–256. [Google Scholar] [CrossRef]
  21. Zhang, C.; Bai, Z.; Li, X.; Rang, Q.; Wei, Z.; Lei, T.; Wang, N. Spatio-temporal evolution and attribution analysis of human effects of vegetation cover on the Loess Plateau from 2001 to 2018. Arid. Land Geogr. 2021, 44, 188–196. [Google Scholar]
  22. Liu, Z.; Hu, W.; Ma, L.; Huang, X. Spatio-Temporal Variations of Vegetation Cover and Its Influencing Factors in Highland Lake Basin. Front. Environ. Sci. 2024, 12, 1502208. [Google Scholar] [CrossRef]
  23. Zhang, S.; Nie, Y.; Zhang, H.; Li, Y.; Han, Y.; Liu, Y.; Wang, B. Spatiotemporal Variation of Vegetation NDVI and its Driving Forces in Inner Mongolia Based on Geodetector. Acta Agrestia Sin. 2020, 28, 1460–1472. [Google Scholar]
  24. He, J.; Zhang, M.; Wang, P.; Wang, S.; Wang, X. Climate Characteristics of the Extreme Drought Events in Southwest China during Recent 50 Years. Acta Geogr. Sin. 2011, 66, 1179–1190. [Google Scholar]
  25. Fensholt, R.; Langanke, T.; Rasmussen, K.; Reenberg, A.; Prince, S.D.; Tucker, C.; Scholes, R.J.; Le, Q.B.; Bondeau, A.; Eastman, R.; et al. Greenness in Semi-Arid Areas across the Globe 1981–2007—An Earth Observing Satellite Based Analysis of Trends and Drivers. Remote Sens. Environ. 2012, 121, 144–158. [Google Scholar] [CrossRef]
  26. Mu, B.; Zhao, X.; Wu, D.; Wang, X.; Zhao, J.; Wang, H.; Zhou, Q.; Du, X.; Liu, N. Vegetation Cover Change and Its Attribution in China from 2001 to 2018. Remote Sens. 2021, 13, 496. [Google Scholar] [CrossRef]
  27. Li, C.; Jia, X.; Zhu, R.; Mei, X.; Wang, D.; Zhang, X. Seasonal Spatiotemporal Changes in the NDVI and Its Driving Forces in Wuliangsu Lake Basin, Northern China from 1990 to 2020. Remote Sens. 2023, 15, 2965. [Google Scholar] [CrossRef]
  28. Cao, Y.; Zhou, S.; Yang, X. Vegetation dynamics and its response to climate change in Liaoning Province in last 20 years. Acta Ecol. Sin. 2022, 42, 5966–5979. [Google Scholar] [CrossRef]
  29. Chaudhari, K.; Thakkar, A. Neural Network Systems with an Integrated Coefficient of Variation-Based Feature Selection for Stock Price and Trend Prediction. Expert Syst. Appl. 2023, 219, 119527. [Google Scholar] [CrossRef]
  30. Deng, X.; Liu, Y.; Liu, Z.; Yao, J. Temporal-spatial dynamic change characteristics of evapotranspiration in arid region of Northwest China. Acta Ecol. Sin. 2017, 37, 2994–3008. [Google Scholar] [CrossRef]
  31. Wang, J.-F.; Hu, Y. Environmental Health Risk Detection with GeogDetector. Environ. Model. Softw. 2012, 33, 114–115. [Google Scholar] [CrossRef]
  32. Sun, G.; Guo, B.; Zang, W.; Huang, X.; Han, B.; Yang, X.; Chen, S.; Wei, C.; Wu, H. Spatial–Temporal Change Patterns of Vegetation Coverage in China and Its Driving Mechanisms over the Past 20 Years Based on the Concept of Geographic Division. Geomat. Nat. Hazards Risk 2020, 11, 2263–2281. [Google Scholar] [CrossRef]
  33. Zhang, H.; Zhu, C.; Jiao, T.; Luo, K.; Xu, M.; Wang, M. Analysis of the Trends and Driving Factors of Cultivated Land Utilization Efficiency in Henan Province from 2000 to 2020. Land 2024, 13, 2109. [Google Scholar] [CrossRef]
  34. Zhu, Z.; Piao, S.; Myneni, R.; Huang, M.; Zeng, Z.; Canadell, J.; Ciais, P.; Sitch, S.; Friedlingstein, P.; Arneth, A.; et al. Greening of the Earth and Its Drivers. Nat. Clim. Change 2016, 6, 791–795. [Google Scholar] [CrossRef]
  35. Zhu, L.; Meng, J.; Zhu, L. Applying Geodetector to Disentangle the Contributions of Natural and Anthropogenic Factors to NDVI Variations in the Middle Reaches of the Heihe River Basin. Ecol. Indic. 2020, 117, 106545. [Google Scholar] [CrossRef]
  36. Huang, S.; Zheng, X.; Ma, L.; Wang, H.; Huang, Q.; Leng, G.; Meng, E.; Guo, Y. Quantitative Contribution of Climate Change and Human Activities to Vegetation Cover Variations Based on GA-SVM Model. J. Hydrol. 2020, 584, 124687. [Google Scholar] [CrossRef]
  37. Huo, H.; Sun, C. Spatiotemporal Variation and Influencing Factors of Vegetation Dynamics Based on Geodetector: A Case Study of the Northwestern Yunnan Plateau, China. Ecol. Indic. 2021, 130, 108005. [Google Scholar] [CrossRef]
  38. Li, H.; Li, Y.; Shen, W.; Li, Y.; Lin, J.; Lu, X.; Xu, X.; Jiang, J. Elevation-Dependent Vegetation Greening of the Yarlung Zangbo River Basin in the Southern Tibetan Plateau, 1999–2013. Remote Sens. 2015, 7, 16672–16687. [Google Scholar] [CrossRef]
  39. Xu, M.; Ding, J.; Wang, T.; Lu, L.; Sun, H.; Zhang, F.; Cheng, X.; Nurmemet, I. A Pixel Dichotomy Coupled Linear Kernel-Driven Model for Estimating Fractional Vegetation Cover in Arid Areas from High-Spatial-Resolution Images. IEEE Trans. Geosci. Remote Sens. 2023, 61, 1–15. [Google Scholar] [CrossRef]
  40. Xiong, J.; Peng, C.; Cheng, W.; Li, W.; Liu, Z.; Fan, C.; Sun, H. Analysis of Vegetation Coverage Change in Yunnan Province Based on MODIS-NDVI. J. Geo-Inf. Sci. 2018, 20, 1830–1840. [Google Scholar] [CrossRef]
  41. Pan, Y. Research on Dynamic Early Warning of Urban Ecosystem Security in Yunnan Province. Master’s Thesis, Yunnan Normal University, Kunming, China, 2017. [Google Scholar]
  42. Yu, S.; Luo, Y.; Li, J. Climatology and changes of hourly precipitation with various intensities in Yunnan Province from 1982 to 2016. Torrential Rain Disasters 2020, 39, 363–371. [Google Scholar] [CrossRef]
  43. Tao, Y.; Zhang, W.; Duan, C.; Chen, Y.; Ren, J.; Xing, D.; He, Q. Climatic causes of continuous drought over Yunnan Province from 2009 to 2012. J. Yunnan Univ. 2014, 36, 866–874. [Google Scholar] [CrossRef]
  44. Xu, X.; Liu, J.; Zhou, X. Vegetation Classification and Coverage Based on RS/GIS Technology—A Case Study of Kunming City, Yunnan Province. For. Resour. Manag. 2019, 86–93. [Google Scholar] [CrossRef]
  45. Bian, L.; Ye, F.; Liu, S.; Wang, J.; Xu, J. Change Trend of Vegetation Cover in Kunming based on NDVI During 2001–2015. Shandong Agric. Sci. 2018, 50, 107–110. [Google Scholar] [CrossRef]
  46. Feng, X.; Zhang, X. Analysis of Vegetation Coverage Changes in Kunming from 2012 to 2021 Based on NDVI. Mod. Agric. 2022, 54–58. [Google Scholar] [CrossRef]
  47. Sun, H.; Wang, J.; Xiong, J.; Bian, J.; Jin, H.; Cheng, W.; Li, A. Vegetation Change and Its Response to Climate Change in Yunnan Province, China. Adv. Meteorol. 2021, 8857589. [Google Scholar] [CrossRef]
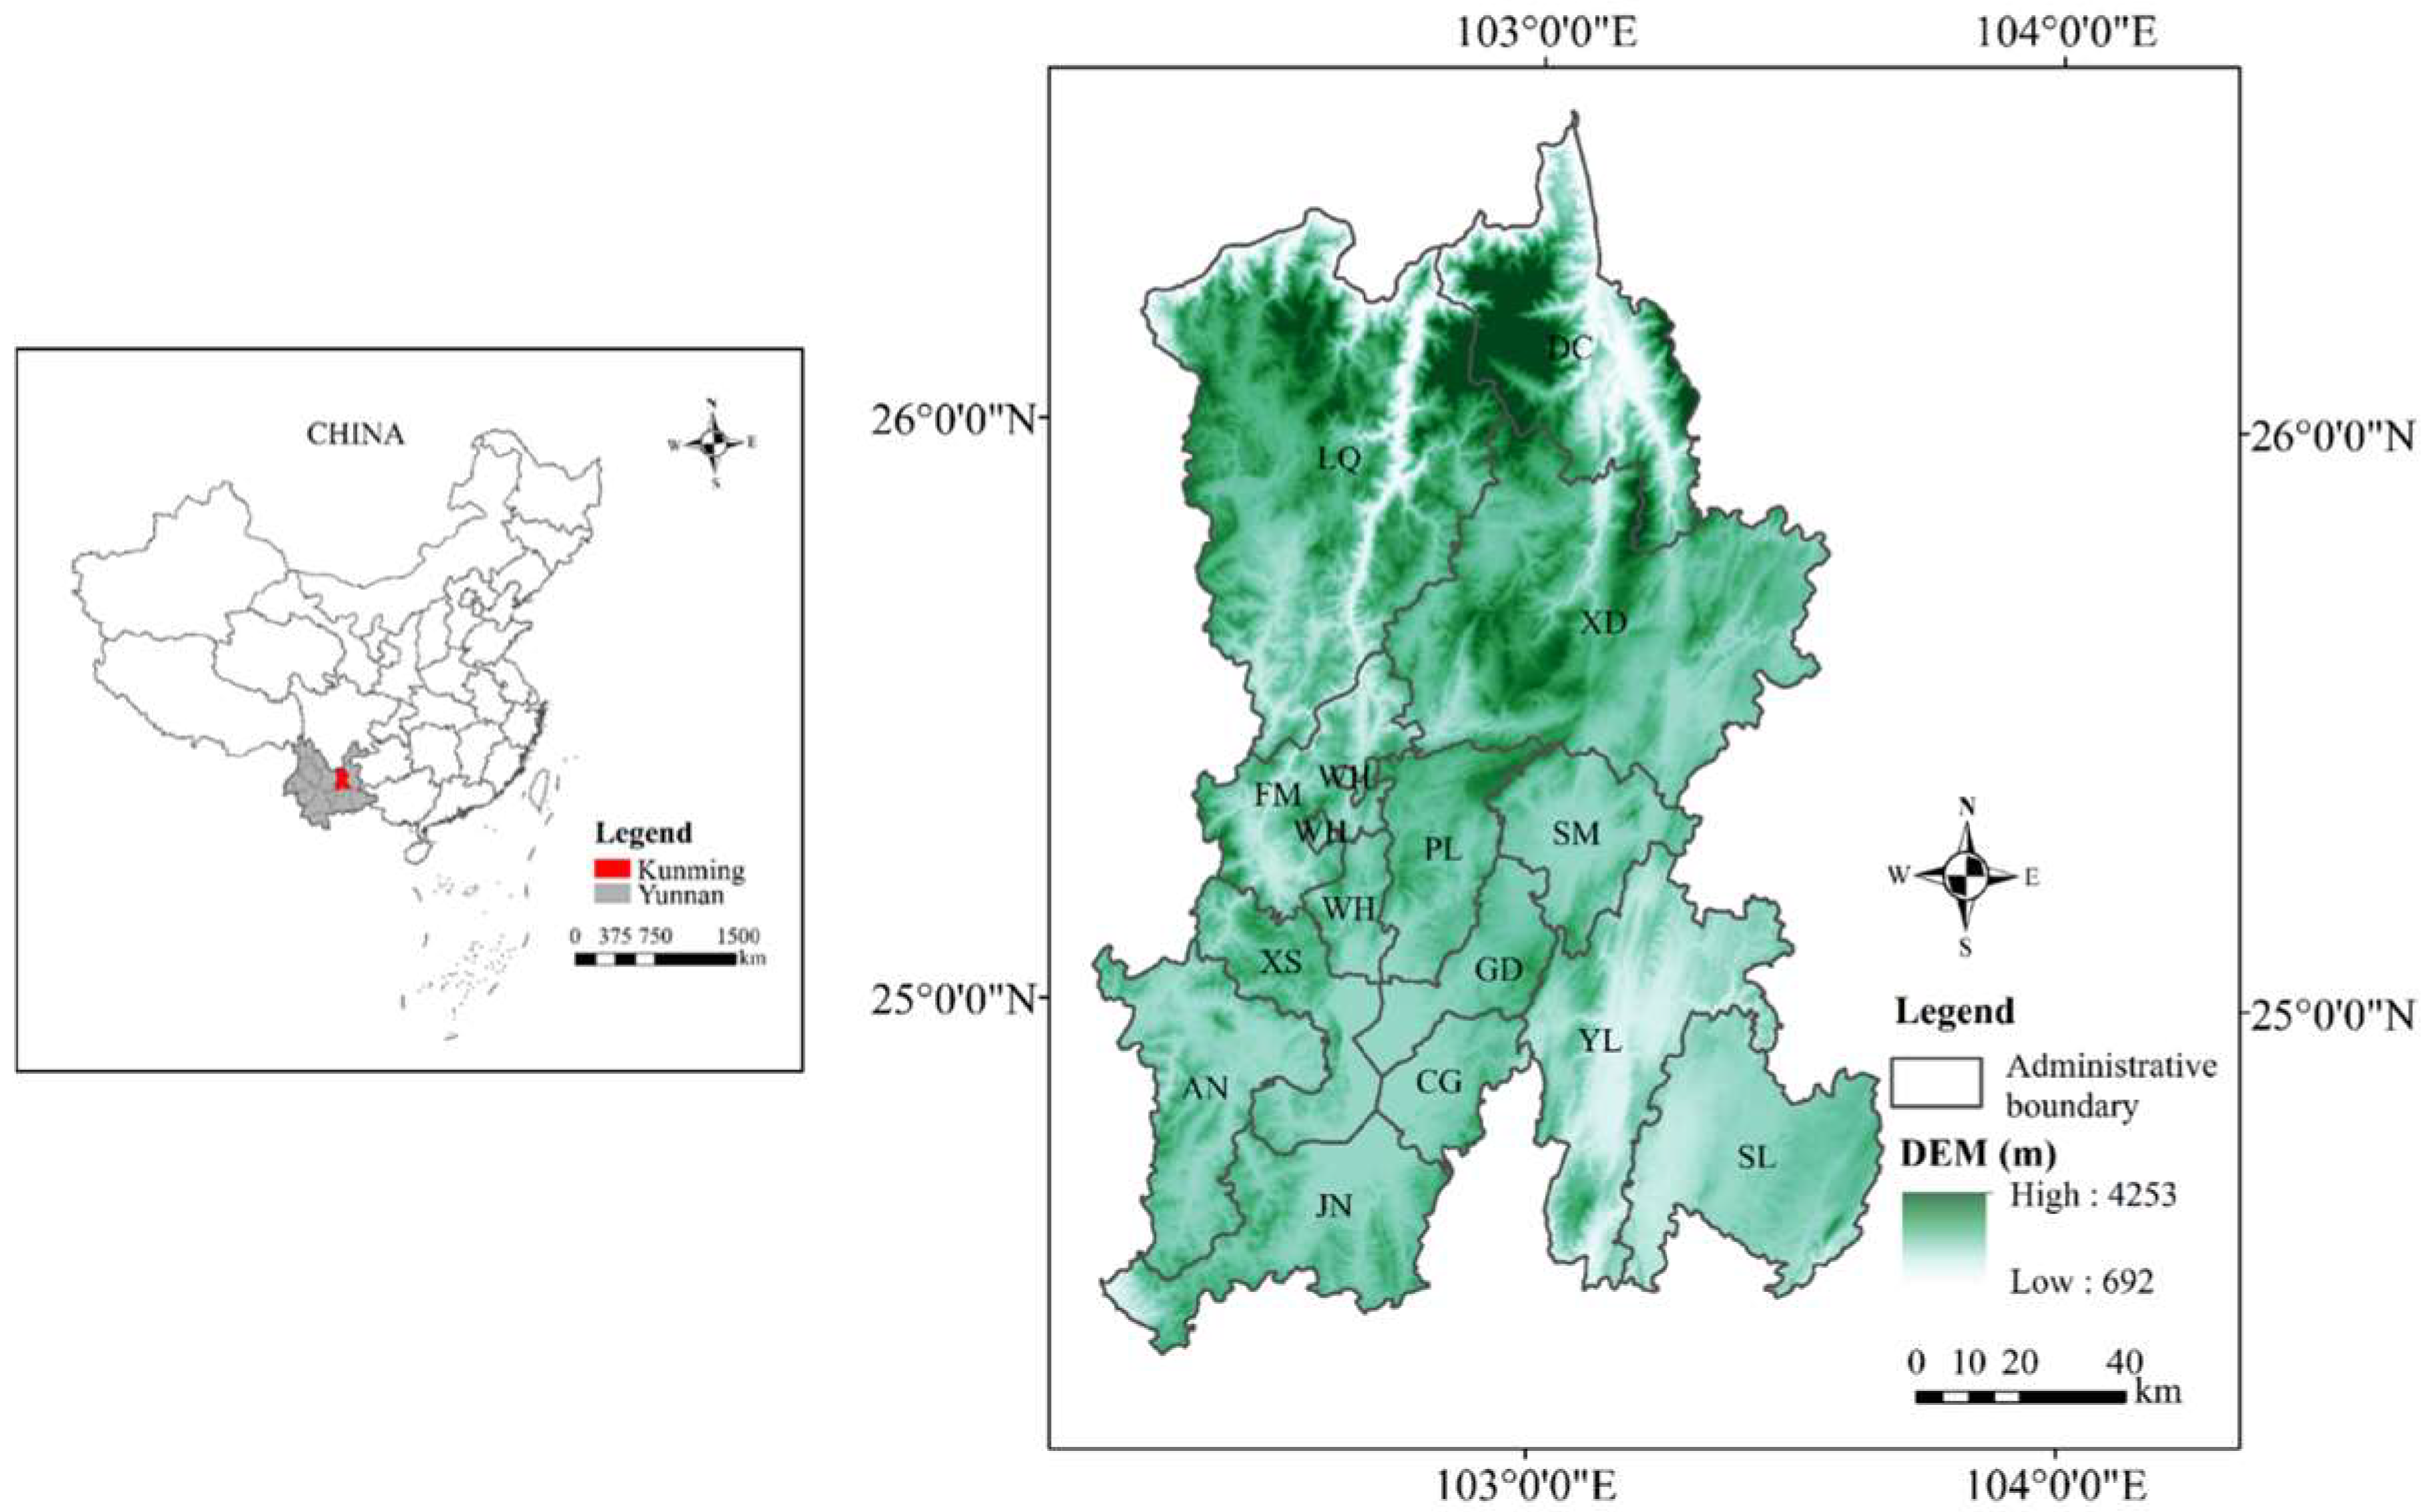
Figure 1. Study area.
Forests 16 01339 g001
Figure 2. Scatter plot of NDVI and kNDVI (a). Spatio-temporal pattern of kNDVI mean values in Kunming from 2000 to 2023 (b).
Forests 16 01339 g002
Figure 3. Interannual variations of mean growing season kNDVI in Kunming from 2000 to 2023, (the light blue areas are 95% confidence intervals, and the dashed lines are multi-year averages).
Forests 16 01339 g003
Figure 4. Monthly variation in growing season kNDVI in Kunming from 2000 to 2023.
Forests 16 01339 g004
Figure 5. Mean and standard deviation of kNDVI in various districts and counties of Kunming from 2000 to 2023.
Forests 16 01339 g005
Figure 6. Spatial pattern of vegetation fluctuations in Kunming from the year 2000 to 2023.
Forests 16 01339 g006
Figure 7. Trends in kNDVI changes in Kunming from 2000 to 2023.
Forests 16 01339 g007
Figure 8. Explanatory power of driving factors (p < 0.001) (left). Explanatory power of paired factors (right).
Forests 16 01339 g008aForests 16 01339 g008b
Table 1. Data sources and preprocessing.
DatasetData SourcesSpatial ResolutionPreprocessing
NDVI datasetNational Tibetan Plateau Data Center (https://data.tpdc.ac.cn/) 250 mZoom out by 10,000 times
Slope (X1)DEM
Soil (X2)Data Centre for Resource and Environmental Sciences, Chinese Academy of Sciences (https://www.resdc.cn/)1 km
DEM (X3)Geospatial data cloud (https://www.gscloud.cn/)90 mResampling to 1 km
Geomorphological Atlas of the People’s Republic
of China (X4)
National Earth System Science Data Center (https://www.geodata.cn/)1 km
Average annual temperature (X5)National Tibetan Plateau Data Center (https://data.tpdc.ac.cn/)1 km
Annual precipitation (X6)National Earth System Science Data Center (https://www.geodata.cn/)1 km
GDP (X7)National Earth System Science Data Center (https://www.geodata.cn/)1 km
Artificial night light (X8)National Tibetan Plateau Data Center (https://data.tpdc.ac.cn/)1 km
Remote sensing monitoring data on the status of land use in China (X9)Data Centre for Resource and Environmental Sciences, Chinese Academy of Sciences (https://www.resdc.cn/)30 mResampling to 1 km
Table 2. Trend analysis test types.
βZTrend Types
β > 0Z > 1.96Significantly improved
Z ≤ 1.96Slightly improved
β = 0ZStable
β < 0Z ≤ 1.96Slightly degraded
Z > 1.96Severely degraded
Table 3. Classification of kNDVI coefficient of variation in Kunming.
Fluctuation DegreeCV ValueArea Ratio
Minimum fluctuation<0.0501.451%
Low volatility0.050 ≤ CV < 0.10043.960%
Moderate fluctuation0.100 ≤ CV < 0.1534.793%
High volatility0.150 ≤ CV < 0.2008.794%
Maximum fluctuation≥0.20011.002%
Disclaimer/Publisher’s Note: The statements, opinions and data contained in all publications are solely those of the individual author(s) and contributor(s) and not of MDPI and/or the editor(s). MDPI and/or the editor(s) disclaim responsibility for any injury to people or property resulting from any ideas, methods, instructions or products referred to in the content.