Article

Compensatory Regulation and Temporal Dynamics of Photosynthetic Limitations in Ginkgo Biloba Under Combined Drought–Salt Stress

National Key Laboratory for Development and Utilization of Forest Food Resources, Co-Innovation Center for Sustainable Forestry in Southern China, Nanjing Forestry University, Nanjing 210037, China
*
Author to whom correspondence should be addressed.
The authors contributed equally to this work.
Forests 2025, 16(8), 1334; https://doi.org/10.3390/f16081334 (registering DOI)
Submission received: 8 July 2025 / Revised: 7 August 2025 / Accepted: 14 August 2025 / Published: 16 August 2025

Abstract

Photosynthesis in higher plants is highly sensitive to drought and salinity. While studies have examined the individual effects of drought or salt stress on photosynthesis, their combined impact remains poorly understood. In this study, we investigated the diurnal dynamics and primary limiting factors (stomatal, mesophyll, and biochemical) affecting the net photosynthetic rate (An) in Ginkgo (G.) biloba under drought, salt, and combined drought–salt stress. The results revealed that G. biloba exhibited a bimodal pattern of An under control conditions, primarily driven by mesophyll conductance (gm). Under drought, this pattern shifted, with stomatal limitations dominant in the late afternoon. In contrast, salt and combined stress induced a unimodal An pattern due to a flattened gm curve and reduced correlation between gm and An. Interestingly, combined stress caused significantly lower mesophyll limitations than salt stress alone, compensating for increased stomatal limitations and leading to a higher An. Our findings reveal a dynamic shift in the limiting factors over time and stress types, suggesting that G. biloba has mechanisms to mitigate combined drought–salt stress. These insights deepen our understanding of plant resilience under complex environmental conditions.

1. Introduction

Photosynthesis is the primary process by which plants absorb carbon and plays a decisive role in determining their final photosynthetic productivity. However, it is highly susceptible to the effects of drought and salt stress [1,2,3]. Most of the current research focuses on the effects of either drought or salt stress alone on photosynthesis, while studies on the combined impact of these stresses are limited, even though drought and salt stress often occur simultaneously and can have synergistic effects. Therefore, it is especially important to study the photosynthetic limitations under combined drought and salt stress.
Both salt and drought stress lead to stomatal closure in plant leaves, which helps reduce water loss but also restricts photosynthesis. This effect may be due to reduced stomatal conductance (gs) and mesophyll conductance (gm), which in turn limit the supply of CO2 and hinder the photosynthetic metabolic process. Insufficient CO2 can also trigger secondary metabolism and the formation of reactive oxygen species. Such oxidative stress is more likely to occur under multiple stress conditions [4]. The relative contribution of stomatal, mesophyll, and biochemical limitations to a decline in photosynthesis varies over time under drought and salt stress. Under drought conditions, the primary cause of a decline in photosynthesis is reduced CO2 diffusion into chloroplasts [5,6]. In a mild drought, photosynthesis is mainly limited by a decreased gs [7]. However, as the drought intensifies, structural changes (e.g., reduced chloroplast area and thicker cell walls), as well as biochemical changes (e.g., decreased activity of aquaporins, AQPs, and carbonic anhydrase, CA), lead to increased mesophyll and biochemical limitations [8]. Salt stress causes a decline in the chlorophyll content, reduces the chloroplasts’ capacity for light absorption and energy transfer, and decreases thylakoid stacking. These changes hinder enzymatic reactions and lead to biochemical limitations, including reduced RuBPCase activity and a lower carbon fixation capacity. The regeneration of RuBP and inorganic phosphate is also restricted [9], reducing the availability of CO2 and ATP and thus limiting photosynthesis [10]. While many studies have examined drought [11,12] and salt stress individually, it remains unclear whether the same physiological limitations apply when both stresses occur simultaneously.
Under drought and salt stress, not only the overall photosynthetic capacity but also its diurnal variation may be significantly altered. Under normal growth conditions, Ginkgo biloba (hereafter G. biloba) typically exhibits a bimodal pattern in its net photosynthetic rate (An) throughout the day, due to the well-documented phenomenon of midday depression in photosynthesis [13,14]. This midday decline is primarily caused by an increased leaf temperature and elevated leaf-to-air vapor pressure difference (VPD), leading to a reduced gs [15]). Studies on other species, such as Sasa bambusoides, have shown that stress conditions like salinity can disrupt this bimodal pattern, resulting in a monotonic decline throughout the day [16]. Additionally, the intercellular CO2 concentration (Ci) often shows a U-shaped trend during the day, with a dip in the morning and an afternoon peak aligning with the midday depression [17]. However, it remains unclear whether the same diurnal patterns in these photosynthetic limiting factors (i.e., stomatal, mesophyll, and biochemical limitations) persist under combined drought and salt stress, especially in G. biloba. Understanding these dynamic changes is essential for revealing how plants cope with simultaneous abiotic stresses throughout the day.
As one of the oldest living plants, G. biloba has a large number of resistance genes [18], likely due to long evolutionary persistence under diverse environmental challenges. Therefore, studying its response to drought and salt stress can deepen our understanding of plant adaptation mechanisms under combined abiotic stresses. Previous studies have shown that the photosynthetic activity in G. biloba is affected by either drought or salt stress, resulting in a reduced gs and gm and lower biochemical activity [19,20]. However, no research has yet explored the diurnal variation in these limiting factors under combined drought and salt stress. This knowledge is crucial for improving plant productivity, particularly in the context of widespread drought and salinity conditions. Therefore, the objectives of this study are (1) to determine the primary limiting factors of photosynthesis in G. biloba under drought, salt, and combined drought and salt stress; (2) to investigate the diurnal dynamics of photosynthetic limiting factors under these combined stress conditions.

2. Materials and Methods

2.1. Plant Materials

The experimental materials were 3-year-old G. biloba seedlings planted at the Xiashu Forest Farm of Nanjing Forestry University (119°12′E, 32°07′N). The potting substrate was a mixture of loess and an organic cultivation matrix (Jiangsu Xingnong Matrix Technology Co., Ltd., Zhenjiang City, Jiangsu Province, China) in a 4:1 ratio. The organic matrix had a pH of 5.5–7.0 and an organic matter content of ≥ 35% and demonstrated good water retention, fertilizer retention, and air permeability. The seedlings were grown under natural outdoor-temperature conditions. To prevent rainfall from affecting the substrate’s moisture content, a plastic shed with good ventilation and 50% light transmission was constructed over the experimental area.
Stress treatments were initiated once the sixth leaf on each plant had fully unfolded. The experiment comprised a control group (30% absolute soil water content—AWC; no NaCl) and three stress treatments: drought (20% AWC, no NaCl), salt (30% AWC, 150 mmol/L NaCl), and combined drought–salt stress (20% AWC, 150 mmol/L NaCl). Each group included 8–10 individual seedlings. The conditions of a 20% AWC to induce drought stress and 150 mM NaCl to induce salinity stress were selected because they reliably induce measurable physiological responses without causing acute lethality in G. biloba seedlings, as confirmed by our pre-experimental tests and supported by relevant references [19,21,22,23].
To establish salt stress, an NaCl solution was applied starting in early June. To minimize osmotic shock, the concentration was gradually increased over three days (50, 100, and 150 mmol/L). After reaching the target concentration, the plants received 150 mmol/L NaCl every seven days for three rounds, until the onset of the drought treatments.
During the water regulation phase, all the plants were initially saturated to a 30% AWC. The pot weights were recorded nightly to calculate the water loss and maintain consistent moisture levels. The target weight was calculated as
T a r g e t   w e i g h t   P o t   w e i g h t   + D r y   s u b s t r a t e   w e i g h t D r y   s u b s t r a t e   w e i g h t =   30 %
Each pot (with dry substrate) weighed approximately 3.5 kg, including 3.3 kg of dry substrate. The seedling biomass was excluded from the calculation due to the difficulty of non-destructive measurement. Irrigation was discontinued once the AWC dropped to the predetermined levels. The measurements were conducted after 60 days of stress exposure.

2.2. Synchronous Measurement of Gas Exchange and Chlorophyll Fluorescence

Leaf gas exchange and chlorophyll fluorescence parameters were simultaneously measured using an Li-6800 gas exchange analysis system (LI-COR, LI-COR Biosciences Inc., Lincoln, NE, USA) equipped with a multiphase flash fluorescence leaf chamber (LI-6800–01A). Prior to measurement, the LI-6800 was used to record the diurnal variation in key environmental factors (i.e., light intensity, temperature, and humidity), on a clear, cloudless day between 08:00 and 18:00 (Figure 1). These recorded environmental parameters were then programmed into the LI-6800 to simulate natural conditions and assess the diurnal dynamics of the photosynthetic performance (e.g., An, gs, intercellular CO2 concentration—Ci) and chlorophyll fluorescence parameters (i.e., the steady-state fluorescence, Fs, and the maximum fluorescence in light-adapted leaves, Fm’). The minimum and maximum chlorophyll fluorescence values (Fo and Fm) and dark respiration rate (Rd) were recorded in fully dark-adapted leaves.

2.3. Estimation of Mesophyll Conductance

The mesophyll conductance (gm) was estimated using the variable J method [24].
g m = A n C i Γ * J flu + 8 A n + R d J flu 4 A n + R d
J flu = Φ PS II × P P F D × α × β
where PPFD is the flux density of the photosynthetically active photons and α is the leaf absorptance and assumed to be 0.84 [25,26]. β reflects the distribution of the absorbed quantum between photosystem II and I (PSI and PSII) and is assumed to be 0.55 [27]. The actual photochemical efficiency of photosystem II (ΦPSII) is determined by Fs and Fm ‘. The formula is as follows:
Φ PS II   = F m   F s F m
where Γ* is the CO2 compensation point in the absence of mitochondrial respiration, which can be found using the following Equation (5):
Γ *   =   exp 13.49     24460 8.314   ×   273.15     +     T L
where TL is the leaf temperature (°C).

2.4. Estimation of the Maximum Carboxylation Rate

The formula for calculating the maximum carboxylation rate (Vcmax) at any given time point during the day was as follows:
V C max   =   A n   +   R d C c     +     K m C c     Γ *
where Km is the Michaelis–Menten constant of Rubisco at 21% O2. It was 541.9 μmol mol−1 in a study by Walker et al. (2013) [28] at 25 °C.
Cc was the CO2 concentration in the chloroplast stroma and was calculated using the following equation:
C c   =   C a     A n g s     A n g m
where Ca is the ambient CO2 concentration.
g s = A n   C a   C i

2.5. Photosynthetic Limitation Analysis

We performed photosynthetic limitation analyses to evaluate the stress responses in G. biloba across different treatments. Using time-matched control measurements as baseline references, we effectively isolated the specific effects of drought, salt, and combined stress from diurnal environmental variability. This approach enabled precise quantification of treatment-induced limitations on the photosynthetic performance.
The calculation of the photosynthetic limitations followed the differential method of Deans et al. (2019a, b) [29,30], with modifications to include mesophyll-related components as proposed by Liu et al. (2022) [31]. According to the framework given by Grassi & Magnani (2005) [11] and Deans et al. (2019a) [29], the deviation in An was partitioned into components reflecting limitations due to the biochemistry, mesophyll conductance, and stomatal conductance.
d A calc = d A biochem + d A mesophll +   d A stom
where dAcalc represents the linearized difference in the photosynthetic rate relative to the reference, and dAbio, dAmeso, and dAstom are the biochemical, mesophyll, and stomatal components of dAcalc, respectively.
d A biochem = A n V c , max d V c , max
d A mesophll = A n g m d g m
d A stom = A n g s d g s
where dVcmax, dgm, and dgs represent the difference between the observations and the referenced values, respectively.
The assimilation rate under the condition of Rubisco restriction can be described by the following model:
A n   =   V c , max C c       Γ * C c   +     K m     R d
Km is the Michaelis–Menten constant of Rubisco at 21% O2. Cc can be calculated using
C c = C a A n g s A n g m
By substituting Equation (14) into Equation (13) and rearranging the terms, we obtain
1 g s   + 1 g m A n 2 V c , max R d 1 g s + 1 g m + C a + K m A + V c m a x C a Γ *
The partial derivatives of An with respect to Vcmax, gm, and gs are obtained through implicit differentiation of Equation (15):
A n V c , max   =   C a     Γ *             A n 1 g s   +   1 g m V c , max     R d 1 g s     +   1 g m   +   C a   +   K m   2 1 g s   +   1 g m A n
A n g m = A n g m 2 V c , max   R d A n V c , max R d 1 g s + 1 g m + C a + K m 2 1 g s + 1 g m A n
A n g m = A n g s 2 V c , max   R d     A n V c , max   R d 1 g s   +   1 g m + C a +   K m 2 1 g s + 1 g m A n

2.6. Path Analysis Using Structural Equation Modeling

We performed a systematic path analysis using structural equation modeling (SEM) to quantify the relationships among the photosynthetic parameters across different treatments. The SEM framework incorporated a theoretically grounded path model for each treatment condition after z-score standardization of all the variables (scale function in R), which inherently reduced the multicollinearity among the predictors while preserving their biological relationships. The models featured An as the primary endogenous variable, with gs, gm, and Vcmax as key predictors. The specification included covariances among the predictors and explicit decomposition of the direct effects, indirect effects mediated by covariances, and total effects through all the pathways.
Model implementation utilized the lavaan package with maximum likelihood estimation and incorporated two critical statistical protections: (1) bias-corrected bootstrap confidence intervals (500 replicates, se = “bootstrap”) to mitigate potential heteroscedasticity in the parameter estimates and (2) treatment-stratified modeling that inherently controlled for false positives by maintaining separation between the experimental groups. We evaluated the model fit using multiple indices: the Comparative Fit Index (CFI > 0.95), Root Mean Square Error of Approximation (RMSEA < 0.06), and Standardized Root Mean Residual (SRMR < 0.08). The complete analytical workflow was implemented in R (v4.2.0) using the tidyverse ecosystem, ensuring reproducibility from raw data processing to the final visualization. This integrated approach combined data standardization, robust estimation techniques, and stratified analysis to produce reliable path coefficients while accounting for the inherent challenges of photosynthetic parameter intercorrelations and treatment-specific response patterns.

2.7. Statistical Analysis

We conducted data analysis and visualization using R software (version 4.2.2) with the ggplot2 package. Linear regression models were applied to assess the pairwise relationships between An and gs, An and gm, and gm and gs, as well as An and Vcmax. To capture non-linear temporal trends in photosynthetic parameters An, gm, gs, and Vcmax, we employed a Generalized Additive Model (GAM) using the mgcv package in R, incorporating the treatment as a predictor variable.

3. Results

3.1. Diurnal Variations in Photosynthetic Characteristics Under Different Treatments

A comparative analysis of ΦPSIImax (Figure 1) revealed a clear gradient of photoinhibition in G. biloba across the stress treatments. The control plants maintained the highest ΦPSIImax, followed by drought-stressed and drought–salt-stressed plants, which showed intermediate but comparable levels. Notably, salt stress alone caused the most severe suppression of ΦPSIImax, exhibiting significantly lower values than those with all the other treatments.
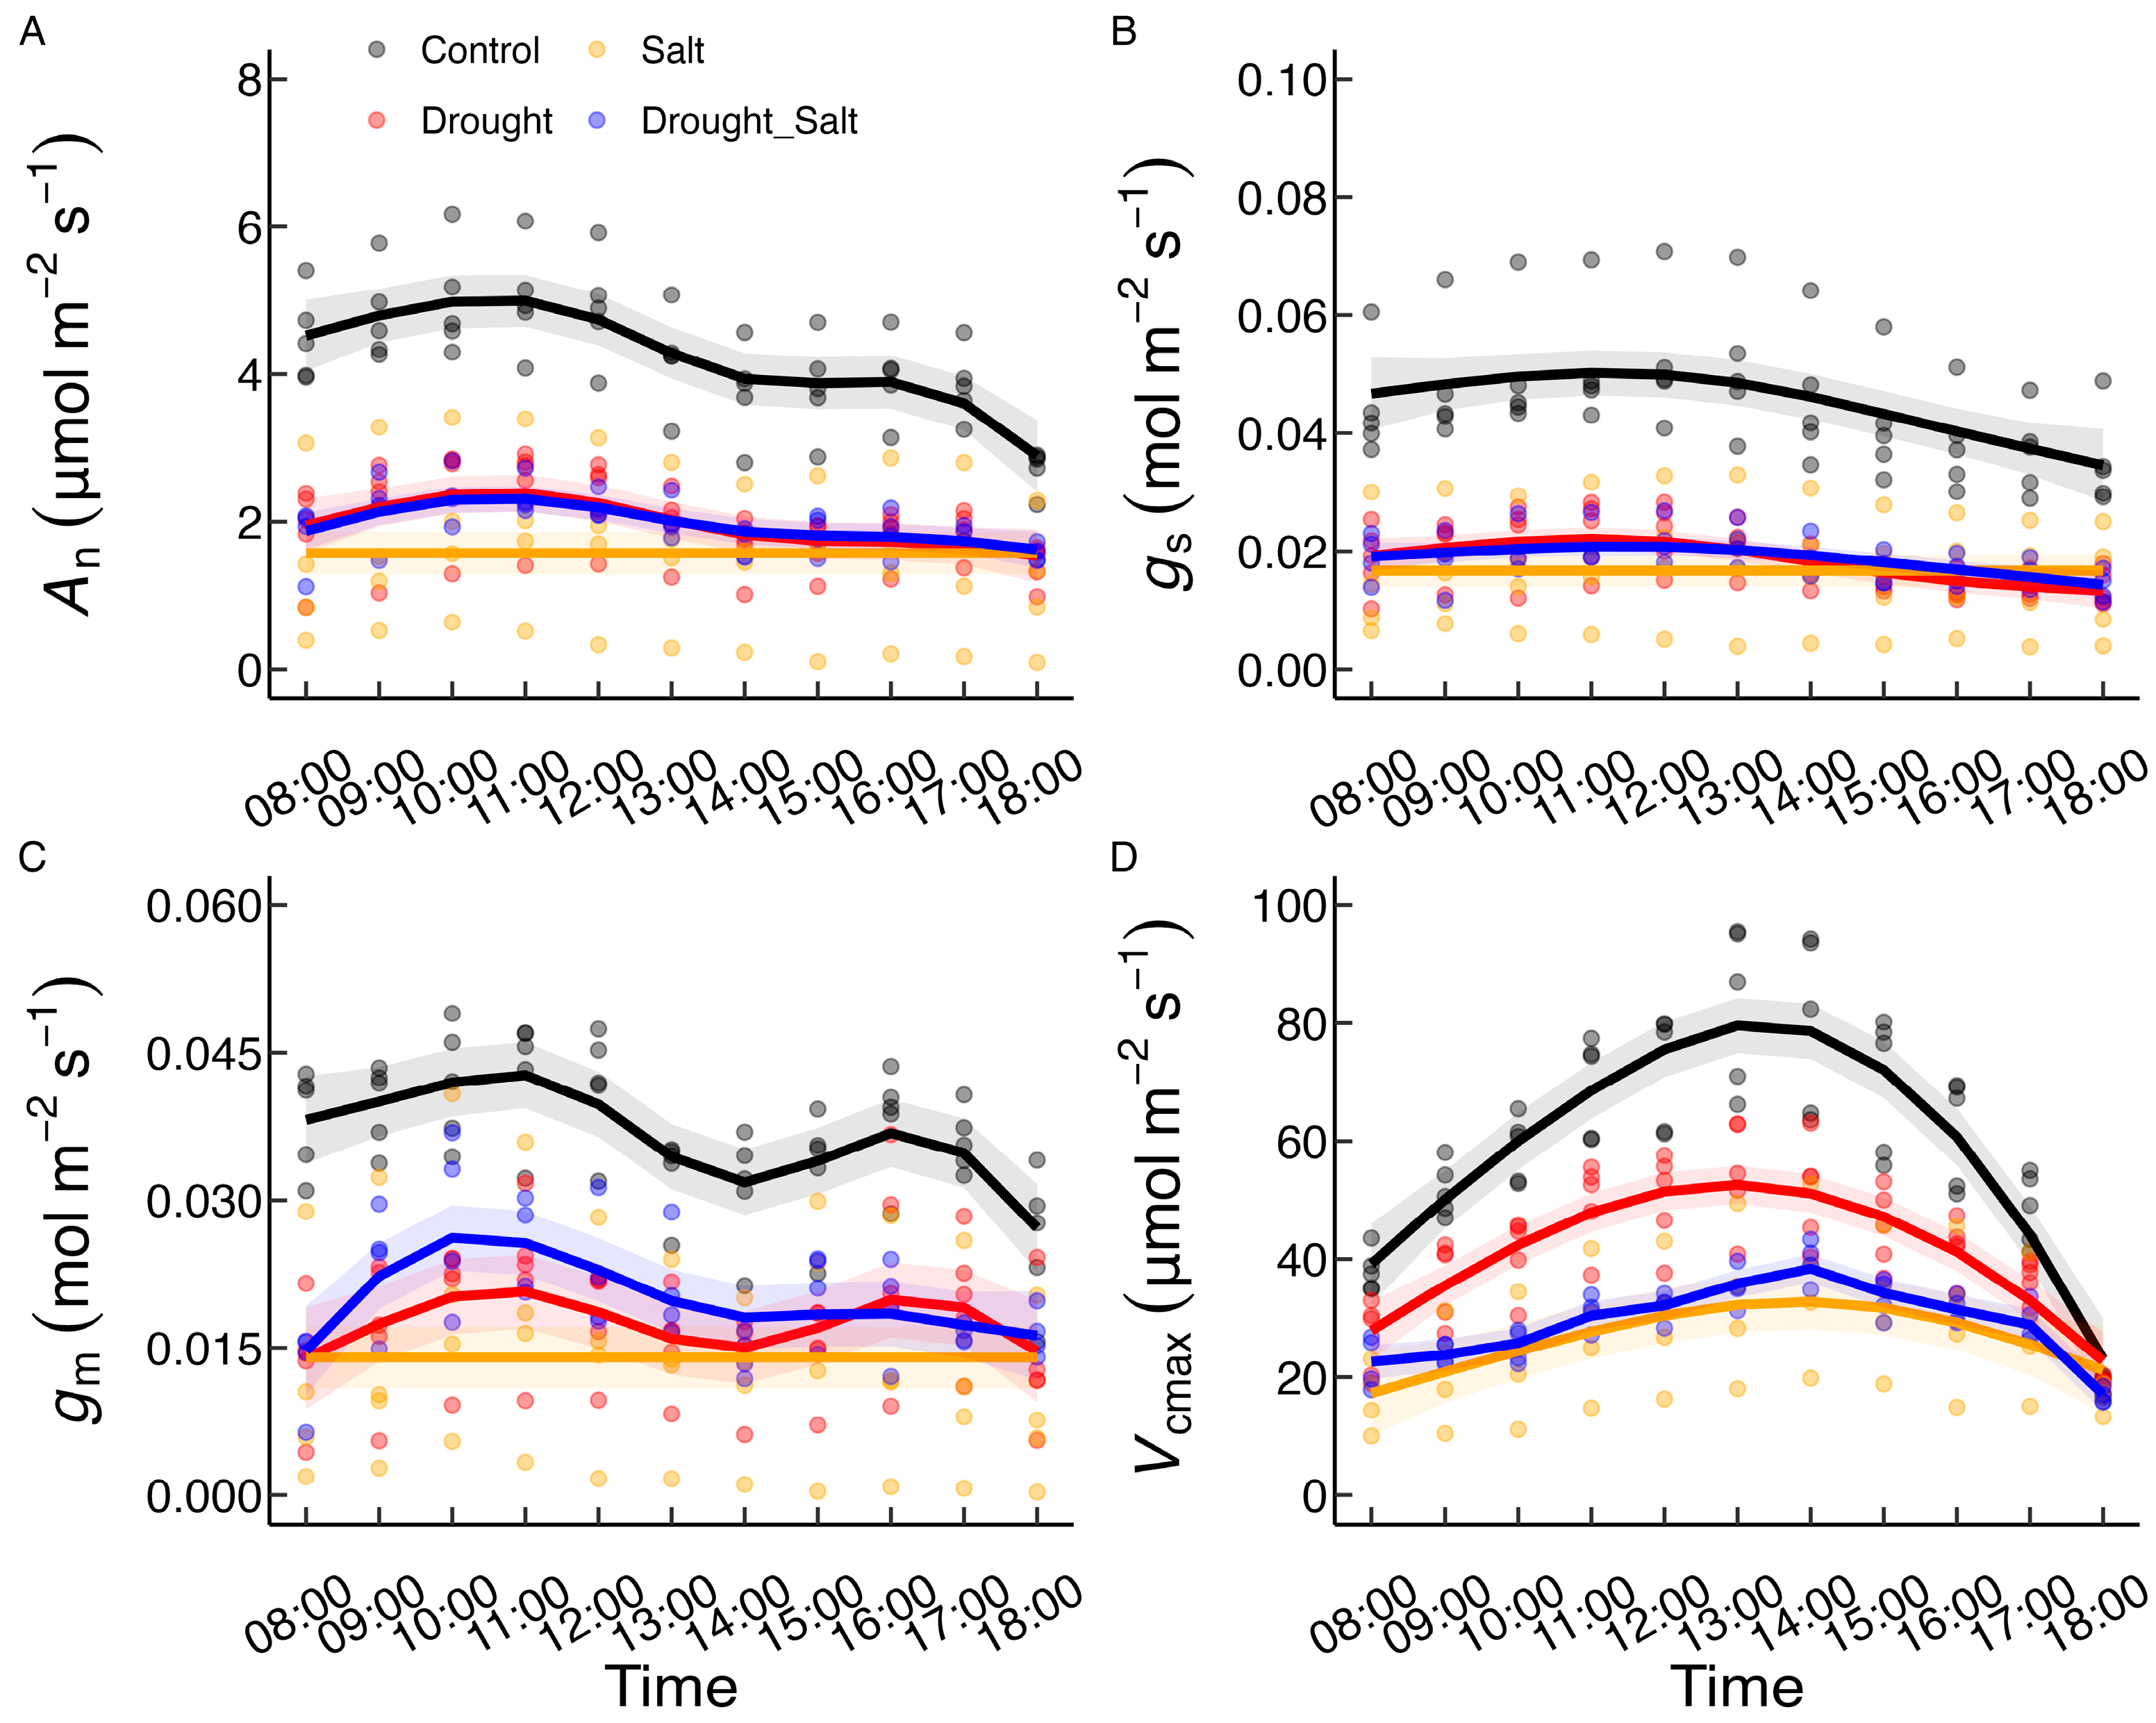
To compare the diurnal trends in the photosynthesis-related parameters across treatments, we used GAMs to analyze the daily variation patterns of An, gm, gs, and Vcmax under four treatment conditions (Figure 2). All the parameters in the control group were significantly higher than those under the stress treatments, confirming that the applied stresses effectively induced distinct physiological responses in G. biloba. Our analyses revealed a bimodal diurnal pattern in An under control conditions and in gm under both control and salt treatments (Figure 2A,C). This pattern was characterized by a morning increase (08:00–11:00) peaking at around 11:00, followed by a midday depression (12:00–14:00), modest afternoon recovery (14:00–16:00), and a steep decline after 16:00. Under both drought and combined drought–salt stress, An exhibited significantly attenuated afternoon recovery and a significantly attenuated post-16:00 decline, as did gm under combined drought–salt treatment. In contrast, salt-stressed plants showed no statistically significant diurnal variation in An and gm. As illustrated in Figure 2B, under control, drought, and combined drought–salt stress gs increased steadily in the morning (08:00–11:00), followed by a gradual decrease (11:00–18:00). Salt stress eliminated any discernible diurnal variation in gs. All the treatments exhibited a unimodal trend in Vcmax (Figure 2D). In control and drought-stressed plants, Vcmax increased sharply from 08:00 to a peak at 13:00, followed by a decrease (13:00–18:00). Under salt and combined drought–salt stress, the peak was delayed to 14:00, followed by a decline. While salt stress generally suppressed all the parameters to low, stable levels, Vcmax still exhibited treatment-specific diurnal responses.

3.2. The Relationships Among Various Photosynthetic Characteristics Under Different Treatments

To further elucidate the factors influencing An under distinct stress conditions, correlation analyses were performed to establish linear relationships between An and gs, gm, and Vcmax across the treatments, with comparisons based on the coefficient of determination (R2). As shown in Figure 3, gs exhibited strong correlations with An under all four treatments, with R2 values ranging from 0.69 to 0.94. Notably, salt-stressed plants exhibited a strong correlation between gm and An (R2 = 0.90). Control and combined drought–salt stress treatments showed moderate correlations (R2 = 0.74 and 0.67, respectively), both of which were higher than that observed in the drought treatment (R2 = 0.57). In contrast, Vcmax displayed weak correlations with An across all the treatments. The weakest correlation was observed under combined drought–salt stress (R2 = 0.02), whereas the strongest (albeit modest) association occurred under salt stress (R2 = 0.61).

3.3. Diurnal Variations in Photosynthetic Limiting Factors of G. Biloba Under Different Treatments

We quantified the stress-induced photosynthetic limitations by comparing the treated and control plants at corresponding time points, deriving the stress-specific reduction in An and decomposing it into dAbio, dAmeso, and dAstom components. This analytical approach effectively separated the treatment effects from natural diurnal fluctuations, clearly demonstrating the differential impacts of drought, salt, and combined stress on each limitation type (Figure 4). The analysis revealed distinct temporal patterns: under drought stress, dAmeso accounted for the majority of photosynthetic reductions during the morning hours before being superseded by dAstom dominance in the afternoon, whereas under salt stress dAmeso was consistently shown to be the principal limiting factor throughout the measurement period. The combined stress treatment presented unique progression, with dAbio serving as the primary constraint on photosynthetic activity during the early daylight hours before yielding to increasing influences from both dAstom and dAmeso after 15:00, illustrating the complex interplay of the effects of multiple stress factors on the photosynthetic performance.

3.4. Path Analysis Showing Differential Regulation of Photosynthesis by Conductance and Biochemical Factors in Stressed G. Biloba

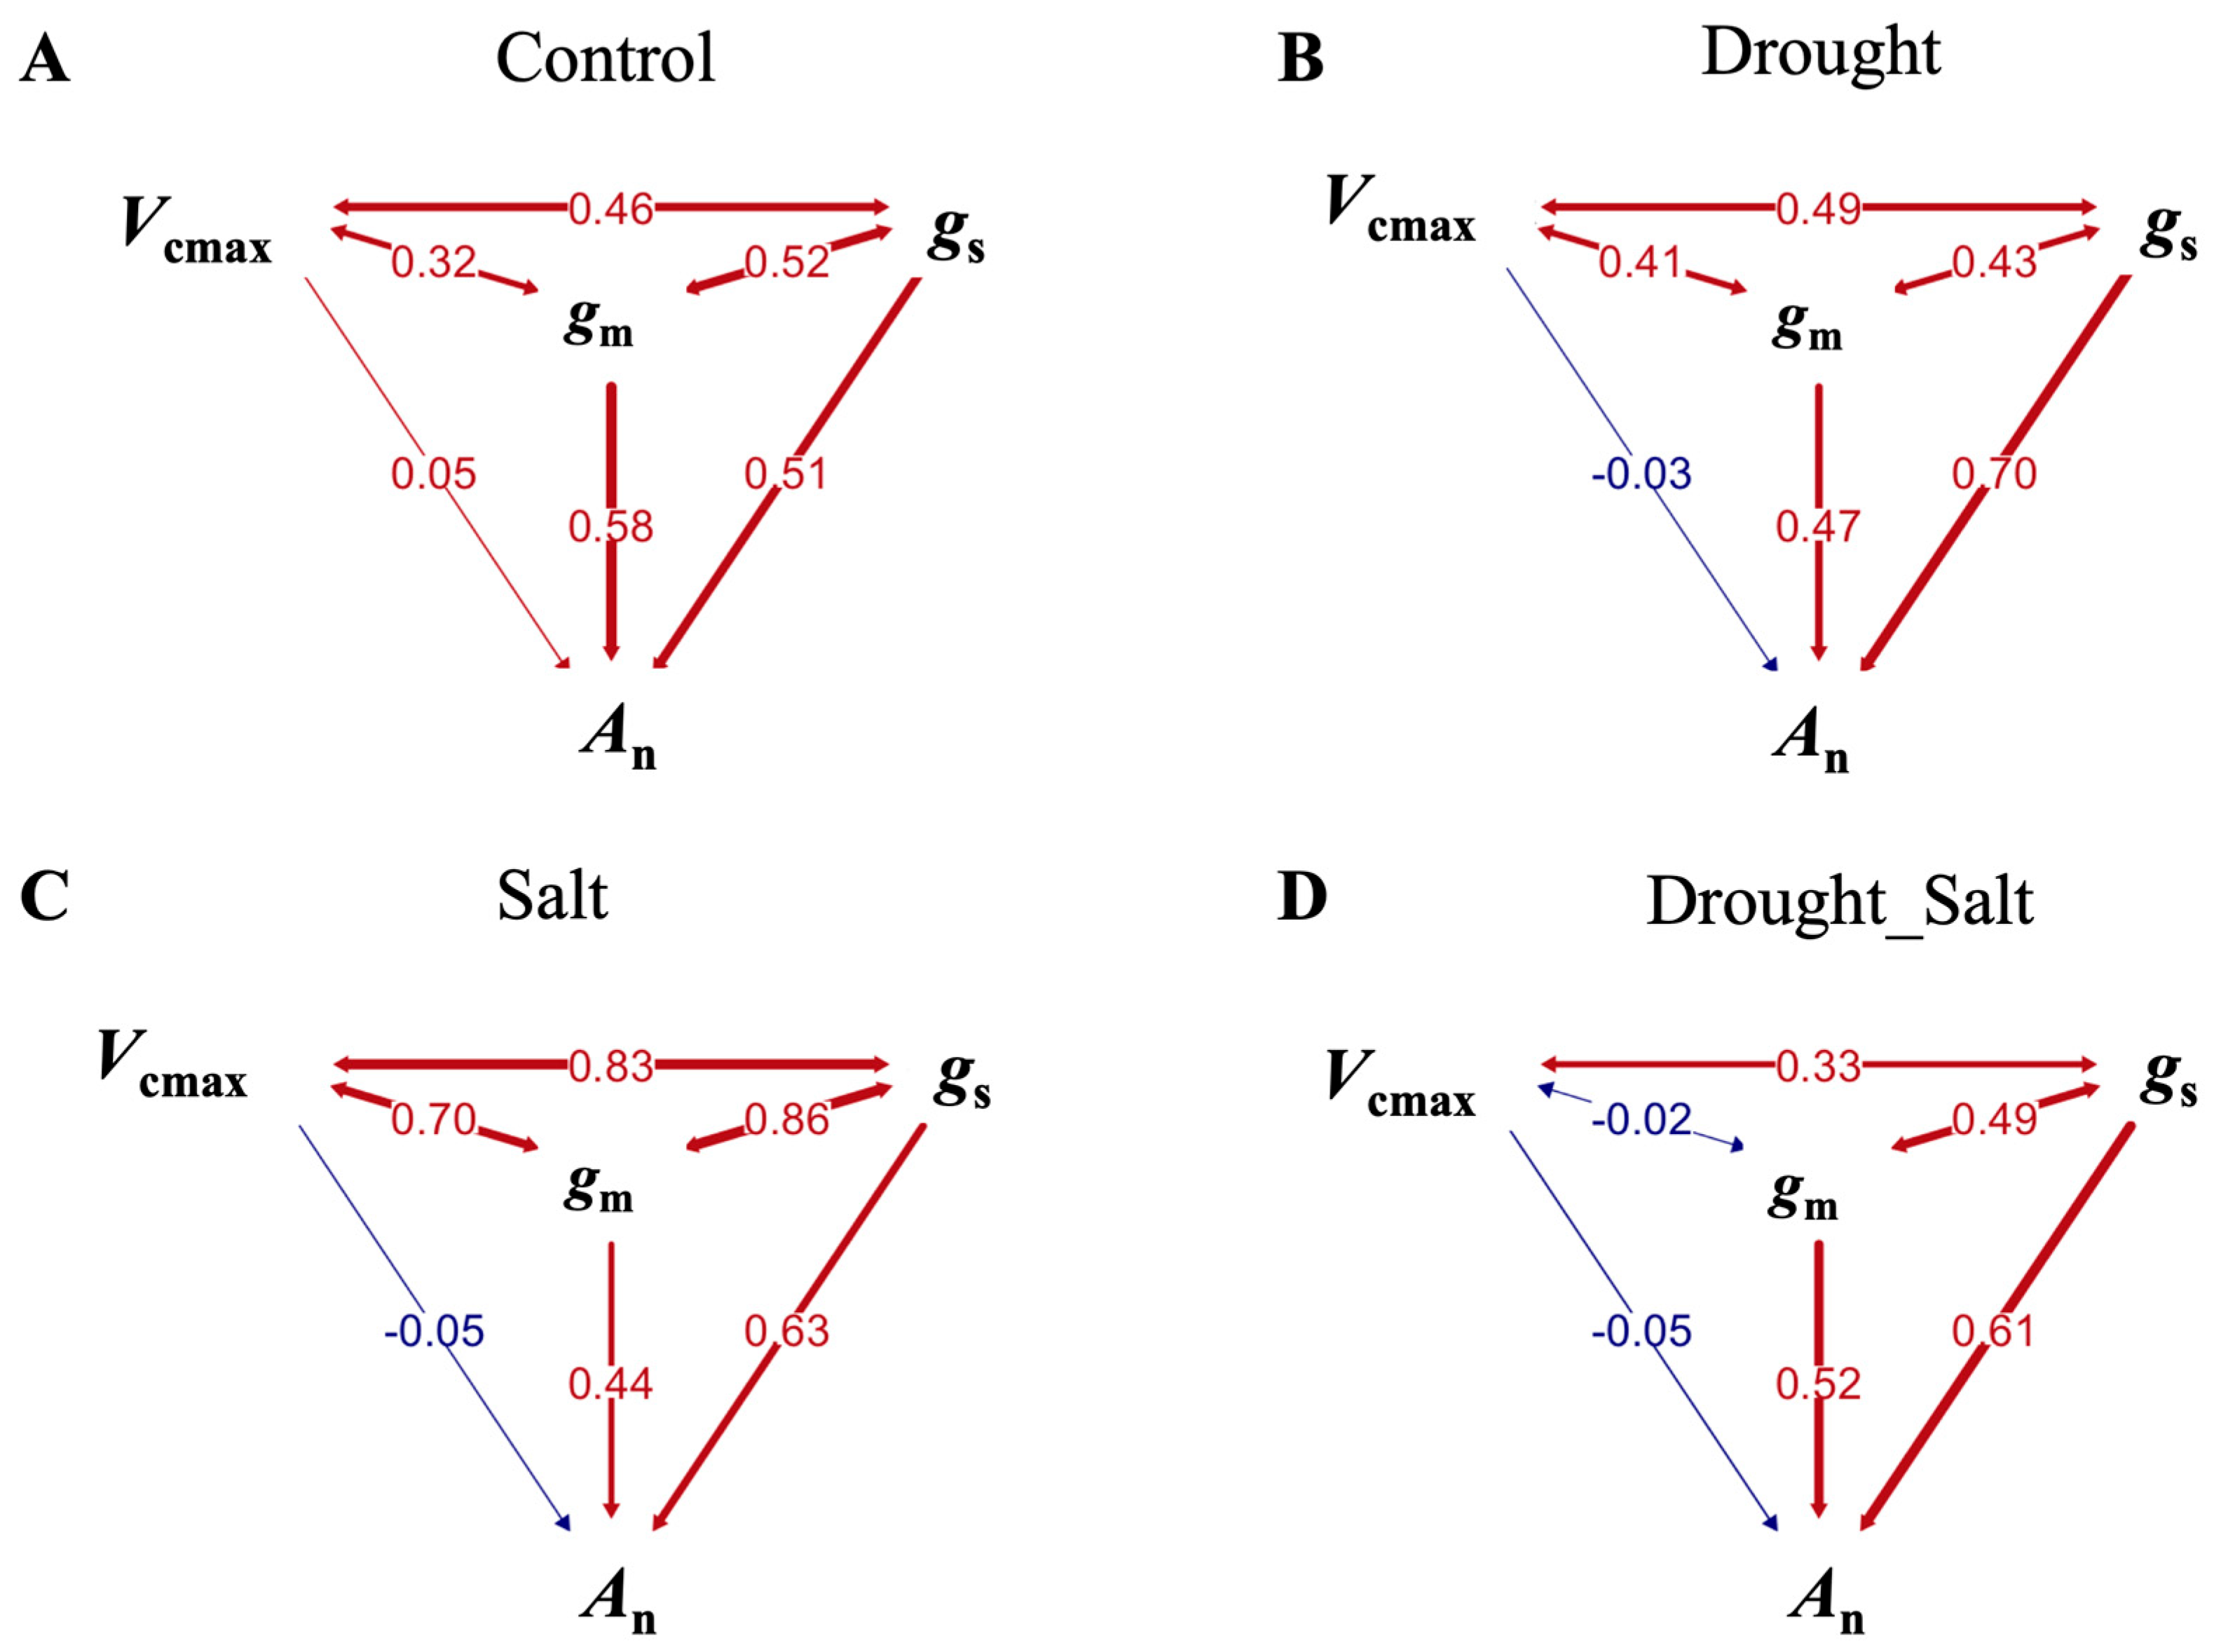
Path coefficient decomposition analysis quantified the direct, indirect, and total effects of gs, gm, and Vcmax on An under different stress conditions (Figure 5; Table 1). The results demonstrate that gs and gm consistently exerted significant direct and indirect effects on An across all the stress conditions, with their total effects remaining highly significant. In contrast, Vcmax showed no significant direct effect on An in any treatment but often contributed indirectly through its effect on gs and gm, leading to a significant total effect except under combined drought and salt stress. Under control conditions, gs and gm had strong direct effects (β = 0.51 and 0.58, respectively), with additional indirect pathways reinforcing their total influence (β = 0.82 and 0.86). Drought stress increased the direct effect of gs (β = 0.70) while reducing that of gm (β = 0.47), though their indirect effects maintained high contributions to their total influence. Salt stress further amplified the indirect effects, particularly via its effect on gs, resulting in the highest total effects for both gs (β = 0.96) and gm (β = 0.94). However, under combined drought and salt stress, Vcmax lost its significant total effect due to weakened indirect pathways, whereas gs and gm remained dominant drivers of An. These findings underscore the predominant role of conductance traits rather than biochemical factors in regulating photosynthesis under stress, with the stress type modulating the relative strength of direct and indirect pathways.

4. Discussion

4.1. Stress-Induced Shifts in Photosynthetic Dynamics

Under control conditions, G. biloba exhibited a bimodal diurnal pattern in An that closely paralleled the variations in gm (Figure 2). Both correlation analysis (Figure 3) and path analysis (Figure 5) confirmed the dominant role of gm in regulating photosynthesis in unstressed G. biloba. This pattern contrasts with that in shrub species like Rosmarinus officinalis and Lavandula stoechas which typically show unimodal patterns under optimal conditions [32]. Under drought stress, while gm maintained a bimodal pattern, its correlation with An weakened relative to the correlation of An with gs, indicating a shift in the regulatory dominance from mesophyll to stomatal control. A dominant role of gs under drought is also found in cotton [33]. In contrast, salt stress induced the strongest mesophyll limitation, likely due to structural modifications in the chloroplasts, specifically, a reduction in the chloroplast surface area exposed to the intercellular airspace (Sc/S) and an increase in the mesophyll cell wall thickness [34,35].Due to the slow adjustment of leaf anatomical structures, gm cannot rapidly compensate for the declining CO2 demand caused by impaired photosynthetic enzymes. Consequently, gs becomes increasingly important in co-regulating photosynthesis to maintain the metabolic balance under salt treatments. Path analysis revealed near-identical total effects of gs (β = 0.96) and gm (β = 0.94) under salt stress, highlighting their tightly coupled regulation. While Vcmax exerted no direct effect on An, it indirectly influenced photosynthesis through its effects on both gs (β = 0.51) and gm (β = 0.30), with stomatal regulation playing a more substantial role. In contrast, under combined drought–salt stress the primary limitation shifted to biochemical constraints (enzyme inactivation), where Vcmax could only weakly modulate photosynthesis via its effect on gs.
These stress-specific shifts in photosynthetic regulation likely reflect distinct physiological adaptation strategies. Under drought conditions, the transition from mesophyll to stomatal dominance may be mediated by rapid ABA signaling [36], which preferentially induces stomatal closure to conserve water while maintaining residual photosynthetic activity. In contrast, salt stress primarily disrupts mesophyll function through both osmotic effects and ion toxicity [37], leading to structural changes in the chloroplasts that impair CO2 diffusion [34,35]. The observed tight coupling between gs and gm under salt stress (β = 0.96 vs. 0.94) suggests a compensatory mechanism where stomatal regulation adjusts to match the reduced mesophyll capacity, potentially through ABA-independent pathways [38]. The synergistic effects of combined stress on biochemical limitations may result from accelerated enzyme denaturation due to oxidative damage [39], as drought and salt stress collectively exacerbate reactive oxygen species production.

4.2. Synergistic Alleviate of Mesophyll Limitation Under Combined Drought_salt Stress

Higher values of ΦPSIImax under combined drought–salt stress compared to those observed under salt stress alone can be attributed to the significantly lower mesophyll limitations detected under combined drought–salt stress. This unique response may reflect the ecological adaptations of G. biloba as a relict species that has persisted through climatic fluctuations in marginal habitats with periodic water and salinity stress. As illustrated in Figure 4, gs exhibited the strongest correlation with An under both salt stress and combined drought–salt stress, followed by gm. However, Figure 3 reveals that the increase in stomatal and biochemical limitations under combined drought–salt stress was substantially smaller than the reduction in mesophyll limitations compared to these values for salt stress alone. This disproportionate decrease in mesophyll limitations effectively masked the impact of stomatal and biochemical limitations on An. These findings are further supported by Figure 2, which shows that the decline in gm under combined stress was less pronounced than that under salt stress alone, relative to the control. Consequently, the combined stress treatment resulted in higher ΦPSIImax and An values than those observed under single salt stress.
The reduced mesophyll limitation under combined drought-salt stress likely arises from synergistic physiological adaptation that alleviate salt-induced damage. Drought-induced osmotic adjustment through compatible solute accumulation, such as proline and glycine betaine, has been shown to mitigate ionic toxicity by stabilizing cellular cellular structures and maintaining K+ homeostasis under salt stress [40,41,42]. This osmotic protection may help preserve chloroplast integrity and CO2 diffusion capacity in mesophyll cell, resulting in a smaller decline in gm compared to salt stress alone. Hussain et al. (2020, 2023) [43,44] proposed that under combined low-salinity and drought stress, non-selectively transported ions may act as cost-effective osmotic, promoting aerial water potential gradients and enhancing carbon assimilation. Similarly, Suzuki et al. (2014) [45] demonstrated that co-occurring stressors can induce antagonistic effects, potentially enhancing resilience to one or both stressors. For instance, combined heat-salt stress in tomatoes synergistically increased glycine betaine and trehalose accumulation while maintaining higher K+ levels and reducing Na+/K+ ratios, ultimately improving cellular water status and photosynthetic more effectively than single salt stress [46]. Additionally, the unique leaf anatomy of G. biloba, characterized by sclerified mesophyll cells and stress-resistant vascular bundles, may provide inherent structural buffering against combined stress impact. Together, these responses could explain the observed decline of mesophyll limitation and higher An under combined stress conditions, although the specific synergistic mechanisms between osmotic adjustment and ion compartmentalization in G. biloba warrant further experimental verification.

5. Conclusions

This study reveals important insights into the complex dynamics of photosynthesis in G. biloba under drought, salt, and combined drought-salt stress. The results show that G. biloba exhibits a bimodal pattern of An under control conditions, primarily regulated by gm, which shifts to stomatal limitation during drought stress, especially in the late afternoon. These diurnal patterns suggest that targeted irrigation in late afternoon could optimize water use efficiency in cultivation. Under salt and combined stress conditions, a transition to a unimodal An pattern occurs, reflecting a weakened correlation between gm and An, suggesting a shift in the primary limiting factors. Notably, under combined stress, mesophyll limitation is significantly reduced compared to salt stress alone. This mechanism suggests that soil management practices maintaining mild drought could paradoxically enhance salt tolerance in field conditions. These findings suggest that G. biloba possesses adaptive mechanisms that allow it to mitigate the negative impacts of combined drought and salt stress, with a dynamic shift in limiting factors over time. The stress-specific limitation patterns provide a physiological basis for developing precision irrigation schedules and soil amendment strategies in ginkgo plantations. In the future, investigating the molecular mechanisms of osmotic regulation and ion homeostasis under combined stress could further enhance our understanding of plant resilience and help in developing strategies to improve plant performance in environments facing multiple stresses.

Author Contributions

Conceptualization, J.H.; methodology, J.H., Y.M., and Y.W.; software, J.H., Y.M., and Y.W.; validation, J.H., Y.M., and Y.W.; formal analysis, Y.M., Y.W., and S.L.; investigation, Y.M., Y.W., S.L., L.L., Y.Z., P.D., C.L., and S.T.; resources, J.H. and L.L.; data curation, J.H.; writing—original draft preparation, Y.M. and Y.W.; writing—review and editing, J.H., Y.M., Y.W., L.L., and Y.Z., P.D.; visualization, J.H., Y.M., and Y.W.; supervision, J.H.; project administration, J.H.; funding acquisition, J.H. All authors have read and agreed to the published version of the manuscript.

Funding

This research was funded by the Natural Science Foundation of Jiangsu Province (Grant No. BK20240669), the National Natural Science Foundation of China (Grant No. 32401559), and the Key Research and Development Program of Jiangsu Province (Grant No. BE2021367).

Data Availability Statement

The data underlying this article will be shared on reasonable request to the corresponding author.

Conflicts of Interest

The authors declare no conflicts of interest.

References

  1. Chaves, M.M.; Flexas, J.; Pinheiro, C. Photosynthesis under drought and salt stress: Regulation mechanisms from whole plant to cell. Ann. Bot. 2009, 103, 551–560. [Google Scholar] [CrossRef] [PubMed]
  2. Chaves, M.M. Effects of water deficits on carbon assimilation. J. Exp. Bot. 1991, 42, 1–16. [Google Scholar] [CrossRef]
  3. Munns, R.; James, R.A.; Luächli, A. Approaches to increasing the salt tolerance of wheat and other cereals. J. Exp. Bot. 2006, 57, 1025–1043. [Google Scholar] [CrossRef]
  4. Chaves, M.M.; Oliveira, M.M. Mechanisms underlying plant resilience to water deficits: Prospects for water-saving agriculture. J. Exp. Bot. 2004, 55, 2365–2384. [Google Scholar] [CrossRef]
  5. Flexas, J.; Bota, J.; Escalona, J.M.; Sampol, B.; Medrano, H. Effects of drought on photosynthesis in grapevines under field conditions: An evaluation of stomatal and mesophyll limitations. Funct. Plant Biol. 2002, 29, 461–471. [Google Scholar] [CrossRef]
  6. Galmés, J.; Medrano, H.; Flexas, J. Photosynthetic limitations in response to water stress and recovery in Mediterranean plants with different growth forms. New Phytol. 2007, 175, 81–93. [Google Scholar] [CrossRef]
  7. Buckley, T.N. How do stomata respond to water status? New Phytol. 2019, 224, 21–36. [Google Scholar] [CrossRef] [PubMed]
  8. Han, J.M.; Zhang, W.F.; Xiong, D.L.; Flexas, J.; Zhang, Y.L. Mesophyll conductance and its limiting factors in plant leaves. Chin. J. Plant Ecol. 2017, 41, 914–924. [Google Scholar]
  9. Parida, A.K.; Das, A.B. Salt tolerance and salinity effects on plants: A review. Ecotoxicol. Environ. Saf. 2005, 60, 324–349. [Google Scholar] [CrossRef]
  10. Xu, J.Y. The Photosynthetic Characteristics, Ion Homeostasis and the Correlation Between Them in GLYCINE Soja Under Salt Stress. Ph.D. Dissertation, Northeast Normal University, Changchun, China, 2016. [Google Scholar]
  11. Grassi, G.; Magnani, F. Stomatal, mesophyll conductance and biochemical limitations to photosynthesis as affected by drought and leaf ontogeny in ash and oak trees. Plant Cell Environ. 2005, 28, 834–849. [Google Scholar] [CrossRef]
  12. Han, J.M.; Lei, Z.Y.; Zhang, Y.J.; Yi, X.P.; Zhang, W.F.; Zhang, Y.L. Drought-introduced variability of mesophyll conductance in Gossypium and its relationship with leaf anatomy. Physiol. Plant. 2018, 166, 873–887. [Google Scholar] [CrossRef]
  13. Cheng, T.T.; Zhang, G.Z.; Zhang, S.Y.; Ai, Z.; Zhang, Y.T. Photosynthesis Diurnal Variation of Xanthoceras sorbifolia Bunge under Different Soil Water Conditions. Acta Bot. Boreali-Occident. Sin. 2016, 36, 1828–1835. [Google Scholar]
  14. Lawson, T.; Vialet-Chabrand, S. Speedy stomata, photosynthesis and plant water use efficiency. New Phytol. 2019, 221, 93–98. [Google Scholar] [CrossRef]
  15. Pons, T.L.; Welschen, R.A.M. Midday depression of net photosynthesis in the tropical rainforest tree Eperua grandiflora: Contributions of stomatal and internal conductances, respiration and Rubisco functioning. Tree Physiol. 2003, 23, 937–947. [Google Scholar] [CrossRef]
  16. Zhao, Y.P. Study on Photosynthetic Diurnal Variation of Salix Matsudana Under Salt Stress. Ph.D. Dissertation, Shanxi Academy of Forestry and Grassland Sciences, Taiyuan, China, 2023. [Google Scholar]
  17. Zhou, D.F.; Han, D.H.; Meng, H.J.; Zhao, T.; Guo, H. Study on Summer Diurnal Variation of Photosynthesis of Zhenzhuyouxing Apricot in Sandy Wasteland of Middle Heihe River. J. Northeast Agric. Sci. 2019, 47, 128–130. [Google Scholar]
  18. Wang, L.; Cui, J.W.; Jin, B.; Zhao, J.G.; Xu, H.M.; Lu, Z.G.; Li, W.; Li, X.; Li, L.; Liang, E.; et al. Multifeature analyses of vascular cambial cells reveal longevity mechanisms in old Ginkgo biloba trees. Proc. Natl. Acad. Sci. USA 2020, 117, 2201–2210. [Google Scholar] [CrossRef]
  19. Roig-Oliver, M.; Bresta, P.; Nadal, M.; Liakopoulos, G.; Nikolopoulos, D.; Karabourniotis, G.; Bota, J.; Flexas, J. Cell wall composition and thickness affect mesophyll conductance to CO2 diffusion in Helianthus annuus under water deprivation. J. Exp. Bot. 2020, 71, 7198–7209. [Google Scholar] [CrossRef] [PubMed]
  20. Li, L.; Zhou, K.; Yang, X.; Su, X.; Ding, P.; Zhu, Y.; Cao, F.; Han, J. Leaf nitrogen allocation to non-photosynthetic apparatus reduces mesophyll conductance under combined drought-salt stress in Ginkgo biloba. Front. Plant Sci. 2025, 16, 1557412. [Google Scholar] [CrossRef]
  21. Ni, J.; Hao, J.; Jiang, Z.; Zhan, X.; Dong, L.; Yang, X.; Sun, Z.; Xu, W.; Wang, Z.; Xu, M. NaCl Induces flavonoid biosynthesis through a putative novel pathway in post-harvest Ginkgo leaves. Front. Plant Sci. 2017, 8, 920. [Google Scholar] [CrossRef]
  22. Chen, Y.; Lin, F.; Yang, H.; Yue, L.; Hu, F.; Wang, J.; Luo, Y.; Cao, F. Effect of varying NaCl doses on flavonoid production in suspension cells of Ginkgo biloba: Relationship to chlorophyll fluorescence, ion homeostasis, antioxidant system and ultrastructure. Acta Physiol. Plant. 2014, 36, 3173–3187. [Google Scholar] [CrossRef]
  23. Shi, W.Y.; Du, Y.T.; Ma, J.; Min, D.H.; Jin, L.G.; Chen, J.; Chen, M.; Zhou, Y.B.; Ma, Y.Z.; Xu, Z.S.; et al. The WRKY transcription factor GmWRKY12 confers drought and salt tolerance in soybean. Int. J. Mol. Sci. 2018, 19, 4087. [Google Scholar] [CrossRef] [PubMed]
  24. Harley, P.C.; Loreto, F.; Di Marco, G.; Sharkey, T.D. Theoretical considerations when estimating the mesophyll conductance to CO2 flux by the analysis of the response of photosynthesis to CO2. Plant Physiol. 1992, 98, 1429–1436. [Google Scholar] [CrossRef]
  25. Björkman, O.; Demmig, B. Photon yield of O2 evolution and chlorophyll fluorescence characteristics at 77 K among vascular plants of diverse origins. Planta 1987, 170, 489–504. [Google Scholar] [CrossRef] [PubMed]
  26. Schreiber, U. Pulse-amplitude-modulation (PAM) fluorometry and saturation pulse method: An overview. In Chlorophyll a Fluorescence. Advances in Photosynthesis and Respiration; Papageoriou, G.C., Govindjee, Eds.; Springer: Dordrecht, The Netherlands, 2004; Volume 19, pp. 279–319. [Google Scholar]
  27. von Caemmerer, S. Biochemical Models of Leaf Photosynthesis; CSIRO: Collingwood, Australia, 2000. [Google Scholar]
  28. Walker, B.; Ariza, L.S.; Kaines, S.; Badger, M.R.; Cousins, A.B. Temperature response of in vivo Rubisco kinetics and mesophyll conductance in Arabidopsis thaliana: Comparisons to Nicotiana tabacum. Plant Cell Environ. 2013, 36, 2108–2119. [Google Scholar] [CrossRef]
  29. Deans, R.M.; Brodribb, T.J.; Busch, F.A.; Farquhar, G.D. Plant water-use strategy mediates stomatal effects on the light induction of photosynthesis. New Phytol. 2019, 222, 382–395. [Google Scholar] [CrossRef]
  30. Deans, R.M.; Farquhar, G.D.; Busch, F.A. Estimating stomatal and biochemical limitations during photosynthetic induction. Plant Cell Environ. 2019, 42, 3227–3240. [Google Scholar] [CrossRef]
  31. Liu, T.; Barbour, M.M.; Yu, D.; Rao, S.; Song, X. Mesophyll conductance exerts a significant limitation on photosynthesis during light induction. New Phytol. 2022, 233, 360–372. [Google Scholar] [CrossRef]
  32. Munne-Bosch, S.; Nogues, S.; Alegre, L. Diurnal variations of photosynthesis and dew absorption by leaves in two evergreen shrubs growing in Mediterranean field conditions. New Phytol. 1999, 144, 109–119. [Google Scholar] [CrossRef]
  33. Han, J.M.; Flexas, J.; Xiong, D.L.; Galmes, J.; Zhang, Y. Regulation of photosynthesis and water-use efficiency in pima and upland cotton species subjected to drought and recovery. Photosynthetica 2024, 62, 6–15. [Google Scholar] [CrossRef] [PubMed]
  34. Wang, X.; Ma, W.T.; Sun, Y.R.; Xu, Y.N.; Li, L.; Miao, G.; Tcherkez, G.; Gong, X.Y. The response of mesophyll conductance to short-term CO2 variation is related to stomatal conductance. Plant Cell Environ. 2024, 47, 1. [Google Scholar] [CrossRef] [PubMed]
  35. Hu, K.; Zhao, P.; Wu, K.; Yang, H.; Yang, Q.; Fan, M.; Long, G. Reduced and deep application of controlled-release urea maintained yield and improved nitrogen-use efficiency. Field Crops Res. 2023, 295, 108876. [Google Scholar] [CrossRef]
  36. Wilkinson, S.; Davies, W.J. ABA-based chemical signaling: The coordination of responses to stress in plants. J. Exp. Bot. 2002, 53, 1143–1154. [Google Scholar]
  37. Munns, R.; Tester, M. Mechanisms of salinity tolerance. Annu. Rev. Plant Biol. 2008, 59, 651–681. [Google Scholar] [CrossRef] [PubMed]
  38. Daszkowska-Golec, A.; Szarejko, I. Open or close the gate—Stomata action under the control of phytohormones in drought stress conditions. Front. Plant Sci. 2013, 4, 138. [Google Scholar] [CrossRef]
  39. Miller, G.; Suzuki, N.; Ciftci-Yilmaz, S.; Mittler, R. Reactive oxygen species homeostasis and signalling during drought and salinity stresses. Plant Cell Environ. 2010, 33, 453–467. [Google Scholar] [CrossRef]
  40. Sarwas, M.K.S.; Ullah, I.; Rahman, M.U.; Ashraf, M.Y.; Zafar, Y. Glycine betaine accumulation and its relation to yield and yield components in cotton genotypes grown under water deficit conditions. Pak. J. Bot. 2006, 38, 1449–1456. [Google Scholar]
  41. Chen, T.H.H.; Murata, N. Glycine betaine protects plants against abiotic stress: Mechanisms and biotechnological applications. Plant Cell Environ. 2010, 34, 1–20. [Google Scholar] [CrossRef] [PubMed]
  42. Jarin, A.; Ghosh, U.K.; Hossain, M.S.; Mahmud, A.; Khan, M.A.R. Glycine betaine in plant responses and tolerance to abiotic stresses Afsana. Disc. Agric. 2024, 2, 127. [Google Scholar] [CrossRef]
  43. Hussain, T.; Asrar, H.; Zhang, W.; Liu, X. The combination of salt and drought benefits selective ion absorption and nutrient use efficiency of halophyte Panicum antidotale. Front. Plant Sci. 2023, 14, 1091292. [Google Scholar] [CrossRef]
  44. Hussain, T.; Koyro, H.W.; Zhang, W.; Liu, X.; Gul, B.; Liu, X. Low salinity improves photosynthetic performance in Panicum antidotale under drought stress. Front. Plant Sci. 2000, 11, 481. [Google Scholar] [CrossRef]
  45. Suzuki, N.; Rivero, R.M.; Shulaev, V.; Blumwald, E.; Mittler, R. Tansley review Abiotic and biotic stress combinations. New Phytol. 2014, 203, 32–43. [Google Scholar] [CrossRef] [PubMed]
  46. Rivero, R.M.; Mestre, T.C.; Mittler, R.; Rubio, F.; Garcia-Sanchez, F.; Martinez, V. The combined effect of salinity and heat reveals a specific physiological, biochemical and molecular response in tomato plants: Stress combination in tomato plants. Plant Cell Environ. 2014, 37, 1059–1073. [Google Scholar] [CrossRef] [PubMed]
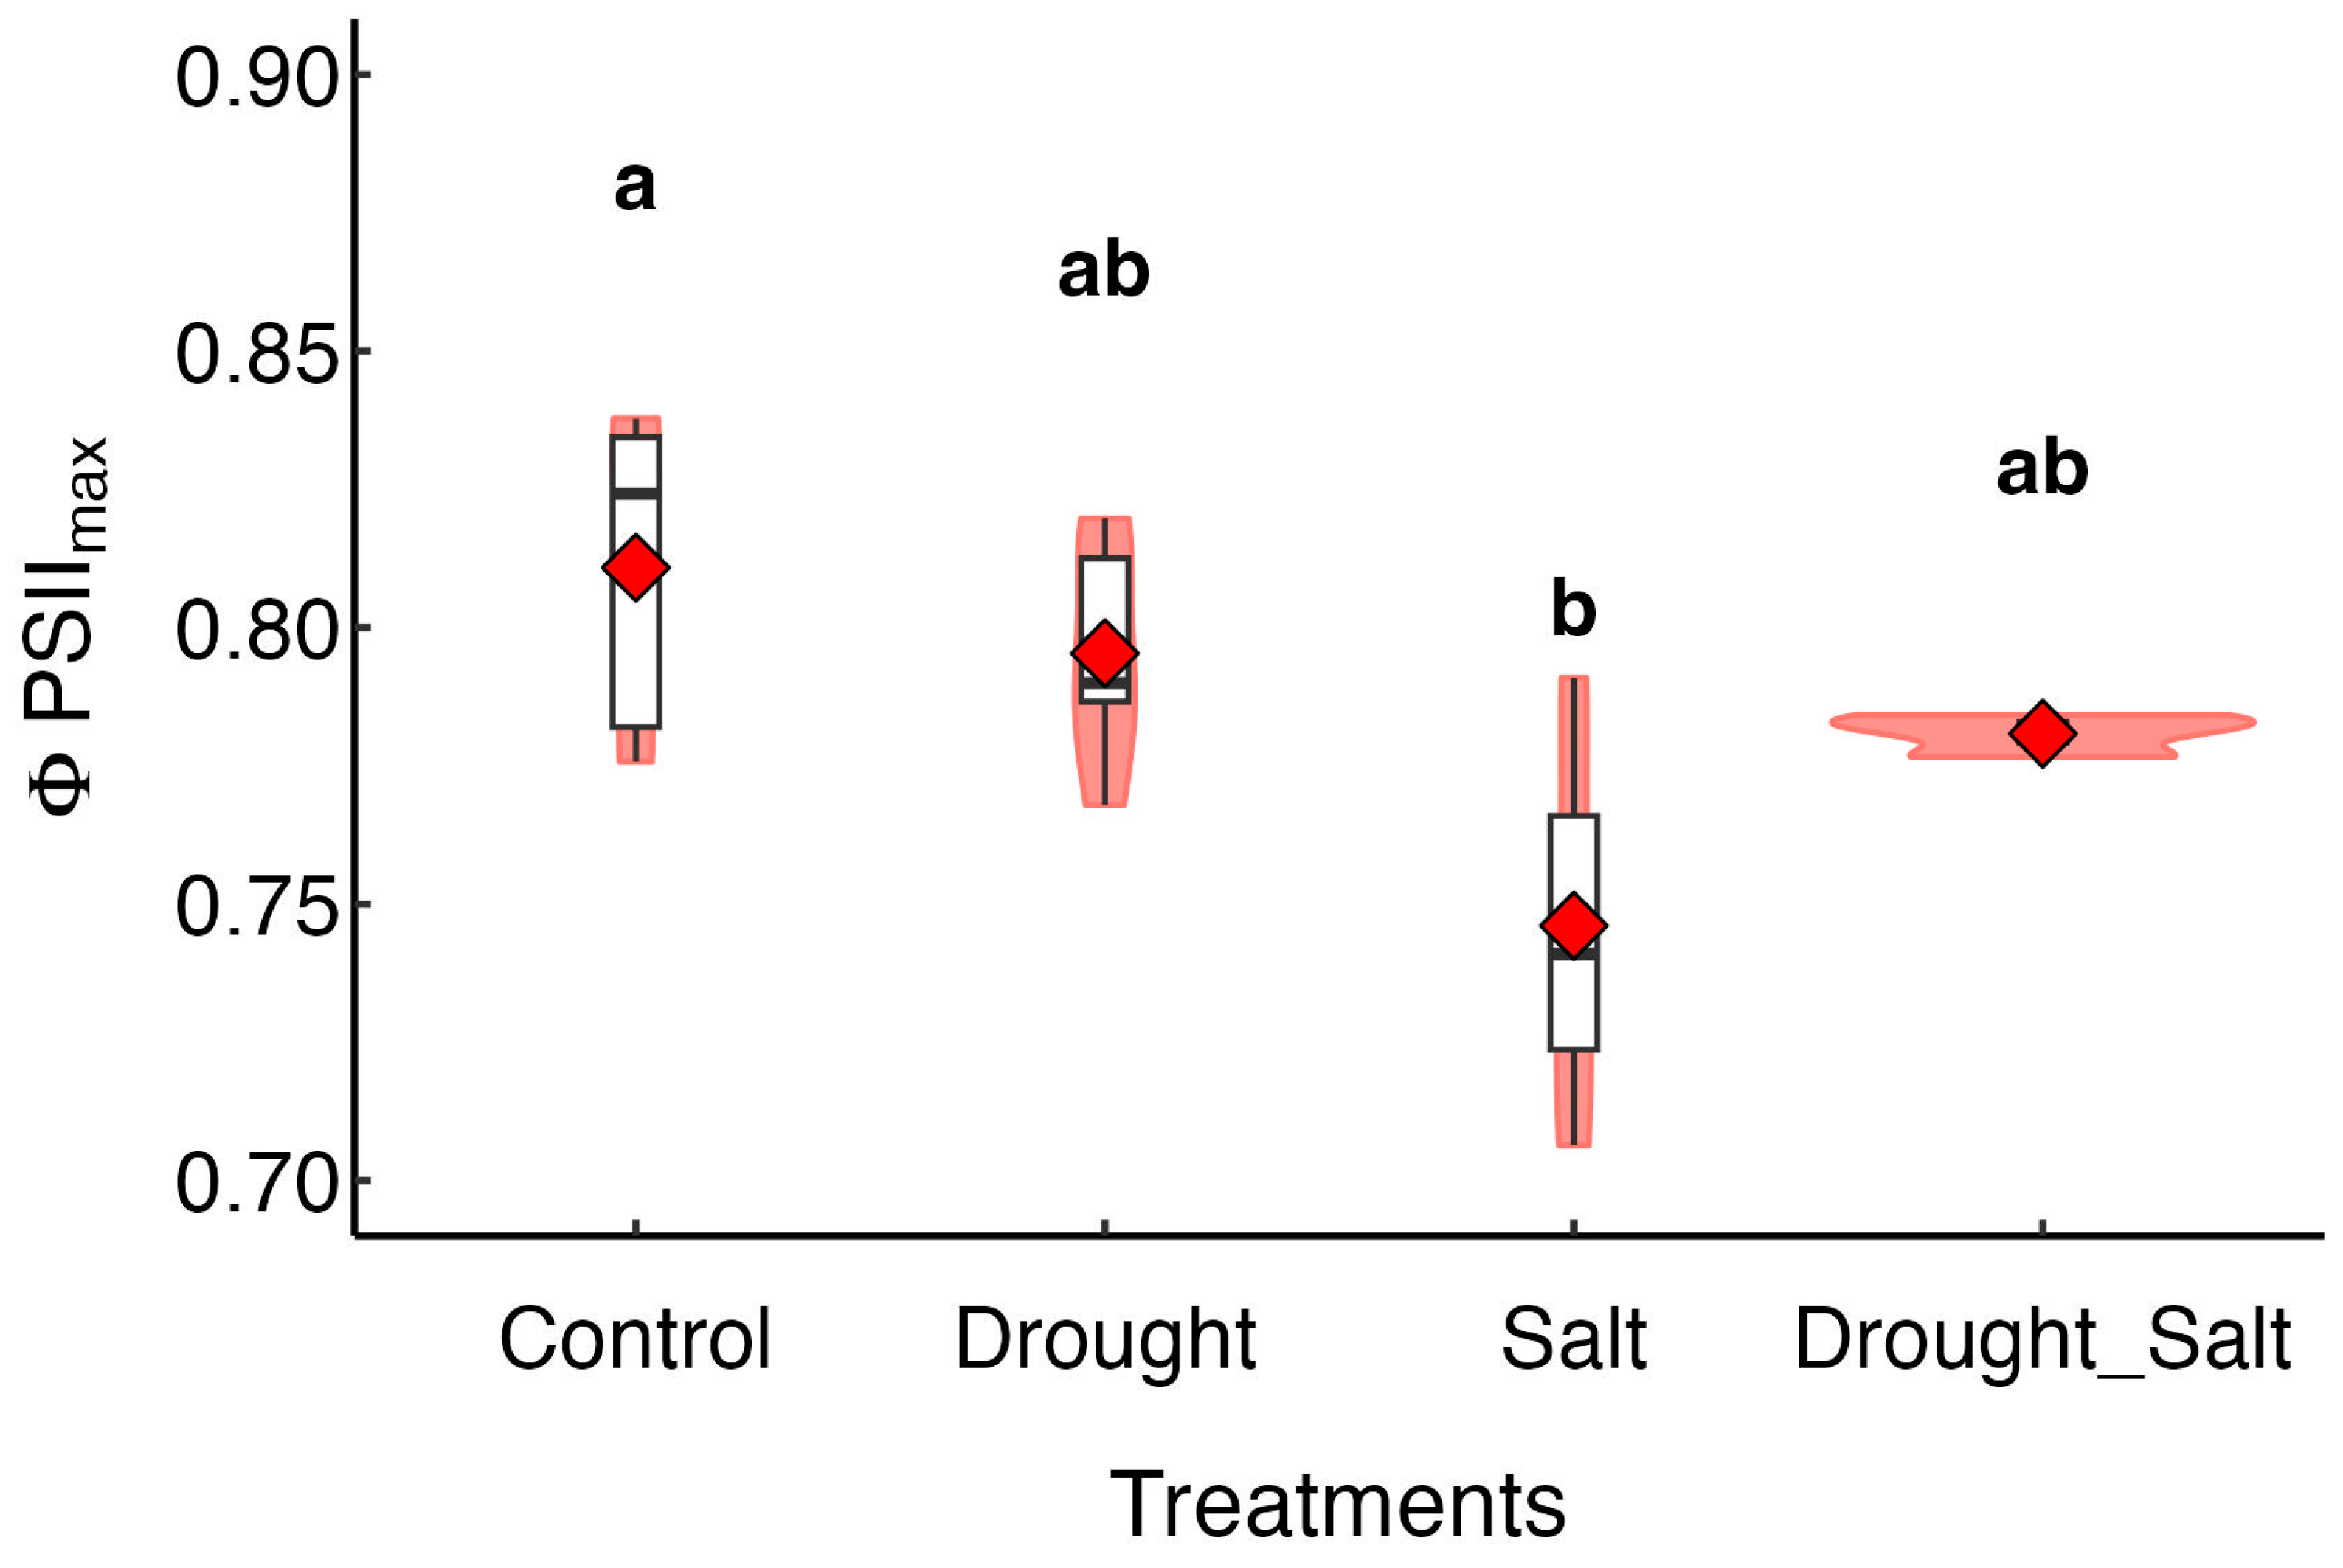
Figure 1. Changes in the maximum photochemical quantum yield (ΦPSIImax) under different treatments. Violin plots show the probability density distribution of data, with wider sections indicating higher data concentration (most pronounced in the Drought_Salt treatment). Boxplots inside violins display the interquartile range (IQR, 25th–75th percentile, white boxes), median line, and 1.5×IQR whiskers. Red diamond markers represent mean values of five replicates. Lowercase letters indicate statistically significant differences among treatments (p < 0.05, one-way ANOVA with Tukey’s HSD test).
Forests 16 01334 g001
Figure 2. Diurnal variations in (A) the net photosynthetic rate (An), (B) stomatal conductance (gs), (C) mesophyll conductance (gm), and (D) maximum carboxylation rate (Vcmax) under different treatments. The data points display the measured values, while the line illustrates the fitted curve generated using the GAM approach, with the shaded ribbons indicating the 95% confidence intervals.
Forests 16 01334 g002
Figure 3. Correlations among photosynthetic traits under different treatments: (A) net photosynthetic rate (An) vs. stomatal conductance (gs); (B) An vs. mesophyll conductance (gm); (C) gm vs. gs; (D) An vs. maximum carboxylation rate (Vcmax). Different colors represent distinct treatment groups (see legend). Solid lines indicate linear regression fits, with regression equations and correction coefficients (R2) shown for each treatment.
Forests 16 01334 g003
Figure 4. Quantitative diurnal analysis of photosynthetic limitations under (A) Drought, (B) Salt, and (C) combined Drought_Salt stress treatments. Stress-induced deviation in An (dAcal) relative to that of control plants was calculated at each time point and partitioned into biochemical (dAbio), mesophyll (dAmeso), and stomatal (dAstom) components.
Forests 16 01334 g004
Figure 5. Standardized path coefficients obtained from structural equation modeling (SEM) analyzing photosynthetic traits under (A) Control, (B) Drought, (C) Salt, and (D) combined Drought_Salt treatments. Solid red arrows indicate positive relationships, while blue arrows represent negative relationships. Node labels include An (net photosynthetic rate), gs (stomatal conductance), gm (mesophyll conductance), and Vcmax (maximum carboxylation rate).
Forests 16 01334 g005
Table 1. Decomposition of path coefficients showing direct, indirect, and total effects (standardized β ± bootstrap standard error) of stomatal conductance (gs), mesophyll conductance (gm), and maximum carboxylation rate (Vcmax) on net photosynthetic rate (An) under different stress conditions. Significance levels: *** p < 0.001, ** p < 0.01, * p < 0.05, ns (not significant) p > 0.05.
TreatmentsPathDirect Effect (Standardized β ± Bootstrap Standard Error)Indirect Effect (Standardized β ± Bootstrap Standard Error)SignificanceTotal Effect (Standardized β ± Bootstrap Standard Error) (Significance)
ControlgsAn0.51 ± 0.05/***0.82 ± 0.09 (***)
gsgmAn/0.30 ± 0.08***
gsVcmaxAn/0.02 ± 0.02ns
gmAn0.58 ± 0.04/***0.86 ± 0.08 (***)
gmgsAn/0.26 ± 0.08**
gmVcmaxAn/0.02 ± 0.02ns
VcmaxAn0.05 ± 0.05/ns0.46 ± 0.14 (**)
VcmaxgsAn/0.23 ± 0.07**
VcmaxgmAn/0.18 ± 0.08*
DroughtgsAn0.70 ± 0.04/***0.89 ± 0.06 (***)
gsgmAn/0.20 ± 0.08*
gsVcmaxAn/–0.01 ± 0.01ns
gmAn0.47 ± 0.04/***0.75 ± 0.11 (***)
gmgsAn/0.29 ± 0.09**
gmVcmaxAn/–0.01 ± 0.01ns
VcmaxAn–0.03 ± 0.03/ns0.50 ± 0.12 (***)
VcmaxgsAn/0.34 ± 0.09***
VcmaxgmAn/0.19 ± 0.06**
SaltgsAn0.63 ± 0.09/***0.96 ± 0.07 (***)
gsgmAn/0.37 ± 0.10***
gsVcmaxAn/–0.04 ± 0.04ns
gmAn0.44 ± 0.78/***0.94 ± 0.09 (***)
gmgsAn/0.53 ± 0.12***
gmVcmaxAn/–0.03 ± 0.03ns
VcmaxAn–0.05 ± 0.04/ns0.76 ± 0.13 (***)
VcmaxgsAn/0.51 ± 0.11***
VcmaxgmAn/0.30 ± 0.08***
Drought_SaltgsAn0.61 ± 0.05/***0.84 ± 0.09 (***)
gsgmAn/0.25 ± 0.09**
gsVcmaxAn/–0.02 ± 0.02ns
gmAn0.52 ± 0.06/***0.81 ± 0.11 (***)
gmgsAn/0.29 ± 0.10**
gmVcmaxAn/0.00 ± 0.01ns
VcmaxAn–0.05 ± 0.04/ns0.14 ± 0.16 (na)
VcmaxgsAn/0.20 ± 0.09*
VcmaxgmAn/–0.01 ± 0.08ns
Disclaimer/Publisher’s Note: The statements, opinions and data contained in all publications are solely those of the individual author(s) and contributor(s) and not of MDPI and/or the editor(s). MDPI and/or the editor(s) disclaim responsibility for any injury to people or property resulting from any ideas, methods, instructions or products referred to in the content.