Article

Climate–Growth Sensitivity Reveals Species-Specific Adaptation Strategies of Montane Conifers to Warming in the Wuyi Mountains

1
Scientific Observation and Research Station for Ecological Environment of Wuyi Mountains, Ministry of Ecology and Environment, Nanjing 210042, China
2
Fujian Wuyishan State Integrated Monitoring Station for Ecological Quality of Forest Ecosystem, Wuyishan 354300, China
3
Nanjing Institute of Environmental Sciences, Ministry of Ecology and Environment, 8 Jiangwangmiao Street, Nanjing 210042, China
4
College of Landscape Architecture, Jiangsu Vocational College of Agriculture and Forestry, Zhenjiang 212400, China
*
Authors to whom correspondence should be addressed.
These authors contributed equally to this work.
Forests 2025, 16(8), 1299; https://doi.org/10.3390/f16081299
Submission received: 15 June 2025 / Revised: 26 July 2025 / Accepted: 27 July 2025 / Published: 8 August 2025
(This article belongs to the Special Issue Environmental Signals in Tree Rings)

Abstract

Subtropical high-elevation mountain ecosystems are crucial for regional climate regulation and biodiversity conservation. However, the patterns of conifer radial growth in response to climate change in these regions remain unclear, significantly hindering the development of effective adaptive forest management strategies. This study examined Pinus taiwanensis and Cryptomeria fortunei, two dominant species in the Wuyi Mountains, using dendroclimatological methods to systematically analyze their long-term climate–growth relationships. The main findings include the following: (1) P. taiwanensis radial growth was significantly and positively associated with summer mean and maximum temperatures (in both the current and previous year), with no significant correlation to precipitation or minimum temperatures. In contrast, C. fortunei growth showed a positive relationship with previous autumn precipitation and a negative correlation with previous winter precipitation; (2) moving-window analysis revealed that P. taiwanensis maintained consistent temperature sensitivity, with an increasing response to summer warming in recent decades. Meanwhile, C. fortunei displayed phase-specific responses driven by precipitation and minimum temperatures. These results demonstrate divergent climate-response strategies among subtropical conifers in a warming climate: P. taiwanensis exhibits temperature-sensitive growth, whereas C. fortunei is primarily regulated by moisture availability. The findings provide critical insights for the adaptive management of subtropical montane forests, highlighting the need for species-specific strategies to maintain ecosystem services under future climate change.

1. Introduction

Global warming has become one of the most significant ecological challenges of the 21st century, with far-reaching impacts on the structure and function of terrestrial ecosystems [1,2]. Forests, as a core component of these ecosystems, play a vital role in regulating the global carbon cycle through carbon sequestration, thereby supporting regional climate stability and ecological balance [2,3]. High-altitude ecosystems, known for their sensitivity to climate change, are increasingly vulnerable as the frequency of extreme drought events rises, threatening the stability of forest vegetation [4]. Rising temperatures alter the factors that constrain tree growth by disrupting the water–heat balance. Moreover, differences in functional traits among tree species lead to varied responses to these changes [5]. These differences directly impact forest ecosystem services and the capacity to maintain biodiversity.
The response mechanisms of high-altitude tree species to climate change vary significantly across species [6]. While traditional theory suggests that temperature is the primary limiting factor, recent studies highlight the complexity of these responses: under identical climatic conditions, different species may exhibit either synchronized or divergent growth patterns [6,7]. This variability stems primarily from species-specific physiological and ecological adaptation strategies, including differences in key functional traits such as hydraulic conductivity, photosynthetic carbon assimilation capacity, and non-structural carbohydrates [8]. However, the current understanding of how multiple species respond to climate change in subtropical high-altitude forests remains limited [9]. Systematic comparative studies across species are therefore essential, not only to identify both universal patterns and species-specific mechanisms in tree climate–growth relationships, but also to establish a theoretical foundation for accurately evaluating forest carbon sequestration potential and developing science-based adaptive management strategies [3].
Tree rings have emerged as a valuable proxy for climate reconstruction in subtropical mountain regions, offering high temporal resolution, continuous chronological records, and extensive spatial coverage [10,11]. Variations in ring width allow for precise quantification of tree growth responses to temperature, precipitation, and drought events [12]. This is especially important in high-altitude subtropical areas where climate data are limited. In such regions, dendrochronological analysis reveals interspecies differences in hydroclimatic sensitivity, providing biological evidence for assessing carbon sink stability [13]. Integrating multi-species tree-ring networks across spatial scales can effectively reveal ecological response patterns to regional climate change, while also providing a critical scientific basis for optimizing climate model parameters and developing nature-based forest adaptation strategies.
The Wuyi Mountains, situated at the intersection of the subtropical monsoon and mountain climate zones, represent a characteristic high-altitude subtropical forest ecosystem in China [14]. The region’s distinct hydrothermal gradient and vertical climatic stratification make it an ideal natural laboratory for investigating tree climate–growth relationships [15]. However, dendroclimatological research in this region remains limited [16]. Existing studies have primarily focused on single-species analyses [12], with few systematic comparisons examining how different functional conifer species respond to climate variability. Pinus taiwanensis and Cryptomeria fortunei, two dominant conifers comprising approximately 60% of the total coniferous biomass in these high-altitude forests [16], play complementary roles in maintaining regional ecological balance [15]. P. taiwanensis serves as a keystone species for soil stabilization on steep slopes, while C. fortunei acts as a critical water regulator in a subtropical forest ecosystem. However, it remains unclear whether their radial growth patterns responds to climate warming in a coordinated or contrasting manner. By comparing tree-ring width characteristics and climate sensitivities of these two species using dendroclimatological methods, this study aims to reveal their distinct ecological adaptation strategies to climate change. The findings are intended to provide a theoretical basis for precise regional forest carbon sink assessment and inform biodiversity conservation efforts.

2. Materials and Methods

2.1. Study Area

The research was conducted on Huanggang Mountain (Figure 1), the highest peak (2160 m) of the Wuyi Mountain Range that forms the provincial boundary between Fujian and Jiangxi. The mountain is located at 27°33′–28°04′ N, 117°27′–117°51′ E; this NE–SW trending range extends approximately 52 km with an average elevation exceeding 1200 m. The mountain is located within Yangzhuang Township, Mount Wuyi City, Fujian Province, and Wuyishan Town, Qianshan County, Shangrao City, Jiangxi Province. Its southern foot lies in Fujian Province, while the northern foot marks the boundary with Jiangxi Province. Huanggang Mountain features a well-preserved ecosystem characterized by distinct vertical vegetation zones. From the base to the summit, vegetation transitions through evergreen broad-leaved forests, mixed coniferous and broad-leaved forests, coniferous forests, dwarf crooked forests, and alpine meadows [15]. P. taiwanensis and C. fortunei are the two dominant conifer species, primarily found at high elevations where they play a key role in maintaining local climatic balance (Table 1). These characteristics make Huanggang Mountain an ideal location for studying subtropical mountain ecosystems.
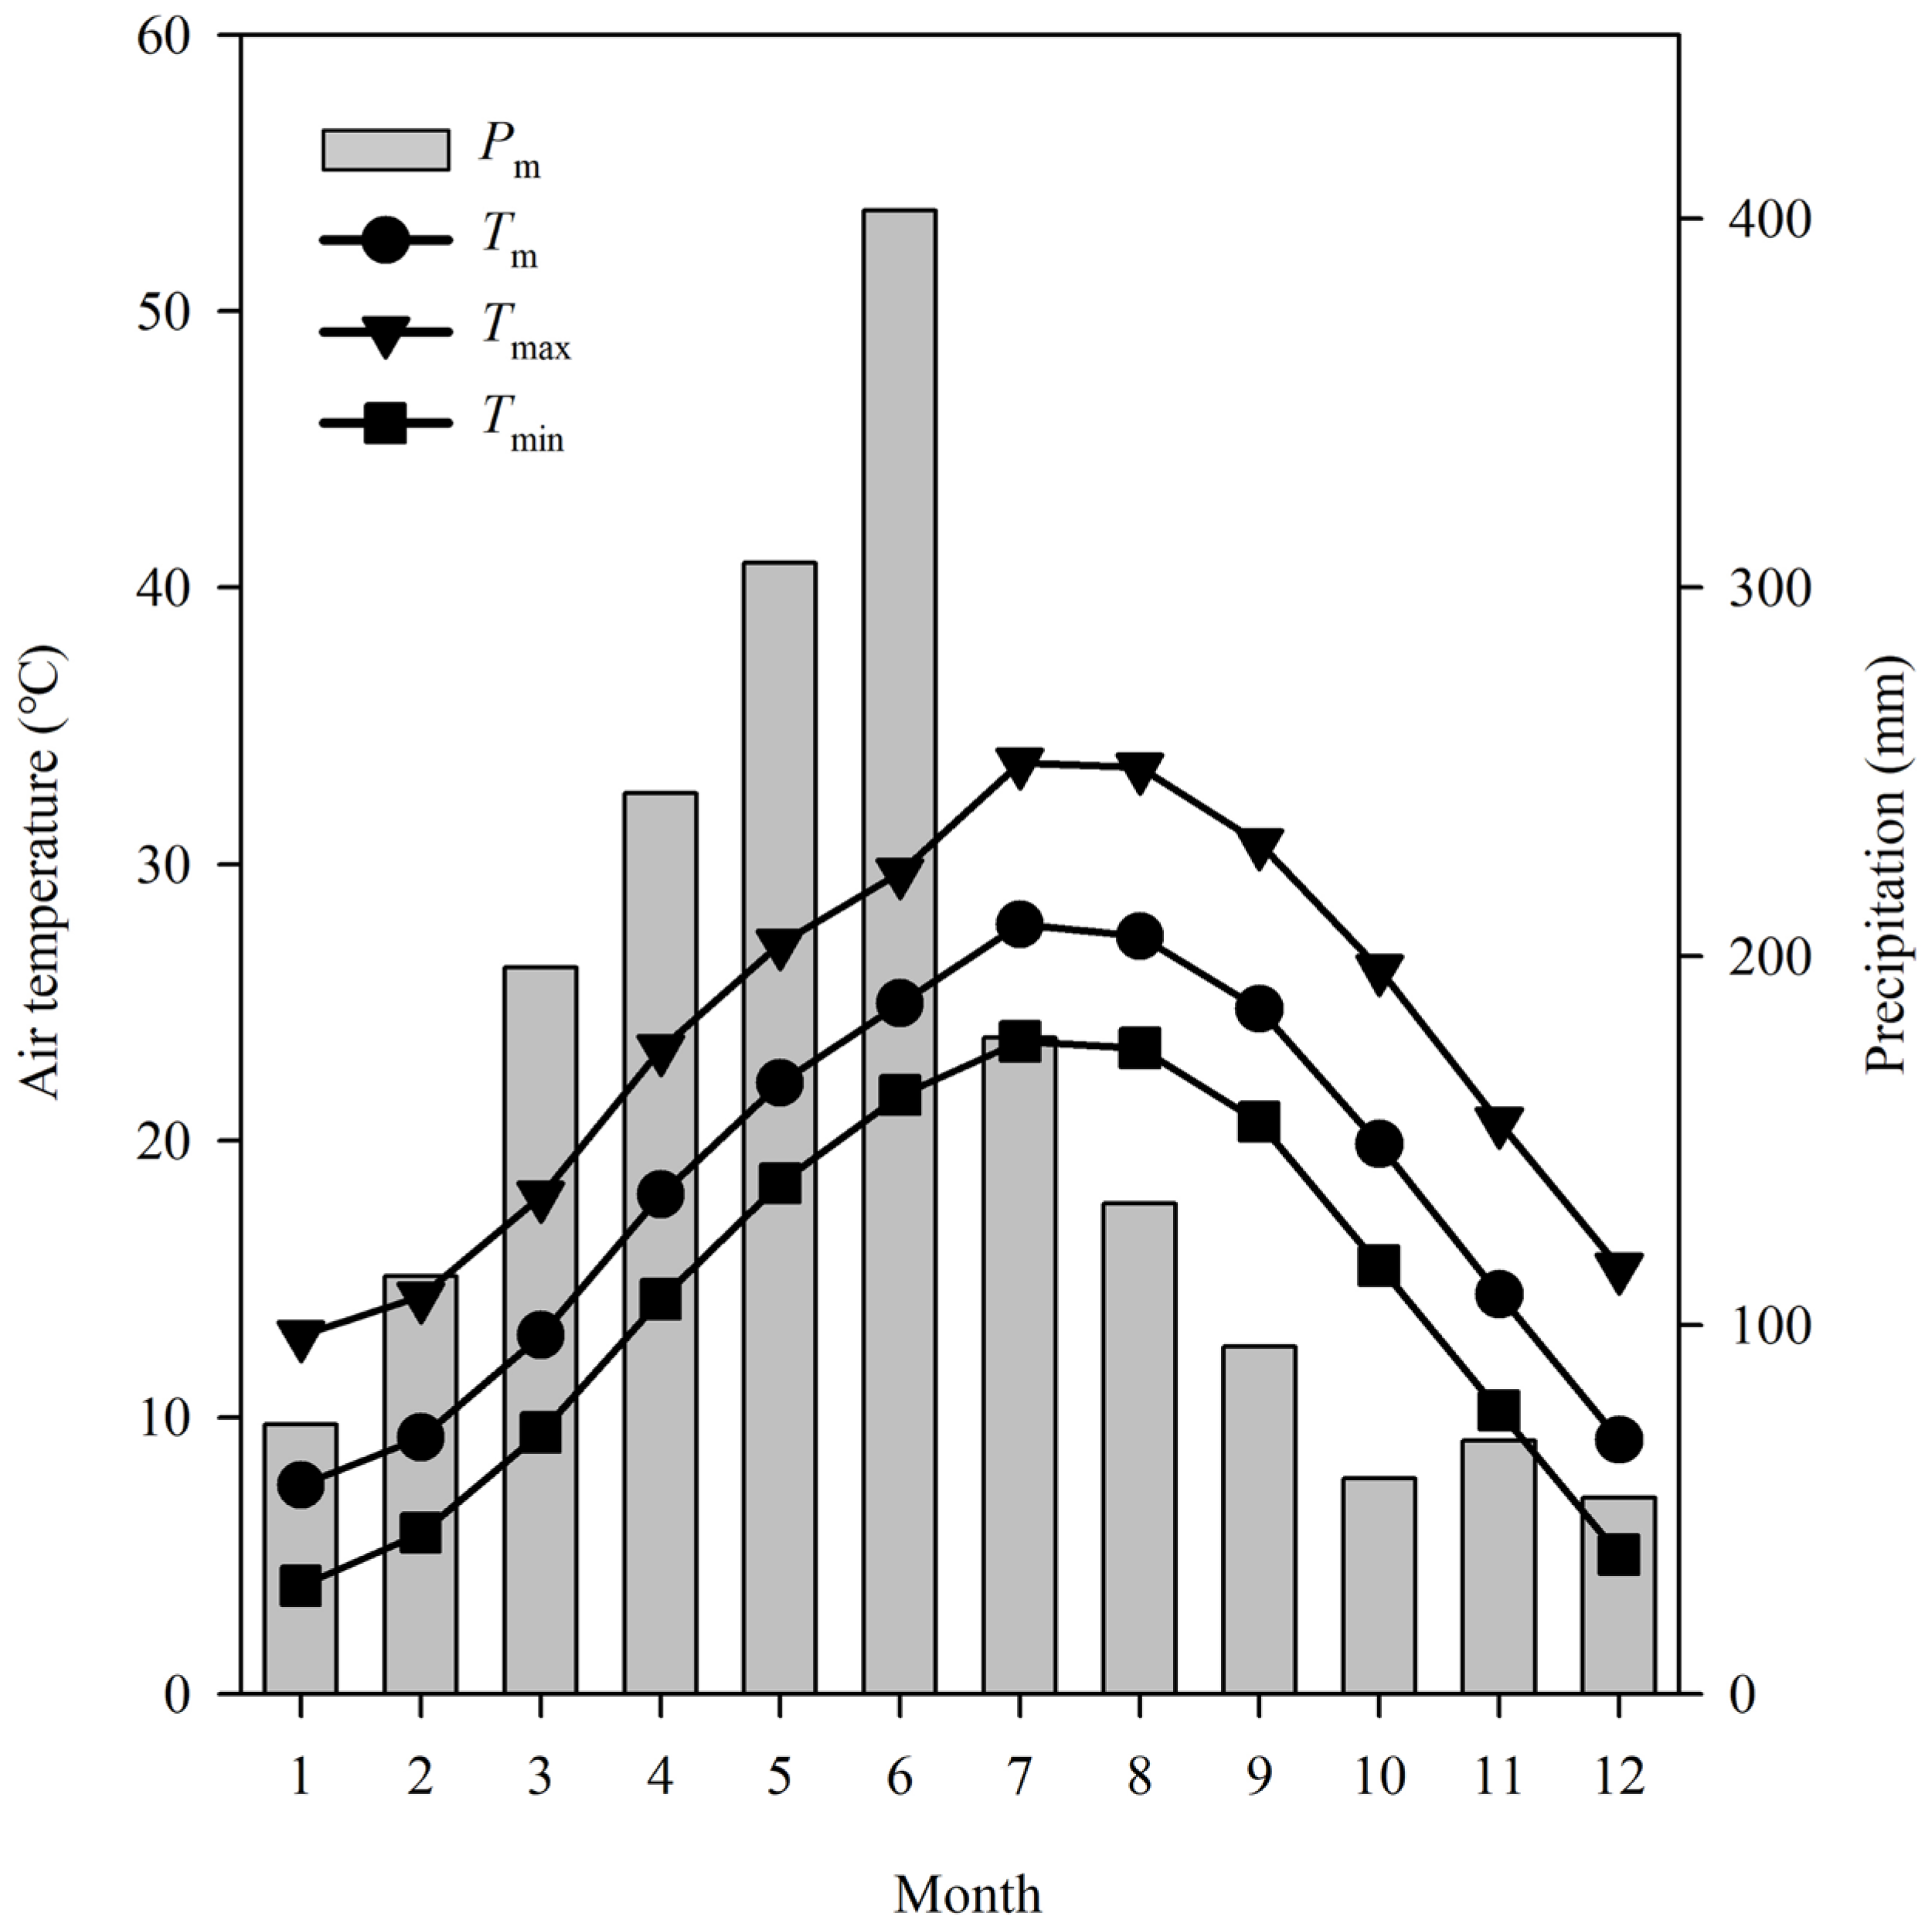
This area experiences a typical temperate continental climate influenced by the East Asian summer monsoon (EASM). Regional climate data were recorded by meteorological stations near the study site (Figure 2). Between 1957 and 2019, the annual mean temperature was 18.2 °C. January was the coldest month, averaging 7.5 °C, while July was the warmest, with a mean temperature of 27.8 °C. The significant seasonal temperature difference of 20.3 °C indicates strong seasonality in the region. Mean annual precipitation is 1923 mm, with the highest monthly precipitation in June (402 mm) and the lowest in December (53 mm). Approximately 53% of the annual precipitation occurs between May and August, indicating a pronounced wet season dominated by summer monsoon rains.

2.2. Regional Climate Data

Meteorological data from 1957 to 2019 were obtained from the China Meteorological Data Sharing Service System (http://www.nmic.cn/, accessed on 26 July 2025). The primary data source was the Wuyishan Station (222.1 m a.s.l., 27°46′ N, 118°02′ E), located approximately 28 km southeast of the sampling sites, as it provides the closest and most representative climate records for the study area (Figure 1). The dataset included monthly climate variables: mean temperature (Tm), maximum temperature (Tmax), minimum temperature (Tmin), and total precipitation (Pm). These indicators are especially valuable for dendroclimatological analysis, as they reflect key environmental factors that influence tree radial growth.

2.3. Tree-Ring Sampling and Chronology Development

Tree-ring cores from P. taiwanensis and C. fortunei were collected in November 2023 from high-altitude areas near the upper forest limit of the Wuyi Mountains (Figure 1). The study site is a well-preserved natural forest with minimal human disturbance, and a canopy density ranging from 70% to 80%. To minimize non-climatic noise in the tree-ring data, only healthy, undamaged trees were sampled. Preference was given to dominant trees with large diameters at breast height (DBH) located in the upper canopy layer. Typically, one core per tree was extracted at breast height (1.3 m above ground) using a 5.15-mm increment borer, resulting in a total of 95 cores.
The collected cores were air-dried in the laboratory, then mounted and polished according to standard dendrochronological protocols [17]. Tree-ring widths were measured with a precision of 0.01 mm using a LINTAB™ 6.0 measuring system. Cross-dating accuracy and measurement quality were verified using COFECHA program (v6.06P) [18]. Cores with abnormal ring characteristics, such as missing rings or indistinct boundaries, which hindered reliable cross-dating, were excluded from further analysis. After quality screening, 90 cores (45 from P. taiwanensis and 45 from C. fortunei) were retained for chronology development. To reduce non-climatic influences, the raw ring-width series were detrended and standardized using ARSTAN program (v41d) [19]. A 67% cubic smoothing spline with a 50% frequency cutoff was applied to preserve high-frequency climatic signals while removing age-related growth trends (Figure 3). The standard chronology, selected for its superior statistical properties, was then used to analyze the relationship between tree growth and climate variables.

2.4. Data and Statistical Analysis

The study analyzed long-term trends in annual mean temperature, total precipitation, mean maximum temperature, and mean minimum temperature in the study area from 1957 to 2019. All statistical analyses of p-values in this study were consistently conducted for the time period spanning 1957 to 2019. The common statistical parameters of correlation among individual tree-ring series (Rbar), expressed population signal (EPS), mean sensitivity (MS), signal-to-noise ratio (SNR), and first-order autocorrelation (AC1) in the dendro-sciences were used to assess the statistical quality of the TRW chronologies [19].
To evaluate the climate–growth relationships of P. taiwanensis and C. fortunei in the Wuyi Mountains, Pearson correlation analysis was conducted to identify climate signals in the tree-ring width indices and to validate the relationships between tree growth and climatic variables. Given that climate conditions in the preceding year may influence current-year ring formation [20], correlations were calculated between the standard chronologies and climate variables from May of the previous year (P5) to September of the current year (C9), covering the period 1957–2019. To investigate the seasonal effects of climate on growth, climate variables were categorized by season and correlated with the standard chronology. The seasons were defined as follows: previous spring (PP, March–May), previous summer (PS, June–August), previous autumn (PA, September–November), previous winter (PW, December–February), current spring (CP, March–May), current summer (CS, June–August), and current autumn (CA, September–November). To account for potential shifts in climate–growth relationships over time, the moving correlation function in DendroCLIM 2002 was applied using a 25-year sliding window [21].

3. Results

3.1. Climate Change Trends

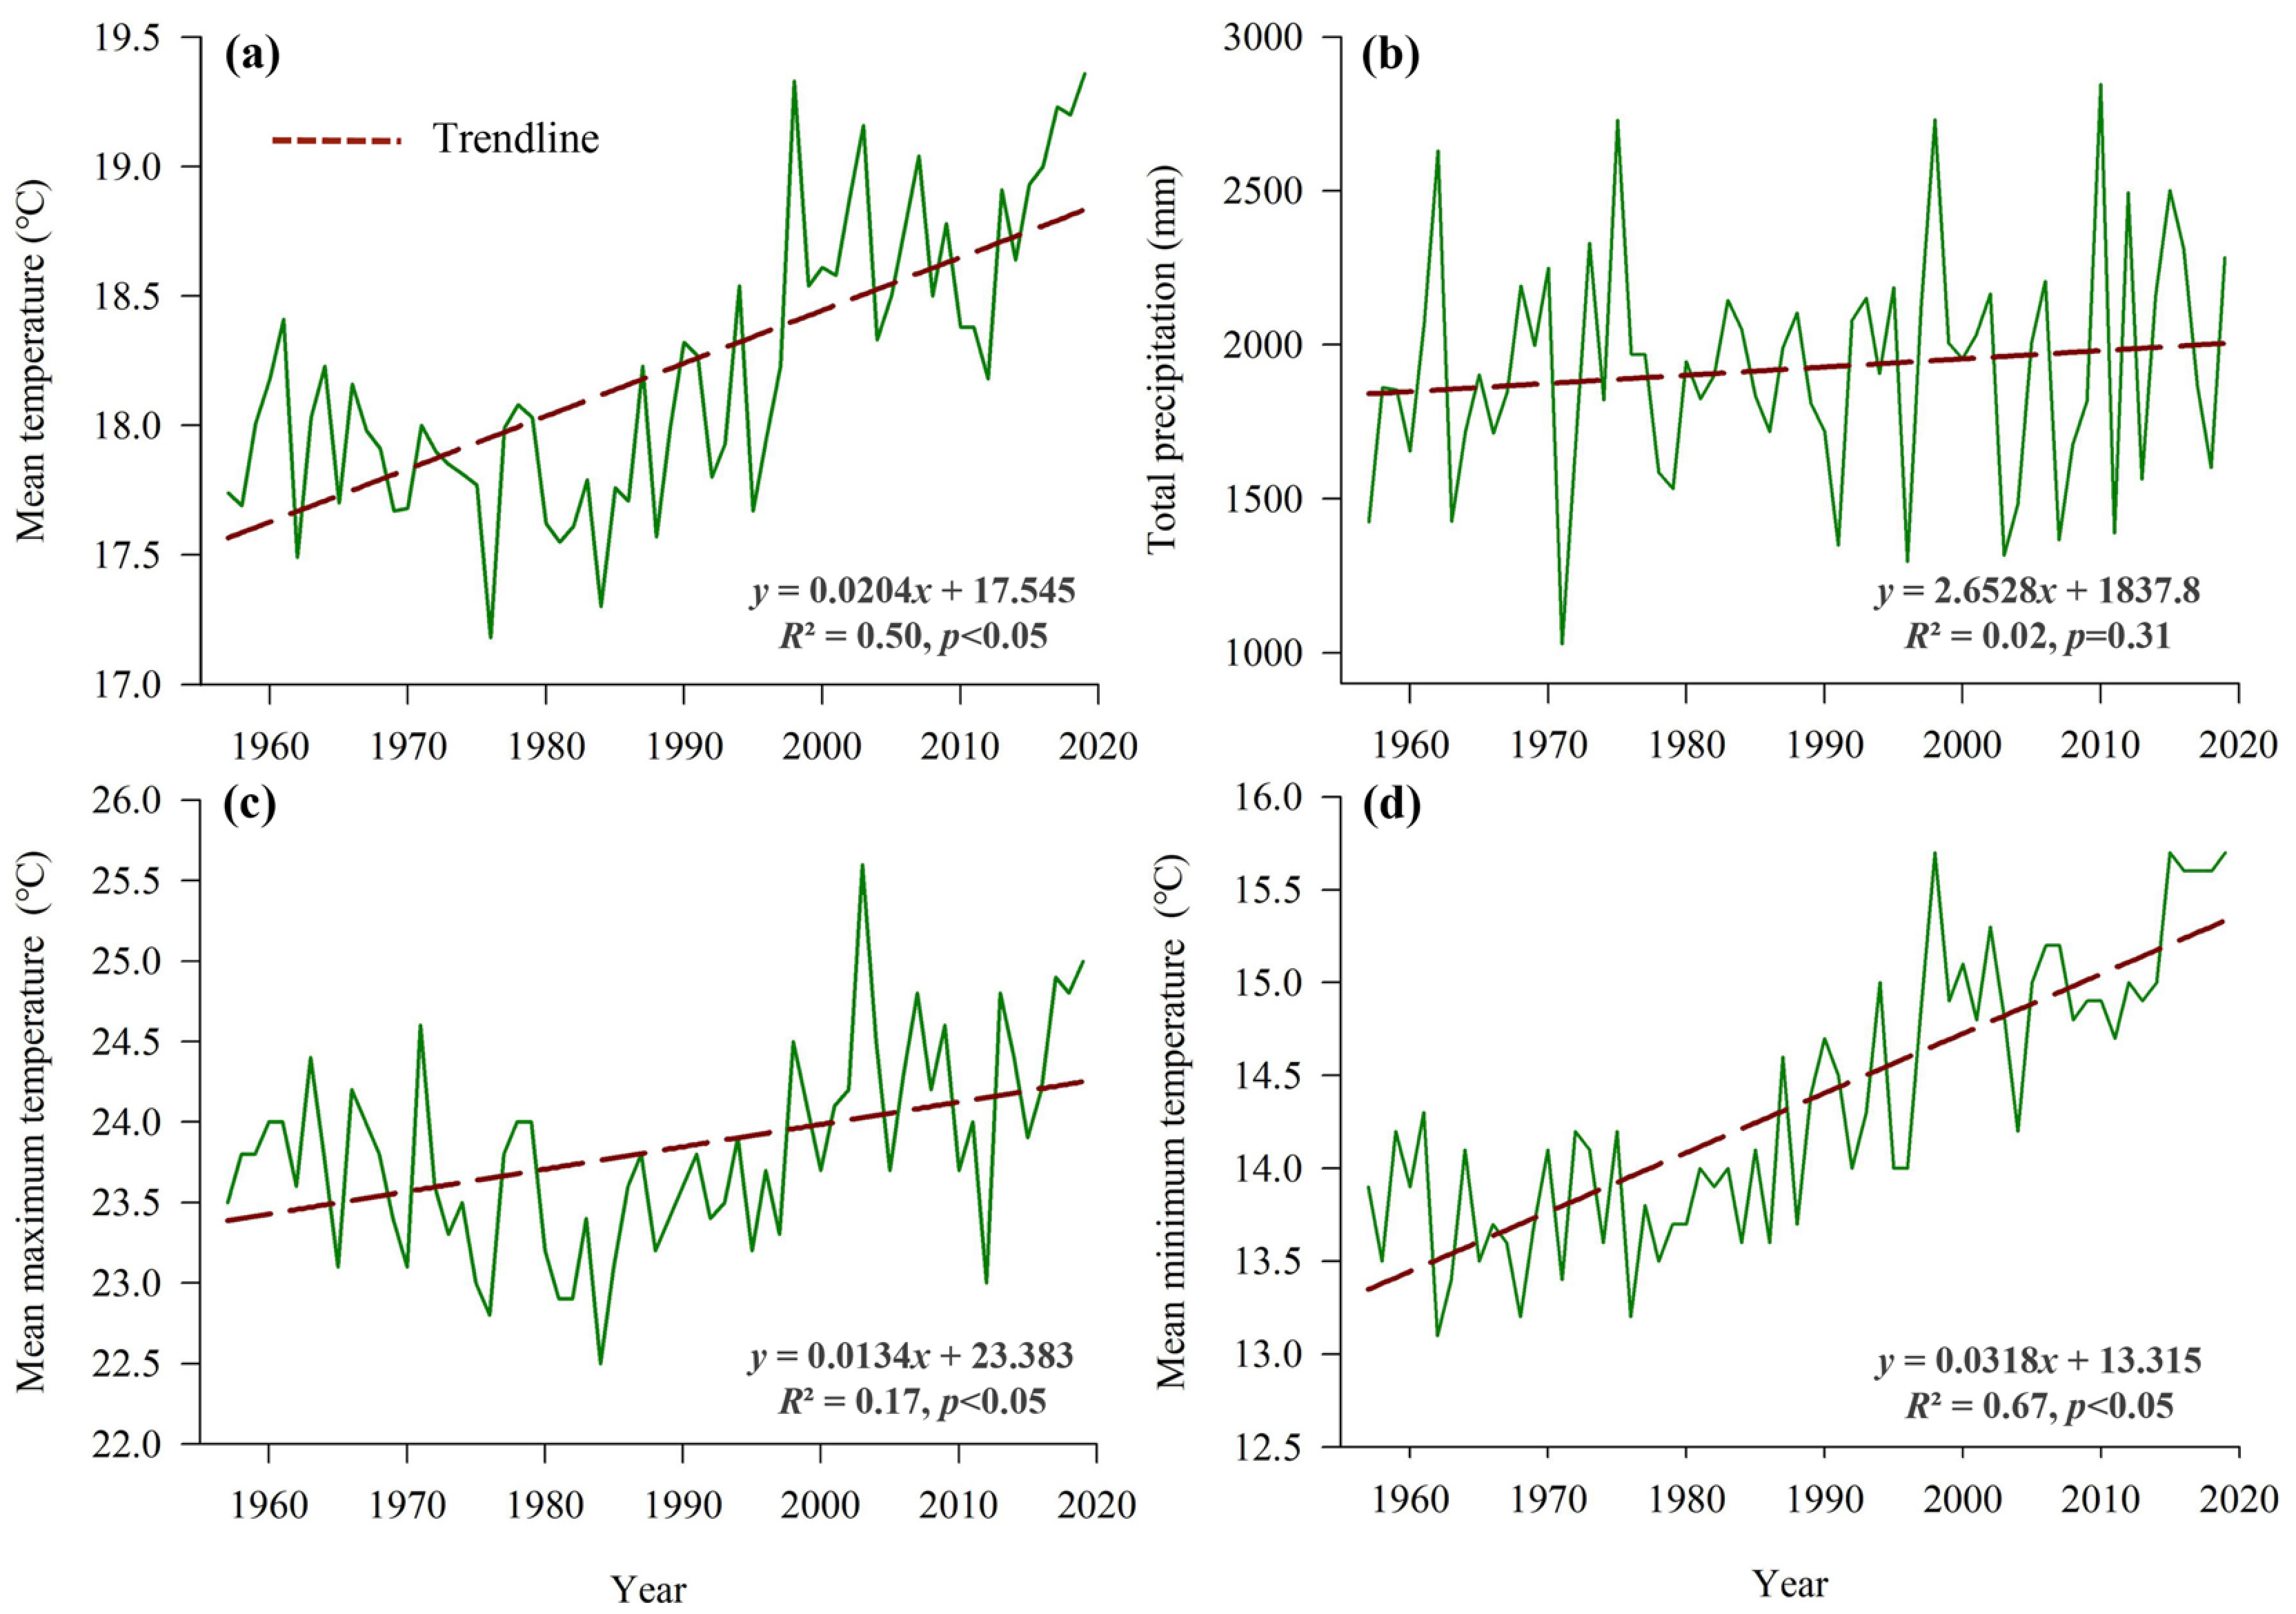
All climatic variables exhibited gradual increasing trends over the study period (Figure 4). Notably, the increase in minimum temperature was more pronounced, with statistically significant rises observed in mean, maximum, and minimum temperatures (p ≤ 0.05). In contrast, although precipitation exhibited a slight increasing trend, it was not statistically significant (p > 0.05). These findings suggest that regional climate warming has not been accompanied by a significant drying trend. Furthermore, the rates of increase in mean and minimum temperatures were greater than that of maximum temperature.

3.2. Statistics of Chronology Characteristics

The mean sensitivity (MS) of P. taiwanensis is 0.1722, while C. fortunei exhibits a slightly higher MS of 0.1810, indicating that both species show moderate to high sensitivity to climate variability, with C. fortunei exhibiting numerically higher interannual fluctuations. The signal-to-noise ratio (SNR) is higher for P. taiwanensis (15.415) than for C. fortunei (10.871), indicating a stronger climatic signal in P. Taiwanensis’ chronology. The expressed population signal (EPS) values for both species, 0.939 for P. taiwanensis and 0.916 for C. fortunei, exceed the commonly accepted threshold of 0.85, confirming that both chronologies are representative of regional climate conditions. The two species differ significantly in the temporal extent of their chronologies. P. taiwanensis spans the period from 1912 to 2023 (112 years), while C. fortunei provides a longer record from 1857 to 2023 (167 years), offering greater potential for long-term climate reconstruction. Autocorrelation analysis reveals key differences in growth dynamics: C. fortunei exhibits a higher first-order autocorrelation (0.7118), compared to P. taiwanensis (0.5921), indicating that its radial growth is more strongly influenced by climatic conditions from the previous year. This pronounced biological memory effect may reduce its sensitivity to current-year climate variability. In contrast, the lower autocorrelation in P. taiwanensis indicates a more immediate response to current climatic factors. Together, these complementary characteristics make both species valuable for dendroclimatic research: P. taiwanensis for capturing high-resolution, short-term annual climate signals, and C. fortunei for providing insights into long-term climate patterns (Table 2).

3.3. Relationship Between Tree Growth and Monthly Climatic Factors

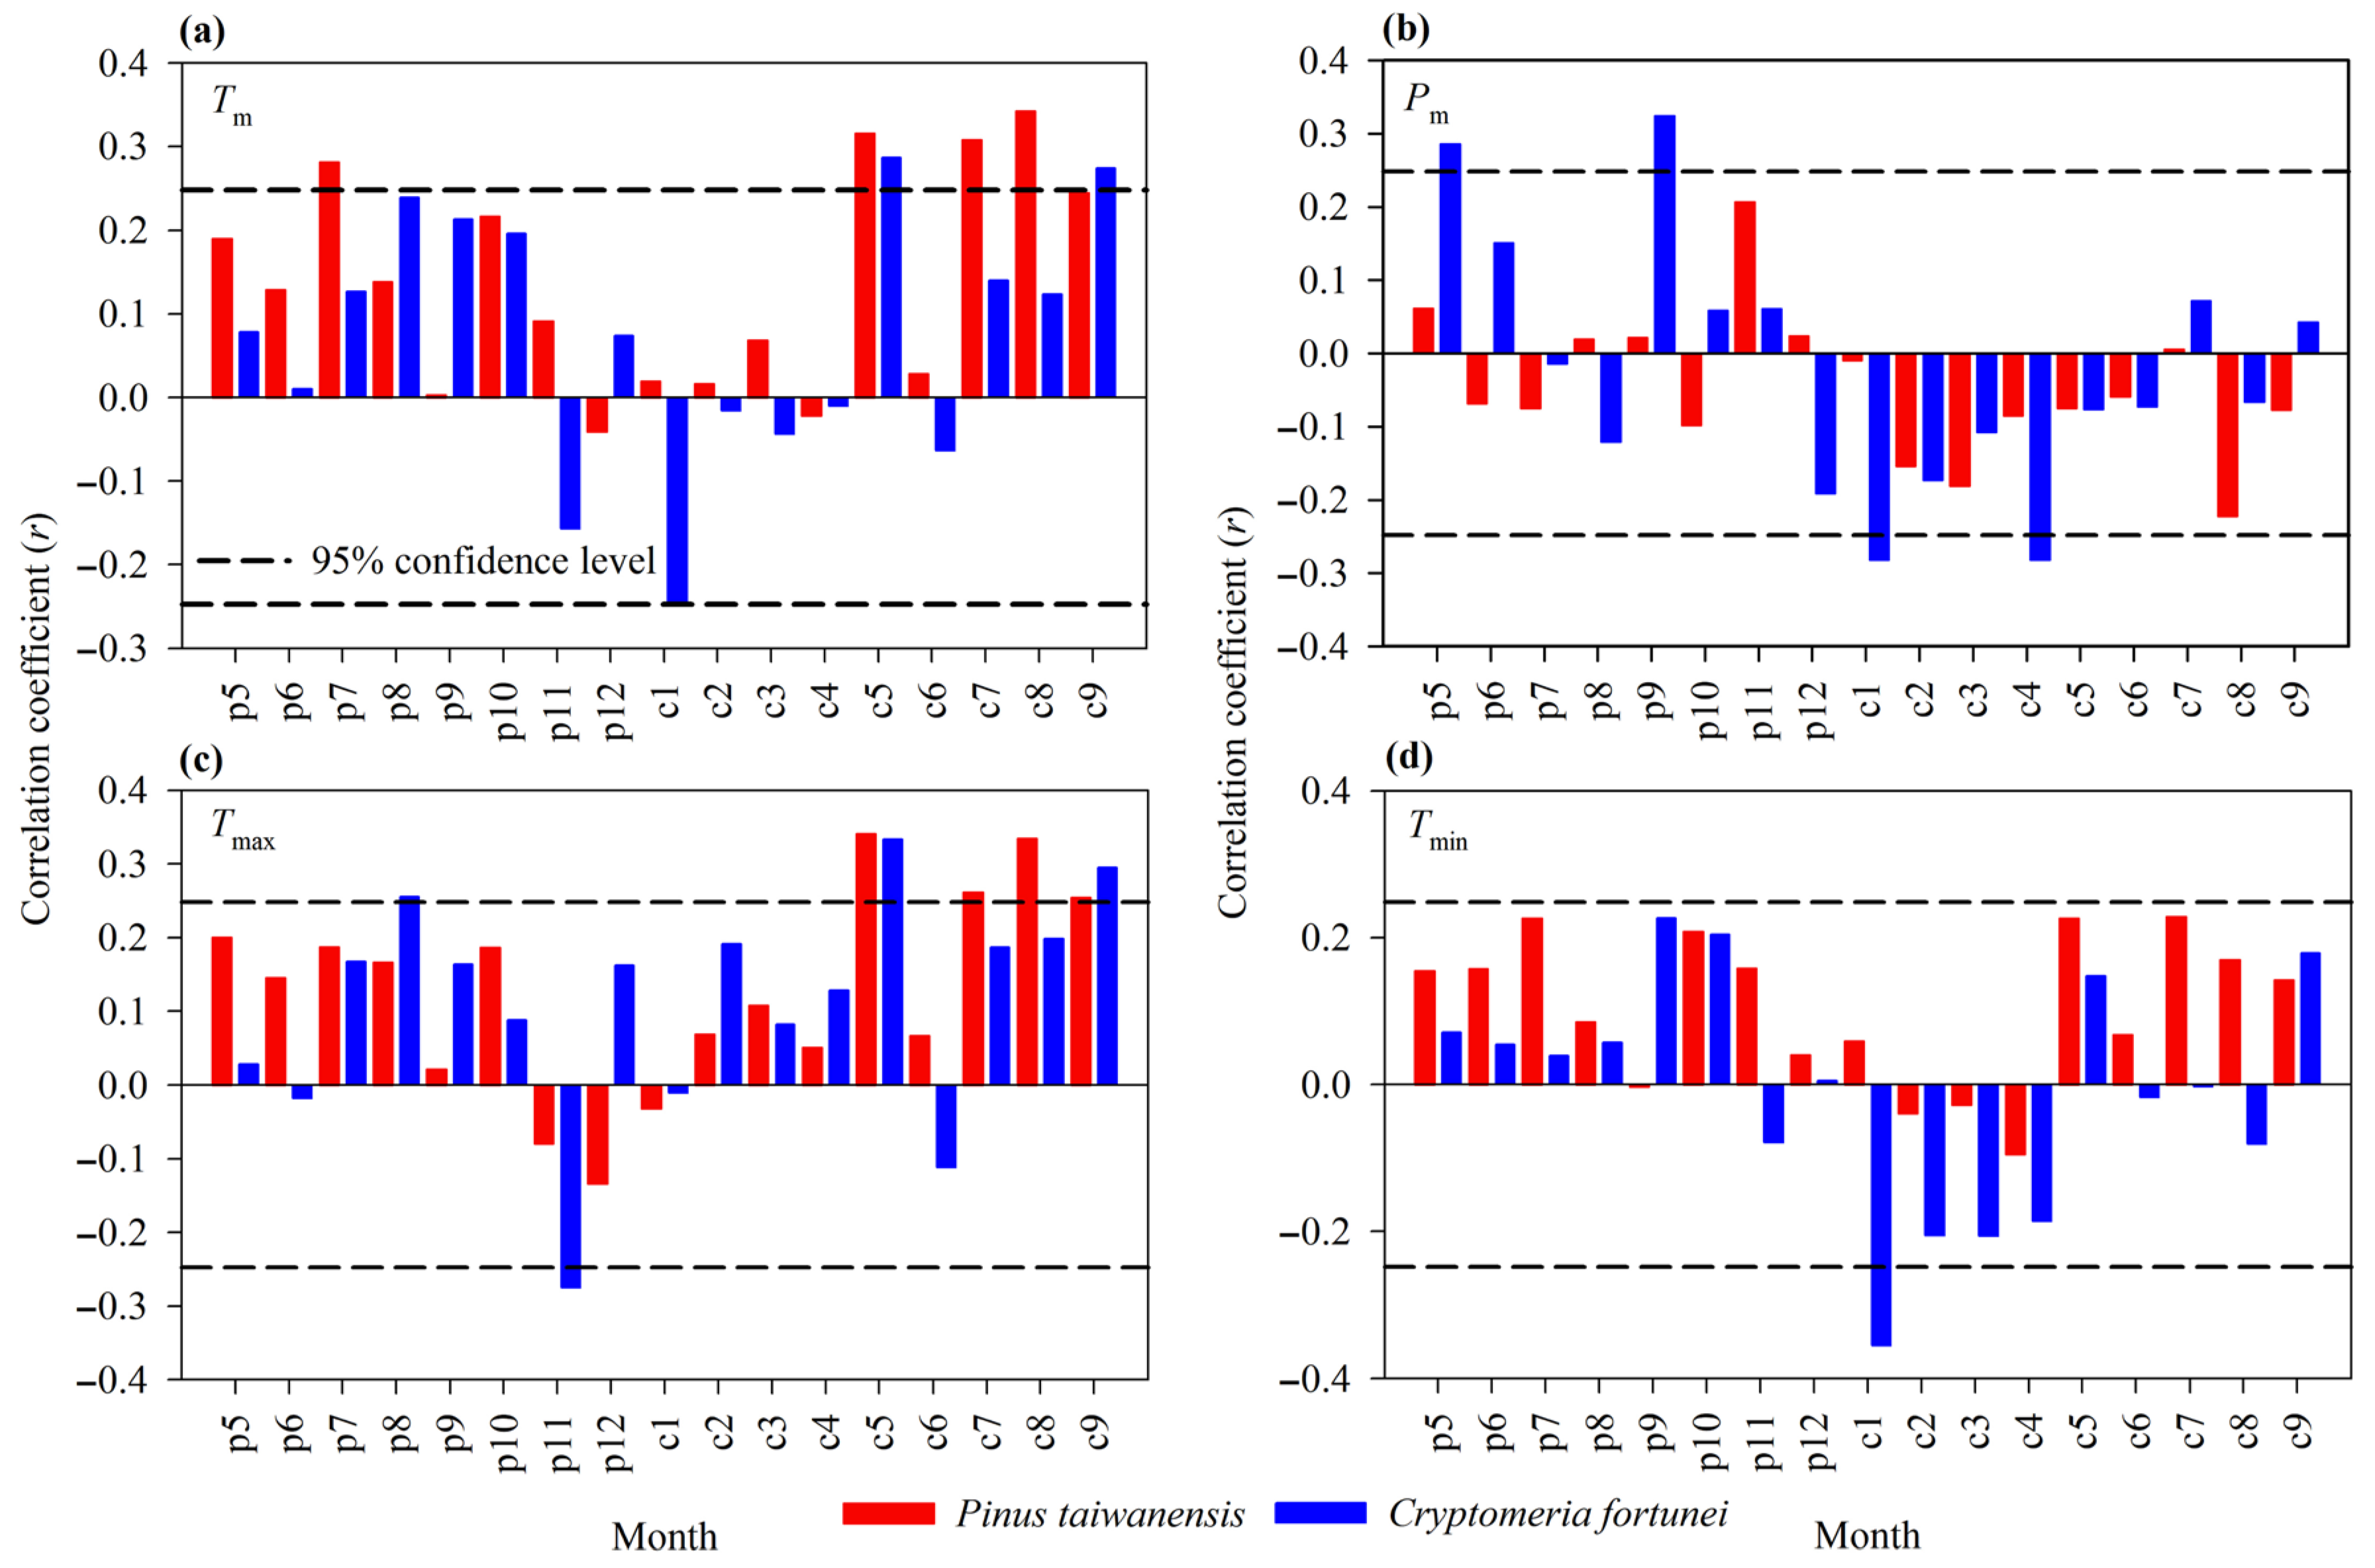
Correlation coefficients between the standard chronologies of both species and climate variables for the period 1957–2019 are shown in Figure 5. The growth of P. taiwanensis exhibited significant positive correlations with mean temperatures in the previous July and in the current May, July, August, and September. Similarly, strong positive correlations were observed with maximum temperatures during the same current-year months (p ≤ 0.05). However, its radial growth showed no significant correlation with either precipitation or minimum temperature (p > 0.05). In contrast, C. fortunei exhibited a significant negative correlation with mean temperature in the current January and a positive correlation in the current May and September (p ≤ 0.05). Its radial growth was positively associated with precipitation in the previous May and September, but negatively correlated in the current January and April (p ≤ 0.05). In terms of temperature extremes, C. fortunei responded positively to maximum temperatures in the previous August and the current May and September, while showing a significant negative correlation with maximum temperature in the previous November and minimum temperature in the current January (p ≤ 0.05). These results indicate that P. taiwanensis primarily responds to thermal conditions during the current growing season, particularly mean and maximum temperatures. In contrast, the growth of C. fortunei is shaped by a broader set of hydrothermal conditions extending across both the current and previous years.

3.4. Relationship Between Tree Growth and Seasonal Climatic Factors

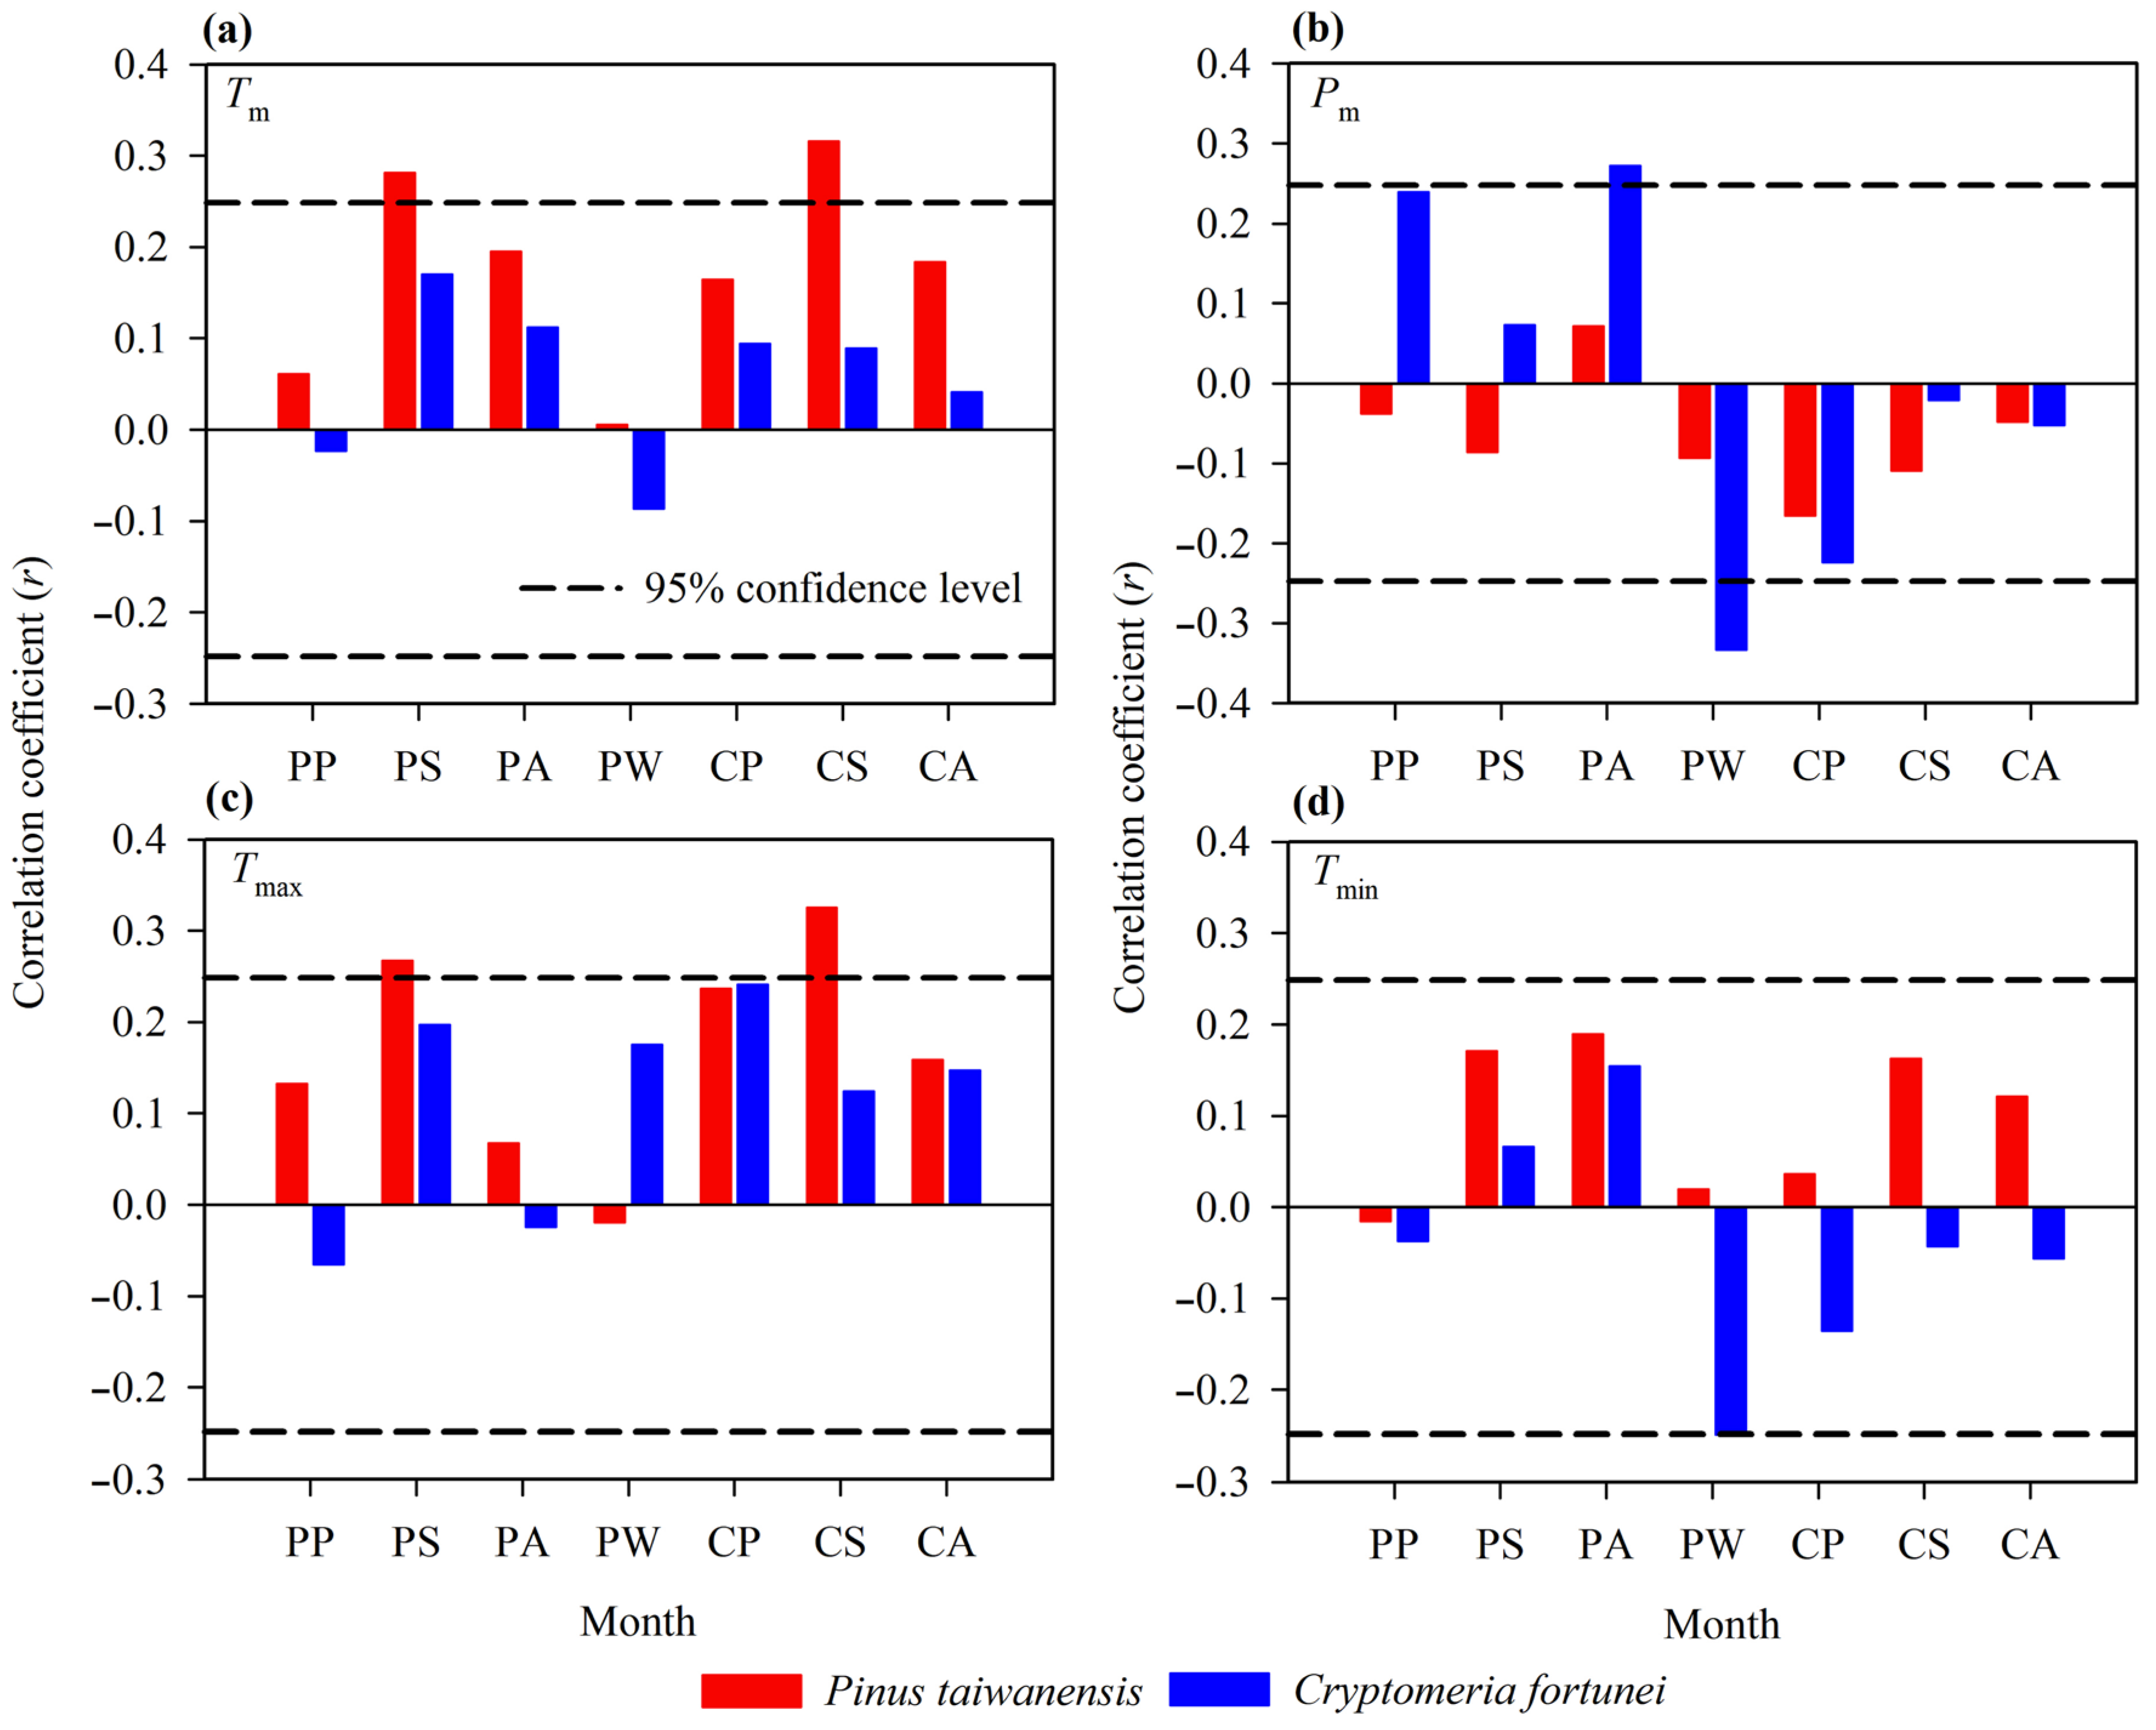
Seasonal climatic variables often provide a more integrated representation of environmental conditions than individual monthly variables. Figure 6 presents the correlations between the tree-ring width chronologies of P. taiwanensis and C. fortunei and seasonal climatic factors. P. taiwanensis exhibited significant positive correlations with both mean and maximum temperatures during the previous and current summers (p ≤ 0.05), while no significant correlations were found with precipitation or minimum temperatures (p > 0.05). These results align with the patterns observed in the monthly analysis, reinforcing the species’ sensitivity to warm-season temperatures. In contrast, C. fortunei showed no significant correlations with temperature variables (mean, maximum, and minimum) across any season, suggesting that temperature is not the primary factor influencing its radial growth (p > 0.05). Instead, its growth was positively correlated with precipitation during the previous autumn and negatively correlated with precipitation during the previous winter, further confirming precipitation as the key limiting factor for radial growth (p ≤ 0.05). These species-specific responses highlight distinct adaptive strategies among conifers in subtropical regions.

3.5. Temporal Stability Analysis of Tree Growth-Climate Relationships

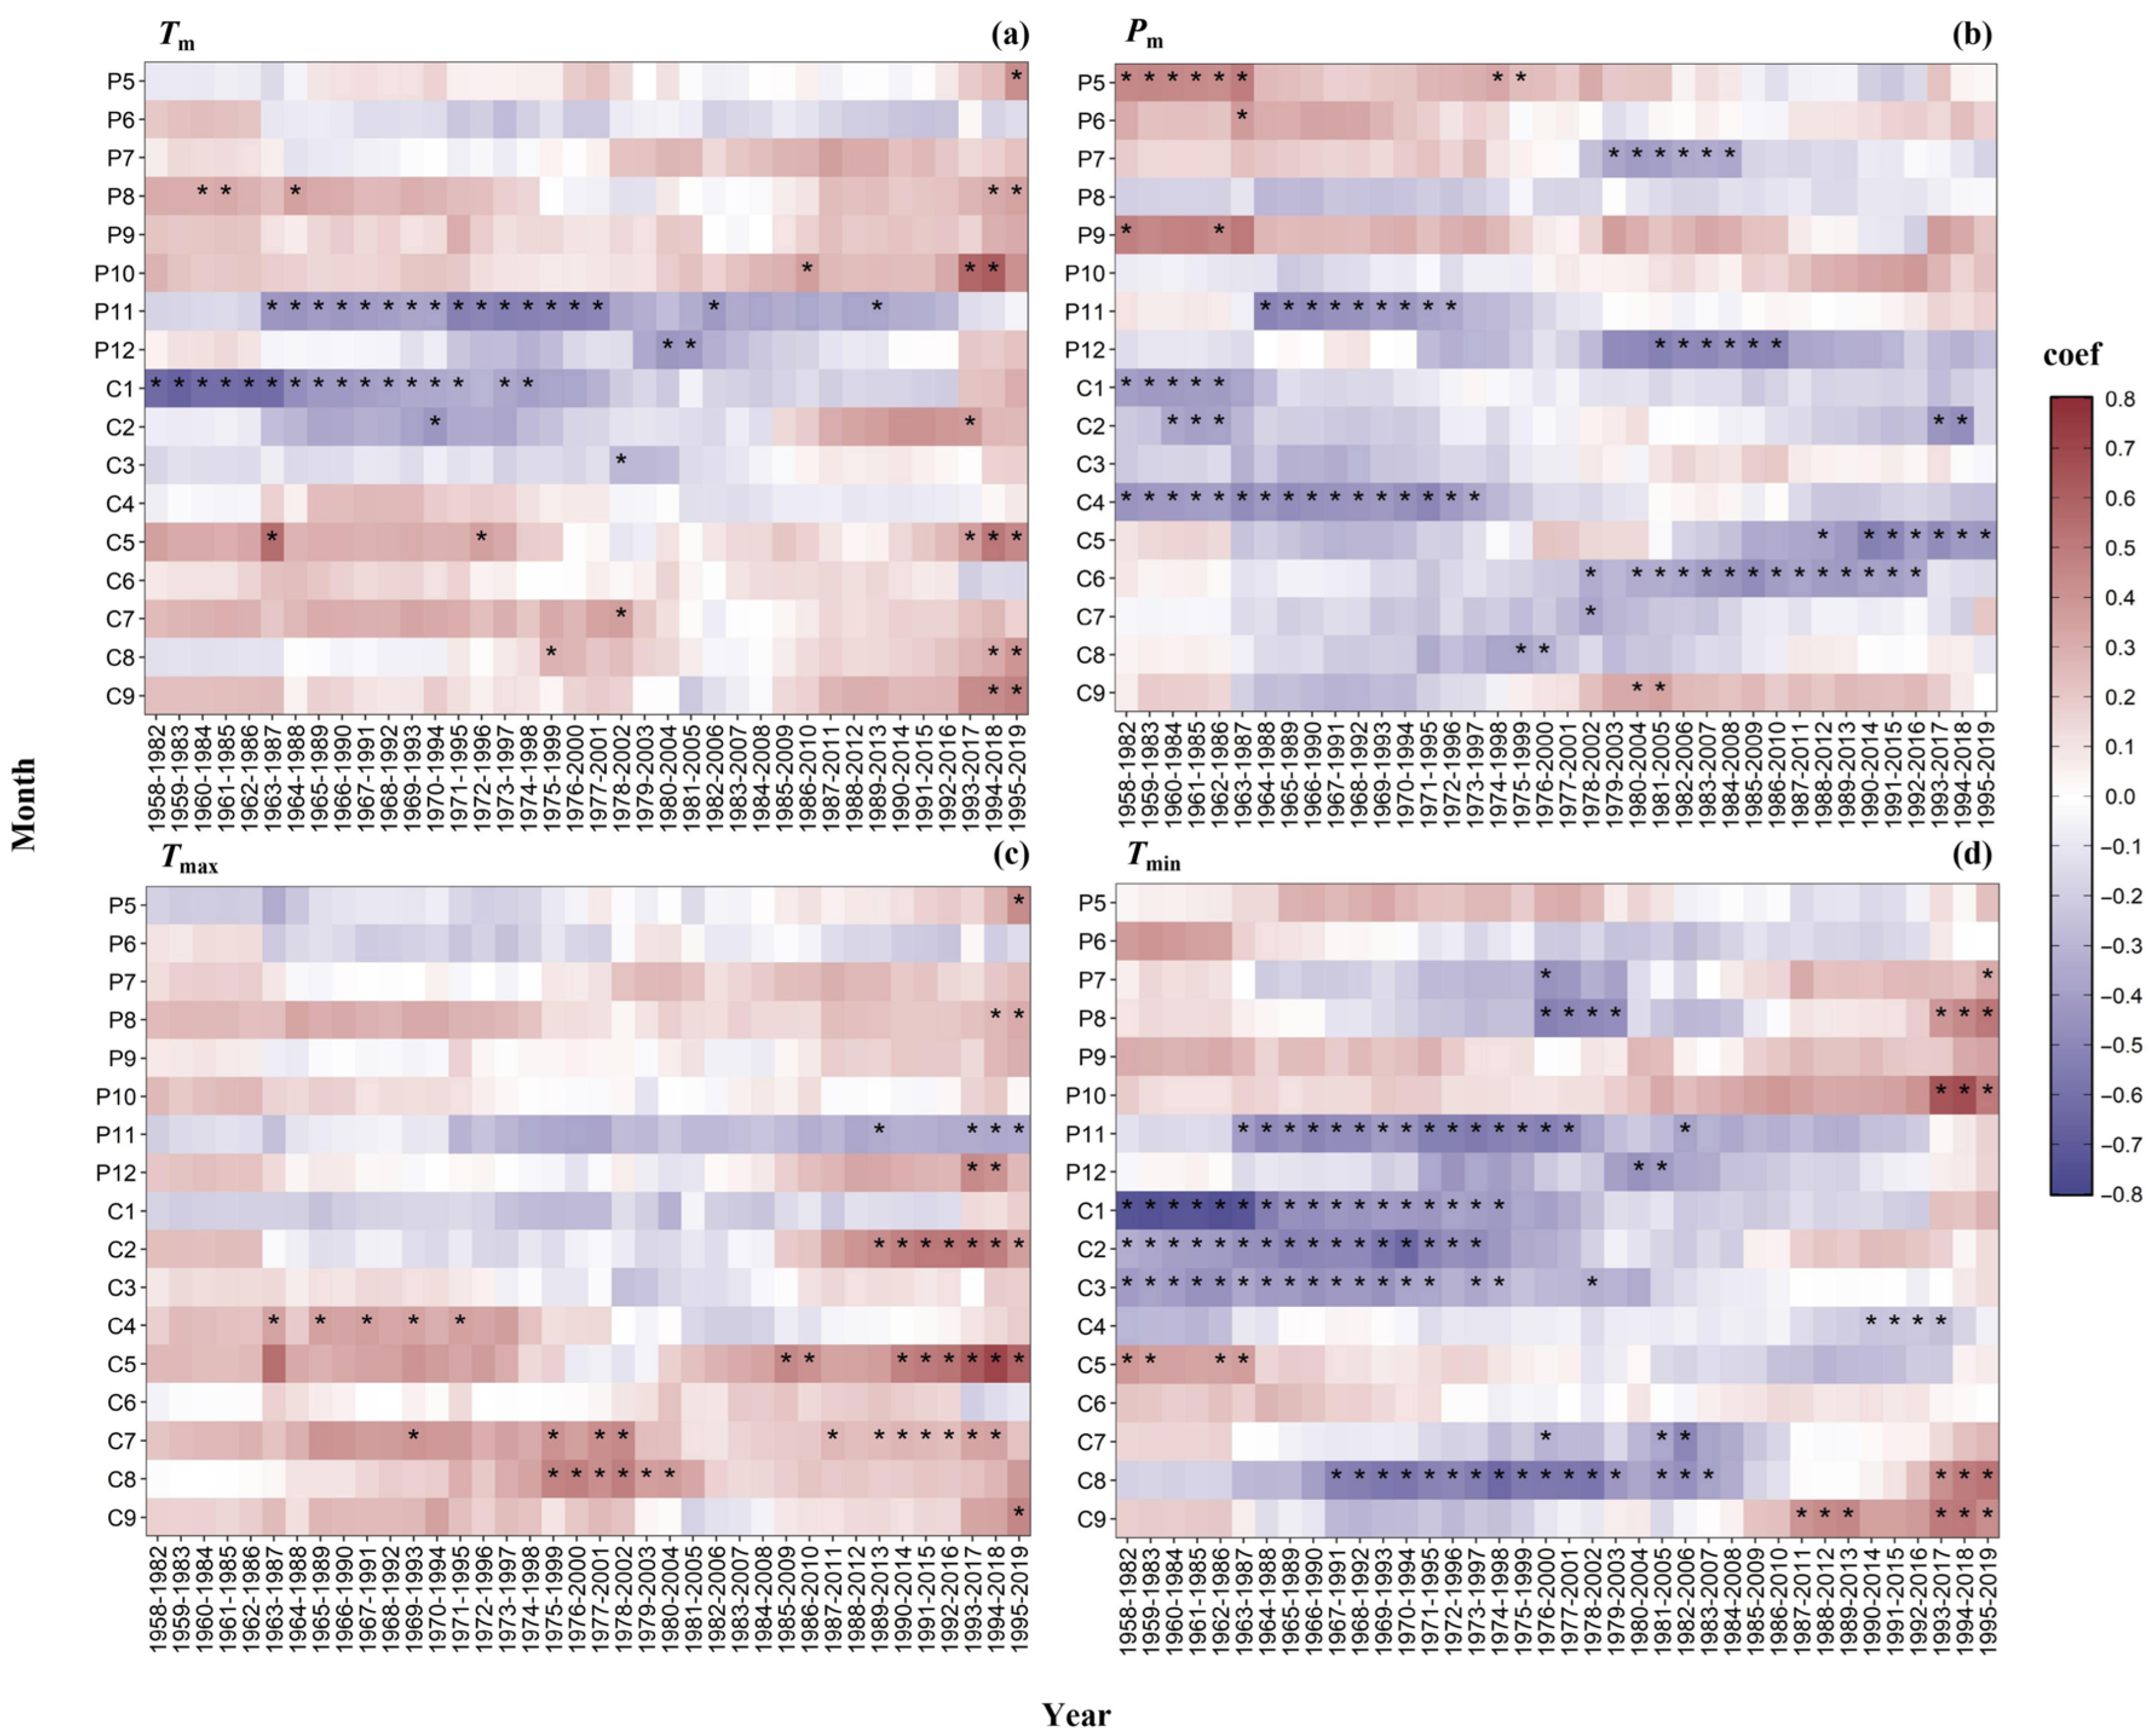
The long-term dynamic relationships between the radial growth of the two species and climatic variables were examined using a sliding window analysis (Figure 7 and Figure 8). For P. taiwanensis, radial growth exhibited stronger correlations with temperature than with precipitation, exhibiting distinct temporal patterns. Significant positive correlations were found with mean temperatures from May to July of the previous year and May, July, and August of the current year, as well as with maximum temperatures from May to July of the previous year and March to August of the current year. Notably, the correlation with current-year July–September temperatures remained stable, while a negative correlation with January maximum temperatures was observed only during the period 1967–1999. Positive correlations with June–July mean and maximum temperatures became significant only in recent decades, suggesting that warming increasingly promotes growth. In contrast, the influence of precipitation was weaker and more sporadic, with significant correlations limited to specific months, such as June–July of the previous year and February–March, April, June, and August of the current year).
Compared with the long-term sliding trends observed in P. taiwanensis, C. fortunei exhibited weaker correlations with mean and maximum temperatures, with fewer months exhibiting statistically significant levels. However, its growth displayed notably stronger relationships with precipitation and minimum temperatures. Specifically, significant negative correlations were found with mean temperatures in November of the previous year (1963–2001) and January of the current year (1958–1998). Positive correlations with maximum temperatures in February, April, May, July, and August of the current year occurred sporadically and inconsistently across different periods. Significant negative correlations with precipitation were observed in July, November, and December of the previous year, as well as in January, February, April, May, and June of the current year. Among these, the correlation with April precipitation was relatively stable, remaining significantly negative from 1958 to 1997. Additionally, minimum temperatures in November of the previous year and in January, February, March, and August of the current year showed significant negative correlations, many of which persisted over extended periods, initially displaying negative correlations before shifting to positive correlations in more recent years. In summary, P. taiwanensis growth shows consistent and significant responses to spring–summer temperatures, while C. fortunei exhibits more variable but generally stronger sensitivity to precipitation and minimum temperatures.

4. Discussion

4.1. Climate–Growth Relationships Across Tree Species

The tree-ring width chronologies of P. taiwanensis and C. fortunei demonstrate strong climatic sensitivity, as reflected in their high mean sensitivity and signal-to-noise ratios. These characteristics affirm their suitability for high-resolution dendroclimatological research, consistent with findings from similar studies of subtropical conifers in the Sanqingshan Mountains [22], Tianmushan Mountains [23], and Fujian Province [24]. This cross-regional consistency not only supports the scientific validity and regional representativeness of the sampling sites, but also highlights the importance of subtropical conifers in dendroclimatology [9]. Due to their pronounced climatic sensitivity, the tree-ring records of P. taiwanensis and C. fortunei offer reliable proxies for reconstructing historical climate variability in the region. These findings contribute critical data for understanding long-term climate patterns in subtropical montane ecosystems and offer valuable insights for both paleoclimatic reconstruction and ecological modeling.
Analysis of growth dynamics reveals that the radial growth rates of P. taiwanensis and C. fortunei in the study area exhibited pronounced fluctuations in recent decades, likely influenced by changing regional climatic conditions. Although the two species coexist at similar elevations and share comparable microenvironments, they exhibit interspecific differences in their growth responses to climatic variables. Such species-specific response patterns are common in subtropical high-altitude ecosystems [13]. Similar variations in growth responses among tree species have been documented in Northeast Asia [25], northwest China [26], and other mountainous regions [27]. Studies in mixed Central European Mountain forests have also revealed contrasting climate–growth relationships among Picea abies, Fagus sylvatica, and Abies alba [28]. These cross-regional findings highlight an important ecological pattern: even under identical environmental conditions, tree species can respond very differently to climate change, a globally consistent phenomenon [29]. This insight is of substantial theoretical significance for understanding species-specific adaptation strategies and predicting forest dynamics under future climate change scenarios.
The radial growth of P. taiwanensis is predominantly regulated by a strong positive correlation with summer temperatures in both the previous and current years’ growing seasons, while exhibiting limited sensitivity to precipitation, an established pattern across multiple subtropical regions [23]. For example, Cai and Liu [22] found that in the Sanqingshan Mountains, P. taiwanensis ring-widths were significantly positively correlated with temperatures during the previous growing season. Similarly, Cai et al. [30] reported that in the Dabie Mountains, its radial growth was significantly positively correlated with mean temperatures from April to June [30]. Similarly, these findings also reflect the regional warming trend in eastern China. In contrast, C. fortunei displays a distinct moisture-sensitive growth pattern. Its radial growth is positively correlated with autumn precipitation in the previous year but negatively correlated with preceding winter precipitation. Supporting this, Chen et al. [31] demonstrated that in southeastern China, C. fortunei radial growth was closely correlated with the self-calibrating Palmer Drought Severity Index from July to February, a finding that is fully consistent with the present study. These cross-regional consistencies suggest that C. fortunei reliance on moisture is a widespread trait throughout its range. The observed interspecific differences in climate sensitivity primarily stem from contrasting morphological and physiological adaptations [32]. As a deep-rooted species, P. taiwanensis can access subsurface water through bedrock fissures, making it less dependent on surface soil moisture. Its thick cuticles and low stomatal density reduce transpiration, rendering photosynthesis more responsive to temperature. Conversely, C. fortunei has a shallow root system and depends on high hydraulic conductance for rapid growth, making it more susceptible to fluctuations in seasonal water availability. These findings reveal the mechanisms underlying the different climate responses of subtropical conifers, providing critical insights for predicting montane forest dynamics and informing adaptive forest management under climate conditions [8].

4.2. Stability of Radial Climate–Growth Relationships Across Tree Species

Since the mid-20th century, subtropical and low-latitude montane ecosystems have experienced significant warming, marked by pronounced seasonal variations in temperature increases [1]. This warming has substantially affected regional forest productivity and carbon sequestration by altering key physiological processes in trees, particularly growth rates [32]. As climate-sensitive ecosystems, high-elevation coniferous forests exhibit complex and temporally unstable growth responses to changing climate conditions [5]. Unlike the widespread “warming-enhanced growth” observed in mid- and high-latitude forests of the Northern Hemisphere, high-elevation subtropical tree species face conflicting influences from extended growing seasons and increased drought stress [33]. Specifically, prolonged growing seasons may enhance carbon assimilation through increased heat accumulation, while water deficits can constrain growth by triggering stomatal closure and reducing photosynthetic activity. These trade-offs between temperature and moisture complicate the assessment of climate change impacts on subtropical forest ecosystems [34]. Furthermore, climate-driven shifts in species distribution may lead to ecological niche restructuring, creating opportunities for expansion in some regions while exacerbating survival challenges in others [34,35].
A 30-year moving window analysis revealed significant temporal shifts in the climate sensitivity of P. taiwanensis. In earlier decades, tree-ring widths showed weak or even negative correlations with June–July temperatures from both the previous and current years. Over time, however, these correlations became significantly positive, a trend consistent with findings by Wang et al. [23] in southeastern China. Under climate warming, rising June–July temperatures likely enhanced growth by extending the period of physiological activity, increasing photosynthetic enzyme activity, and promoting carbon assimilation [12]. Conversely, the species’ response to precipitation exhibited an opposite pattern, shifting from positive to negative correlations with June–July rainfall. Although the region experienced significant warming, precipitation has also shown a slight increasing trend (Figure 4). Higher temperatures increase atmospheric moisture capacity, leading to intensified convective activity and more frequent cloud formation, thereby increasing precipitation. However, increased precipitation did not necessarily benefit growth; instead, it may have hindered it by reducing soil aeration, increasing disease risks, and diminishing levels of photosynthetically active radiation [20]. In contrast, C. fortunei displayed distinct seasonal patterns in its climate response. Its radial growth transitioned from a negative to a positive correlation with early spring (January–April) precipitation. As spring initiates cambial activity, earlier snowmelt and an extended growing season, facilitated by warming, create favorable moisture conditions that support radial growth [20]. Rising minimum temperatures in January–March also alleviated cold stress, prolonged physiological function, and enabled earlier root nutrient uptake. Concurrently, higher nighttime temperatures maintained respiratory efficiency, helping to meet the energy demands of photosynthesis. As a result, under ongoing climate warming, the previously limiting effects of winter–spring minimum temperatures shifted toward facilitation, transforming C. Fortunei’s growth response from negative to positive correlations with early-season temperature [10].
In summary, in humid subtropical montane ecosystems experiencing sustained warming and increased precipitation, tree species exhibit divergent growth responses [8]. C. fortunei appears better positioned to thrive under these conditions, due to its higher water-use efficiency and greater thermal adaptability. In contrast, P. taiwanensis, whose growth is primarily driven by summer temperatures, may initially benefit from moderate warming within its current elevational range. However, as temperatures continue to rise, populations at lower elevations may approach their thermal tolerance limits, potentially triggering upward migration to maintain optimal growth conditions [36]. Subtropical montane forests often exhibit nonlinear responses to climate change, with their long-term stability depending on the synergistic effects of temperature, precipitation, and atmospheric CO2 levels. Compared to high-latitude forests, low-latitude species may reach the limits of their climatic niches earlier, with declines in growth and increasing mortality serving as early warning indicators of ecosystem transition [37]. To improve the accuracy of forest dynamic predictions, it is essential to establish long-term monitoring networks along elevational gradients. These should integrate dendroecological and physiological metrics from multiple species to better guide adaptive forest management under changing climate conditions.

5. Conclusions

P. taiwanensis and C. fortunei, as keystone species in subtropical montane forests, exhibit fundamentally distinct climate–growth relationships. The radial growth of P. taiwanensis is strongly dependent on temperature, characterized by a pronounced “warming fertilization effect”. In contrast, C. fortunei demonstrates pronounced sensitivity to moisture, with growth closely linked to seasonal moisture availability. Temporal analyses reveal non-stationary climate responses and clear interspecific divergence, shaped by differences in root morphology (deep vs. shallow rooting systems), water-use efficiency, and stomatal regulation strategies. Under continued climate warming, these functional differences may drive ecological shifts: the greater phenotypic plasticity of C. fortunei could provide a competitive advantage, whereas P. taiwanensis may initially benefit from warming but eventually face range contraction as temperatures exceed its thermal tolerance. These ecophysiological insights advance understanding of altitudinal migration and community dynamics in subtropical montane forests under climate change, providing a scientific basis for targeted conservation and adaptive management strategies.

Author Contributions

X.Z. (Xiao Zheng) and J.Y. conceived the idea; J.Y. and X.Z. (Xiao Zheng) sampled the tree cores; J.Y. and X.G. measured the tree-ring width; J.Y., Y.H. and X.Z. (Xu Zhou) conducted the analysis; X.Z. (Xiao Zheng), J.Y. and H.D. wrote the manuscript. All authors have read and agreed to the published version of the manuscript.

Funding

This study was funded by the Open Foundation of Scientific Observation and Research Station for Ecological Environment of Wuyi Mountains, Ministry of Ecology and Environment, China, and the Zhenjiang Innovation Capacity Building Project (SS2024010).

Data Availability Statement

The original contributions presented in this study are included in the article. Further inquiries can be directed to the corresponding authors.

Acknowledgments

The authors thank the reviewers for their diligence in providing useful comments that improved this work.

Conflicts of Interest

The authors declare no conflicts of interest.

References

  1. IPCC. Climate Change 2022-Impacts, Adaptation and Vulnerability: WorkingGroup II Contribution to the Sixth Assessment Report of the Intergovernmental Panel on Climate Change; Cambridge University Press: Cambridge, UK, 2023. [Google Scholar]
  2. Bonan, G.B. Forests and climate change: Forcings, feedbacks, and the climate benefits of forests. Science 2008, 320, 1444–1449. [Google Scholar] [CrossRef]
  3. Trumbore, S.; Brando, P.; Hartmann, H. Forest health and global change. Science 2015, 349, 814. [Google Scholar] [CrossRef]
  4. Borgaonkar, H.P.; Sikder, A.B.; Ram, S. High altitude forest sensitivity to the recent warming: A tree-ring analysis of conifers from Western Himalaya, India. Quat. Int. 2011, 236, 158–166. [Google Scholar] [CrossRef]
  5. Anderegg, W.R.L.; Trugman, A.T.; Badgley, G.; Konings, A.G.; Shaw, J. Divergent forest sensitivity to repeated extreme droughts. Nat. Clim. Chang. 2020, 10, 1091–1095. [Google Scholar] [CrossRef]
  6. Gao, L.; Gou, X.; Deng, Y.; Yang, M.; Zhang, F. Assessing the influences of tree species, elevation and climate on tree-ring growth in the Qilian Mountains of northwest China. Trees 2017, 31, 393–404. [Google Scholar] [CrossRef]
  7. Lloyd, A.H.; Bunn, A.G.; Berner, L. A latitudinal gradient in tree growth response to climate warming in the Siberian taiga. Glob. Chang. Biol. 2011, 17, 1935–1945. [Google Scholar] [CrossRef]
  8. Fei, S.; Desprez, J.M.; Potter, K.M.; Jo, I.; Knott, J.A.; Oswalt, C.M. Divergence of species responses to climate change. Sci. Adv. 2017, 3, e1603055. [Google Scholar] [CrossRef]
  9. Cai, Q.; Ma, S.; Sun, L.; Chen, G.; Xiao, J.; Fang, W.; Ji, C.; Tang, Z.; Fang, J. Elevational Patterns of Tree Species Richness and Forest Biomass on Two Subtropical Mountains in China. Forests 2023, 14, 1337. [Google Scholar] [CrossRef]
  10. Yu, J.; Liu, Q.J.; Meng, S.W.; Zhou, G.; Shah, S.; Xu, Z.Z. Summer temperature variability inferred from tree-ring records in the central Hengduan Mountains, southeastern Tibetan Plateau. Dendrochronologia 2018, 51, 92–100. [Google Scholar] [CrossRef]
  11. Yu, J.; Zhou, G.; Liu, Q.J. Tree-ring based summer temperature regime reconstruction in XiaoXing Anling Mountains, northeastern China since 1772 CE. Palaeogeogr. Palaeoclimatol. Palaeoecol. 2018, 495, 13–23. [Google Scholar] [CrossRef]
  12. Chen, F.; Yuan, Y.J.; Wei, W.S.; Yu, S.L.; Zhang, T.W. Reconstructed temperature for Yong’an, Fujian, Southeast China: Linkages to the Pacific Ocean climate variability. Glob. Planet. Chang. 2012, 86–87, 11–19. [Google Scholar] [CrossRef]
  13. Su, J.; Gou, X.; Hille Ris Lambers, J.; Zhang, D.D.; Zheng, W.; Xie, M.; Manzanedo, R.D. Increasing ENSO variability synchronizes tree growth in subtropical forests. Agric. For. Meteorol. 2024, 345, 109830. [Google Scholar] [CrossRef]
  14. Wang, X.P.; Wang, Z.H.; Fang, J.Y. Mountain ranges and peaks in China. Biodivers. Sci. 2004, 12, 206–212. [Google Scholar] [CrossRef]
  15. Chen, S.F.; Xu, H.; Lin, W.J.; Zheng, X.; Xu, X.J.; Liu, W.F.; Ding, H.; Chen, S.P. Variation analysis on species diversity of plant communities along the elevation gradient in Wuyishan National Park. J. Plant Resour. Environ. 2023, 32, 1–9. [Google Scholar]
  16. Chen, F.; Yuan, Y.J.; Wei, W.S.; Yu, S.L.; Zhang, T.W. Tree ring-based winter temperature reconstruction for Changting, Fujian, subtropical region of Southeast China, since 1850: Linkages to the Pacific Ocean. Theor. Appl. Climatol. 2011, 109, 141–151. [Google Scholar] [CrossRef]
  17. Stokes, M.A.; Smiley, T.L. An Introduction to Tree-Ring Dating; University of Arizona Press: Tucson, AZ, USA, 1968. [Google Scholar]
  18. Holmes, R. Computer-assisted quality control in tree-ring dating and measurement. Tree-Ring Bull. 1983, 43, 69–78. [Google Scholar]
  19. Cook, E.R.; Kairiukstis, L.A. Methods of Dendrochronology; Springer: New York, NY, USA, 1990. [Google Scholar]
  20. Fritts, H.C. Growth-Rings of Trees-Their Correlation Withclimate. Science 1966, 154, 973–979. [Google Scholar] [CrossRef]
  21. Biondi, F.; Waikul, K. DENDROCLIM2002: A C++ program for statistical calibration of climate signals in tree-ring chronologies. Comput. Geosci. 2004, 30, 303–311. [Google Scholar] [CrossRef]
  22. Cai, Q.; Liu, Y. Two centuries temperature variations over subtropical southeast China inferred from Pinus taiwanensis Hayata tree-ring width. Clim. Dyn. 2016, 48, 1813–1825. [Google Scholar] [CrossRef]
  23. Wang, F.; Arseneault, D.; Pan, B.; Liao, Q.; Sugiyama, J. Pre-1930 unstable relationship between climate and tree-ring width of Pinus taiwanensis Hayata in southeastern China. Dendrochronologia 2019, 57, 125629. [Google Scholar] [CrossRef]
  24. Chen, F.; Yuan, Y.J.; Wei, W.S.; Yu, S.L.; Wang, H.Q. Tree-ring response of subtropical tree species in southeast China on regional climate and sea-surface temperature variations. Trees 2015, 29, 17–24. [Google Scholar] [CrossRef]
  25. Cao, J.; Liu, H.; Zhao, B.; Li, Z.; Drew, D.M.; Zhao, X. Species-specific and elevation-differentiated responses of tree growth to rapid warming in a mixed forest lead to a continuous growth enhancement in semi-humid Northeast Asia. For. Ecol. Manag. 2019, 448, 76–84. [Google Scholar] [CrossRef]
  26. Xiao, S.C.; Ding, A.J.; Tian, Q.Y.; Han, C.; Peng, X.M. Site- and species-specific climatic responses of two co-occurring shrubs in the temperate Alxa Desert Plateau, northwest China. Sci. Total Environ. 2019, 667, 77–85. [Google Scholar] [CrossRef]
  27. Dawes, M.A.; Haettenschwiler, S.; Bebi, P.; Hagedorn, F.; Handa, I.T.; Koerner, C.; Rixen, C. Species-specific tree growth responses to 9 years of CO2 enrichment at the alpine treeline. J. Ecol. 2011, 99, 383–394. [Google Scholar] [CrossRef]
  28. Kašpar, J.; Tumajer, J.; Šamonil, P.; Vašíčková, I. Species-specific climate–growth interactions determine tree species dynamics in mixed Central European mountain forests. Environ. Res. Lett. 2021, 16, 034039. [Google Scholar] [CrossRef]
  29. Yuan, D.; Zhu, L.; Cherubini, P.; Li, Z.; Zhang, Y.; Wang, X. Species-specific indication of 13 tree species growth on climate warming in temperate forest community of northeast China. Ecol. Indic. 2021, 133, 108389. [Google Scholar] [CrossRef]
  30. Cai, Q.; Liu, Y.; Duan, B.; Sun, C. Regional difference of the start time of the recent warming in Eastern China: Prompted by a 165-year temperature record deduced from tree rings in the Dabie Mountains. Clim. Dyn. 2018, 50, 2157–2168. [Google Scholar] [CrossRef]
  31. Chen, F.; Yu, S.; Yuan, Y.; Wang, H.; Gagen, M. A tree-ring width based drought reconstruction for southeastern China: Links to Pacific Ocean climate variability. Boreas 2016, 45, 335–346. [Google Scholar] [CrossRef]
  32. Hamrick, J.L. Response of forest trees to global environmental changes. For. Ecol. Manag. 2004, 197, 323–335. [Google Scholar] [CrossRef]
  33. Williams, A.P.; Allen, C.D.; Macalady, A.K.; Griffin, D.; Woodhouse, C.A.; Meko, D.M.; Swetnam, T.W.; Rauscher, S.A.; Seager, R.; Grissino-Mayer, H.D.; et al. Temperature as a potent driver of regional forest drought stress and tree mortality. Nat. Clim. Chang. 2013, 3, 292–297. [Google Scholar] [CrossRef]
  34. Toledo, M.; Poorter, L.; Peña-Claros, M.; Alarcón, A.; Balcázar, J.; Leaño, C.; Licona, J.C.; Llanque, O.; Vroomans, V.; Zuidema, P.; et al. Climate is a stronger driver of tree and forest growth rates than soil and disturbance. J. Ecol. 2011, 99, 254–264. [Google Scholar] [CrossRef]
  35. Trahan, M.W.; Schubert, B.A. Temperature-induced water stress in high-latitude forests in response to natural and anthropogenic warming. Glob. Chang. Biol. 2016, 22, 782–791. [Google Scholar] [CrossRef]
  36. Fonti, P.; Jansen, S. Xylem plasticity in response to climate. New Phytol. 2012, 195, 734–736. [Google Scholar] [CrossRef] [PubMed]
  37. Grabherr, G.; Gottfried, M.; Pauli, H. Climate Change Impacts in Alpine Environments. Geogr. Compass. 2010, 4, 1133–1153. [Google Scholar] [CrossRef]
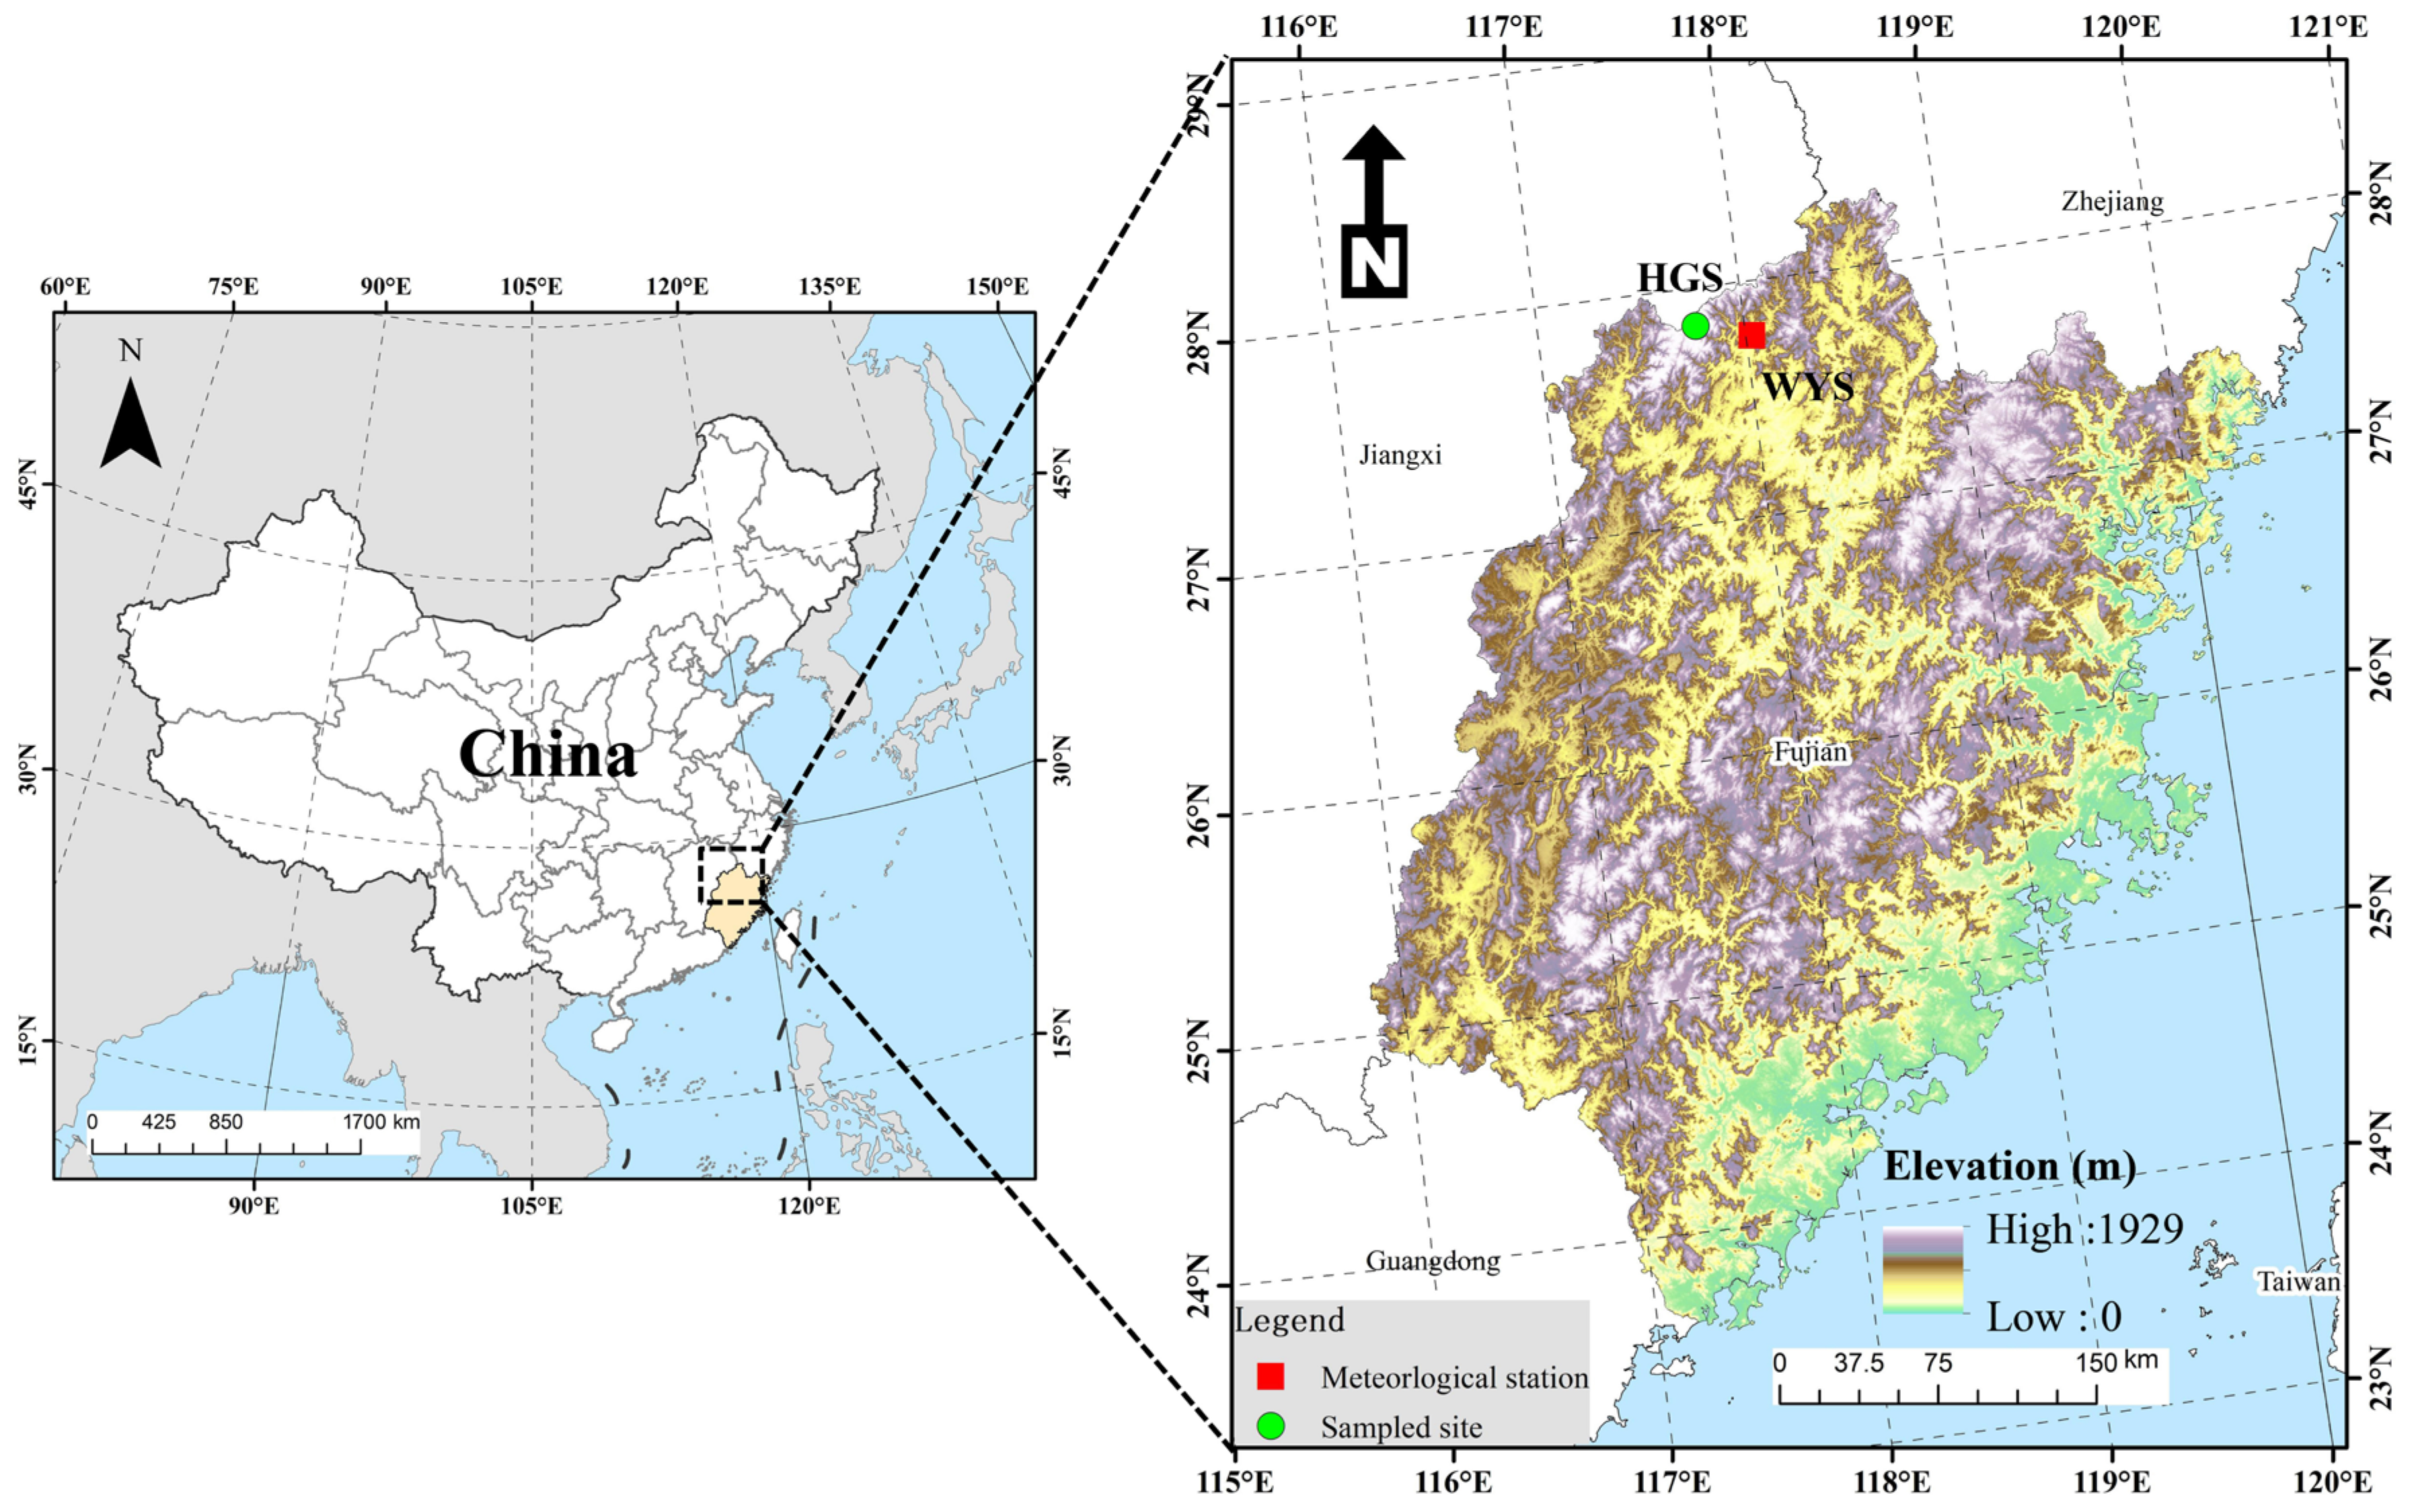
Figure 1. Sampling sites and the nearest meteorological stations in the Wuyi Mountains, Fujian Province, southeastern China.
Forests 16 01299 g001
Figure 2. Climatic diagram for the Wuyishani Meteorological Station (27.76° N, 118.03° E, 216.0 m a.s.l.). Monthly mean values of mean, maximum, and minimum temperatures, and total monthly precipitation, calculated for the period 1957–2019.
Forests 16 01299 g002
Figure 3. Standard tree-ring chronologies (black solid line) and sample sizes of annual ring widths (black dashed line) for P. taiwanensis (a) and C. fortunei (b).
Forests 16 01299 g003
Figure 4. Long-term trends and interannual variations in annual mean temperature (a), precipitation (b), mean maximum temperature (c), and mean minimum temperature (d) from 1957 to 2019 in the study area.
Forests 16 01299 g004
Figure 5. Correlation analysis of the tree-ring width chronologies of P. taiwanensis and C. fortunei with monthly mean temperature (a), precipitation (b), mean maximum temperature (c), and mean minimum temperature (d). Black dashed lines indicate the 95% confidence level (p ≤ 0.05). “p” = previous year; “c” = current year. The same below.
Forests 16 01299 g005
Figure 6. Correlation analysis of the tree-ring width chronologies of P. taiwanensis and C. fortunei with seasonal mean temperature (a), precipitation (b), mean maximum temperature (c), and mean minimum temperature (d). Black dashed lines denote the 95% confidence level (p ≤ 0.05). The legend is the same as in Figure 5.
Forests 16 01299 g006
Figure 7. Moving correlation analysis between the tree-ring width indices of P. taiwanensis and monthly mean temperature (a), precipitation (b), mean maximum temperature (c), and mean minimum temperature (d) (25-year window). * indicates a significance level of 95%. The legend is the same as in Figure 5.
Forests 16 01299 g007
Figure 8. Moving correlation analysis between the tree-ring width indices of C. fortunei and monthly mean temperature (a), precipitation (b), mean maximum temperature (c), and mean minimum temperature (d) (25-year window). * indicates a significance level of 95%. The legend is the same as in Figure 5.
Forests 16 01299 g008
Table 1. Sampling locations for dendrochronological analysis.
Tree SpeciesLatitudeLongitudeElevation (m)DBH (cm)Slope (°)
Pinus taiwanensis27°50′25.42″ N117°45′25.57″ E186333.744
Cryptomeria fortunei27°50′39.60″ N117°45′39.88″ E178247.337
DBH: diameter at breast height.
Table 2. Statistical characteristics of the chronologies for P. taiwanensis and C. fortunei.
Tree-Ring ParametersP. taiwanensisC. fortunei
Sample size (tree/core)45/4545/45
Mean0.99560.9839
Time span 1912–20231857–2023
Standard deviation (SD)0.25370.3246
Mean sensitivity (MS)0.17220.1810
Autocorrelation order 10.59210.7118
All series mean correlation (R)0.3000.254
Signal-to-noise ratio (SNR)15.41510.871
Expressed population signal (EPS)0.9390.916
Variance in first eigenvector35.84%37.35%
Disclaimer/Publisher’s Note: The statements, opinions and data contained in all publications are solely those of the individual author(s) and contributor(s) and not of MDPI and/or the editor(s). MDPI and/or the editor(s) disclaim responsibility for any injury to people or property resulting from any ideas, methods, instructions or products referred to in the content.