Article

Do Forest Carbon Offset Projects Bring Biodiversity Conservation Co-Benefits? An Examination Based on Ecosystem Service Value

1
College of Economics, Sichuan Agricultural University, Chengdu 611130, China
2
College of Management, Sichuan Agricultural University, Chengdu 611130, China
3
College of Animal Science and Technology, Sichuan Agricultural University, Chengdu 611130, China
*
Author to whom correspondence should be addressed.
Forests 2025, 16(8), 1274; https://doi.org/10.3390/f16081274
Submission received: 24 June 2025 / Revised: 12 July 2025 / Accepted: 23 July 2025 / Published: 4 August 2025

Abstract

In the context of worsening climate change and biodiversity loss, forest carbon offset projects are viewed as important nature-based solutions to mitigate these trends. However, there is limited evidence on whether these projects provide net benefits for biodiversity conservation. This study uses a staggered difference-in-differences model with balanced panel data from 128 counties in Sichuan Province, China, spanning from 2000 to 2020, to examine whether these projects bring biodiversity conservation co-benefits. The results show that the implementation of forest carbon offset projects leads to a 55.1% decrease in the ecosystem service value of forest biodiversity, with the negative impact particularly pronounced in areas facing agricultural land use and livestock pressures. The dynamic effect tests indicate that the benefits of biodiversity conservation generally begin to decline significantly 5 years after project implementation. Additional analyses show that although projects certified under biodiversity conservation standards also exhibit negative effects, the magnitude of decline is substantially smaller compared to uncertified projects, and certified projects achieve greater carbon stock gains. Heterogeneity analysis demonstrates that projects employing native tree species show significant positive effects. Moreover, spatial econometric results demonstrate significant negative spillover effects within an 80 km radius surrounding the project sites, with the effect attenuating over distance. To maximize the potential of forest carbon offset projects in addressing both climate change and biodiversity loss, it is important to mitigate the negative impacts on biodiversity within and beyond project boundaries and to enhance the continuous monitoring of projects that have been certified for biodiversity conservation.

1. Introduction

Addressing climate change and protecting biodiversity are closely linked [1]. Climate change accelerates biodiversity loss, and biodiversity loss harms ecosystem stability and carbon sequestration capacity, further speeding up global warming [2,3]. There is growing consensus on the urgency and importance of managing both issues together, making it a global focus [4]. Forest carbon offset projects, as nature-based solutions, play a dual role in mitigating climate change and curbing biodiversity loss [5,6,7]. Their direct connection to biodiversity comes from international climate change agreements. Since the Kyoto Protocol was adopted in 1997, the scope of forest carbon offset activities eligible for carbon market trading has expanded from afforestation and reforestation to include actions that prevent forest degradation and protect biodiversity. This is consistent with and complementary to climate change adaptation actions under the Convention on Biological Diversity [8]. Compared to other types of carbon offset projects, forest carbon offset projects incorporating biodiversity co-benefits not only align with the synergistic objectives of two major international conventions but also better address corporate imperatives related to climate risk management, sustainability responsibility fulfillment, and ESG performance enhancement, thereby exhibiting greater attractiveness and competitiveness within voluntary carbon markets [9]. However, despite biodiversity conservation being a common goal in the design and approval of forest carbon offset projects, projects focused solely on carbon sequestration may not automatically address biodiversity concerns. In some cases, aggressive carbon sequestration measures in project development and management can harm biodiversity, which in turn weakens efforts to adapt to climate change.
Specifically, forest carbon offset projects typically involve three types of activities: avoiding deforestation, improving forest management, and afforestation/reforestation. The first two types, which focus on protecting primary or natural forests, are considered biodiversity-friendly forest carbon offset projects [10,11]. In contrast, afforestation/reforestation projects are controversial regarding their effectiveness in biodiversity conservation due to issues related to species selection, planting methods, and site choices. On the one hand, in pursuit of rapid carbon stock gains, some forest carbon offset projects favor afforestation using exotic species or fast-growing monocultures. Such homogenized planting practices not only diminish the structural complexity of forests within project areas but may also extend adverse effects to surrounding regions, contributing to the degradation or loss of native forests. The underlying mechanism lies in fundamental ecological differences between plantations and natural forests—particularly in species composition, stand structure, and ecosystem processes—which exacerbate disturbances and competitive pressures on adjacent native ecosystems [12,13]. On the other hand, voluntary carbon market mechanisms permit the inclusion of non-forest ecosystems, such as grasslands and shrublands, as eligible sites for afforestation. Planting trees in habitats inherently unsuitable for forest development risks disrupting native ecosystem structure and function, promoting the spread of invasive species, and ultimately undermining ecosystem stability and resilience [14,15].
Previous studies have established that forest management practices significantly influence the synergy between carbon sequestration and biodiversity conservation [16,17]; however, there remains a notable gap in systematic, quantitative evidence regarding the broader ecological impacts of specific interventions, such as species selection, management models, and intensity, within the framework of forest carbon offset projects. Given that biodiversity underpins most ecosystem services, acting as a regulator, a service in itself, and a commodity [18], this paper views biodiversity as a service, as suggested by Costanza et al. [19] in their assessment of the ecosystem service value of biodiversity conservation. Currently, there are two main methods for the monetary valuation of biodiversity conservation as an ecosystem service: the first is based on primary data, which involves quantifying ecological processes and functions and then applying economic valuation techniques [20]; the second is the unit value method (i.e., the equivalent factor method), which estimates economic value per unit area of the ecosystem [21,22,23]. The equivalent factor method requires less data and is suitable for evaluating ecosystem service values over large areas where data collection is challenging. It effectively reflects the relationship between natural, socio-economic factors and ecosystem service value [21,24]. Therefore, this paper will use the equivalent factor method to measure the benefits of biodiversity conservation.
In this context, this paper assesses the impact of forest carbon offset projects implemented in China on the value of forest biodiversity conservation. The potential contributions are mainly reflected in two aspects. First, the paper provides causal evidence in the debate over whether forest carbon offset projects have synergistic benefits for biodiversity conservation. Existing research has deepened the understanding of the potential synergies and risks between forest carbon sequestration and biodiversity conservation [12,13]. However, related quantitative studies primarily focus on quantifying the trade-offs or synergies between forest carbon sequestration and biodiversity conservation from an ecological perspective, with insufficient explanation of the causal relationship between the implementation of forest carbon offset projects and biodiversity conservation outcomes. Qualitative analyses tend to examine the potential impacts of forest carbon offset projects on forest structure and invasive species through content analysis of publicly disclosed project documents and real-world case studies [25], making it challenging to accurately determine whether these projects result in net benefits for biodiversity conservation. Additionally, selection bias in the choice of forest carbon offset projects presents challenges in identifying causal effects in evaluations [26,27]. In contrast to previous research, this paper utilizes a quasi-natural experiment based on the implementation of forest carbon offset projects and employs a difference-in-differences model to assess the causal relationship between forest carbon sequestration and biodiversity conservation from the perspective of ecosystem service value. This approach effectively addresses the challenge of identifying the “additionality” of forest carbon offset projects and provides supplementary causal evidence for the relationship between the two.
Second, the paper enriches the empirical research on the evaluation of forest carbon offset project outcomes. In terms of evaluation focus, existing studies often concentrate on tropical rainforest countries and focus primarily on REDD+ projects aimed at preventing deforestation [25,28,29]. In terms of research data, related empirical studies mainly use national or regional-level time series or cross-sectional data for analysis [30,31]. Different from the aforementioned studies, this paper evaluates the ecological and environmental effects of forest carbon offset projects in the form of afforestation and reforestation activities using long-term panel data at the county level in Sichuan Province, China. This expands the types of evaluations conducted on forest carbon offset projects and allows for a broader understanding of their ecological and environmental impacts over a longer time frame and across a wider spatial distribution. This paper supplements a valuable supplement to the research on the evaluation of forest carbon offset project outcomes.

2. Materials and Methods

2.1. Materials

2.1.1. Study Area

Sichuan Province is a crucial water source and soil conservation area in the upper Yangtze River basin and is also one of the 25 global biodiversity hotspots. As of 2024, the province has a permanent population of 83.64 million, with forest land and grassland accounting for 19.93% and 52.38% of its total area, respectively. With forests and grasslands covering about three-fourths of its land area, Sichuan ranks third in the country for forest land and forest growing stock volume and fourth in forest area, making it an important natural carbon sink in China and worldwide.
Sichuan was among the first provinces in China to pilot forest carbon offset projects and is a priority area for forest carbon offset development. Since implementing the first forest carbon offset project in 2004, Sichuan has launched three additional projects in 2010, 2011, and 2012, all involving afforestation activities and covering 13 counties in Sichuan (Table 1 shows the basic information about forest carbon offset projects in Sichuan). The trading mechanisms include the Clean Development Mechanism (CDM), Chinese Certified Emission Reduction (CCER), and the Voluntary Carbon Standard (VCS), with two projects also certified for additional biodiversity conservation by the Climate Community and Biodiversity (CCB) Standards. The project sites are near biodiversity hotspots, and before project implementation, they were mostly covered by shrubs and herbaceous plants, with no rare or endangered species present. Figure 1 shows the distribution of counties with projects and counties with biodiversity conservation areas. The main biodiversity conservation goals of the projects are to provide wildlife corridors by using native species for vegetation restoration, increase habitat area for threatened species, and improve their living conditions. The unique geographical location, long operational history, and development model aimed at multiple benefits of Sichuan’s forest carbon offset projects offer valuable data for examining their impact on biodiversity conservation. This helps deepen the understanding of the co-benefits of forest carbon offset projects and provides empirical evidence for addressing climate change and halting biodiversity loss.

2.1.2. Data Source

To account for the ecosystem service value of biodiversity, we collect 30 m × 30 m precision remote sensing monitoring data of Chinese land cover in 2000, 2005, 2010, 2013, 2015, 2018, and 2020, containing six primary land classifications (farmland, forest, grassland, watershed, construction land, and unused land). The data are obtained from the Resource and Environment Science Data Center of the Chinese Academy of Sciences. Natural environment data are sourced from GSSD and MODIS, while economic variables are derived from the Sichuan County Statistical Yearbook for 2001–2021. For analysis, the necessary raw raster data were aggregated into county-level panel data. The full sample consists of balanced panel data from 128 counties between 2000 and 2020.

2.2. Calculation Method of Forest Biodiversity Conservation Value

This study employs the equivalent factor method to quantify the benefits of biodiversity conservation. It is important to note that we do not directly measure the intrinsic attributes of biodiversity, such as species richness or genetic diversity. Instead, we use the ecosystem service value of forest biodiversity (Bio_ESV) as a proxy indicator to reflect the forest ecosystem’s capacity to support biodiversity. Specifically, drawing on the framework developed by Ng et al. [32], we characterize the spatial structure and biodiversity-supporting functions of county-level forest ecosystems based on forest patch area and connectivity metrics. We then apply the ecosystem service value equivalent factors proposed by Xie et al. [23] to estimate the per-unit-area contribution of forest land to biodiversity maintenance. This approach integrates spatial features such as patch size and connectivity with standardized value coefficients, capturing the ecological value of forests in maintaining landscape-scale ecological processes, facilitating species migration, and preserving habitat integrity. Therefore, the term “biodiversity-related ecosystem service value” in this study should be interpreted as a monetized representation of the ecosystem’s function in supporting biodiversity, rather than the intrinsic value of biodiversity itself.
This study constructs a county-level panel variable of biodiversity-related ecosystem service value by applying a spatially explicit ecological valuation framework that integrates patch-based habitat connectivity. The method follows the landscape connectivity index developed by Ng et al. [32], with modifications to accommodate a time-series panel structure at the county level. The outcome variable is denoted as B i o E S V j t , representing the biodiversity ecosystem service value in county j and year t , and is calculated using the following formula:
B i o E S V j t = i j V C d P C i t d P C m a x t A m a x t
where i j indexes all forest patches within county j , V C   is the unit biodiversity service value coefficient for forest land, drawn from national valuation studies [23], d P C i t is the patch-level differential probability of connectivity in year t , d P C m a x t is the maximum d P C among all patches in year t , and A m a x t denotes the largest forest patch area in year t , used to normalize patch contributions across time.
The central variable d P C i t captures the marginal importance of each patch to the structural connectivity of the landscape and is computed as follows:
d P C i t = P C i t P C i 0 t P C i t × 100
where P C i t denotes the overall probability of connectivity with patch i included, while P C i 0 t denotes the probability of connectivity with patch i excluded.

2.3. Staggered Difference in Differences Model

This study is based on balanced panel data from 128 counties between 2000 and 2020. The forest carbon offset projects are treated as a quasi-natural experiment, with counties implementing these projects as the treatment group and the remaining counties as the control group. Due to the varying implementation times of different forest carbon offset projects, this study, following the method of Beck et al. [33], constructs a Staggered Difference-in-Differences (DID) model. Specifically, “staggered” refers to the fact that the implementation of forest carbon offset projects occurred at different times across regions, exhibiting substantial temporal heterogeneity. Accordingly, employing a staggered DID model allows for a more accurate identification of dynamic treatment effects across varying adoption timings. In contrast, “balanced panel data” denotes a dataset wherein each observational unit (county) is observed continuously and completely across all years, thereby minimizing potential biases arising from sample attrition or missing data. The estimation methods used in this study were implemented using Stata 17 software.
l n b i o _ e s v i , t = β 0 + β 1 F C O P i , t + θ X i , t + μ t + γ i + ε i , t
where l n b i o _ e s v i , t represents the forest biodiversity conservation value for county i in year t ; γ i denotes the individual fixed effect; μ t is the time fixed effect; ε i , t is the disturbance term; X i , t is the set of control variables; the core explanatory variable F C O P i , t is the interaction term between the group dummy variable and the time dummy variable. F C O P i , t is used to identify counties implementing forest carbon offset projects in year t . For the years in which the project is implemented and subsequent years, the value is set to 1, and for other years, it is set to 0. Implementing counties are assigned a value of 1 (as the treatment group), and non-implementing counties are assigned a value of 0 (as the control group). The estimated coefficient β 1 measures the average difference in forest biodiversity conservation value before and after the implementation of the forest carbon offset projects.

2.4. Event Study Model

The premise of using a staggered DID model is that the treatment group and the control group have consistent trends before the projects are implemented, which satisfies the parallel trend assumption. Since the implementation years of the forest carbon offset projects vary, it is not feasible to set a specific year as the critical point for all projects. Instead, a relative time dummy variable must be set for each county’s project implementation. Therefore, we use the method of Beck et al. [33] to conduct a parallel trend test and construct Equation (4) as follows.
l n b i o _ e s v i t = α + β n n 13 13 F C O P j k , p l o i c y + n + X i t γ + η i + θ j t + δ k t + μ i j k t
where l n b i o _ e s v i t represents the project implementation window, with a value of 1 in the year of implementation and 0 in other years. The period before the project implementation is used as the baseline.

2.5. Synthetic Difference-in-Differences Model

The Synthetic DID model optimizes the weights of control groups from different periods to construct a synthetic control group that has the same pre-trend as the treatment group before the project implementation. This approach reduces reliance on the parallel trends assumption and effectively balances biases caused by the non-random implementation of the project, offering greater robustness compared to the traditional Difference-in-Differences (DID) model [26]. The specific model construction is as follows.
β ^ sdid , α ^ , μ ^ , v ^ = arg m i n β , α , μ , v i = 1 N t = 1 T l n b i o _ e s v i , t α β 1 F C S P i , t μ i v t 2 ϖ ¯ ^ i s d i d λ ^ t s d i d
In Equation (5), β ^ sdid   is the estimated coefficient for the treatment effect β of the forest carbon offset project; α ^ is the estimate of the constant term α ; μ ^ is the estimate of the county fixed effect μ i ; v ^ is the estimate of the time fixed effect v t ; N is the total number of counties; T is the number of time periods; ϖ ¯ ^ i s d i d represents the weights for the county units; λ ^ t s d i d represents the time weights.

2.6. Spillover-Robust DID

The implementation of forest carbon offset projects may also impact biodiversity conservation in neighboring areas, suggesting the potential for spatial spillover effects. Therefore, this study further employs a DID method that accounts for spillover effects (Spillover-robust DID) to examine whether the implementation of forest carbon offset projects affects the biodiversity conservation value in surrounding regions. This study follows the approach of Greenaway-McGrevy and Phillips [34] to design the following spatial spillover effects DID model.
l n b i o _ e s v i t = α +   β FCOP i t + γ   Close i t + θ X i t + μ i + λ t + ε i t
Close i t represents the distance from county i to the nearest treatment group, with this value being 0 before the project implementation; the treatment group is 0 both before and after the policy. Equation (6) relaxes the “Stable Unit Treatment Value Assumption” (SUTVA) by introducing neighboring treatment groups, only partially satisfying the SUTVA assumption, to estimate the policy treatment effects and the “neighbor” treatment effects. The specification of Close i t is as follows.
Whether a county is assigned to the neighboring treatment group   Close i t it is a single dummy variable, which can be broken down into a set of dummy variables.
C l o s e i t = C l o s e i t 1 + C l o s e i t 2 + + C l o s e i t k
where, for k ( 1 , 2 K ) , there are the following:
C l o s e i t k = 1 , i f n , 1 k D i k h 0 , i f D i < n , 1 k   o r   D i > k h
The distance D i from a county to the treatment group is divided into K equal intervals, each with a length of h . We set the treatment distance to be within 160 km and divide it into 4 groups with 40 km intervals. In this case, K is 4, and the length of each interval h is 40, resulting in 4 different indicators C l o s e i t k .

2.7. Variable Descriptions

2.7.1. Dependent Variable

The dependent variable is the natural logarithm of the forest biodiversity conservation value calculated above ( l n b i o _ e s v ).

2.7.2. Independent Variable

This study treats the implementation of forest carbon offset projects as a quasi-natural experiment, using the interaction of project implementation county dummy variables and project implementation time dummy variables to represent the treatment effect of the forest carbon offset project ( F C O P ).

2.7.3. Control Variables

Based on relevant studies by Costanza et al. [35], Liu et al. [36], and Roshni et al. [37], considering that other county-level natural conditions and economic factors may affect forest biodiversity, this study controls for five broad categories of variables. (1) Natural Climate: Suitable precipitation and temperature are important factors affecting forest biodiversity [35]. This study uses rainfall and temperature as proxy variables for natural climate. (2) Forest Cover: Forest cover has a significant impact on biodiversity. While the restoration of natural forests helps protect biodiversity, a larger area of artificial forest cover does not always benefit biodiversity [38]. This study uses the ratio of forest area to land area as a control variable affecting forest biodiversity. (3) Industrialization: Higher levels of industrialization pose a greater threat to biodiversity [37]. This study uses the proportion of industrial output value to regional GDP as a proxy for industrialization level. (4) Agricultural Development: Agricultural development conflicts with biodiversity conservation, and an increase in agricultural land area significantly negatively impacts biodiversity [39]. Additionally, mechanized farming practices in agriculture can adversely affect biodiversity [40]. This study uses total agricultural output value, the proportion of agricultural land, and total agricultural machinery power as proxies for agricultural development. (5) Population Density: Numerous studies indicate that population expansion, especially increased population density, poses a significant threat to biodiversity conservation [36,41]. This study uses the ratio of registered population to administrative land area to measure population density. Table 2 provides a detailed introduction to and descriptive statistics of the relevant variables.

3. Empirical Analysis

3.1. Baseline Regression Results

Table 3 reports the regression results of the forest carbon offset projects and biodiversity conservation value. The estimation results show that the estimated coefficients of FCOP are significant at the 1% level. Column (1) controls for county and year fixed effects, showing that FCOPs significantly reduce biodiversity ESV. Column (2) includes additional controls, and the estimated effect remains negative and significant, with a 55.1% reduction ( ( e 0.801 1 ) × 100 55.1 % ). The implementation of forest carbon offset projects led to an average reduction of approximately CNY 7.228 million in biodiversity conservation value. These findings suggest that FCOPs may generate unintended ecological trade-offs, failing to deliver expected biodiversity co-benefits.
Building on existing scholarship, this study delineates three potential mechanisms through which forest carbon offset projects may adversely affect forest biodiversity ecosystem service values. First, project implementation often favors monoculture plantations, resulting in the homogenization of forest stand structures, a decline in habitat heterogeneity and complexity, and consequently a diminished capacity of ecosystems to sustain species diversity [42,43,44]. Second, forest carbon offset projects may generate spatial competition with traditional land uses such as agriculture and pastoralism. When project activities encroach upon native vegetation or arable and grazing lands, they risk triggering ecological consequences including habitat loss, landscape fragmentation, and the compression of species’ habitats [45]. Third, conflicting interests among project stakeholders may further undermine biodiversity outcomes. Project developers and carbon credit purchasers typically prioritize maximizing carbon sequestration outputs, favoring low-cost, readily certifiable afforestation approaches, whereas local governments and community members often emphasize land tenure security, short-term economic benefits, and livelihood sustainability [46,47]. In the absence of effective incentive-alignment mechanisms, conservation goals are prone to marginalization in practice, leading to declining management efficiency, escalating resource conflicts, and ultimately, the erosion of forest biodiversity ecosystem services.

3.2. Analysis of Moderating Effects

Furthermore, this study attempts to indirectly explore potential mechanism pathways by introducing moderating variables, focusing on the perspectives of human–land relationships and agricultural development pressures. Specifically, per capita arable land area and the number of large livestock slaughters are employed as proxy variables for agricultural land pressure and livestock farming intensity, respectively. As shown in Column (1) of Table 4, the interaction term between forest carbon offset projects and livestock slaughtering intensity yields a significantly negative coefficient, suggesting that in regions characterized by intensive livestock activities, project implementation is more likely to trigger grazing disturbances, land overexploitation, or disruptions to ecosystem structures, thereby exacerbating biodiversity degradation. In Column (2) of Table 4, the interaction between forest carbon offset projects and per capita arable land area yields a significantly positive coefficient, indicating that in areas with relatively abundant arable land resources, the negative impact of projects on forest biodiversity ecosystem service values is comparatively weaker. This finding also indirectly implies that heightened land scarcity may intensify competition over forest land use, leading to the compression of native vegetation habitats and the consequent loss of biodiversity.

3.3. Parallel Trend Tests and Estimation of Dynamic Treatment Effects

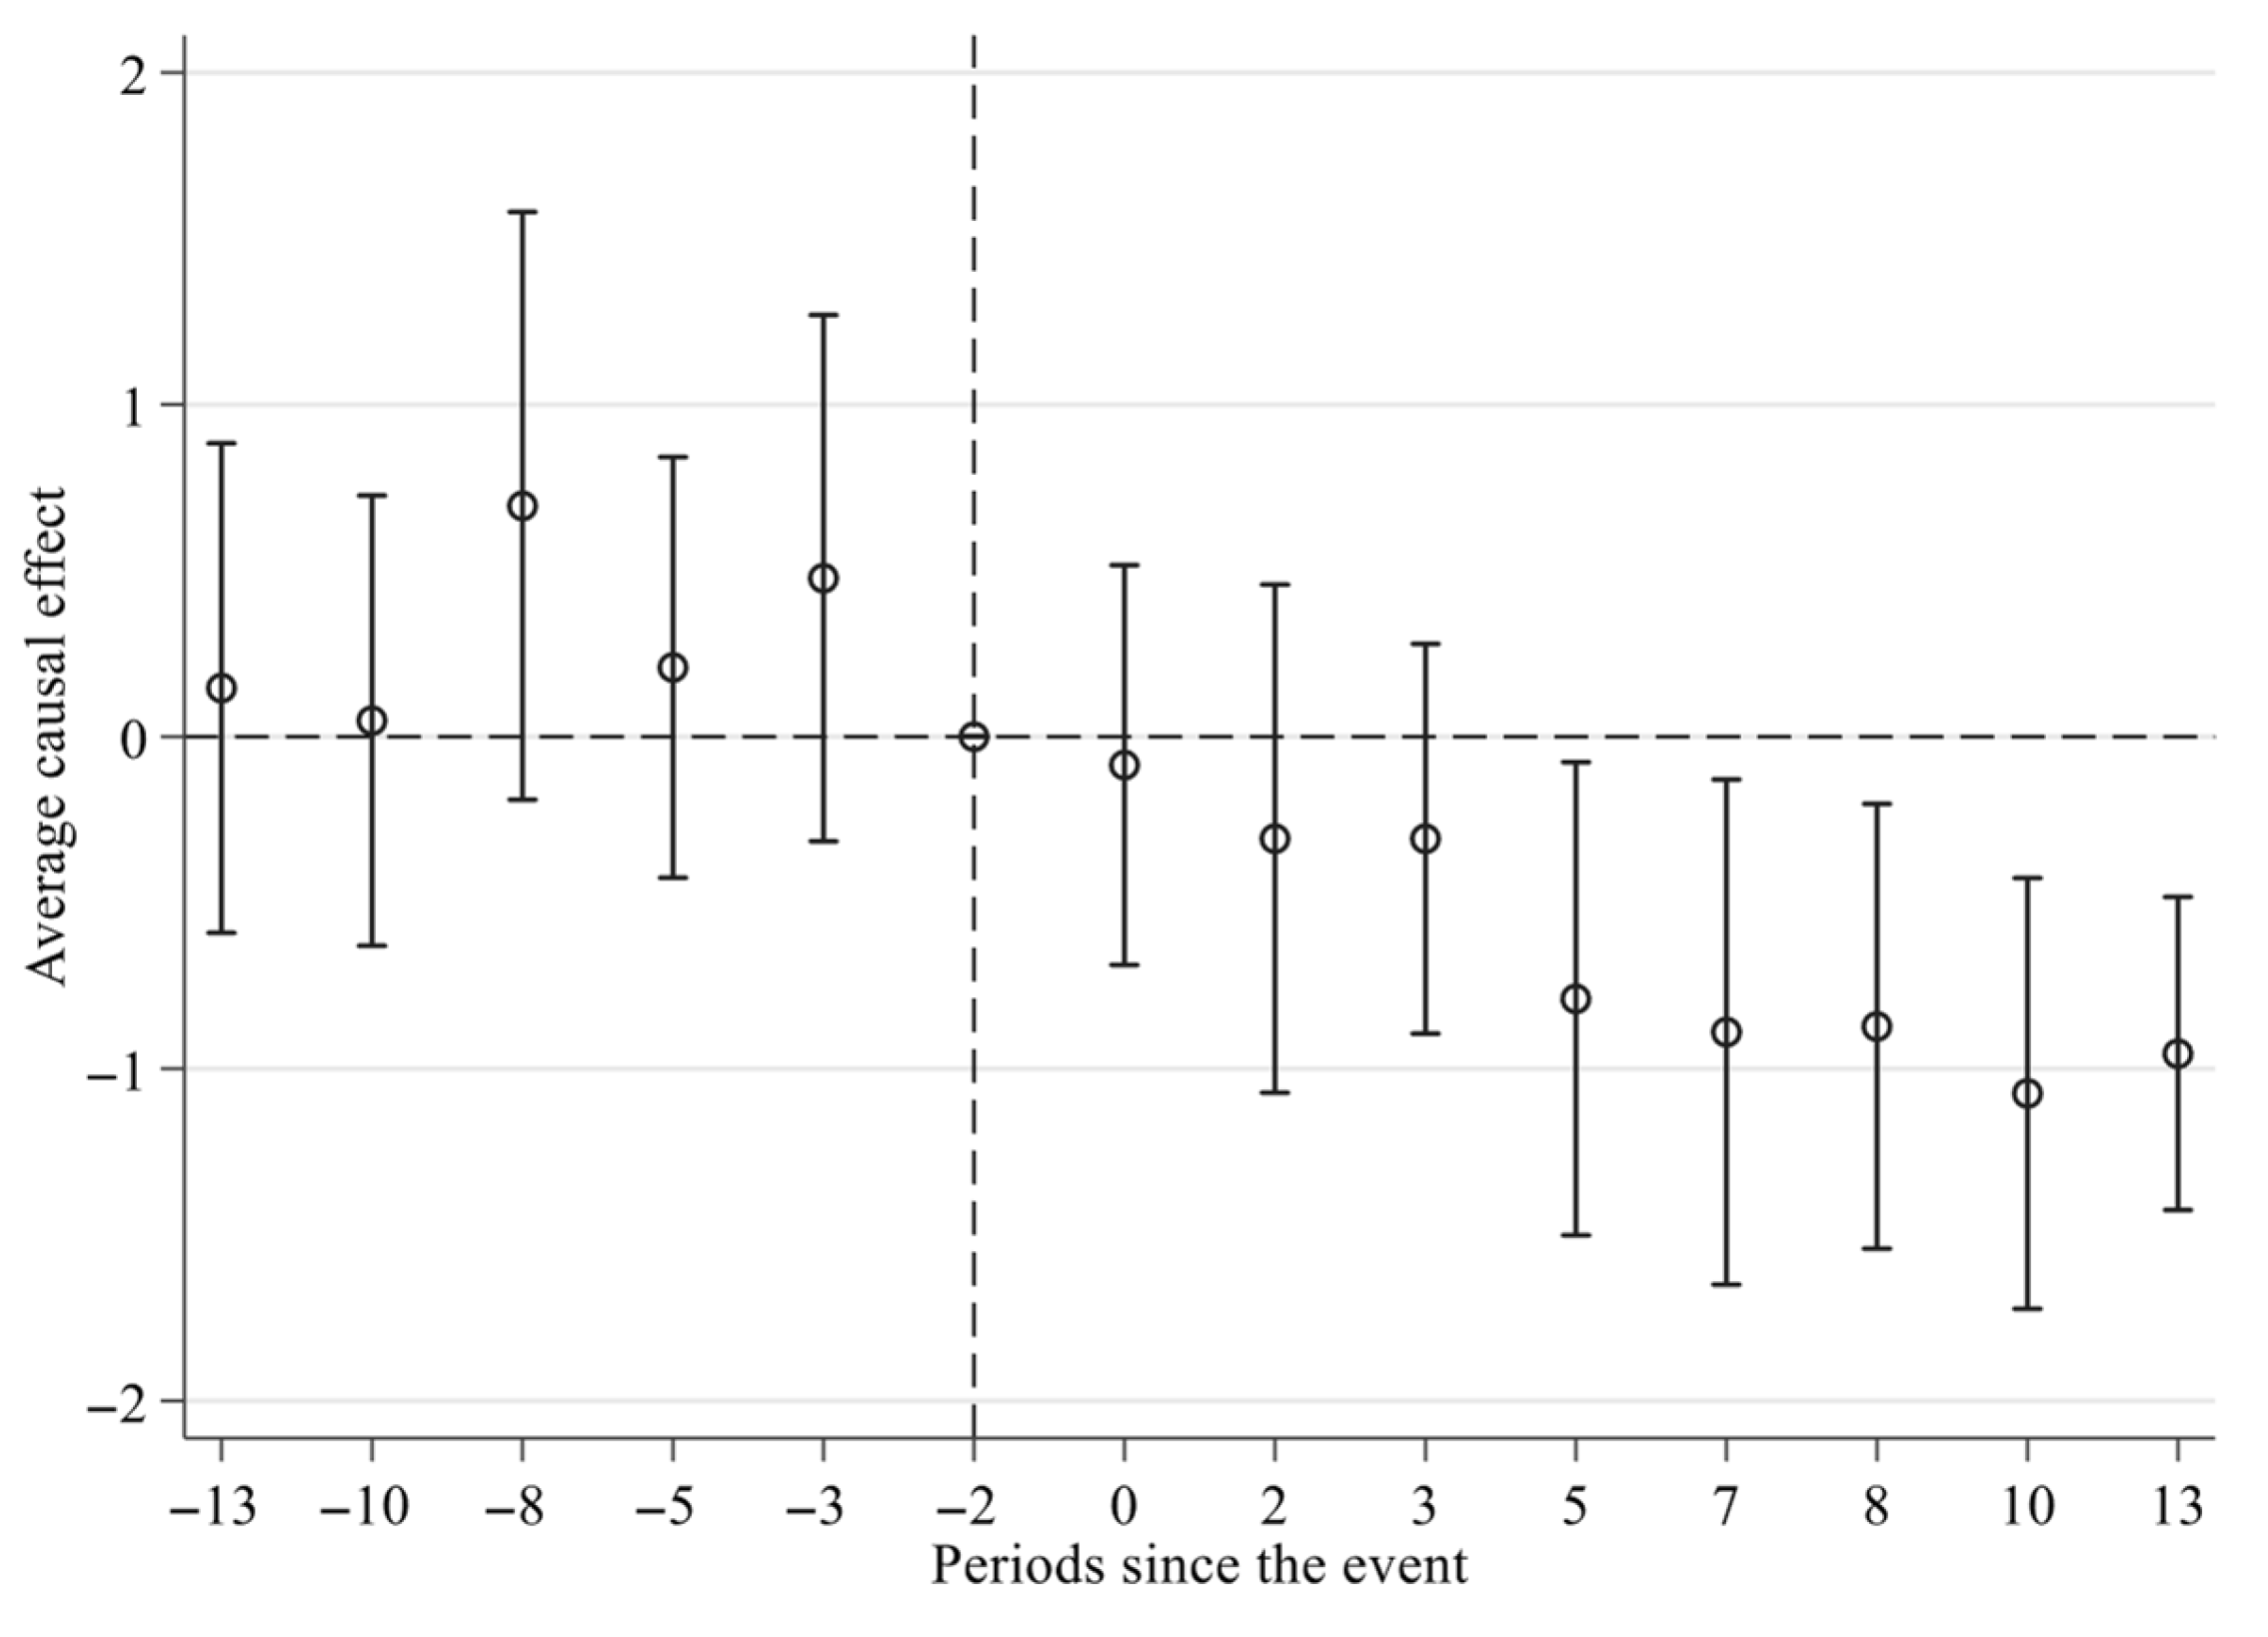
The dynamic trend changes from thirteen years before to thirteen years after project implementation were examined. Figure 2 shows that before the project implementation, the regression results are not significant, indicating no significant difference in the trend of biodiversity conservation value between the treatment and control groups. After the forest carbon offset project is implemented, the regression coefficients become significantly negative starting from the 5th year onwards, indicating that the project significantly reduces forest biodiversity conservation value and has a certain lag effect.
To ensure the robustness and reliability of the results, we conducted multiple robustness checks including the synthetic difference-in-differences method, placebo tests, exclusion of other policy interventions, replacement of the dependent variable, heterogeneity analysis of treatment effects, and the instrumental variable approach. All results are consistent with the baseline regression. For detailed information, please refer to the Supplementary Materials.

3.4. Forest Carbon Offset Projects with Biodiversity Conservation Certification

To ensure that forest carbon offset projects not only help mitigate climate change but also benefit local communities and biodiversity, a type of additional verification standard for forest carbon offset projects has emerged. These standards focus on balancing the climate mitigation potential of ecosystem services with social co-benefits while requiring projects to contribute to ecosystem integrity, biodiversity, and ecological safety, thereby ensuring that market transactions do not negatively impact biodiversity [25]. Among these standards, the CCB (Climate, Community, and Biodiversity) Standards are particularly notable for their comprehensive requirements for biodiversity value [7,48]. Of the four forest carbon offset projects implemented in Sichuan Province, two have passed the additional verification of the CCB Standards, with operation periods exceeding 10 years.
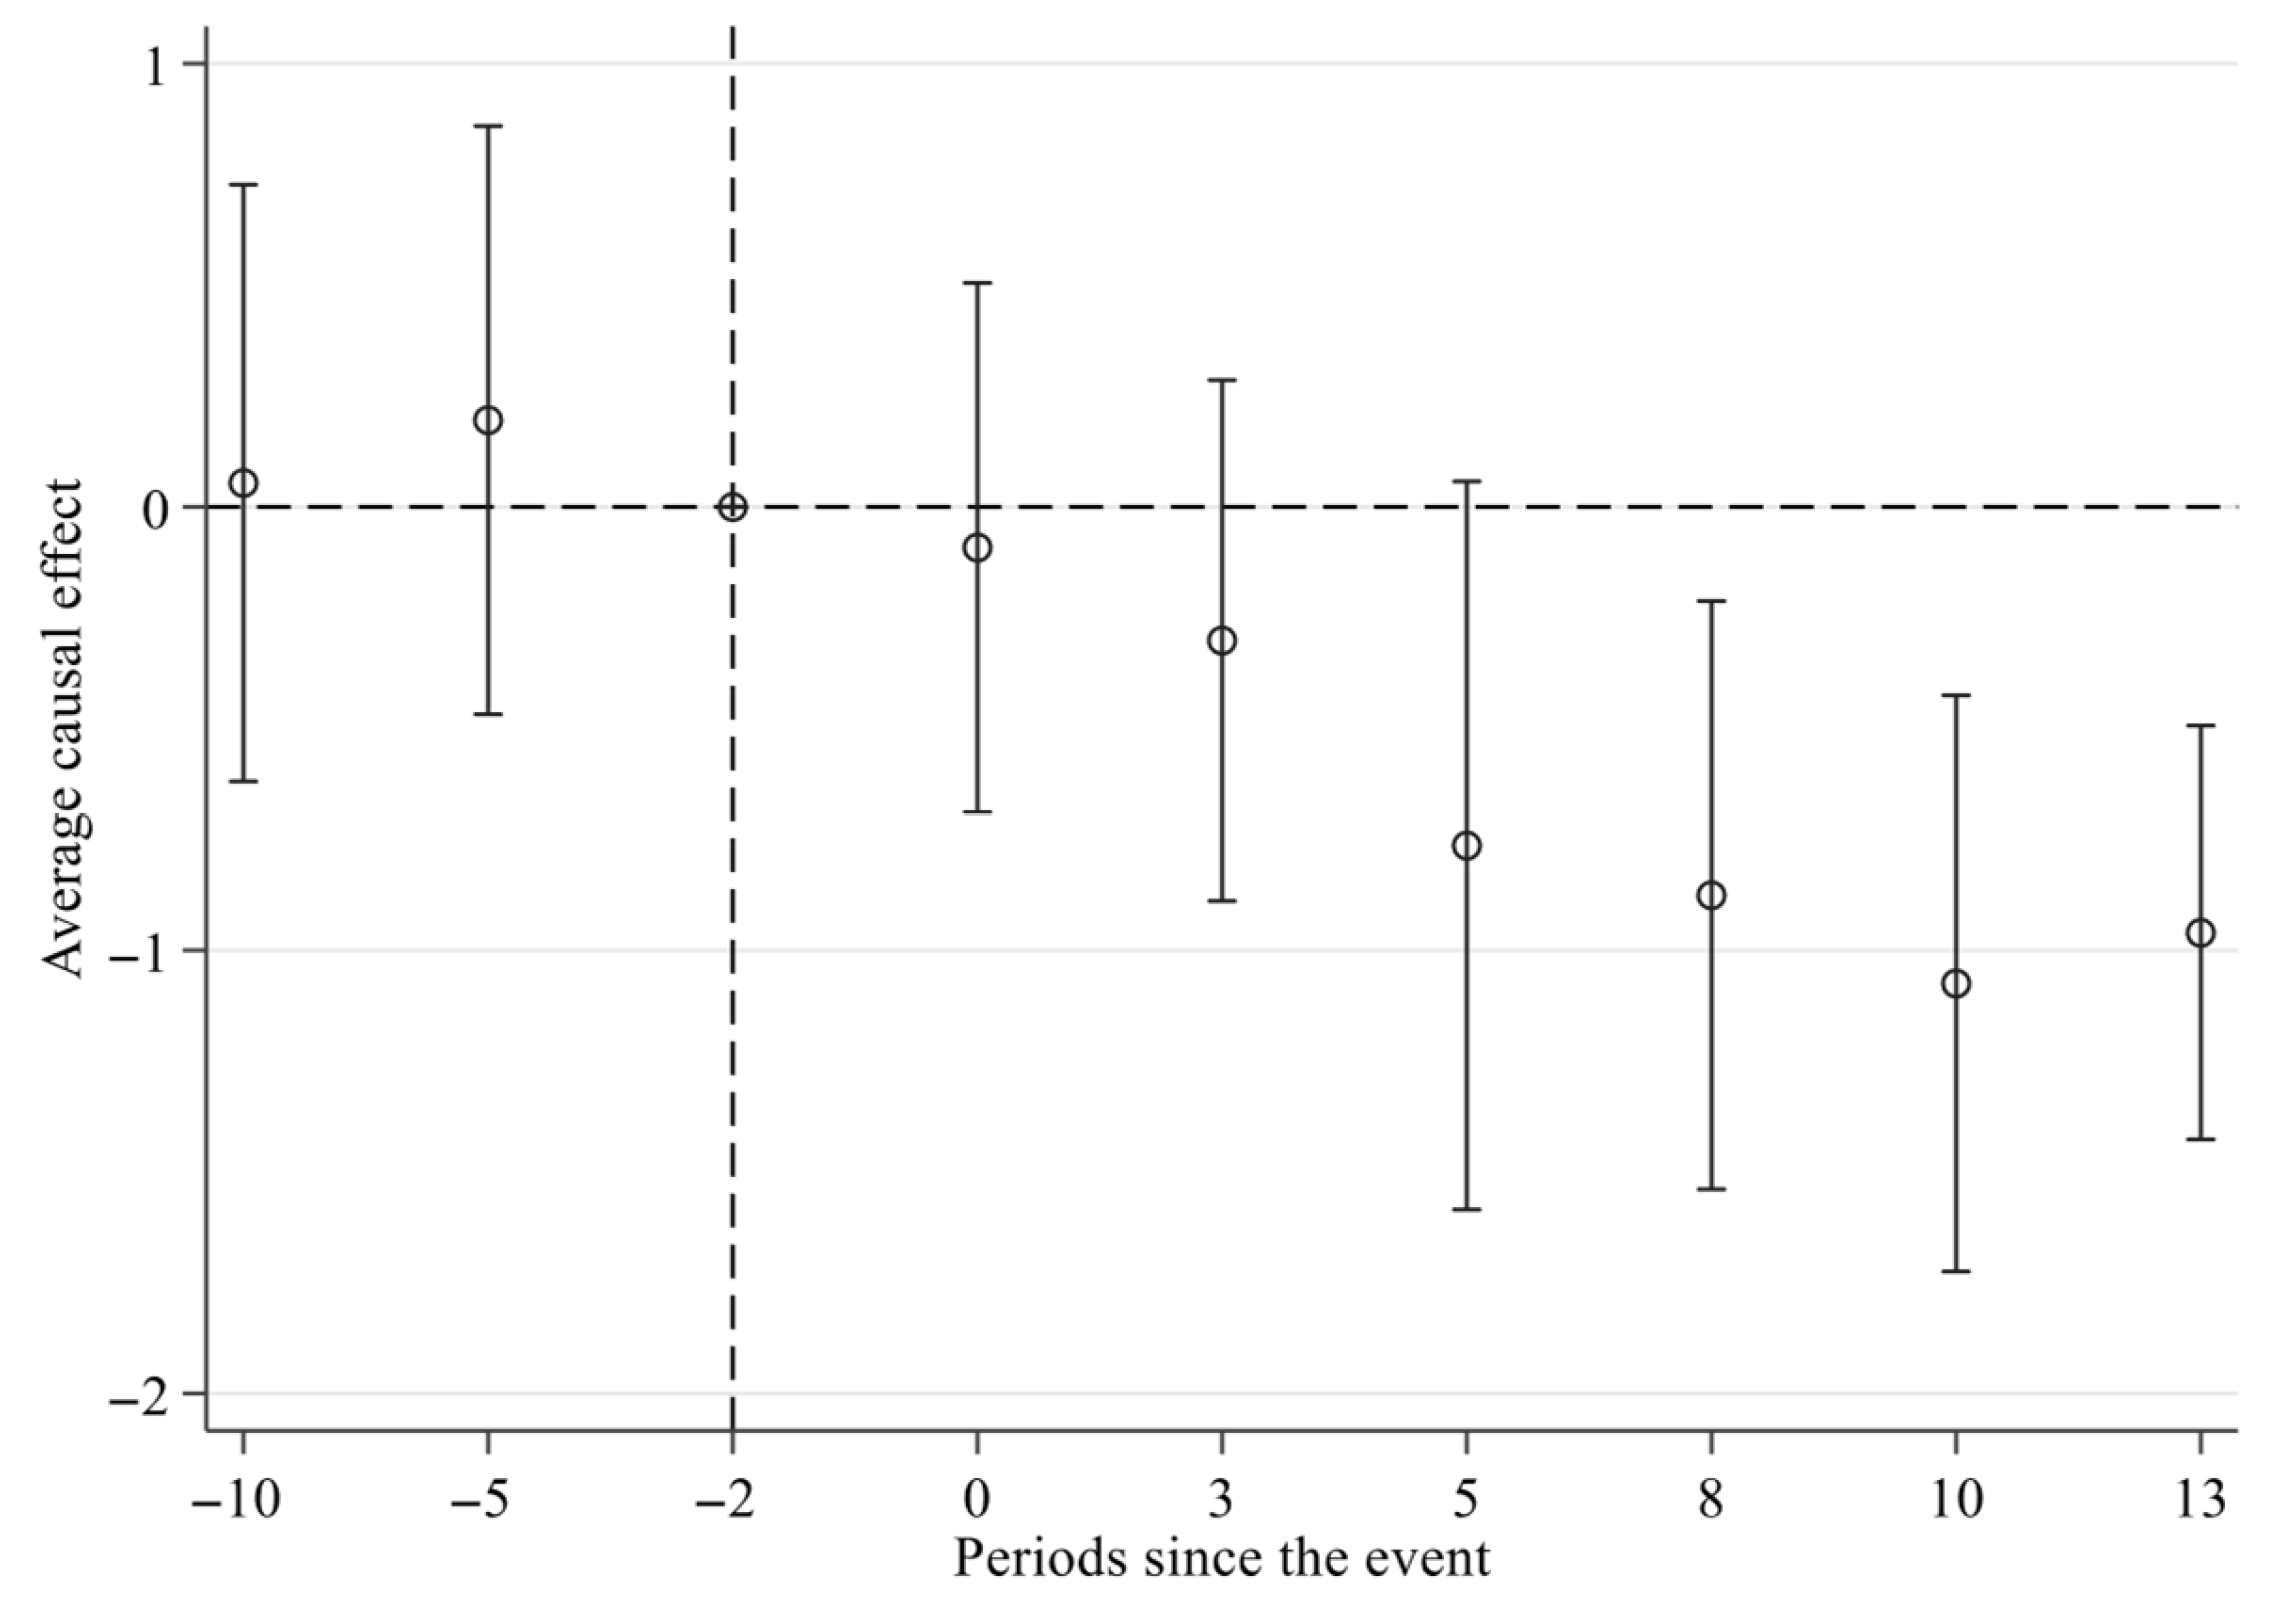
To verify whether forest carbon offset projects with biodiversity conservation certification provide additional biodiversity benefits, this study excluded the counties of forest carbon offset projects that did not pass CCB verification and re-conducted the regression analysis, along with a parallel trend test. As shown in Table 5 and Figure 3, under the premise of passing the parallel trend test, the implementation of forest carbon offset projects with CCB additional verification led to a reduction of approximately CNY 6.996 million in biodiversity conservation value in the region. This result is consistent with the baseline regression results, indicating that the CCB Standards did not bring additional biodiversity conservation benefits.

3.5. The Effects of Different Afforestation Approaches

Given that different afforestation models may have significantly varied ecological impacts, this study further disaggregates the forest carbon offset projects in the sample based on afforestation type, with a particular distinction between monoculture plantations and those using native tree species. As shown in Table 6, the empirical results indicate that projects employing native species exhibit a significantly positive effect on the biodiversity conservation value of ecosystem services, whereas monoculture projects have a significantly negative impact on this dimension. This finding highlights the structural differences in biodiversity outcomes associated with distinct afforestation practices, reinforcing the critical importance of incorporating ecological considerations at the project design stage. It also provides empirical support for optimizing forest carbon offset initiatives toward achieving ecological co-benefits.

3.6. Spatial Spillover Effect

The implementation of forest carbon offset projects may also impact biodiversity conservation in neighboring areas, suggesting the potential for spatial spillover effects. Therefore, this study further employs a DID method that accounts for spillover effects (Spillover-robust DID) to examine whether the implementation of forest carbon offset projects affects the biodiversity conservation value in surrounding regions.
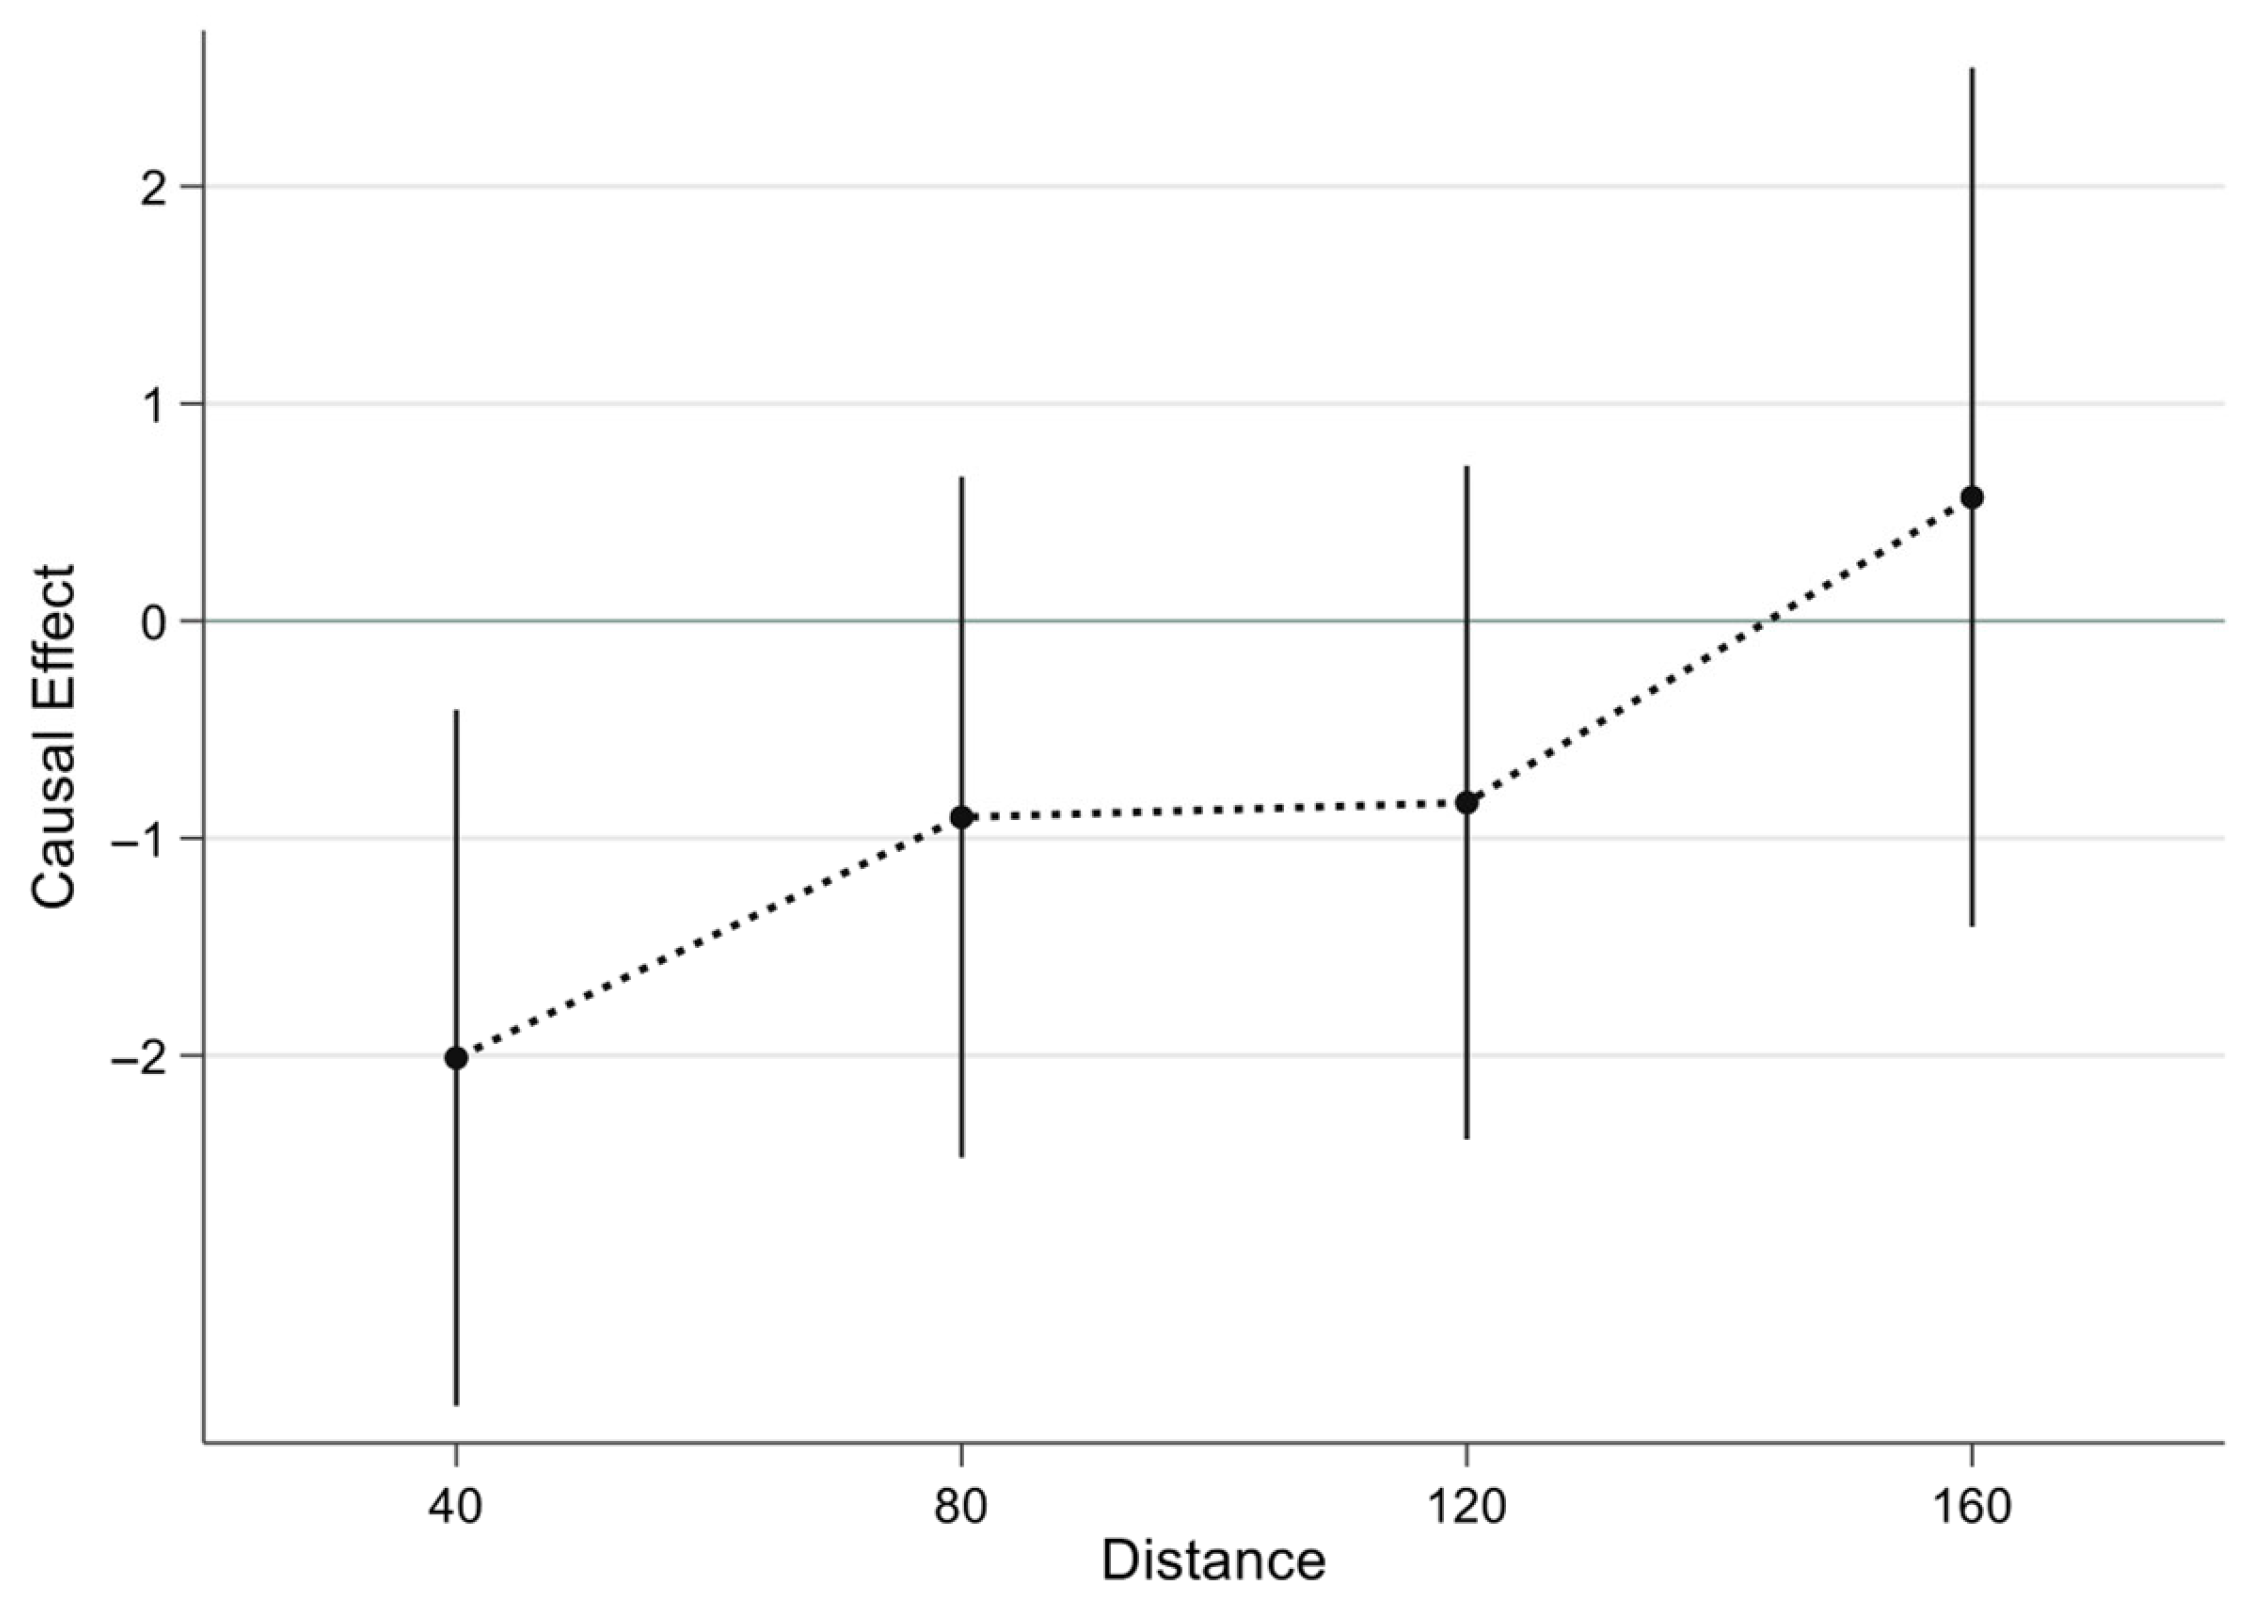
Figure 4 reports the estimated coefficients γ and the corresponding 95% confidence intervals under different thresholds for Equation (6). It is evident that the impact of the forest carbon offset project on biodiversity conservation value shows significant spatial spillover effects within an 80 km range. Furthermore, the spatial spillover effects of the forest carbon offset project decrease as the distance increases. This conclusion indicates that the forest carbon offset project not only reduces the negative impact on the local biodiversity conservation value but also leads to a decrease in the biodiversity conservation value around the project implementation area.
We argue that such negative spatial spillover effects are essentially analogous to the phenomenon of carbon leakage. When stringent forest carbon sequestration measures are implemented in one area, they may—through market dynamics or land-use substitution effects—shift carbon emissions or ecological pressures to neighboring or even more distant regions. Specifically, forest carbon offset projects often restrict land development and resource use within the project boundaries, thereby enhancing local carbon storage and ecosystem service functions. However, these restrictions may simultaneously increase land-use costs or resource demands in surrounding areas. This can trigger accelerated deforestation, land conversion, or other environmentally degrading activities in neighboring regions—ultimately resulting in a “leakage” effect. This phenomenon illustrates a classic case of negative externalities in environmental governance: while local environmental targets may be achieved, the overall net benefits of emission reduction and ecological protection may be undermined at a broader regional or system-wide scale.

3.7. Trade-Offs and Synergies Between Biodiversity Conservation and Carbon Benefits

To more comprehensively examine the potential trade-offs and synergies between carbon sequestration and biodiversity conservation within forest carbon offset projects, we conducted subgroup regressions based on whether the projects obtained CCB certification. As reported in Table 7, after controlling for fixed effects and relevant covariates, forest carbon offset projects consistently exerted negative impacts on biodiversity ecosystem service values, regardless of certification status. However, Columns (2) and (4) indicate that the absolute value of the estimated coefficient is smaller for CCB-certified projects relative to uncertified ones, suggesting that certified projects may place greater emphasis on ecological co-benefits during their design and implementation, thereby partially mitigating adverse ecological effects. Furthermore, according to the results presented in Columns (1) and (3) of Table 7, CCB-certified projects exhibited a statistically significant positive effect on forest carbon stocks, whereas uncertified projects, although displaying a positive direction, did not achieve statistical significance.
There are significant differences in ecological and environmental benefits between certified and non-certified forest carbon offset projects. This study identifies three possible explanations for this disparity. First, certified projects typically incorporate independent third-party verification mechanisms, enhanced information disclosure requirements, and more stringent environmental and social safeguard standards. These measures help mitigate potential issues at the local level, such as “incentive misalignment” and “implementation deviations”, thereby improving the transparency and consistency of policy interventions. Second, certification standards clearly define the ecological protection objectives of a project and emphasize the responsibility for maintaining ecosystem integrity. In practice, this helps reduce potential risks such as “greenwashing” and “ecological crowding out”, thereby strengthening the project’s contribution to non-carbon environmental goals. Third, certified projects are often associated with higher financial returns. The transaction premium serves as a form of ecological compensation for project developers, enhancing their intrinsic motivation to protect biodiversity. This, in turn, stimulates the enthusiasm of local governments and relevant stakeholders for ecological conservation and improves the efficiency of resource allocation. Therefore, compared to non-certified projects, certified projects are better equipped to reduce the risk of ecological degradation.

4. Discussion

4.1. Comparison and Extension of Existing Studies

As a market-based environmental policy instrument aimed at mitigating climate change, forest carbon offset projects are intended to enhance forest carbon sequestration through vegetation restoration and forest management, while simultaneously improving other ecosystem service functions. However, based on empirical evidence from county-level panel data, this study finds that such projects have not achieved the expected synergistic effects in enhancing the ecosystem service value of forest biodiversity; instead, they exhibit an overall negative impact. Compared with existing research on the externalities of forest carbon offset projects, this study further reveals, through quantitative analysis, the broader ecological risks potentially triggered by these initiatives. Consistent with the findings of Ma et al. [13] and He and Wang [12], our empirical analysis indicates that the implementation of forest carbon offset projects may lead to unintended ecological risks. Drawing upon existing literature, three potential mechanisms are explored. First, the practical implementation of these projects often adopts monoculture plantation models, leading to forest stand homogenization, reduced habitat heterogeneity, and decreased ecological complexity, ultimately undermining the ecosystem’s capacity to maintain biodiversity [42,43,44]. Second, spatial competition arises between project activities and traditional land uses such as agriculture and livestock grazing. When projects encroach upon native vegetation or agricultural land, they may trigger habitat loss, ecological fragmentation, and species habitat compression [45]. The findings from our moderation effect analysis and spatial econometric regressions indirectly support this, showing that the negative impacts are more pronounced in regions with higher agricultural land pressure and livestock intensity and that these impacts also spill over into neighboring areas, degrading their ecosystem service values. Finally, conflicts among stakeholder interests also play a critical role during project implementation. Participants in the carbon market—such as project developers and investors—often prefer afforestation models that are low-cost and easy to verify and manage, such as monoculture plantations of fast-growing species, in order to maximize carbon sequestration benefits. In contrast, local governments and communities are more concerned with land tenure security, livelihood stability, and the immediate economic returns from land use [46,47]. These divergent objectives frequently result in misaligned institutional arrangements, which hinder the realization of long-term ecological goals. In the absence of effective incentive-compatible governance mechanisms, biodiversity conservation objectives are easily marginalized.
It is important to note that although forest carbon offset projects certified by the CCB have not fully achieved the expected outcomes in biodiversity conservation, this does not imply that the CCB certification itself lacks value. Based on a comparative analysis of the effects on both forest carbon stock enhancement and the ecosystem service value of forest biodiversity, this study finds that, compared with uncertified projects, CCB-certified forest carbon offset projects demonstrate better performance in increasing carbon stock while exerting relatively weaker negative impacts on the ecosystem service value of biodiversity. This finding provides indirect empirical evidence supporting the potential synergistic relationship between carbon sequestration benefits and biodiversity conservation [7,9]. Furthermore, considering that Sichuan Province is characterized by complex topography—including hilly, mountainous, and plateau ecosystems—rich vegetation diversity, and a climate spectrum ranging from subtropical humid to plateau monsoon types [49] and exhibits a socio-economic structure dominated by agriculture and livestock industries [50], the conclusions drawn from this study may offer relevant insights for other regions with similar natural and socio-economic conditions.

4.2. Policy Implications

To achieve synergistic benefits between climate change mitigation and biodiversity conservation, this study proposes three actionable policy recommendations for policymakers and project designers. First, a differentiated ecological compensation mechanism should be established to explicitly address spatial competition between forestry expansion and existing land uses such as agriculture and animal husbandry. Mitigating the risks of land-use displacement is essential to prevent the spillover of ecological degradation at the regional scale, particularly in biodiversity-sensitive areas. Second, long-term and systematic biodiversity monitoring mechanisms should be integrated into project implementation requirements. It is recommended to develop a multidimensional monitoring framework encompassing species diversity, habitat integrity, and ecosystem functioning, enabling dynamic assessment and scientific feedback on the ecological impacts of projects. In addition, special attention should be given to identifying and monitoring land-use activities near project boundaries. Measures such as ecological buffer zones, transitional belts, or wildlife corridors can help reduce negative biodiversity externalities in surrounding areas and prevent the spatial diffusion and accumulation of ecological degradation. Third, incentive-compatible governance mechanisms should be designed to reconcile conflicting interests among stakeholders. Multiple approaches can be adopted, including biodiversity performance-based subsidies, preferential market access for ecologically friendly projects (e.g., those using native species or mixed-species plantations), and participatory forest management schemes involving community co-governance. These measures can motivate project developers, local communities, and regulatory agencies to jointly pursue both climate and biodiversity goals, especially in regions with high dependence on natural resources.

4.3. Limitations of This Study

Although this study systematically evaluates the impact of forest carbon offset projects on the ecosystem service value of biodiversity based on long-term county-level panel data, several limitations remain. First, due to the broad geographic coverage and long temporal span of the study area, it is practically challenging to obtain standardized, complete, and traceable data on species richness or habitat conditions. As a result, this study did not adopt direct biodiversity indicators but instead used the monetized ecosystem service value of forest biodiversity as a proxy measure. Second, limited by the lack of long-term and consistent mechanism observation data for the control group, the study was unable to conduct empirical identification using mechanism variables. Instead, it employed indirect strategies through moderation effect analysis and heterogeneity analysis. In the future, as high-resolution ecological data (e.g., dynamic species inventories, habitat integrity indices) become increasingly available, incorporating multidimensional biodiversity indicators and micro-level stakeholder data will facilitate a more detailed understanding of the ecological co-benefits of forest carbon offset projects. Further research could also expand through cross-regional comparisons and the inclusion of international case studies, particularly by contrasting the empirical findings from Sichuan Province with regions characterized by different natural and socio-economic conditions, thereby enhancing the external validity and policy relevance of the conclusions.

5. Conclusions

Based on panel data from 128 county-level administrative regions in Sichuan Province, China, spanning from 2000 to 2020, this study systematically examines whether forest carbon offset projects have generated co-benefits for biodiversity conservation by employing a staggered DID model. The results reveal three main findings. First, the implementation of forest carbon offset projects did not yield the expected biodiversity co-benefits. During the sample period, the projects, on average, led to a 55.1% decline in the ecosystem service value of forest biodiversity within the counties where they were implemented. Further heterogeneity analysis shows that this negative impact is particularly pronounced in areas facing intense agricultural land use pressure and livestock farming stress. Second, although forest carbon offset projects certified for biodiversity conservation also exhibited negative effects, the magnitude of the decline was significantly smaller compared to uncertified projects, and certified projects demonstrated superior performance in terms of carbon stock gains. Third, the negative impact of forest carbon offset projects on the ecosystem service value of biodiversity exhibited a significant spatial spillover effect within an 80 km radius, with the effect diminishing as distance increased. In addition, dynamic effect tests indicate that the detrimental impact on biodiversity ecosystem service value is lagged, becoming statistically significant in the fifth year after project implementation and persisting thereafter. These main findings are robust to multiple checks, including synthetic DID models, instrumental variable approaches, placebo tests, alternative dependent variable specifications, the exclusion of confounding policy effects, and the treatment of heterogeneous effects.

Supplementary Materials

The following supporting information can be downloaded at: https://www.mdpi.com/article/10.3390/f16081274/s1, references [51,52,53].

Author Contributions

Q.W.: conceptualization, writing—original draft, writing—review and editing; Y.H.: writing—review and editing, Supervision, project administration, funding acquisition; R.C.: methodology, software, writing—review and editing; W.Z.: validation, formal analysis, investigation, resources, supervision, project administration, funding acquisition; Y.C.: methodology, software, formal analysis, investigation, resources. All authors have read and agreed to the published version of the manuscript.

Funding

This research was funded by the National Office for Philosophy and Social Sciences [22BJY129, 23CJY061] and the Sichuan Provincial Key Research Base Project for Social Sciences [CR2410].

Data Availability Statement

Data will be made available on request.

Conflicts of Interest

The authors declare no conflicts of interest.

References

  1. Arneth, A.; Shin, Y.-J.; Leadley, P.; Rondinini, C.; Bukvareva, E.; Kolb, M.; Midgley, G.F.; Oberdorff, T.; Palomo, I.; Saito, O. Post-2020 Biodiversity Targets Need to Embrace Climate Change. Proc. Natl. Acad. Sci. USA 2020, 117, 30882–30891. [Google Scholar] [CrossRef]
  2. Mooney, H.; Larigauderie, A.; Cesario, M.; Elmquist, T.; Hoegh-Guldberg, O.; Lavorel, S.; Mace, G.M.; Palmer, M.; Scholes, R.; Yahara, T. Biodiversity, Climate Change, and Ecosystem Services. Curr. Opin. Environ. Sustain. 2009, 1, 46–54. [Google Scholar] [CrossRef]
  3. Sintayehu, D.W. Impact of Climate Change on Biodiversity and Associated Key Ecosystem Services in Africa: A Systematic Review. Ecosyst. Health Sustain. 2018, 4, 225–239. [Google Scholar] [CrossRef]
  4. Mantyka-pringle, C.S.; Martin, T.G.; Rhodes, J.R. Interactions between Climate and Habitat Loss Effects on Biodiversity: A Systematic Review and Meta-Analysis. Glob. Change Biol. 2012, 18, 1239–1252. [Google Scholar] [CrossRef]
  5. Busch, J.; Godoy, F.; Turner, W.R.; Harvey, C.A. Biodiversity Co-Benefits of Reducing Emissions from Deforestation under Alternative Reference Levels and Levels of Finance. Conserv. Lett. 2011, 4, 101–115. [Google Scholar] [CrossRef]
  6. Díaz, S.; Hector, A.; Wardle, D.A. Biodiversity in Forest Carbon Sequestration Initiatives: Not Just a Side Benefit. Curr. Opin. Environ. Sustain. 2009, 1, 55–60. [Google Scholar] [CrossRef]
  7. Merger, E.; Dutschke, M.; Verchot, L. Options for REDD+ Voluntary Certification to Ensure Net GHG Benefits, Poverty Alleviation, Sustainable Management of Forests and Biodiversity Conservation. Forests 2011, 2, 550–577. [Google Scholar] [CrossRef]
  8. Alexander, S.; Nelson, C.R.; Aronson, J.; Lamb, D.; Cliquet, A.; Erwin, K.L.; Finlayson, C.M.; de Groot, R.S.; Harris, J.A.; Higgs, E.S.; et al. Opportunities and Challenges for Ecological Restoration within REDD+. Restor. Ecol. 2011, 19, 683–689. [Google Scholar] [CrossRef]
  9. Lee, D.-H.; Kim, D.; Kim, S. Characteristics of Forest Carbon Credit Transactions in the Voluntary Carbon Market. Clim. Policy 2018, 18, 235–245. [Google Scholar] [CrossRef]
  10. Grainger, A.; Boucher, D.H.; Frumhoff, P.C.; Laurance, W.F.; Lovejoy, T.; McNeely, J.; Niekisch, M.; Raven, P.; Sodhi, N.S.; Venter, O.; et al. Biodiversity and REDD at Copenhagen. Curr. Biol. 2009, 19, R974–R976. [Google Scholar] [CrossRef]
  11. Paoli, G.D.; Wells, P.L.; Meijaard, E.; Struebig, M.J.; Marshall, A.J.; Obidzinski, K.; Tan, A.; Rafiastanto, A.; Yaap, B.; Ferry Slik, J.; et al. Biodiversity Conservation in the REDD. Carbon Balance Manag. 2010, 5, 7. [Google Scholar] [CrossRef] [PubMed]
  12. He, J.; Wang, J. Certificated Exclusion: Forest Carbon Sequestration Project in Southwest China. J. Peasant Stud. 2023, 50, 2165–2186. [Google Scholar] [CrossRef]
  13. Ma, M.; Haapanen, T.; Singh, R.B.; Hietala, R. Integrating Ecological Restoration into CDM Forestry Projects. Environ. Sci. Policy 2014, 38, 143–153. [Google Scholar] [CrossRef]
  14. Essl, F.; Erb, K.; Glatzel, S.; Pauchard, A. Climate Change, Carbon Market Instruments, and Biodiversity: Focusing on Synergies and Avoiding Pitfalls. WIREs Clim. Change 2018, 9, e486. [Google Scholar] [CrossRef]
  15. Veldman, J.W.; Overbeck, G.E.; Negreiros, D.; Mahy, G.; Le Stradic, S.; Fernandes, G.W.; Durigan, G.; Buisson, E.; Putz, F.E.; Bond, W.J. Where Tree Planting and Forest Expansion Are Bad for Biodiversity and Ecosystem Services. BioScience 2015, 65, 1011–1018. [Google Scholar] [CrossRef]
  16. Sabatini, F.M.; de Andrade, R.B.; Paillet, Y.; Ódor, P.; Bouget, C.; Campagnaro, T.; Gosselin, F.; Janssen, P.; Mattioli, W.; Nascimbene, J.; et al. Trade-Offs between Carbon Stocks and Biodiversity in European Temperate Forests. Glob. Change Biol. 2019, 25, 536–548. [Google Scholar] [CrossRef]
  17. Tinya, F.; Doerfler, I.; de Groot, M.; Heilman-Clausen, J.; Kovács, B.; Mårell, A.; Nordén, B.; Aszalós, R.; Bässler, C.; Brazaitis, G.; et al. A Synthesis of Multi-Taxa Management Experiments to Guide Forest Biodiversity Conservation in Europe. Glob. Ecol. Conserv. 2023, 46, e02553. [Google Scholar] [CrossRef]
  18. Mace, G.M.; Norris, K.; Fitter, A.H. Biodiversity and Ecosystem Services: A Multilayered Relationship. Trends Ecol. Evol. 2012, 27, 19–26. [Google Scholar] [CrossRef]
  19. Costanza, R.; d’Arge, R.; de Groot, R.; Farber, S.; Grasso, M.; Hannon, B.; Limburg, K.; Naeem, S.; O’Neill, R.V.; Paruelo, J.; et al. The Value of the World’s Ecosystem Services and Natural Capital. Nature 1997, 387, 253–260. [Google Scholar] [CrossRef]
  20. Tongqian, Z.; Zhiyun, O.; Liangqing, J.; Hua, Z. Ecosystem Services and Their Valuation of China Grassland. Acta Ecol. Sin. 2004, 24, 1101–1110. [Google Scholar]
  21. Costanza, R.; de Groot, R.; Sutton, P.; van der Ploeg, S.; Anderson, S.J.; Kubiszewski, I.; Farber, S.; Turner, R.K. Changes in the Global Value of Ecosystem Services. Glob. Environ. Change 2014, 26, 152–158. [Google Scholar] [CrossRef]
  22. Xie, G.; Zhen, L.; LU, C.; Xiao, Y.; Chen, C. Expert Knowledge Based Valuation Method of Ecosystem Services in China. J. Nat. Resour. 2008, 23, 911–919. [Google Scholar] [CrossRef]
  23. Xie, G.; Lu, C.-X.; Leng, Y.-F.; Zheng, D.; Li, S. Ecological Assets Valuation of the Tibetan Plateau. J. Nat. Resour. 2003, 18, 189–196. [Google Scholar] [CrossRef]
  24. Xie, H.; He, Y.; Xie, X. Exploring the Factors Influencing Ecological Land Change for China’s Beijing–Tianjin–Hebei Region Using Big Data. J. Clean. Prod. 2017, 142, 677–687. [Google Scholar] [CrossRef]
  25. Panfil, S.N.; Harvey, C.A. REDD+ and Biodiversity Conservation: A Review of the Biodiversity Goals, Monitoring Methods, and Impacts of 80 REDD+ Projects: Biodiversity Conservation in REDD+ Projects. Conserv. Lett. 2016, 9, 143–150. [Google Scholar] [CrossRef]
  26. Arkhangelsky, D.; Athey, S.; Hirshberg, D.A.; Imbens, G.W.; Wager, S. Synthetic Difference-in-Differences. Am. Econ. Rev. 2021, 111, 4088–4118. [Google Scholar] [CrossRef]
  27. Callaway, B.; Sant’Anna, P.H.C. Difference-in-Differences with Multiple Time Periods. J. Econom. 2021, 225, 200–230. [Google Scholar] [CrossRef]
  28. Magnago, L.F.S.; Magrach, A.; Laurance, W.F.; Martins, S.V.; Meira-Neto, J.A.A.; Simonelli, M.; Edwards, D.P. Would Protecting Tropical Forest Fragments Provide Carbon and Biodiversity Cobenefits under REDD+? Glob. Change Biol. 2015, 21, 3455–3468. [Google Scholar] [CrossRef]
  29. Phelps, J.; Webb, E.L.; Adams, W.M. Biodiversity Co-Benefits of Policies to Reduce Forest-Carbon Emissions. Nat. Clim. Change 2012, 2, 497–503. [Google Scholar] [CrossRef]
  30. Palomo, I.; Dujardin, Y.; Midler, E.; Robin, M.; Sanz, M.J.; Pascual, U. Modeling Trade-Offs across Carbon Sequestration, Biodiversity Conservation, and Equity in the Distribution of Global REDD+ Funds. Proc. Natl. Acad. Sci. USA 2019, 116, 22645–22650. [Google Scholar] [CrossRef]
  31. Sarira, T.V.; Zeng, Y.; Neugarten, R.; Chaplin-Kramer, R.; Koh, L.P. Co-Benefits of Forest Carbon Projects in Southeast Asia. Nat. Sustain. 2022, 5, 393–396. [Google Scholar] [CrossRef]
  32. Ng, C.N.; Xie, Y.J.; Yu, X.J. Integrating Landscape Connectivity into the Evaluation of Ecosystem Services for Biodiversity Conservation and Its Implications for Landscape Planning. Appl. Geogr. 2013, 42, 1–12. [Google Scholar] [CrossRef]
  33. Beck, T.; Levine, R.; Levkov, A. Big Bad Banks? The Winners and Losers from Bank Deregulation in the United States. J. Financ. 2010, 65, 1637–1667. [Google Scholar] [CrossRef]
  34. Greenaway-McGrevy, R.; Phillips, P.C.B. The Impact of Upzoning on Housing Construction in Auckland. J. Urban Econ. 2023, 136, 103555. [Google Scholar] [CrossRef]
  35. Costanza, R.; Fisher, B.; Mulder, K.; Liu, S.; Christopher, T. Biodiversity and Ecosystem Services: A Multi-Scale Empirical Study of the Relationship between Species Richness and Net Primary Production. Ecol. Econ. 2007, 61, 478–491. [Google Scholar] [CrossRef]
  36. Liu, J.; Coomes, D.A.; Gibson, L.; Hu, G.; Liu, J.; Luo, Y.; Wu, C.; Yu, M. Forest Fragmentation in China and Its Effect on Biodiversity. Biol. Rev. 2019, 94, 1636–1657. [Google Scholar] [CrossRef] [PubMed]
  37. Roshni, N.A.; Hasan, M.K.; Akter, R.; Prodhan, A.K.M.A.-U.-D.; Sagar, A. Impacts of Industrialization on Plant Species Composition, Diversity, and Tree Population Structure in Tropical Moist Deciduous Forest in Bangladesh. Int. J. For. Res. 2022, 2022, 3959617. [Google Scholar] [CrossRef]
  38. Brockerhoff, E.G.; Jactel, H.; Parrotta, J.A.; Quine, C.P.; Sayer, J. Plantation Forests and Biodiversity: Oxymoron or Opportunity? Biodivers. Conserv. 2008, 17, 925–951. [Google Scholar] [CrossRef]
  39. Osawa, T.; Kohyama, K.; Mitsuhashi, H. Trade-off Relationship between Modern Agriculture and Biodiversity: Heavy Consolidation Work Has a Long-Term Negative Impact on Plant Species Diversity. Land Use Policy 2016, 54, 78–84. [Google Scholar] [CrossRef]
  40. Bianchi, F.J.J.A.; Mikos, V.; Brussaard, L.; Delbaere, B.; Pulleman, M.M. Opportunities and Limitations for Functional Agrobiodiversity in the European Context. Environ. Sci. Policy 2013, 27, 223–231. [Google Scholar] [CrossRef]
  41. Luck, G.W. A Review of the Relationships between Human Population Density and Biodiversity. Biol. Rev. 2007, 82, 607–645. [Google Scholar] [CrossRef]
  42. Liu, X.; Trogisch, S.; He, J.-S.; Niklaus, P.A.; Bruelheide, H.; Tang, Z.; Erfmeier, A.; Scherer-Lorenzen, M.; Pietsch, K.A.; Yang, B.; et al. Tree Species Richness Increases Ecosystem Carbon Storage in Subtropical Forests. Proc. R. Soc. B Biol. Sci. 2018, 285, 20181240. [Google Scholar] [CrossRef]
  43. Pawson, S.M.; Brin, A.; Brockerhoff, E.G.; Lamb, D.; Payn, T.W.; Paquette, A.; Parrotta, J.A. Plantation Forests, Climate Change and Biodiversity. Biodivers. Conserv. 2013, 22, 1203–1227. [Google Scholar] [CrossRef]
  44. Wang, X.; Hua, F.; Wang, L.; Wilcove, D.S.; Yu, D.W. The Biodiversity Benefit of Native Forests and Mixed-Species Plantations over Monoculture Plantations. Divers. Distrib. 2019, 25, 1721–1735. [Google Scholar] [CrossRef]
  45. Galik, C.S.; Baker, J.S.; Daigneault, A.; Latta, G. Crediting Temporary Forest Carbon: Retrospective and Empirical Perspectives on Accounting Options. Front. For. Glob. Change 2022, 5, 933020. [Google Scholar] [CrossRef]
  46. Cagnoni, L.B.; Weidlich, E.W.A.; Guillemot, J.; Morselo, C.; Weih, M.; Adler, A.; Brancalion, P.H.S. Stakeholders’ Perspectives of Species Diversity in Tree Plantations: A Global Review. Curr. For. Rep. 2023, 9, 251–262. [Google Scholar] [CrossRef]
  47. Lin, D.; Lin, Y. Stakeholders of Voluntary Forest Carbon Offset Projects in China: An Empirical Analysis. Adv. Meteorol. 2015, 2015, 518698. [Google Scholar] [CrossRef]
  48. Chia, E.L.; Fobissie, K.; Kanninen, M. Exploring Opportunities for Promoting Synergies between Climate Change Adaptation and Mitigation in Forest Carbon Initiatives. Forests 2016, 7, 24. [Google Scholar] [CrossRef]
  49. Liu, S.; Zhang, H.; Xie, F.; Guo, S. Current Situation and Influencing Factors of Pluriactivity in Mountainous and Hilly Rural Areas of Sichuan Province, China. J. Mt. Sci. 2013, 10, 445–454. [Google Scholar] [CrossRef]
  50. Xu, D.; Cao, S.; Wang, X.; Liu, S. Influences of Labor Migration on Rural Household Land Transfer: A Case Study of Sichuan Province, China. J. Mt. Sci. 2018, 15, 2055–2067. [Google Scholar] [CrossRef]
  51. La Ferrara, E.; Chong, A.; Duryea, S. Soap Operas and Fertility: Evidence from Brazil. Am. Econ. J. Appl. Econ. 2012, 4, 1–31. [Google Scholar] [CrossRef]
  52. De Chaisemartin, C.; d’Haultfoeuille, X. Two-Way Fixed Effects Estimators with Heterogeneous Treatment Effects. Am. Econ. Rev. 2020, 110, 2964–2996. [Google Scholar] [CrossRef]
  53. Li, B.; Gasser, T.; Ciais, P.; Piao, S.; Tao, S.; Balkanski, Y.; Hauglustaine, D.; Boisier, J.-P.; Chen, Z.; Huang, M.; et al. The Contribution of China’s Emissions to Global Climate Forcing. Nature 2016, 531, 357–361. [Google Scholar] [CrossRef]
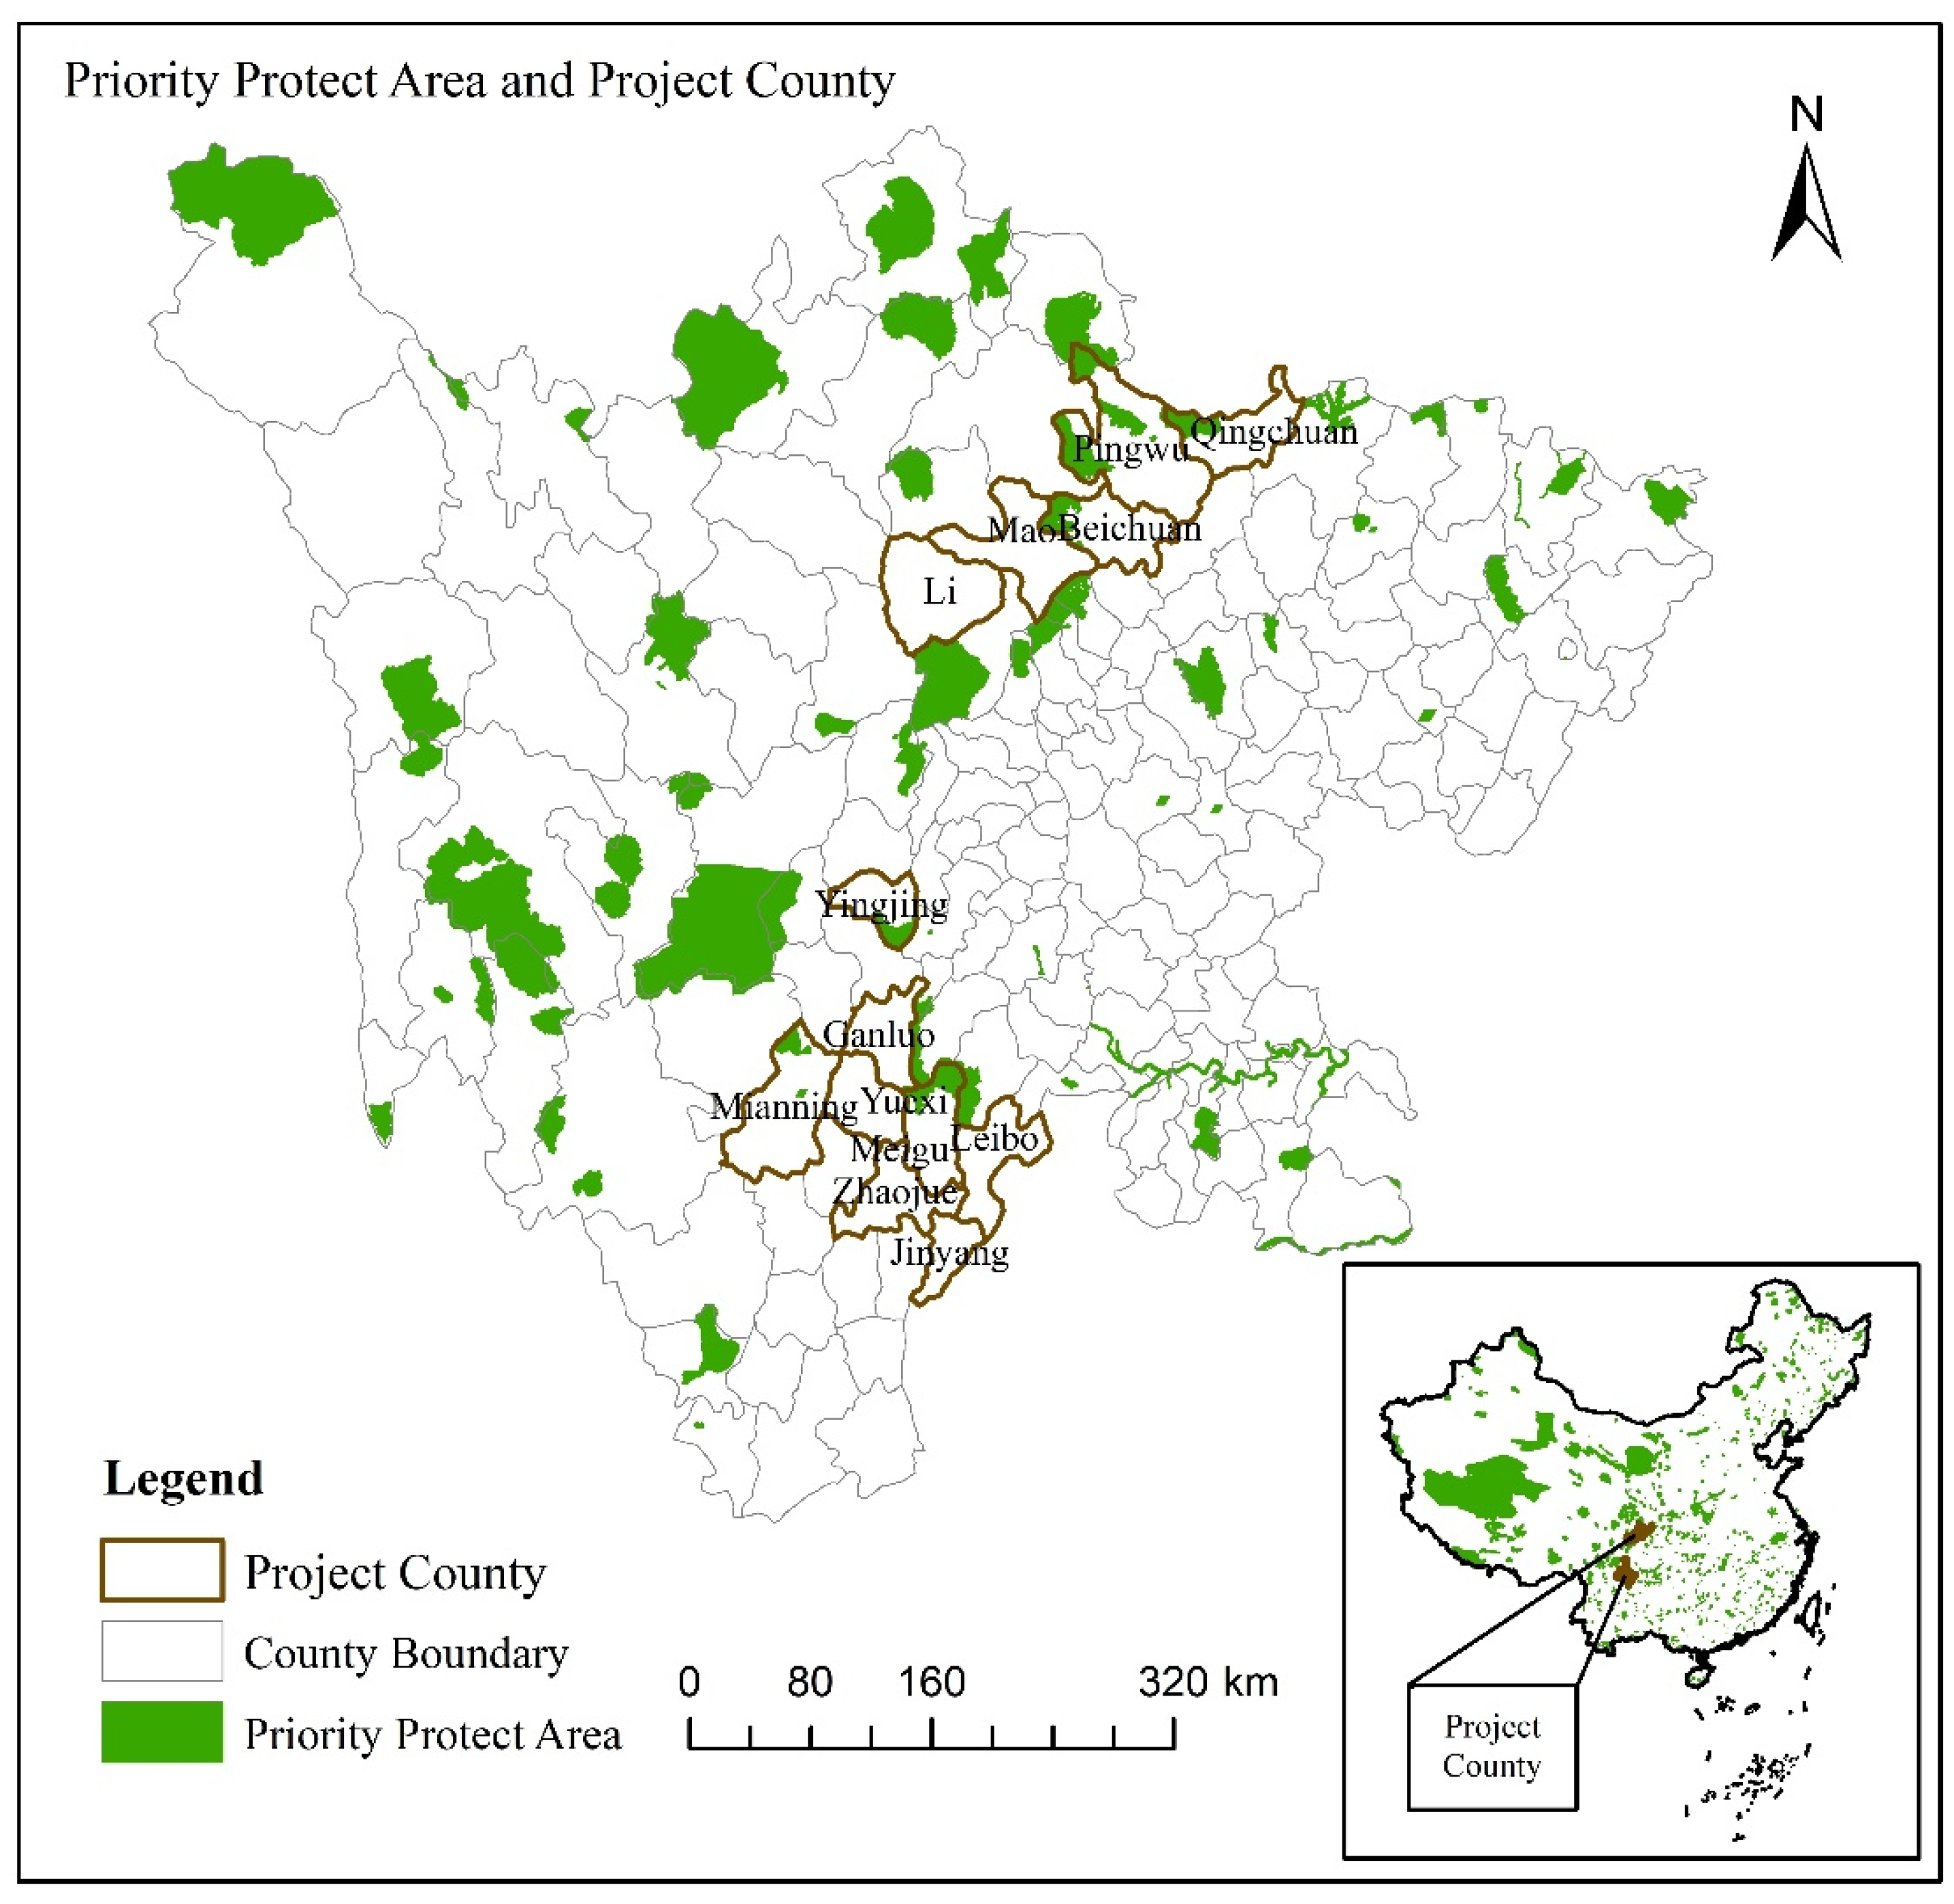
Figure 1. Distribution map of forest carbon offset projects by county.
Forests 16 01274 g001
Figure 2. Parallel trend tests.
Forests 16 01274 g002
Figure 3. Parallel trend tests with CCB Standard.
Forests 16 01274 g003
Figure 4. Spatial spillover effects of forest carbon offset projects. Notes: The vertical solid lines represent the 95% confidence intervals.
Forests 16 01274 g004
Table 1. Basic information of forest carbon offset projects in Sichuan Province.
Project NameCountyProject TypeCCBStart YearAccounting Period (Years) Coverage Area (ha)
China Northwestern Sichuan Degraded Land Afforestation and Reforestation ProjectLiCDMYes200420747.8
MaoCDMYes200420234.9
BeichuanCDMYes200420200.2
QingchuanCDMYes200420878.3
PingwuCDMYes200420190.6
Novartis Southwestern Sichuan Degraded Land Afforestation and Reforestation ProjectGanluoCDMYes201030924.3
YuexiCDMYes2010301245
MeiguCDMYes201030731.6
ZhaojueCDMYes201030441.8
LeiboCDMYes201030854.1
Sichuan Province Yingjing County Reforestation ProjectYingjingVCSNo201130159.2
Audi Panda Habitat Multi-Benefit Forest Restoration and Carbon Offset ProjectMianningCCERNo201230153.4
JinyangCCERNo201230181.7
Note: Multiple counties may correspond to the same afforestation and reforestation project plan certified by CCB. Specifically, there are two CCB-certified project plans covering multiple counties.
Table 2. Descriptive statistics.
VariableDefinitionObs.MeanSdv.MinMax
Dependent Variablelnbio_esvBiodiversity Conservation Value (Million CNY) (ln)10246.0283.3310.00213.952
Independent VariableFCOPWhether the county is implementing a forest carbon offset project10240.0700.25601
Control VariablesforestForest Area Coverage (%)102441.03926.1510.01491.884
temperatureAnnual Average Temperature (°C)102416.2623.9532.21421.636
rainfallRainfall (mm)10241041.709247.431480.2262158.709
second_indTotal Industrial Output Above Designated Size/Regional GDP10240.3890.1570.0420.797
agriculture_outputAgricultural Output/Regional GDP10240.3690.2070.0470.869
agriculturepowerTotal Agricultural Machinery Power (Kilowatt) (ln)10242.6280.9180.6934.605
populationRegistered Population/Administrative Land Area (Square Kilometers)10240.0260.0250.0010.109
Moderating Variablesagricultural land pressureCultivated Land Area per Permanent Resident102413.8927.3290.00337.546
livestock intensityLarge Livestock Slaughter Number (ln)101011.0721.0906.63913.819
Table 3. Regression results based on the staggered DID.
VariablesDependent Variable: lnbio_esv
(1)(2)
FCOP−0.924 ***−0.801 ***
(0.236)(0.230)
Constant6.093 ***9.699 ***
(0.017)(2.172)
Control VariablesNOYES
County FEYESYES
Year FEYESYES
Observations10241024
R-squared0.8550.865
Notes: *** p < 1%. The values in parentheses are standard errors, and standard errors are clustered at the county level.
Table 4. Analysis of moderating effects.
VariablesDependent Variable: lnbio_esv
(1)(2)
FCOP X Livestock Intensity−0.378 *
(0.220)
FCOP X Agricultural Land Pressure 0.082 *
(0.046)
FCOP−0.645 ***−1.387 ***
(0.240)(0.409)
Constant9.029 ***11.908 ***
(2.563)(3.242)
Control VariablesYESYES
County FEYESYES
Year FEYESYES
Observations10101024
R-squared0.8640.867
Notes: *** p < 1% and * p < 10%. The values in parentheses are standard errors, and standard errors are clustered at the county level.
Table 5. Forest carbon offset projects with CCB Standard.
VariablesDependent Variable: lnbio_esv
(1)(2)
FCOP−0.854 ***−0.760 ***
(0.312)(0.288)
Constant6.079 ***9.743 ***
(0.019)(2.252)
Control VariablesNOYES
County FEYESYES
Year FEYESYES
Observations10001000
R-squared0.8530.864
Notes: *** p < 1%. The values in parentheses are standard errors, and standard errors are clustered at the county level.
Table 6. Heterogeneity analysis based on different afforestation models.
Variables(1)
Monocultures
(2)
Native Species
esv_bioesv_bio
FCOP−0.990 ***0.533 **
(0.242)(0.258)
Constant9.781 ***9.491 ***
(2.186)(2.338)
Control VariablesYESYES
County FEYESYES
Year FEYESYES
Observations1000944
R-squared0.8650.862
Notes: *** p < 1% and ** p < 5%. The values in parentheses are standard errors, and standard errors are clustered at the county level.
Table 7. Trade-offs and synergies between biodiversity conservation and carbon benefits.
VariablesCCBNON-CCB
(1)(2)(3)(4)
lncarbonstocklnbio_esvlncarbonstocklnbio_esv
FCOP0.181 ***−0.760 ***0.025−0.806 ***
(0.043)(0.288)(0.031)(0.292)
Constant0.635 ***9.743 ***0.582 ***9.265 ***
(0.114)(2.252)(0.105)(2.252)
Control VariablesYESYESYESYES
County FEYESYESYESYES
Year FEYESYESYESYES
Observations8751000833952
R-squared0.9950.8640.9960.865
Notes: *** p < 1%. The values in parentheses are standard errors, and standard errors are clustered at the county level.
Disclaimer/Publisher’s Note: The statements, opinions and data contained in all publications are solely those of the individual author(s) and contributor(s) and not of MDPI and/or the editor(s). MDPI and/or the editor(s) disclaim responsibility for any injury to people or property resulting from any ideas, methods, instructions or products referred to in the content.