Article

Effects of Different Phosphorus Addition Levels on Physiological and Growth Traits of Pinus massoniana (Masson Pine) Seedlings

1
Zhejiang Academy of Forestry, Hangzhou 310023, China
2
Northwest Zhejiang Bamboo Forest Ecosystem Positioning Observation and Research Station, National Forestry and Grassland Administration, Hangzhou 310023, China
3
Thousand-Island Lake Forest Farm of Chun’an County, Hangzhou 311700, China
*
Author to whom correspondence should be addressed.
Forests 2025, 16(8), 1265; https://doi.org/10.3390/f16081265 (registering DOI)
Submission received: 23 June 2025 / Revised: 21 July 2025 / Accepted: 30 July 2025 / Published: 2 August 2025

Abstract

Soil phosphorus (P) availability is an important determinant of productivity in Pinus massoniana (Masson pine) forests. The mechanistic bases governing the physiological and growth responses of Masson pine to varying soil P conditions remain insufficiently characterized. This study aims to decipher the adaptive strategies of Masson pine to different soil P levels, focusing on root morphological–architectural plasticity and the allocation dynamics of nutrient elements and photosynthetic assimilates. One-year-old potted Masson pine seedlings were exposed to four P addition treatments for one year: P0 (0 mg kg−1), P1 (25 mg kg−1), P2 (50 mg·kg−1), and P3 (100 mg kg−1). In July and December, measurements were conducted on seedling organ biomass, root morphological indices [root length (RL), root surface area (RSA), root diameter (RD), specific root length (SRL), and root length ratio (RLR) for each diameter grade], root architectural indices [number of root tips (RTs), fractal dimension (FD), root branching angle (RBA), and root topological index (TI)], as well as the content of nitrogen (N), phosphorus (P), carbon (C), and non-structural carbohydrates (NSCs) in roots, stems, and leaves. Compared with the P0 treatment, P2 and P3 significantly increased root biomass, root–shoot ratio, RL, RSA, RTs, RLR of finer roots (diameter ≤ 0.4 mm), nutrient accumulation ratio in roots, and starch (ST) content in roots, stems and leaves. Meanwhile, they decreased soluble sugar (SS) content, SS/ST ratio, C and N content, and N/P and C/P ratios in stems and leaves, as well as nutrient accumulation ratio in leaves. The P3 treatment significantly reduced RBA and increased FD and SRL. Our results indicated that Masson pine adapts to low P by developing shallower roots with a reduced branching intensity and promoting the conversion of ST to SS. P’s addition effectively alleviates growth limitations imposed by low P, stimulating root growth, branching, and gravitropism. Although a sole P addition promotes short-term growth and P uptake, it triggers a substantial consumption of N, C, and SS, leading to significant decreases in N/P and C/P ratios and exacerbating N’s limitation, which is detrimental to long-term growth. Under high-P conditions, Masson pine strategically prioritizes allocating limited N and SS to roots, facilitating the formation of thinner roots with low C costs.

1. Introduction

Masson pine (Pinus massoniana) represents a pivotal timber species in the subtropical and tropical zones of China, comprising 3.6% of the nation’s total forest area [1]. Known for its relatively rapid growth rate, wide range of applications (including papermaking and construction, among others), and strong adaptability, this species holds considerable economic and ecological significance in China [2]. Phosphorus (P) is a fundamental macronutrient for plants’ growth and development. Forests in subtropical China are predominantly distributed in acidic red soils, which are characterized by an extremely low available P content. This nutritional constraint of the soil has emerged as a critical limiting factor for the productivity of Masson pine plantations in the region [3]. Studies have found that supplementing phosphate fertilizer could increase the volume of young-aged and middle-aged Masson pine forests by 33.6% and 24.5%, respectively [4,5]. Nonetheless, the excessive application of P fertilizer not only inflates forestry production costs but also precipitates ecological ramifications such as soil eutrophication [6]. Therefore, clarifying the response mechanisms of Masson pine to different soil P levels in terms of physiological growth can help provide rational fertilization strategies for Masson pine in P-deficient soils to increase yields and also reduce the risk of ecological damage to the soil caused by the excessive application of P fertilizer.
Plants enhance their low-P adaptability via morphological and physiological compensatory mechanisms. Morphologically, for example, they adapt to P limitations by shortening taproots, reducing root diameters, increasing root density, and promoting root hairs’ proliferation/elongation [7,8]. A reduction in root diameter can lower root construction costs, which helps plants experiencing carbon starvation induced by phosphorus deficiency to maintain their basic root absorption capacity [9]. Architecturally, they may form shallow “umbrella-shaped” roots to forage P in rich layers or cluster roots (via increased lateral root density) to expand the absorption area [10,11]. In contrast, P’s supplementation can alleviate P deficiency stress, mitigate such compensatory adjustments, and promote root elongation by increasing auxin levels in root tips, activating the expression of cell elongation-related genes, and other mechanisms [12,13,14]. However, existing studies only infer root architecture changes by analyzing root density and distribution across soil layers. A significant research gap remains regarding plant root architectural plasticity under different soil P conditions—such as root branching direction, intensity, and patterns—which have not been quantified using indices like root branching angle, topological index, and fractal dimension [15,16]. Previous studies have found that Masson pine exhibits a strong physiological and growth plasticity under low-P stress. For example, low P alters the root–shoot ratio, root morphology, antioxidant enzyme activity, and root vitality of Masson pine [17]. However, none of these studies have addressed the responses of the root morphology and architecture of Masson pine to varying soil P levels.
Root growth limitation caused by low P further hinders plants’ acquisition of other nutrient elements (e.g., nitrogen, potassium) [18]. In addition, accelerated plant growth under high-P conditions leads to the excessive consumption of other resources (e.g., nutrient elements and non-structural carbohydrates (NSCs)) [19]. These may all become limiting factors for plant growth and deserve priority attention. The “Resource Optimization Hypothesis” holds that allocating limited nutrients and photosynthates to fast-growing and functionally active organs, such as root tips, young leaves, and shoot apical meristems, can maximize the survival and reproduction probability of plants [20,21,22,23,24,25]. For Masson pine, previous studies have mainly focused on the effects of low P on biomass allocation and the expression of genes related to P’s transport and absorption [26,27,28]. However, the nutrient and photosynthate allocation strategies of Masson pine under varying soil P conditions, and the relationship between these strategies and the plasticity of its growth and root morphology, remain poorly understood.
In summary, existing studies on the effects of soil P on Masson pine lack analyses of root architectural traits across different growth stages, thus failing to quantify the strategic transition mechanisms of root architecture in Masson pine under varying soil P levels. Additionally, due to the absence of research on nutrient element and photosynthate allocation strategies, it is also difficult to clarify how Masson pine balances resource investment among different functional organs. This study aims to dissect the adaptive mechanisms of Masson pine to different soil P conditions by comprehensively investigating biomass accumulation, morphological plasticity, nutrient allocation, and carbon–photosynthate allocation strategies of Masson pine at different developmental stages under varying soil P levels.

2. Materials and Methods

2.1. Experimental Set Up

The experiment was conducted in a greenhouse at the Research Institute of Subtropical Forestry, Chinese Academy of Forestry (119°57′ E, 29°48′ N), Hangzhou, Zhejiang Province, China. The experimental site is characterized by a typical subtropical monsoon climate, with a frost-free period of 307 days, an average annual sunshine duration of 1663.2 h, an average annual rainfall of 1423 mm, an average relative humidity of 70.3%, and an average annual temperature of 25.3 °C during the experimental period.
The seeds used in this study were collected from the Masson pine forest in Laoshan Forest Farm, Zhejiang Province, with the provenance being Chun’an County, Zhejiang Province. Seeds collected from 10 healthy mother trees in the Masson pine stand were evenly mixed to form a seed pool, where each mother tree accounted for an equal proportion in the seed pool. Seeds were randomly selected from the seed pool, placed on filter paper moistened with deionized water, and then incubated in an incubator at 25 °C for germination. After germination, the seeds were transplanted into seedling trays filled with a substrate composed of peat, vermiculite, and perlite at a ratio of 2:1:1. In April, Masson pine seedlings with a uniform height and basal diameter were selected and transplanted into plastic pots with an inner diameter of 25 cm and a height of 27 cm. Each pot was filled with 6 kg of soil. The soil used in the pot experiment was low-phosphorus acidic red soil collected from the Masson pine forest of Laoshan Forest Farm, Chun’an County, Hangzhou City, Zhejiang Province, to simulate the natural growth environment of Masson pine. The soil sample had a pH of 4.91 and the following physicochemical properties: 16.5 g kg−1 organic carbon, 0.88 g kg−1 total nitrogen, 0.24 g kg−1 total P, 10.5 g kg−1 total potassium, 77.26 mg kg−1 hydrolyzable nitrogen, 2.29 mg kg−1 available P, and 57.62 mg kg−1 available potassium. The soil particle composition is as follows: sand accounts for 35.85%, silt for 35.68%, and clay for 28.47%. In accordance with the World Reference Base for Soil Resources, the soil used in this experiment is classified as loamy clay.
Forty seedlings of Masson pine were allocated into four groups, with 10 seedlings per group, each group subjected to one of the four different phosphate fertilizer dosages (Na2HPO4·H2O), namely 0 (P0), 25 mg kg−1 (P1), 50 mg kg−1 (P2), or 100 mg kg−1 (P3), designated as four treatment groups. According to the nutrient grading standard of the National Soil Census [29], the soil without any fertilizer application (P0) was classified as extremely P-deficient. The fertilizer was divided into three equal portions and applied to the soil in three installments, with a 15-day interval between each fertilization. Each time, the fertilizer was dissolved in 200 mL of clear water and uniformly sprayed onto the soil surface. Soil moisture was precisely regulated by combining the gravimetric method with a sophisticated soil moisture monitoring system (Trime-pico AZS-100, Aozuo Ecological Instruments, Gütersloh, Germany), maintaining it consistently at 80%–85% of the maximum field capacity. All seedlings were maintained under consistent conditions for light, water, and temperature.

2.2. Harvest and Measurements

In July and December of the same year, sampling was performed on 10 seedlings in each treatment group. Five seedlings were sampled each time as five replicates. First, leaves, stems, and roots were separated using scissors. Subsequently, soil attached to the roots was carefully cleaned to avoid damaging root tissues and architecture. The soil was passed through a 2 mm sieve to collect all residual fine roots. Roots, stems, and leaves were sealed in self-sealing bags, placed in an ice box at 0–2 °C, and transported to the laboratory. Root samples were carefully washed with deionized water and softly blotted with filter paper to remove surface moisture, followed by high-resolution scanning at 500 dpi using a dual-sided scanner (Regent Instruments Inc., WinRhizo Pro, Québec, QC, Canada). Root images were analyzed using WinRhizo 2.0 software to determine the roots’ morphological parameters, including root length (RL, cm), root surface area (RSA, cm2), and average root diameter (RD, mm). Additionally, root architectural traits, such as number of root tips (RTs, tips plant−1), number of root links, fractal dimension (FD), and root branching angle (RBA, °), were quantified. The FD was calculated using the box-counting algorithm embedded in the WinRhizo software [30]. Using WinRhizo software, root lengths of eleven diameter grades (including 0–0.2 mm, 0.2–0.4 mm, 0.4–0.6 mm, … >2 mm) were also obtained. The root length ratio (RLR) was calculated by dividing the root length of each diameter class (rl) by the total root length. This study analyzed the root topological architecture by calculating the root topological root topological index (TI) using the following formula. As shown in Figure 1, the two typical root topological patterns—herringbone branching and dichotomous branching—exhibit TI values of 1 and 0.5, respectively [15].
TI = lg (α)/lg (µ)
Root tips were defined as external nodes, whereas branch points were referred to as internal nodes. Correspondingly, root segments between any two nodes were termed links. Links that did not end at a terminal point within the root architecture were classified as internal links, with the remaining designated as external links. External links were further subcategorized as external–external (EE) when extending from other external links or external–internal (EI) when arising from internal links. The altitude (α) was defined as the number of internal links along the longest pathway from the root collar to an external root tip. Meanwhile, the magnitude (µ) represented the total number of external links in the root system, which was equivalent to the RTs [15].
Roots, stems, and leaves were inactivated at 105 °C for 30 min, then oven-dried at a constant temperature of 65 °C to a constant weight to determine the dry mass (biomass) of each organ. Specific root length (SRL) was calculated as the ratio of total root length to root dry weight. After crushing the roots, stems, and leaves of each sample, the content of nitrogen (N), P, carbon (C), and NSCs [including soluble sugars (SSs) and starch (ST)] was determined. N content was measured using the H2O2-H2SO4 digestion method, and P content was determined by vanadium molybdenum yellow colorimetry [31]. C content was measured using the potassium dichromate–sulfuric acid volumetric method [32]. The content of SS and ST was assayed via anthrone colorimetry [33]. The nutrient accumulation ratio was defined as the ratio of nutrient accumulation in a single organ to the total nutrient accumulation in the whole plant. Each sample was subjected to three repeated determinations. The data from these three measurements were considered reliable if their relative deviation was within 5%, and the median of the three values was then taken as the representative value of the sample.

2.3. Statistical Analysis

Statistical analyses of parameter differences and correlations were performed using SPSS 20.0 (SPSS Inc., Chicago, IL, USA). Specifically, factorial analysis of variance (ANOVA) was applied to assess treatment effects on the data, while Pearson’s correlation coefficients were calculated to examine inter-indicator relationships. The Shapiro–Wilk test was employed to validate the normality of residuals prior to parametric analyses.

3. Results

3.1. Effect of Phosphorus Addition on Biomass Allocation

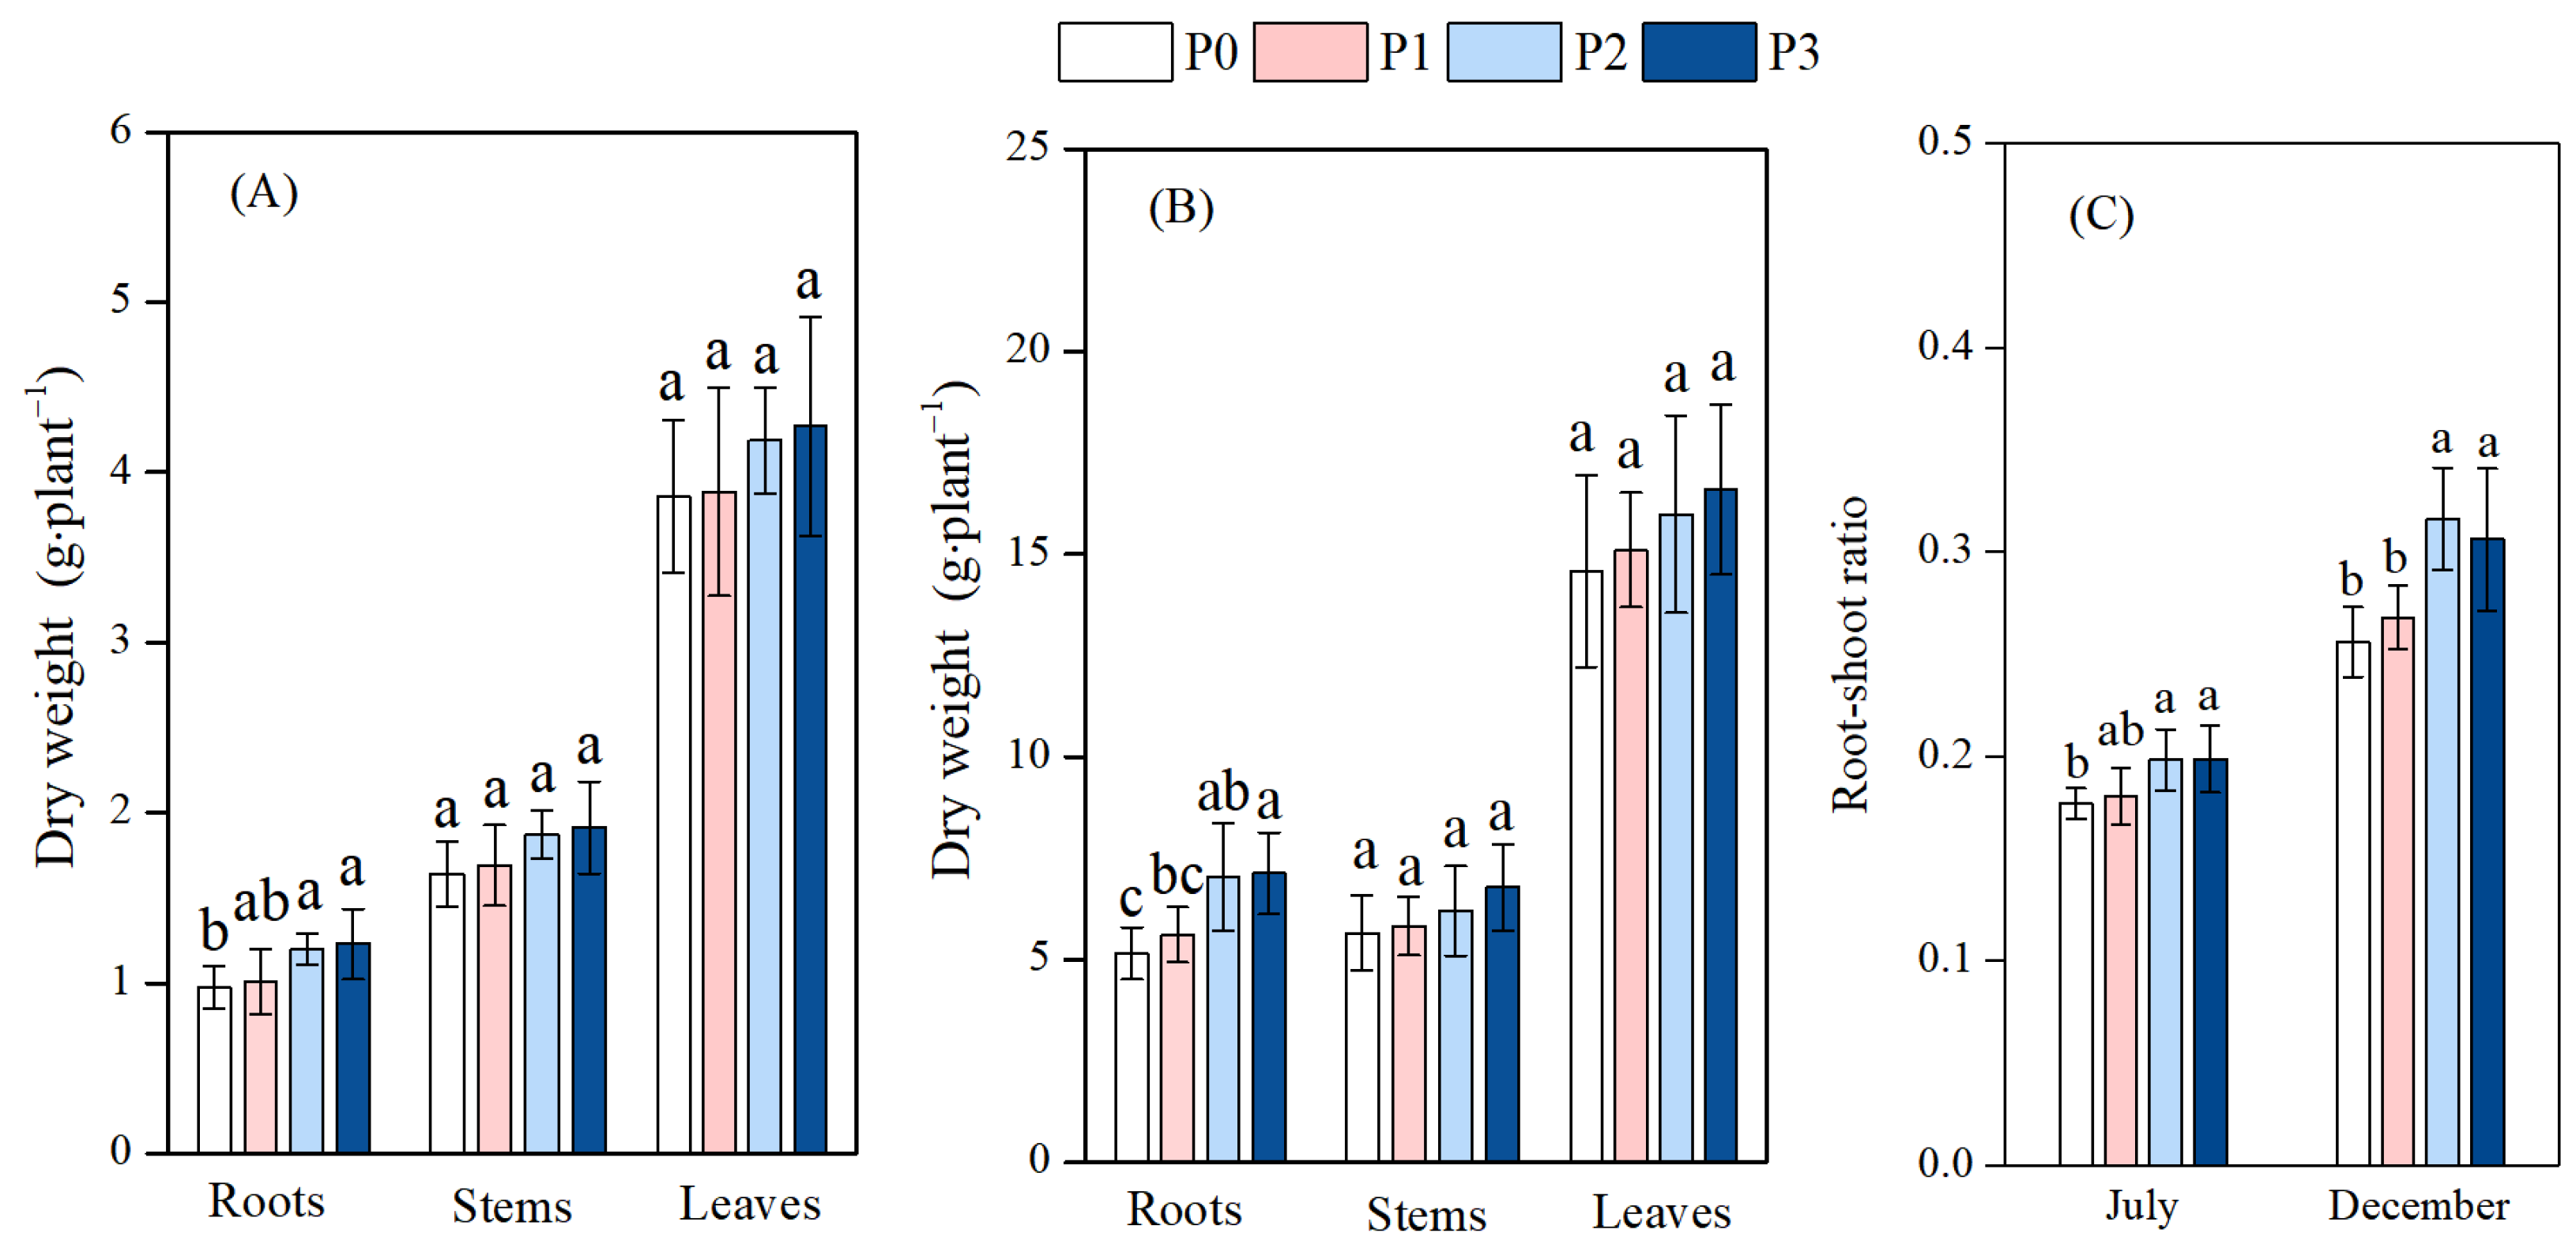
In July, the root biomass and root–shoot ratio gradually increased with the increasing addition of P (Figure 2). Compared with the P0 treatment, the P2 and P3 treatments significantly increased root biomass by 23.2% and 26.2%, respectively. There was no significant difference in root biomass between the P1 and P0 treatments. No significant differences in stems’ and leaves’ biomass were observed between treatments. The results in December were similar to those in July. What differs is that the root biomass under the P4 treatment was significantly greater than that under the P1 treatment. In addition, compared with the P0 treatment, the P2 and P3 treatments significantly increased root biomass by 36.5% and 38.2%, respectively.

3.2. Effect of Phosphorus Addition on the Root Morphology and Architecture

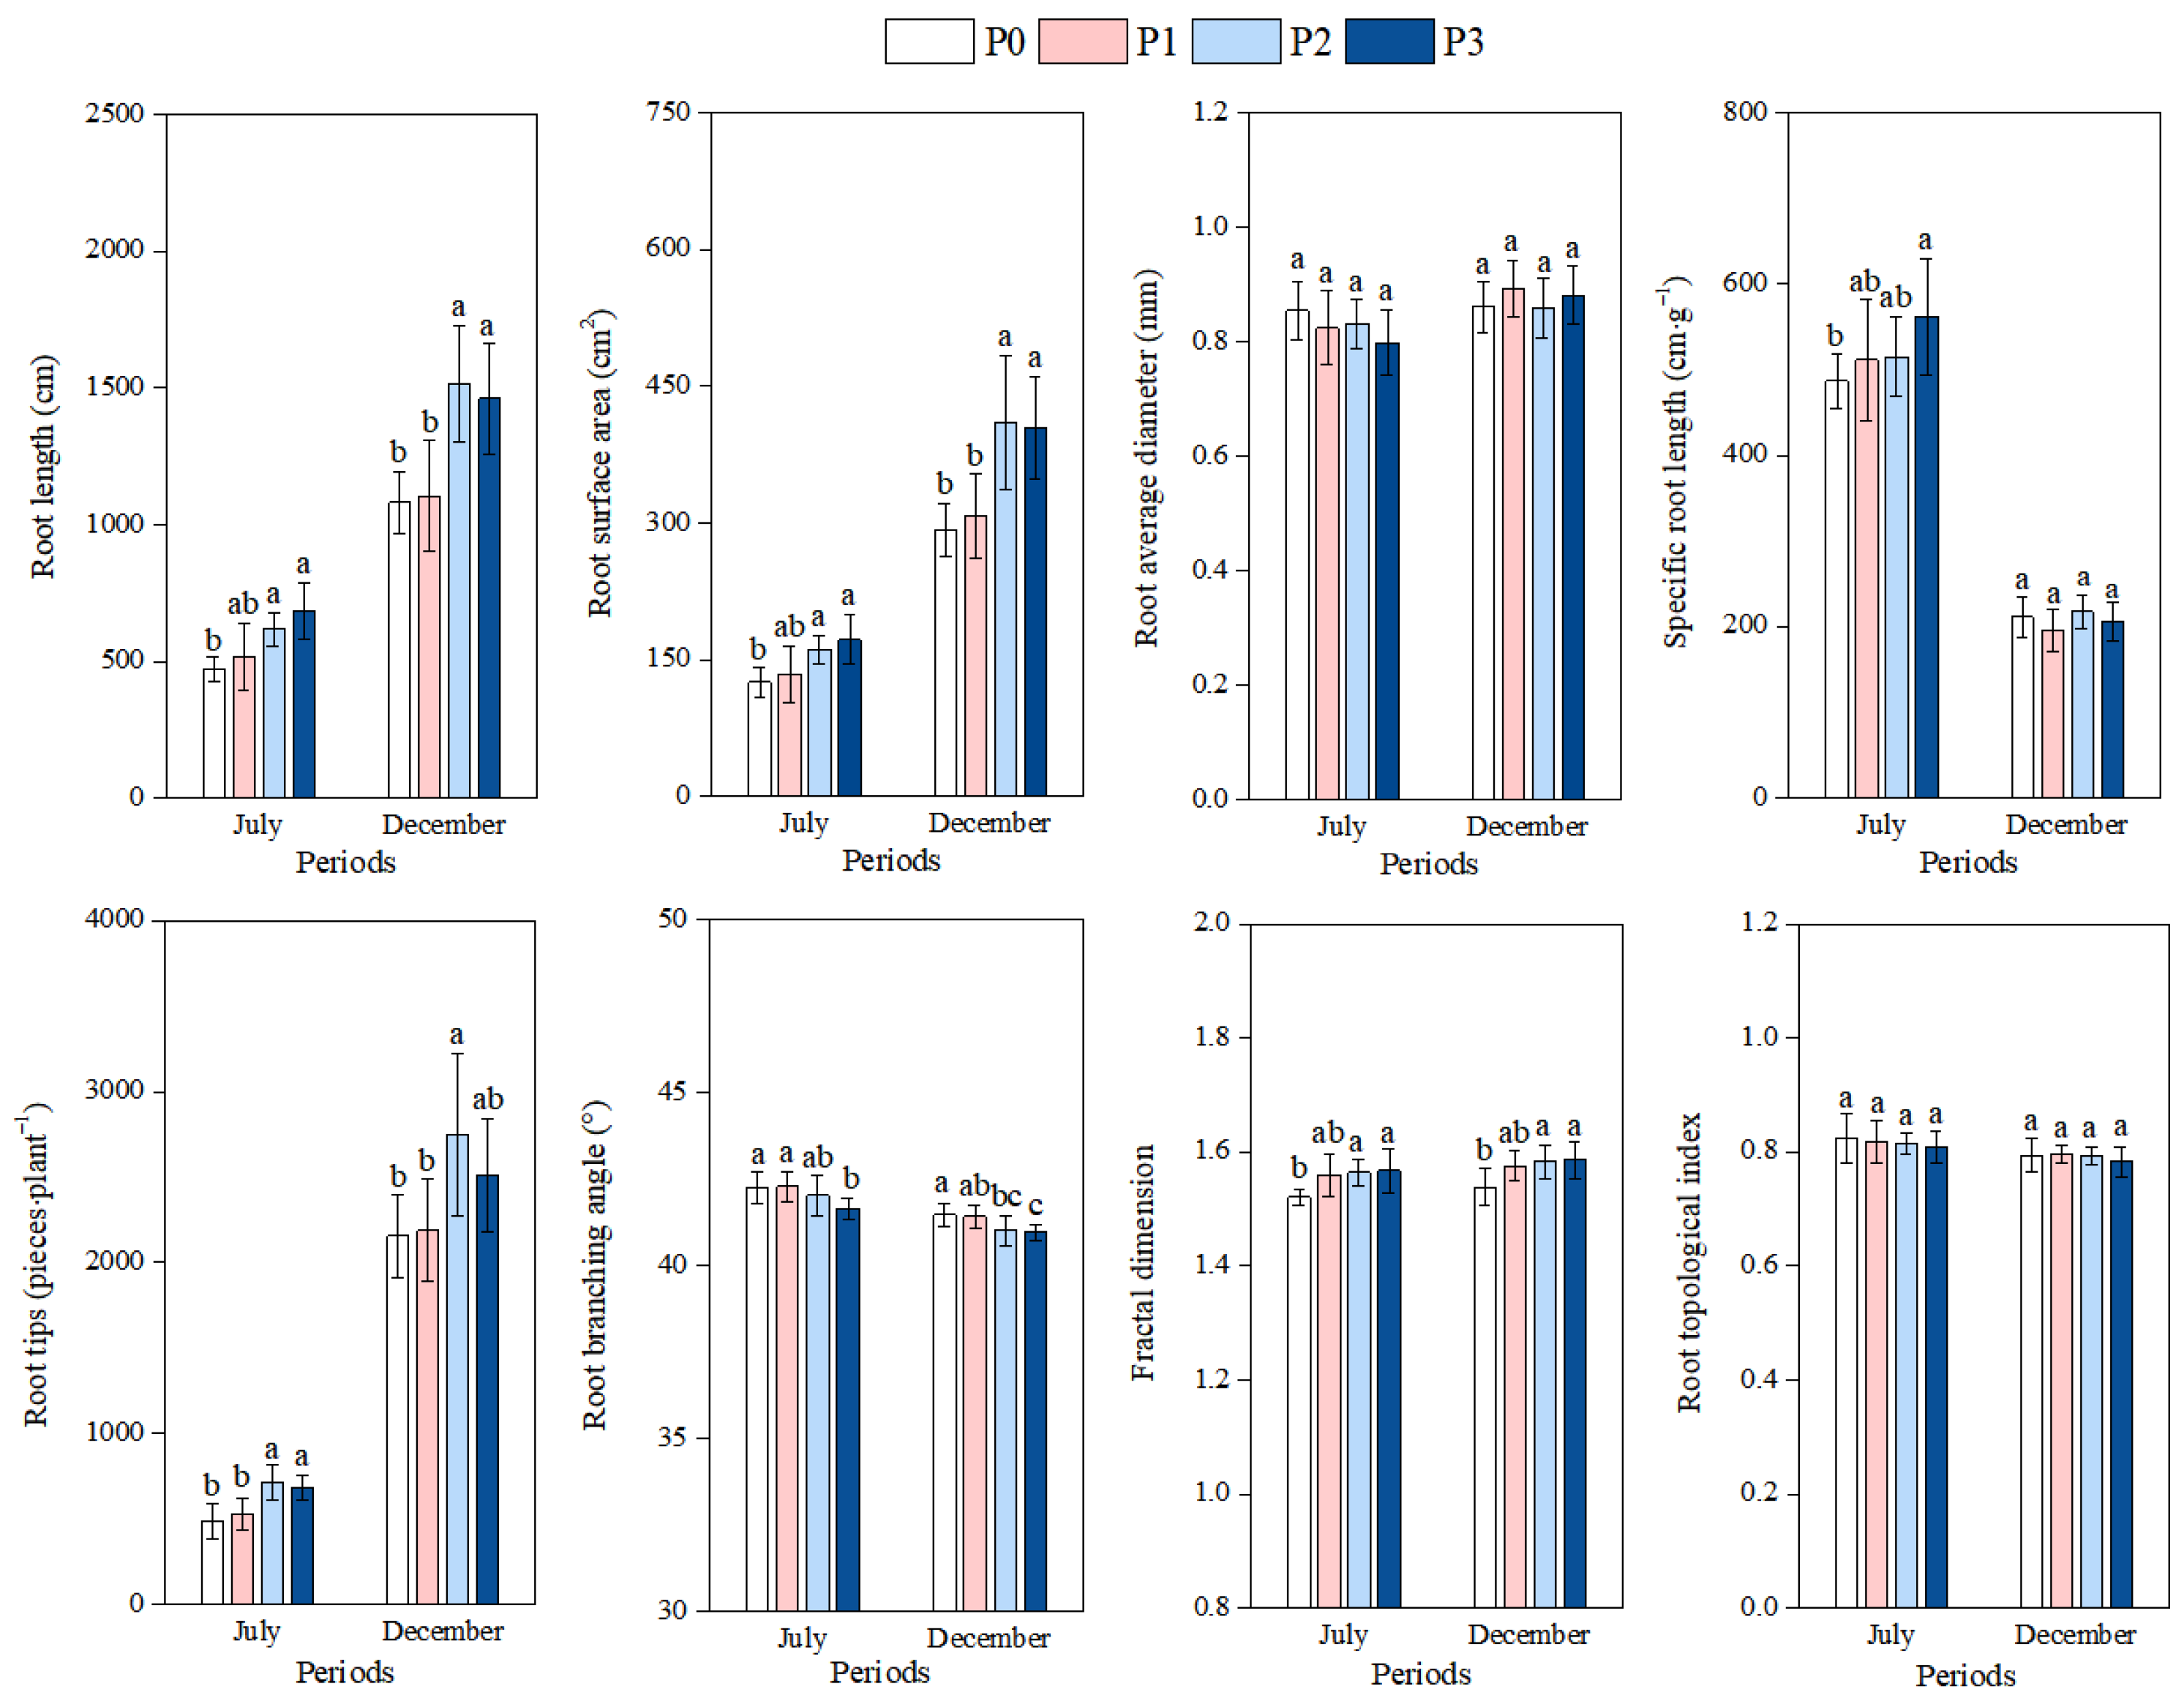
Regarding root morphology, the following results were observed. In July, RL and RSA under the P2 and P3 treatments were significantly greater than those under the P0 treatment; additionally, SRL under the P3 treatment was significantly greater than that under the P0 treatment. In December, RL and RSA under the P2 and P3 treatments were significantly greater than those under the P0 and P1 treatments. No significant differences in SRL were found between any treatments in December. Across both July and December, RD showed no significant differences between treatments (Figure 3).
Regarding root architecture, in July, RTs under P2 and P3 treatments were significantly higher than under P0 and P1. With the increasing addition of P, RBA gradually decreased, while FD gradually increased, and TI showed no significant change. The RBA under the P3 treatment was significantly lower than that under P0 and P1. The results in December were similar to those in July, except that the RBA under the P2 treatment was significantly smaller than that under P0 (Figure 3).
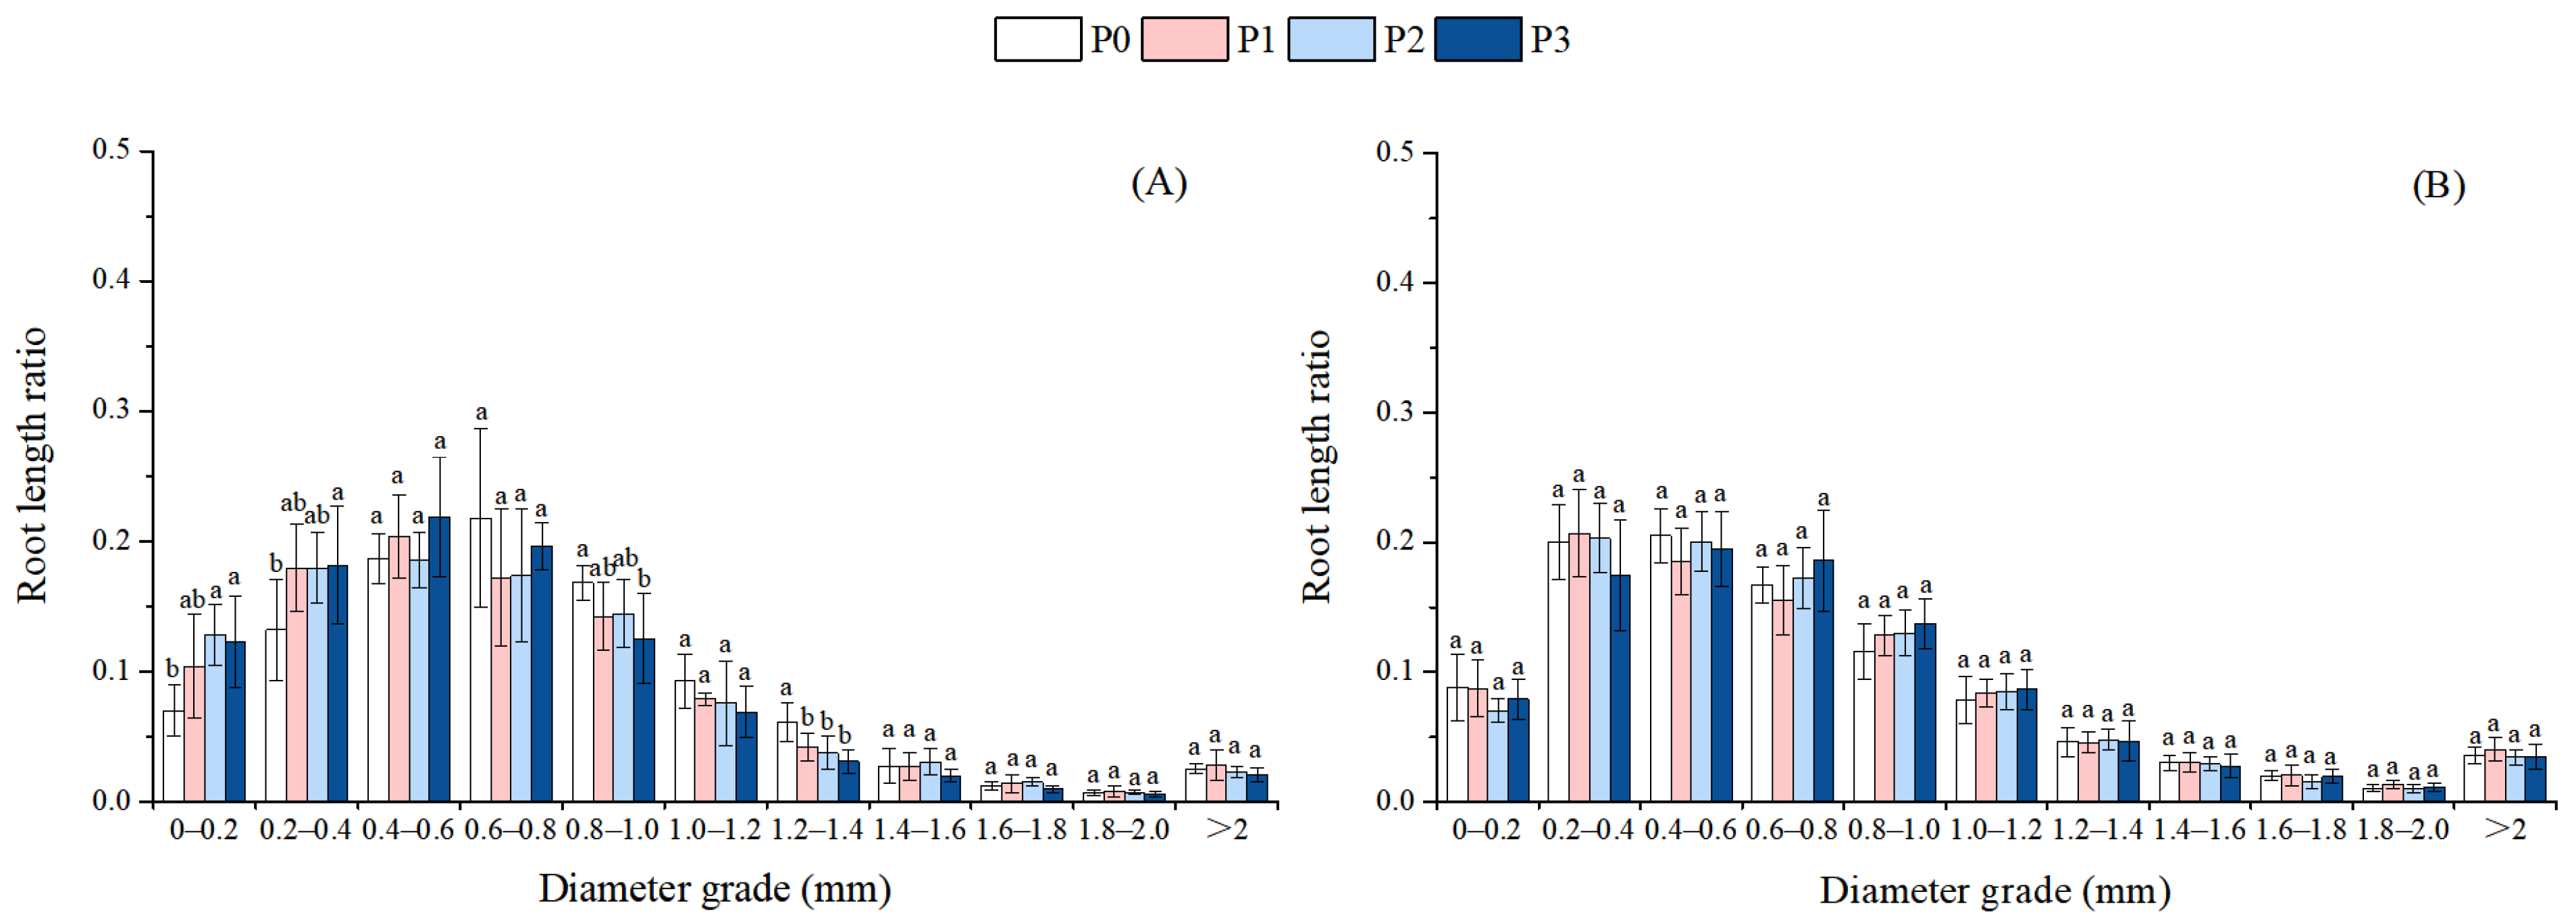
In July, compared with P0, the P2 and P3 treatments significantly increased the RLR of the 0–0.2 mm root diameter grades, and P3 treatments significantly increased the RLR of the 0.2–0.4 mm roots. By contrast, P1, P2, and P3 significantly decreased the RLRs of the 1.2–1.4 mm roots, and P3 significantly decreased the RLRs of the 0.8–1 mm roots. In December, there were no significant differences in the RLRs of each diameter grade between different treatments (Figure 4).

3.3. Effect of Phosphorus Addition on Nutrient Elements and Non-Structural Carbohydrates

In July, with the increase in the addition of P, the P content in roots, stems, and leaves showed an upward trend. In contrast, the N content in stems and leaves and the C content in all three tissues presented a downward trend. Meanwhile, the N/P and C/P ratios in roots, stems, and leaves showed a decreasing trend. In addition, the C/N ratio in leaves showed an increasing trend. There were no significant differences in N content and C/N ratio in roots, nor in C/N ratio in stems and roots, between different treatments. In December, the P addition treatments exhibited more significant effects than those in July. For example, compared with P0, P addition treatments (P1, P2, and P3) significantly increased the P content in roots, stems, and leaves, as well as the C/N ratio in leaves. They also significantly decreased the C content in leaves, the N content in stems and leaves, and the N/P ratio in roots (Table 1).
In both periods, the addition of P had similar effects on NSC content. Compared with the P0, P addition treatments (P1, P2, and P3) significantly increased ST content in roots, stems and leaves, while decreasing SS content in stems and leaves, as well as the SS/ST ratio in roots, stems, and leaves. Notably, root SS content showed no significant differences between treatments in either July or December (Table 2).

3.4. Effect of Phosphorus Addition on the Nutrient Accumulation Ratio

In July, compared with P0, the P2 and P3 treatments significantly reduced the N accumulation ratio in leaves, while increasing it in roots. Both P2 and P3 significantly enhanced the C accumulation ratio in roots, whereas only P2 significantly decreased the C accumulation ratio in leaves. There were no significant differences in the accumulation ratios of N, P, and C in roots, stems, and leaves between the P1 and P0 treatments. P addition treatments showed no significant effects on the P accumulation ratio in the three organs. In December, compared with P0, the P2 and P3 treatments significantly decreased the N, P, and C accumulation ratios in leaves and increased these ratios in roots. There were no significant differences in the accumulation ratios of P and C in roots, stems, and leaves between the P1 and P0 treatments. Compared with P0, the P1 treatment significantly increased the N accumulation ratio in roots (Figure 5).

3.5. Correlation Analysis Among the Indicators

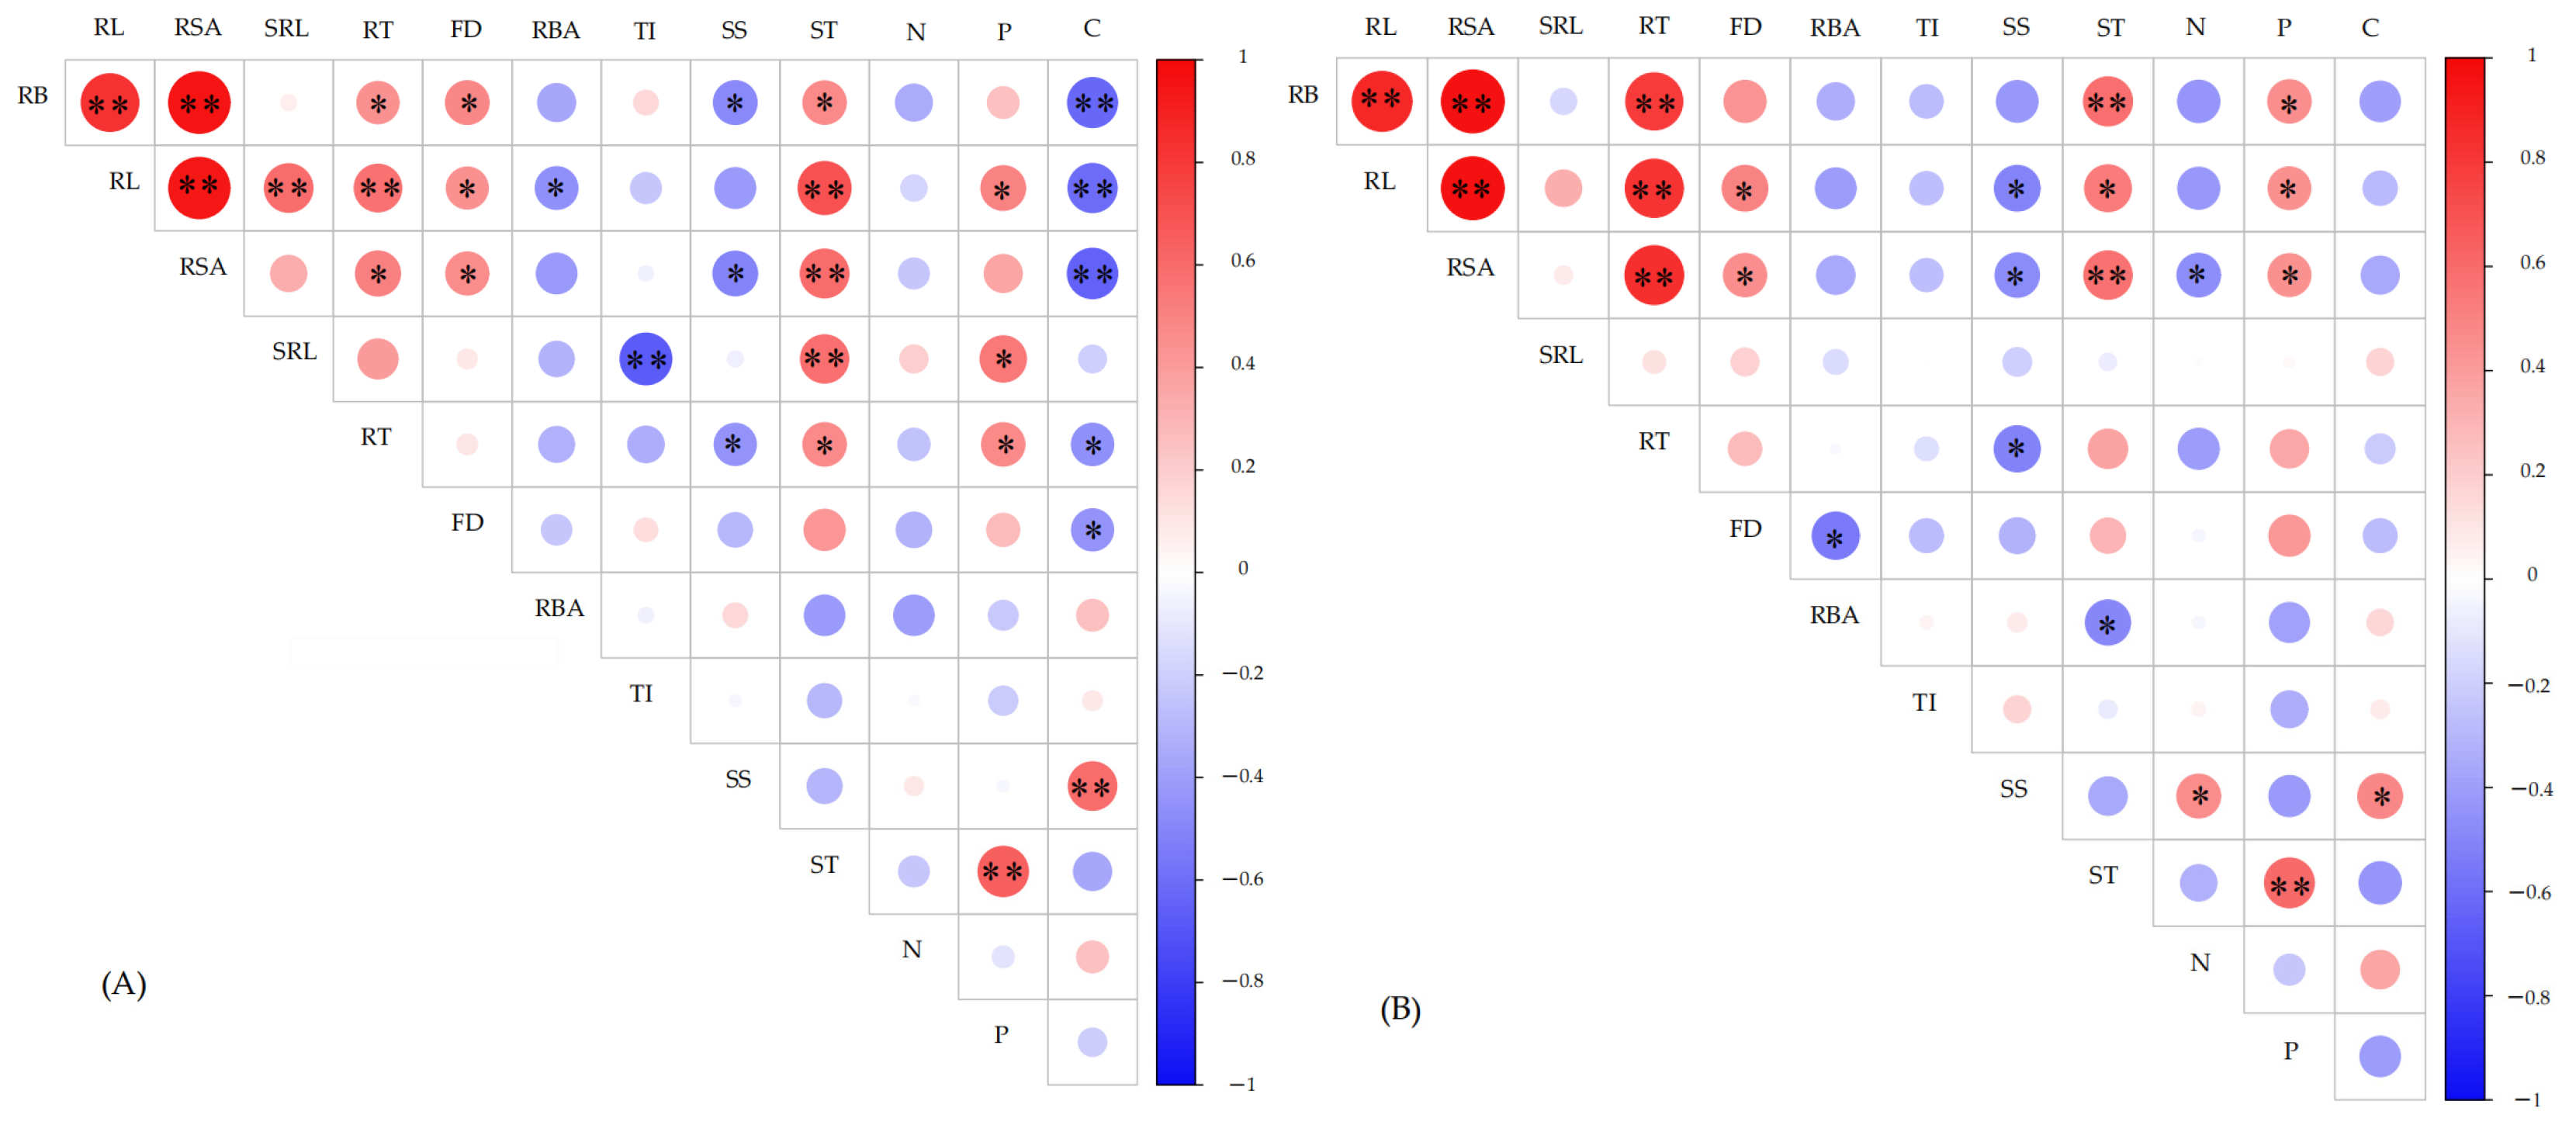
In July, the accumulation of root biomass was significantly positively correlated with FD (r = 0.48), RTs (r = 0.449), and ST (r = 0.473) (p < 0.05) and significantly negatively correlated with SS (r = −0.482) and C content (r = −0.630). In December, RB was extremely significantly positively correlated with ST (r = 0.587) content and RTs (r = 0.797) and significantly positively correlated with P content (r = 0.458).
In July, RL was extremely significantly positively correlated with ST content (r = 0.707) (p < 0.01), significantly positively correlated with P content (r = 0.502), and extremely significantly negatively correlated with C content (r = −0.609). In December, RL was significantly positively correlated with ST (r = 0.534) and P content (r = 0.444) and significantly negatively correlated with SS content (r = −0.508) (Figure 6). This indicates that an increased content of ST and P in roots may promote root growth and the accumulation of biomass, while root growth also leads to the consumption of SS.
In July, SRL was significantly negatively correlated with TI (r = −0.675) and significantly positively correlated with P content (r = 0.540) and ST content (r = 0.587). This indicates that the ability of unit dry matter to form longer root systems may be related to root branching patterns.
In July, RTs were significantly negatively correlated with SS (r = −0.447) and C content (r = −0.452) and significantly positively correlated with ST (r = 0.475) and P content (r = 0.473). In December, RTs were significantly negatively correlated with SS content (r = −0.518). This indicates that an increased content of ST and P in roots may promote root branching and proliferation, which may also lead to the consumption of SS.
In December, RBA was significantly negatively correlated with ST content (r = −0.496). This indicates that the massive accumulation of ST in roots may induce root geotropism.
ST was extremely significantly positively correlated with P content in July (r = 0.640) and December (r = 0.607). In December, SS was significantly positively correlated with C (r = 0.468) and N content (r = 0.488).

4. Discussion

4.1. Responses of Biomass Allocation

The regulatory capacity of plant biomass allocation strategies allows for a more efficient resource acquisition under varying soil nutrient conditions, thereby maintaining growth, reproduction, and survival [34]. This study demonstrates that the addition of P significantly enhanced root biomass (a 38.2% increase in root biomass), which aligns with the conclusion that low P availability inhibits the accumulation of root biomass in Masson pine. Mechanistically, low P restricts the synthesis of nucleic acids and nucleoproteins in plants, thereby inhibiting cell differentiation, division, and C fixation processes [35]. P’s addition effectively alleviates this inhibitory effect. It is noteworthy that the addition of P has a minor impact on stems and leaves, indicating that the roots of Masson pine are more sensitive to soil P changes than the aboveground parts. Zhou’s study also found that the addition of P promoted the root growth of Phyllostachys edulis (Carrière) J. Houzeau within 6 months but had no effect on the aboveground parts; a significant promoting effect on aboveground parts was not observed until 12 months [36]. This also indicates that the promoting effect of the addition of P on aboveground growth may take longer to manifest than that on root growth. However, previous studies have reported conflicting findings: low P can stimulate the accumulation of root biomass, which may be attributed to differences in plant plasticity and the diversification of adaptive strategies under low-P conditions [37]. For example, rapeseed (Cunninghamia lanceolata (Lamb.) Hook.) enhances the root secretion of organic acids to solubilize soil P under low-P conditions. This strategy maintains a high P use efficiency and photosynthetic efficiency, thereby sustaining a robust growth performance [38]. Similarly, under low-P conditions, the root biomass of slash pine (Pinus elliptii Engelm.) increases, and the root–shoot ratio rises. This C investment strategy allows roots to expand their foraging range in P-deficient soils [39]. From the perspective of root–shoot ratio dynamics, Masson pine prioritizes aboveground growth under low-P conditions. Conversely, with increasing soil P levels, the allocation priority shifts toward root growth, aligning with previous findings [40]. However, conflicting results have reported that low P may destabilize P transporters, inhibiting P’s translocation to shoots, which in turn promotes root growth and elevates the root–shoot ratio [22]. In summary, P enrichment favors the root growth of Masson pine, while P deficiency promotes an aboveground biomass allocation. Since phosphate fertilizer’s application has only a limited effect on increasing the biomass of stems and leaves, the long-term continuous application of phosphate fertilizer is not feasible from a cost-saving perspective. However, based on the developmental dynamics of Masson pine roots [41], it is feasible to apply an appropriate amount of phosphate fertilizer during the vigorous root growth period of young Masson pine plantations (less than 20 years old) to promote the rapid establishment of root systems.

4.2. Responses of Root Morphology and Root Architecture

In this study, the addition of P significantly increased RL and RSA, demonstrating its effectiveness in alleviating the restrictive effects of low P on root growth and development. This finding aligns with previous research [42]. Studies on C. lanceolata and Larix gmelinii (Rupr.) Kuzen have revealed that low P can promote the directional transport of auxins, gibberellins, and photosynthates to the roots, thereby facilitating root growth [43,44]. It is noteworthy that the addition of P promoted the development of denser and finer roots during the early growth stage of Masson pine, thereby increasing SRL, in agreement with previous findings [45]. In high-P environments, the production of fine roots with a high absorption efficiency and low C cost may represent a key adaptive strategy for Masson pine. This strategy enables an expansion of root foraging range while minimizing C expenditure. However, conflicting studies have reported that low P inhibits vascular bundle development, leading to smaller cortical cells with a compact arrangement and consequently thinner roots [46]. This phenomenon was not observed in the present study.
In this study, the addition of P significantly increased RTs and FD, demonstrating its promotion of root branching—a finding consistent with previous research [40]. Increased external branching of roots is also a reason for the increase in the RLR of fine roots. However, the TI of Masson pine did not decrease with the increase in branching intensity (FD). This may be because the addition of P not only promotes lateral root branching but also induces the main roots to generate more fine lateral branches, thereby exerting a minimal impact on the overall branching pattern of the root system. In this study, the addition of P reduced the RBA, leading to a steeper root system and enhanced geotropism. Previous studies have also shown that P fertilization can help roots grow deeper into the soil layer [13]. Low P increased the RBA of Masson pine, forming a shallower root architecture—a finding consistent with prior research [10].

4.3. Responses of Nutrient Elements’ and Non-Structural Carbohydrates’ Allocation

In this study, the addition of P increased P content in the roots, stems, and leaves of Masson pine but decreased N content in stems and leaves, thereby significantly reducing the N/P ratio. This phenomenon may be attributed to the competitive ion mechanism between N and P during nutrient absorption. Studies have shown that there is competition between phosphate ions (H2PO4/HPO42−) and nitrate ions (NO3) in anion channels [47]. However, studies have also revealed a synergistic promotion mechanism in the absorption of N and P [48]. The C content also exhibited a decreasing trend, which was significantly negatively correlated with biomass. This suggests that the rapid growth of Masson pine under high-P conditions leads to a substantial consumption of N and C, potentially contributing to the reduction in their content. From the N/P results of this study, it can be seen that N remains the main limiting factor for the growth of Masson pine even under low-P conditions (N/P < 14) [49]. Although the addition of P alone promotes the short-term growth of Masson pine, it exacerbates N’s limitation and hinders long-term growth. Therefore, in the actual fertilization management of Masson pine plantations, applying phosphate fertilizer alone is insufficient. It is also necessary to supplement N fertilizer in a timely manner during the vigorous growth period of Masson pine to alleviate N limitation. Notably, unlike stems and leaves, the N content of roots did not decline with the addition of P. This suggests that Masson pine preferentially allocates N to roots under nutrient limitation, safeguarding roots’ nutrient absorption capacity. From the nutrient element accumulation ratios, Masson pine allocated more N, P, and C to roots under P-sufficient conditions, while reducing the allocation to leaves. Conversely, the pattern was reversed under low-P conditions. It has also been observed in studies on Larix gmelinii var. principis-rupprechtii (Mayr) Pilger that the sole addition of P reduces the N content in leaves, particularly during the vigorous growth period from June to July. Furthermore, the P content in roots increases significantly, while no such change is observed in stems and leaves [50].
NSCs are important photosynthetic products that support plant growth, metabolism, and a series of physiological activities [51]. Changes in the concentration of NSCs in key growth parts can reflect the adaptive strategies of plants to dynamic environments [52]. In this study, the addition of P significantly decreased the content of SS and the SS/ST in stems and leaves, while increasing ST content. This suggests that high P promotes the conversion of SS to starch, in line with previous findings [53]. In other words, Masson pine promoted the conversion of ST to SS to maintain organ growth under low-P stress. Previous studies have demonstrated that soluble sugar content is closely associated with plant lateral root density under varying soil P conditions [54]. Additionally, research has indicated that sugars can act as signaling molecules to induce the formation of clustered roots under low-P conditions, rather than merely serving as an energy source [55]. However, although different P additions also increased root ST, they did not significantly affect root SS. This suggests that when soluble sugars become scarce due to heavy consumption, Masson pine preferentially allocates soluble sugars to roots to fulfill their growth requirements. In this study, ST content was positively correlated with RL and RTs, indicating that the addition of P promotes the substantial accumulation of ST in roots, which provides energy and carbon skeletons for roots and thereby facilitates roots’ proliferation and elongation. Vriet’s research also found that there is a positive correlation between root starch content and root regenerative capacity [56]. In this study, a P addition-induced reduction in RBA was also significantly correlated with the increase in root ST content (Figure 6). This may be because the addition of P promotes ST’s accumulation in roots, thereby enhancing root geotropism. Previous studies have also confirmed that an increase in starch can enhance root geotropism [57].

5. Conclusions

In this study, a low P availability constrained root growth and branching in Masson pine, while exerting a minimal impact on aboveground parts. Masson pine adapted to low-P environments by developing shallower roots with a reduced branching intensity and promoting the conversion of ST to SS. P supplementation effectively alleviated the growth limitations imposed by low P, stimulating root growth, branching, and gravitropism. Under high-P conditions, Masson pine preferentially allocated more N, P, and C to roots, rendering root responses to P more sensitive than shoots. While the addition of P enhanced short-term growth and P uptake, it also intensified SS, N, and C depletion, leading to significant decreases in N/P and C/P ratios and exacerbating N’s limitation, potentially limiting long-term development. Under high-P conditions, Masson pine strategically prioritizes allocating limited N and SS to roots, facilitating the formation of thinner roots with low C costs. This adaptive strategy supports roots’ morphological and architectural plasticity while maintaining root growth and physiological functions, enabling the species to thrive under N and SS scarcity.

Author Contributions

Z.Y. and H.W. designed the experiments. Z.Y. and H.W. performed the analysis. Z.Y. and H.W. drafted the manuscript. All the authors critically revised and approval the final version of this manuscript. All authors have read and agreed to the published version of the manuscript.

Funding

This study was supported by funding from the National Natural Science Foundation of China (32201645), Special Project of Zhejiang Provincial Scientific Research Institutes (2024F1065-2).

Data Availability Statement

The data presented in this study are available on request from the corresponding author.

Conflicts of Interest

The authors declare no conflict of interest.

References

  1. Jian, Z.J.; Ni, Y.Y.; Xu, J.; Lei, L.; Zeng, L.X.; Xiao, W.F. Soil fertility in the Pinus massoniana forests of China. Acta Ecol. Sin. 2021, 41, 5279–5288. [Google Scholar] [CrossRef]
  2. Peng, J.F.; Cui, J.Y.; Li, J.B.; Peng, M.; Ma, Y.T.; Wei, X.X.; Li, J.K.; Li, X.; Liu, Y.M.; Li, J.X. Microenvironmental effects on growth response of Pinus massoniana to climate at its northern boundary in the Tongbai Mountains, Central China. J. For. Res. 2024, 1, 44–57. [Google Scholar] [CrossRef]
  3. Tie, L.H.; Peñuelas, J.; Huang, C.; Sardans, J.; Bose, A.K.; Ouyang, S.G.; Kong, Y.X.; Guo, Y.; Wu, Y.J.; Cheng, W.; et al. Phosphorus limitation of Pinus massoniana reforestation increases with stand development: Evidence from plant, leaf litter, and soil. Plant Soil 2024, 504, 817–832. [Google Scholar] [CrossRef]
  4. Lu, L.H.; Cai, D.X.; He, R. Synthetic Analysis on the fertilization effects for young Pinus massoniana plantation. Sci. Silvae Sin. 2004, 40, 99–105. [Google Scholar]
  5. Liu, Q.H.; Zhou, Z.C.; Zhang, K.M.; Lan, Y.Z.; Wu, J.F.; Nie, G.Q. Influence of phosphorus on growth and wood basic density of Pinus massoniana provenances. J. Zhejiang AF Univ. 2012, 29, 185–191. [Google Scholar]
  6. Kulmann, M.S.S.; Aguilar, M.V.M.A.; Tassinari, A.; Schwalbert, R.; Tabaldi, L.A.; Araujo, M.M.; Antoniolli, Z.I.; Nicoloso, F.T.; Brunetto, G.; Schumacher, V.M. Effects of increasing soil phosphorus and association with ectomycorrhizal fungi (Pisolithus microcarpus) on morphological, nutritional, biochemical, and physiological parameters of Pinus taeda L. For. Ecol. Manag. 2023, 544, 121207. [Google Scholar] [CrossRef]
  7. Shinde, S.; Naik, D.; Cumming, J.R. Carbon allocation and partitioning in Populus tremuloides are modulated by ectomycorrhizal fungi under phosphorus limitation. Tree Physiol. 2017, 38, 52–65. [Google Scholar] [CrossRef]
  8. Sun, Z.Y.; Bai, C.; Liu, Y.F.; Ma, M.Z.; Zhang, S.W.; Liu, H.; Bai, R.; Han, X.R.; Yong, J.W.H. Resilient and sustainable production of peanut (Arachis hypogaea) in phosphorus-limited environment by using exogenous gamma-aminobutyric acid to sustain photosynthesis. Ecotoxicol. Environ. Saf. 2023, 263, 115388. [Google Scholar] [CrossRef]
  9. Crombez, H.; Motte, H.; Tom, B. Tackling plant phosphate starvation by the roots. Dev. Cell 2019, 48, 599–615. [Google Scholar] [CrossRef]
  10. Xu, W.F.; Zhang, Q.; Yuan, W.; Xu, F.Y.; Aslam, M.M.A.; Miao, R.; Li, Y.; Wang, Q.W.; Li, X.; Zhang, X.; et al. The genome evolution and low-phosphorus adaptation in white lupin. Nat. Commun. 2020, 11, 1069. [Google Scholar] [CrossRef]
  11. Ding, Y.; Wang, Z.; Mo, S.; Liu, J.; Xing, Y.; Wang, Y.; Ge, C.; Wang, Y. Mechanism of low phosphorus inducing the main root lengthening of rice. J. Plant Growth Regul. 2021, 18, 1032–1043. [Google Scholar] [CrossRef]
  12. Gong, H.Q.; Xiang, Y.; Wako, B.K.; Jiao, X.Q. Complementary effects of phosphorus supply and planting density on maize growth and phosphorus use efficiency. Front. Plant Sci. 2022, 13, 983788. [Google Scholar] [CrossRef] [PubMed]
  13. Li, Y.L.; Yang, X.Y.; Liu, H.J.; Wang, W.; Wang, C.; Ding, G.D.; Xu, F.S.; Wang, S.L.; Cai, H.M.; Hammond, J.P.; et al. Local and systemic responses conferring acclimation of Brassica napus roots to low phosphorus conditions. J. Exp. Bot. 2022, 11, 4753–4777. [Google Scholar] [CrossRef] [PubMed]
  14. Liu, D. Root developmental responses to phosphorus nutrition. J. Integr. Plant Biol. 2021, 63, 977–1178. [Google Scholar] [CrossRef] [PubMed]
  15. Fitter, A.H.; Stickland, T.R.; Harvey, M.L.; Wilson, G.W. Architectural analysis of plant root systems 1. Architectural correlates of exploitation efficiency. New Phytol. 1991, 118, 375–382. [Google Scholar] [CrossRef]
  16. Sorgonà, A.; Abenavoli, M.R.; Cacco, G. A comparative study between two citrus rootstocks: Effect of nitrate on the root morpho-topology and net nitrate uptake. Plant Soil 2005, 270, 257–267. [Google Scholar] [CrossRef]
  17. Xu, J.; Lei, L.; Zeng, L.X.; Jian, Z.J.; Xiao, W.F.; Ni, Y.Y. The combined effect of root morphological and resistance traits alleviated the growth limitations of Pinus massoniana seedlings under low phosphorus conditions. Plant Soil 2024, 507, 807–822. [Google Scholar] [CrossRef]
  18. Wang, X.; Wang, H.F.; Chen, Y.; Sun, M.M.; Wang, Y.; Chen, Y.F. The transcription factor NIGT1.2 modulates both phosphate uptake and nitrate influx during phosphate starvation in Arabidopsis and maize. Plant Cell 2020, 32, 3519–3534. [Google Scholar] [CrossRef]
  19. Lindroth, R.L. Impacts of elevated atmospheric CO2 and O3 on forests: Phytochemistry, trophic interactions, and ecosystem dynamics. J. Chem. Ecol. 2010, 36, 2–21. [Google Scholar] [CrossRef]
  20. Chen, J.X.; Lian, W.T.; Li, Z.; Guo, X.; Li, Y.N.; Zhao, H.Y.; Yi, K.K.; Li, X.X.; Liao, H. Natural variation in the GmVPE1 promoter contributes to phosphorus re-translocation to seeds and improves soybean yield. Plant Biotechnol. J. 2025, 23, 1359–1372. [Google Scholar] [CrossRef]
  21. Hayes, P.E.; Nge, F.J.; Cramer, M.D.; Finnegan, P.M.; Fu, P.; Hopper, S.D.; Oliveira, R.S.; Turner, B.L.; Zemunik, G.; Zhong, H.T.; et al. Traits related to efficient acquisition and use of phosphorus promote diversification in Proteaceae in phosphorus-impoverished landscapes. Plant Soil 2021, 462, 67–88. [Google Scholar] [CrossRef]
  22. Xiao, X.L.; Zhang, J.Q.; Satheesh, V.; Meng, F.X.; Gao, W.L.; Dong, J.S.; Zheng, Z.; An, G.Y.; Nussaume, L.; Liu, D.; et al. SHORT-ROOT stabilizes PHOSPHATE1 to regulate phosphate allocation in Arabidopsis. Nat. Plants 2022, 8, 1074–1081. [Google Scholar] [CrossRef]
  23. Rubio, V.; Linhares, F.; Solano, R.; Martín, A.C.; Iglesias, J.; Leyva, A.; Paz-Ares, J. A conserved MYB transcription factor involved in phosphate starvation signaling both in vascular plants and in unicellular algae. Genes Dev. 2001, 15, 2122–2133. [Google Scholar] [CrossRef]
  24. Amit, K.; Shahbaz, M.; Koirala, M.; Blagodatskaya, E.; Seidel, S.J.; Kuzyakov, Y.; Pausch, J. Root trait plasticity and plant nutrient acquisition in phosphorus limited soil. J. Plant Nutr. Soil Sci. 2019, 182, 945–952. [Google Scholar] [CrossRef]
  25. Feng, J.G.; Song, Y.J.; Zhu, B. Ecosystem-dependent responses of soil carbon storage to phosphorus enrichment. New Phytol. 2023, 238, 2363–2374. [Google Scholar] [CrossRef] [PubMed]
  26. Huang, S.Y.; Wu, T.G.; Chu, X.L.; Wang, B.; Wang, X.H.; Zhang, D.B.; Zhou, Z.C. Effects of phosphorus addition and inoculation of Mycorrhizal Fungi on the growth and phosphorus utilization of masson pine container seedlings from dfferent families. For. Res. 2021, 34, 142–151. [Google Scholar]
  27. Zhang, T.; Wen, X.P.; Ding, G.J. Ectomycorrhizal symbiosis enhances tolerance to low phosphorous through expression of phosphate transporter genes in masson pine (Pinus massoniana). Acta Physiol. Plant. 2017, 39, 101. [Google Scholar] [CrossRef]
  28. Fan, F.H.; Wang, Q.Z.; Li, H.P.; Ding, G.J.; Wen, X.P. Transcriptome-Wide Identification and Expression Profiles of Masson Pine WRKY Transcription Factors in Response to Low Phosphorus Stress. Plant Mol. Bio. Rep. 2021, 39, 1–9. [Google Scholar] [CrossRef]
  29. Zhang, Z.Q.; Jiao, J.Y.; Chen, T.D.; Chen, Y.L.; Lin, H.; Xu, Q.; Cheng, Y.Z.; Zhao, W.T. Soil nutrient evaluation of alluvial fan in the middle and lower reaches of Lhasa River Basin. J. Plant Nutr. Fertil. 2022, 28, 2082–2096. [Google Scholar]
  30. Bouma, T.J.; Nielsen, K.L.; Hal, J.V.; Koutstaal, B. Root system topology and diameter distribution of species from habitats differing in inundation frequency. Funct. Ecol. 2001, 15, 360–369. [Google Scholar] [CrossRef]
  31. Yang, Z.Y.; Zhou, B.Z.; Ge, X.G.; Cao, Y.H.; Brunner, I.; Shi, J.X.; Li, M.H. Species-Speciffc responses of root morphology of three co-existing tree species to nutrient patches reflect their root foraging strategies. Front. Plant Sci. 2021, 11, 618222. [Google Scholar] [CrossRef]
  32. Gao, Z.B.; Wang, H.Y.; Lu, X.T.; Wang, Z.Y. Effects of nitrogen and phosphorus addition on C:N:P stoichiometry in roots and leaves of four dominant plant species in a meadow steppe of Hulunbuir. Chin. J. Ecol. 2017, 36, 80–88. [Google Scholar]
  33. Li, M.H.; Xiao, W.F.; Wang, S.G.; Cheng, G.W.; Cherubini, P.; Cai, X.H. Mobile carbohydrates in Himalayan treeline trees I. evidence for carbon gain limitation but not for growth limitation. Tree Physiol. 2008, 28, 1287–1296. [Google Scholar] [CrossRef] [PubMed]
  34. Zhang, C.C.; Gu, R.; Lin, L.X.; Russo, S.E. Functional traits and ecological niches as correlates of the interspecific growth–mortality trade-off among seedlings of 14 tropical tree species. Funct. Ecol. 2024, 38, 1888–1901. [Google Scholar] [CrossRef]
  35. Hu, D.D.; Zhang, J.Y.; Yang, Y.M.; Yu, D.Y.; Zhang, H.Y.; Zhang, D. Molecular mechanisms underlying plant responses to low phosphate stress and potential applications in crop improvement. New Crops 2025, 2, 100064. [Google Scholar] [CrossRef]
  36. Zhou, J.F.; Shi, W.H.; Pan, K.T.; Ying, Y.Q.; Sun, C. Effect of low phosphorus stress on growth and nutrient physiology of Phyllostachys edulis seedlings. J. Zhejiang AF Univ. 2022, 39, 1010–1017. [Google Scholar]
  37. Joshi, S.R.; Morris, J.W.; Tfaily, M.M.; Young, R.P.; McNear, D.H., Jr. Low soil phosphorus availability triggers maize growth stage specific rhizosphere processes leading to mineralization of organic P. Plant Soil 2021, 459, 423–440. [Google Scholar] [CrossRef]
  38. Yu, Y.C.; Yu, J.; Fang, L.; Jiang, D.F. Organic Acids exudation from the roots of Cunninghamia lanceolata and Pinus massoniana seedlings under low phosphorus stress. J. Nanjing For. Univ. (Nat. Sci. Ed.) 2007, 31, 9–12. [Google Scholar] [CrossRef]
  39. Zhang, J.H.; Li, Y.Q.; Wan, X.R. Effects of different levels of NP nutrition on the dry matter distribution of root and shoot of Chinese Fir, Slash Pine and Timor Mahogany seedlings. Sci. Silvae Sin. 2006, 42, 48–53. [Google Scholar]
  40. Ai, Z.Z.; Yuan, J.; Hang, M.L.; Tan, X.F. Effects of phosphorus on root/shoot ratio and root morphology of Camellia oleifera seedlings under aluminum toxicity. Jiangsu Agric. Sci. 2017, 45, 106–108. [Google Scholar]
  41. Han, C.; Song, M.; Du, H.; Zeng, F.P.; Peng, W.X.; Wang, H.; Chen, L.; Su, L. Biomass and carbon storage in roots of Cunninghamia lanceolata and Pinus massoniana plantations at different stand ages in Guangxi. Acta Ecol. Sin. 2017, 37, 2282–2289. [Google Scholar] [CrossRef]
  42. Bom, F.; Williams, A.; Borrell, A.K.; Raymond, N.; Bell, M. Phosphorus management is key to effective deployment of root ideotypes in complex soil environments. Plant Soil 2023, 489, 323–340. [Google Scholar] [CrossRef]
  43. Chen, Z.Y.; Wu, P.F.; Zou, X.H.; Wang, P.; Ma, J.; Ma, X.Q. Relationship between Growth and Endogenous Hormones of Chinese Fir seedlings under low phosphorus stress. Sci. Silvae Sin. 2016, 52, 57–66. [Google Scholar]
  44. Chen, Y.L.; Li, X.L.; Zhou, X.Y. Effects of phosphate deficiency on the growth and acid phosphatase activity of Larix gmelini seedlings. J. Beijing For. Univ. 2006, 28, 46–50. [Google Scholar]
  45. Chen, X.Y.; Ren, H.; Zhang, J.W.; Zhao, B.; Ren, B.Z.; Wan, Y.S.; Liu, P. Deep phosphorus fertilizer placement increases maize productivity by improving root-shoot coordination and photosynthetic performance. Soil Tillage Res. 2024, 235, 105915. [Google Scholar] [CrossRef]
  46. Niu, Y.F.; Chai, R.S.; Jin, G.L.; Wang, H.; Tang, C.X.; Zhang, Y.S. Responses of root architecture development to low phosphorus availability: A review. Ann. Bot. 2013, 112, 391–408. [Google Scholar] [CrossRef]
  47. O’Brien, J.A.; Vega, A.; Bouguyon, E.; Krouk, G.; Gojon, A.; Coruzzi, G.; Gutiérrez, R.A. Nitrate transport, sensing, and responses in plants. Mol. Plant. 2016, 9, 837–856. [Google Scholar] [CrossRef]
  48. Liu, B.; Xu, W.Y.; Niu, Y.X.; Li, Q.Y.; Cao, B.L.; Qi, J.Y.; Zhao, Y.D.; Zhou, Y.L.; Song, L.; Cui, D.K.; et al. TaTCP6 is required for efficient and balanced utilization of nitrate and phosphorus in wheat. Nat. Commun. 2025, 16, 1683. [Google Scholar] [CrossRef]
  49. Ni, H.J.; Zhao, J.C.; Yang, Z.Y. The effects of different moso bamboo densities on the physiological growth of Indocalamus latifolius cultivated in moso bamboo Forests. Forests 2025, 16, 636. [Google Scholar] [CrossRef]
  50. Xu, F.L.; Zhao, Y.F.; Zhang, P.; Wang, W.L.; Yu, Q.M.; Wang, W.D.; Wang, G.X. Effects of fertilization on nitrogen and phosphorus content in roots, stems and leaves of Larix principis-rupprechtii plantation. Sci. Silvae Sin. 2014, 50, 139–143. [Google Scholar]
  51. Li, M.H.; Jiang, Y.; Wang, A.; Li, X.B.; Zhu, W.; Yan, C.F.; Du, Z.; Shi, Z.; Lei, J.P.; Schönbeck, L.; et al. Active summer carbon storage for winter persistence in trees at the cold alpine treeline. Tree Physiol. 2018, 38, 1345–1355. [Google Scholar] [CrossRef] [PubMed]
  52. Chen, H.Y.; Dong, Y.F.; Xu, T.; Wang, Y.P.; Wang, H.T.; Duan, B.L. Root order-dependent seasonal dynamics in the carbon and nitrogen chemistry of poplar fine roots. New For. 2017, 48, 587–607. [Google Scholar] [CrossRef]
  53. Yu, Q.S.; Ni, X.F.; Ji, C.J.; Zhu, J.L.; Tang, Z.Y.; Fang, J.Y. Effects of 10-year nitrogen and phosphorus additions on leaf non-structural carbohydrates of dominant plants in tropical rainforests in Jianfengling, Hainan. Chin. J. Plant Ecol. 2024, 48, 690–700. [Google Scholar]
  54. Hammond, J.P.; White, P.J. Sugar signaling in root responses to low phosphorus availability. Plant Physiol. 2011, 156, 1033–1040. [Google Scholar] [CrossRef]
  55. Zhou, K.Q.; Yamagishi, M.; Osaki, M.; Masuda, K. Sugar signalling mediates cluster root formation and phosphorus starvation-induced gene expression in white lupin. J. Exp. Bot. 2008, 59, 2749–2756. [Google Scholar] [CrossRef]
  56. Vriet, C.; Smith, A.M.; Wang, T.L. Root starch reserves are necessary for vigorous re-growth following cutting back in Lotus japonicus. PLoS ONE 2014, 31, e87333. [Google Scholar] [CrossRef]
  57. Takahashi, N.; Yamazaki, Y.; Kobayashi, A.; Higashitani, A.; Takahashi, H. Hydrotropism Interacts with gravitropism by degrading amyloplasts in seedling roots of arabidopsis and radish. Plant Physiol. 2003, 132, 805–810. [Google Scholar] [CrossRef]
Figure 1. Diagram of root topology classification. (A) Herringbone branching. (B) Dichotomous branching. α: Number of internal links along longest pathway from root collar to external root tip. µ: Total number of external links.
Forests 16 01265 g001
Figure 2. Effects of different phosphorus addition levels on the biomass allocation of Masson pine seedlings. Note: a, b, c—different letters indicate significant differences between different treatments (p < 0.05). The values in the bar chart are the means and standard errors. (A): July, (B): December, (C): root–shoot ratio.
Forests 16 01265 g002
Figure 3. Effects of different phosphorus addition levels on the root morphology and architecture of Masson pine seedlings. Note: a, b, c—different letters indicate significant differences between different treatments (p < 0.05). The values in the bar chart are the means and standard errors.
Forests 16 01265 g003
Figure 4. Effects of different phosphorus addition levels on the root length ratio of roots with different diameter grades of Masson pine seedlings. Note: a, b—different letters indicate significant differences between different treatments (p < 0.05). The values in the bar chart are the means and standard errors. (A): July, (B): December.
Forests 16 01265 g004
Figure 5. Effects of different phosphorus addition levels on the nutrients accumulation ratio of Masson pine seedlings. Note: a, b, c—different letters indicate significant differences between different treatments (p < 0.05). The values in the bar chart are the means and standard errors. (AC): July, (DF): December.
Forests 16 01265 g005
Figure 6. The relationships between the indicators. Note: red and blue indicate positive and negative correlations, respectively. The size and color intensity of the circles in the figure reflect the strength of the correlation between the indicators. Larger circles and deeper colors indicate a stronger correlation between the indicators. RB: root biomass, (A): July, (B): December, df = n − 2 = 18, |r| > 0.444 is p < 0.05, |r| > 0.561 is p < 0.01. **: Correlation is significant at the 0.01 level (p < 0.01). *: Correlation is significant at the 0.05 level (p < 0.05).
Forests 16 01265 g006
Table 1. Effect of different phosphorus addition levels on the nutrient elements’ allocation of Masson pine seedlings.
PeriodsNutrient Content and Ratio TreatmentsLeavesStemsRoots
JulyP
(mg g−1)
P00.945 ± 0.044 b0.560 ± 0.033 b0.633 ± 0.023 b
P11.026 ± 0.044 ab0.612 ± 0.026 ab0.696 ± 0.032 a
P21.136 ± 0.096 a0.656 ± 0.071 a0.725 ± 0.048 a
P31.162 ± 0.086 a0.679 ± 0.066 a0.739 ± 0.062 a
N
(mg g−1)
P013.04 ± 0.65 a4.61 ± 0.22 a8.20 ± 0.66 a
P112.02 ± 1.08 ab4.18 ± 0.36 ab7.99 ± 0.53 a
P211.78 ± 0.58 b3.99 ± 0.31 b7.81 ± 0.68 a
P311.40 ± 0.96 b3.97 ± 0.25 b7.75 ± 0.41 a
C
(mg g−1)
P0526.8 ± 7.2 a561.4 ± 20.9 a545.8 ± 8.3 a
P1513.6 ± 8.7 ab549.2 ± 15.9 ab537.2 ± 14.1 ab
P2501.8 ± 14.2 b537.8 ± 19.0 ab530.2 ± 18.3 ab
P3506.4 ± 16.0 b525.2 ± 23.8 b525.6 ± 17.1 b
N/PP013.81 ±0.31 a8.24 ± 0.24 a12.96 ± 0.92 a
P111.72 ± 1.06 b6.83 ± 0.63 b11.50 ± 0.90 ab
P210.42 ± 0.93 c6.10 ± 0.23 c10.79 ± 0.74 b
P39.82 ± 0.63 c5.89 ± 0.68 c10.57 ± 1.27 b
C/NP040.47 ± 1.22 b121.9 ± 7.2 a66.98 ± 6.03 a
P142.97 ± 3.51 ab132.3 ± 13.0 a67.46 ± 5.02 a
P242.66 ± 1.94 ab135.5 ± 11.9 a68.22 ± 5.58 a
P344.62 ± 3.12 a132.7 ± 10.5 a67.92 ± 3.02 a
C/PP0472.7 ± 35.5 a819.3 ± 65.5 a700.7 ± 44.7 a
P1410.3 ± 26.6 b767.0 ± 41.0 ab594.2 ± 27.6 b
P2378.1 ± 19.0 bc695.2 ± 62.5 bc571.3 ± 35.6 b
P3366.5 ± 20.4 c616.4 ± 43.4 c552.7 ± 36.8 b
DecemberP
(mg g−1)
P01.098 ± 0.077 c0.661 ± 0.045 c0.750 ± 0.039 b
P11.220 ± 0.085 b0.706 ± 0.034 bc0.866 ± 0.031 a
P21.296 ± 0.040 ab0.768 ± 0.062 ab0.895 ± 0.060 a
P31.340 ± 0.075 a0.823 ± 0.056 a0.910 ± 0.050 a
N
(mg g−1)
P012.10 ± 0.51 a4.17 ± 0.35 a7.54 ± 0.63 a
P110.51 ± 0.66 b3.70 ± 0.25 b7.39 ± 0.54 a
P210.16 ± 0.89 b3.43 ± 0.29 b6.99 ± 0.58 a
P39.77 ± 0.50 b3.46 ± 0.22 b7.09 ± 0.23 a
C
(mg g−1)
P0517.2 ± 13.1 a539.4 ± 15.8 a524.0 ± 15.4 a
P1498.0 ± 9.1 b524.8 ± 9.7 ab513.8 ± 13.3 ab
P2490.4 ± 17.3 b516.6 ± 9.4 bc509.8 ± 9.0 ab
P3489.2 ± 10.9 b505.4 ± 15.0 c501.6 ± 18.8 b
N/PP011.06 ± 0.79 a6.30 ± 0.21 a10.08 ± 1.08 a
P18.65 ± 0.85 b5.23 ± 0.13 b8.56 ± 0.88 b
P27.84 ± 0.72 bc4.46 ± 0.21 c7.81 ± 0.35 b
P37.30 ± 0.47 c4.23 ± 0.45 c7.80 ± 0.43 b
C/NP042.82 ± 2.42 b130.1± 11.3 b69.93 ± 6.43 a
P147.52 ± 2.69 a142.6 ± 10.8 ab69.77 ± 4.89 a
P248.52 ± 4.02 a151.8 ± 14.7 a73.27 ± 5.49 a
P350.19 ± 2.63 a146.2 ± 7.2 a70.79 ± 1.47 a
C/PP0472.9 ± 35.8 a819.3 ± 65.5 a700.7 ± 44.7 a
P1409.6 ± 27.0 b745.2 ± 38.9 b594.2 ± 27.6 b
P2378.8 ± 20.0 bc676.6 ± 59.4 bc571.3 ± 35.6 b
P3365.9 ± 20.2 c616.4 ± 43.4 c552.7 ± 36.8 b
Note: a, b, c—different letters indicate significant differences between different treatments (p < 0.05). The values are the means and standard errors.
Table 2. Effect of different phosphorus addition levels on the non-structural carbohydrates allocation of Masson pine seedlings. Note: a, b, c—different letters indicate significant differences between different treatments (p < 0.05).
PeriodsNon-Structural Carbohydrate Content and RatioTreatmentsLeavesStemsRoots
JulySoluble sugar
(%)
P011.33 ± 0.76 a7.54 ± 0.47 a7.94 ± 0.66 a
P110.51 ± 0.73 a6.91 ± 0.47 ab7.80 ± 0.45 a
P29.41 ± 0.44 b6.54 ± 0.53 b7.41 ± 0.74 a
P39.32 ± 0.58 b6.25 ± 0.46 b7.29 ± 0.52 a
Starch
(%)
P05.34 ± 0.44 c6.80 ± 0.41 c7.71 ± 0.47 c
P16.28 ± 0.42 b7.07 ± 0.42 c7.88 ± 0.26 c
P26.47 ± 0.23 ab8.03 ± 0.59 b9.13 ± 0.72 b
P36.87 ± 0.51 a10.32 ± 0.75 a12.26 ± 0.94 a
Sugar/starchP02.126 ± 0.099 a1.114 ± 0.119 a1.105 ± 0.115 a
P11.680 ± 0.173 b0.978 ± 0.059 b0.991 ± 0.073 b
P21.454 ± 0.066 c0.819 ± 0.095 c0.814 ± 0.080 c
P31.363 ± 0.134 c0.607 ± 0.045 d0.596 ± 0.039 d
DecemberSoluble sugar
(%)
P012.31 ± 0.86 a8.79 ± 0.59 a9.42 ± 0.72 a
P110.93 ± 0.45 b7.98 ± 0.50 b9.12 ± 0.49 a
P29.89 ± 0.62 c6.93 ± 0.50 c8.75 ± 0.66 a
P39.80 ± 0.45 c6.64 ± 0.35 c8.62 ± 0.58 a
Starch
(%)
P05.43 ± 0.25 b6.32 ± 0.47 c6.38 ± 0.51 d
P16.55 ± 0.47 a6.77 ± 0.30 c7.13 ± 0.38 c
P27.13 ± 0.60 a7.44 ± 0.48 b8.26 ± 0.37 b
P37.04 ± 0.50 a8.77 ± 0.62 a10.11 ± 0.75 a
Sugar/starchP02.269 ± 0.110 a1.392 ± 0.034 a1.478 ± 0.082 a
P11.673 ± 0.073 b1.182 ± 0.117 b1.281 ± 0.073 b
P21.395 ± 0.146 c0.937 ± 0.121 c1.064 ± 0.122 c
P31.398 ± 0.137 c0.759 ± 0.063 d0.855 ± 0.068 d
Note: a, b, c, d—different letters indicate significant differences between different treatments (p < 0.05). The values are the means and standard errors.
Disclaimer/Publisher’s Note: The statements, opinions and data contained in all publications are solely those of the individual author(s) and contributor(s) and not of MDPI and/or the editor(s). MDPI and/or the editor(s) disclaim responsibility for any injury to people or property resulting from any ideas, methods, instructions or products referred to in the content.