Article

Coordinated Roles of Osmotic Adjustment, Antioxidant Defense, and Ion Homeostasis in the Salt Tolerance of Mulberry (Morus alba L. ‘Tailai Sang’) Seedlings

Key Laboratory of Heilongjiang Province for Cold-Regions Wetlands Ecology and Environment Research, Harbin University, Harbin 150086, China
*
Author to whom correspondence should be addressed.
These authors contributed equally to this work.
Forests 2025, 16(8), 1258; https://doi.org/10.3390/f16081258 (registering DOI)
Submission received: 2 July 2025 / Revised: 25 July 2025 / Accepted: 29 July 2025 / Published: 1 August 2025

Abstract

Soil salinization severely limits plant growth and productivity. Mulberry (Morus alba L.), an economically and ecologically important tree, is widely cultivated, yet its salt-tolerance mechanisms at the seedling stage remain insufficiently understood. This study investigated the physiological and biochemical responses of two-year-old mulberry (‘Tailai Sang’) seedlings subjected to six NaCl treatments (0, 50, 100, 150, 200, and 300 mmol L−1) for 28 days. Results showed that growth parameters and photosynthetic gas exchange exhibited dose-dependent declines. The reduction in net photosynthetic rate (Pn) was attributed to both stomatal limitations (decreased stomatal conductance) and non-stomatal limitations, as evidenced by a significant decrease in the maximum quantum efficiency of photosystem II (Fv/Fm) under high salinity. To cope with osmotic stress, seedlings accumulated compatible solutes, including soluble sugars, proteins, and proline. Critically, mulberry seedlings demonstrated effective ion homeostasis by sequestering Na+ in the roots to maintain a high K+/Na+ ratio in leaves, a mechanism that was compromised above 150 mmol L−1. Concurrently, indicators of oxidative stress—malondialdehyde (MDA) and H2O2—rose significantly with salinity, inducing the activities of antioxidant enzymes (SOD, CAT, APX, and GR), which peaked at 150 mmol L−1 before declining under extreme stress. A biomass-based LC50 of 179 mmol L−1 NaCl was determined. These findings elucidate that mulberry salt tolerance is a coordinated process involving three key mechanisms: osmotic adjustment, selective ion distribution, and a robust antioxidant defense system. This study establishes an indicative tolerance threshold under controlled conditions and provides a physiological basis for further field-based evaluations of ‘Tailai Sang’ mulberry for cultivation on saline soils.

1. Introduction

1.1. Global Challenge of Soil Salinization and Its Impact on Forestry

Soil salinization, defined as the excessive accumulation of soluble salts (predominantly NaCl) in the soil profile, is one of the most severe abiotic stresses and land degradation processes limiting agricultural and forestry productivity worldwide [1,2]. It is estimated that over 20% of irrigated agricultural land globally is affected by salinity [3], and the total area of salt-affected land is expanding at a rate of 1 to 1.5 million hectares per year [4]. In China alone, salinized soil covers approximately 99 million hectares, mainly distributed in the northwest, northeast, and coastal regions [5]. In forest ecosystems, high soil salinity severely impairs root water uptake, creates ionic toxicity, disrupts nutrient balance, and reduces photosynthetic capacity [6]. These impacts ultimately lead to decreased tree growth, increased susceptibility to pests and pathogens, and a decline in critical ecosystem services such as carbon sequestration and soil stabilization [7]. Therefore, screening and cultivating salt-tolerant tree species is crucial for the ecological restoration and sustainable development of these degraded lands [8].

1.2. Mulberry (Morus alba L.): Economic and Ecological Importance

Mulberry (Morus alba L.), a fast-growing, deciduous tree belonging to the family Moraceae, is widely cultivated for sericulture, fruit production, and as a valuable fodder resource [9]. Beyond its central role in the silk industry, where leaf quality directly dictates cocoon yield, mulberry contributes significantly to agroforestry systems by improving soil structure, preventing erosion, and sequestering atmospheric carbon [10]. Its remarkable adaptability to diverse climates and soils makes it a promising candidate species for the afforestation and reclamation of degraded or saline lands [9,11]. Furthermore, as a member of the Moraceae family, it shares a close genetic relationship with Broussonetia papyrifera (Paper Mulberry), another economically important species whose salt tolerance has been studied [4]. However, despite its potential, the physiological and biochemical mechanisms governing its salt tolerance, which are critical for successful stand establishment, remain insufficiently characterized, particularly at the seedling stage [9].

1.3. Known Salt-Tolerance Mechanisms in Plants

Plants have evolved a suite of complex physiological and biochemical strategies to cope with the dual challenges of osmotic stress and Na+ toxicity imposed by high salinity [1]. These mechanisms primarily include: (i) osmotic adjustment, which involves the synthesis and accumulation of compatible solutes (e.g., proline, soluble sugars, and soluble proteins) to lower cellular water potential, maintain cell turgor, and protect macromolecular structures [4,12]; (ii) ion homeostasis, a critical strategy to mitigate Na+ toxicity by restricting its uptake and transport to photosynthetically active tissues; this is often achieved through selective ion transporters that maintain a high cytosolic K+/Na+ ratio, a key determinant of salt tolerance [2,13]; (iii) antioxidant defense, which involves the activation of both enzymatic (e.g., superoxide dismutase (SOD), catalase (CAT), ascorbate peroxidase (APX)) and non-enzymatic systems to scavenge reactive oxygen species (ROS) that are overproduced under salt stress and cause oxidative damage to lipids, proteins, and nucleic acids [1,14]; and (iv) photosynthetic regulation, where salt stress can induce both stomatal closure (stomatal limitation) and damage to the photosynthetic apparatus (non-stomatal limitation), leading to reduced photosynthetic rates [15]. Studies on related woody perennials like Populus spp. and Broussonetia papyrifera have demonstrated that the overall salt tolerance is determined by the effective coordination of these mechanisms [4,16].

1.4. Knowledge Gap and Rationale

Despite the mulberry’s great potential for afforestation on saline soils, most existing research has focused on mature trees or the response to other stresses like drought [11]. The seedling stage is arguably the most vulnerable phase in a plant’s life cycle, and early stress responses can dictate long-term survival and productivity [17]. To date, a systematic and quantitative investigation of how different NaCl concentrations affect the growth, photosynthesis (including non-stomatal limitations assessed by chlorophyll fluorescence), osmotic adjustment, antioxidant capacity, and, critically, ion distribution (Na+/K+ homeostasis) in two-year-old mulberry seedlings is lacking. This knowledge gap hinders the scientific evaluation and effective utilization of mulberry in saline land reclamation projects.

1.5. Objectives and Hypotheses

The present study aims to fill this gap by the following:
  • Quantifying the dose-dependent effects of NaCl on the growth and photosynthetic performance (including both gas exchange and chlorophyll fluorescence) of two-year-old Morus alba ‘Tailai Sang’ seedlings.
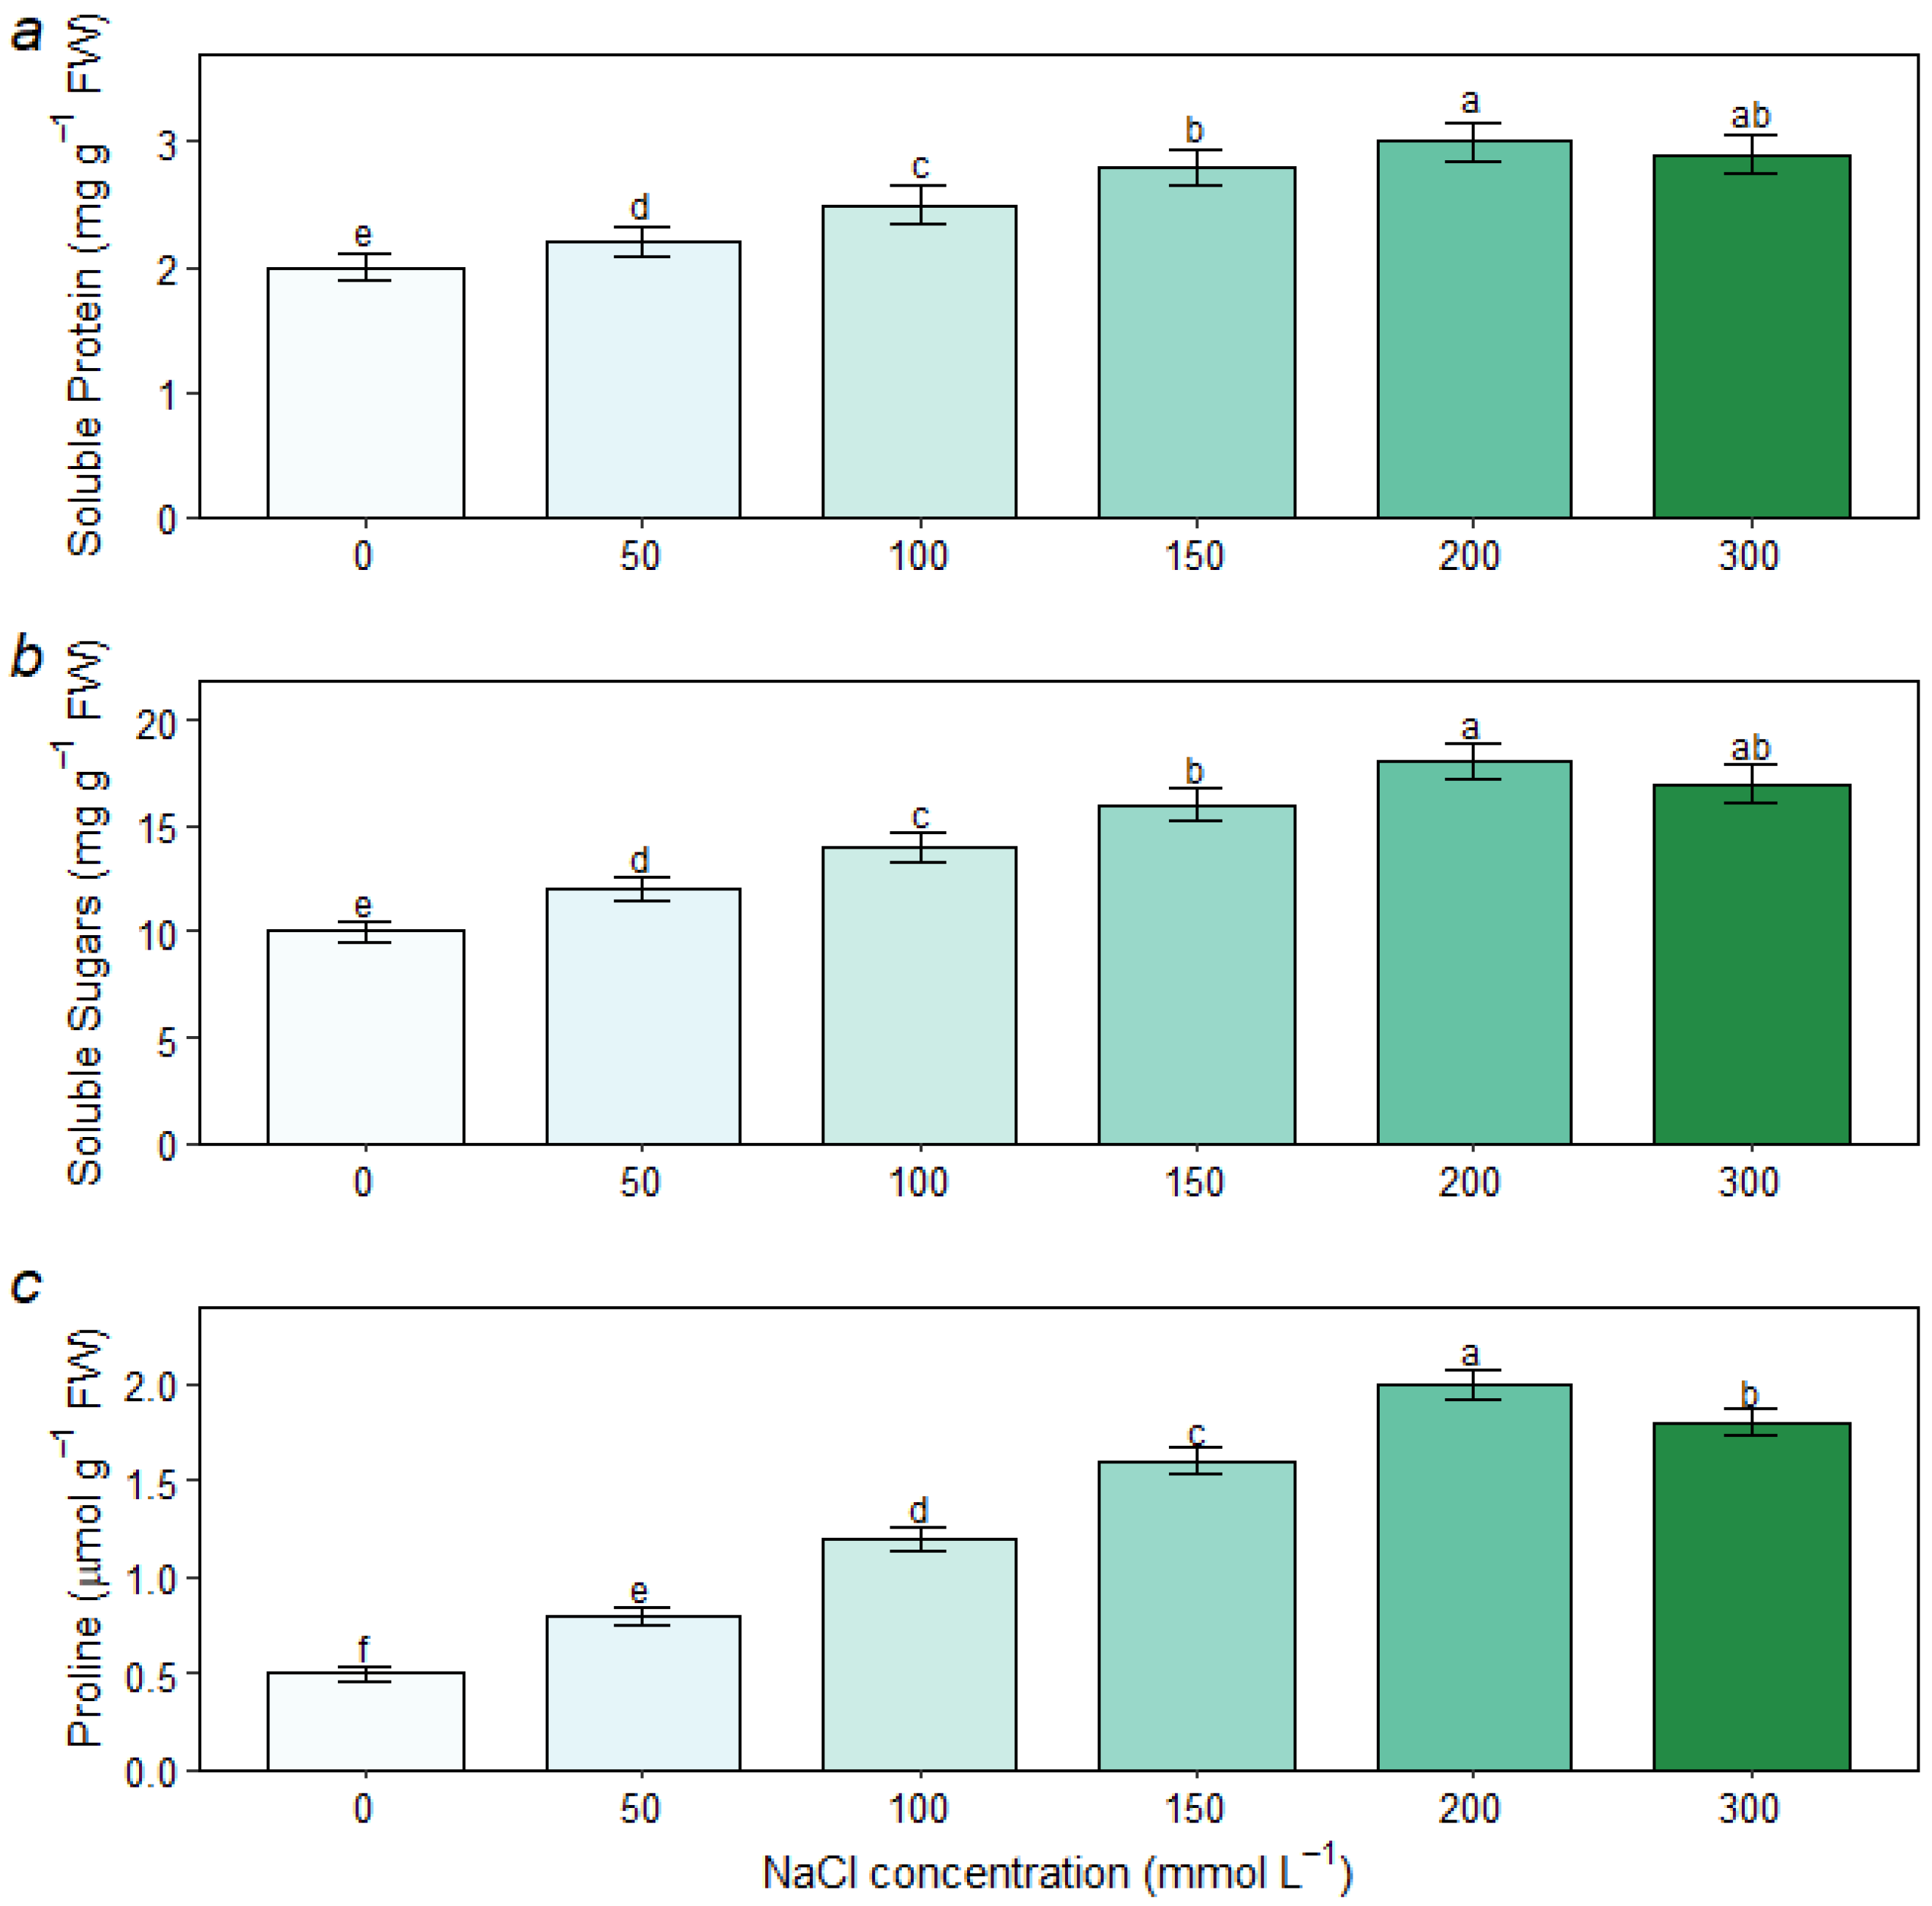
  • Investigating the patterns of osmotic adjustment through the accumulation of proline, soluble sugars, and soluble proteins.
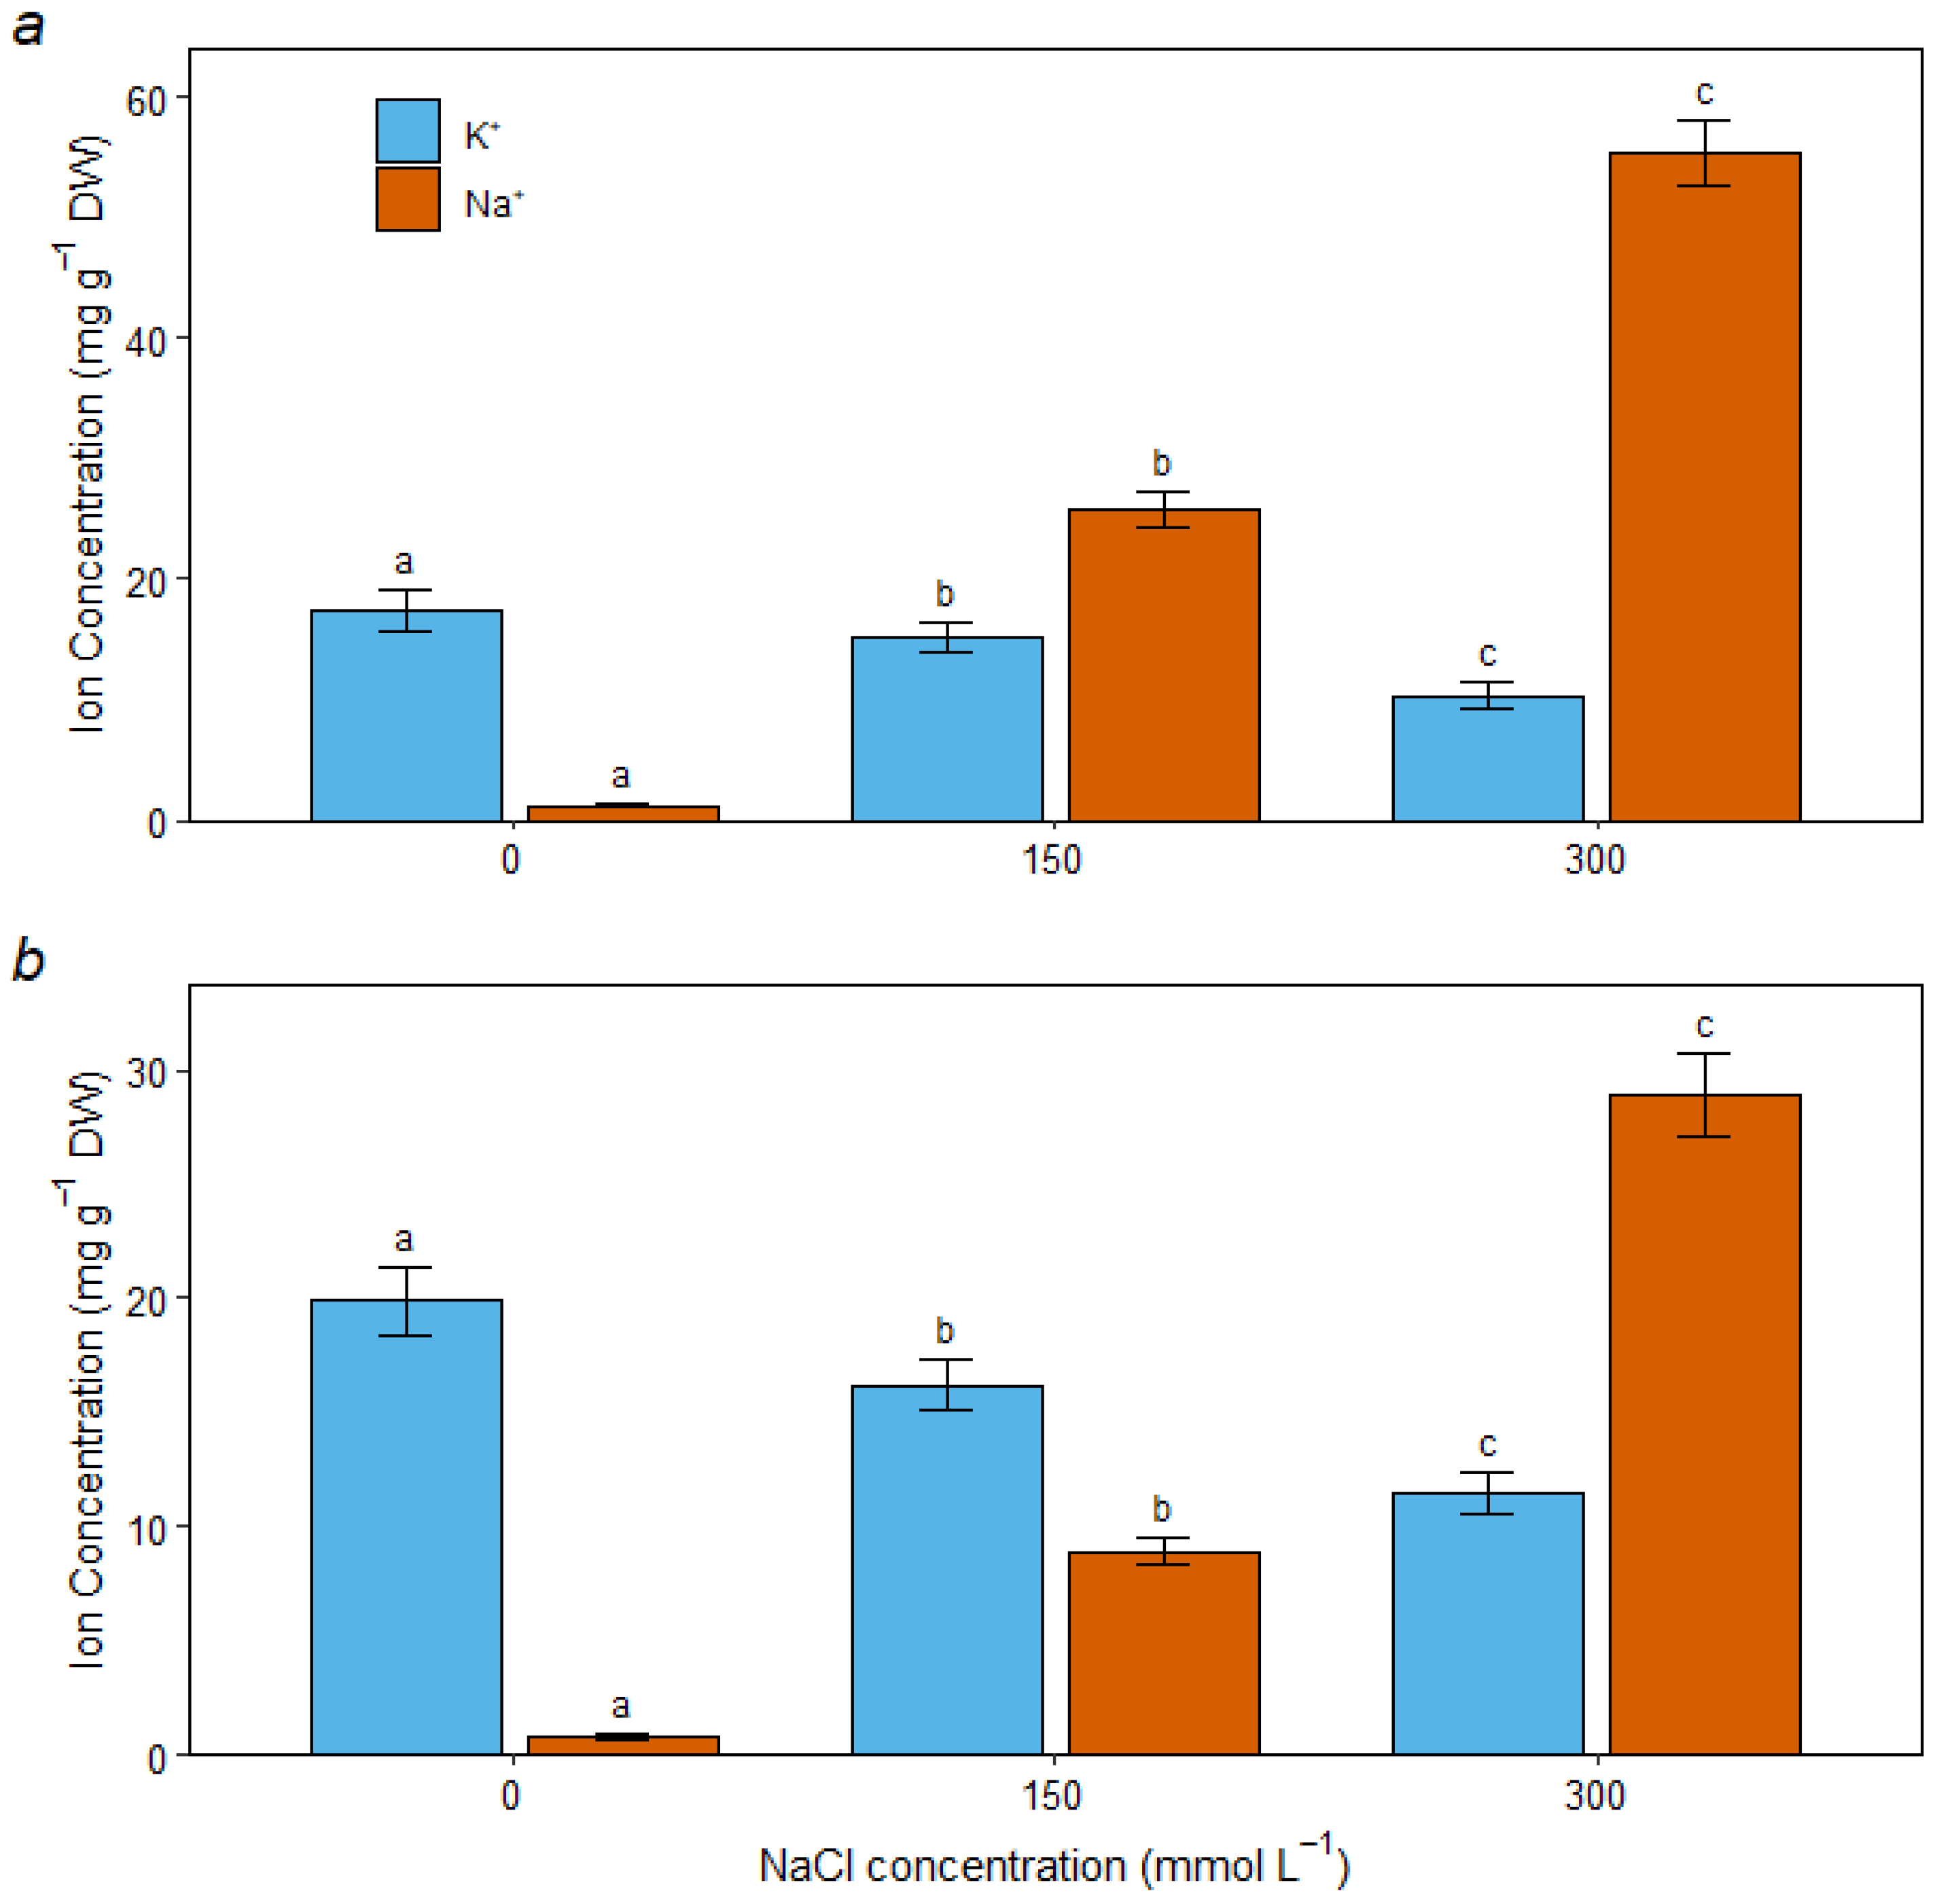
  • Characterizing the ion homeostasis strategy by measuring Na+ and K+ distribution in roots and leaves.
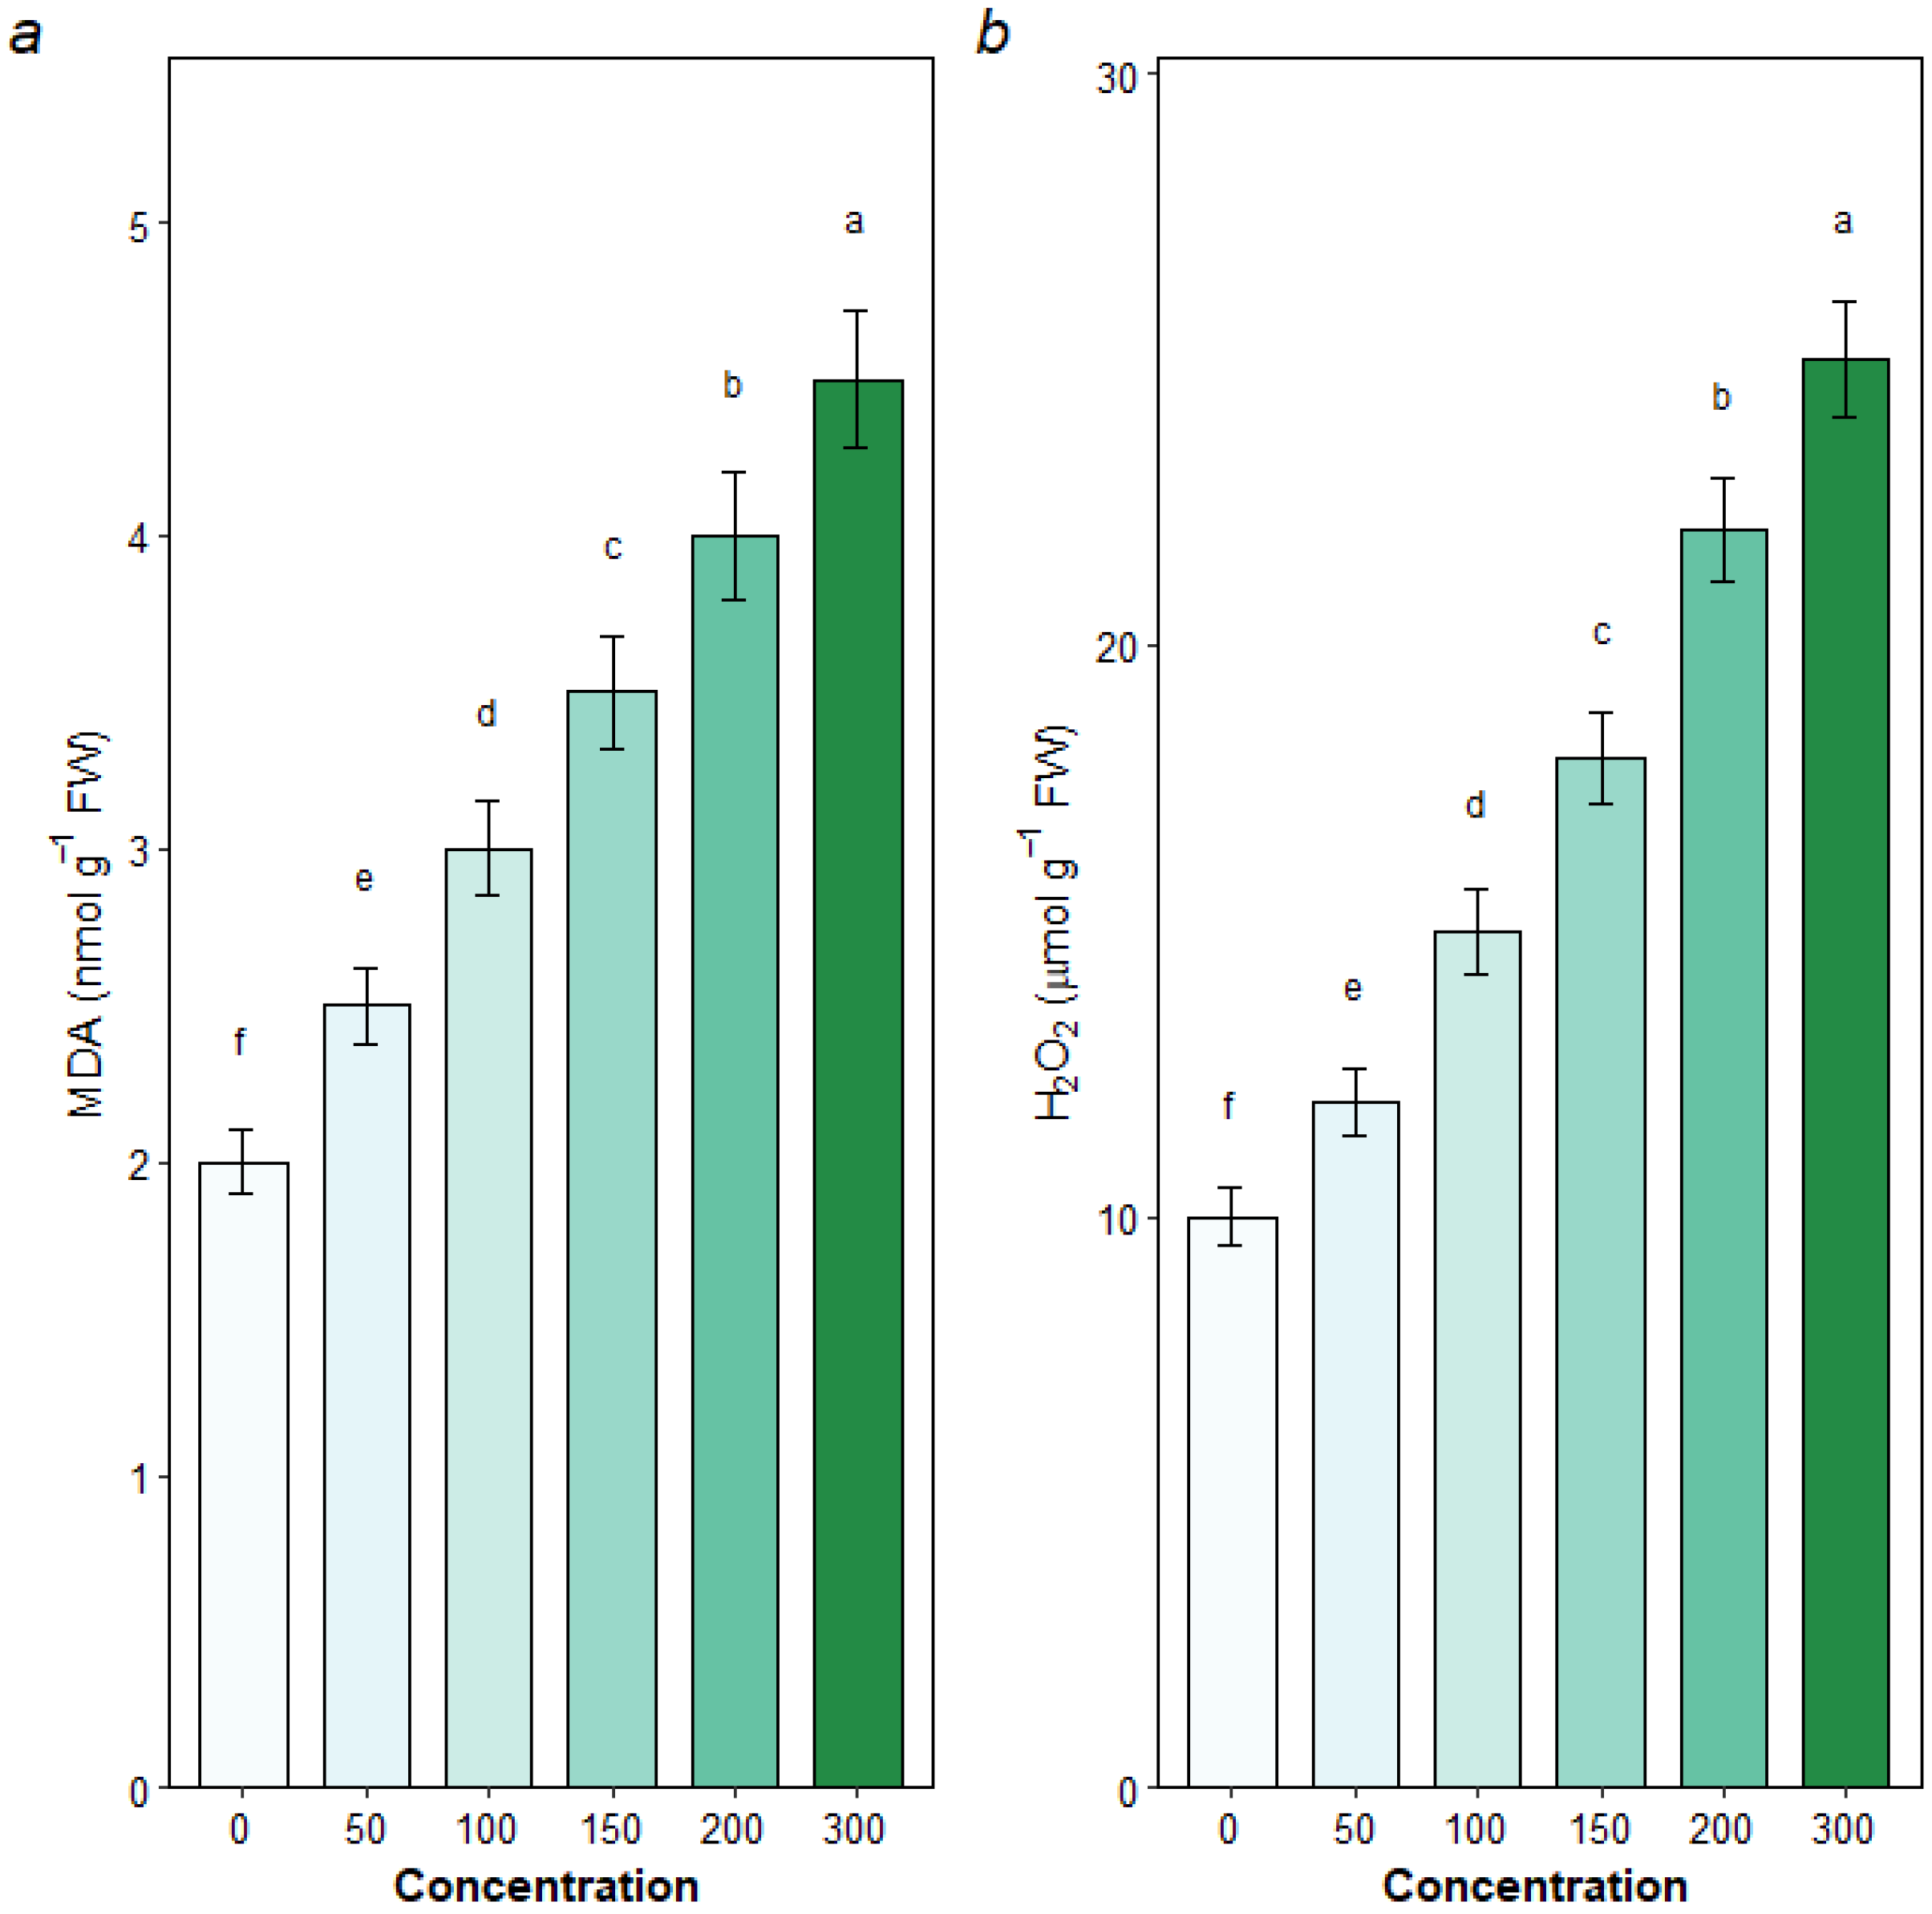
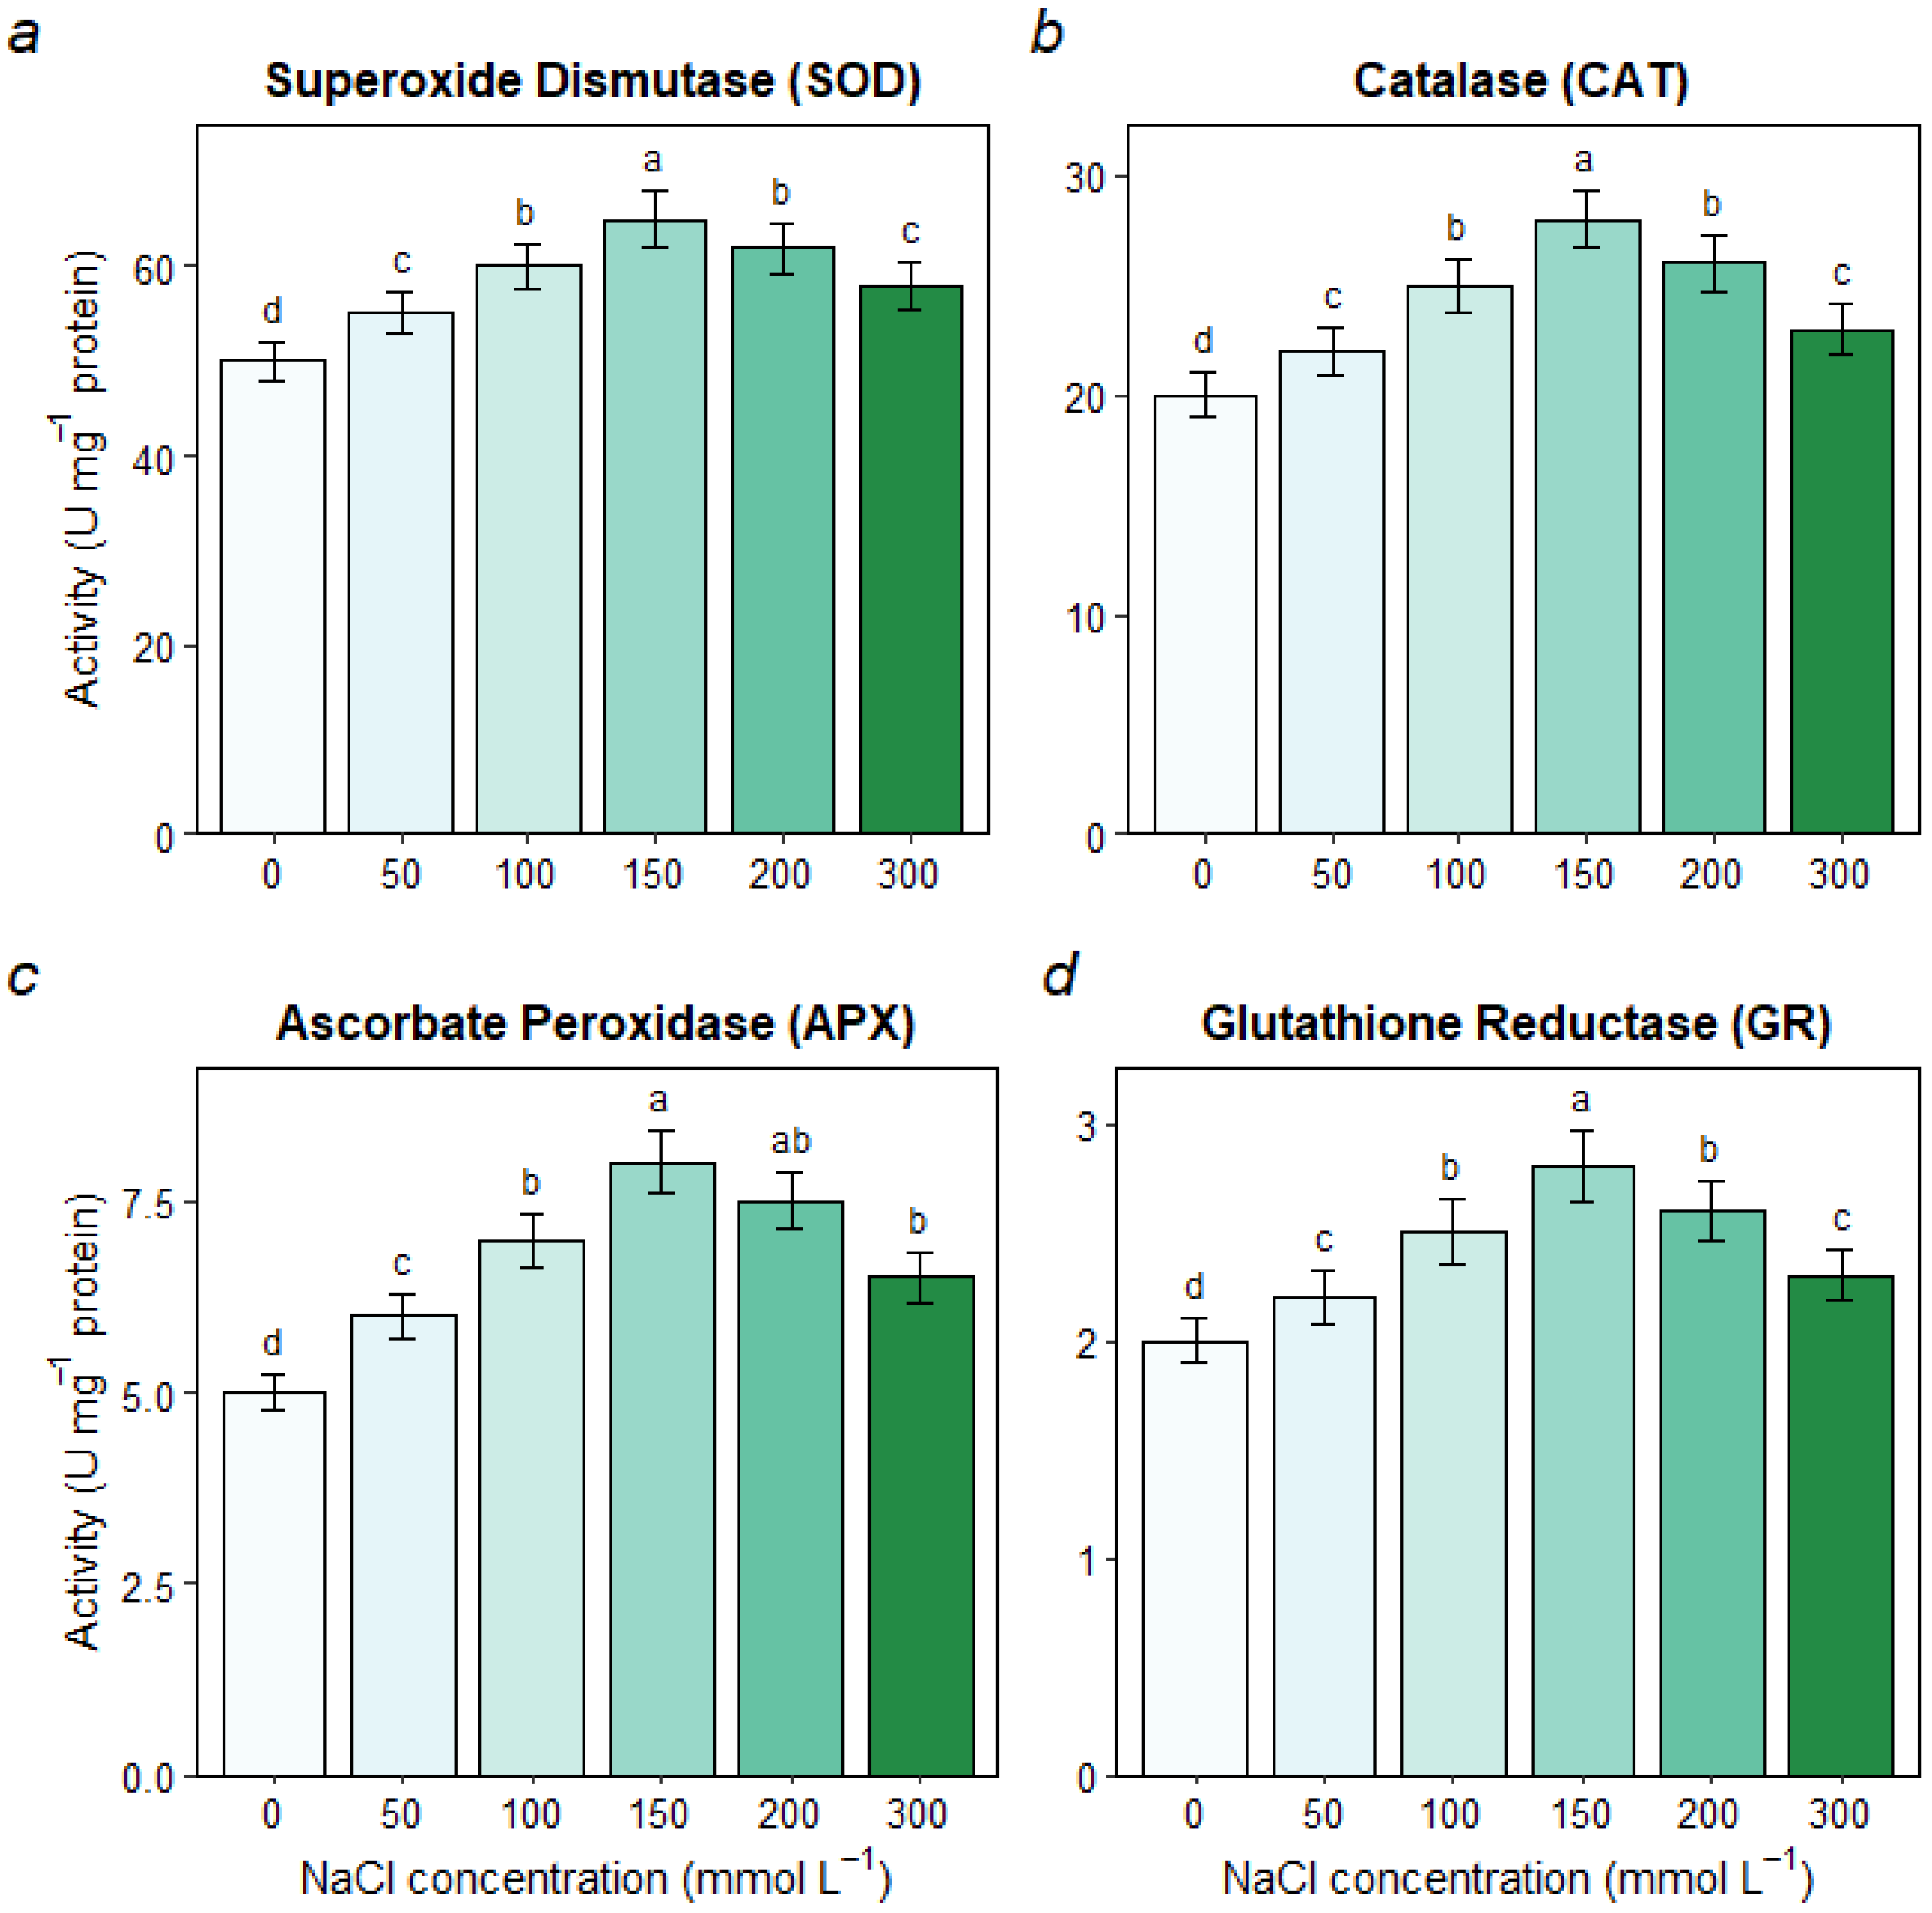
  • Evaluating the dynamics of the antioxidant system by measuring ROS indicators (MDA, H2O2) and the activities of key antioxidant enzymes (SOD, CAT, APX, GR).
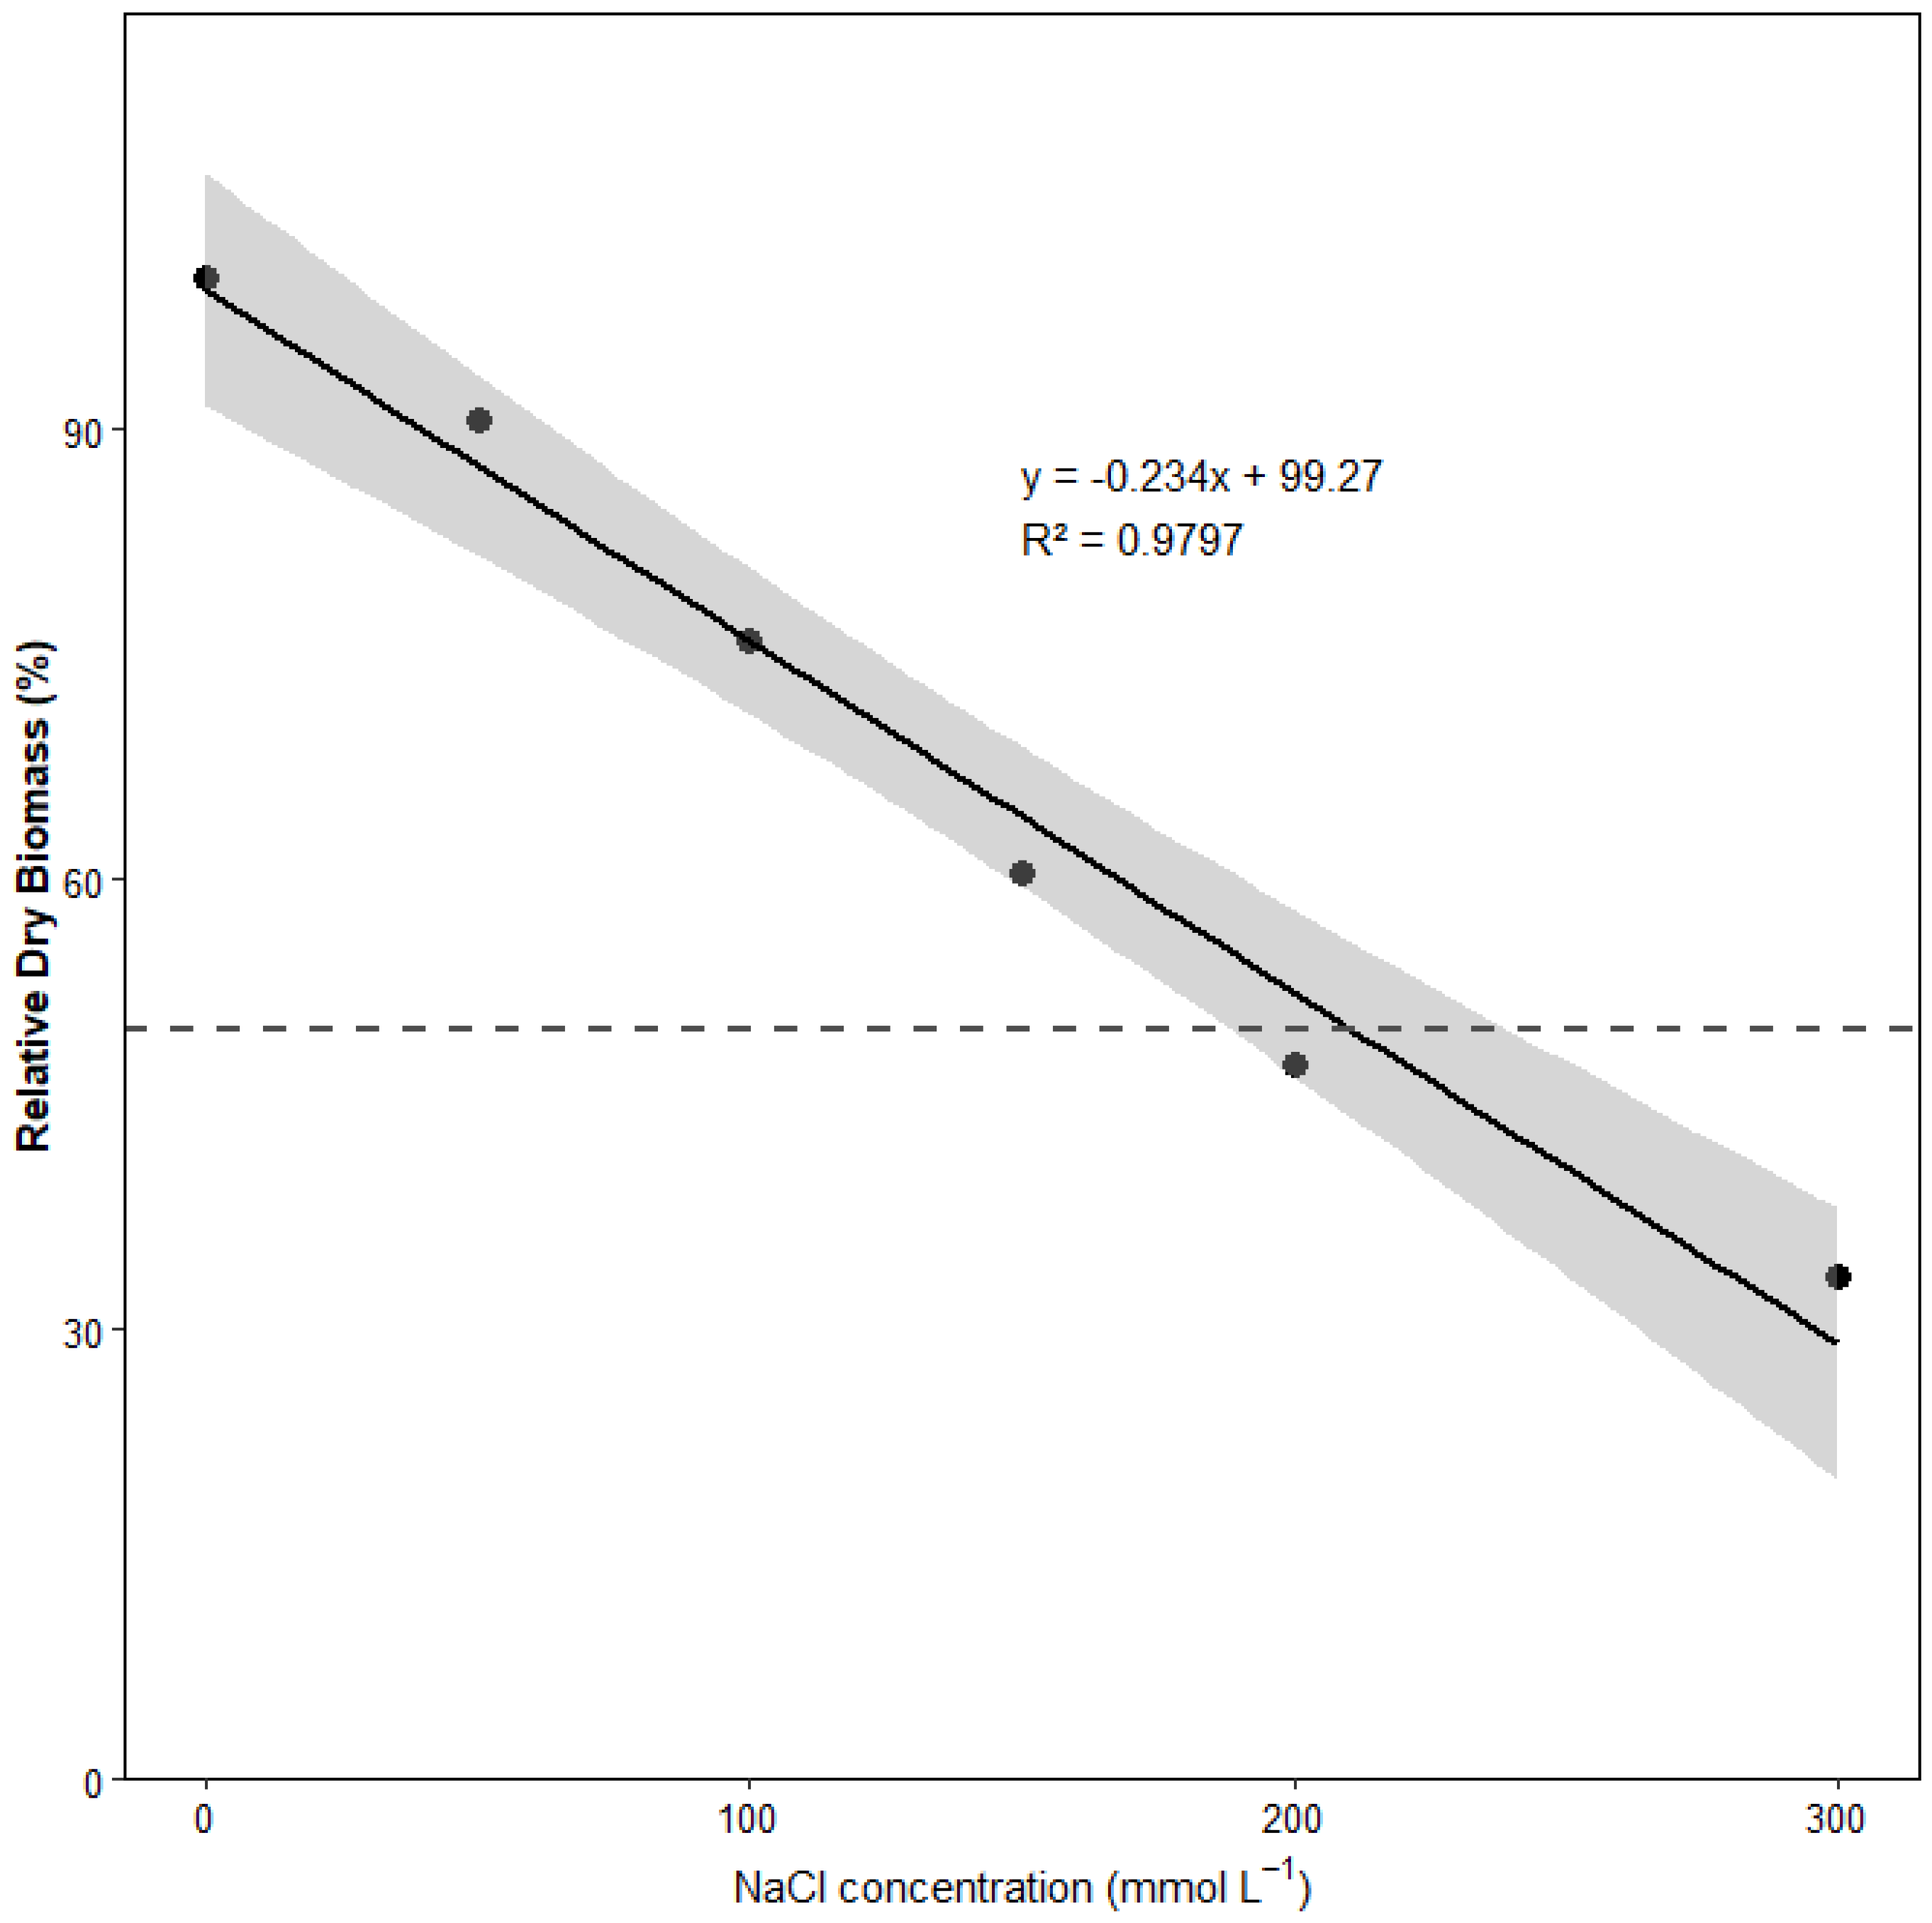
  • Establishing a salt tolerance threshold (LC50) based on biomass reduction.
We hypothesized that (i) ‘Tailai Sang’ mulberry seedlings would exhibit significant osmotic adjustment and antioxidant enzyme induction under moderate salt stress; (ii) their salt tolerance would be strongly associated with an ability to restrict Na+ accumulation in leaves; and (iii) a definable tolerance threshold exists, beyond which these protective mechanisms become overwhelmed, leading to a sharp decline in physiological function and growth.

2. Materials and Methods

2.1. Plant Material and Growth Conditions

The experiment was conducted using two-year-old seedlings of mulberry (Morus alba L. ‘Tailai Sang’), a cultivar widely grown in Heilongjiang Province, China. Seedlings of uniform size (approximately 25 cm in height and 5 mm in stem diameter) were selected for the study. The seedlings were transplanted into 3.0 L plastic pots, each filled with a sterilized mixture of peat, river sand, and perlite (3:1:1, v/v/v). The substrate pH was maintained at 6.5 ± 0.2. All pots were placed in a greenhouse under controlled conditions: temperature of 25 ± 2 °C, relative humidity of 60 ± 5%, and a 16 h light/8 h dark photoperiod with a photosynthetic photon flux density (PPFD) of 600 µmol m−2 s−1. To allow for acclimation, all plants were irrigated with half-strength Hoagland’s nutrient solution to field capacity every 3 days for 2 weeks prior to the start of the treatments [18].

2.2. Salt Stress Treatments

After the acclimation period, seedlings were randomly divided into six groups (n = 10 per group, with 3 biological replicates for all measurements). The groups were subjected to different concentrations of NaCl solution: 0 (S0, control), 50 (S50), 100 (S100), 150 (S150), 200 (S200), and 300 (S300) mmol L−1. The salt solutions, prepared with half-strength Hoagland’s solution, were applied via subirrigation every 3 days for a total duration of 28 days. To prevent osmotic shock, the NaCl concentration was increased incrementally by 50 mmol L−1 each day until the final target concentrations were reached for each treatment group.

2.3. Measurement of Growth and Biomass

At the end of the 28-day treatment period, seedling height and stem basal diameter were measured using a ruler (±0.1 cm) and a digital caliper (±0.01 mm), respectively. The plants were then harvested and separated into shoots and roots. The plant parts were oven-dried at 75 °C to a constant weight, and their dry biomass was recorded using an electronic balance (±0.01 g).

2.4. Photosynthetic Gas Exchange and Chlorophyll Fluorescence

Photosynthetic gas exchange parameters were measured on the youngest, fully expanded leaf of each plant between 9:00 and 11:00 a.m. using a LI-6400 portable photosynthesis system (LI-COR, PPSystem, Lincoln, NE, USA). Measurements included the net photosynthetic rate (Pn), stomatal conductance (Gs), intercellular CO2 concentration (Ci), and transpiration rate (Tr). The conditions inside the leaf chamber were maintained at a PPFD of 1000 µmol m−2 s−1, a leaf temperature of 25 °C, and a CO2 concentration of 400 µmol mol−1.
Chlorophyll fluorescence was measured on the same leaves using a portable fluorometer (Handy-PEA, Hansatech, Pentney, UK) after a 30 min dark adaptation period. The maximum quantum yield of PSII photochemistry was calculated as Fv/Fm = (FmFo)/Fm, where Fo and Fm are the minimal and maximal fluorescence, respectively [19].

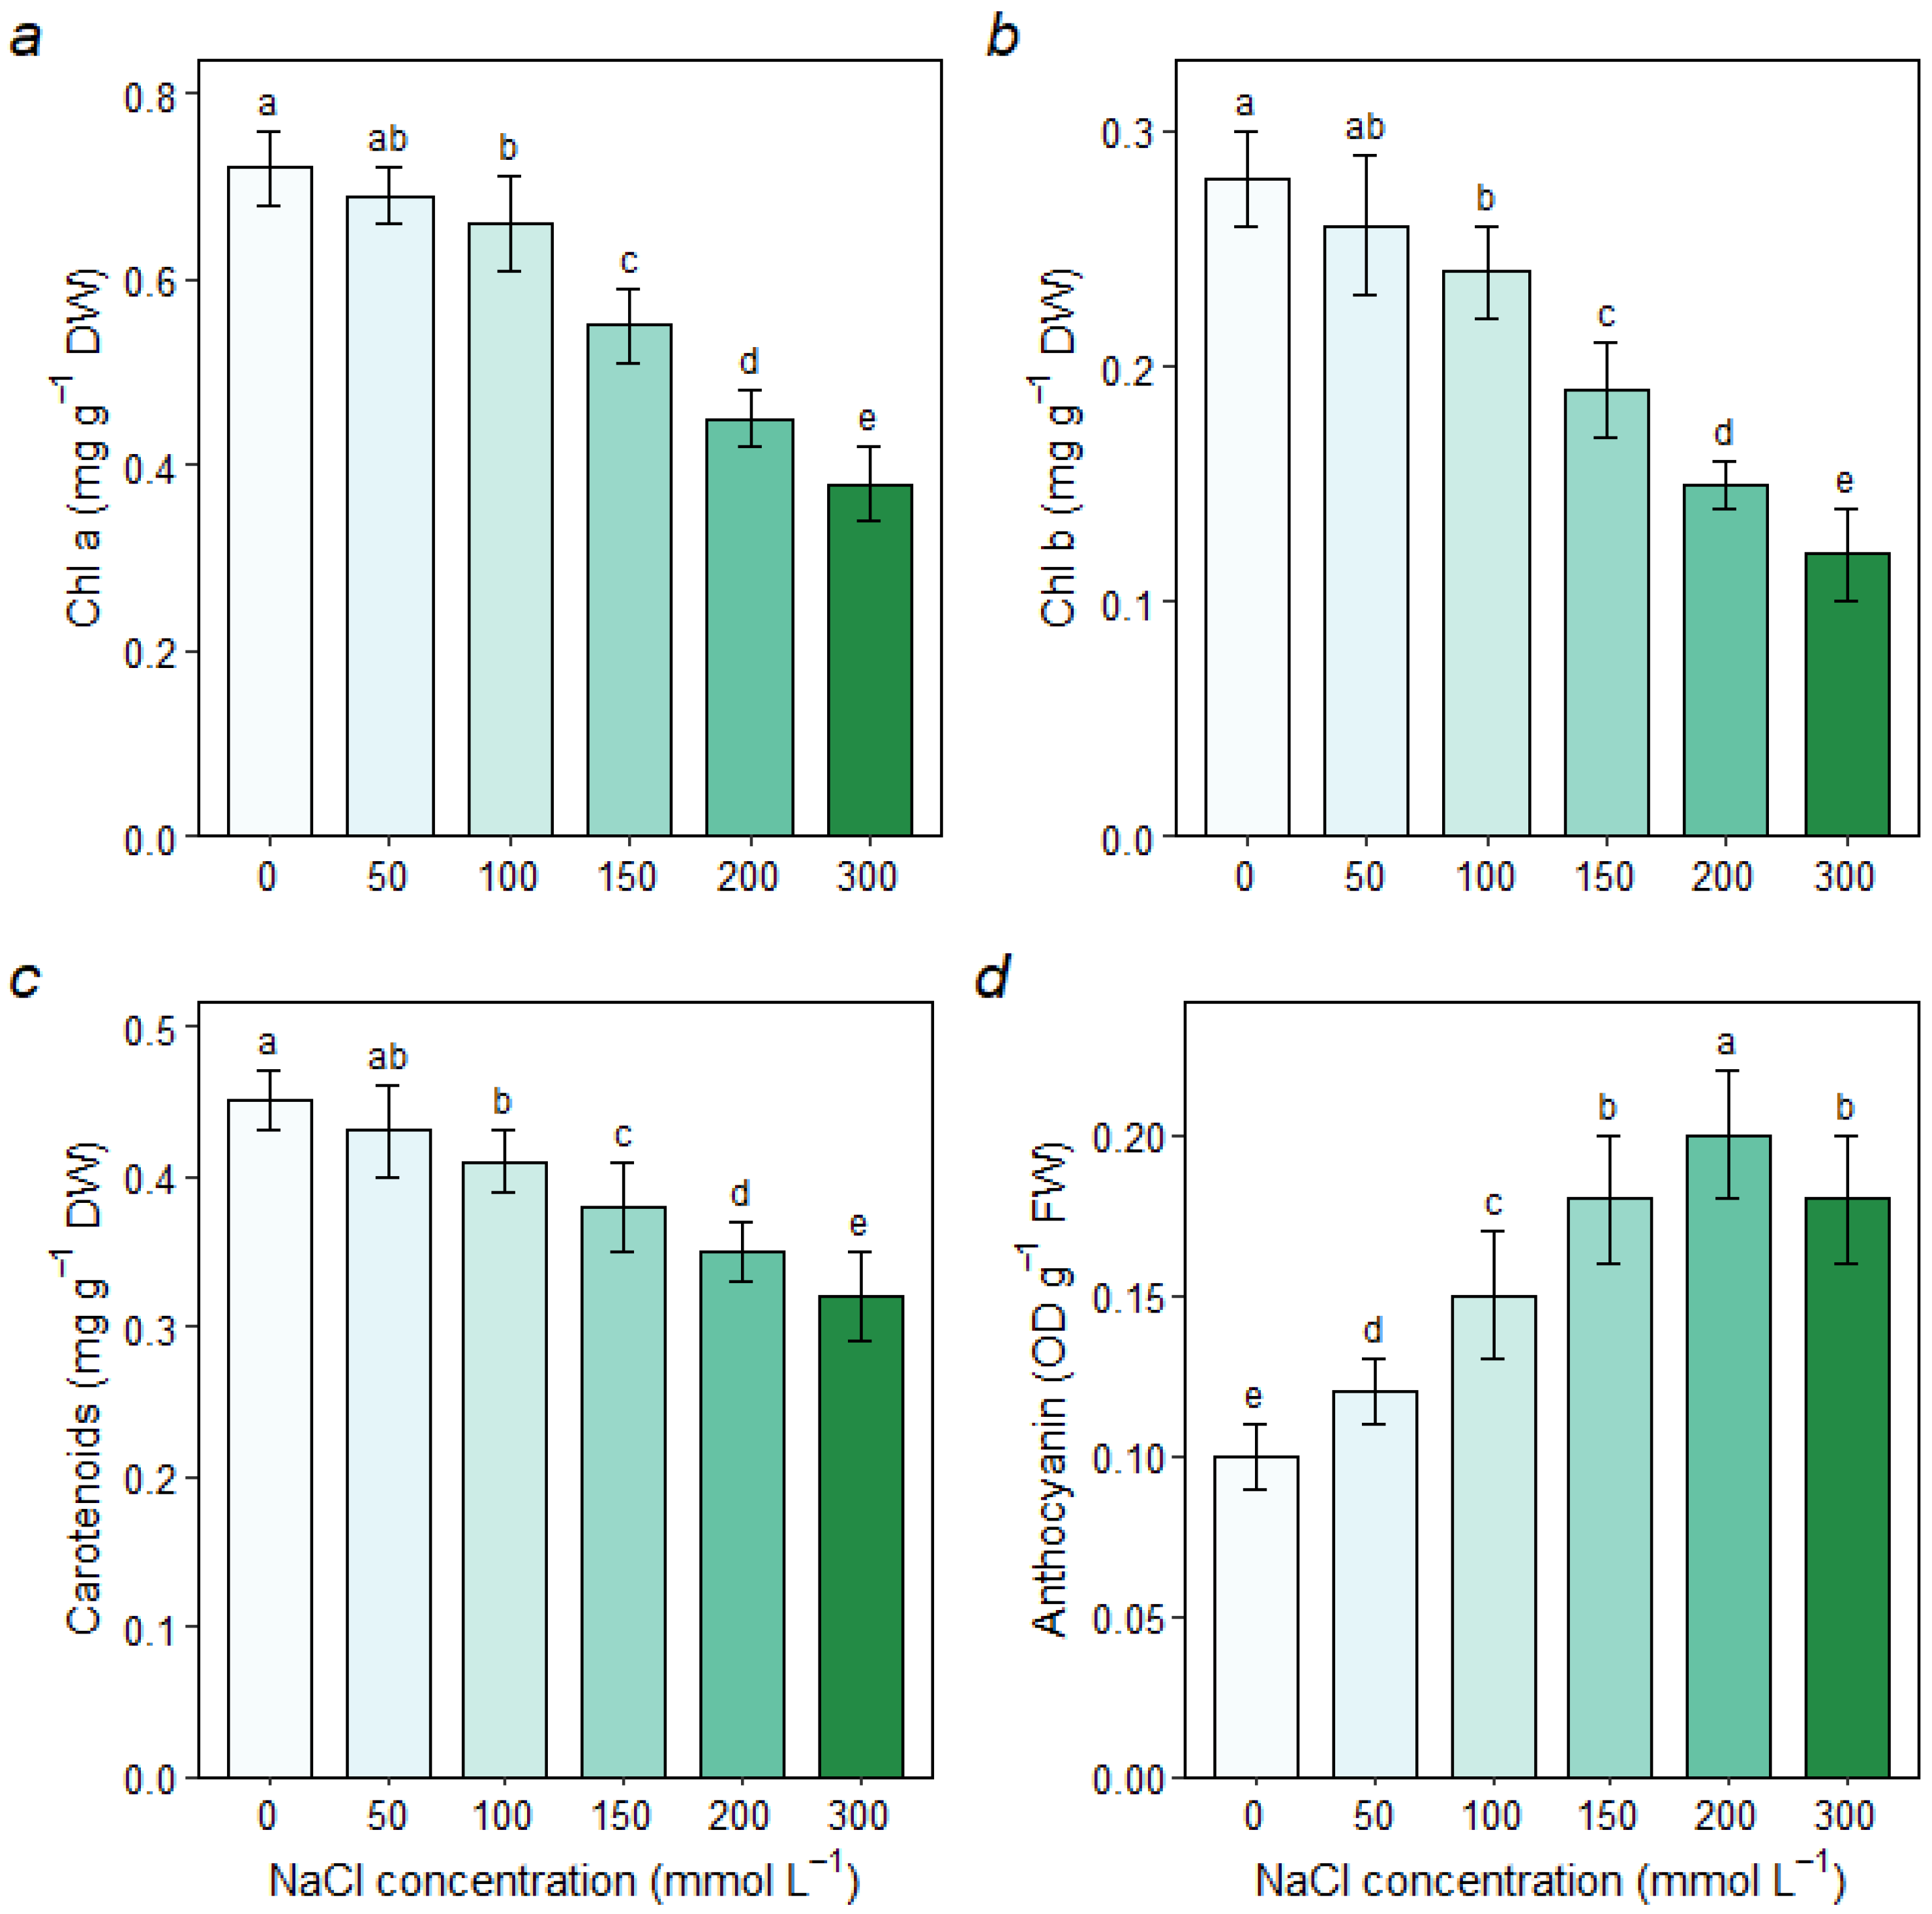
2.5. Photosynthetic Pigments and Anthocyanins

Leaf discs (0.5 g fresh weight) were homogenized and extracted in 80% acetone in darkness for 24 h. The concentrations of chlorophyll a (Chl a), chlorophyll b (Chl b), and total carotenoids (Car) were determined spectrophotometrically by measuring the absorbance at 663, 646, and 470 nm, according to the method described by Wellburn (1994) [20]. Anthocyanin content was measured using the dual-wavelength method after extraction in acidified methanol (1% HCl in methanol), with absorbance readings at 530 and 657 nm [21].

2.6. Osmotic Regulators and Ion Content

Free proline content was extracted in 3% (w/v) sulfosalicylic acid and quantified using the ninhydrin reaction method at 520 nm [22]. Soluble sugars were measured by the anthrone–sulfuric acid colorimetric method. Soluble protein was determined using the bicinchoninic acid (BCA) assay.
For ion analysis, oven-dried root and leaf samples (0.5 g) were digested using a nitric acid–perchloric acid method. The concentrations of Na+ and K+ in the digested solutions were measured using an atomic absorption spectrophotometer (AAS).

2.7. Oxidative Stress Markers and Antioxidant Enzymes

Lipid peroxidation was estimated by measuring the malondialdehyde (MDA) content using the thiobarbituric acid (TBA) reaction, with absorbance corrections at 532 and 600 nm [22]. Hydrogen peroxide (H2O2) content was determined based on the formation of a titanium-peroxide complex, measured at 415 nm.
For enzyme assays, fresh leaf samples were homogenized in a pre-chilled phosphate buffer (pH 7.8). The activities of superoxide dismutase (SOD), catalase (CAT), ascorbate peroxidase (APX), and glutathione reductase (GR) were determined spectrophotometrically following standard protocols as described in previous studies [4,16,23].

2.8. Statistical Analysis

All data were expressed as the mean ± standard deviation (SD) of three biological replicates. One-way analysis of variance (ANOVA) was performed using SPSS 22.0 (IBM Corp., Armonk, NY, USA). Fisher’s least significant difference (LSD) test was used for multiple comparisons among treatment means, with a significance level set at p < 0.05. Different letters in tables and figures indicate significant differences between treatments. The salt tolerance threshold (LC50) was estimated by fitting the relative dry biomass data to a nonlinear, four-parameter sigmoidal dose–response model. Pearson correlation analysis was performed to evaluate the relationships among all measured parameters, and the results were visualized as a heatmap.

3. Results

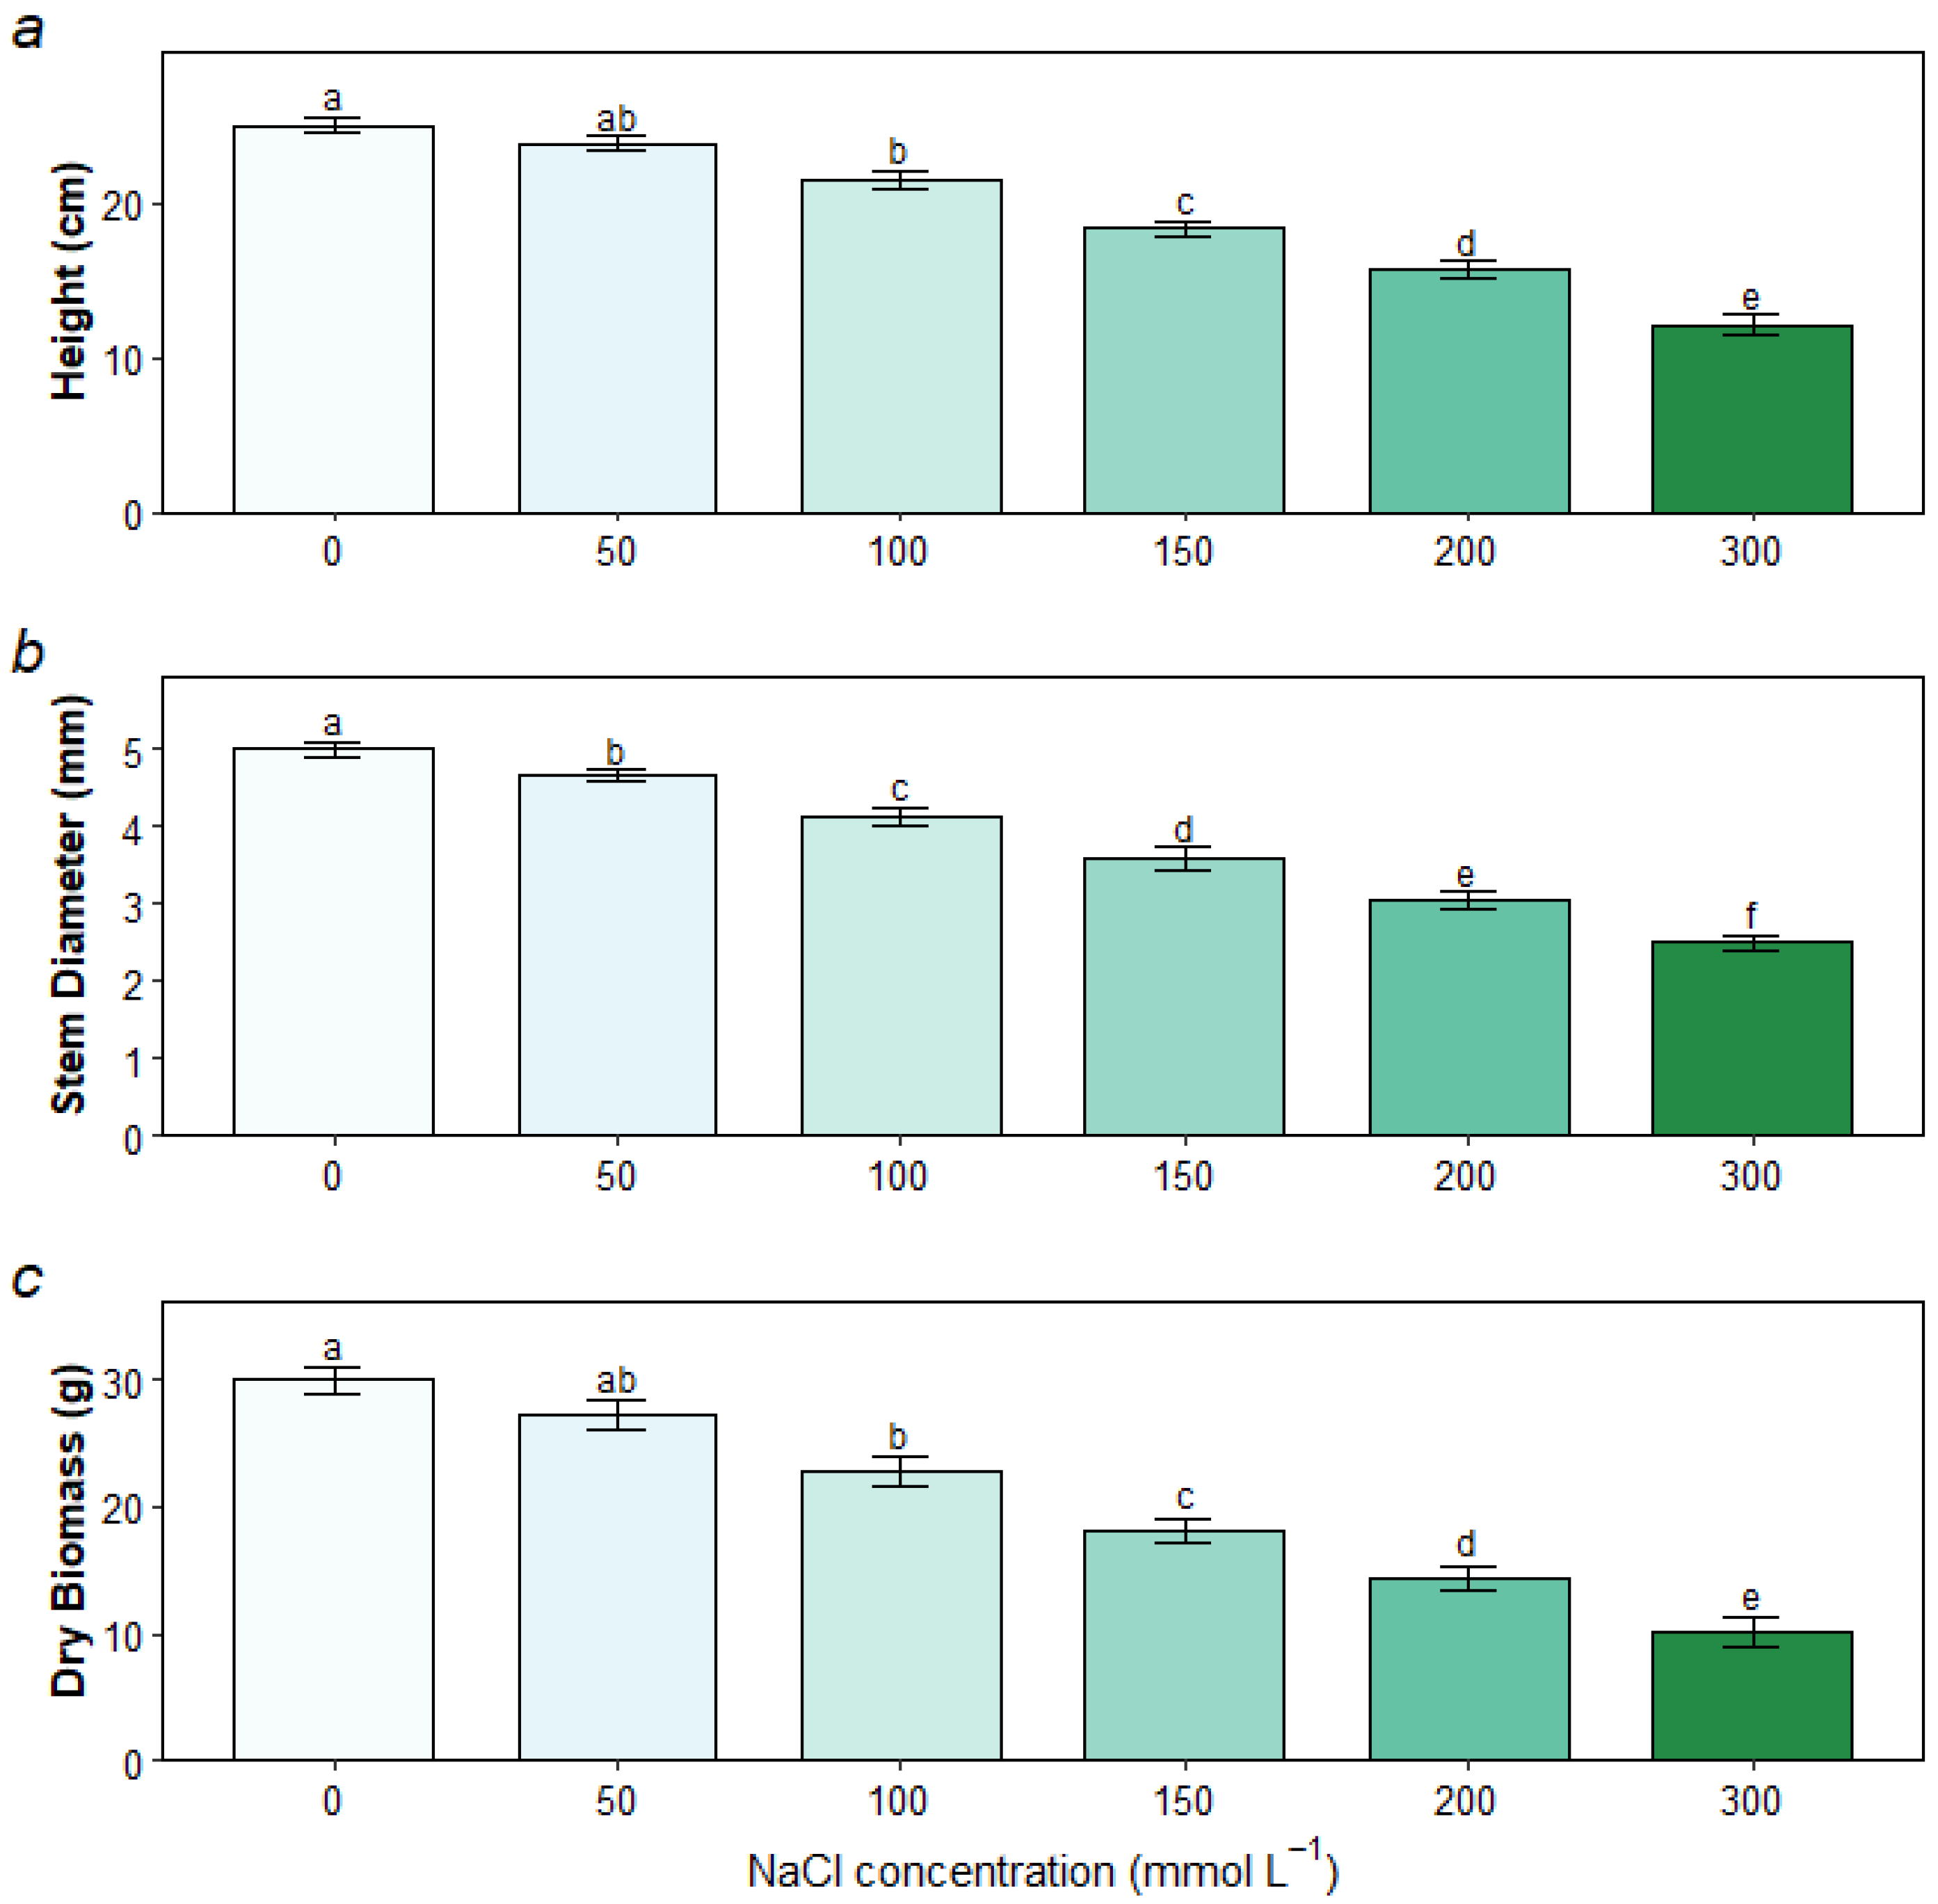
3.1. Growth and Biomass Responses to Salt Stress

The visible symptoms of salt stress became more pronounced with increasing NaCl concentration (Figure 1). Compared to the vigorous growth of the control group (S0), seedlings in high-concentration treatments (≥150 mmol L−1) exhibited significant growth retardation, leaf chlorosis (yellowing), and wilting. At 300 mmol L−1, severe leaf necrosis and defoliation were observed, indicating acute salt toxicity.

3.2. Photosynthetic Performance Under Salt Stress

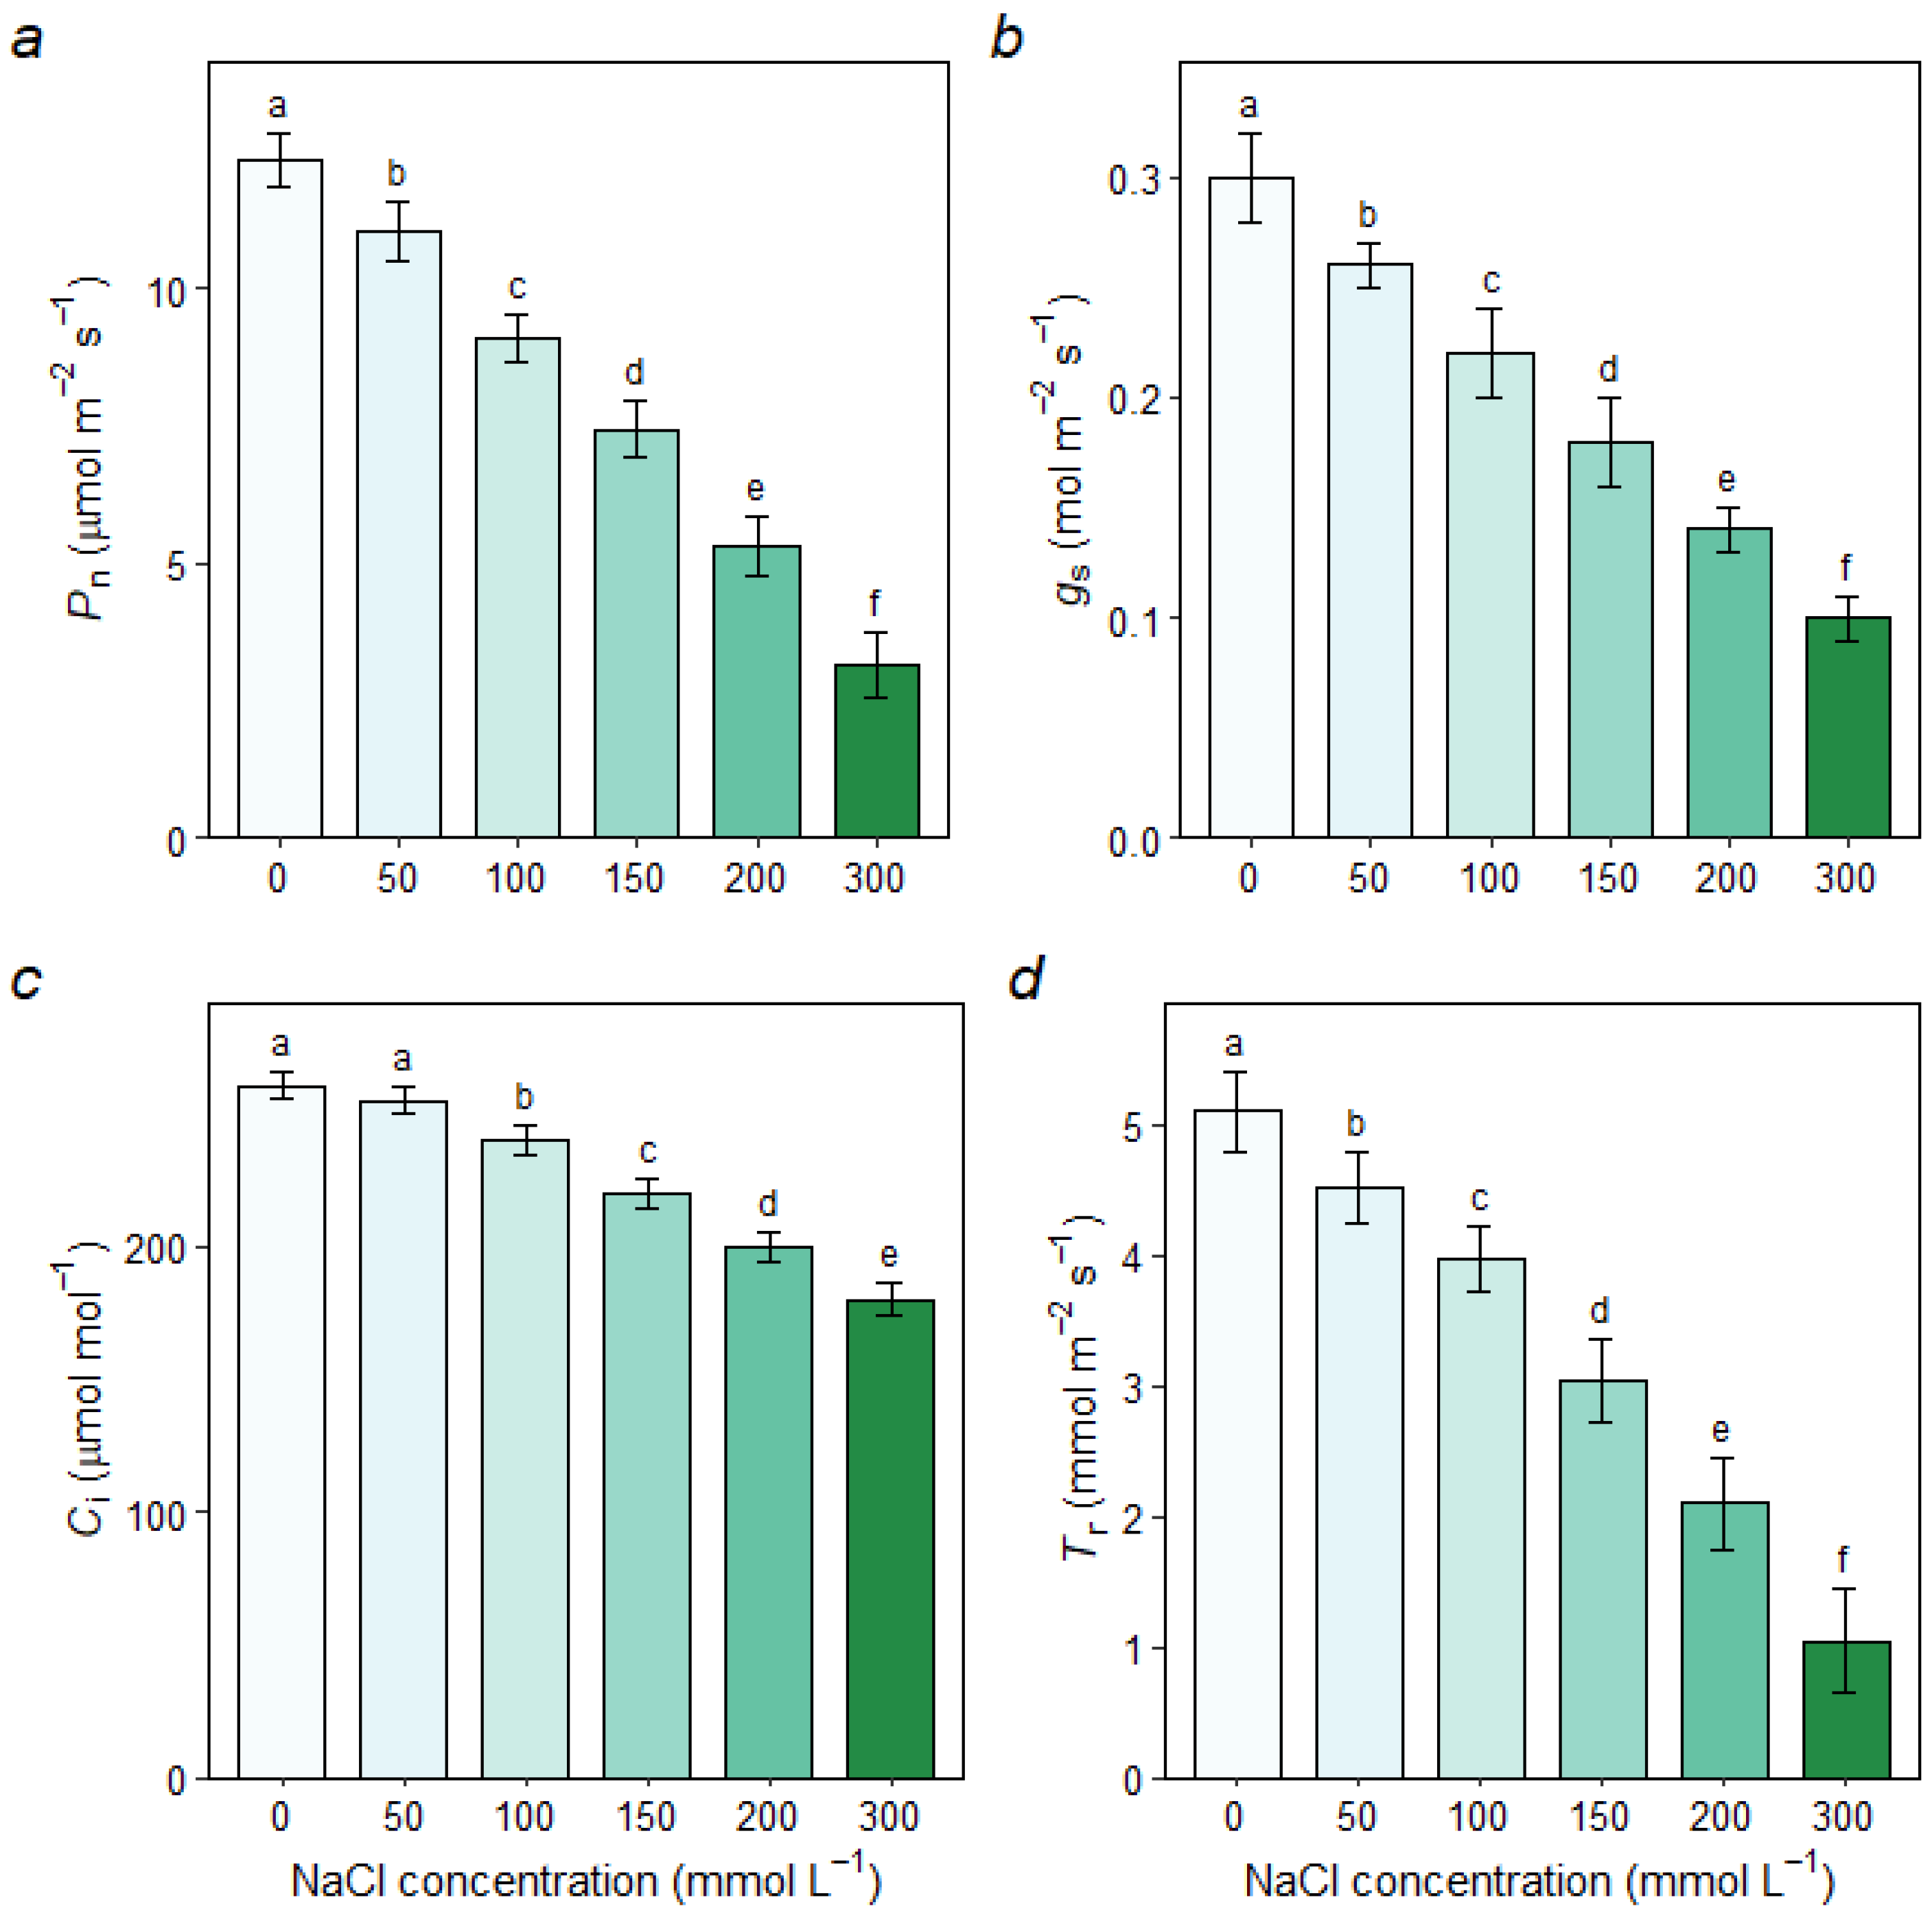
3.2.1. Gas Exchange Parameters

Salt stress negatively impacted the photosynthetic gas exchange functions of the mulberry seedlings. As illustrated in Figure 2, the net photosynthetic rate (Pn), stomatal conductance (Gs), and transpiration rate (Tr) all decreased continuously with rising salt concentrations. The Pn was 12.36 µmol m−2 s−1 in the control (S0) but dropped sharply to 7.45 and 3.15 µmol m−2 s−1 under S150 and S300 treatments, respectively. The trends for Gs and Tr were highly consistent with that of Pn, suggesting that stomatal closure was a primary cause of the decline in photosynthetic capacity (stomatal limitation). Interestingly, the intercellular CO2 concentration (Ci) also decreased as stress intensified, which implies that non-stomatal factors might also be limiting photosynthesis.

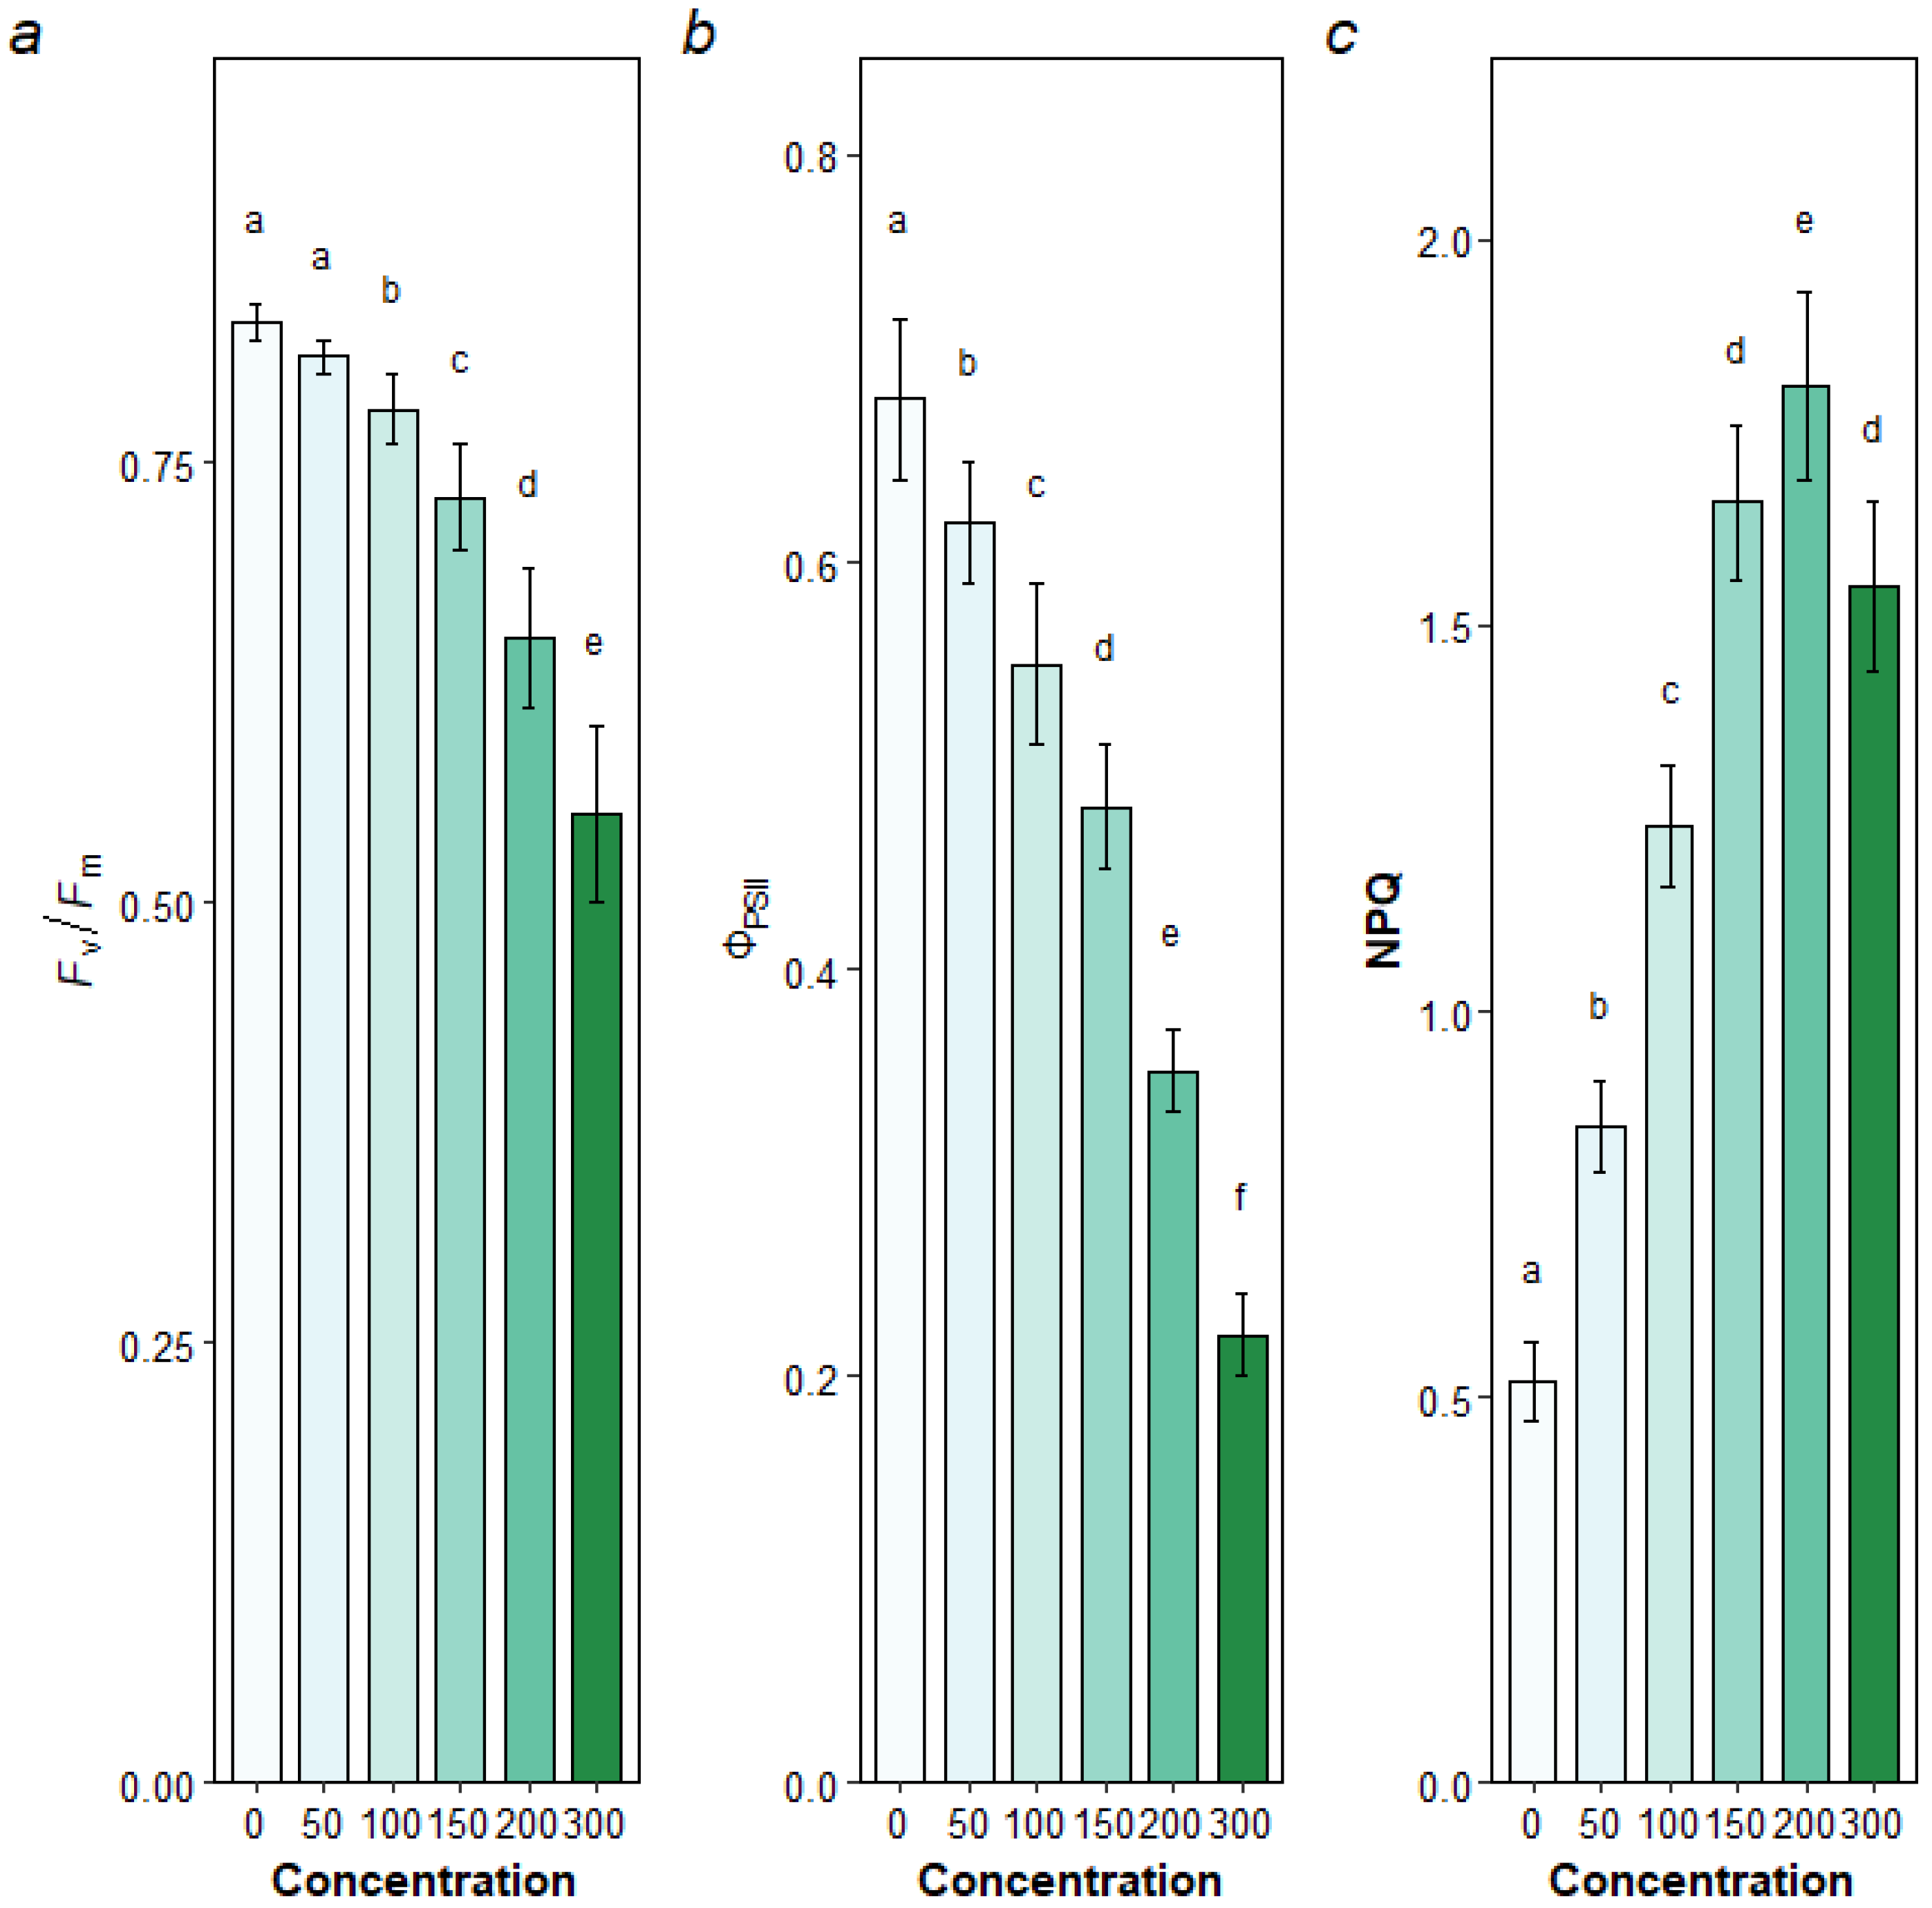
3.2.2. Chlorophyll Fluorescence Parameters

To further investigate the non-stomatal limitations on photosynthesis, we measured chlorophyll fluorescence parameters. As shown in Figure 3, the maximum quantum efficiency of PSII (Fv/Fm) remained relatively stable under low to moderate stress (S50, S100) but decreased sharply when the NaCl concentration exceeded 150 mmol L−1. This indicates that high salt stress caused significant photoinhibitory damage to the PSII reaction centers. Correspondingly, the actual quantum efficiency of PSII (ΦPSII) also showed a continuous decline. In contrast, non-photochemical quenching (NPQ) increased significantly with stress intensity, peaking at the S200 treatment. This suggests that the seedlings activated heat dissipation mechanisms to protect the photosynthetic apparatus from excess light energy. These fluorescence data provide direct evidence for “non-stomatal limitation” under salt stress.

3.3. Changes in Photosynthetic Pigments

Salt stress led to the degradation of photosynthetic pigments. As shown in Figure 4, the contents of chlorophyll a, chlorophyll b, total chlorophyll, and carotenoids all decreased significantly with increasing salinity. At 300 mmol L−1, the total chlorophyll content was only 50% of that in the control group. Conversely, the content of anthocyanins, which act as stress-responsive and photoprotective pigments, progressively accumulated from S0 to S200, reaching a peak at the S200 concentration before declining slightly at S300. This trend points to an enhanced photoprotective capacity under stress.

3.4. Accumulation of Osmotic Regulators

To cope with the osmotic stress imposed by salinity, mulberry seedlings significantly increased the synthesis of compatible solutes. As shown in Figure 5, the contents of soluble sugars, soluble proteins, and free proline all rose significantly with increasing NaCl concentration. Proline, in particular, exhibited a dramatic accumulation, with its content under the 200 mmol L−1 (S200) treatment reaching four times that of the control group. This highlights the central role of these osmolytes in maintaining cellular turgor and protecting cell structures under salt stress.

3.5. Ion Homeostasis Under Salt Stress

Maintaining ion homeostasis, particularly a low Na+ concentration in leaves, is a key salt tolerance strategy. As shown in Figure 6, mulberry seedlings demonstrated an effective ion partitioning strategy. With increasing external NaCl levels, Na+ was preferentially accumulated in the roots, while its accumulation in the leaves was significantly restricted, especially at concentrations below 150 mmol L−1. This allowed the leaves to maintain a high K+/Na+ ratio. However, at concentrations of 200 and 300 mmol L−1, the sequestration capacity of the roots appeared to be compromised, leading to a sharp increase in leaf Na+ content and a corresponding collapse of the K+/Na+ ratio, which coincided with severe growth inhibition.

3.6. Oxidative Stress and Antioxidant Enzyme Activities

The salt stress induced oxidative damage, as indicated by the significant accumulation of malondialdehyde (MDA) and H2O2 (Figure 7). In response, the seedlings’ antioxidant defense system was activated. As shown in Figure 8, the activities of four key antioxidant enzymes—superoxide dismutase (SOD), catalase (CAT), ascorbate peroxidase (APX), and glutathione reductase (GR)—were all significantly induced under moderate salt stress, reaching their maximum activities at 150 mmol L−1. Beyond this point, at higher concentrations (S200 and S300), the activities of these enzymes declined, suggesting that the defense system was overwhelmed by excessive ROS production under severe stress.

3.7. Estimated Salt Tolerance Threshold

By performing a nonlinear sigmoidal regression analysis on the relatively dry biomass against the corresponding NaCl concentrations (Figure 9), the salt concentration causing a 50% reduction in biomass (LC50) was calculated. The estimated LC50 for ‘Tailai Sang’ mulberry seedlings was 179.41 mmol L−1, providing a quantitative benchmark for its salt tolerance.

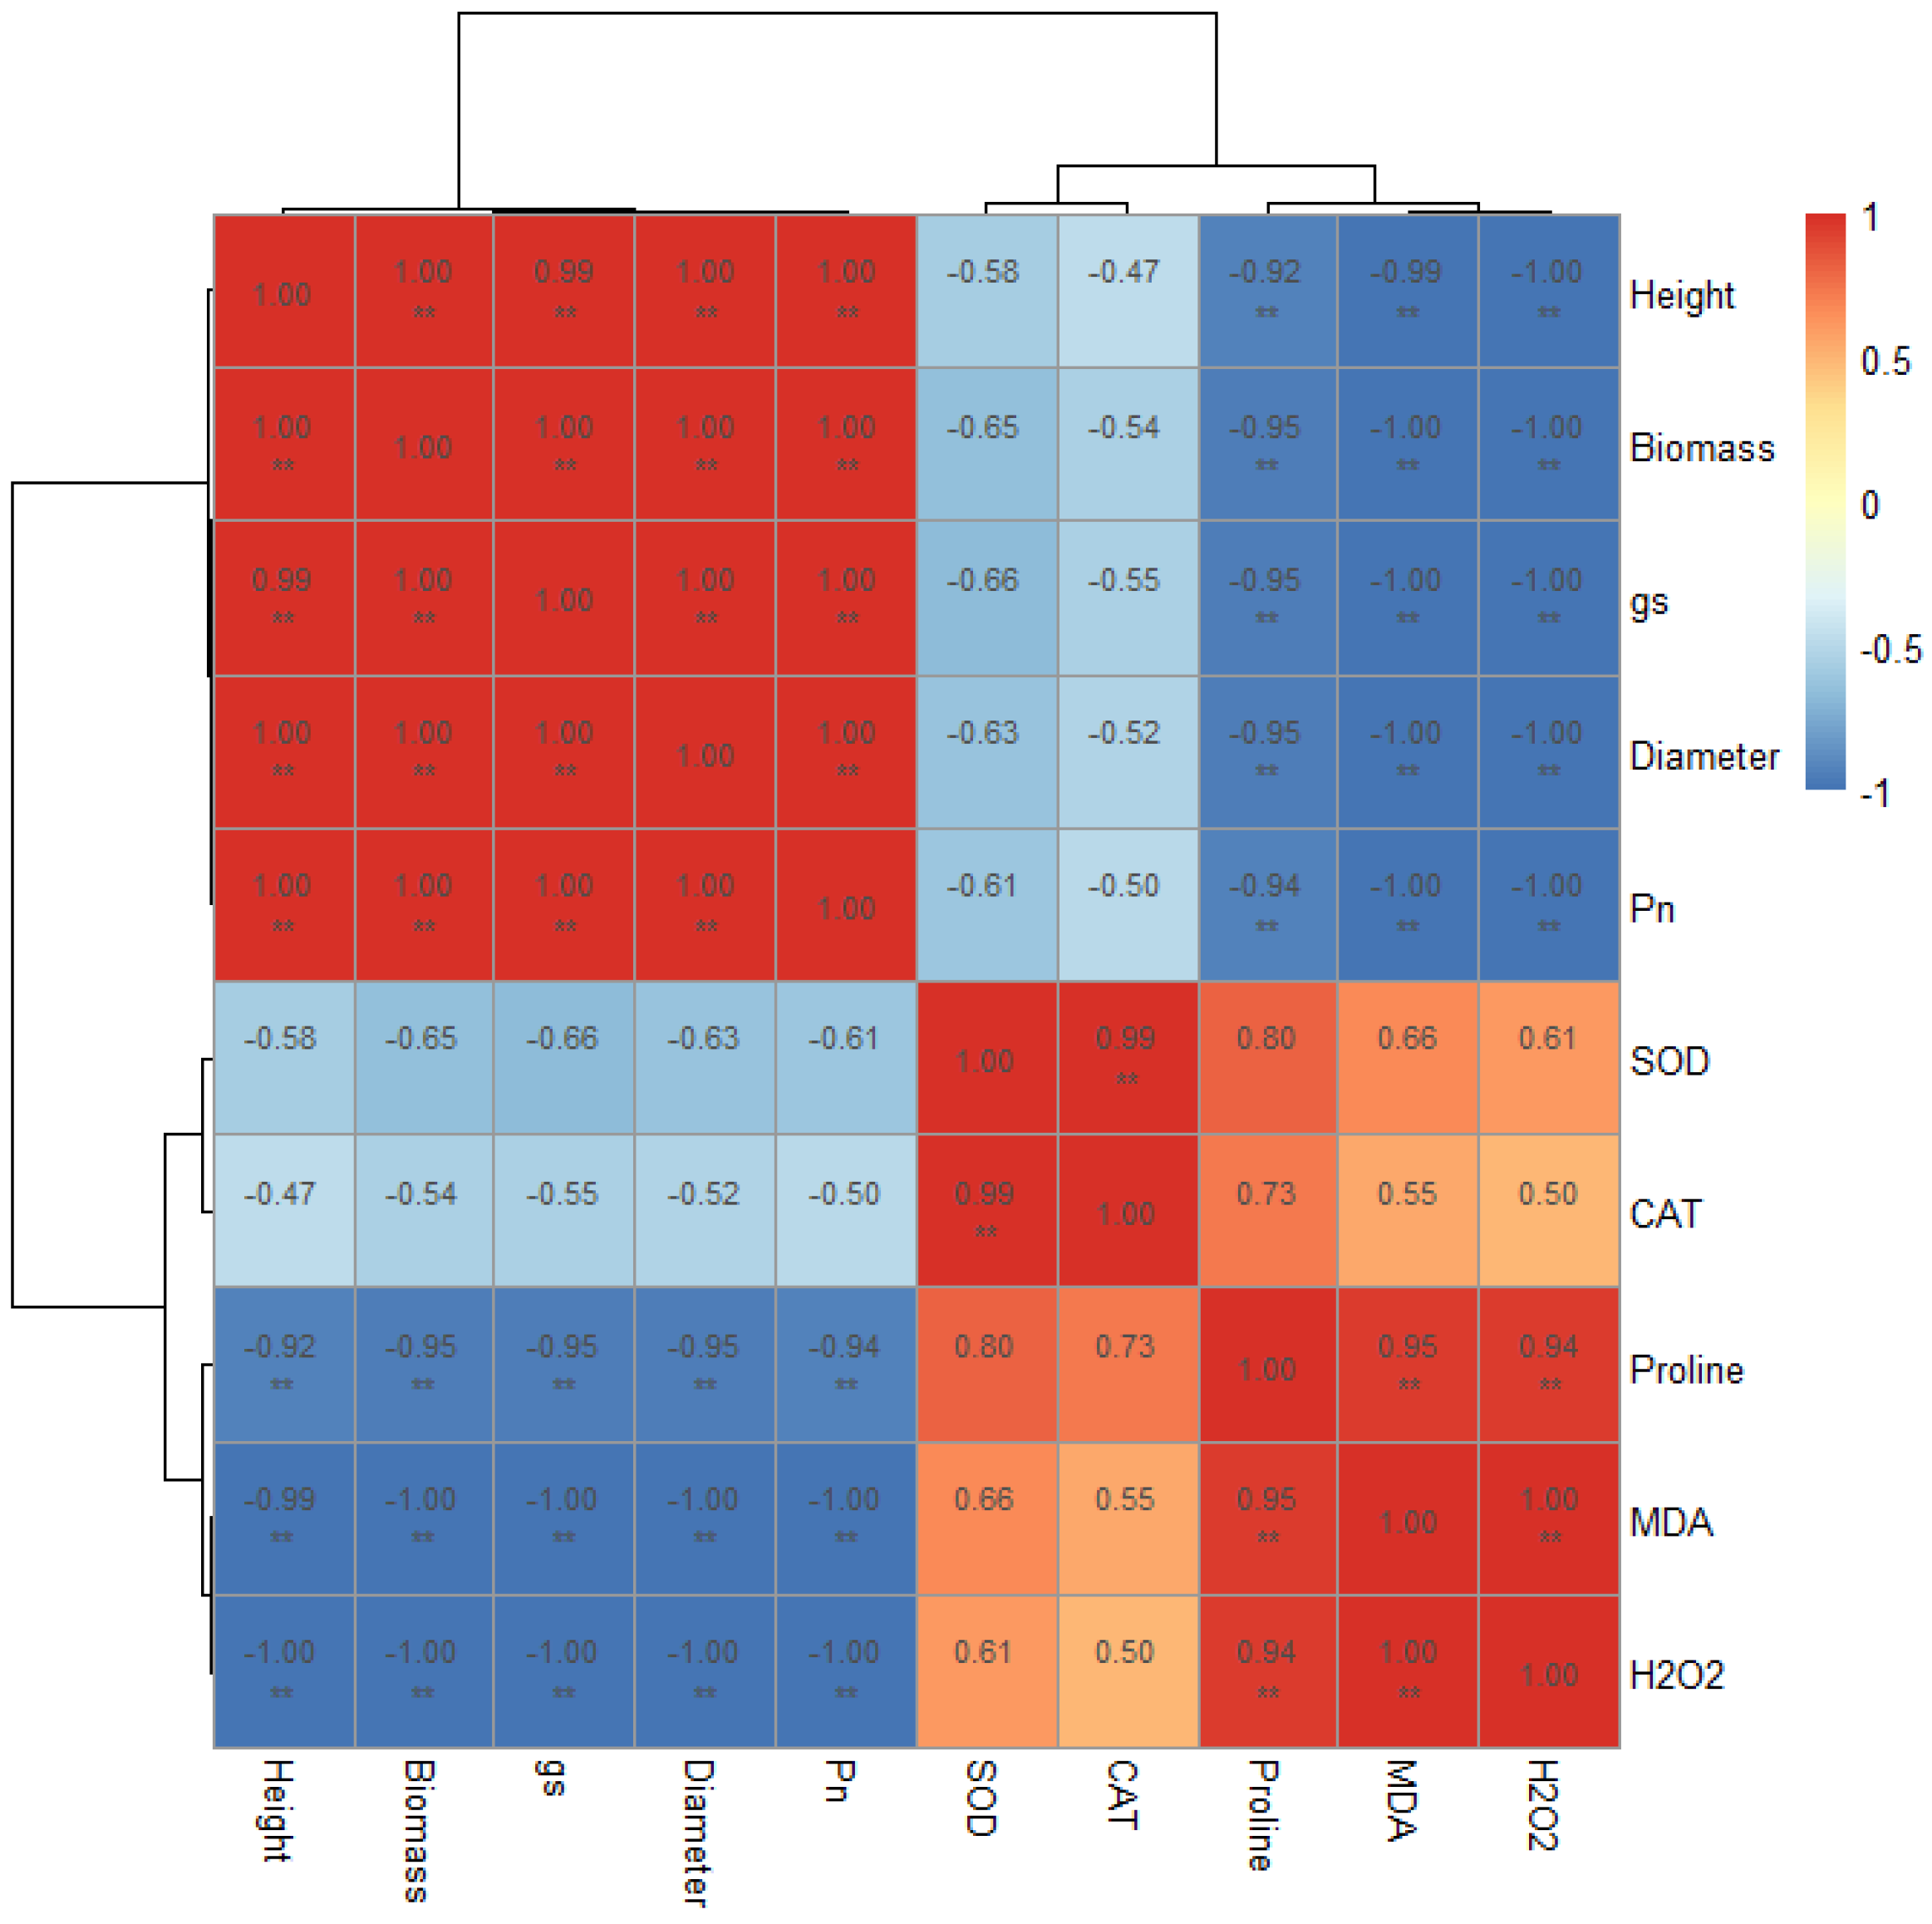
3.8. Correlation Analysis Among Measured Parameters

To understand the relationships between different physiological responses, a Pearson correlation analysis was performed (Figure 10). The results revealed several strong correlations. Growth and photosynthetic parameters (height, biomass, gs, diameter, Pn) were all highly positively correlated with each other (r ≥ 0.99), while stress indicators (Proline, MDA, H2O2) also showed strong positive inter-correlations (r ≥ 0.94).
Critically, a strong negative correlation was observed between the growth/photosynthesis group and the stress indicator group. For instance, net photosynthetic rate (Pn) was perfectly negatively correlated with MDA content (r = −1.00) and H2O2 content (r = −1.00), indicating a direct link between oxidative damage and photosynthetic inhibition. Similarly, proline content was strongly negatively correlated with height (r = −0.92) and biomass (r = −0.95). The antioxidant enzymes SOD and CAT showed moderate positive correlations with stress indicators like proline (r = 0.80 for SOD) and MDA (r = 0.66 for SOD).

4. Discussion

This study provides a comprehensive physiological assessment of two-year-old ‘Tailai Sang’ mulberry seedlings in response to a gradient of NaCl stress. Our findings reveal a coordinated, multi-faceted strategy for salt tolerance, which ultimately defines the threshold beyond which cellular homeostasis can no longer be maintained.

4.1. Growth Inhibition Is a Consequence of Impaired Photosynthesis

The observed dose-dependent decline in plant height, stem diameter, and biomass accumulation is a classic plant response to salinity, consistent with findings in other woody species such as Populus and Broussonetia papyrifera [4,16]. This growth inhibition is primarily a consequence of reduced photosynthetic carbon assimilation [18]. Our results indicate that the decline in net photosynthetic rate (Pn) stems from both stomatal and non-stomatal limitations, a dual-limitation model widely recognized in stress physiology [15].
Initially, under moderate stress, the parallel decrease in Pn and stomatal conductance (gs) suggests that stomatal closure is a key factor, likely as a mechanism to conserve water under osmotic stress. However, the accompanying decrease in intercellular CO2 concentration (Ci) at these stages suggests that the photosynthetic machinery’s demand for CO2 was still high. Under severe stress (>150 mmol L−1), the sharp decline in the maximum quantum efficiency of PSII (Fv/Fm) provides direct evidence of non-stomatal limitation. This indicates photo-oxidative damage to the PSII reaction centers, impairing the plant’s ability to utilize light energy and fix CO2 even if it were available. Furthermore, the substantial accumulation of Na+ and unmeasured Cl in the leaves at high salinity likely exerted direct toxic effects on metabolic processes in the chloroplast stroma, such as inhibiting key Calvin cycle enzymes like RuBisCO [2,6,20]. Therefore, the observed non-stomatal limitation is a composite effect of both damage to the light-harvesting apparatus and direct ion-induced metabolic inhibition.

4.2. Osmotic Adjustment and Ion Homeostasis Are Core Tolerance Strategies

To survive the initial osmotic shock, mulberry seedlings effectively accumulated compatible solutes, including soluble sugars, proteins, and, most notably, proline, which increased fourfold. This accumulation helps lower cellular water potential, maintain turgor, and protect cellular structures from dehydration [4,12,22].
Perhaps more critically, our results highlight the importance of ion homeostasis in mulberry’s salt tolerance. Tolerant woody plants typically limit the transport of toxic Na+ ions to the photosynthetically active leaves [9]. Our findings align perfectly with this strategy. The ‘Tailai Sang’ seedlings preferentially sequestered Na+ in the roots, thereby maintaining a relatively high K+/Na+ ratio in the leaves, which is essential for normal enzymatic functions [2,13]. The breakdown of this sequestration mechanism at concentrations above 150 mmol L−1, marked by a surge in leaf Na+ content and a collapse of the K+/Na+ ratio, directly correlates with the severe decline in photosynthesis and growth. This failure to control Na+ toxicity is likely the primary cause of physiological collapse under high salinity [2].

4.3. The Antioxidant System Provides Inducible but Saturable Defense

Salt stress invariably leads to the overproduction of reactive oxygen species (ROS), causing oxidative damage, as evidenced by the increase in MDA and H2O2 in our study [14,23]. In response, mulberry seedlings mounted a robust antioxidant defense. The activities of key ROS-scavenging enzymes—SOD, CAT, APX, and GR—were significantly upregulated under moderate stress, peaking at 150 mmol L−1. This “rise-and-fall” pattern is a hallmark of an adaptive but ultimately saturable defense system, and it has been similarly documented in closely related species like Broussonetia papyrifera [4].
This dynamic response provides insight into the seedlings’ tolerance versus sensitivity at a physiological level, as highlighted by the reviewer. The peak activity at 150 mmol L−1 can be interpreted as the limit of active tolerance, where the seedlings successfully adapt by deploying maximum enzymatic defense to maintain homeostasis. The subsequent decline at higher concentrations suggests that the ROS production rate exceeds the scavenging capacity of the antioxidant system. This marks a critical transition from a tolerant, adaptive state to a sensitive, damaging one, where cellular homeostasis begins to fail, ultimately leading to the observed severe growth inhibition.

4.4. Integrated Stress Response Network Revealed by Correlation Analysis

The correlation analysis (Figure 10) further clarifies the integrated nature of mulberry’s stress response network. The strong negative correlation between photosynthetic parameters (Pn, gs) and oxidative stress markers (MDA) provides compelling evidence that membrane lipid peroxidation is a key factor contributing to non-stomatal limitation of photosynthesis under high salinity. Furthermore, the positive correlation between proline and MDA suggests that, under these experimental conditions, proline accumulation is a direct response to the degree of oxidative stress rather than a preventative measure against its onset. This highlights a potentially compensatory, rather than protective, primary role for proline in this species.

4.5. Salt Tolerance Threshold and Implications for Cultivation

The calculated LC50 of 179.41 mmol L−1 provides a quantitative benchmark for the salt tolerance of ‘Tailai Sang’ mulberry seedlings. This threshold is comparable to or exceeds that of several other important woody species. For example, it is slightly lower than the threshold reported for the highly tolerant Populus euphratica (277 mmol L−1) but higher than that of the Populus cathayana (138 mmol L−1) [16].
This threshold is comparable to, or exceeds that of, several other important woody species. For example, it is slightly lower than the threshold reported for the highly tolerant Populus euphratica (277 mmol L−1) but higher than that of Populus cathayana (138 mmol L−1) [16,19,21]. More relevantly, this tolerance is notably higher than that reported for its relative in the Moraceae family, Broussonetia papyrifera, which showed severe damage at similar concentrations [4], suggesting that ‘Tailai Sang’ possesses a comparatively robust salt tolerance mechanism.

4.6. Limitations and Future Directions

While this study provides a comprehensive physiological overview, we acknowledge several limitations that open important avenues for future research. The findings are based on a short-term experiment on young seedlings under controlled greenhouse conditions. Consequently, the results primarily reflect initial acclimation and stress responses and may not fully predict long-term survival or productivity in the field, where stress is often chronic and coupled with other environmental variables [7,24,25]. Furthermore, our analysis of ion homeostasis was incomplete; as one reviewer correctly pointed out, the omission of chloride (Cl) analysis is a significant limitation, as Cl toxicity is a known major component of NaCl stress [1,2,26,27]. Future studies must include Cl analysis to fully dissect the components of ion toxicity. Similarly, while total biomass was measured, we did not analyze biomass partitioning into roots and shoots. The root–shoot ratio is a critical indicator of a plant’s resource allocation strategy under stress [22,28], and its absence limits our understanding of the whole-plant adaptive response. Our assessment of the antioxidant system was also confined to enzymatic components; a complete picture would require measuring non-enzymatic antioxidants like ascorbate and glutathione, which are key substrates in the AsA-GSH cycle [14]. Finally, the experiment was conducted under relatively low light conditions (600 µmol m−2 s−1), which may not fully represent field conditions where higher irradiance could exacerbate photo-oxidative stress and alter photosynthetic regulation [15,29,30]. Future research addressing these aspects through long-term field trials and more extensive biochemical analyses will be crucial for validating and expanding upon our findings.

5. Conclusions

This study demonstrates that the salt tolerance of two-year-old Morus alba ‘Tailai Sang’ seedlings is underpinned by a coordinated suite of physiological and biochemical mechanisms, which function effectively up to a stress level of approximately 150 mmol L−1 NaCl.
Increasing salinity caused a dose-dependent inhibition of growth and photosynthesis. The decline in photosynthetic rate was attributed to a combination of stomatal closure and non-stomatal damage to the PSII reaction centers, as confirmed by gas exchange and chlorophyll fluorescence data. To combat the dual effects of osmotic stress and Na+ toxicity, the seedlings employed three primary defense strategies: (1) Osmotic adjustment through the significant accumulation of compatible solutes, particularly proline and soluble sugars, to maintain cellular turgor; (2) ion homeostasis, achieved by preferentially sequestering Na+ in the roots to maintain a high K+/Na+ ratio in the photosynthetically active leaves; and (3) antioxidant defense, characterized by the induction of antioxidant enzymes (SOD, CAT, APX, and GR) to scavenge ROS, although this system became saturated under severe salinity.
The salt tolerance threshold (LC50) was quantitatively determined to be 179.41 mmol L−1, providing a critical benchmark for its cultivation. Collectively, these findings clarify that mulberry’s resilience to salt is not based on a single mechanism but on the coordinated interplay between osmotic regulation, selective ion partitioning, and antioxidant defense. This comprehensive understanding offers a robust and scientific basis for utilizing ‘Tailai Sang’ mulberry in the ecological restoration and productive use of saline lands.

Author Contributions

Conceptualization, N.X. and T.W.; methodology, N.X.; formal analysis, Y.W.; investigation, T.W. and J.D.; resources, Y.S.; writing—original draft, N.X. and Y.S.; writing—review and editing, N.X. and Y.S. All authors have read and agreed to the published version of the manuscript.

Funding

This research was supported by the Heilongjiang Province Natural Science Foundation (LH2022C053), the National Natural Science Foundation of China (31500323; 32101396), and the Heilongjiang Province postdoctoral research start-up foundation project (2022106).

Data Availability Statement

The original contributions presented in the study are included in the article, further inquiries can be directed to the corresponding author.

Conflicts of Interest

The authors declare no conflicts of interest.

References

  1. Parida, A.K.; Das, A.B. Salt tolerance and salinity effects on plants: A review. Ecotoxicol. Environ. Saf. 2005, 60, 324–349. [Google Scholar] [CrossRef]
  2. Munns, R.; Tester, M. Mechanisms of salinity tolerance. Annu. Rev. Plant Biol. 2008, 59, 651–681. [Google Scholar] [CrossRef]
  3. Song, J.; Chen, M.; Feng, G.; Jia, Y.; Wang, B.; Zhang, F. Effect of salinity on growth, ion accumulation and the roles of ions in osmotic adjustment of two populations of Suaeda salsa. Plant Soil 2009, 314, 133–141. [Google Scholar] [CrossRef]
  4. Wen, Z.G. Physiological Responses of Broussonetia papyrifera Seedlings to Salt Stress. Master’s Thesis, Chinese Academy of Forestry, Beijing, China, 2018. [Google Scholar]
  5. Ci, L.; Yang, X. Desertification and Its Control in China; Higher Education Press: Beijing, China, 2010. [Google Scholar]
  6. Zhu, J.K. Plant salt tolerance. Trends Plant Sci. 2001, 6, 66–71. [Google Scholar] [CrossRef]
  7. Harfouche, A.; Meilan, R.; Altman, A. Molecular and physiological responses to abiotic stress in forest trees and their relevance to tree improvement. Tree Physiol. 2014, 34, 1181–1198. [Google Scholar] [CrossRef]
  8. Pulford, I.D.; Watson, C. Phytoremediation of heavy metal-contaminated land by trees—A review. Environ. Int. 2003, 29, 529–540. [Google Scholar] [CrossRef] [PubMed]
  9. Liu, Y.; Ji, D.; Turgeon, R.; Chen, J.; Lin, T.; Huang, J.; Luo, J.; Zhu, Y.; Zhang, C.; Lv, Z. Physiological and Proteomic Responses of Mulberry Trees (Morus alba L.) to Combined Salt and Drought Stress. Int. J. Mol. Sci. 2019, 20, 2486. [Google Scholar] [CrossRef] [PubMed]
  10. Sarkar, T.; Mogili, T.; Sivaprasad, V. Improvement of abiotic stress adaptive traits in mulberry (Morus spp.): An update on biotechnological interventions. 3 Biotech 2017, 7, 214. [Google Scholar] [CrossRef]
  11. He, N.; Zhang, C.; Qi, X.; Zhao, S.; Tao, Y.; Yang, G.; Lee, T.H.; Wang, X.; Cai, Q.; Li, D.; et al. Draft genome sequence of the mulberry tree Morus notabilis. Nat. Commun. 2013, 4, 2445. [Google Scholar] [CrossRef]
  12. Hasegawa, P.M.; Bressan, R.A.; Zhu, J.K.; Bohnert, H.J. Plant cellular and molecular responses to high salinity. Annu. Rev. Plant Physiol. Plant Mol. Biol. 2000, 51, 463–499. [Google Scholar] [CrossRef]
  13. Almeida, D.M.; Oliveira, M.M.; Saibo, N.J.M. Regulation of Na+ and K+ homeostasis in plants: Towards improved salt stress tolerance in crop plants. Genet. Mol. Biol. 2017, 40, 326–345. [Google Scholar] [CrossRef]
  14. Mittler, R. Oxidative stress, antioxidants and stress tolerance. Trends Plant Sci. 2002, 7, 405–410. [Google Scholar] [CrossRef]
  15. Chaves, M.M.; Flexas, J.; Pinheiro, C. Photosynthesis under drought and salt stress: Regulation mechanisms from whole plant to cell. Ann. Bot. 2009, 103, 551–560. [Google Scholar] [CrossRef] [PubMed]
  16. Zhang, Z.Z. Study on Characteristics of Drought and Salt Tolerance of Several Species of Poplars and Their Effects on Soil Microbial Communities. Ph.D. Thesis, Beijing Forestry University, Beijing, China, 2021. [Google Scholar]
  17. Jaleel, C.A.; Gopi, R.; Sankar, B.; Gomathinayagam, M.; Panneerselvam, R. Differential responses in water use efficiency in two varieties of Catharanthus roseus under Drought Stress. Comptes Rendus Biol. 2008, 331, 42–47. [Google Scholar] [CrossRef] [PubMed]
  18. Hoagland, D.R.; Arnon, D.I. The water-culture method for growing plants without soil. Calif. Agric. Exp. Stn. Circ. 1938, 347, 1–39. [Google Scholar]
  19. Wang, Y.L. Coupling Response Mechanism of Leaf Structure and Leaf Physiology of Two Poplar Varieties to Drought Stress. Ph.D. Thesis, Shanxi Agricultural University, Taigu, China, 2019. [Google Scholar]
  20. Wellburn, A.R. The spectral determination of chlorophylls a and b, as well as total carotenoids, using various solvents with spectrophotometers of different resolution. J. Plant Physiol. 1994, 144, 307–313. [Google Scholar] [CrossRef]
  21. Lei, M.; Zhu, C.; Liu, Y.; Karthikeyan, A.S.; Bressan, R.A.; Raghothama, K.G.; Liu, D. Ethylene signalling is involved in regulation of phosphate starvation-induced gene expression and production of acid phosphatases and anthocyanin in Arabidopsis. New Phytol. 2011, 189, 1084–1095. [Google Scholar] [CrossRef]
  22. Li, H.S. Principles and Techniques of Plant Physiological and Biochemical Experiments; Higher Education Press: Beijing, China, 2000. [Google Scholar]
  23. Feng, Z.T.; Deng, Y.Q.; Fan, H.; Sun, Q.J.; Sui, N.; Wang, B.S. Effects of NaCl stress on the growth and photosynthetic characteristics of Ulmus pumila L. seedlings in sand culture. Photosynthetica 2014, 52, 313–320. [Google Scholar] [CrossRef]
  24. Bhaduri, A.M.; Fulekar, M.H. Antioxidant enzyme responses of plants to heavy metal stress. Rev. Environ. Sci. Biotechnol. 2012, 11, 55–69. [Google Scholar] [CrossRef]
  25. Zheng, L.; Meng, Y.; Ma, J.; Zhao, X.; Cheng, T.; Ji, J.; Chang, E.; Meng, C.; Deng, N.; Chen, L.; et al. Transcriptomic analysis reveals importance of ROS and phytohormones in response to short-term salinity stress in Populus tomentosa. Front. Plant Sci. 2015, 6, 678. [Google Scholar] [CrossRef]
  26. Xu, N.; Wei, X.; Wang, Y.; Dong, J.; Yang, X. Mechanism of Arbuscular Mycorrhizal Fungi in Enhancing Lead Stress Resistance in Poplar Trees. Forests 2025, 16, 82. [Google Scholar] [CrossRef]
  27. Tuna, A.L.; Kaya, C.; Ashraf, M.; Altunlu, H.; Yokas, I.; Yagmur, B. The effects of calcium sulfate on growth, membrane stability and nutrient uptake of tomato plants grown under salt stress. Environ. Exp. Bot. 2007, 59, 173–178. [Google Scholar] [CrossRef]
  28. Deinlein, U.; Stephan, A.B.; Horie, T.; Luo, W.; Xu, G.; Schroeder, J.I. Plant salt-tolerance mechanisms. Trends Plant Sci. 2014, 19, 371–379. [Google Scholar] [CrossRef]
  29. Yang, Y.; Guo, Y. Elucidating the molecular mechanisms of plant salt tolerance by transcriptomics. Front. Plant Sci. 2018, 9, 77. [Google Scholar]
  30. Shah, Z.H.; Rehman, H.M.; Akhtar, T.; Daur, I.; Nawaz, M.A.; Ahmad, M.Q.; Rana, I.A.; Atif, R.M.; Yang, S.H.; Chung, G. Redox and ionic homeostasis regulations against oxidative, salinity and drought Stress in wheat (A Systems Biology Approach). Front. Genet. 2017, 8, 141. [Google Scholar] [CrossRef]
Figure 1. Effect of NaCl stress on growth parameters of mulberry seedlings. (a) Height; (b) Stem Diameter; and (c) Dry Biomass. Data are presented as mean ± SD (n = 3). Different lowercase letters above the bars indicate significant differences among treatments at p < 0.05 according to LSD test.
Forests 16 01258 g001
Figure 2. Effect of NaCl stress on photosynthetic gas exchange parameters in mulberry seedlings. (a) Net photosynthetic rate (Pn); (b) Stomatal conductance (Gs); (c) Intercellular CO2 concentration (Ci); and (d) Transpiration rate (Tr). Data are presented as mean ± SD (n = 3). Different lowercase letters indicate significant differences among treatments at p < 0.05.
Forests 16 01258 g002
Figure 3. Effect of NaCl stress on chlorophyll fluorescence parameters in mulberry seedlings. (a) Maximum quantum efficiency of PSII (Fv/Fm); (b) Effective quantum yield of PSII (ΦPSI); and (c) Non-photochemical quenching (NPQ). Data are presented as mean ± SD (n = 3). Different lowercase letters indicate significant differences among treatments at p < 0.05.
Forests 16 01258 g003
Figure 4. Effect of NaCl stress on photosynthetic pigment contents in mulberry leaves. Contents of (a) Chlorophyll a (Chl a), (b) Chlorophyll b (Chl b), (c) Carotenoids (Car), and (d) Anthocyanin are shown. Data are presented as mean ± SD (n = 3). Different lowercase letters above the bars for the same pigment type indicate significant differences among treatments at p < 0.05.
Forests 16 01258 g004
Figure 5. Effect of NaCl stress on osmotic regulator contents in mulberry leaves. (a) Soluble Protein; (b) Soluble Sugars; and (c) Proline. Data are presented as mean ± SD (n = 3). Different lowercase letters above the bars indicate significant differences among treatments at p < 0.05 according to LSD test.
Forests 16 01258 g005
Figure 6. Effect of NaCl stress on Na+ and K+ concentrations in roots and leaves of mulberry seedlings. (a) Root ion concentrations; (b) Leaf ion concentrations. Data are presented as mean ± SD (n = 3). Different lowercase letters above the bars for the same ion in the same tissue indicate significant differences among treatments at p < 0.05.
Forests 16 01258 g006
Figure 7. Effect of NaCl stress on malondialdehyde (MDA) and hydrogen peroxide (H2O2) contents in mulberry leaves. (a) Malondialdehyde (MDA); (b) Hydrogen Peroxide (H2O2). Data are presented as mean ± SD (n = 3). Different lowercase letters above the bars indicate significant differences among treatments at p < 0.05.
Forests 16 01258 g007
Figure 8. Effect of NaCl stress on antioxidant enzyme activities in mulberry leaves. (a) Superoxide Dismutase (SOD); (b) Catalase (CAT); (c) Ascorbate Peroxidase (APX); and (d) Glutathione Reductase (GR). Data are presented as mean ± SD (n = 3). Different lowercase letters above the bars indicate significant differences among treatments at p < 0.05.
Forests 16 01258 g008
Figure 9. Linear regression of relative dry biomass versus NaCl concentration for LC50 determination. The dashed line represents the 50% reduction level used to determine the LC50 value.
Forests 16 01258 g009
Figure 10. Pearson correlation matrix of measured physiological and biochemical parameters in mulberry seedlings under salt stress. Red cells indicate a positive correlation, while blue cells indicate a negative correlation. The intensity of the color corresponds to the strength of the correlation coefficient (r). Asterisks denote statistical significance (** p < 0.01).
Forests 16 01258 g010
Disclaimer/Publisher’s Note: The statements, opinions and data contained in all publications are solely those of the individual author(s) and contributor(s) and not of MDPI and/or the editor(s). MDPI and/or the editor(s) disclaim responsibility for any injury to people or property resulting from any ideas, methods, instructions or products referred to in the content.

