Article

Higher Winter Precipitation and Temperature Are Associated with Smaller Earlywood Vessel Size but Wider Latewood Width in Quercus faginea Lam.

by
Ignacio García-González
1,*,
Filipe Campelo
2,
Joana Vieira
3 and
Cristina Nabais
2
1
Grupo BIOAPLIC, Instituto de Biodiversidade Agraria e Desenvolvemento Rural-Departamento de Botánica, Universidade de Santiago de Compostela, EPSE, Campus Terra, 27002 Lugo, Spain
2
Centre for Functional Ecology, Associate Laboratory TERRA, Department of Life Sciences, University of Coimbra, Calçada Martim de Freitas s/n, 3000-456 Coimbra, Portugal
3
Forest Wise CoLab ForestWISE, Quinta de Prados, Campus da UTAD, 5001-801 Vila Real, Portugal
*
Author to whom correspondence should be addressed.
Forests 2025, 16(8), 1252; https://doi.org/10.3390/f16081252
Submission received: 31 May 2025 / Revised: 14 July 2025 / Accepted: 23 July 2025 / Published: 1 August 2025
(This article belongs to the Section Forest Ecophysiology and Biology)

Abstract

Quercus faginea Lam., a winter-deciduous oak native to the Iberian Peninsula, typically grows under a Mediterranean climate. To identify the main drivers influencing radial wood increment, we analyzed the climatic signals in tree-ring width and wood anatomical traits using increment cores. Winter conditions influenced both latewood width and earlywood vessel size in the first row. Latewood was positively correlated with precipitation and temperature, with the long-term positive effect of winter water supply supported by SPEI. In contrast, vessel size showed negative correlations, also reflecting a long-term negative effect of winter precipitation. Consequently, conditions that enhanced latewood width and overall tree-ring growth appear to be associated with the formation of smaller earlywood vessels. Although ample winter precipitation replenishes soil water reserves and supports prolonged wood formation, it may also induce anaerobic soil conditions that promote root fermentation, depleting carbohydrates needed for cell turgor and expansion, and ultimately regulating earlywood vessel size. This physiological decoupling may help explain the lack of a significant correlation between latewood width and earlywood vessel size, underscoring their independent responses to environmental influences. Our findings highlighted the complex interplay between various climatic conditions affecting Q. faginea, with implications for understanding its adaptive capacity in changing climates.

1. Introduction

The response of species to climatic drivers has always been a major research area of ecology, embedding concepts of biogeography, acclimation, and adaptation. Understanding how species will be affected by the increasing rate of temperature, one of the parameters associated with climate change, is of utmost importance because it can affect their growth, phenology, reproductive success, and geographic distribution [1]. The phenological, morphological, and physiological plasticity of plants accommodates the intra- and inter-annual variability of climatic conditions. This is evidenced by the annual variation in tree-ring width [2] and in the intra- and inter-annual variability of wood anatomical traits, such as vessel size [3]. Tree-ring width and wood anatomical features serve as valuable climate proxies as they directly reflect the tree’s response to environmental conditions during the growing season [4]. Ring width captures the cumulative bole increment over the year, integrating multiple climate-influenced physiological processes, including photosynthesis, cambial activity, and cell expansion [5]. In contrast, anatomical traits, especially those of earlywood vessels (such as size, number, and conductivity), offer more detailed insights into the plant’s hydraulic system and its plasticity to respond to environmental variability [6].
Quercus faginea Lam. is native to the Western Mediterranean, occurring in the Iberian Peninsula and North Africa. In Portugal, the distribution of Q. faginea is very restricted due to the past overexploitation for shipbuilding [7]. It grows in transitional zones, between the temperate (Q. robur L.) and sub-Mediterranean deciduous oaks (Q. pyrenaica Willd.) in the north, and the Mediterranean evergreen oaks (Q. suber L. and Q. ilex L.) in the south. Although generally considered a winter-deciduous species, Q. faginea exhibits high intra-specific morphological and phenological variability, with some individuals being marcescent, i.e., they can keep the leaves during mild winters until the following spring [8]. The geographical constraint of Q. faginea habitats, included in the Natura 2000 network (code 9240), and the species behaviour between winter-deciduous and marcescent [9], make this species a valuable model for assessing climate sensitivity through tree-ring width and wood anatomical traits.
Dendrochronological studies on Q. faginea are scarce, but have thus far shown a positive correlation between annual radial increment and winter/spring precipitation [10,11,12]. In addition to tree-ring width, vessel lumen area and density can also record climatic signals in closely related oak species, either similar to or distinct from the signals embodied by ring-width variables [3,13,14,15,16]. However, evidence from Q. faginea populations in Spain has shown heterogeneous results. While several wood anatomical features measured at the pre-Pyrenean range exhibited no significant correlations with climatic parameters [17], earlywood vessel area was found to be negatively correlated with late winter temperatures [4]; even then, climatic signals were stronger for radial-growth variables (e.g., tree-ring and latewood width). In contrast, a robust signal in anatomical features was reported for deciduous oaks, including Q. faginea, in northern Spain, with a negative relation with winter precipitation [15,18,19].
This study aims to evaluate the climatic signals recorded in tree-ring width and wood anatomical traits of Q. faginea growing in central Portugal. We hypothesize that water availability during winter and spring, preceding summer drought, is the primary driver influencing both traits. By integrating wood anatomical characteristics with annual radial increment, our goal is to understand how climate impacts wood formation in Q. faginea by identifying (i) the most critical periods of the growing season, and (ii) the key anatomical features involved in this process.

2. Materials and Methods

2.1. Study Site, Sampling, and Measurement

The study area (Figure 1) was located at Monte de Santa Olaia e Ferrestelo (40°10′15″ N 8°43′00″ W), a low elevation calcareous outcrop in Portugal, where Q. faginea dominates the forest, surrounded by rice fields along the River Mondego; the climate is typically Mediterranean, with a mean annual temperature of 16.2 °C and an annual precipitation of 848 mm. We selected ten Q. faginea trees in 2011, and sampled two 5 mm wood cores per tree, using an increment borer at breast height. The cores were air-dried, mounted on wooden supports, and sanded with progressively finer sandpaper to produce a flat surface on which tree-ring boundaries were clearly visible under magnification.
We subsequently prepared the samples for vessel measurements [20] by removing wood dust and tyloses from vessel lumina with a high-pressure water blast, and filling vessels with white chalk to increase the contrast between lumina and the background tissue. Images of the cross-section surface were captured on a radial path from the bark to the pith using a digital camera (Canon EOS 600D) attached to a stereomicroscope (Leica MS 5). We used the ImageJ v1.54 software [21] to analyse the digital images (https://imagej.net/ij/, accessed on 1 May 2025) and measure vessel lumen areas for each ring. Size (10,000–150,000 µm2) and shape (objects with a width/length ratio equal to or lower than 0.60) filters were defined to remove objects that were not earlywood vessels. We confirmed the accuracy of vessel identification visually by observation under a stereomicroscope and corrected vessel outlines manually or removed undesired objects when necessary. Centroid coordinates allowed us to determine the relative radial position of each vessel within the ring. We measured earlywood and latewood widths in the radial direction for each ring. For the earlywood, we also assessed tangential width (the distance from the first to the last earlywood vessel in the image), as this parameter was necessary to standardize certain anatomical variables across samples.

2.2. Chronology Building and Assessment

Chronologies were obtained on a tree basis, i.e., we averaged width measurements and pooled all vessels belonging to the same ring. However, we discriminated between vessels located in the first row (r1) and those outside it (nr1), as they are formed at distinct moments during the growing season and may be influenced by different environmental conditions. Vessels were classified as part of the first row if they were close to the previous ring boundary, or appeared to begin before an imaginary line connecting the centers of the vessels closest to that boundary [15]. Vessels outside the first row could not be further classified, as they were not clearly arranged in radial patterns, and their number was highly variable among rings.
We used earlywood vessels to compute several variables and their corresponding chronologies, considering their location within the first row (r1) or not (nr1). This included a set of variables derived from vessel size, such as the mean vessel area (mva) and diameter (mvd), the median of the vessel distribution (Mvd), its third quartile (q3) and 95th percentile (m95), the maximum vessel area (max); others were influenced by vessel number, such as the total vessel number (nv), total vessel area (tva), or the ratio of vessels in the first row (nvR). We also included some traits related to water flow, such as specific conductivity (Ks), theoretical conductivity (Kt), and the hydraulically-weighted diameter (DH). The latter is an estimation of the average diameter needed to achieve the theoretical hydraulic conductivity for a stem [22], and can be used to investigate the vessel’s signal [15,16,23]. We standardized total vessel area and number of vessels to 10 mm of tangential width, approximated the conductive area to estimate Ks as the convex hull enclosing all selected earlywood vessels, and considered Kt as the sum of the fourth power of all vessel radii. For each ring, all measurements belonging to both cores of the same tree were pooled to calculate annual anatomical variables. We also considered the total ring width (RW) as well as earlywood (EW) and latewood (LW) increments for further processing.
Chronology computation for each variable involved first detrending all individual (tree) curves with a cubic smoothing spline with a length of 32 years, and a 50% cutoff, and computing growth indices by division. Although most anatomical variables hardly exhibited trends, we applied the same method to all series to avoid differences caused by the standardization method. We did not prewhiten the resulting indices before computing the mean chronology, since no variable showed clearly significant autocorrelations. Individual tree curves were subsequently averaged by biweight robust mean, and chronology quality was assessed as usual in dendrochronology. The period 1961–2011 (51 years), for which all measurements were obtained, was used as the common interval.
To reduce the number of variables for further analyses, we identified redundancy using a varimax-rotated principal component analysis (PCA), with mean chronologies from all ten trees as variables and growth years as cases. The ordination based on the first two principal components revealed which variables exhibited similar or distinct patterns, based on their groupings (see Section 3.2).
Differences of earlywood traits between rows (vessel size/number, DH, and Kt) were assessed by fitting linear mixed-effect models, which also allowed us to examine variation among trees and across years. We modeled the mean value for each ring, including Tree as a random effect to account for between-tree variation, and Row (r1 vs. nr1) and Year as fixed effects. The interaction between Row and Year was also included as a fixed effect to test whether differences between rows changed over time.
All analyses were performed in R v. 4.5.0 [24], primarily using the base package, along with dplR [25] for tree-ring analyses, and lme4 [26] for linear mixed-effects models.

2.3. Computation of Climate–Growth Relationships

We calculated stationary correlations between the chronologies and climate data (meteorological records and a drought index) for 1961–2011. Pearson’s correlation coefficients were assessed for significance using the percentile bootstrap method with 10,000 replications, following recommendations for stable quantile estimation [27]. Climate–growth relationships were analyzed from the previous June to the current October. In addition, we seasonalized monthly values for two periods: from the previous December to the current January, and from May to July. All calculations were performed in R, using the boot [28] and corrplot [29] packages for the scripts.
Monthly temperature and precipitation data were obtained from KNMI Climate Explorer (http://climexp.knmi.nl/, accessed on 20 October 2023). We also calculated the standardized precipitation–evapotranspiration index (SPEI) commonly used to assess vegetation responses to drought [30]. SPEI values were computed in R using the SPEI package [31] across time scales from 1 to 24 months. Potential evapotranspiration was estimated following the Thornthwaite method [32]. Correlations between variable chronologies and all SPEI time scales for the same monthly period (previous June to current October) were calculated to examine legacy effects of climate. The results were visualized in a heatmap.

3. Results

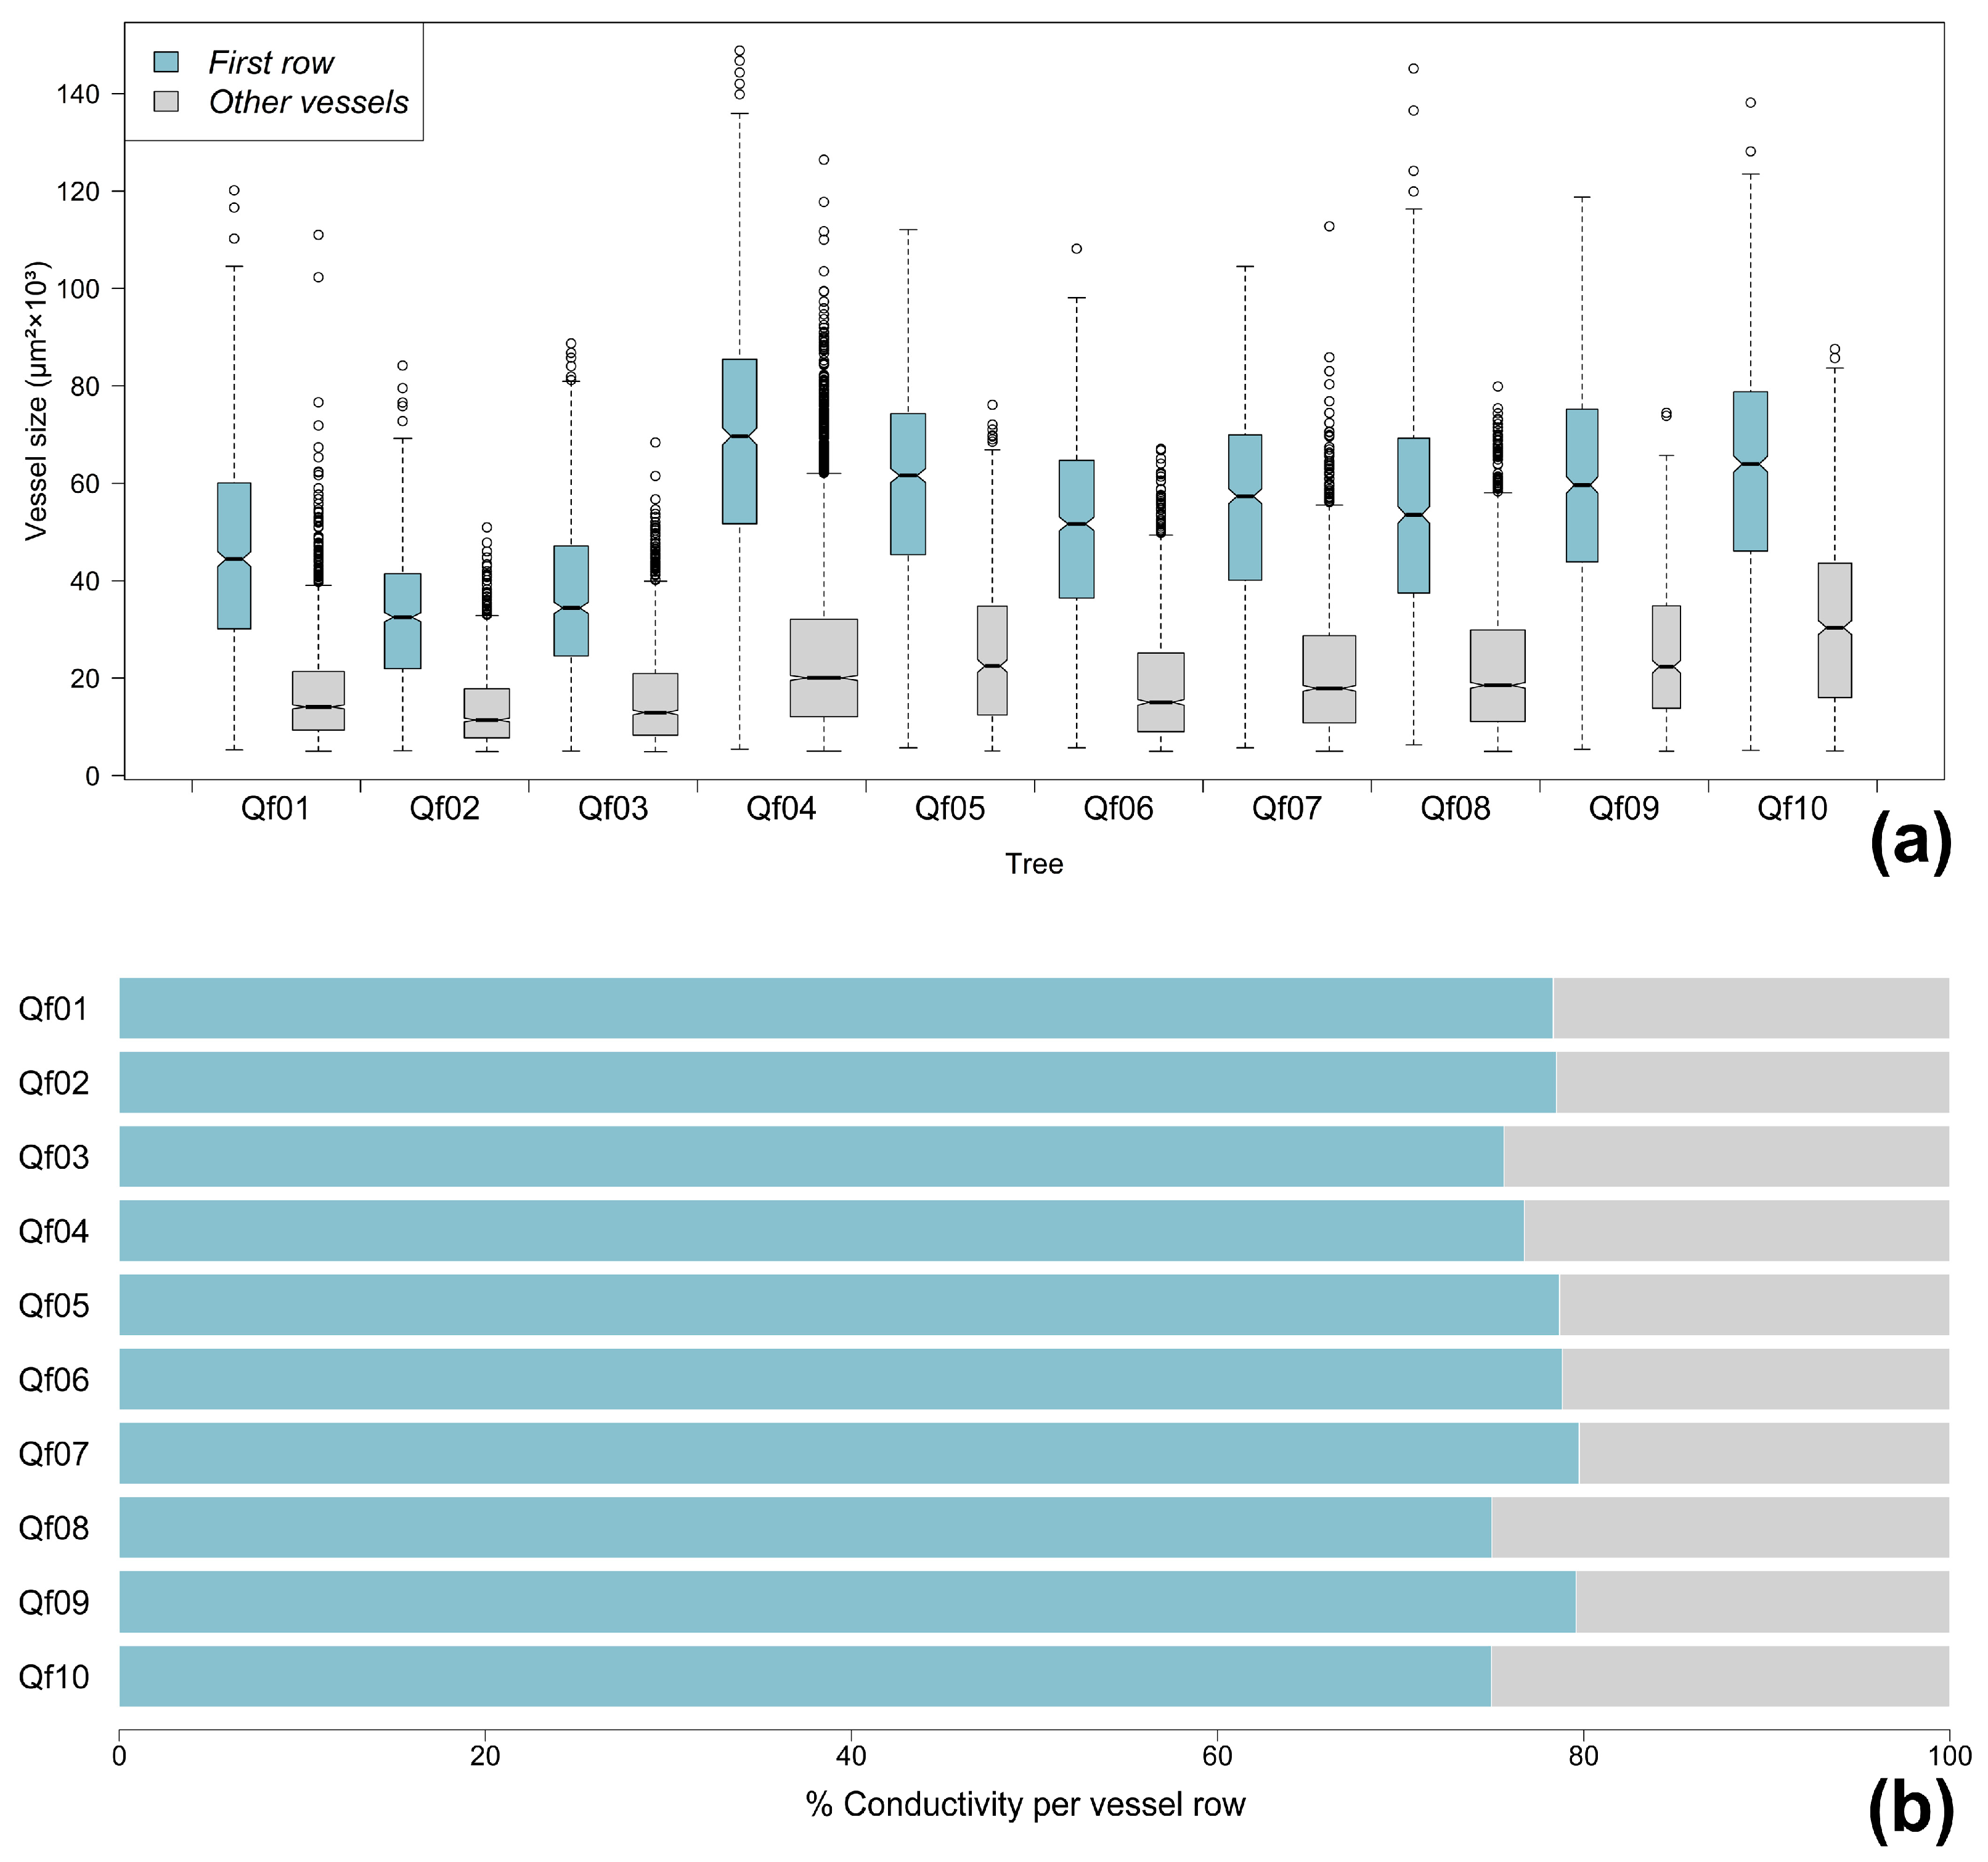
3.1. Vessel Distributions and Contribution of the First Row

We measured a total of 27,820 vessels, with only one-third belonging to the first row (9512 vs. 18,308). Vessels were considerably larger in the first row, but both groups (r1 vs. nr1) showed high variability (51,701.5 ± 23,526.1 vs. 20,926.1 ± 14,263.2 µm2). Vessel size distribution also differed (Figure 2a), as r1-vessels approximated a normal distribution, while nr1-vessels were skewed towards smaller sizes, with frequent outliers.
Mean vessel size for the entire ring (31,448.6 ± 23,156.5 µm2) was strongly dependent on the first row, which almost always contained the largest vessels (98.07% of the rings had their largest vessels in this row, where also 81.20% of vessels larger than the third quartile were located). Consequently, most of the ring’s hydraulic conductivity was secured by the first row (78.05%, Figure 2b).
Vessel traits were influenced by both year and position within the earlywood (Table 1). The effect of Year was statistically significant for all variables, and particularly strong for the number of vessels (nv) and DH, indicating that vessel traits changed over time (Table 1a). This likely reflects both age-related trends and year-to-year variation. Specifically, nv decreased with Year (i.e., older trees tend to produce fewer vessels), while the other traits increased. The effect of Row was statistically significant (p < 0.05) for all variables except DH, and a similar pattern in the interaction term (Row × Year) suggests that temporal patterns differed between the first row and the rest of the earlywood vessels for the remaining traits. The standard deviation associated with the tree random effect was substantial for most variables, indicating relevant between-tree variation (Table 1b).

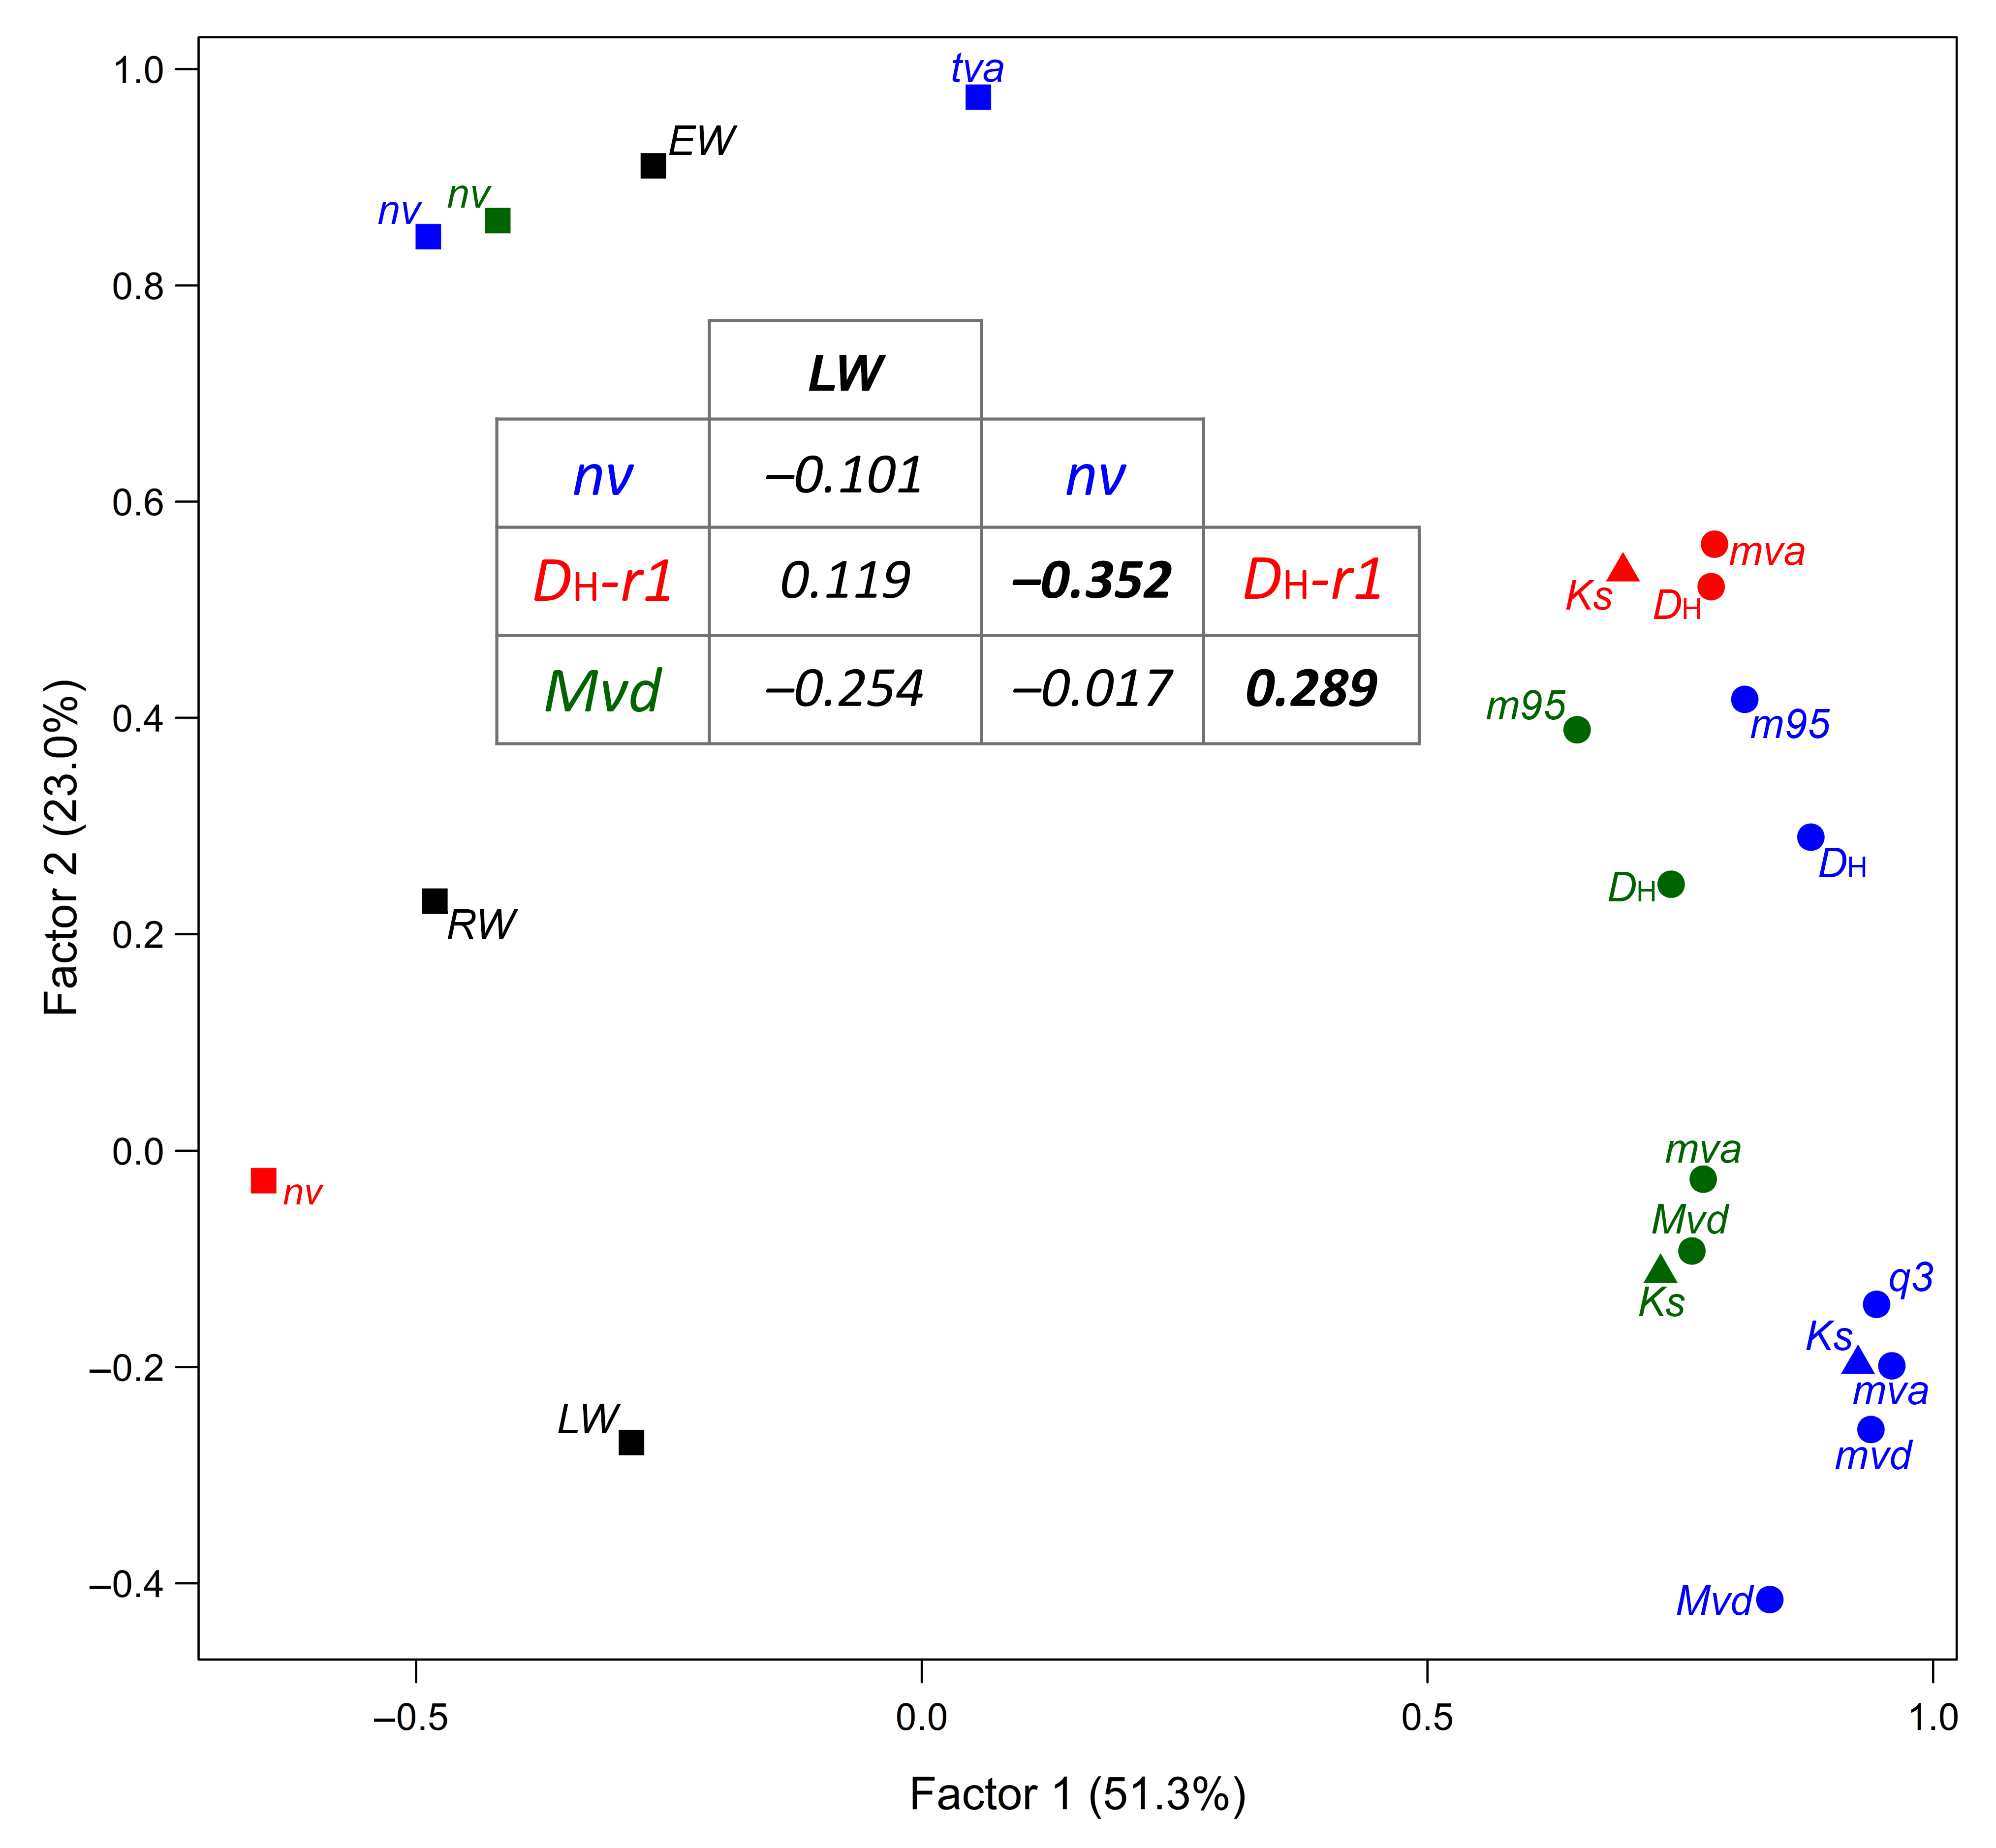
3.2. Comparative Analysis of Variable Chronologies

The selection of the most appropriate variables was based on the comparison of all chronologies (Figure 3) and their apparent ecophysiological meaning. Vessel and ring-width variables showed high collinearity, indicating that most carried the same ecological information. Principal component analysis revealed a strong ordination along the first eigenvector, which explained 51.5% of the total variance. Two main groups emerged at opposite ends of the axis: (i) variables related to the number of conductive cells produced (width variables and vessel numbers), and (ii) further anatomical variables associated with vessel size and/or conductivity. Total vessel area (tva) fell in between but aligned more closely with the ring-width variables. The second axis explained much less variance and separated earlywood and latewood within the first group, as well as the first row for vessels variables.
Latewood width (LW) was selected as the primary indicator of radial growth. Indeed, LW contributed strongly to the first principal component while it was highly correlated (r = 0.83) with tree-ring width (RW). The total number of vessels (nv) was also retained, as it showed a distinct pattern from LW along the second eigenvector; in this regard, nv was mainly driven by vessels outside the first row, such that both variables varied almost identically, while the number of vessels in the first row exhibited a more erratic pattern. Total vessel area (tva) was excluded, as it appeared to combine two different signals: widths/vessel numbers and size/conductivity variables.
Regarding the anatomical variables (located on the opposite side of the first eigenvector), we selected one variable to describe each of the identified signals, vessel size within or outside the first row. For the former, DH-r1 was chosen, as all variables in the first row were very similar to each other because they were largely influenced by the largest vessels (see DH and the 95th percentile of vessel size). For the latter, vessels outside the first row clustered together, except for those variables defined by the largest vessels (upper percentiles), which aligned more closely to the first row. We hypothesize that these largest vessels are likely in transition to the second row and probably formed early in the season. Consequently, we decided to express vessel size outside the first row as the median rather than the mean in order to maximize the signal of smaller vessels [15]. This size was defined as diameter instead of area to facilitate comparison with DH. The results of the mixed-effects models (Table 1), with highly significant differences in vessel size and conductivity between rows but not in their DH, also support the idea that these differences are driven by the smaller vessels.

3.3. Assessment of Chronology Quality

Mean sensitivity, i.e., year-to-year variability, was high for LW and low for nv, DH-r1, and Mvd-nr1. The first-order autocorrelation was low and close to zero after spline filtering, indicating that most persistence was due to trend. Therefore, autoregressive modeling of the indices was unnecessary.
Chronology quality statistics were generally modest (Table 2). Mean correlation between all series was low for nv and Mvd-nr1, remained within a commonly accepted range in dendrochronology (e.g., Rbar > 0.30) for LW, and was maximized for DH-r1. In fact, this was the only variable to reach EPS values near the classical recommended threshold of 0.85 [33].

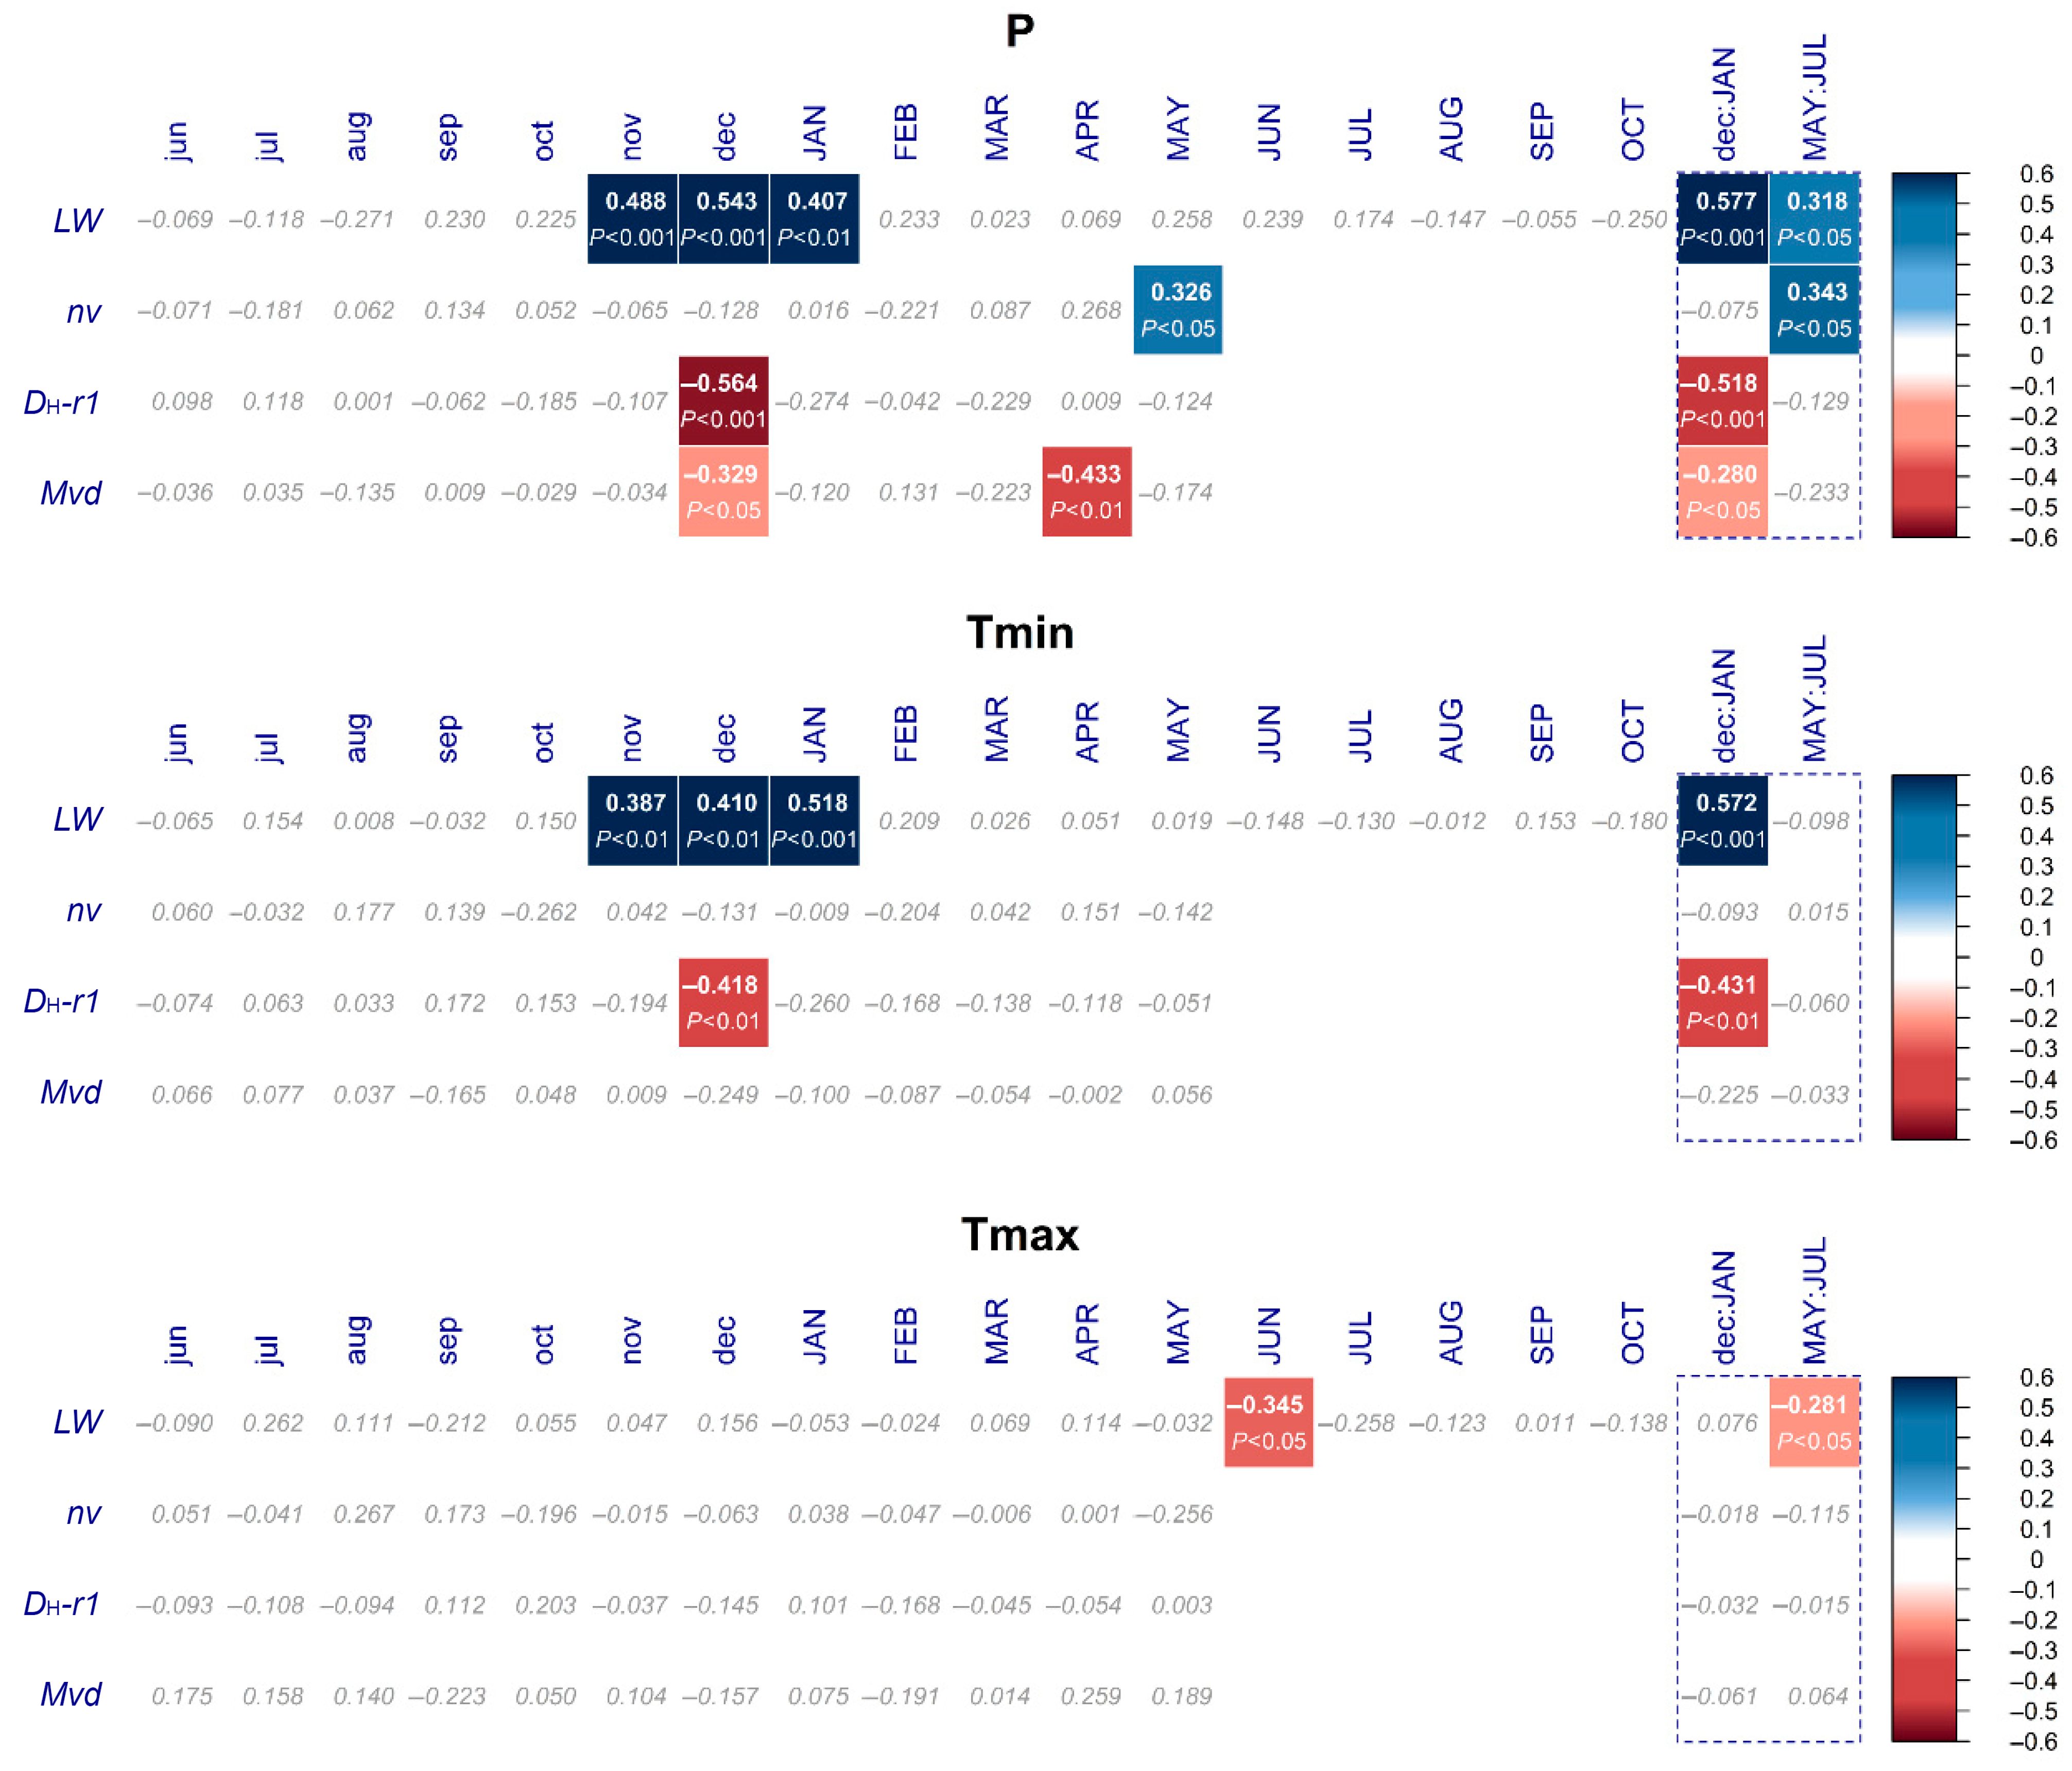
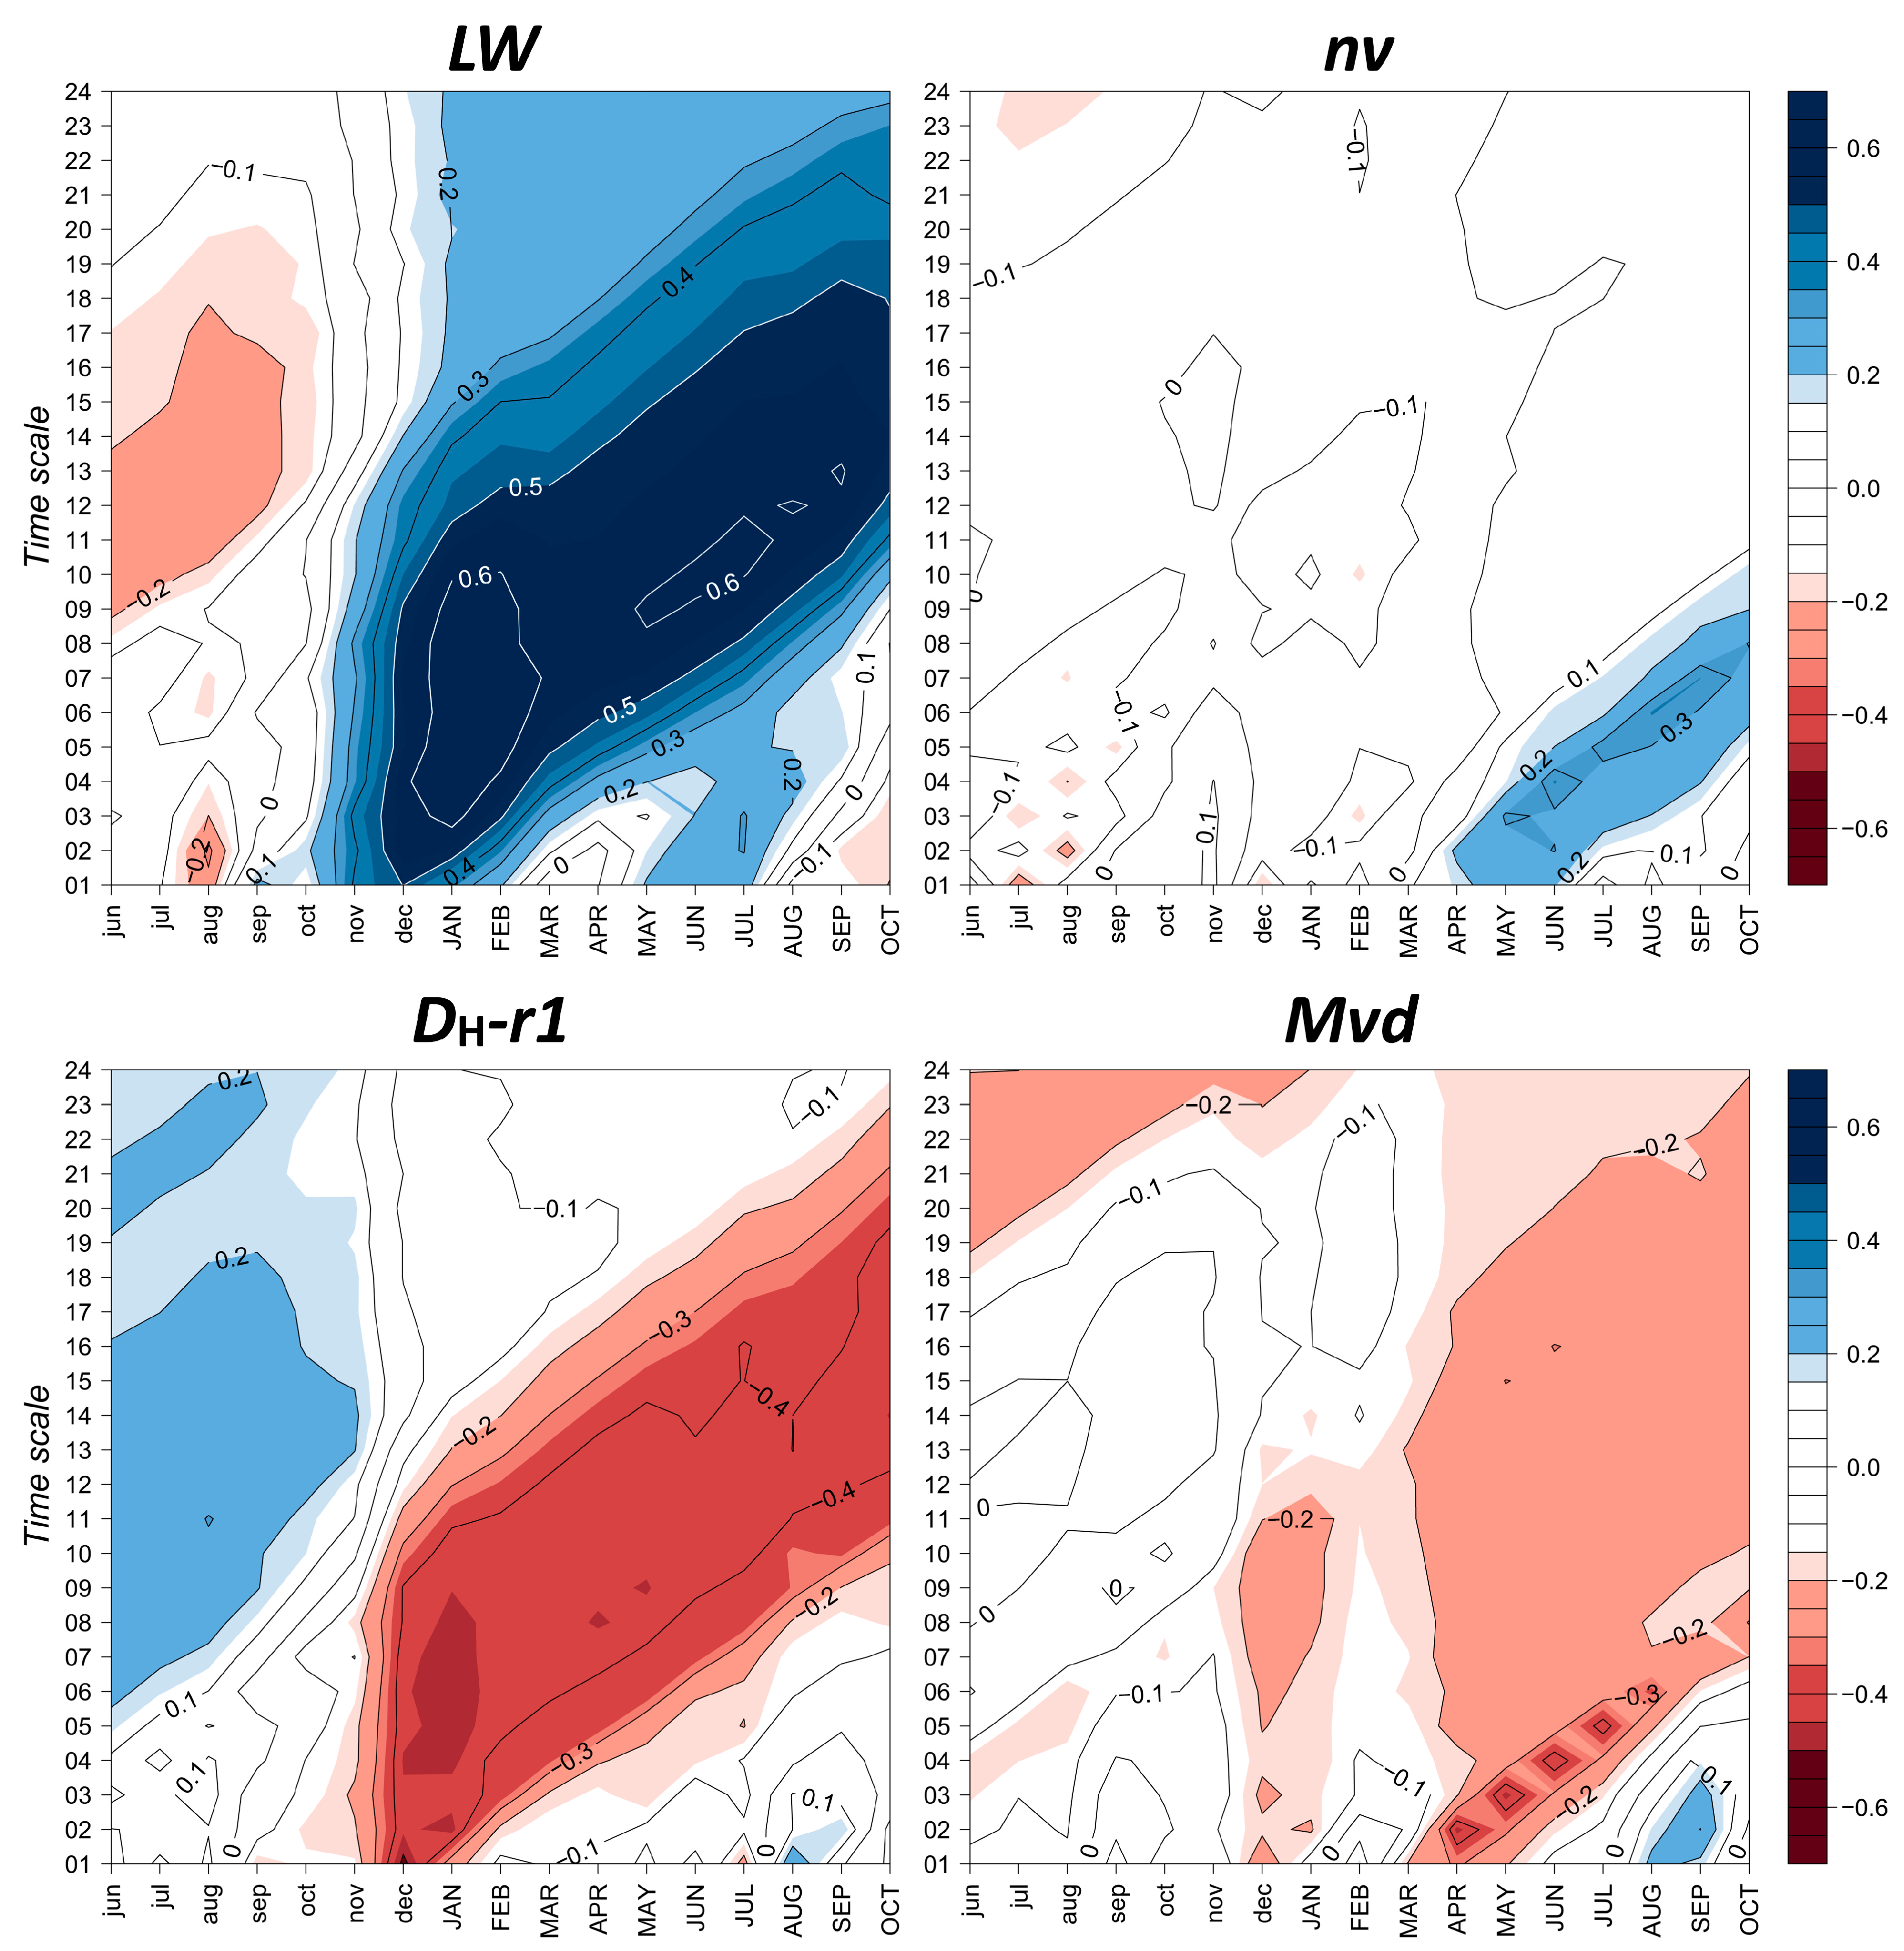
3.4. Climate–Growth Relationships

Correlations with climatic variables showed that winter conditions were the main drivers of growth, both for the radial increment and anatomical variables (Figure 4). LW was positively correlated with winter precipitation (November–January), particularly when considering the whole period (r = 0.577; p < 0.001). Correlations with SPEI also revealed a long-term positive effect of winter precipitation on LW (Figure 5). Some weaker positive relationships were observed for late spring–early summer precipitation, but no significant associations emerged later in the season. However, these later correlations were much lower than those observed for winter. Similar patterns appeared for minimum temperature, though no relationship was found with maximum temperature in winter. A weak correlation with June maximum temperature may reflect increased evapotranspiration.
Regarding the anatomical variables, the number of vessels was hardly related to climate, except for a weak effect of May precipitation. In contrast, vessel sizes responded to climate, particularly in early winter. This was most evident in the negative correlation between DH-r1 and winter precipitation (and to a lesser extent, minimum temperature), with the strongest correlation observed for December precipitation (r = −0.564; p < 0.001); the relationship weakened slightly when considering a longer time window. Correlations with SPEI revealed a strong long-term negative effect of winter precipitation on the vessel size of the first row (Figure 5). Conversely, vessels in later rows were much less related to winter conditions but showed a negative correlation with April rainfall.

4. Discussion

The final size of a tree ring is determined by the rates of cambial cell division and development, with water availability and temperature exerting a greater control on cambial activity than carbon assimilation [34,35,36]. Consistent with this, LW in Q. faginea, which correlates with RW, showed a strong positive association with winter precipitation and minimum temperatures (Figure 4). Winter precipitation is essential to replenish soil water reserves that support the following growing season. In fact, the long-term correlations between LW and SPEI further confirmed the importance of water availability for sustaining growth and the formation of wide tree rings in Q. faginea (Figure 5).
Latewood production relies on the hydraulic capacity of earlywood vessels, as shown for Q. robur and Q. pyrenaica [37]. In ring-porous species like Q. faginea, over 90% of water conductivity is provided by the most recent growth ring, primarily through the large earlywood vessels (Figure 2) [38]. Adequate water availability reduces embolism risk in these vessels, extending the period of cambial activity and resulting in wider latewood [39,40,41]. Conversely, Q. faginea may produce little to no latewood during very dry years [10], a response partly explained by increased cavitation of earlywood vessels, which reduces hydraulic conductivity, carbon uptake, and the length of the growing season, particularly under Mediterranean conditions [42,43]. Although larger earlywood vessels are more susceptible to cavitation, their higher hydraulic efficiency benefits outweigh the embolism risk in seasonal environments. This explains why vessel size does not necessarily correlate with increased tyloses formation or reduced summer growth in oaks from northwestern Spain [42].
Higher winter temperatures can anticipate cambial activity [44,45], leading to an earlier production of xylem cells and, if maintained by water availability later in the season, a wider ring [37]. A study on the stem diameter variations of Q. faginea performed at the same site found that, although stem increment only started in March, it was positively correlated with mean temperatures in January, February, and March [12]. This suggests that winter temperatures play a crucial role in reactivating the cambium, leading to an observable increment later in March.
Vessel size exhibited opposite relationships to LW, with a negative correlation with winter precipitation and minimum temperatures (Figure 4), pointing out that conditions favoring wider tree rings also tend to produce smaller vessels. Such a pattern may indicate reduced vulnerability to cavitation, better maintenance of hydraulic conductivity, and prolonged carbon assimilation, which can promote latewood formation [46]. However, this mechanism does not appear to have played a significant role at our study site, as we found no correlation between LW and DH-r1 for Q. faginea (Figure 3). Notably, DH-r1 was negatively correlated with the number of vessels (Figure 3), indicating that smaller vessels may be offset by a greater number in terms of total hydraulic capacity, potentially obscuring the direct relationship between LW and DH-r1.
Water availability can influence conduit size, and several studies hypothesize that narrower earlywood vessels form under dry conditions [47,48,49]. Indeed, tracheid dimensions of Pinus sylvestris were found to depend primarily on turgor pressure [34]. This finding is further supported by modeling studies that examined the effects of air temperature and soil water potential on stem growth in Picea abies and Larix decidua, confirming turgor pressure as the main driver of growth [50]. However, high winter precipitation was coupled with the occurrence of smaller earlywood vessels at our study site (Figure 4). Indeed, an inverse relationship between winter water excess and vessel size is not uncommon, and has been reported for ring-porous oaks from northern Spain [15,18], including Q. faginea [19].
Earlywood vessels in ring-porous species start differentiating before budbreak [51] and become functional before full leaf expansion [52], thus relying on stored water and reserves accumulated in the previous growing season [53,54]. Carbohydrates produced during the latter half of summer are crucial for supporting dormancy respiration and the structural growth that occurs in spring [55]. A depletion of these reserves before earlywood formation can limit the osmotic potential needed for water uptake during vessel expansion, even under adequate water availability [56,57]. As a result, the final vessel may be reduced. High winter temperatures can accelerate respiration rates, reducing sugar pools and potentially impairing vessel development [58]. This mechanism has been proposed as a key explanation for the strong influence of winter conditions on earlywood vessel characteristics in Q. robur [15]. Additionally, soil flooding can create anaerobic conditions in the root zone, enhancing fermentation processes and depleting reserves [59]. In our study area, which is surrounded by rice fields, high winter precipitation may lead to soil flooding, further reducing the amount of carbohydrates that are essential for cell expansion during earlywood formation.
Climate projections for the Mediterranean Region, including Portugal, predict rising temperatures and reduced precipitation. These conditions can increase the susceptibility of ring-porous oaks to drought-induced decline [43], with their vessel characteristics serving as early indicators of this process [60]. Based on our results, higher winter temperatures are associated with increased latewood width in Q. faginea, but reduced winter precipitation is likely to limit overall wood increment, while elevated summer temperatures may lead to earlier growth cessation. Latewood plays a crucial mechanical role in supporting a tree’s weight, and reduced latewood production may result in structurally weaker trees with an increased risk of mortality. Regarding earlywood, lower winter precipitation tends to promote the formation of larger vessels in Q. faginea, whereas higher winter temperatures have the opposite effect. However, reduced water availability also lowers turgor pressure, potentially leading to smaller vessels. As a result, final vessel size reflects the combined influence of these climatic conditions, with consequences for hydraulic conductivity vulnerability to embolism.

5. Conclusions

In Q. faginea, latewood width showed a positive correlation with winter precipitation and minimum temperature, while earlywood vessel size exhibited opposite relationships. This indicates that winter conditions favoring wider latewood, and thus greater overall tree-ring width, are associated with the formation of smaller earlywood vessels. Although high winter precipitation is crucial for replenishing soil water reserves that support prolonged wood growth and wider tree rings, it could also create anaerobic soil conditions during winter at our study site. These anaerobic environments may enhance root fermentation processes, depleting carbohydrate reserves vital for maintaining cell turgor and ultimately regulating vessel expansion. Consequently, carbohydrate availability during these specific periods can directly impact earlywood vessel size. The differing influence of climatic conditions on LW and earlywood vessel size is further supported by the lack of a significant correlation between these two traits, indicating that their development responds independently to environmental conditions.

Author Contributions

Conceptualization, I.G.-G. and C.N.; methodology, I.G.-G.; formal analysis, I.G.-G.; investigation, I.G.-G., F.C., J.V. and C.N.; resources, I.G.-G. and C.N.; data curation, I.G.-G. and C.N.; writing—original draft preparation, I.G.-G.; writing—review and editing, F.C., J.V. and C.N.; funding acquisition, I.G.-G. and C.N. All authors have read and agreed to the published version of the manuscript.

Funding

This research was supported by the project PTDC/AAC-AMB/111675/2009 funded by the Portuguese Science Foundation. F.C. was supported by the Portuguese R&D unit CFE (FCT/UIDB/04004/2020). IGG received support from the Consellería de Educación, Ciencia, Universidades e Formación Profesional, Xunta de Galicia (ED431C 2023/19), through the recognition of the Competitive Research Group BIOAPLIC.

Data Availability Statement

The original data presented in this study are included in the manuscript. Further inquiries can be directed to the corresponding author.

Conflicts of Interest

The authors declare no conflicts of interest.

Abbreviations

The following abbreviations are used in this manuscript:
RWTotal ring width
EWEarlywood width
LWLatewood width
mvdMean vessel diameter
MvdMedian vessel diameter
q3Third quartile of vessel area distribution
m9595th percentile of vessel area distribution
maxMaximum vessel area
nvNumber of vessels
tvaTotal vessel area
nvRRatio of vessels in the first row
KsSpecific conductivity
KtTheoretical conductivity (sum of the fourth power of vessel radii)
DHHydraulically-weighted diameter
EPSExpressed populations signal
SPEIStandardized precipitation–evapotranspiration index

References

  1. Babst, F.; Bouriaud, O.; Poulter, B.; Trouet, V.; Girardin, M.P.; Frank, D.C. Twentieth century redistribution in climatic drivers of global tree growth. Sci. Adv. 2019, 5, eaat4313. [Google Scholar] [CrossRef]
  2. King, G.M.; Gugerli, F.; Fonti, P.; Frank, D.C. Tree growth response along an elevational gradient: Climate or genetics? Oecologia 2013, 173, 1587–1600. [Google Scholar] [CrossRef]
  3. Fonti, P.; von Arx, G.; García-González, I.; Eilmann, B.; Sass-Klaassen, U.; Gärtner, H.; Eckstein, D. Studying global change through investigation of the plastic responses of xylem anatomy in tree rings. New Phytol. 2010, 185, 42–53. [Google Scholar] [CrossRef]
  4. Alla, A.Q.; Camarero, J.J. Contrasting responses of radial growth and wood anatomy to climate in a Mediterranean ring-porous oak: Implications for its future persistence or why the variance matters more than the mean. Eur. J. For. Res. 2012, 131, 1537–1550. [Google Scholar] [CrossRef]
  5. Zweifel, R.; Zimmermann, L.; Zeugin, F.; Newbery, D.M. Intra-annual radial growth and water relations of trees: Implications towards a growth mechanism. J. Exp. Bot. 2006, 57, 1445–1459. [Google Scholar] [CrossRef]
  6. Carrer, M.; von Arx, G.; Castagneri, D.; Petit, G. Distilling allometric and environmental information from time series of conduit size: The standardization issue and its relationship to tree hydraulic architecture. Tree Physiol. 2015, 35, 27–33. [Google Scholar] [CrossRef]
  7. Capelo, J.; Catry, F. A distribuição do carvalho-português em Portugal. In Árvores e Florestas de Portugal, Volume 2: Os Carvalhais—Um Património a Conservar; Sande Silva, J., Ed.; Fundação Luso-Americana para o Desenvolvimento: Lisboa, Portugal, 2007; pp. 85–93. [Google Scholar]
  8. Castro-Díez, P.; Navarro, J. Water relations of seedlings of three Quercus species: Variations across and within species grown in contrasting light and water regimes. Tree Physiol. 2007, 27, 1011–1018. [Google Scholar] [CrossRef]
  9. Vila-Viçosa, C.; Gonçalves, J.; Honrado, J.; Lomba, Â.; Almeida, R.S.; Vázquez, F.M.; Garcia, C. Late Quaternary range shifts of marcescent oaks unveil the dynamics of a major biogeographic transition in southern Europe. Sci. Rep. 2020, 10, 21598. [Google Scholar] [CrossRef] [PubMed]
  10. Corcuera, L.; Camarero, J.J.; Gil-Pelegrín, E. Effects of a severe drought on growth and wood anatomical properties of Quercus faginea. IAWA J. 2004, 25, 185–204. [Google Scholar] [CrossRef]
  11. Tumajer, J.; Serra-Maluquer, X.; Gazol, A.; de Andrés, E.G.; Colangelo, M.; Sangüesa-Barreda, G.; Olano, J.M.; Rozas, V.; García-Plazaola, J.I.; Fernández-Marín, B.; et al. Bimodal and unimodal radial growth of Mediterranean oaks along a coast-inland gradient. Agric. For. Meteorol. 2022, 327, 109234. [Google Scholar] [CrossRef]
  12. Vieira, J.; Campelo, F.; Nabais, C. Environment controls seasonal and daily cycles of stem diameter variations in Portuguese oak (Quercus faginea L.). Forests 2022, 13, 170. [Google Scholar] [CrossRef]
  13. García-González, I.; Fonti, P. Ensuring a representative sample of earlywood vessels for dendroecological studies: An example from two ring-porous species. Trees 2008, 22, 237–244. [Google Scholar] [CrossRef]
  14. Hu, Z.; Zhu, L.; Liu, S.; Lei, P.; Zhang, R.; Cherubini, P. Xylem adjustment and growth response of early- and late-successional tree species to rapid warming. Eur. J. For. Res. 2024, 143, 785–801. [Google Scholar] [CrossRef]
  15. García-González, I.; Souto-Herrero, M. Earlywood anatomy highlights the prevalent role of winter conditions on radial growth of oak at its distribution boundary in NW Iberia. Plants 2023, 12, 1185. [Google Scholar] [CrossRef] [PubMed]
  16. Gea-Izquierdo, G.; Fonti, P.; Cherubini, P.; Martín-Benito, D.; Chaar, H.; Cañellas, I. Xylem hydraulic adjustment and growth response of Quercus canariensis Willd. to climatic variability. Tree Physiol. 2012, 32, 401–413. [Google Scholar] [CrossRef]
  17. Villar-Salvador, P.; Castro-Díez, P.; Pérez-Rontomé, C.; Montserrat-Martí, G. Stem xylem features in three Quercus (Fagaceae) species along a climatic gradient in NE Spain. Trees 1997, 12, 90–96. [Google Scholar] [CrossRef]
  18. Souto-Herrero, M.; Rozas, V.; García-González, I. Earlywood vessels and latewood width explain the role of climate on wood formation of Quercus pyrenaica Willd. across the Atlantic-Mediterranean boundary in NW Iberia. For. Ecol. Manag. 2018, 425, 126–137. [Google Scholar] [CrossRef]
  19. Akhmetzyanov, L.; Buras, A.; Sass-Klaassen, U.; Den Ouden, J.; Mohren, F.; Groenendijk, P.; García-González, I. Multi-variable approach pinpoints origin of oak wood with higher precision. J. Biogeogr. 2019, 46, 1163–1177. [Google Scholar] [CrossRef]
  20. Sass, U.; Eckstein, D. The variability of vessel size in beech (Fagus sylvatica L.) and its ecophysiological interpretation. Trees 1995, 9, 247–252. [Google Scholar] [CrossRef]
  21. Abramoff, M.D.; Magalhaes, P.J.; Ram, S.J. Image Processing with ImageJ. Biophotonics Int. 2004, 11, 36–42. [Google Scholar]
  22. Fichot, R.; Laurans, F.; Monclus, R.; Moreau, A.; Pilate, G.; Brignolas, F. Xylem anatomy correlates with gas exchange, water-use efficiency and growth performance under contrasting water regimes: Evidence from Populus deltoides x Populus nigra hybrids. Tree Physiol. 2009, 29, 1537–1549. [Google Scholar] [CrossRef]
  23. Argüelles-Marrón, B.; Meave, J.A.; Luna-Vega, I.; Crispin-DelaCruz, D.B.; Szejner, P.; Ames-Martínez, F.N.; Rodríguez-Ramírez, E.C. Adaptation potential of Neotropical montane oaks to drought events: Wood anatomy sensitivity in Quercus delgadoana and Quercus meavei. Funct. Ecol. 2023, 37, 2040–2055. [Google Scholar] [CrossRef]
  24. R Core Team. R: A Language and Environment for Statistical Computing; R Foundation for Statistical Computing: Vienna, Austria, 2025. [Google Scholar]
  25. Bunn, A.G. A dendrochronology program library in R (dplR). Dendrochronologia 2008, 26, 115–124. [Google Scholar] [CrossRef]
  26. Bates, D.; Mächler, M.; Bolker, B.; Walker, S. Fitting linear mixed-effects models using lme4. J. Stat. Softw. 2015, 67, 1–48. [Google Scholar] [CrossRef]
  27. Efron, B.; Tibshirani, R.J. An Introduction to the Bootstrap; Chapman & Hall/CRC: New York, NY, USA, 1993. [Google Scholar]
  28. Canty, A.; Ripley, B. boot: Bootstrap R (S-Plus) Functions, R package version 1.3-31; R Foundation for Statistical Computing: Vienna, Austria, 2024; Available online: https://CRAN.R-project.org/package=boot (accessed on 1 May 2025).
  29. Wei, T.; Simko, V. R Package ‘corrplot’: Visualization of a Correlation Matrix; Version 0.95; R Foundation for Statistical Computing: Vienna, Austria, 2024; Available online: https://github.com/taiyun/corrplot (accessed on 1 May 2025).
  30. Vicente-Serrano, S.M.; Gouveia, C.; Camarero, J.J.; Begueria, S.; Trigo, R.; Lopez-Moreno, J.I.; Azorin-Molina, C.; Pasho, E.; Lorenzo-Lacruz, J.; Revuelto, J.; et al. Response of vegetation to drought time-scales across global land biomes. Proc. Natl. Acad. Sci. USA 2013, 110, 52–57. [Google Scholar] [CrossRef]
  31. Beguería, S.; Vicente-Serrano, S.M. SPEI: Calculation of the Standardized Precipitation-Evapotranspiration Index, R package version 1.8.1; R Foundation for Statistical Computing: Vienna, Austria, 2023; Available online: https://CRAN.R-project.org/package=SPEI (accessed on 1 May 2025).
  32. Thornthwaite, C.W. An approach toward a rational classification of climate. Geogr. Rev. 1948, 38, 55–94. [Google Scholar] [CrossRef]
  33. Wigley, T.M.L.; Briffa, K.R.; Jones, P.D. On the average value of correlated time-series, with applications in dendroclimatology and hydrometeorology. J. Clim. Appl. Meteorol. 1984, 23, 201–213. [Google Scholar] [CrossRef]
  34. Cabon, A.; Fernández-de-Uña, L.; Gea-Izquierdo, G.; Meinzer, F.C.; Woodruff, D.R.; Martínez-Vilalta, J.; De Cáceres, M. Water potential control of turgor-driven tracheid enlargement in Scots pine at its xeric distribution edge. New Phytol. 2020, 225, 209–221. [Google Scholar] [CrossRef]
  35. Körner, C. Paradigm shift in plant growth control. Curr. Opin. Plant Biol. 2015, 25, 107–114. [Google Scholar] [CrossRef] [PubMed]
  36. Tardieu, F.; Granier, C.; Muller, B. Water deficit and growth. Co-ordinating processes without an orchestrator? Curr. Opin. Plant Biol. 2011, 14, 283–289. [Google Scholar] [CrossRef] [PubMed]
  37. Pérez-de-Lis, G.; Olano, J.M.; Rozas, V.; Rossi, S.; Vázquez-Ruiz, R.A.; García-González, I. Environmental conditions and vascular cambium regulate carbon allocation to xylem growth in deciduous oaks. Funct. Ecol. 2017, 31, 592–603. [Google Scholar] [CrossRef]
  38. Tyree, M.T.; Cochard, H. Summer and winter embolism in oak: Impact on water relations. Ann. For. Sci. 1996, 53, 173–180. [Google Scholar] [CrossRef]
  39. Lupi, C.; Morin, H.; Deslauriers, A.; Rossi, S. Xylem phenology and wood production: Resolving the chicken-or-egg dilemma. Plant Cell Environ. 2010, 33, 1721–1730. [Google Scholar] [CrossRef]
  40. Brodersen, C.R.; McElrone, A.J. Maintenance of xylem network transport capacity: A Review of embolism repair in vascular plants. Front. Plant Sci. 2013, 4, 108. [Google Scholar] [CrossRef]
  41. Wang, L.; Ruan, Y.-L. Regulation of cell division and expansion by sugar and auxin signaling. Front. Plant Sci. 2013, 4, 163. [Google Scholar] [CrossRef]
  42. Pérez-de-Lis, G.; Rozas, V.; Vázquez-Ruiz, R.A.; García-González, I. Do ring-porous oaks prioritize earlywood vessel efficiency over safety? Environmental effects on vessel diameter and tyloses formation. Agric. For. Meteorol. 2018, 248, 205–214. [Google Scholar] [CrossRef]
  43. Gentilesca, T.; Camarero, J.J.; Colangelo, M.; Nolè, A.; Ripullone, F. Drought-induced oak decline in the western Mediterranean region: An overview on current evidences, mechanisms and management options to improve forest resilience. iForest 2017, 10, 796–806. [Google Scholar] [CrossRef]
  44. Begum, S.; Nakaba, S.; Yamagishi, Y.; Oribe, Y.; Funada, R. Regulation of cambial activity in relation to environmental conditions: Understanding the role of temperature in wood formation of trees. Physiol. Plant 2013, 147, 46–54. [Google Scholar] [CrossRef] [PubMed]
  45. Rahman, M.H.; Kudo, K.; Yamagishi, Y.; Nakamura, Y.; Nakaba, S.; Begum, S.; Nugroho, W.D.; Arakawa, I.; Kitin, P.; Funada, R. Winter-spring temperature pattern is closely related to the onset of cambial reactivation in stems of the evergreen conifer Chamaecyparis pisifera. Sci. Rep. 2020, 10, 14341. [Google Scholar] [CrossRef] [PubMed]
  46. Castagneri, D.; Regev, L.; Boaretto, E.; Carrer, M. Xylem anatomical traits reveal different strategies of two Mediterranean oaks to cope with drought and warming. Environ. Exp. Bot. 2017, 133, 128–138. [Google Scholar] [CrossRef]
  47. Castagneri, D.; Carrer, M.; Regev, L.; Boaretto, E. Precipitation variability differently affects radial growth, xylem traits and ring porosity of three Mediterranean oak species at xeric and mesic sites. Sci. Total Environ. 2020, 699, 134285. [Google Scholar] [CrossRef]
  48. Bleicher, N.; von Arx, G. A case study on the climate-growth signal stability and plasticity in European oak from ecologically contrasting sites—Implications for dendroclimatological studies. Trees 2025, 39, 49. [Google Scholar] [CrossRef]
  49. Skiadaresis, G.; Schwarz, J.; Stahl, K.; Bauhus, J. Groundwater extraction reduces tree vitality, growth and xylem hydraulic capacity in Quercus robur during and after drought events. Sci. Rep. 2021, 11, 5149. [Google Scholar] [CrossRef]
  50. Peters, R.L.; Steppe, K.; Cuny, H.E.; De Pauw, D.J.; Frank, D.C.; Schaub, M.; Rathgeber, C.B.K.; Cabon, A.; Fonti, P. Turgor—A limiting factor for radial growth in mature conifers along an elevational gradient. New Phytol. 2021, 229, 213–229. [Google Scholar] [CrossRef] [PubMed]
  51. Kudo, K.; Yasue, K.; Hosoo, Y.; Funada, R. Relationship between formation of earlywood vessels and leaf phenology in two ring-porous hardwoods, Quercus serrata and Robinia pseudoacacia, in early spring. J. Wood Sci. 2015, 61, 455–464. [Google Scholar] [CrossRef]
  52. Kitin, P.; Funada, R. Earlywood vessels in ring-porous trees become functional for water transport after bud burst and before the maturation of the current-year leaves. IAWA J. 2016, 37, 315–331. [Google Scholar] [CrossRef]
  53. Michelot, A.; Bréda, N.; Damesin, C.; Dufrene, E. Differing growth responses to climatic variations and soil water deficits of Fagus sylvatica, Quercus petraea and Pinus sylvestris in a temperate forest. For. Ecol. Manag. 2012, 265, 161–171. [Google Scholar] [CrossRef]
  54. Furze, M.E.; Huggett, B.A.; Chamberlain, C.J.; Wieringa, M.M.; Aubrecht, D.M.; Carbone, M.S.; Walker, J.C.; Xu, X.; Czimczik, C.I.; Richardson, A.D. Seasonal fluctuation of nonstructural carbohydrates reveals the metabolic availability of stemwood reserves in temperate trees with contrasting wood anatomy. Tree Physiol. 2020, 40, 1355–1365. [Google Scholar] [CrossRef]
  55. Gough, C.M.; Flower, C.E.; Vogel, C.S.; Dragoni, D.; Curtis, P.S. Whole-ecosystem labile carbon production in a north temperate deciduous forest. Agric. For. Meteorol. 2009, 149, 1531–1540. [Google Scholar] [CrossRef]
  56. Barbaroux, C.; Bréda, N. Contrasting distribution and seasonal dynamics of carbohydrate reserves in stem wood of adult ring-porous sessile oak and diffuse-porous beech trees. Tree Physiol. 2002, 22, 1201–1210. [Google Scholar] [CrossRef]
  57. Hartmann, H.; Trumbore, S. Understanding the roles of nonstructural carbohydrates in forest trees—From what we can measure to what we want to know. New Phytol. 2016, 211, 386–403. [Google Scholar] [CrossRef] [PubMed]
  58. Turnbull, M.H.; Whitehead, D.; Tissue, D.T.; Schuster, W.S.F.; Brown, K.J.; Griffin, K.L. Responses of leaf respiration to temperature and leaf characteristics in three deciduous tree species vary with site water availability. Tree Physiol. 2001, 21, 571–578. [Google Scholar] [CrossRef]
  59. Vartapetian, B.B.; Jackson, M.B. Plant adaptations to anaerobic stress. Ann. Bot. 1997, 79, 3–20. [Google Scholar] [CrossRef]
  60. Colangelo, M.; Gazol, A.; Camarero, J.J.; Borghetti, M.; Sanchez-Salguero, R.; Matias, L.; Castellaneta, M.; Nola, P.; Ripullone, F. Earlywood vessel characteristics are early indicators of drought-induced decline in ring-porous oak species within the Mediterranean Basin. Sci. Total Environ. 2025, 980, 179565. [Google Scholar] [CrossRef] [PubMed]
Figure 1. Location (red dot) and climatic diagram of the sampling site, Monte de Santa Olaia e Ferrestelo. Photo obtained from Google Earth.
Forests 16 01252 g001
Figure 2. Distribution of earlywood vessel size per tree (a), separating those in the first row (r1; blue) and not (nr1; grey); the width of the box plots is proportional to the number of vessels included. Contribution of each group of vessels (r1 and nr1) to the total theoretical conductivity (b).
Forests 16 01252 g002
Figure 3. Principal component analysis (varimax rotated) of the set of variables studied. Black symbols indicate ring-width variables, and colored symbols are earlywood anatomical variables (blue: whole earlywood; red: first vessel row; green: vessels outside the first row). nv: number of vessels; mva: mean vessel area; mvd: mean vessel diameter; Mvd: median vessel diameter; q3: third quartile of vessel distribution; m95: 95th percentile of vessel distribution; DH: hydraulically-weighted diameter; Ks: specific conductivity. The inner table shows the correlation values of the selected variables for further analysis. Bold values show significant correlations with p < 0.05.
Forests 16 01252 g003
Figure 4. Climate–growth relationship for the study variable chronologies for the period 1960–2011 (51 years). Results are expressed as Pearson’s correlation coefficients, with their significance obtained by 10,000 bootstrap replications. Only significant correlations are highlighted. LW—latewood width; nv—number of vessels not in the first row; DH-r1—hydraulically-weighted vessel diameter for the first row; Mvd—median vessel diameter outside the first row. P: total precipitation; Tmin: mean of minimum daily temperatures; Tmax: mean of maximum daily temperatures. Lower and uppercase letters correspond to the months of the previous and current growth years, respectively; climate variables are expressed as monthly records.
Forests 16 01252 g004
Figure 5. Correlations between monthly values of the standardized precipitation–evapotranspiration index (SPEI) at different time scales (1–24) for LW, DH-r1, Mvd, and nv chronologies for the period 1960–2011 (51 years). LW—latewood width; nv—number of vessels not in the first row; DH-r1—hydraulically-weighted vessel diameter for the first row; Mvd—median vessel diameter outside the first row. Lower and uppercase letters correspond to the months of the previous and current growth years, respectively.
Forests 16 01252 g005
Table 1. Summary of the mixed-effects models to assess differences due to vessel rows, growth years, and individual trees, showing the results for the fixed effects (a), and for the random effects (b). (mva: mean vessel area; DH: hydraulically-weighted vessel diameter; nv: number of vessels; Kt: total theoretical conductivity, expressed as the sum of the fourth power of vessel radii; n.s. refers to non-significant statistics for p > 0.05).
(a)VariableEffectEstimateStd Errort-Valuep-Value
Row−243,313.4473,199.660−3.3249.19 × 10−4
mvaYear121.3026.0704.6533.69 × 10−6
Row × Year137.8536.8703.7391.95 × 10−4
Row−303.89222.779−1.3640.17 n.s.
DHYear0.570.0797.2051.12 × 10−12
Row × Year0.190.1121.7140.09 n.s.
Row−1934.00241.400−8.0153.00 × 10−15
nvYear−1.060.086−12.296<2.00 × 10⁻¹⁶
Row × Year0.960.1227.9196.23 × 10−15
Row−7875.141525.738−5.1622.94 × 10−7
KtYear2.370.5434.3661.39 × 10−5
Row × Year4.200.7685.4705.67 × 10−8
(b)Standard deviationmvaDHnvKt
Tree7996.46670.821095.45989.95
Residual8897.32911.051225.001047.60
Table 2. Statistics of chronology quality for the study variables (LW: latewood width; nv: total number of vessels; DH-r1: hydraulically-weighted vessel diameter for the first row; Mvd-nr1: median vessel diameter outside the first row). Mean sensitivity (Sens) and first-order autocorrelation coefficient (AR1) were calculated for both raw and detrended (std) series. Other statistics refer to the detrended series. (Rbar: mean correlation between all radii; RvsM: mean correlation of radii versus the chronology mean; EPS: expressed population signal; SNR: signal-to-noise ratio; %Var: percentage of variance in the first eigenvector).
LWnvDH-r1Mvd-nr1
Sens (raw)0.4390.2850.0730.149
Sens (std)0.4170.2910.0720.147
AR1 (raw)0.2840.4980.3440.215
AR1 (std)−0.0350.099−0.011−0.009
Rbar0.3060.1980.3570.120
RvsM0.6000.5170.6440.455
EPS0.8150.7110.8470.571
SNR4.402.475.551.33
%Var39.9%32.4%45.2%23.7%
Disclaimer/Publisher’s Note: The statements, opinions and data contained in all publications are solely those of the individual author(s) and contributor(s) and not of MDPI and/or the editor(s). MDPI and/or the editor(s) disclaim responsibility for any injury to people or property resulting from any ideas, methods, instructions or products referred to in the content.

