Abstract
Depending on the feedstock type and the pyrolysis conditions, biochars exhibit different physical, chemical, and structural properties, which highly influence their performance in various applications. This study presents a comprehensive characterization of biochar materials derived from the waste wood of pine (Pinus sylvestris L.) and beech (Fagus sylvatica) after low-temperature pyrolysis at 270 °C, followed by chemical activation using zinc chloride. The resulting materials were thoroughly analyzed in terms of their chemical composition (FTIR), thermal behavior (TGA/DTG), structural morphology (SEM and XRD), elemental analysis, and particle size distribution. The successful modification of raw biomass into carbon-rich structures of increased aromaticity and thermal stability was confirmed. Particle size analysis revealed that the activated carbon of Fagus sylvatica (FSAC) exhibited a monomodal distribution, indicating high homogeneity, whereas Pinus sylvestris-activated carbon showed a distinct bimodal distribution. This heterogeneity was supported by elemental analysis, revealing a higher inorganic content in pine-activated carbon, likely contributing to its dimensional instability during activation. These findings suggest that the uniform morphology of beech-activated carbon may be advantageous in filtration and adsorption applications, while pine-activated carbon’s heterogeneous structure could be beneficial for multifunctional systems requiring variable pore architectures. Overall, this study underscored the potential of chemically activated biochar from lignocellulosic residues for customized applications in environmental and material science domains.
Keywords:
biochar; carbonization; charcoal; chemical composition; lignocellulose; microscopy structure; wood 1. Introduction
Biochar is a black, amorphous carbon with a polycyclic structure, higher aromaticity, and lower contents of hydrogen H and oxygen O compared to the initial biomass feedstock and different surface oxidations [1,2,3,4,5]. Biochar typically contains volatiles, ash, fixed carbon, nitrogen, and sulfur [3]. The biochar’s applications depend on its physicochemical properties, which are mainly influenced by the species of the initial feedstock, referring mainly to chemical composition and anatomical characteristics, as well as the conditions of pyrolysis, such as the heating temperature, duration, and pressure [1]. The determination of the optimum application for each biochar material produced, hence, requires a thorough characterization of the material and a study on the complete production process [6,7,8].
Among the most crucial properties of charcoal or biochar (depending on the methodology applied for its production) are its reactivity, mechanical durability, electrical conductivity, self-heating tendency, fixed carbon content, ash content, elemental composition, potential impurities detection, stability in soil, surface area, porosity, etc. [3,4], while the availability of wood or other feedstock types, charcoal’s quality, cost, and the capacity to produce it constitute important aspects as well [7]. During the process of carbonization, several chemical changes in wood chemical compounds take place, most of them working in parallel. More specifically, hemicelluloses (15%–35% of wood mass) rapidly depolymerize at 200–300 °C into volatile gases (CO, CO2, acetic acid) and tars, while cellulose (35%–50% of wood mass), at 300–400 °C, breaks down into levoglucosan and other anhydrosugars, which aid in the formation of bio-oil, and lignin (the 18%–35% of wood mass), at approximately 400–700 °C, breaks down gradually, producing aromatic compounds and a solid residue that is rich in carbon (biochar) [4,6,7]. During the thermochemical process of wood carbonization, the phenomena that take place till 150 °C are dehydration and a loss of low-molecular-weight volatiles. At approximately 200 °C, where active pyrolysis starts, hemicellulose depolymerization, cellulose crystallinity degradation, and lignin softening take place. At higher temperatures, the carbonization phase occurs, with condensation reactions taking place (i.e., aromatic groups grow, forming turbo static “graphene” structures; pores are developed; lignin depolymerizes providing phenols; cellulose breaks down in sugars; hemicelluloses break down, providing ketones, among others; while non condensable gases, such as CO, CO2, CH4, and H2, emerge from decarboxylation, demethoxylation, and other depolymerization reactions [6,7]). At higher temperatures (above 500 °C), aromatic C=C condensation occurs (the graphitization mechanism) [5,6].
The activation process, including both chemical and physical activation methods, undoubtedly affects the formation of oxygenated functional groups in the material’s mass [9]. Activated carbon can be produced from a variety of carbonaceous sources, including coal, lignite, wood, and waste materials (such as coconut husks, paper mill waste, bones, pits, etc.). In previous studies, during the production of activated biochar from several plant species’ wastes, dehydration, carbonization, and silica extraction were applied using (4%) NaOH solution and revealed a wide peak in the 3200–3600 cm−1 region in the activated carbon that was caused by O–H stretching vibrations [10]. This indicated the presence of hydroxyl groups on the surface of biochar, which can be caused by adsorbed water as well as phenolic, alcohol, or carboxylic groups. This peak could be intensified by acid treatment, suggesting higher surface oxidation.
The increased physical adsorption capability of activated carbon is mainly attributed to its more extended pore structure and higher specific surface area [8,9]. An overview of activated charcoal dosage and application methods was provided by Zellner et al. [11], who summarized the list of formulations that are known to adsorb or not adsorb onto activated charcoal. Chen et al. [12] reported that activated charcoal was effective in removing pollutants from the water samples. It has been demonstrated that both the biochar’s chemical composition and the functional groups on the biochar surface affect the efficiency of Pb(II) ion removal from water, thus requiring the use of mass spectrometry analysis to unravel the underlying mechanisms. Biochar-derived activated carbon seems to work incredibly well in air filtration and wastewater treatment systems [13]. According to studies looking into resource recovery techniques and green pollution management, activated carbon effectively removes several organic pollutants from water sources. It is still essential to conduct research on the health impacts of organic pollutants and trace elements that come from using charcoal. According to the literature, polycyclic aromatic hydrocarbons (PAHs) and several other harmful compounds impair indoor air quality and harm lung health [14]. Scientists could create enhanced public health recommendations and fortify the current regulatory frameworks by researching the chemical profiles of biochar [13,14].
According to Prastiwi et al. [15], the activated biochar that is derived from wood can be utilized as a slow-release fertilizer for copper, iron, and zinc. Activated charcoal is frequently used to absorb airborne contaminants such as particulate matter, hazardous gases, and volatile organic compounds (VOCs). It is efficient at eliminating pollutants from indoor air and industrial emissions due to its high surface area. The adsorption of VOCs onto activated charcoal made from sawdust waste during furniture production was highlighted by Chaisarn et al. [16]. Iodine number analysis was used to characterize the charcoal generated at 450 °C, with phosphoric acid acting as an activator [16], allowing the determination of the material’s adsorption capability. At the same time, they recorded the specific surface area and shape of the charcoal by employing BET analysis to investigate nitrogen’s physical adsorption isotherms at 77.35 K in addition to scanning electron microscopy (SEM).
Yan et al. [17] activated carbon that was derived from coconut shell and wood wastes and then applied ozone oxidation to effectively remove SO2, NOx, and Hg0 from the flue gases. The effects of various circumstances on the chemicals’ rates of oxidation and clearance were investigated. Charcoal and activated carbon have quite different adsorption capabilities for different gases. While coconut shell was proven to be more appropriately suited for the adsorption of SO2 and Hg0 due to its reduced COOH and O=C–O group concentration, charcoal exhibited a higher adsorption ability for NOx. The physical and chemical properties of charcoal and activated carbon are intimately related to their adsorption capabilities for various gases. Charcoal has a stronger polarity and a higher concentration of oxygen-containing functional groups, like C–O and C=O, compared to activated charcoal. Its capacity to absorb NOx is improved by these features.
Activated charcoal is used as a component in composites to enhance their quality. Yadav et al. [18] studied the adsorption of cationic dyes, medications, and metals using a magnetic/β-cyclodextrin/activated charcoal/Na alginate composite. Activated charcoal’s function was to coat Fe3O4 particles and shield them from buildup and chemical breakdown. Furthermore, activated charcoals were studied as a medication delivery vehicle. Miriyala et al. [19] placed ibuprofen and paracetamol onto activated carbon and studied them during in vitro drug release. Amorphous drug stabilization and a high drug loading capacity were demonstrated by the activated charcoal [18,19]. The chemical and pharmaceutical industries frequently employ activated carbons for purification.
Only recent research attempted to investigate how the chemical activation after low-temperature pyrolysis (300–500 °C) affects the characteristics of biochar, improving its porosity, surface functionality, and ability to absorb [20]. Compared to high-temperature biochar, biochar that is produced by low-temperature pyrolysis (300–500 °C) exhibits higher levels of volatile matter and residual organic chemicals. As it is referred, biochar (at low temperatures) that is made from woody feedstocks has a moderate surface area but an excessive amount of oxygen-containing functional groups (OH, COOH), which are required for chemical activation and subsequent modification [21]. Chemical activation, in general, alters the physicochemical structure of biochar by employing substances such as KOH, HPO4, ZnCl2, or NaOH. KOH seems to increase pores and the surface area (up to 1500 m2/g), and H3PO4 adds acidic surface groups while maintaining carbon frameworks. When activated, low-temperature biochar may demonstrate a combination of meso- and microporosity, which makes it appropriate for the pollutant’s adsorption (such as dyes and heavy metals) [22]. Despite the potential of chemically activated biochar, there are still issues with optimizing the activation conditions (e.g., temperature or agent concentration), especially for woody feedstocks that undergo low-temperature pyrolysis, and further investigation is required for its potential and application range assessment clarification.
Furthermore, low-temperature pyrolysis is generally associated with a higher biochar yield and higher retention of surface functional groups due to less severe thermal degradation. In contrast, high-temperature pyrolysis typically produces biochars with an enhanced surface area, higher porosity, and carbon content—properties that are often desirable in adsorption applications, albeit at the cost of significantly higher energy input [23,24]. The scarce previously published studies have shown that increasing the pyrolysis temperature from 300 °C to 500 °C could reduce the yield from 46.7% to 33.2% while significantly enhancing BET surface area and aromaticity [20]. These findings strengthen our interest in exploring the balance between energy efficiency and material performance.
In an attempt to maintain the energy applied during the biochar production process at low levels, and therefore, the production cost and a low environmental footprint, in the current study, low temperatures (270 °C) and a short duration of pyrolysis (60 min) were applied to produce biochar types by utilizing waste wood of two different widely available wood species. Specifically, wood biomasses of pine (Pinus sylvestris L.) and beech (Fagus sylvatica) were used. These two wood species are commonly applied in the field of construction and are significant species in the European region as well as around the globe, whose mechanical processing creates large quantities of residual woody biomass that require management and utilization. The obtained biochar materials were thoroughly characterized for their potential utilization in various applications that are emerging in several fields (e.g., environmental science, materials research, adsorption applications, forensic investigations, etc.). Afterwards, the biochar materials were chemically activated and all the different produced materials were thoroughly characterized, including their chemical compositions, crystallinity and bonds, thermal decomposition rates, equilibrium moisture contents (EMC), densities, particle analyses, morphologies, and anatomical characteristics, towards the investigation of the produced biochar materials’ potential utilization in various applications and the impact of chemical activation on the properties of these materials and their application range.
2. Materials and Methods
2.1. Raw Material Harvesting and Preparation
For the purposes of the current work, wood biomass of pine (Pinus sylvestris L.) (PS) and beech (Fagus sylvatica) (FS) species was obtained from 2 trunks. The samples were taken at approximately 1–1.3 m of the trunk height, and mainly included the sapwood regions. The trunks originated from the AUTh University Forest of “Taxiarchis” in the Chalkidiki region, located in Northern Greece, after being selected as typical and free of apparent defects (the pine and beech wood were aged 23 and 28 years old, respectively). The trunks were placed into laboratory infrastructures and cut into boards; the bark material was totally removed, and the boards were conditioned in a chamber under stable conditions (65% relative humidity, 20 ± 2 °C) until a constant weight was achieved. ISO13061-1 [25] was applied for the measurement of the EMC of wood (%), while ISO13061-2 [26] was applied for the measurement of wood basic density (dry wood weight/EMC wood volume). The mean EMC values of the untreated wood specimens were found to be 8.56% for pine and 9.32% for beech wood, while the basic density of those were found to be 566 kg/m3 for pine and 708 kg/m3 for beech wood.
2.2. Pyrolysis Process
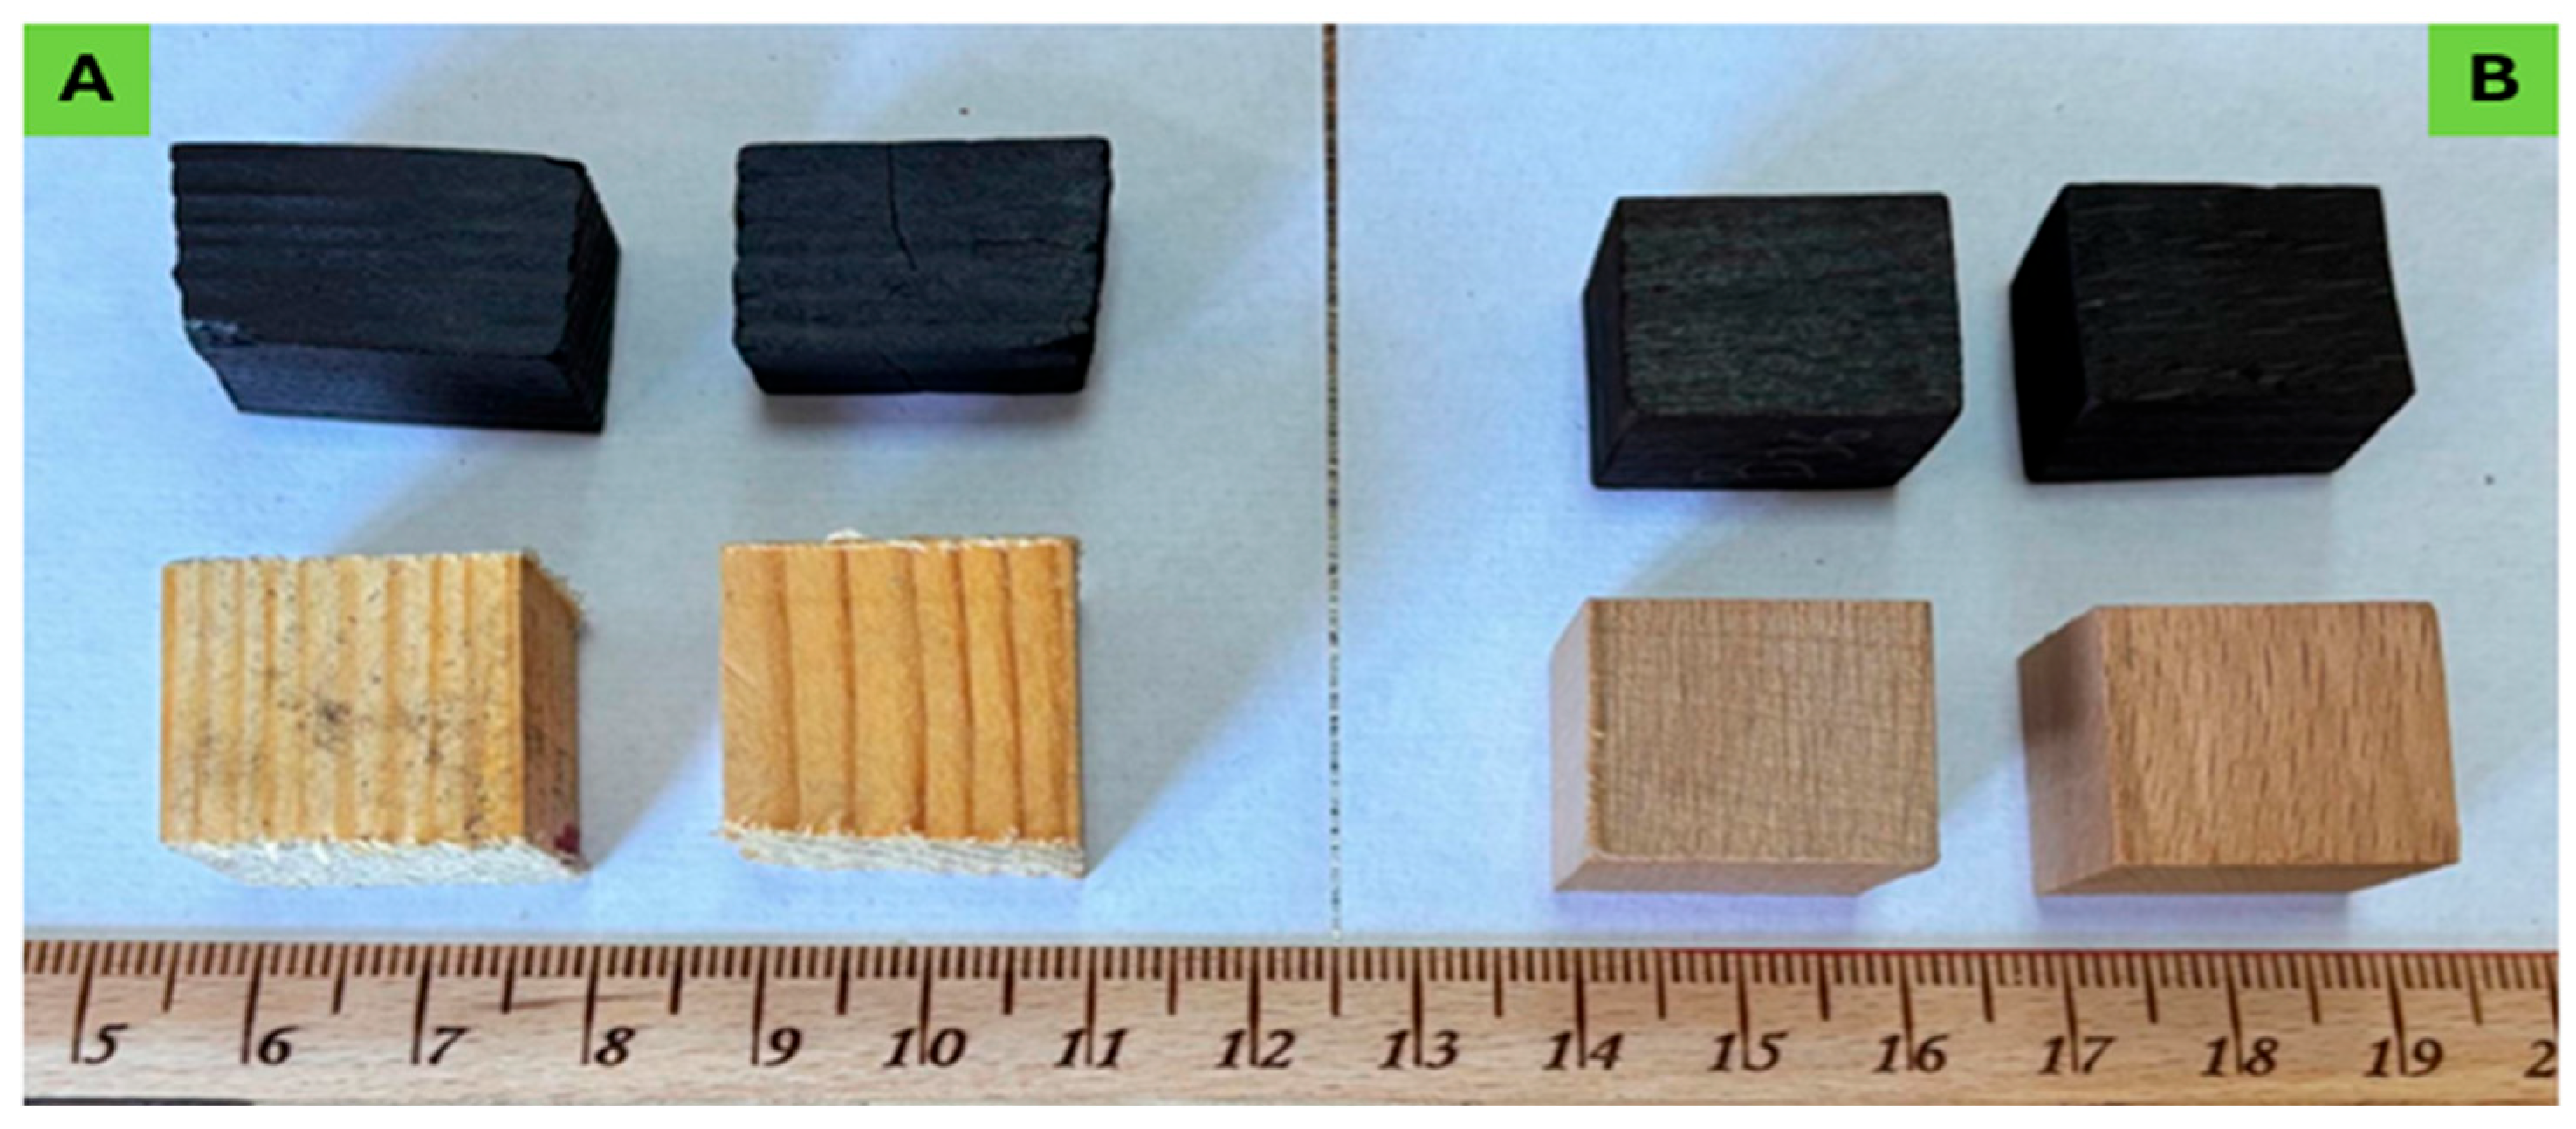
Wood specimens in the form of cubes of 20 × 20 × 20 mm (Figure 1) were prepared and inserted into a custom-made pyrolyzing reactor and pyrolyzed at a low temperature (270 °C) for a short period of 1 h (with a total residence time of 60 min, and 15 min under the highest temperature of 270 °C). The fixed-bed pyrolysis reactor included the following parts: an N2 tube, nitrogen gas flow path, flowmeter, temperature controller, pyrolysis reactor, digital temperature, pressure gauge, the flow line of the pyrolysis vapors, a liquid collecting container, power supply, and a cooling unit. In a typical industrial process, biochar is usually generated at 500 °C and pyrolyzed for 60 min [27].
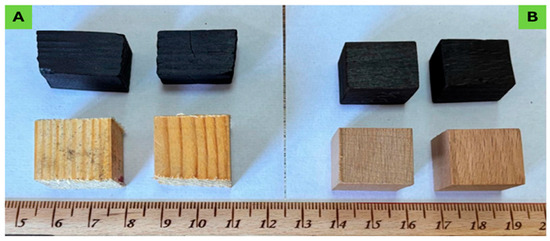
Figure 1.
Wood specimens of pine wood (A) and beech wood (B) before and after pyrolysis treatment application.
In the current work, 20 specimens were pyrolyzed per wood species in order to produce adequate biochar materials for the activation and characterization processes. The pyrolyzed material of all the categories was placed under stable conditions (65% relative humidity, 20 ± 2 °C) so as to be conditioned until a constant weight was achieved. The characterization of the treated and untreated materials led to an understanding of the induced changes and the potential utilization of these biochar materials. Raw wood material samples of the two wood species and the respective biochar materials were ground using a Willey mill (of 20 mesh), which was to be used in several characterization processes that are described in the following sections.
2.3. Biochar Activation
Samples of the beech material, Fagus sylvatica biochar (FSB), and the pine material, Pinus sylvestris L. biochar (PSB), were chemically activated as per the experimental procedure reported in the literature [28]. Raw wood materials of the species were not included in the activation process. A certain amount of FSB and PSB biochar materials (with a mean value of 23.22 g for the FSB and 27.08 g for the PSB) was added to ZnCl2 at a w/w ratio of 1:2 (FSB or PSB/ZnCl2 solution (60% w/w) impregnation ratio). This solution was stirred using a magnetic stirrer at 20 ± 2 °C for 3 h, and the solution was then filtered. The filtration was implemented using Whatman Grade 42 black ribbon filter papers with a nominal pore size of 2.5 µm, given that it is considered suitable for fine precipitate retention and provides an efficient separation of solid residues during the washing and activation steps. Afterwards, the samples were washed with deionized water and dried at 105 °C for 12 h. The dried activated FS/PS samples were subjected to slow pyrolysis at a 600 °C temperature, 10 °C/min heating rate, and a 200 cm3/min N2 gas atmosphere in a pyrolysis reactor [29]. The produced activated carbon samples were washed several times with 0.3 M hydrochloric acid (HCl) solution (prepared at room temperature) to ensure that the ZnCl2 salt was completely removed. Finally, the filtrate was washed with deionized water until it became neutral, and then it was dried at 105 °C for 12 h. In the following, all the materials were conditioned under stable conditions (65% relative humidity, 20 ± 2 °C) until a constant weight was achieved. The yield of activated carbon biochar materials post-activation was determined.
2.4. Infrared Spectroscopy Using Fourier Transform (FTIR)
In the context of the characterization of different materials, a Fourier transform infrared (FTIR) analysis of the samples was performed using a Perkin-Elmer Frontier spectrometer (Waltham, MA, USA). The spectra were collected using the attenuated total reflection (ATR) technique within a range of 4000 to 500 cm−1 at a resolution of 4 cm−1.
2.5. Thermogravimetric Analysis (TGA) of Activated and Non-Activated Biochars
Thermogravimetric analysis (TGA) and derivative thermogravimetry (DTG) of the materials were performed using a PerkinElmer TGA 4000 instrument. Approximately 10 mg of each material sample was placed in a platinum crucible and heated from room temperature to 35 °C to 900 °C at a constant heating rate of 10 °C/min under a nitrogen atmosphere (flow rate: 20 mL/min) using a thermogravimetric analyzer.
2.6. Particle Size Analyses of Activated and Non-Activated Biochars
Particle size distribution analyses of the activated and non-activated biochars derived from the Pinus sylvestris (PSB, PSC) and Fagus sylvatica (FGB, FGC) species of wood material were conducted using a laser diffraction particle size analyzer (Malvern Mastersizer e2000 Hydro particle size analyzer, Malvern Instruments Limited, Malvern, UK). Approximately 0.1 g of each biochar sample was dispersed in distilled water using ultrasonication for 15 min to ensure proper de-agglomeration. The measurements were conducted under ambient conditions, and the particle size distributions were recorded based on volume.
2.7. Scanning Electron Microscopy (SEM) Analyses of Activated and Non-Activated Biochars
Morphological and elemental analyses of the biomass-derived carbons were carried out using a scanning electron microscope (SEM, Zeiss Supra 40, Cologne, Germany) at the optimum operating condition with 1000⋅magnification at an excitation energy of 10 kV, along with energy-dispersive X-ray spectroscopy (EDS) analysis, in order to examine the morphologies of the biomass-derived carbons.
2.8. X-Ray Diffraction Analyses (XRD) of Activated Biochars
X-ray diffraction (XRD) analyses were performed to investigate the crystalline structures of the activated biochars. The measurements were carried out using a Panalytical X-Pert 3 Powder diffractometer equipped with Cu Kα radiation (λ = 1.5406 Å), operating at 40 kV and 40 mA. The diffraction patterns were recorded over a 2θ range of [e.g., 10–60°] with a scanning rate of 2°/min. The obtained XRD patterns were compared with standard reference data to identify the crystalline phases present in the samples.
Microsoft Excel software was used for results processing and the preparation of the diagrams and tables of the experimental results, while one-way ANOVA was conducted through SPSS software (version 27) to detect whether the differences in mean values of different wood material categories were statistically significant. Differences were considered significant at p ≤ 0.05.
3. Results
3.1. The Yield of Biochar Activation
The yields of the activated carbon obtained from the two different biomass sources demonstrated notable variations. Specifically, Fagus sylvatica resulted in an activated carbon yield of 53.411%, while Pinus sylvestris exhibited a higher yield of 64.170%. This difference can be attributed to the intrinsic structural and compositional properties of the raw materials, such as lignin, cellulose, and hemicellulose contents, which influence carbon retention during the carbonization and activation processes. The higher yield from Pinus sylvestris suggests its greater potential for activated carbon production in terms of mass efficiency. These results are consistent with previous findings in the literature, where softwood species typically exhibit higher yields due to their structural composition and thermal behavior during pyrolysis and the activation steps [30,31].
3.2. FTIR Analysis Results
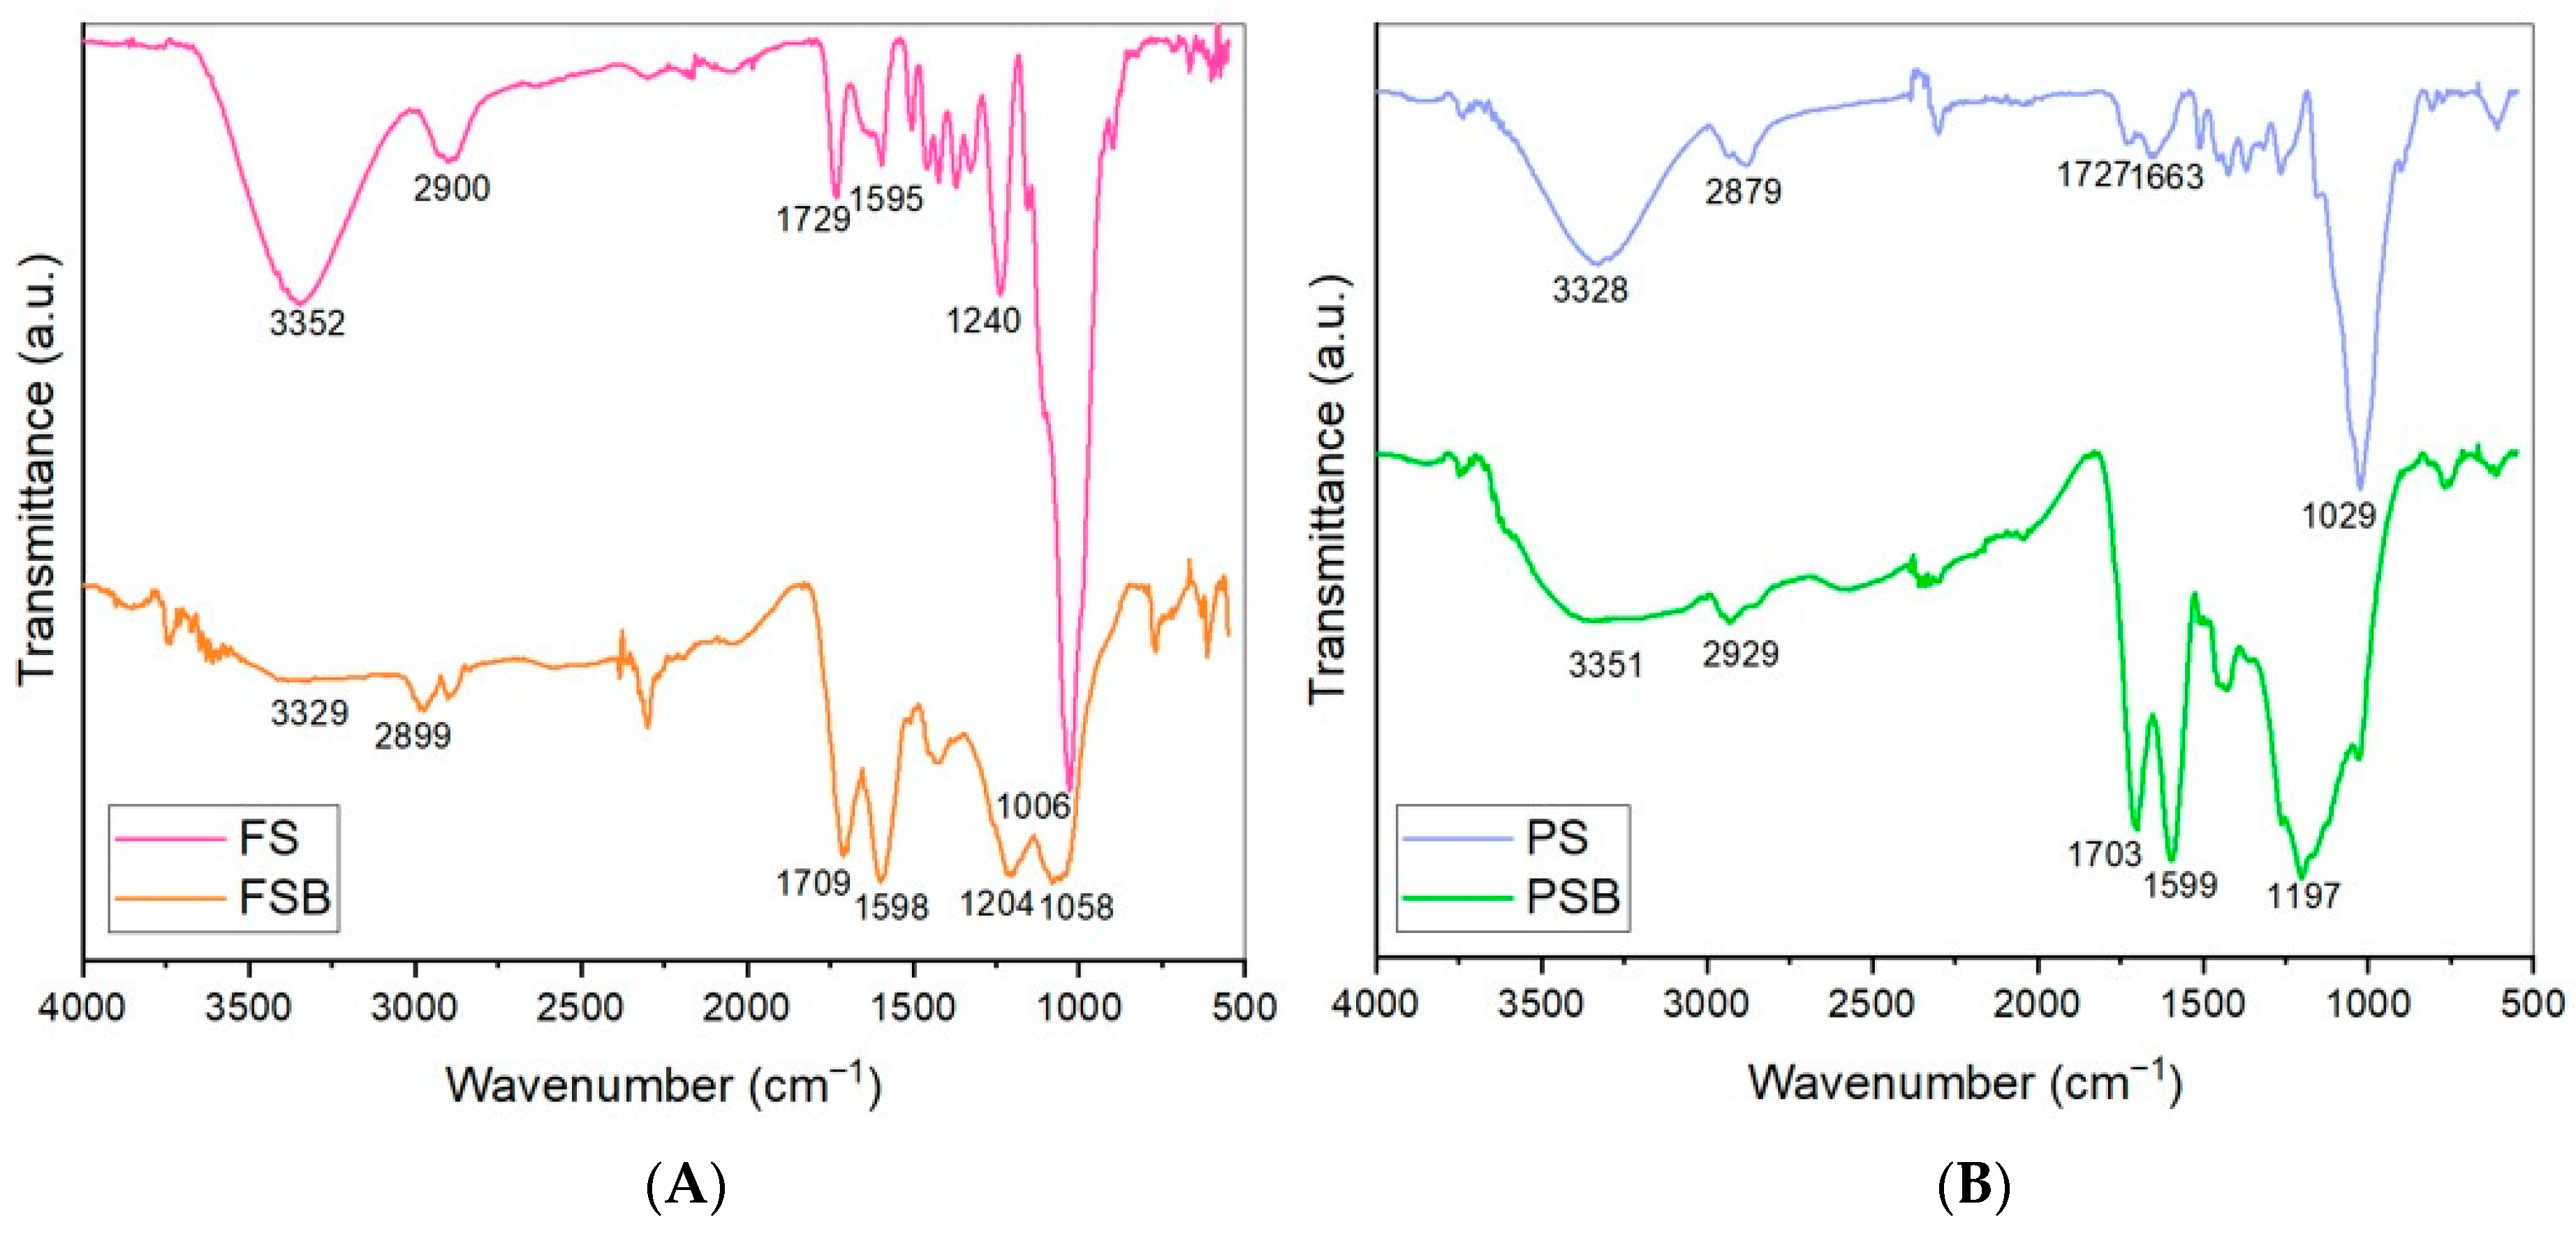
The FTIR spectra of the wood-based biochars (PSB and FSB) and raw materials (PS and FS) are presented in Figure 2. The FTIR analysis clearly demonstrates the chemical transformation of Fagus sylvatica (FS) wood pieces into biochar (FSB) through pyrolysis. The significant reduction in hydroxyl, aliphatic, and carbonyl functional groups, alongside the relative enrichment of aromatic structures, confirms the successful carbonization of the biomass. The remaining oxygen-containing groups in the biochar structure may contribute to its surface reactivity and potential for adsorption applications [32]. Moreover, the FTIR analysis clearly demonstrates the chemical transformations that also occur during the pyrolysis and transformation of Pinus sylvestris wood dust (PS) into biochar (PSB). In particular, the degradation of the O–H, C–H, and C=O functional groups, along with the increase in aromatic structures, confirms that PSB possesses a more stable, hydrophobic, and carbon-rich structure.
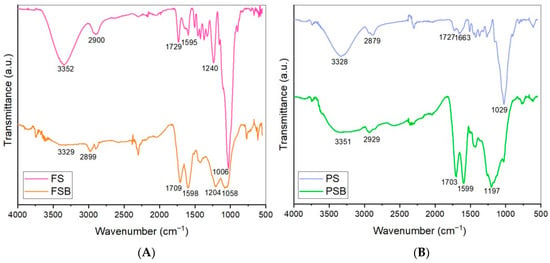
Figure 2.
FTIR spectra of the samples of the two wood species raw materials (FS: Fagus sylvatica raw material; FSB: Fagus sylvatica biochar after the carbonization process (A); PS: Pinus sylvestris raw material; and PSB: Pinus sylvestris biochar after the carbonization process (B)).
In Figure 3, the alterations in the chemical structures of the beech (FS) and pine (PS) wood powder samples due to the pyrolysis process were evidenced by FTIR analysis and corroborated by the findings reported in the literature. The biochar spectra are characterized by several prominent bands. The O–H stretching band, located in the range of approximately 3400–3300 cm−1, is clearly observed in the FS and PS samples. However, the intensity of this band gradually decreases in the spectra of the FSB and PSB samples, and is nearly absent. This phenomenon can be attributed to the accelerated dehydration reactions occurring in the biomass as the pyrolysis temperature increases. A distinct absorbance peak in the range of 3000–2879 cm−1, assigned to aliphatic C–H stretching vibrations, was observed in the biochar spectra. In conjunction with the aromatic C=C stretching peak found at around 1600 cm−1, the spectral features clearly reflect a progressive increase in aromatic character and molecular condensation of the biochars as the pyrolysis temperature increases [33,34].
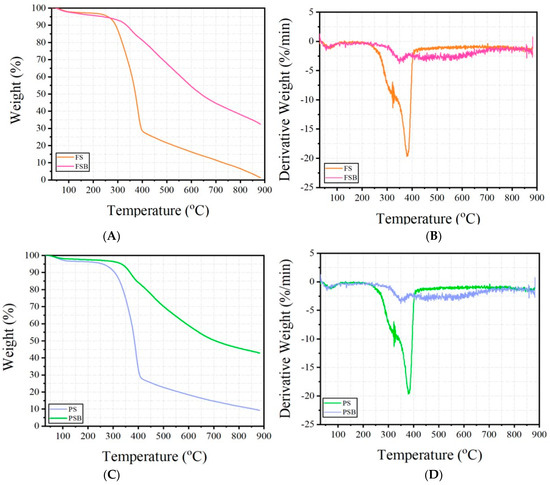
Figure 3.
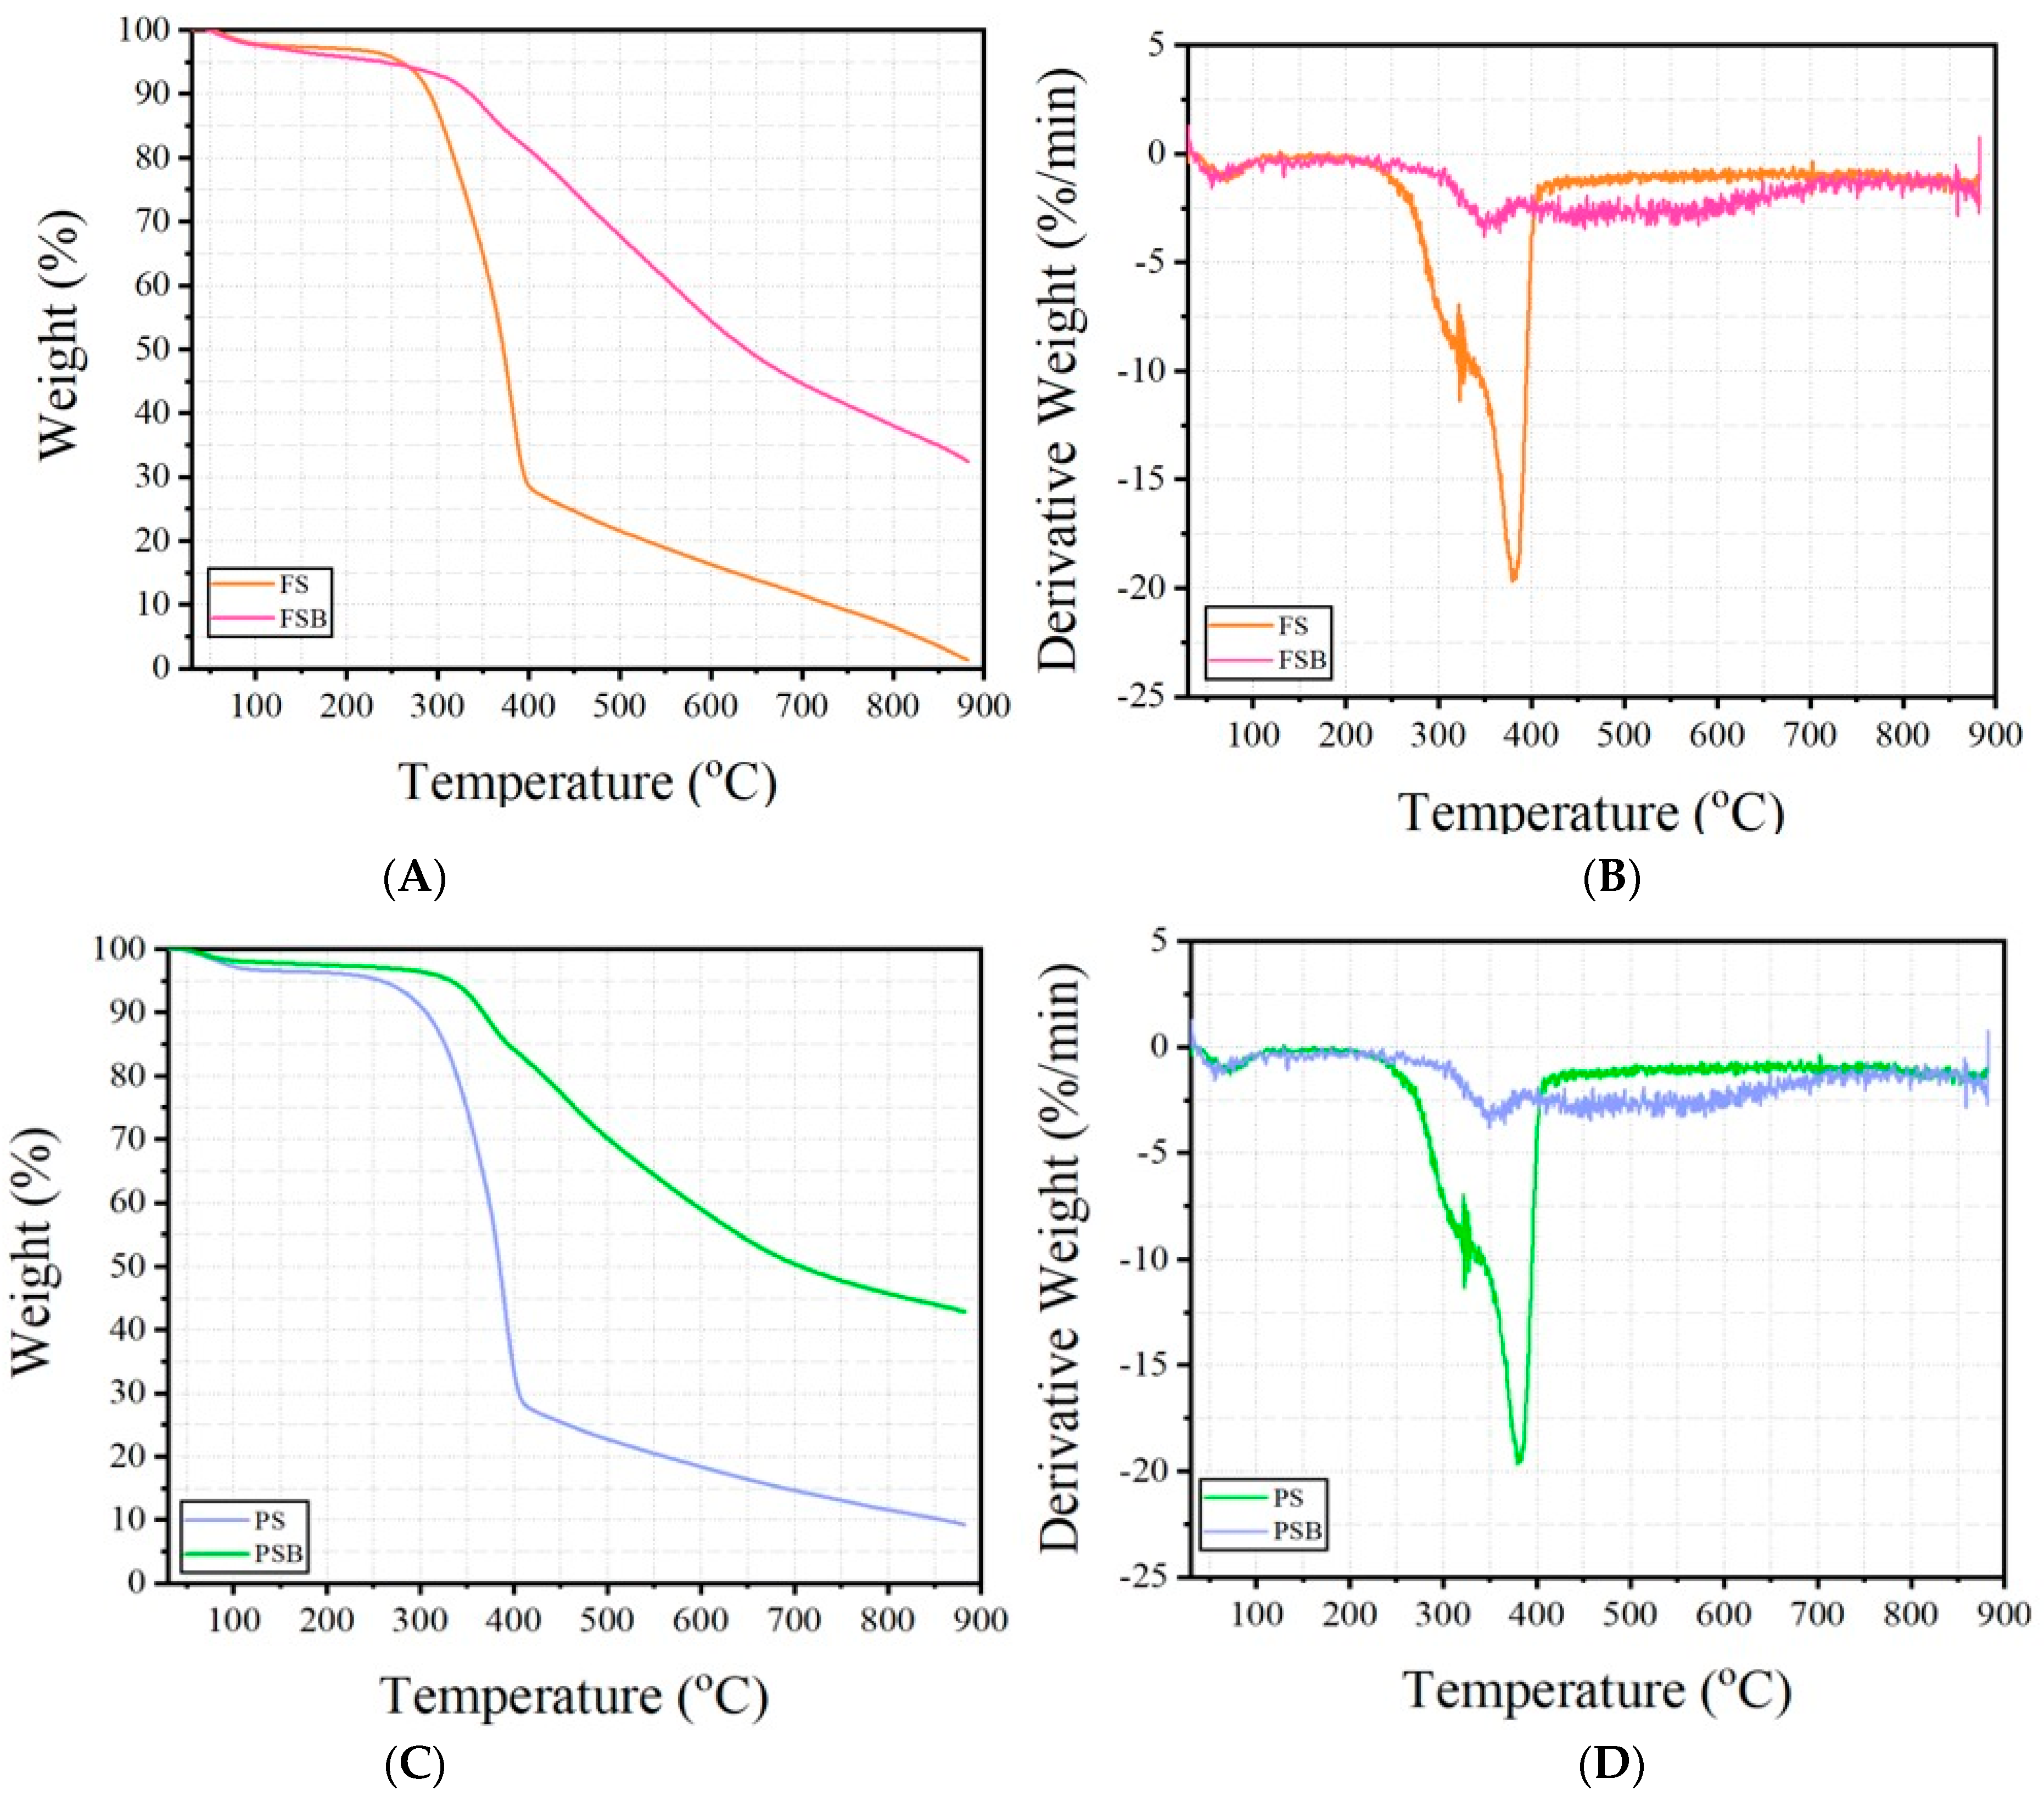
TGA and DTG curves of the samples ((A,B) refer to the Fagus sylvatica raw material, FS and Fagus sylvatica biochar refer to the FSB samples, while (C,D) refer to the Pinus sylvestris L. raw material, and PS and Pinus sylvestris biochar refer to the PSB samples).
The bands in the range of 1204–1006 cm−1 can be attributed to the C−O stretching vibrations present in the glucose monomers that constitute cellulose and hemicellulose components, as well as to the C−H in-plane deformation associated with the guaiacyl units of lignin [34,35,36]. Similarly to hydrogen bonding, as the torrefaction temperature of the biomass increases, the intensity of the C−O bonds in cellulose and hemicelluloses decreases in the spectra due to the thermal degradation induced by the torrefaction process [37,38] (Appendix A of the current article).
3.3. TGA Analysis Results
The thermogravimetric analyses (TGA) and derivative thermogravimetry (DTG) results of the raw wood materials and biochars are shown in Figure 4. The effects of biochar reinforcement on the FS and PS wood samples can be seen clearly in the curves. The FS and PS samples represent raw wood dust, while the FSB and PSB constitute the biochar forms obtained through the pyrolysis of these wood materials. According to the TGA curves, it is generally observed that there are three main decomposition phases.
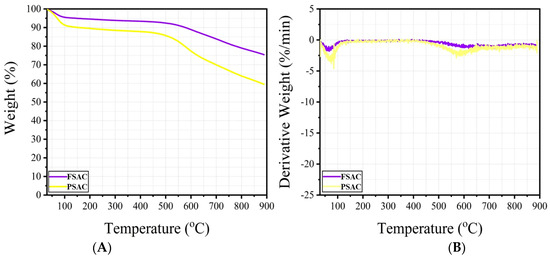
Figure 4.
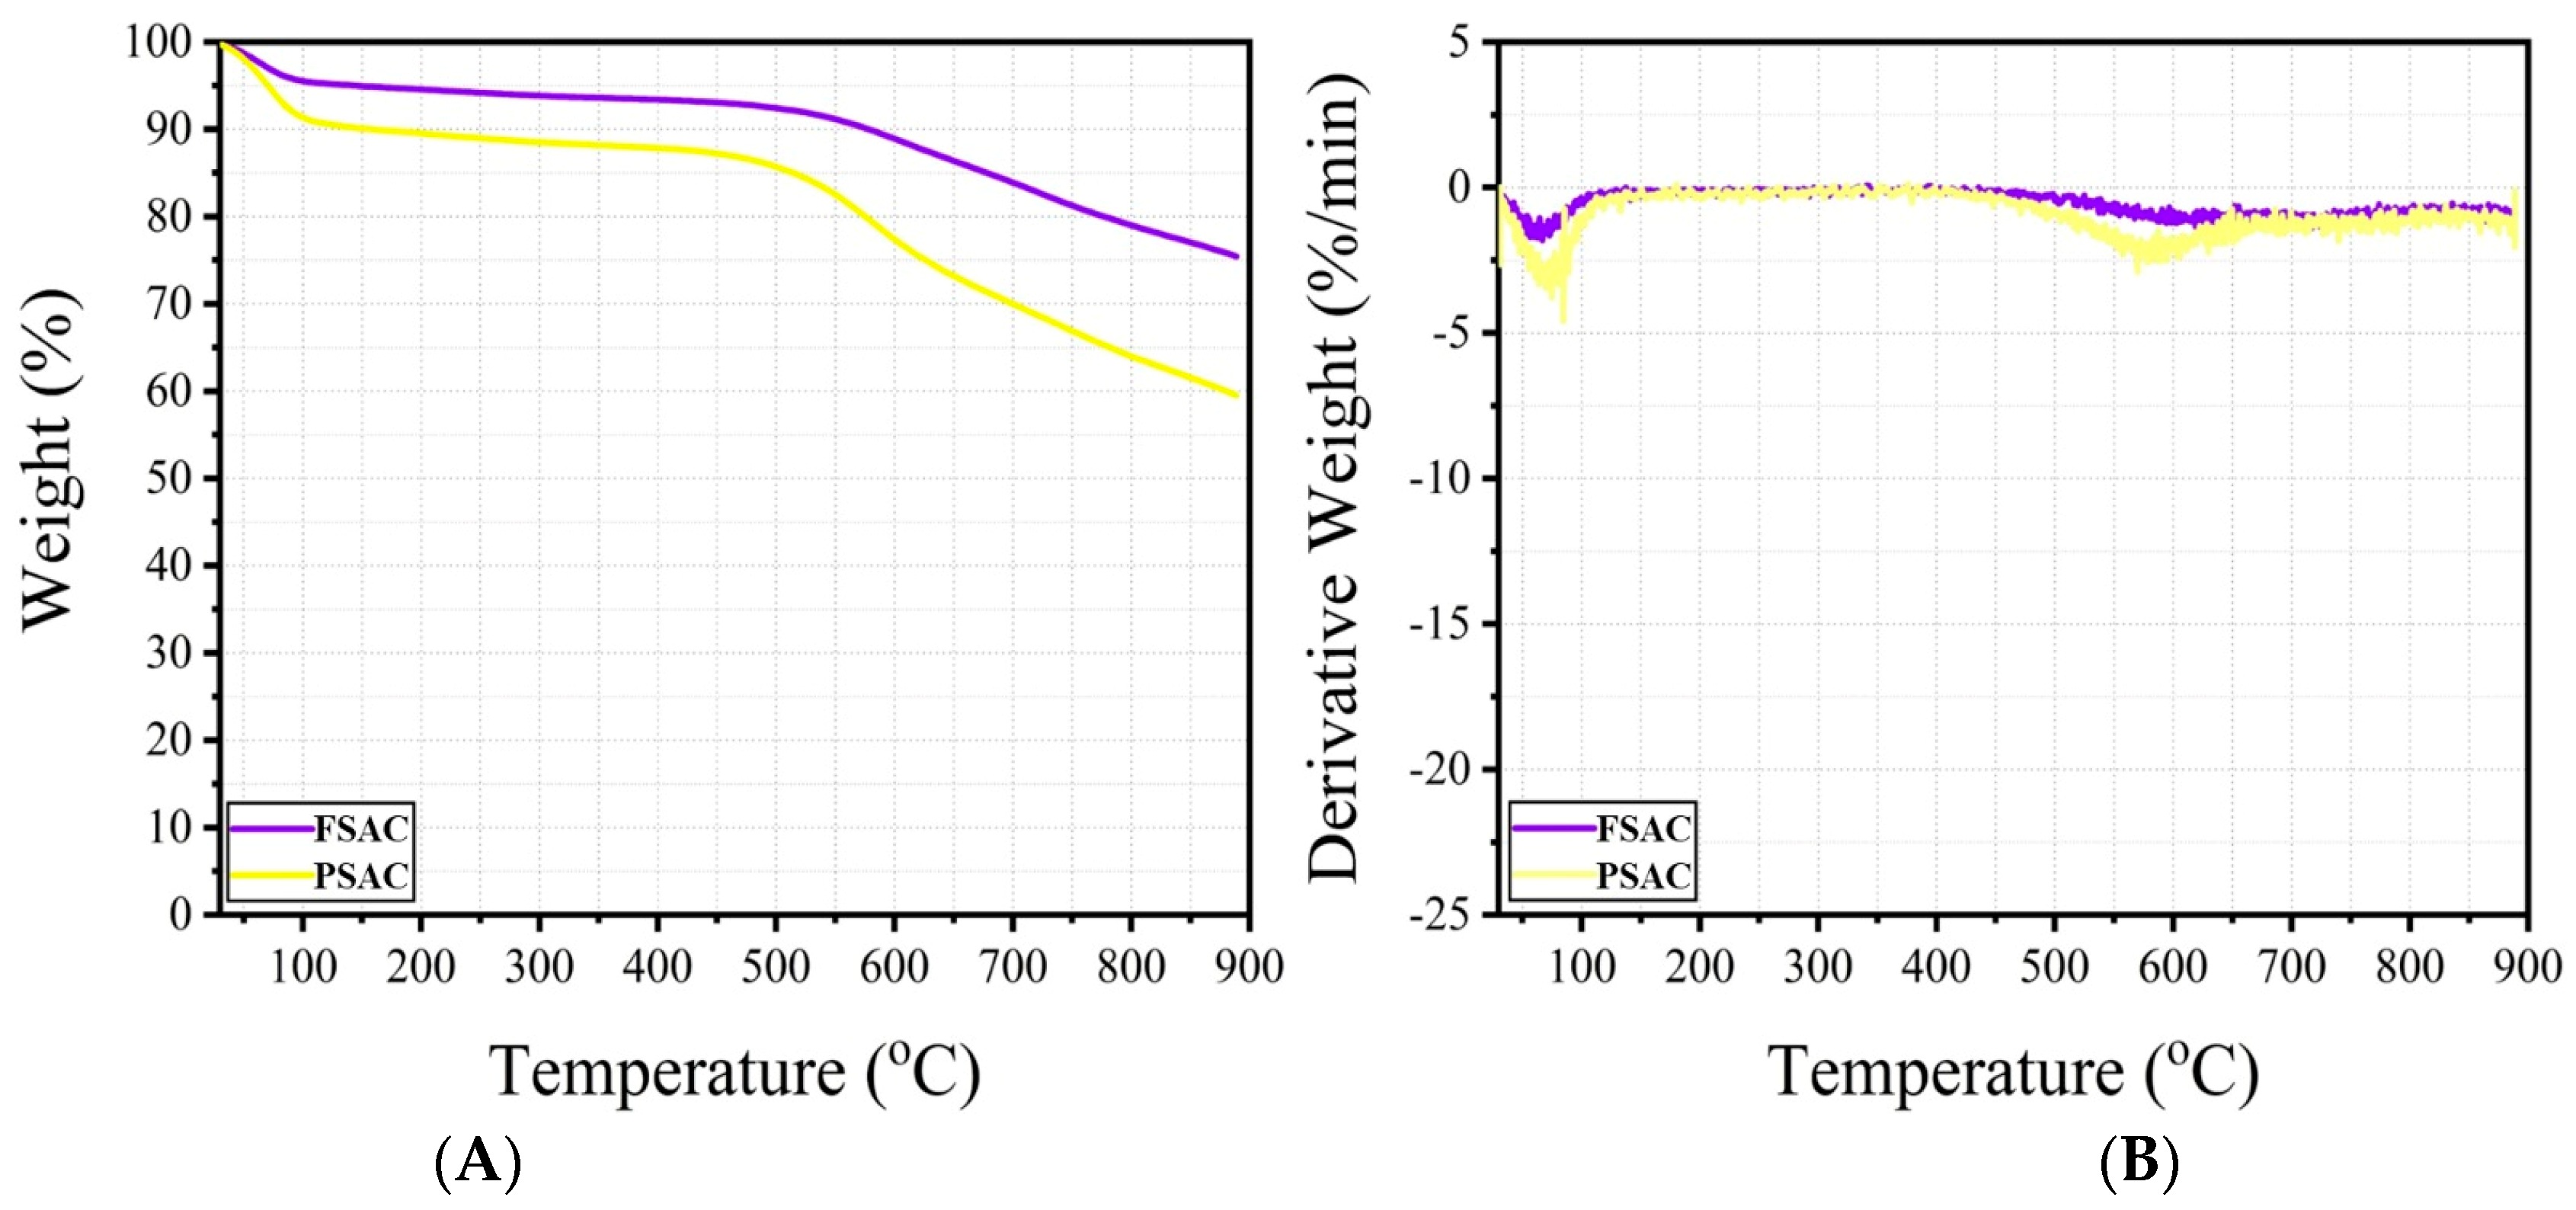
TGA (A) and DTG (B) curves of the Fagus sylvatica post-activation, FSAC, and Pinus sylvestris post-activation, PSAC, samples (AC: activated carbon).
If these decomposition stages are defined, it is observed that there is a removal of moisture content and most volatile extractives at the temperature range of 100–200 °C. At the stage where the temperature value is in the range of 200–450 °C, the degradation of organic components such as cellulose, hemicelluloses, and lignin takes place [4,5,6,24]. Finally, between 450–900 °C, carbonization and formation of inorganic residues occurs [39]. During the main decomposition phase, which took place when the temperature value was in the range of 200–450 °C, high mass losses of approximately 70%–75% were observed in the FS and PS samples. Hemicelluloses were lost first during the thermal degradation of wood (approximately at 180–300 °C) since they constitute the most unstable component of the three structural chemical components of wood, while cellulose, due to a higher polymerization degree and crystallinity index, was more stable thermally and was being lost at higher temperatures (250–400 °C) [4]. On the other hand, these losses decreased to approximately 20%–25% in the biochar-based FSB and PSB samples in the temperature range of 200–450 °C. The reason for this difference is that biochar, which acts as a reinforcement in the structure, slows down the decomposition reactions and makes the decomposition more gradual/stable. According to other previous studies in the literature, drying occurs at a temperature range of 70–120 °C. It has been described that hemicelluloses’ decomposition occurs at temperatures of approximately 200–400 °C, and with an increasing temperature, cellulose breaks down at approximately 300–400 °C, whereas further volatiles are released from the structure. It has been established that lignin undergoes structural degradation, which takes place at around 400–450 °C and above [39,40,41]. Considering the residue amounts obtained at the maximum temperature value in the TGA experiments of the current study, it is understood that FS decomposed almost completely, leaving less than 2% residue (mostly inorganic part). On the other hand, it was seen that the FSB sample containing biochar leaves about 35% residue at the same temperature value. The same is true for the PS and PSB samples. When the curves are examined, it is seen that at the maximum temperature value, the PS sample left approximately 10% char residue, while this rate was determined to be approximately 43% in the PSB in the form of char material. The high carbon content [42] of biochar and, consequently, its high-temperature resistance increased its resistance to degradation. In addition, as observed in the DTG curves, it is clear that the rate of mass change is slower and more stable in samples containing biochar. This indicates that thermal degradation is slower and more gradual in samples made of biochar. According to the DTG curves, the FS and PS raw wood material samples show a sharp peak at about 380 °C, indicating an abrupt decomposition of the organic components. This is supported by high negative derivative values (approximately −20%/min). In contrast, the decomposition of the biochar-based FSB and PSB samples was spread over a wider temperature range (approximately 300–400 °C), the peaks were of lower intensity (approximately −3%/min/−4%/min), and the decomposition was smoother.
The thermogravimetric analyses (TGA) and derivative thermogravimetry (DTG) results of the Fagus sylvatica, FS-activated carbon (FSAC), and Pinus sylvestris-activated carbon (PSAC) are exhibited in Figure 4.
The thermogravimetric analyses (TGA) results for Fagus sylvatica-activated carbon (FSAC) and Pinus sylvestris L.-activated carbon (PSAC) revealed different thermal decomposition performances. As seen in the TGA curves, FSAC exhibited a low weight loss up to 600 °C. After approximately 600 °C, the weight gain accelerated relatively. A similar trend is observed for PSAC, but a relatively higher amount of weight loss is observed when compared to FSAC. This trend could be attributed to the different chemical compositions of beech and pine wood; beech wood has a higher hemicellulose content compared to pine [4], which is characterized by a higher lignin content [4,43]. At 900 °C, the residual mass of PSAC was significantly lower than that of FSAC (approximately 60%), indicating a higher degree of carbonization and lower inorganic content. In contrast, FSAC exhibited a more stable weight loss and was observed to be more thermally stable with a higher final residue (~75%). The derivative thermogravimetric (DTG) curves support these observations; PSAC exhibited a distinct decomposition peak around 600 °C, while FAC showed a broader and less intense decomposition profile. These results indicate that PSAC undergoes a more abrupt and complete decomposition, while FSAC may leave a higher amount of residue in the form of char due to differences in raw material composition or pyrolysis efficiency. Additionally, it is believed that the residues remaining on the FSAC and PSAC samples during the cleaning process directly influence these results
3.4. Particle Size Analysis Results
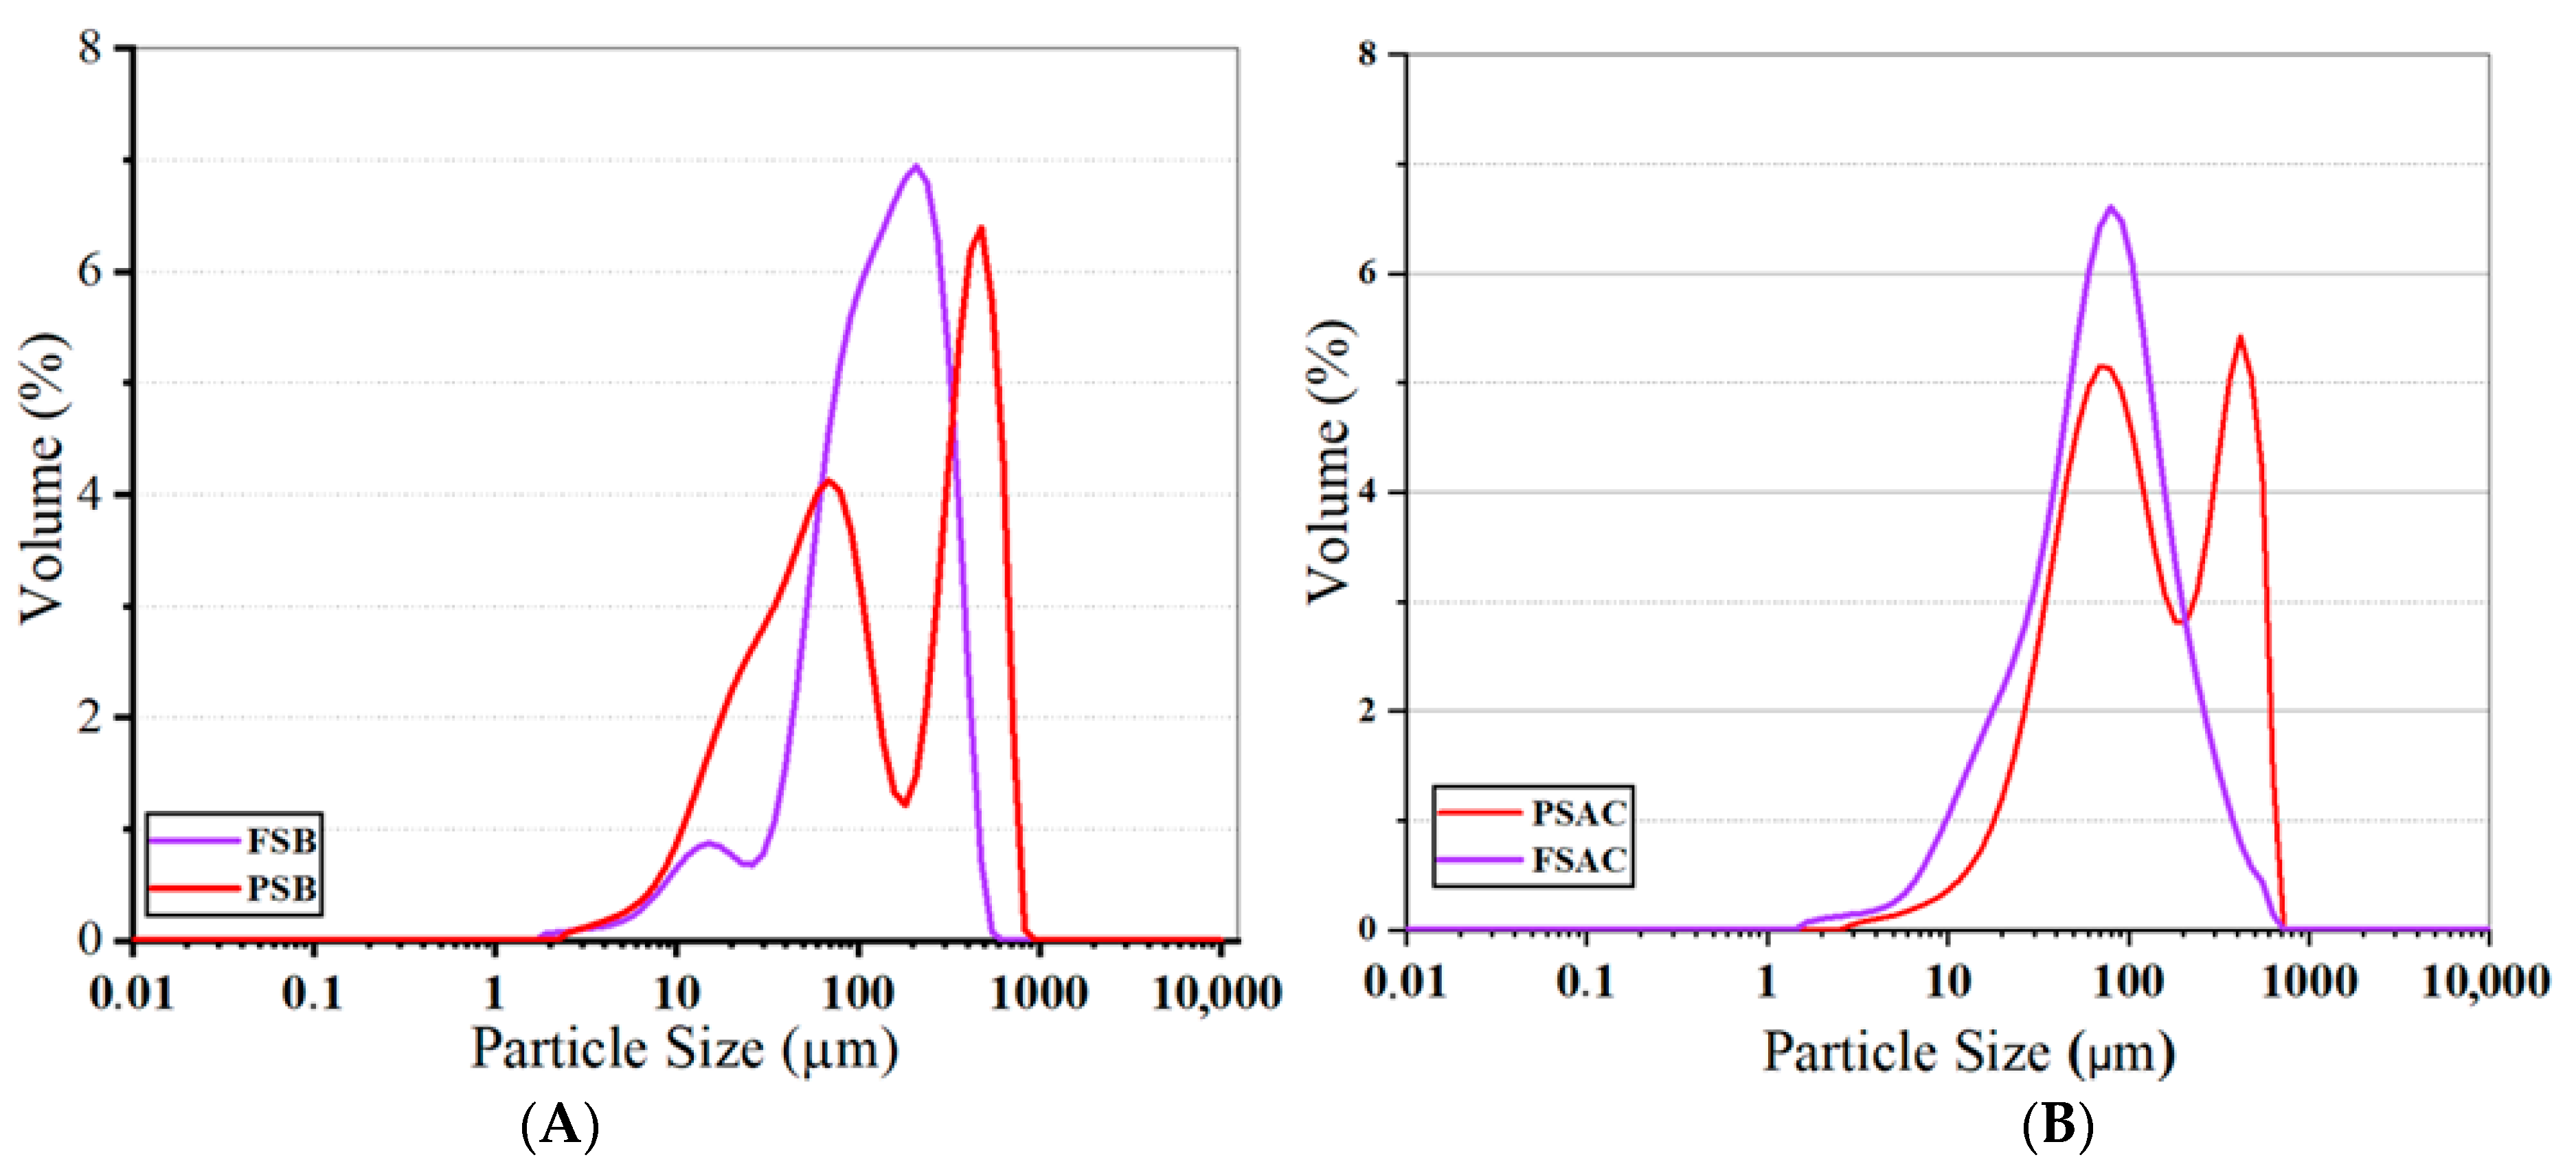
The graph of the activated and non-activated biochars and materials is given in Figure 5. The graph facilitates the comparison of the particle size distributions of Fagus sylvatica biochar (FSB) and Pinus sylvestris biochar (PSB), demonstrating that both biochar types exhibit distributions across different size ranges.
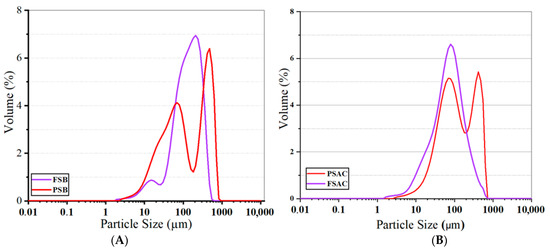
Figure 5.
Particle size of the activated (A) and non-activated biochar materials (B) of the two studied species (FSB: Fagus sylvatica biochar, PSB: Pinus sylvestris biochar, FSAC: Fagus sylvatica-activated carbon, PSAC: Pinus sylvestris L.-activated carbon).
The Fagus sylvatica (FS biochar) predominantly contains particles within the 100–700 µm range, with the primary peak, which has the highest volume percentage, observed around 200–300 µm. In other words, the FSB wood powders contain particles ranging from 2 to 700 µm. However, the dominant particle size distribution is considered the main reference, indicating that the average particle size for the FSB is approximately 140 µm. Additionally, a low-intensity distribution is observed in the 10–50 µm range, suggesting that smaller particles in this size range are present, though in relatively low amounts. On the other hand, Pinus sylvestris biochar (PSB) exhibits a distinct bimodal (dual-peaked) distribution (based on the direct visual interpretation of the particle size distribution), with the most dominant size ranges identified as 50–100 µm and 600–700 µm. This distinct bimodal (dual-peaked) distribution was observed in the particle size analysis and was evidenced by two clearly separated peaks in the distribution curve. This observation is consistent with previous studies on biomass-derived activated carbons and aligns with the authors’ experience in similar material systems, where heterogeneous pore formation or fragmentation often results in bimodal behavior, e.g., [39]. This distribution suggests that the PSB undergoes a more heterogeneous fragmentation mechanism and experiences different fragmentation dynamics during the production process. When analyzing the graphs, it is evident that the average particle size for the PSB falls within the 100–110 µm range. Although the FSB demonstrates a relatively homogeneous distribution across a broader size range, the PSB exhibits the formation of distinctly small and large particles.
As shown in Figure 5, the FSAC sample exhibited a monomodal distribution with a single pronounced peak centered around 100 mm, corresponding to a maximum volume percentage of approximately 6.5%. This narrow and symmetric profile indicates a high level of homogeneity in particle size. This is consistent with previous findings on pyrolyzed biomass materials, where controlled activation can lead to more homogeneous particle structures (e.g., [39]).
In contrast, the PSAC sample demonstrated a bimodal distribution, with two distinct peaks located at approximately 75 mm and 400 mm, each reaching volume percentages of around 5.2% and 4.8%, respectively. This broader distribution reflects a more heterogeneous particle population, suggesting the presence of both fine and coarse fractions within the same material. Interestingly, the bimodal nature of PSAC’s particle size distribution is supported by the elemental composition of activated carbons. Such bimodal or broadened particle size distribution curves have been reported in studies on biochar and activated carbon materials derived from lignocellulosic biomass under variable processing conditions [40], reinforcing our graphical interpretation. According to the elemental analysis results, PSAC contains a higher proportion of inorganic constituents compared to FSAC (please, check also the elemental composition discussion in the following in which the relative elemental content, including indicators of inorganic matter, is provided). The increased inorganic content is likely to affect dimensional stability during carbonization and activation processes, leading to irregular fragmentation and, consequently, a wider particle size distribution. Based on observations related to particle size distribution and morphological uniformity of the current study, it could be claimed that the uniformity observed in the FSAC sample may enhance and optimize its performance in applications that benefit from consistent particle morphology, such as adsorption, catalysis, and controlled filtration systems. On the other hand, the wider size range in PSAC could probably be advantageous in systems where a combination of different pore structures is desired, potentially improving mass transport or mechanical integration within composite matrices. However, further experimental studies are required to validate these application potentials.
These findings highlight the distinct textural characteristics of the two activated carbon types and suggest that their application potential may vary depending on the specific requirements of the end-use system.
3.5. SEM and Elemental Analysis
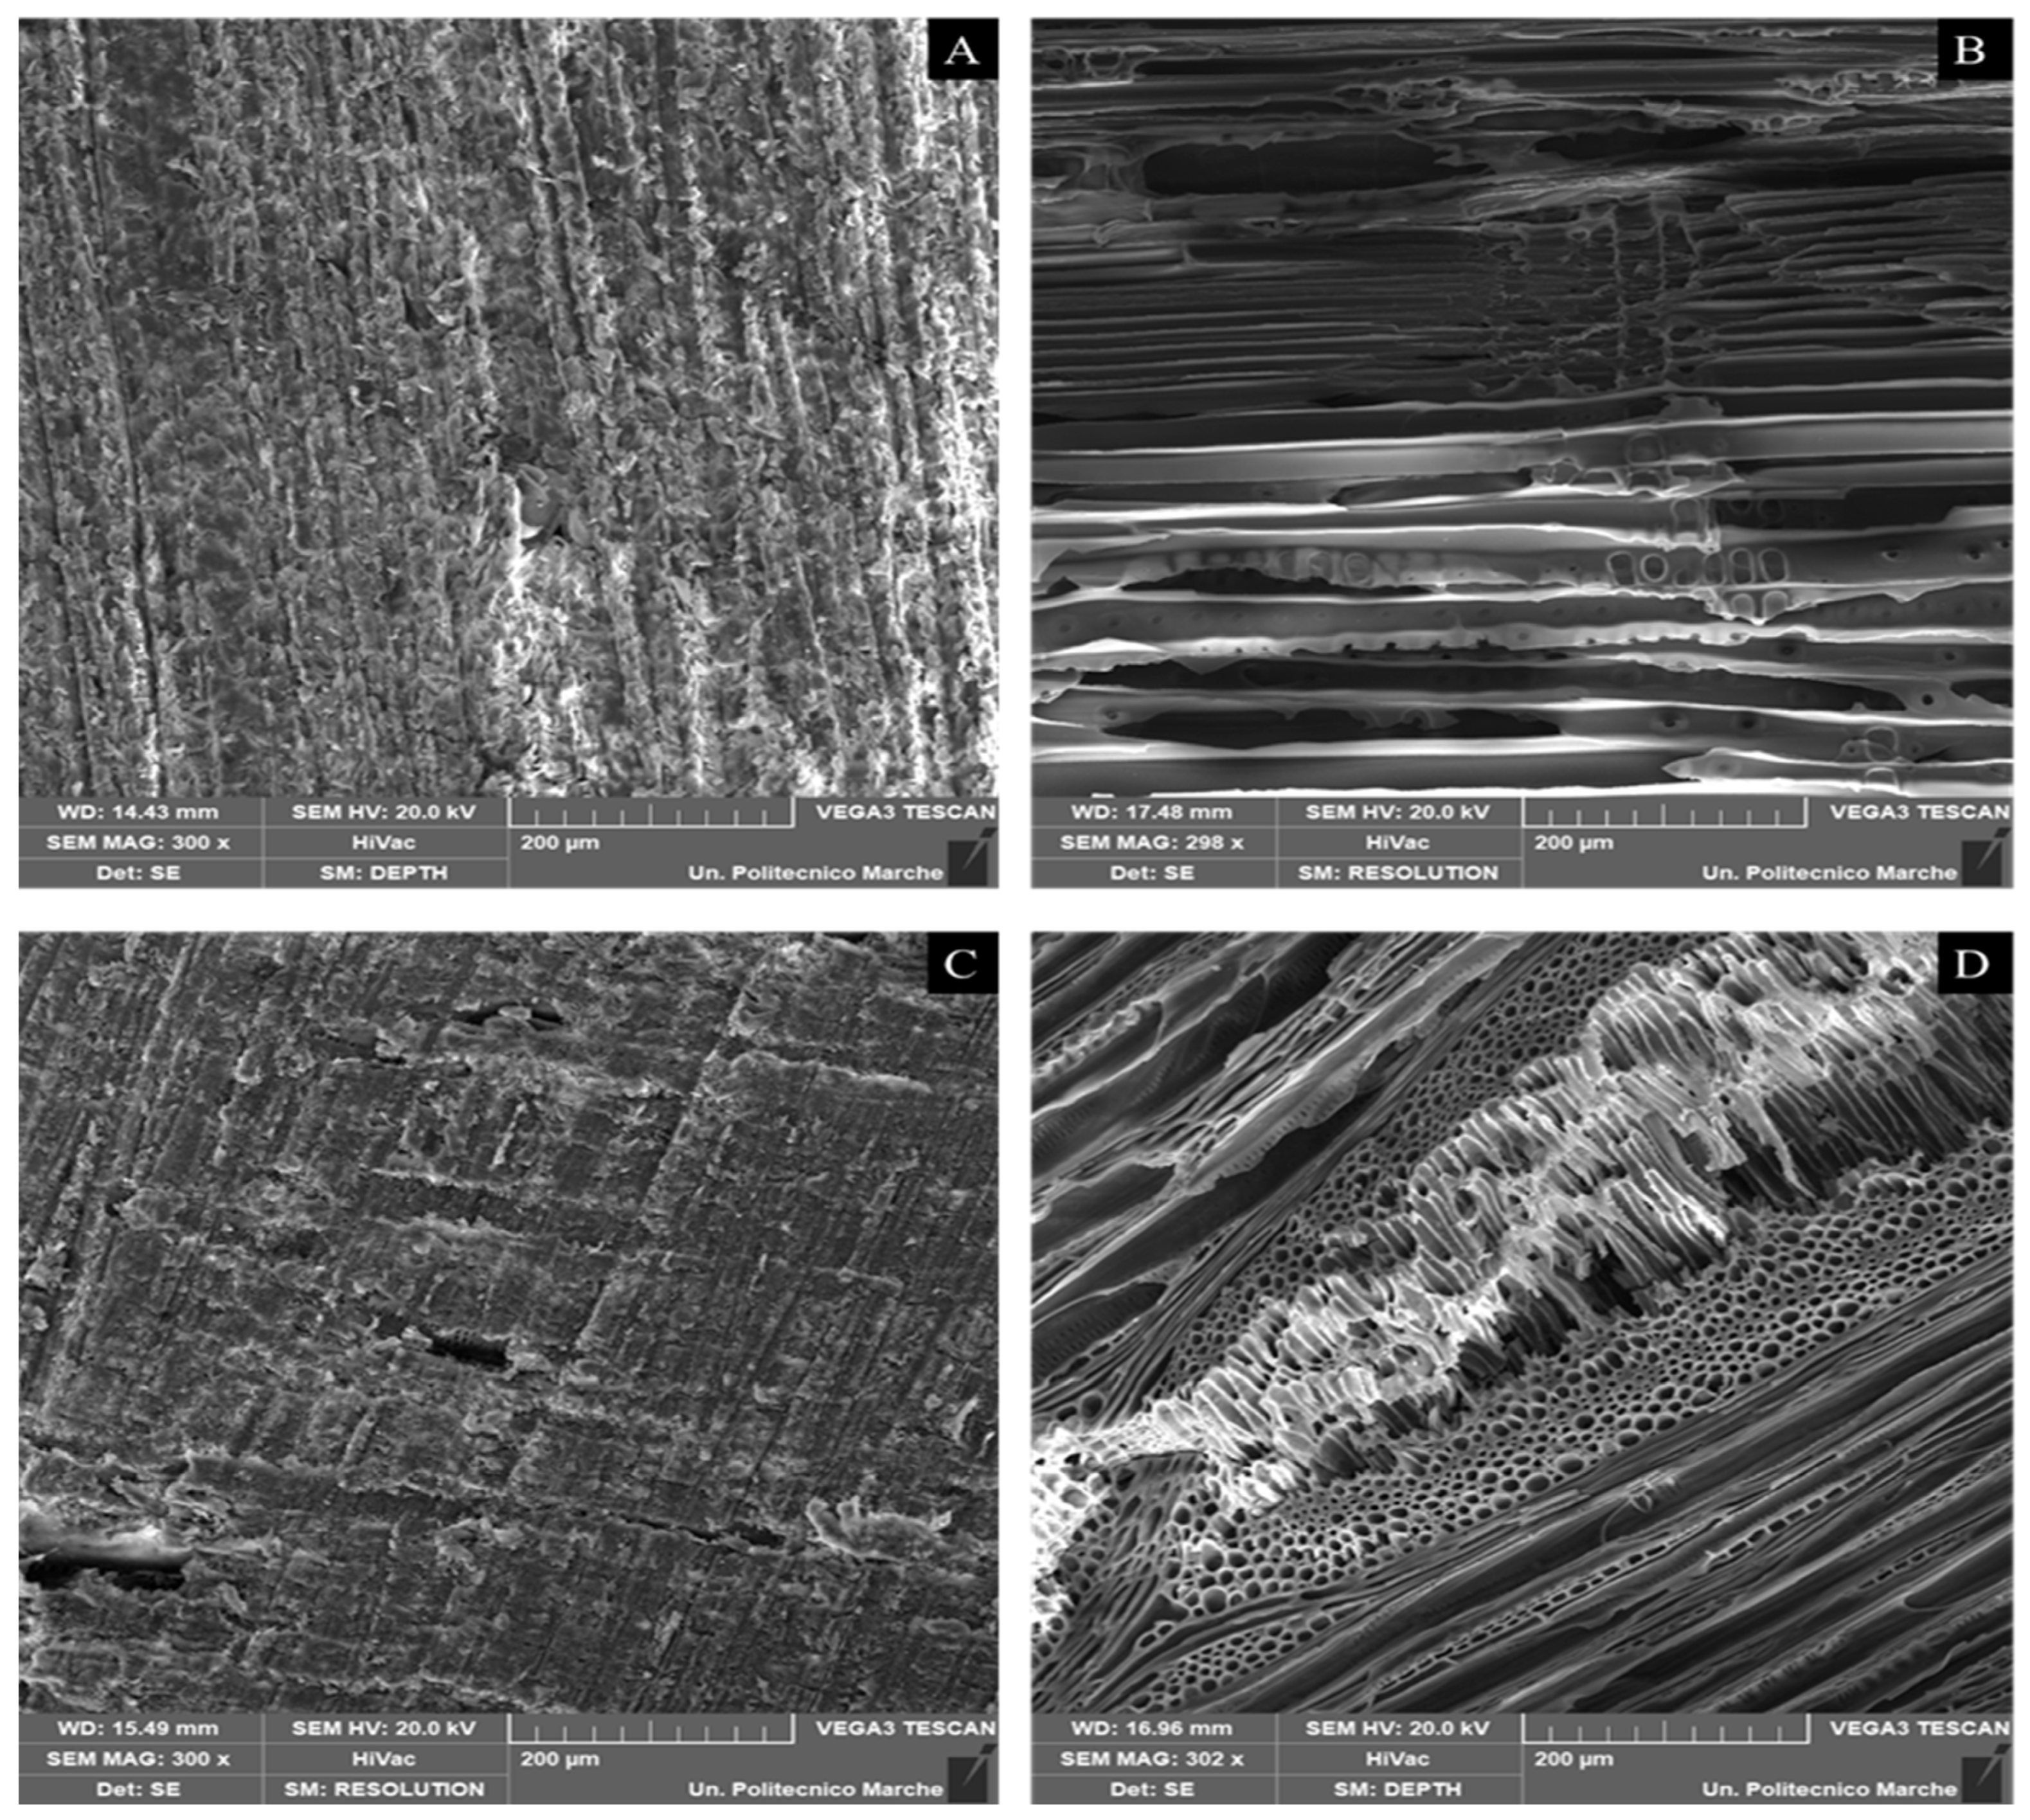
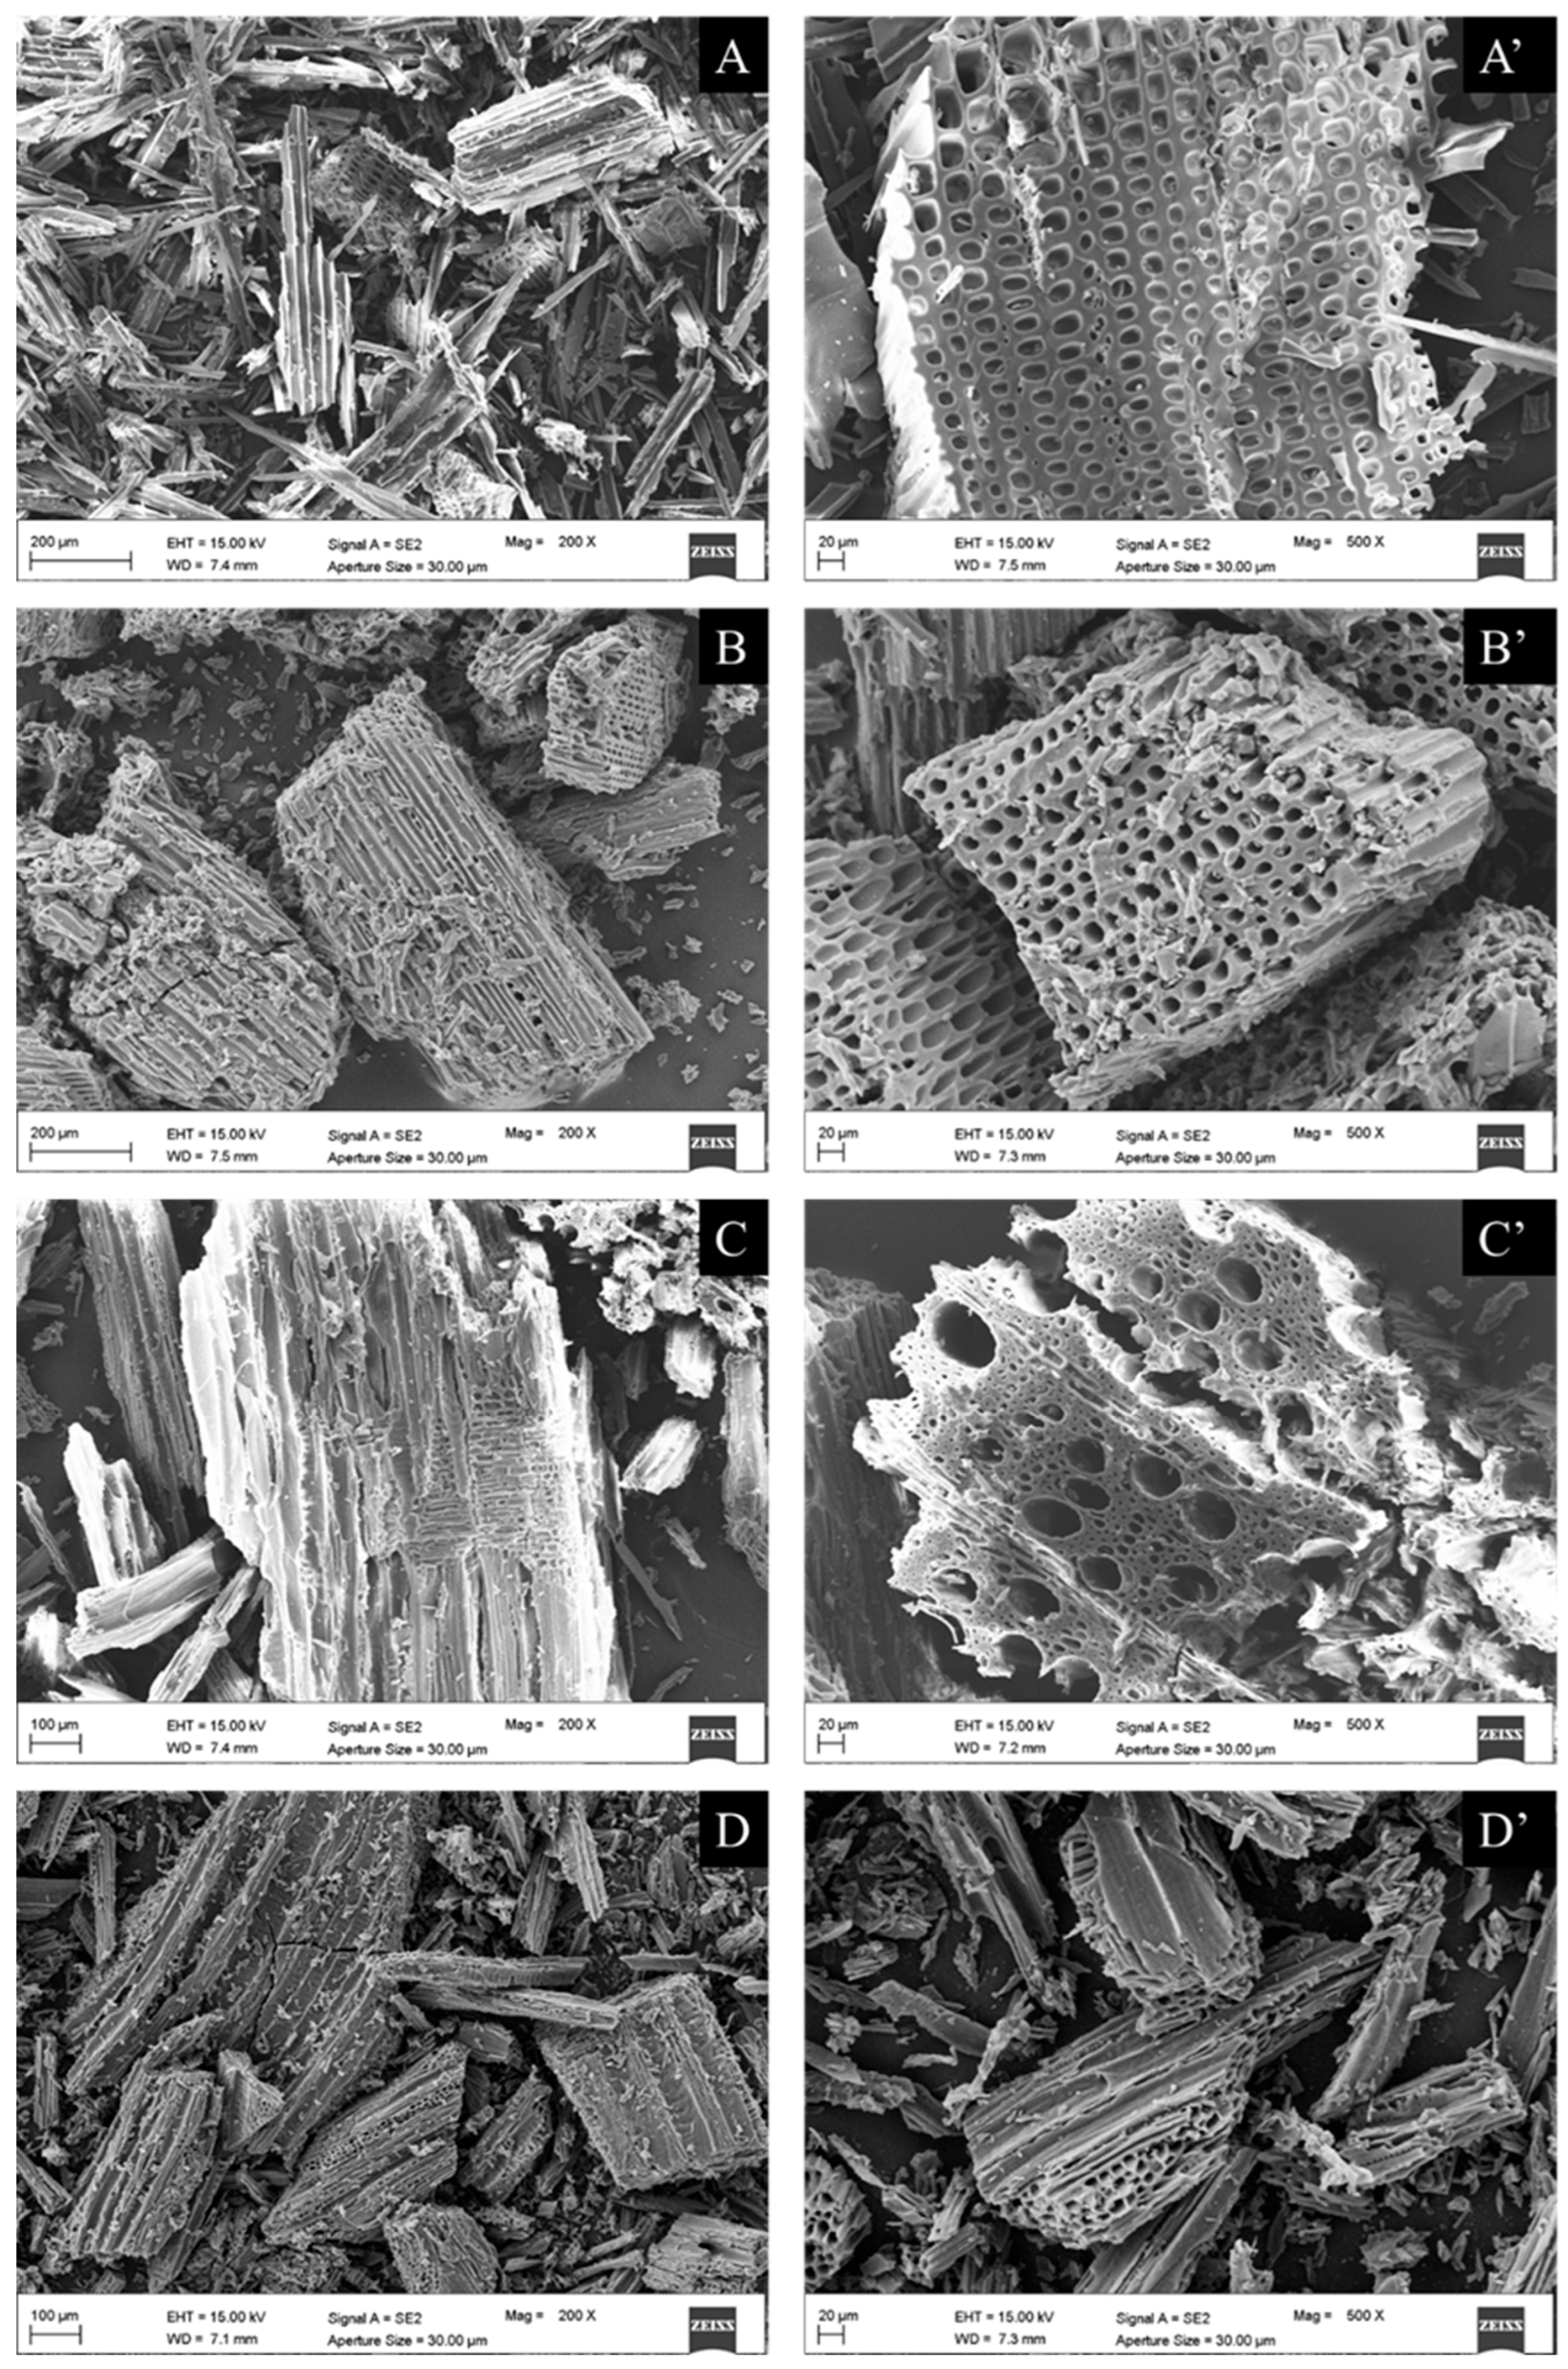
SEM images of unmilled samples (raw Pinus sylvestris, Pinus sylvestris biochar, raw Fagus sylvatica, and Fagus sylvatica biochar pieces) are depicted in Figure 6. Furthermore, the SEM micrographs of the milled Fagus sylvatica and Pinus sylvestris L. biochar and activated carbon samples are displayed in Figure 7. Both raw precursors (Pinus sylvestris and Fagus sylvatica) are characterized by rough surfaces without visible pores. Following the intense thermal treatment, the morphology of all the specimens has altered, resulting in a heterogeneous structure with a porous architecture that includes huge holes with a diameter of a few micrometers.
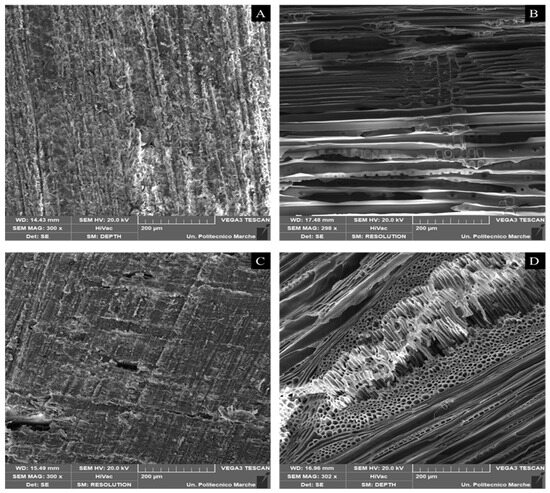
Figure 6.
SEM images of unmilled samples (pieces): Raw material (untreated) of Pinus sylvestris L. (A), Pinus sylvestris biochar (B), raw material (untreated) of Fagus sylvatica (C), and Fagus sylvatica biochar (D).
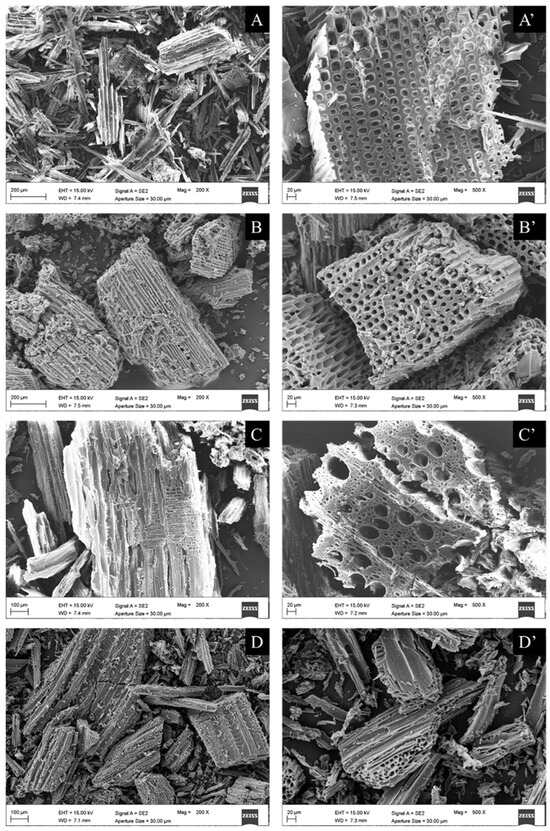
Figure 7.
SEM images of milled samples: Pinus sylvestris biochar (PSB: (A,A’) for the images of two different magnifications, 200 or 100 μm on the left, and 20 μm on the right with the apostrophe), Pinus sylvestris-activated carbon (PSAC: (B,B’)), Fagus sylvatica biochar (FSB: (C,C’)), and Fagus sylvatica-activated carbon (FSAC: (D,D’)).
3.6. Elemental Analysis Results
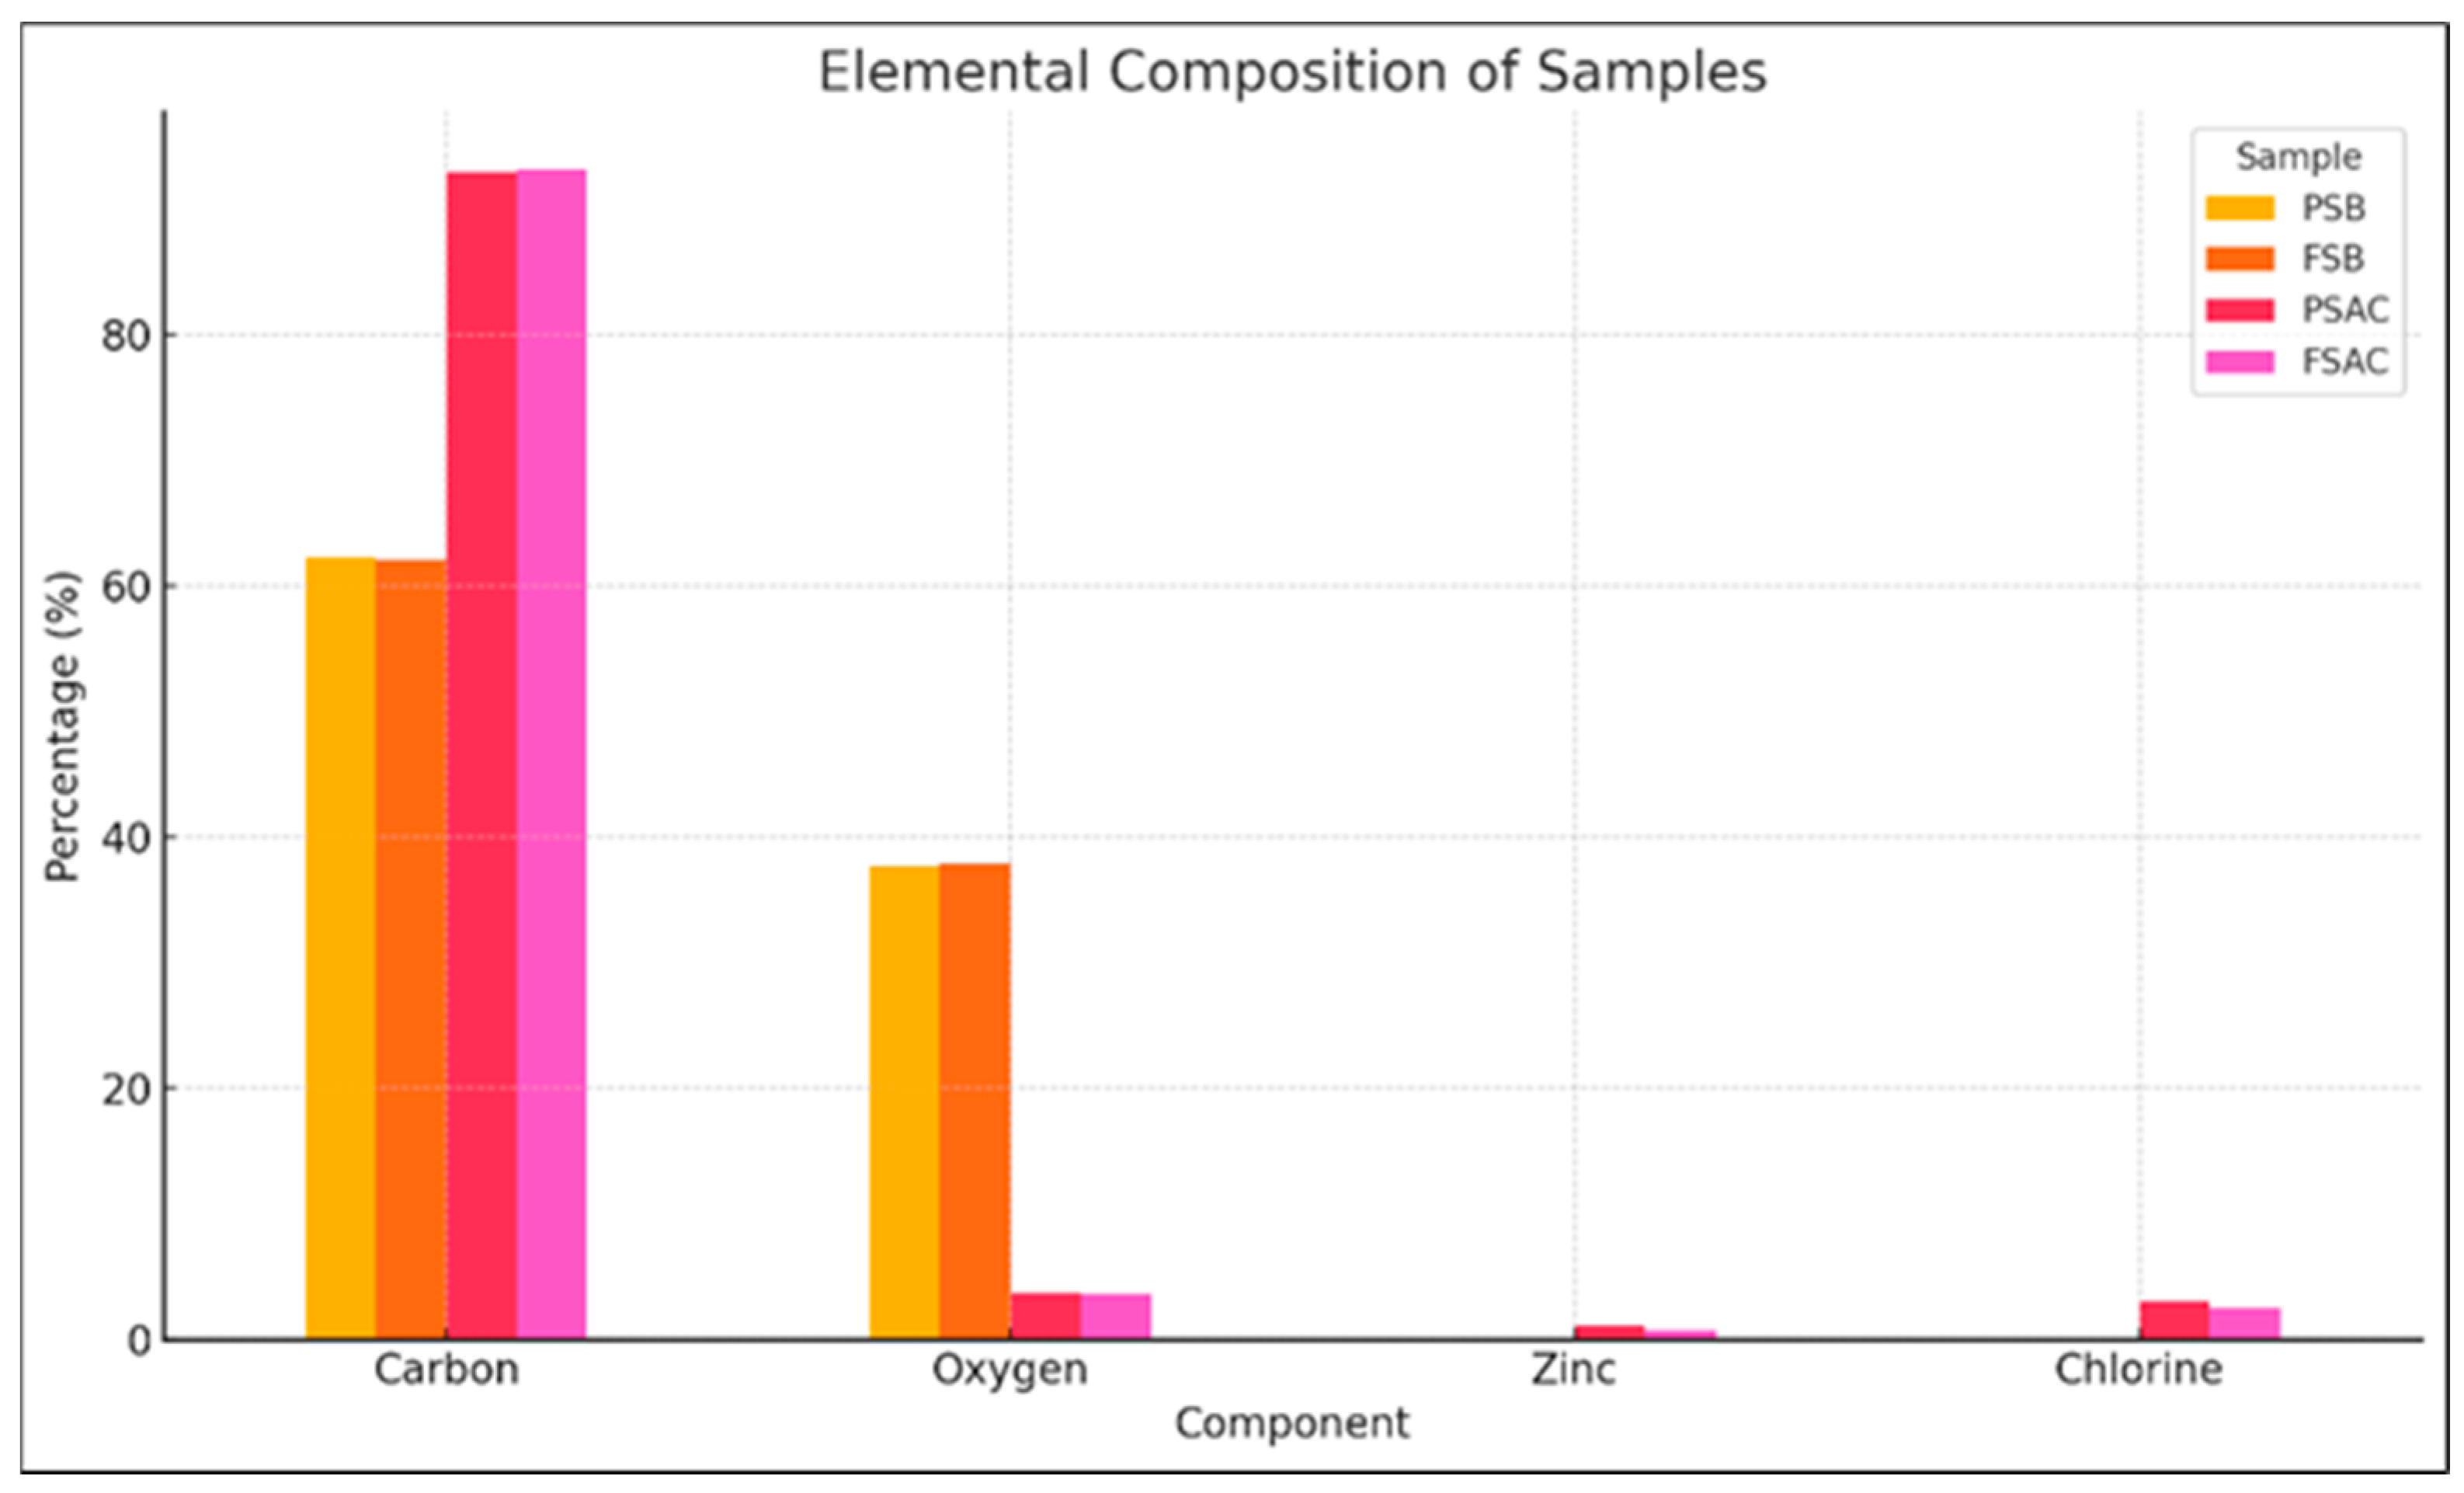
The Pinus sylvestris biochar (PSB), activated carbon (PSAC), Fagus sylvatica biochar (FSB), and activated carbon FSAC elemental analyses results are provided in Figure 8. As expected, carbon was the dominant element in all samples. Activated carbon samples, namely PSAC and FSAC, exhibited the highest carbon content, marking statistically significant differences from the remainder of the material categories’ values, exceeding 90%, indicating successful pyrolysis and chemical activation processes that enhanced carbon purity.
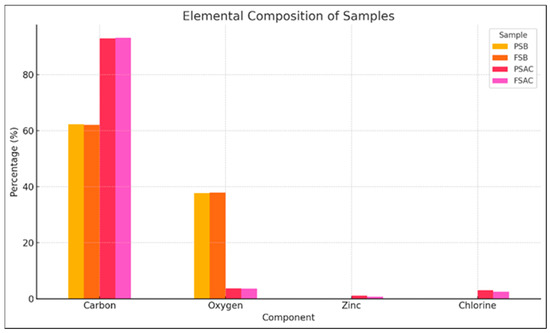
Figure 8.
Elemental analysis of Pinus sylvestris biochar (PSB), Pinus sylvestris L.-activated carbon (PSAC), Fagus sylvatica biochar (FSB), and Fagus sylvatica-activated carbon (FSAC).
In contrast, the biochar samples of the two species (Pinus sylvestris L. (PSB) and Fagus sylvatica (FSB)) showed lower carbon contents, approximately 70%–75%, and relatively higher oxygen contents (25%–30%), which is consistent with the presence of residual oxygen-containing functional groups in partially carbonized biomass. Upon activation, the oxygen levels dropped significantly (below 5%), confirming the effective removal of volatile and oxygenated compounds during the activation process.
Zinc (Zn) was detected only in the PSAC sample, possibly due to the inherent mineral content or process-related contamination. Chloride (Cl) was observed in the PSAC and FAC samples, which may be attributed to residuals from the chemical activation process involving hydrochloric acid. The oxygen levels were notably higher in the non-activated biochars (PSB and FSB), potentially due to the presence of oxygen-containing functional groups or adsorbed moisture. Elemental data were obtained via EDX analysis and represent the surface-level composition. These results support the enhanced structural carbonization and purity of activated carbons compared to their corresponding biochar precursors.
3.7. X-Ray Diffraction Analysis (XRD) Results
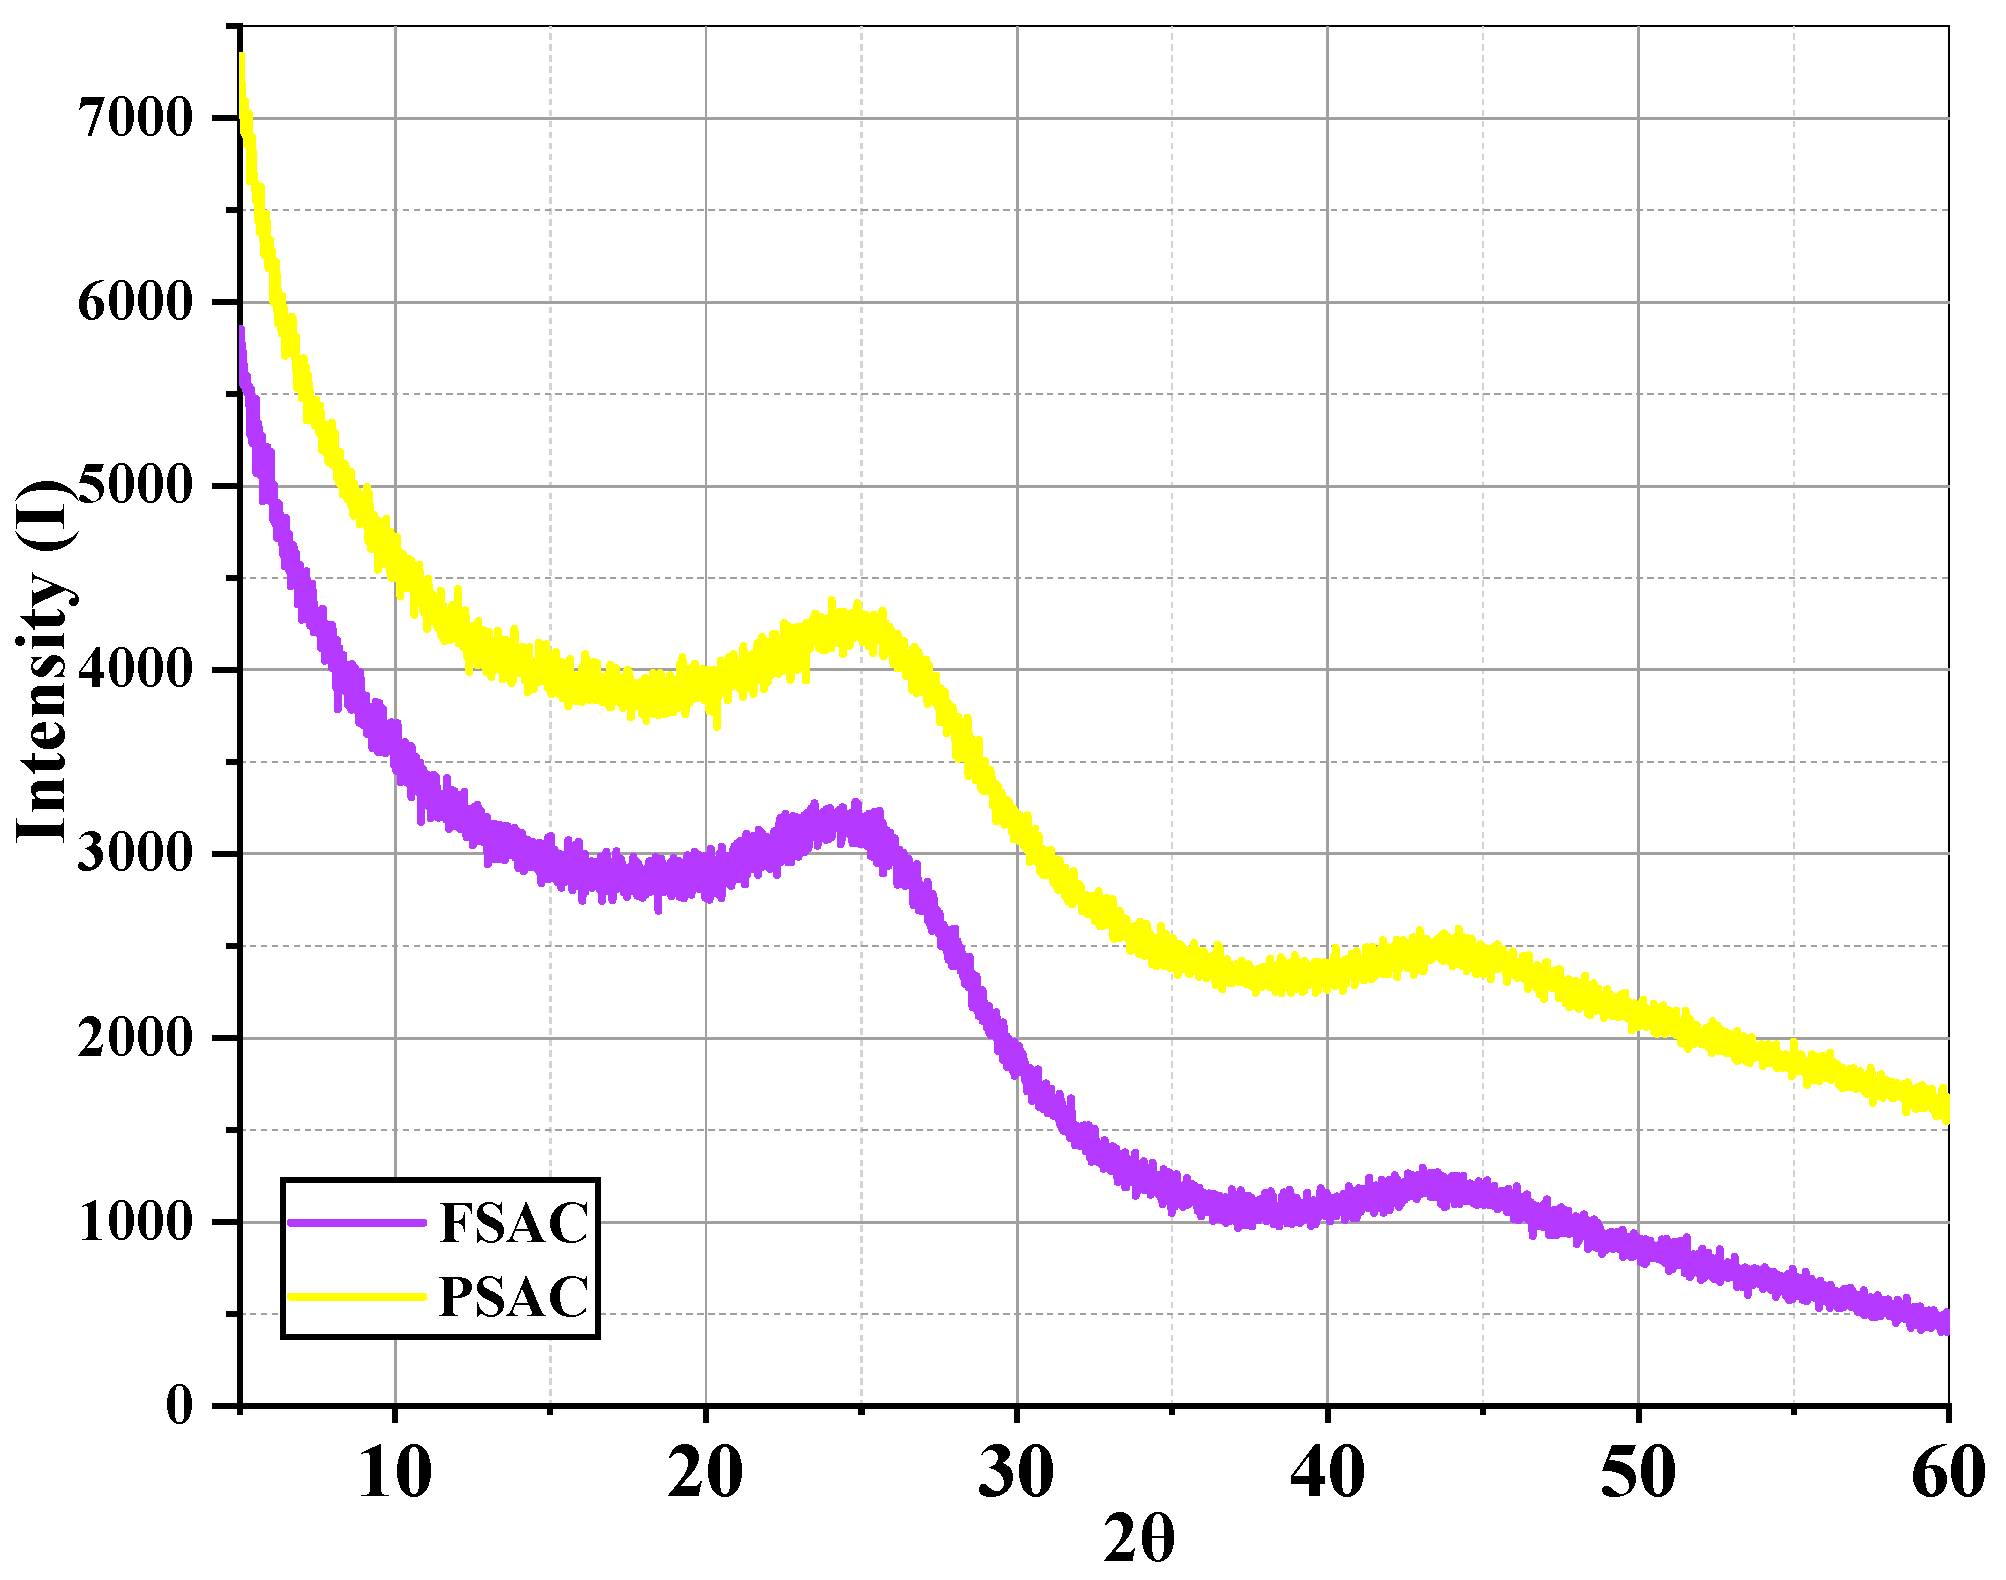
The Pinus sylvestris-activated carbon (PSAC) and Fagus sylvatica-activated carbon (FSAC) XRD analysis results are provided in Figure 9. The X-ray diffraction (XRD) patterns of FSAC and PSAC reveal that both samples exhibit predominantly amorphous structures. The broad and low-intensity diffraction peaks observed around 2θ ≈ 22° and 2θ ≈ 43° are characteristic of disordered carbon materials and are commonly associated with the (002) and (100) planes of turbostratic or partially graphitized carbon structures [44,45].
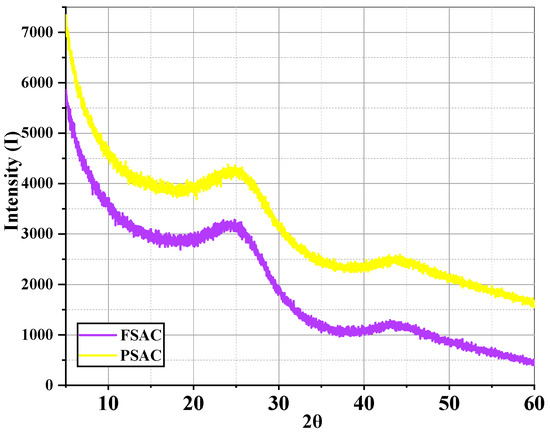
Figure 9.
X-ray diffraction analysis of Pinus sylvestris-activated carbon (PSAC) and Fagus sylvatica-activated carbon (FSAC).
The FSAC sample demonstrates lower overall diffraction intensity compared to the PSAC sample, suggesting a higher degree of disorder and potentially greater microporosity. This can be attributed to the degradation of graphitic domains during carbonization and activation processes, resulting in an amorphous carbon network. In contrast, the PSAC sample displays relatively higher intensity at the same diffraction regions, indicating the presence of a slightly more ordered structure or a greater content of microcrystalline carbon. The more pronounced (002) peak implies that PSAC retains more residual graphitic features than FSAC [46].
4. Discussion
The results of the current work, obtained through FTIR, TGA, and elemental analyses, show that the lignocellulosic biomasses derived from the wood species Fagus sylvatica and Pinus sylvestris L. may be successfully converted into biochars and activated carbons of unique and desired physicochemical characteristics, even in the case of employing a low-temperature carbonization/pyrolysis process. The FTIR chemical changes detected in these two wood species’ biochars are considered consistent with the acknowledged mechanisms of pyrolysis described by Chun et al. [33] and Jang et al. [34], especially the enhanced aromaticity and destruction of O–H/C=O groups.
There is an apparent reduction in the intensity of the aromatic C=C stretching bands in the FTIR spectra (e.g., from 1663 cm−1 to 1599 cm−1 for PSB, and from 1595 cm−1 to 1598 cm−1 for FSB), followed by chemical activation. However, apart from the intensity of the FTIR bands, there is also an overall chemical transformation associated with the carbonization and activation process, which highlights the materials’ increased aromaticity. Specifically, the shift and persistence of the C=C aromatic bands near ~1595–1600 cm−1, along with the reduction in oxygen-containing functional groups (which is evidenced by the decreased intensity or disappearance of peaks around 1700–1750 cm−1 and in the hydroxyl region around 3300 cm−1), suggest a structural condensation and enrichment in aromatic domains. This transformation is also consistent with previous reports describing the progressive development of graphitic or polyaromatic structures during thermal treatment and chemical activation. Therefore, although the FTIR intensity of aromatic C=C bands may be reduced due to increased structural ordering or lower dipole activity, the spectral features, overall, reveal an increase in the aromatic character and thermal stability of the carbonaceous material.
Because of its lignin-rich composition, pine-derived biochar (PSB) demonstrated improved thermal stability (compared to that of the Fagus-derived biochar material, FSB), while the FTIR spectra verified the carbonization process by identifying reduced hydroxyl, aliphatic, and carbonyl groups and enriched aromatic structures.
In addition, the TGA studies demonstrated that biochar reinforcement (induced during the carbonization process) decreased the mass loss coming from thermal degradation by approximately 50% in both the FSB and PSB as compared to raw wood samples, with the PSB exhibiting a more stable and wide decomposition profile. As shown by the SEM and elemental analyses results, its bimodal particle distribution and inorganic content account for its higher residual mass in the form of char (43% in the PSB vs. 35% in the FSB), as opposed to Wang and Wang [43], who observed less variation across hardwood and softwood biochar types. Kamperidou [4] emphasized pine’s naturally higher lignin composition, which suggests that this contrast may be caused by variations in the lignin concentration [47]. In contrast to da Silva et al. [37], the current study biochars’ C–O bond persistence (1204–1006 cm−1) suggests less thorough cellulose decomposition given the specific pyrolysis conditions applied. Except for the SEM images of the activated carbons, a series of adsorption experiments has recently been conducted, including VOC adsorption and the photocatalytic degradation of methylene blue. These experiments clearly demonstrated effective adsorption. The adsorption studies are intended to be presented in a separate publication, in which a follow-up study will be planned that incorporates advanced characterization techniques such as BET.
The carbon purity of both FSAC and PSAC was improved (>90%), and the oxygen content was decreased (<5%) because of the chemical activation. FSAC’s uniform particle size distribution, which is centered at 100 µm, makes it perfect for adsorption applications, while PSAC’s bimodal distribution (75 µm and 400 µm) might help with composite integration. PSAC has significantly more inorganic residues (40%) than FSAC (10%), which may indicate variations in raw material composition or activation effectiveness. These results highlight the significance of choosing the right feedstock and pyrolysis conditions to customize the properties of biochar and activated carbon for particular uses, including catalysis or filtering, among others. Moreover, according to the XRD results, even though both materials are largely amorphous, PSAC exhibits a relatively higher degree of structural order. These differences may stem from the nature of the biomass precursor, carbonization parameters, or the extent of activation, all of which influence the microstructural development of the resulting carbon material. More specifically, in conjunction, the findings of the current work imply that the pine-derived materials might be especially useful for industrial processes that demand thermal stability (like high-temperature filtration), while the products derived from beech exhibit potential for precision uses like energy storage or pharmaceutical-grade filtration. In the future, a detailed experimental comparison, including energy input analysis and application-based evaluations, has already been planned by our team as part of our future research activities. Due to the growing requirement for carbon materials and sustainable adsorbents, these biochars’ specialized qualities may create new markets for energy storage, environmental remediation, and composite materials. Strategic alliances with the forestry sector could improve feedstock supply chains even more, establishing biochar activation as a profitable upcycling method for biomass waste. The prepared biochars could be positioned as competitive, environmentally friendly solutions in the industrial, environmental, and energy sectors if future scale-up and lifecycle evaluations confirm their economic viability.
5. Conclusions
This work shows that low-temperature pyrolysis may effectively transform waste wood from Fagus sylvatica (beech) and Pinus sylvestris (pine) into high-value biochars and activated carbons, providing significant environmental and financial advantages. The efficient conversion of raw biomass into carbon-rich structures with enhanced aromaticity and thermal stability was validated by spectroscopic, thermogravimetric, morphological, and elemental investigations. Because of the differences in lignin and cellulose contents, pine has a higher activated carbon yield (64.170%) than beech (53.411%), indicating a superior mass efficiency for carbon production. According to the particle size analysis, pine-activated carbon (PSAC) displayed a clear bimodal distribution, while beech-activated carbon (FSAC) displayed a monomodal distribution, suggesting great homogeneity. The formation of porous structures after pyrolysis was validated by SEM imaging, and the elemental analyses revealed that activated carbons attained >90% carbon purity, with trace elements (Zn, Cl) and leftover oxygen being connected to activation processes. Both activated carbons’ amorphous nature was further confirmed by the XRD data, which showed that PSAC exhibited somewhat more organized microcrystalline domains than FSAC. Elemental analysis, which revealed a higher inorganic content in PSAC and probably contributed to dimensional instability after activation, confirmed this heterogeneity. The results reveal that while PSAC’s heterogeneous structure may be useful for multifunctional systems requiring various pore topologies, FSAC’s uniform morphology may be advantageous in filtration and adsorption applications. This study’s overall findings demonstrate the significant potential of chemically activated biochar made from forest residual materials for several specialized, valuable uses in material and environmental science.
Author Contributions
Conceptualization, B.Y. and V.K.; methodology, B.Y., H.F., V.K., S.B.A., T.K. and T.V.; software, B.Y., H.F. and S.B.A.; validation, B.Y., T.K. and S.B.A.; formal analysis, B.Y. and H.F.; investigation, B.Y., H.F., S.B.A. and T.K.; resources, V.K. and B.Y.; data curation, B.Y. and H.F.; writing—original draft preparation, V.K. and B.Y.; writing—review and editing, V.K. and B.Y.; visualization, B.Y.; project administration, B.Y. All authors have read and agreed to the published version of the manuscript.
Funding
This research received no external funding.
Institutional Review Board Statement
Not applicable.
Informed Consent Statement
Not applicable.
Data Availability Statement
Available upon request to the corresponding author.
Acknowledgments
The authors express their gratitude to the researchers Natalia Czerwinska and Chiara Giosue for their precious assistance in the measurements implementation, as well as Ioannis Barboutis for his assistance with the mechanical processing and wood specimens’ preparation.
Conflicts of Interest
The authors declare no conflicts of interest.
Appendix A

Table A1.
Structural characterization of beech wood (Fagus sylvatica—FS) and pine (Pinus sylvestris L.—PS) samples before and after thermal pyrolysis treatment (FSB and PSB), created by the authors based on the literature [38], etc.
Table A1.
Structural characterization of beech wood (Fagus sylvatica—FS) and pine (Pinus sylvestris L.—PS) samples before and after thermal pyrolysis treatment (FSB and PSB), created by the authors based on the literature [38], etc.
| Characteristic Bands | Fagus sylvatica (FS) | Fagus sylvatica Biochar (FSB) | Pinus sylvestris L. (PS) | Pinus sylvestris L. Biochar (PSB) |
|---|---|---|---|---|
| O–H bands | Strong and broad band at 3352 cm−1, indicating abundant hydroxyl groups from cellulose, hemicelluloses, and lignin. | Weaker and less defined band at 3329 cm−1 due to decomposition of hydroxyl groups during pyrolysis. | Broad and strong band at 3328 cm−1, indicating abundant hydroxyl groups of lignocellulosic components. | Weaker band at 3351 cm−1, reflecting loss of hydroxyl functionalities during pyrolysis. |
| Aliphatic C–H bands | Noticeable band at 2900 cm−1, attributed to methyl and methylene groups. | Weakened band at 2899 cm−1, indicating breakdown of aliphatic structures. | Clear peak at 2879 cm−1, attributed to –CH3 and –CH2– groups. | Reduced intensity at 2929 cm−1, indicating decomposition of aliphatic chains. |
| C=O (Carbonyl) bands | Distinct band at 1729 cm−1, associated with ester and ketone groups in hemicelluloses and lignin. | Reduced intensity at 1709 cm−1, suggesting loss of carbonyl functionalities. | Prominent peak at 1727 cm−1, related to esters and ketones in hemicellulose | Lower intensity at 1703 cm−1 due to breakdown of carbonyl groups. |
| Aromatic C=C bands | Moderate peak at 1595 cm−1, corresponding to lignin-derived aromatic structures. | Enhanced peak at 1598 cm−1, reflecting increased aromaticity after pyrolysis. | Peak at 1663 cm−1, corresponding to aromatic structures (mainly from lignin). | More pronounced peak at 1599 cm−1, indicating increased aromatic condensation. |
| C–O and carbohydrate bands | Strong band at 1240 cm−1, related to C–O bonds in polysaccharides. | Broader bands at 1204, 1058, and 1006 cm−1, indicating structural rearrangement and presence of residual oxygenated groups. | Sharp band at 1029 cm−1, associated with C–O stretching in polysaccharides. | Multiple bands at 1197 cm−1 and nearby regions, showing oxygenated residue and structural rearrangements. |
References
- Harris, K.; Gaskin, J.; Cabrera, M.; Miller, W.; Das, K.C. Characterization and Mineralization Rates of Low Temperature Peanut Hull and Pine Chip Biochars. Agronomy 2013, 3, 294–312. [Google Scholar] [CrossRef]
- Enders, A.; Hanley, K.; Whitman, T.; Joseph, S.; Lehmann, J. Characterization of biochars to evaluate recalcitrance and agronomic performance. Bioresour. Technol. 2012, 114, 644–653. [Google Scholar] [CrossRef]
- Yargicoglu, E.N.; Sadasivam, B.Y.; Reddy, K.R.; Spokas, K. Physical and chemical characterization of waste wood derived biochars. Waste Manag. 2015, 36, 256–268. [Google Scholar] [CrossRef] [PubMed]
- Kamperidou, V. Chemical and Structural Characterization of Poplar and Black Pine Wood exposed to Short Thermal Modification. Drv. Ind. 2021, 72, 155–167. [Google Scholar] [CrossRef]
- Czerwinska, N.; Giosuè, C.; Matos, I.; Sabbatini, S.; Ruello, M.L.; Bernardo, M. Development of activated carbons derived from wastes: Coffee grounds and olive stones as potential porous materials for air depollution. Sci. Total Environ. 2024, 914, 169898. [Google Scholar] [CrossRef]
- Bacskai, I.; Madar, V.; Fogarassy, C.; Toth, L. Modeling of Some Operating Parameters Required for the Development of Fixed Bed Small Scale Pyrolysis Plant. Resources 2019, 8, 79. [Google Scholar] [CrossRef]
- Ewunetu, T.; Shinjiro, S.; Solomon, A.; Eshetu, B.; Asmamaw, A.; Berhanu, B. Improving traditional charcoal production system for sustainable charcoal income and environmental benefits in highlands of Ethiopia. Heliyon 2023, 9, e19787. [Google Scholar] [CrossRef]
- Getahun, Z.; Abewaa, M.; Mengistu, A.; Adino, E.; Kontu, K.; Angassa, K.; Tiruneh, A.; Abdu, J. Towards sustainable charcoal production: Designing an economical brick kiln with enhanced emission control technology. Heliyon 2024, 10, e27797. [Google Scholar] [CrossRef]
- Gosling, W.D.; Cornelissen, H.L.; McMichael, C.N.H. Reconstructing past fire temperatures from ancient charcoal material. Palaeogeography, Palaeoclimatology. Palaeoecology 2019, 520, 128–137. [Google Scholar] [CrossRef]
- Kunusa, W.R.; Iyabu, H.; Abdullah, R. FTIR, SEM and XRD analysis of activated carbon from sago wastes using acid modification. J. Phys. Conf. Ser. 2021, 1968, 012014. [Google Scholar] [CrossRef]
- Zellner, T.; Prasa, D.; Färber, E.; Hoffmann-Walbeck, P.; Genser, D.; Eyer, F. The Use of Activated Charcoal to Treat Intoxications. Dtsch. Arztebl. Int. 2019, 116, 311–317. [Google Scholar] [CrossRef] [PubMed]
- Chen, Z.; Ye, S.; Yang, Y.; Li, Z. A review on charred traditional chinese herbs: Carbonization to yield a haemostatic effect. Pharm. Biol. 2019, 57, 498–506. [Google Scholar] [CrossRef] [PubMed]
- Barbosa, D.A.; Barbosa, E.G.G.; Molinari, M.D.C.; Pagliarini, R.F.; Marin, S.R.R.; Marin, D.R.; Mertz-Henning, L.M.; Nepomuceno, A.L. Activated charcoal added to tissue culture media increases genotype-dependent biomass production in soybean. Agron. Sci. Biotechnol. 2022, 8, 1–11. [Google Scholar] [CrossRef]
- ElSharkawy, M.; Javed, W. Study of indoor air quality level in various restaurants in saudi arabia. Environ. Prog. Sustain. Energy 2018, 37, 1713–1721. [Google Scholar] [CrossRef]
- Prastiwi, D.A.; Sumawinata, B.; Iskandar, P.; Pari, G. The utilization of activated carbon as micronutrients carrier in slow release fertilizer formulation. In Proceedings of the International Conference on Forest Products, Bogor, Indonesia, 2 November 2018; 359, p. 012009. [Google Scholar] [CrossRef]
- Chaisarn, P.; Satapanajaru, T.; Mahujchariyawong, J.; Prueksasit, T. Adsorption of VOCs by Activated Charcoal Produced from Saw Dust in Para-rubber Wood Furniture Manufacturing. Thammasat Int. J. Sci. Technol. 2008, 13, 92–99. [Google Scholar]
- Yan, Y.; Mao, Z.; Luo, J.; Du, R.; Lin, J. Simultaneous removal of SO2, NOx and Hg0 by O3 oxidation integrated with bio-charcoal adsorption. J. Fuel Chem. Technol. 2020, 48, 1452–1460. [Google Scholar] [CrossRef]
- Yadav, S.; Asthana, A.; Singh, A.K.; Chakraborty, R.; Vidya, S.S.; Susan, A.B.H.; Carabineiro, S.A.C. Adsorption of cationic dyes, drugs and metal from aqueous solutions using a polymer composite of magnetic/β-cyclodextrin/activated charcoal/Na alginate: Isotherm, kinetics and regeneration studies. J. Hazard. Mater. 2021, 409, 124840. [Google Scholar] [CrossRef]
- Miriyala, N.; Ouyang, D.; Perrie, Y.; Lowry, D.; Kirby, D.J. Activated carbon as a carrier for amorphous drug delivery: Effect of drug characteristics and carrier wettability. Eur. J. Pharm. Biopharm. 2017, 115, 197–205. [Google Scholar] [CrossRef]
- Ahmad, M.; Upamali Rajapaksha, A.; Eun Lim, J.; Zhang, M.; Bolan, N.; Mohan, D.; Vithanage, M.; Soo Lee, S.; Sik Ok, Y. Biochar as a sorbent for contaminant management in soil and water: A review. Chemosphere 2014, 99, 19–33. [Google Scholar] [CrossRef]
- Curcio, Ι.; Gigli, R.; Mormile, F.; Mormile, C. A comprehensive review on biochar, with a particular focus on nano properties and applications. Nano Trends 2025, 10, 100117. [Google Scholar] [CrossRef]
- Kwon, G.; Bhatnagar, A.; Wang, H.; Kwon, E.; Song, H. A review of recent advancements in utilization of biomass and industrial wastes into engineered biochar. J. Hazard. Mater. 2020, 400, 123242. [Google Scholar] [CrossRef] [PubMed]
- Weber, K.; Quicker, P. Properties of biochar. Fuel 2018, 217, 240–261. [Google Scholar] [CrossRef]
- Yang, X.; Wan, Y.; Zheng, Y.; Li, C.; Gao, B. Characterization and mechanisms of H2O2 activation by iron-containing biochar for catalytic degradation of organic contaminants. Chem. Eng. J. 2020, 384, 123239. [Google Scholar] [CrossRef]
- ISO 13061-1:2014; Physical and Mechanical Properties of Wood—Test Methods for Small Clear Wood Specimens. Part 1: Determination of Moisture Content for Physical and Mechanical Tests. ISO: Geneva, Switzerland, 2014.
- ISO 13061-2:2014; Physical and Mechanical Properties of Wood—Test Methods for Small Clear Wood Specimens. Part 2: Determination of Density for Physical and Mechanical Tests. ISO: Geneva, Switzerland, 2014.
- Bastistella, L.; Rousset, P.; Aviz, A.; Caldeira-Pires, A.; Humbert, G.; Nogueira, M. Statistical Modelling of Temperature and Moisture Uptake of Biochars Exposed to Selected Relative Humidity of Air. Bioengineering 2018, 5, 13. [Google Scholar] [CrossRef]
- Hekimoğlu, G.; Tyagi, V.V.; Sarı, A.; Sharma, R.K.; Kar, T.; Al-Ahmed, A.; Keleş, S.; Kaygusuz, K.; Al-Sulaiman, F.A.; Saleh, T.A. Walnut shell derived bio-carbon/methyl palmitate as novel composite phase change material with enhanced thermal energy storage properties. J. Energy Storage 2021, 35, 102288. [Google Scholar] [CrossRef]
- Kar, T.; Keleş, S. Characterisation of bio-oil and its sub-fractions from catalytic fast pyrolysis of biomass mixture. Waste Manag. Res. 2019, 37, 674–685. [Google Scholar] [CrossRef]
- Ioannidou, O.; Zabaniotou, A. Agricultural residues as precursors for activated carbon production—A review. Renew. Sustain. Energy Rev. 2007, 11, 1966–2005. [Google Scholar] [CrossRef]
- Dias, J.M.; Alvim-Ferraz, M.C.; Almeida, M.F.; Rivera-Utrilla, J.; Sánchez-Polo, M. Waste materials for activated carbon preparation and its use in aqueous-phase treatment: A review. J. Environ. Manag. 2007, 85, 833–846. [Google Scholar] [CrossRef]
- Dang, Y.; Liu, Y.; Xiang, P.; Tan, Z.; Tian, Z.; Greiner, M.; Heumann, S.; Ding, Y.; Qiao, Z. Carbon Surface Chemistry: Benchmark for the Analysis of Oxygen Functionalities on Carbon Materials. Adv. Mater. 2025, 37, 2418239. [Google Scholar] [CrossRef]
- Chun, Y.; Sheng, G.; Chiou, C.T.; Xing, B. Compositions and sorptive properties of crop residue-derived chars. Environ. Sci. Technol. 2004, 38, 4649–4655. [Google Scholar] [CrossRef]
- Jang, H.M.; Yoo, S.; Choi, Y.K.; Park, S.; Kan, E. Adsorption isotherm, kinetic modeling and mechanism of tetracycline on Pinus taeda-derived activated biochar. Bioresour. Technol. 2018, 259, 24–31. [Google Scholar] [CrossRef]
- Fan, M.; Dai, D.; Huang, B. Fourier transform infrared spectroscopy for natural fibres. Fourier Transform. Mater. Anal. 2012, 3, 45–68. [Google Scholar]
- Zhuang, J.; Li, M.; Pu, Y.; Ragauskas, A.J.; Yoo, C.G. Observation of potential contaminants in processed biomass using fourier transform infrared spectroscopy. Appl. Sci. 2020, 10, 4345. [Google Scholar] [CrossRef]
- da Silva, M.A.; Dias, D.D.S.; Capela, J.M.V.; Fertonani, I.A.P.; Ribeiro, C.A. Biochar from Pine cone (strobilus of Pinus elliottii) by torrefaction process: Evaluation of the adsorptive and energy capacity. J. Therm. Anal. Calorim. 2023, 148, 12321–12333. [Google Scholar] [CrossRef]
- Janu, R.; Mrlik, V.; Ribitsch, D.; Hofman, J.; Sedláček, P.; Bielská, L.; Soja, G. Biochar surface functional groups as affected by biomass feedstock, biochar composition and pyrolysis temperature. Carbon Resour. Convers. 2021, 4, 36–46. [Google Scholar] [CrossRef]
- Ronsse, F.; Van Hecke, S.; Dickinson, D.; Prins, W. Production and characterization of slow pyrolysis biochar: Influence of feedstock type and pyrolysis conditions. GCB Bioenergy 2013, 5, 104–115. [Google Scholar] [CrossRef]
- Januszewicz, K.; Kazimierski, P.; Klein, M.; Kardaś, D.; Łuczak, J. Activated carbon produced by pyrolysis of waste wood and straw for potential wastewater adsorption. Materials 2020, 13, 2047. [Google Scholar] [CrossRef] [PubMed]
- FFotsop, C.G.; Tchuifon, D.R.T.; Kouteu, P.A.N.; Nguena, K.L.T.; Tamo, A.K.; Dongmo, D.N.; Mafo, S.G.M.; Djioko, F.H.K.; Mouangue, R.M.; Tonle, I.K. Investigation of steam explosion pretreatment on spectroscopic, thermodynamic, and textural properties of lignocellulosic biobased materials during a thermal degradation. Biomass Convers. Biorefinery 2024. [Google Scholar] [CrossRef]
- Ngouanwou, G.M.N.; Ngomade, S.B.L.; Fotsop, C.G.; Tchuifon, D.R.T.; Ngakou, C.S.; Tagne, R.F.T.; Anagho, S.G.; Abi, C.F. Effectiveness of pretreatment on kinetic and thermodynamic parameters during the thermal degradation of coffee pulp biowaste material. Chem. Pap. 2025, 79, 1165–1182. [Google Scholar] [CrossRef]
- Wang, J.; Wang, S. Preparation, modification and environmental application of biochar: A review. J. Clean. Prod. 2019, 227, 1002–1022. [Google Scholar] [CrossRef]
- Ogungbenro, A.; Quang, D.; Al-Ali, K.A.; Vega, L.; Abu-Zahra, M.R.M. Synthesis and characterization of activated carbon from biomass date seeds for carbon dioxide adsorption. J. Environ. Chem. Eng. 2020, 8, 104257. [Google Scholar] [CrossRef]
- Zhang, J.; Wang, Y.; Wang, Y.; Wang, S. Structural evolution of biomass-derived activated carbons analyzed by XRD and Raman spectroscopy. Carbon 2020, 162, 559–569. [Google Scholar]
- Heon Kwon, J.; Bum Park, S.; Ayrilmis, N.; Won Oh, S.; Hun Kim, N. Effect of carbonization temperature on electrical resistivity and physical properties of wood and wood-based composites. Compos. Part B Eng. 2013, 46, 102–107. [Google Scholar] [CrossRef]
- Terzopoulou, P.; Kamperidou, V. Chemical characterization of Wood and Bark biomass of the invasive species of Tree-of-heaven (Ailanthus altissima (Mill.) Swingle), focusing on its chemical composition horizontal variability assessment. Wood Mater. Sci. Eng. 2021, 17, 469–477. [Google Scholar] [CrossRef]
Disclaimer/Publisher’s Note: The statements, opinions and data contained in all publications are solely those of the individual author(s) and contributor(s) and not of MDPI and/or the editor(s). MDPI and/or the editor(s) disclaim responsibility for any injury to people or property resulting from any ideas, methods, instructions or products referred to in the content. |
© 2025 by the authors. Licensee MDPI, Basel, Switzerland. This article is an open access article distributed under the terms and conditions of the Creative Commons Attribution (CC BY) license (https://creativecommons.org/licenses/by/4.0/).

