Article

Mangrove Damage and Early-Stage Canopy Recovery Following Hurricane Roslyn in Marismas Nacionales, Mexico

by
Samuel Velázquez-Salazar
1,
Luis Valderrama-Landeros
1,
Edgar Villeda-Chávez
1,
Cecilia G. Cervantes-Rodríguez
2,
Carlos Troche-Souza
1,
José A. Alcántara-Maya
1,
Berenice Vázquez-Balderas
1,
María T. Rodríguez-Zúñiga
1,
María I. Cruz-López
1 and
Francisco Flores-de-Santiago
3,*
1
Coordinación de Geomática, Comisión Nacional para el Conocimiento y Uso de la Biodiversidad, Mexico City 14010, Mexico
2
Departamento El Hombre y su Ambiente, Universidad Autónoma Metropolitana, Unidad Xochimilco, Mexico City 04960, Mexico
3
Instituto de Ciencias del Mar y Limnología, Universidad Nacional Autónoma de México, Mexico City 04510, Mexico
*
Author to whom correspondence should be addressed.
Forests 2025, 16(8), 1207; https://doi.org/10.3390/f16081207
Submission received: 10 June 2025 / Revised: 14 July 2025 / Accepted: 19 July 2025 / Published: 22 July 2025

Abstract

Hurricanes are powerful tropical storms that can severely damage mangrove forests through uprooting trees, sediment erosion, and saltwater intrusion, disrupting their critical role in coastal protection and biodiversity. After a hurricane, evaluating mangrove damage helps prioritize rehabilitation efforts, as these ecosystems play a key ecological role in coastal regions. Thus, we analyzed the defoliation of mangrove forest canopies and their early recovery, approximately 2.5 years after the landfall of Category 3 Hurricane Roslyn in October 2002 in Marismas Nacionales, Mexico. The following mangrove traits were analyzed: (1) the yearly time series of the Combined Mangrove Recognition Index (CMRI) standard deviation from 2020 to 2025, (2) the CMRI rate of change (slope) following the hurricane’s impact, and (3) the canopy height model (CHM) before and after the hurricane using satellite and UAV-LiDAR data. Hurricane Roslyn caused a substantial decrease in canopy cover, resulting in a loss of 47,202 ha, which represents 82.8% of the total area of 57,037 ha. The CMRI standard deviation indicated early signs of canopy recovery in one-third of the mangrove-damaged areas 2.5 years post-impact. The CMRI slope indicated that areas near the undammed rivers had a maximum recovery rate of 0.05 CMRI units per month, indicating a predicted canopy recovery of ~2.5 years. However, most mangrove areas exhibited CMRI rates between 0.01 and 0.03 CMRI units per month, anticipating a recovery time between 40 months (approximately 3.4 years) and 122 months (roughly 10 years). Unfortunately, most of the already degraded Laguncularia racemosa forests displayed a negative CMRI slope, suggesting a lack of canopy recovery so far. Additionally, the CHM showed a median significant difference of 3.3 m in the canopy height of fringe-type Rhizophora mangle and Laguncularia racemosa forests after the hurricane’s landfall.

1. Introduction

Hurricanes are powerful atmospheric phenomena characterized by strong winds, heavy rainfall, and intense low-pressure systems [1]. These storms form over warm ocean waters in tropical and subtropical regions, fueled by the heat from the water. Hurricanes are classified on the Saffir–Simpson scale, which ranges from Category 1 (119–153 km/h) to Category 5 (greater than 252 km/h), based on wind speeds and potential damage [2]. Due to their intense winds, hurricanes can cause widespread destruction, including uprooting trees, damaging buildings, causing power outages, and triggering massive flooding, particularly in low-lying areas [3]. While hurricanes are a natural occurrence, several studies have noted that sea surface temperatures and climate change can affect their intensity and frequency [4].
Mangroves are exceptionally resilient coastal ecosystems that play a vital role in shoreline protection and biodiversity support [5]. These distinctive trees and shrubs possess unique adaptations that enable them to thrive in challenging intertidal environments, where they endure extreme conditions such as fluctuating salinity, powerful tidal currents, and the intense forces associated with tropical storms and hurricanes [6]. Additionally, their dense and flexible root systems effectively stabilize sediments and reduce the impact of strong winds and wave action [7]. These evolutionary traits enable mangroves to withstand the immediate effects of hurricanes and facilitate rapid recovery and regeneration following such events [8].
While mangroves are remarkably resilient and have developed various adaptations to withstand extreme weather conditions, hurricanes can still result in considerable mortality and fragmentation within these coastal forests [9]. Intense winds and storm surges associated with hurricanes can severely compromise the physical integrity of mangroves by uprooting trees, breaking branches, and damaging main trunks, and in certain coastal environments, hurricane-generated waves can deposit sediment layers across mangrove stands, potentially leading to root suffocation and tree mortality [10]. Additionally, hurricanes can obstruct or alter tidal channels, disrupting the essential water exchange processes that mangroves rely on for nutrient flow and oxygenation [11]. These hindrances can negatively impact mangrove regeneration, affecting the health of a forest [12]. Over time, the cumulative effects of these disturbances can fragment mangrove habitats, making them more vulnerable to future storms and reducing their ability to protect coastal areas from shoreline erosion and storm surges [13].
Remote sensing has been a technology of utmost importance for monitoring and assessing the impact of hurricanes on mangrove ecosystems [14]. Using satellite imagery, aerial photography, and other remote sensing platforms [15], such as unoccupied or unmanned aerial vehicles (UAVs), it is possible to collect large-scale, high-resolution data on the health and structure of mangroves before, during, and after storm events [16]. Several investigations into mangroves have demonstrated that these technologies can detect physical damage, such as tree mortality, canopy loss, and forest fragmentation, providing valuable information on the extent of hurricane damage [17]. Additionally, remote sensing enables the continuous, non-invasive monitoring of extensive and often inaccessible coastal areas [18], thus supporting real-time damage assessments of mangrove resilience and recovery [19]. In this sense, monitoring changes over time provides critical information for understanding long-term trends in mangrove vulnerability to hurricanes and other climate-related hazards [20]. Thus, the aim of this study was to assess the damage and early recovery of the mangrove forest canopy following the impact of Hurricane Roslyn on the Marismas Nacionales wetland system in Mexico.

2. Materials and Methods

2.1. Study Area

Marismas Nacionales is the largest coastal wetland system along the Pacific coast of Mexico, spanning the states of Nayarit and southern Sinaloa (Figure 1a). Covering more than 200,000 ha, it represents one of the most extensive and ecologically important mangrove ecosystems in the country [21]. The coastal wetland comprises a combination of estuaries, coastal lagoons, tidal channels, and rivers, supporting numerous endemic and migratory species of ecological and conservation importance [22]. The climate of Marismas Nacionales is predominantly tropical in the southern region, transitioning to subtropical in the north [23], where most rainfall occurs between June and October, coinciding with the tropical storm and hurricane season [24]. The region’s hydrological dynamics are primarily driven by freshwater inflows from two free-flowing rivers—the San Pedro and Acaponeta—and by substantial tidal exchange with the Pacific Ocean, particularly through the Cuautla Canal [25].
Marismas Nacionales supports a diverse assemblage of neotropical mangrove species characteristic of the eastern Pacific mangrove biome. The dominant species include Avicennia germinans (black mangrove), Rhizophora mangle (red mangrove), Laguncularia racemosa (white mangrove), and Conocarpus erectus (buttonwood) [26]. These species exhibit distinct biophysical adaptations that enable them to thrive in specific zones along salinity and tidal gradients. For example, Rhizophora mangle typically occupies the seaward fringe and riverine margins, where its prominent prop root system provides shoreline stabilization and sediment retention. Avicennia germinans and Laguncularia racemosa are more commonly distributed in intermediate to landward zones, where conditions are marked by variable salinity and reduced tidal inundation [27]. Conocarpus erectus, although not a true mangrove, is frequently found in higher elevation areas with infrequent flooding, often forming ecotonal transitions between mangrove forests and inland tropical deciduous forests [28].
Despite its ecological importance, Marismas Nacionales faces growing anthropogenic pressures. The expansion of agricultural activities; the intensification of aquaculture, particularly shrimp farming; unsustainable fishing practices; and infrastructure development, such as the opening of the Cuautla Canal in 1972, have contributed to habitat fragmentation, water quality degradation, and consequential alterations to natural hydrological regimes [29]. Furthermore, the escalating effects of severe weather events such as hurricanes pose substantial threats to the long-term sustainability of the mangrove ecosystem of this coastal region [30].
Hurricane Roslyn originated from a low-pressure system located at the southwestern coast of Mexico on October 10, 2022. Within a remarkably brief period of 18 h, it intensified from a tropical storm to a Category 4 hurricane, achieving peak sustained winds of 200 km/h. On 23 October 2022, Hurricane Roslyn made landfall near Santa Cruz in the northern region of Nayarit as a Category 3 hurricane (Figure 1b), with sustained winds registering at 163 km/h. The powerful winds generated by the hurricane caused extensive damage, particularly in coastal regions. Numerous trees were uprooted, and heavy rainfall led to flooding in low-lying areas. Meanwhile, the storm surge had an adverse impact on coastal communities, resulting in the inundation of portions of roads and critical infrastructure. It was locally reported that the most defoliated mangrove forests were the monospecific stands of Laguncularia racemosa along the edges of the Agua Brava Lagoon (Figure 1c) and Rhizophora mangle in the San Pedro River basin (Figure 1d).

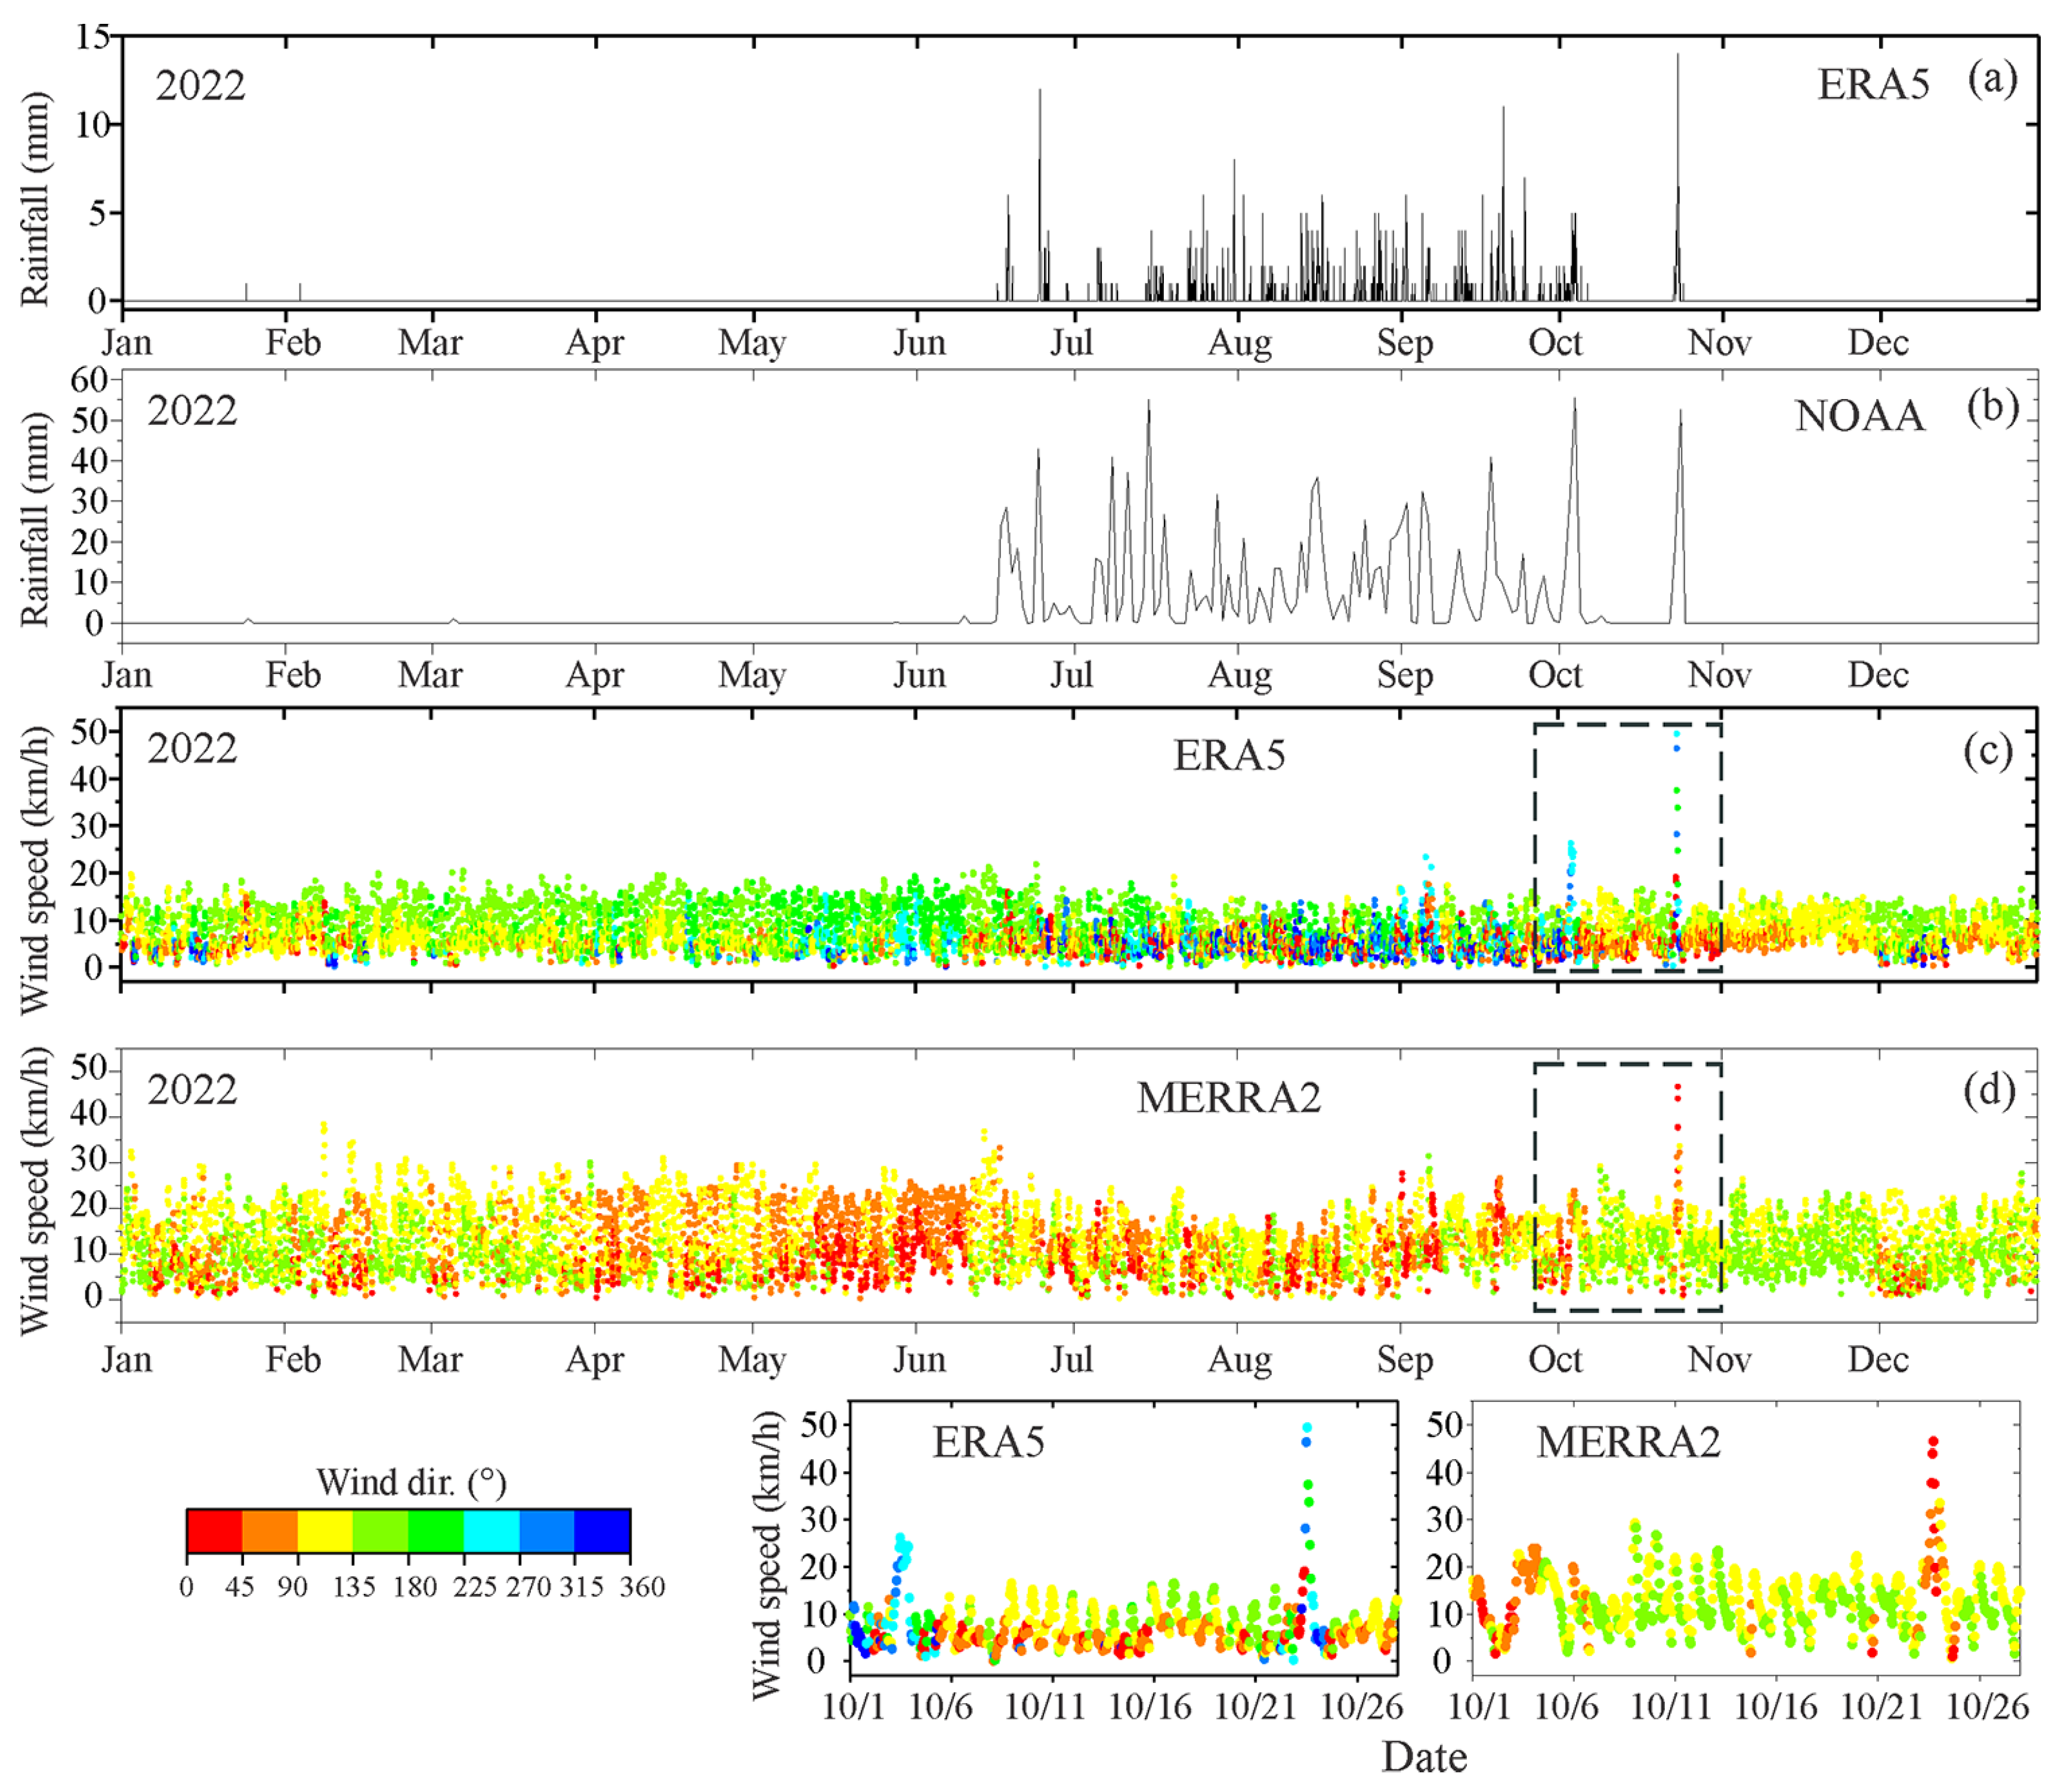
2.2. Rainfall and Wind Data

We obtained hourly rainfall time series from the ERA5 reanalysis platform https://cds.climate.copernicus.eu/ (accessed on 8 June 2025) for the period spanning January to December 2022 (Figure 2). ERA5, the fifth-generation climate reanalysis product developed by the European Centre for Medium-Range Weather Forecasts under the Copernicus Climate Change Service, provided rainfall estimates at an approximately 30 km horizontal resolution, making it particularly suitable for assessing long-term climate patterns. Additionally, we acquired daily average rainfall data from the National Oceanic and Atmospheric Administration (NOAA) Climate Prediction Center https://www.ncei.noaa.gov/cdo-web/ (accessed on 8 June 2025). This dataset incorporated both satellite-derived and ground-based observations. The NOAA gridded rainfall data, covering the same study period (January to December 2022), were downloaded in a NetCDF format through the Climate Data Tools and Services interface.
For wind direction and speed analysis, we acquired two independent hourly datasets covering the study area from January to December 2022. The first dataset comprised the u and v wind components obtained from the ERA5 platform, as previously described. The second dataset was derived from the Modern-Era Retrospective Analysis for Research and Applications, Version 2 (MERRA-2) platform https://gmao.gsfc.nasa.gov/reanalysis/merra-2 (accessed on 8 June 2025), a global atmospheric reanalysis product developed by NASA’s Global Modeling and Assimilation Office. MERRA-2 provided a comprehensive, high-resolution climate record spanning 1980 to the present, incorporating satellite observations and ground-based measurements through advanced data assimilation techniques. The dataset included hourly and monthly wind speed and direction data at multiple atmospheric levels, including near-surface (10 m) and various pressure levels. With a spatial resolution of approximately 0.5° latitude by 0.625° longitude, MERRA-2 is particularly suitable for synoptic-scale climatological and meteorological studies. We accessed the MERRA-2 wind data in NetCDF and HDF formats through the NASA Goddard Earth Sciences Data and Information Services Center.

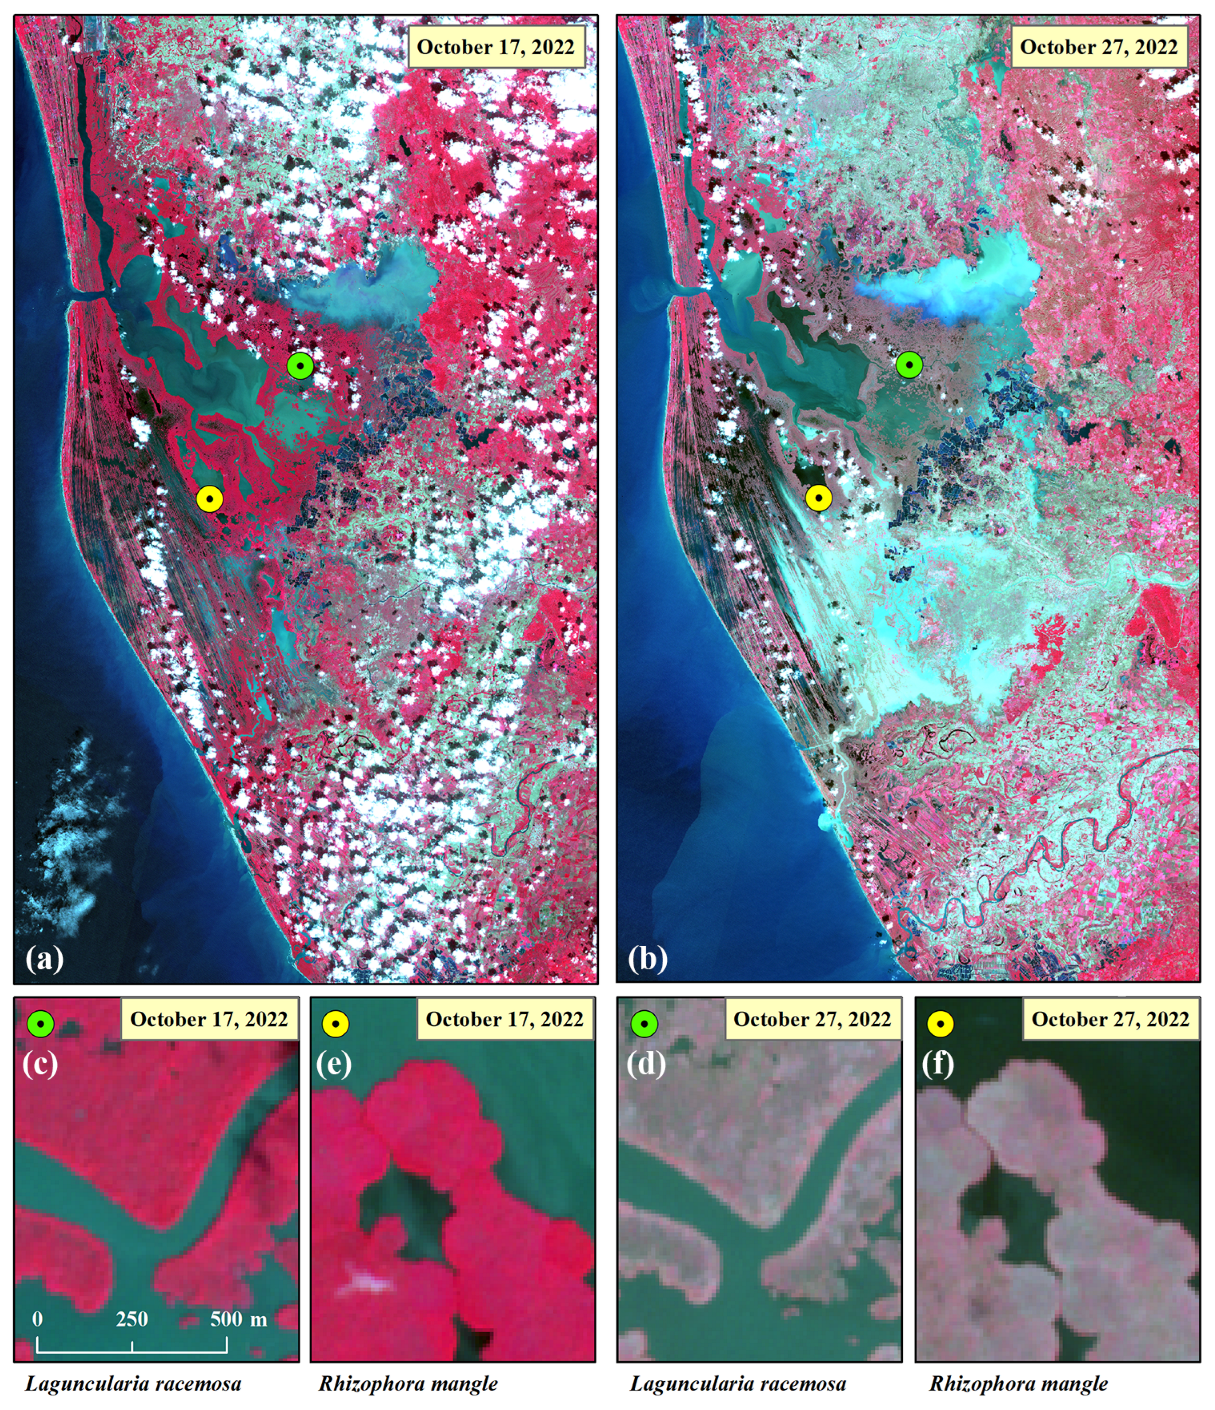
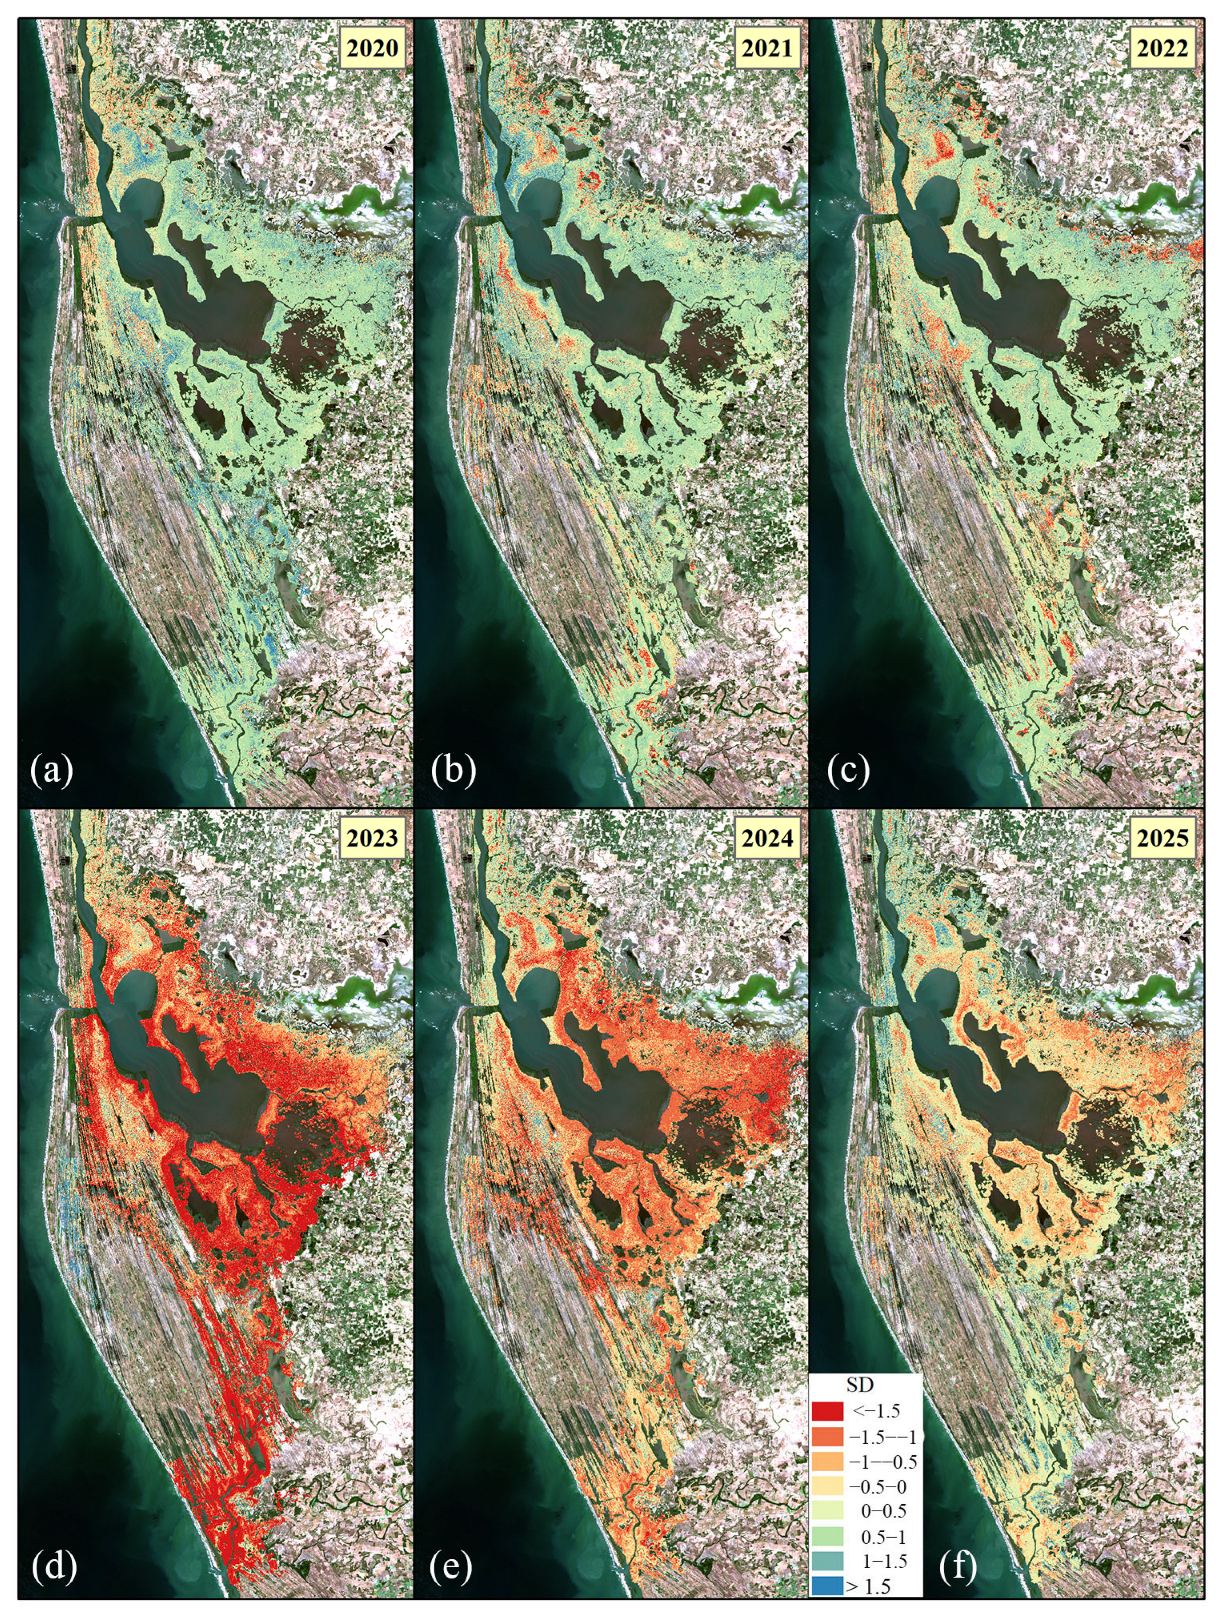
2.3. Mangrove Canopy Defoliation Time Series

Sentinel-2 multispectral imagery (Level-2A surface reflectance product at 10 m spatial resolution) was employed to evaluate mangrove forest canopy conditions within the Marismas Nacionales wetland system. To ensure data comparability while minimizing the influence of image acquisition conditions, we used the harmonized Sentinel-2 collection from https://developers.google.com/earth-engine/datasets/catalog/COPERNICUS_S2_SR_HARMONIZED (accessed on 12 July 2025). A preliminary data quality filter was applied in the Google Earth Engine (GEE), using the Scene Classification Layer (SCL) to exclude pixels depicted as dark areas, cloud shadows, and those with varying probabilities of cloud presence, including cirrus clouds [31]. After this filtering step, the Combined Mangrove Recognition Index (CMRI) was calculated for all available satellite images acquired during the dry season (January to June) from 2020 to 2025, using the same GEE platform [32]. Several studies have incorporated the CMRI in assessing mangrove ecosystem canopies across coastal regions due to its robustness in determining mangrove health [33]. By integrating vegetation and moisture data, this spectral index provides a comprehensive indication of mangrove conditions. The CMRI combines the Normalized Difference Vegetation Index (NDVI), which captures canopy density and photosynthetic activity, with the Normalized Difference Water Index (NDWI), which is sensitive to moisture content in vegetation and adjacent waterways [34]. To ensure that the analysis focused exclusively on mangrove forest cover, the CMRI images were masked using the 2020 mangrove extent from the CONABIO Mexican Mangrove Monitoring System. The CMRI equation is as follows:
C M R I = N I R R N I R + R G N I R G + N I R
where NIR, R, and G indicate the near-infrared, red, and green bands.
The standardization process was applied to enable comparisons of CMRI values across different years by generating standardized anomalies https://yajvaljo.users.earthengine.app/view/cmri--marismas2019-2025 (accessed on 12 July 2025). This process consisted of calculating the CMRI of each pixel for a specific year (referred to as year i) using the median to create biannual composites using all available data from 2019 to 2025. We then standardized these data by subtracting each specific year from the multi-year mean and dividing by its standard deviation for the period 2020 to 2025. The resulting maps represent the number of standard deviations where each pixel deviates from the mean from https://code.earthengine.google.com/ce8a2443d3c09a583a8466f5342ae166 (accessed on 1 July 2025). These values were classified into eight categories: four indicating above-average conditions and four indicating below-average conditions. The classification ranges were 0–0.5, 0.5–1, 1–1.5, and greater than 1.5 standard deviations for both positive (above-average) and negative (below-average) anomalies. The total areas of these classifications were obtained in the open-source software QGIS v.3.42.2.
Monthly composites of the CMRI were analyzed to assess mangrove cover trends from January 2023 to March 2025, using median values at a 10 m pixel resolution. A general linear regression model was applied to estimate these trends [35], with the regression slope (measured in CMRI units per month) indicating both the direction and magnitude of canopy change. For instance, a positive slope value indicates an increase in mangrove canopy density, probably due to natural regeneration. On the contrary, a negative value suggests canopy degradation or a potential loss of mangrove cover. Additionally, field photographs collected during multiple ground campaigns—conducted on 11–18 March 2023; 11–12 April 2023; 2–13 October 2023; 5–16 November 2023—were used to confirm the gaps in the canopy from the remote sensing results. Ultimately, this approach successfully mapped spatiotemporal patterns of mangrove canopy loss or recovery, providing valuable insights for conservation and management efforts [36]. Additionally, representative pixels were selected to extract time series from the monthly CMRI composites. The Mann–Kendall test was applied to pixels dominated by Rhizophora mangle and Laguncularia racemosa, as well as within the Agua Brava Lagoon and the San Pedro and Santiago river systems, to assess significant differences in temporal trends (α = 0.05).
Figure 2. Flowchart for the Hurricane Roslyn assessment [37].
Forests 16 01207 g002

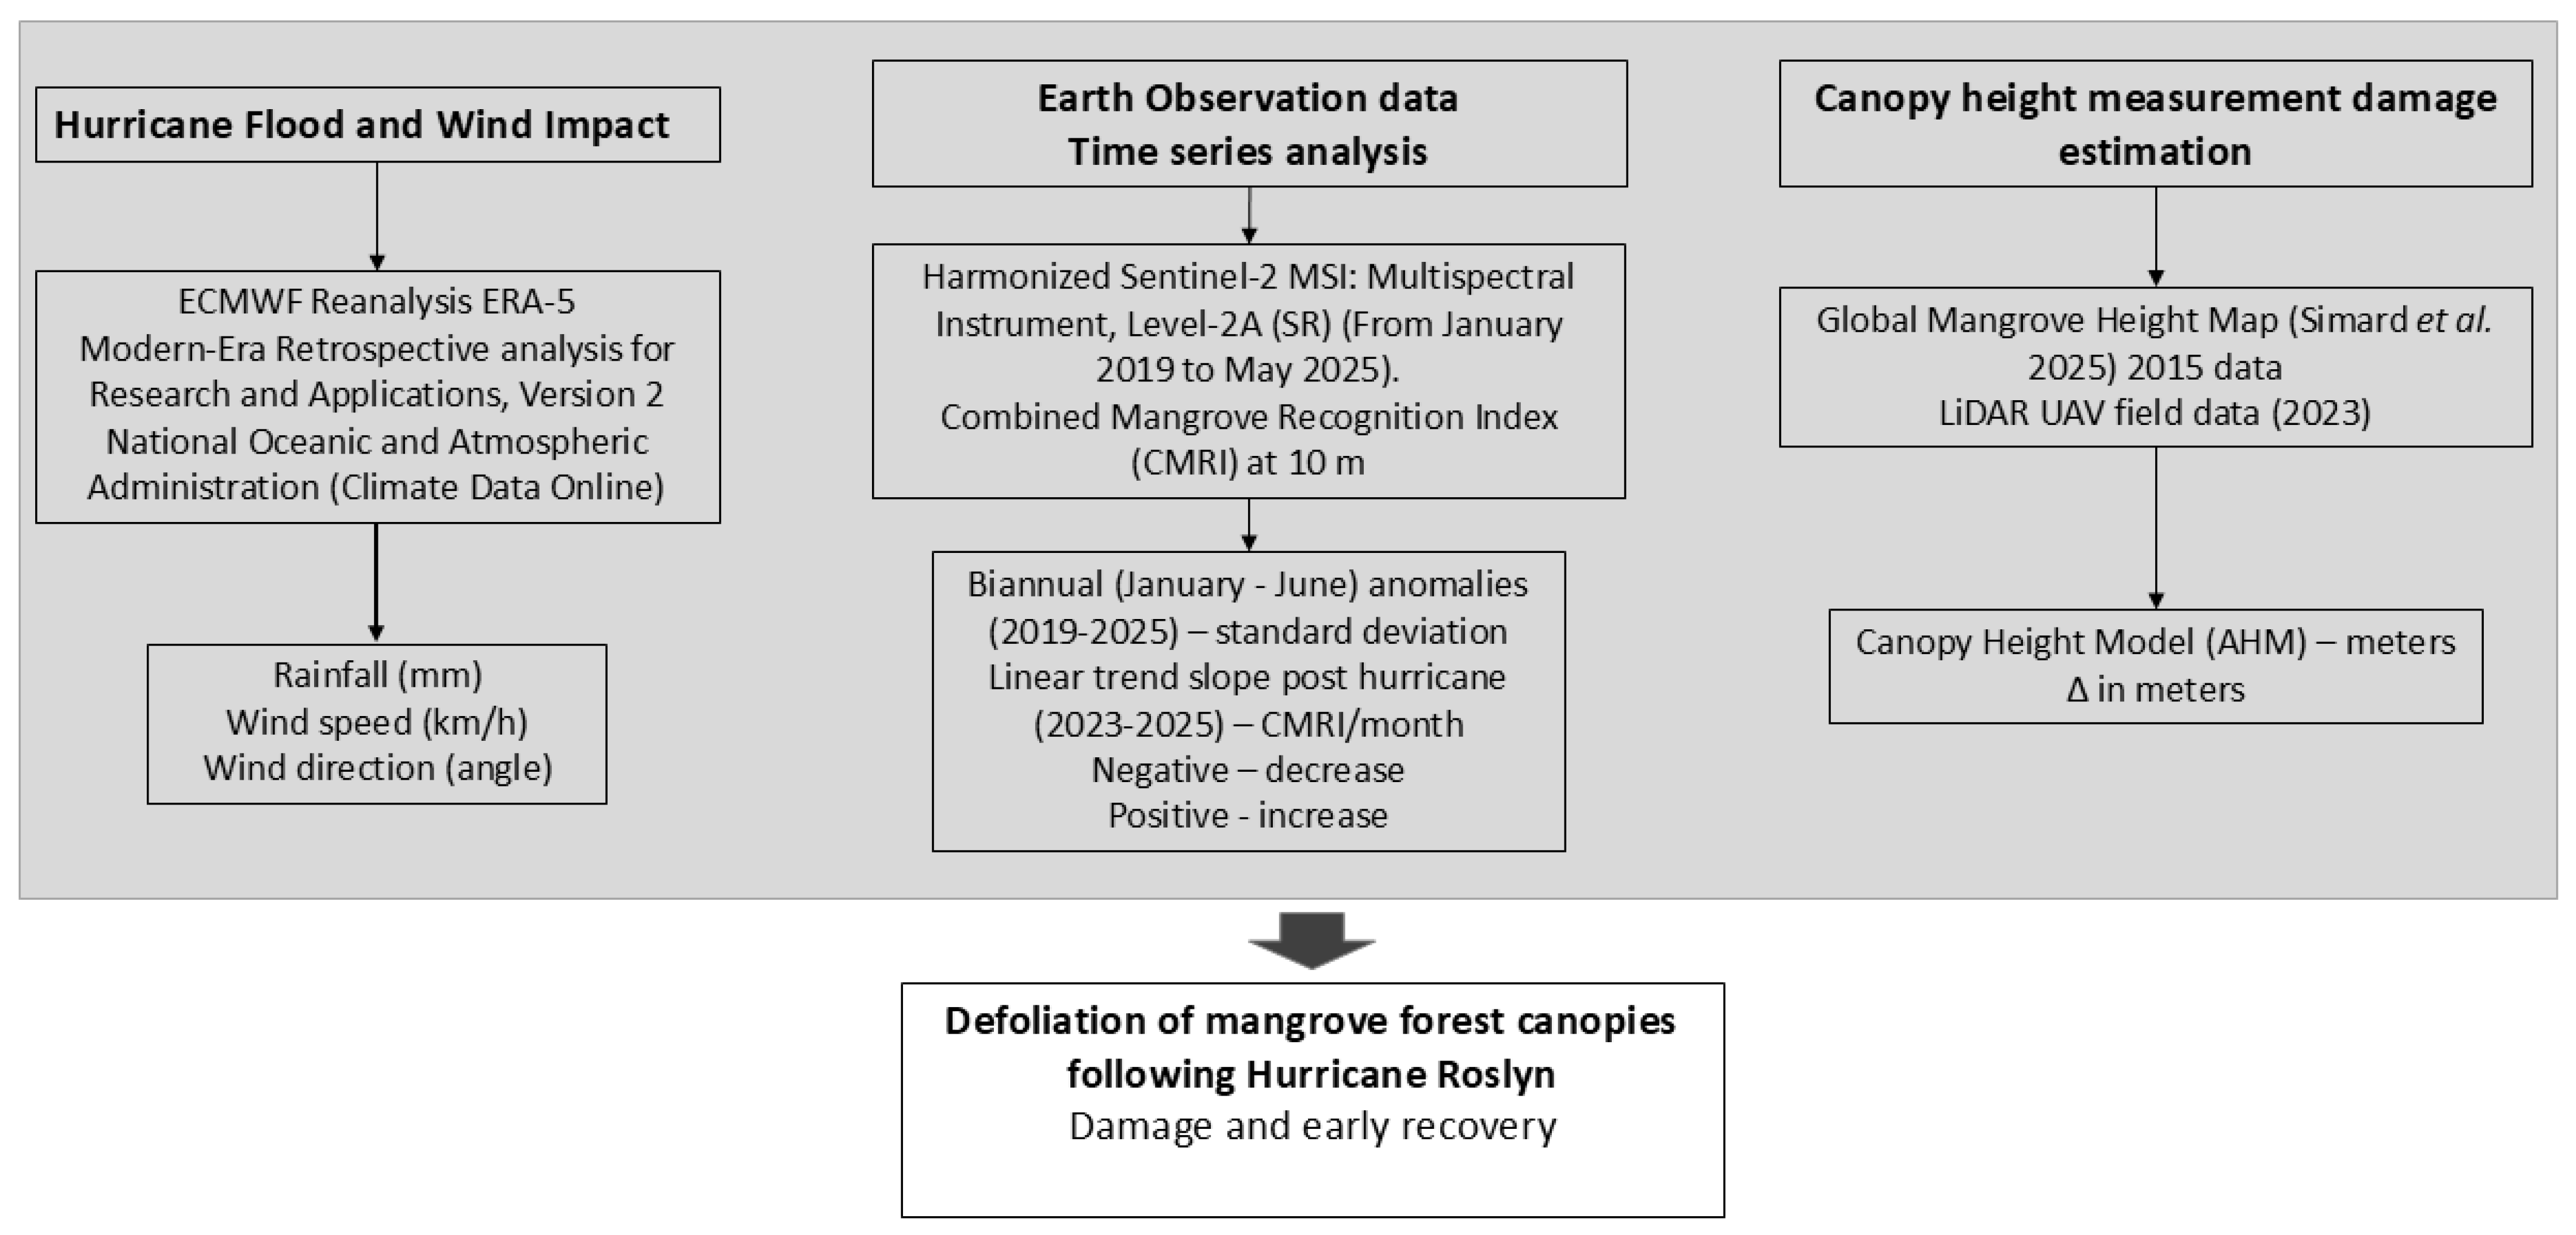
2.4. Canopy Height Models from Satellite and UAV Flight Missions

We employed global canopy height data for mangrove forests derived from TanDEM-X spaceborne data collected in 2015. This dataset boasts a spatial resolution of 12 m and an estimated vertical accuracy of 2.4 m [37]. This canopy height global database is massive, so we selected the specific file for the south of Marismas Nacionales (TDM1_DEM__04_N22W106_DEM_EGM08_GMW314_2015_WM_hcap_cal.tif), and it is available for download from the following open access repository: https://daac.ornl.gov/CMS/guides/CMS_Global_Mangrove_Forest_Ht.html (accessed on 1 July 2025).
Despite the 7-year interval between the collection of TanDEM-X data in 2015 and the landfall of Hurricane Roslyn in 2022, we relied exclusively on the TanDEM-X data for our assessment of mangrove canopy height prior to the hurricane’s impact. This decision was made due to the absence of detailed field data within the study area. We obtained TanDEM-X canopy height data specifically corresponding to the polygons where UAV surveys were conducted using a LiDAR sensor in 2023. Readers are given the reference of Simard [37] for a comprehensive description of the methodology employed in the TanDEM-X approach.
A total of seven UAV surveys were conducted within designated flight polygons, which varied in size from 14 to 26 ha, at an altitude of 50 m. In these areas, we utilized a Matrice 300 RTK UAV (DJI, Shenzhen, China) equipped with a Zenmuse L1 (DJI, Shenzhen, China) LiDAR sensor to estimate the canopy height model (CHM) from a dense cloud point arrangement [38]. The LDR file is imported into DJI Terra version 4.5, wherein the point cloud is reconstructed and subsequently exported in a LAS format. From there, this file is imported into CloudCompare v.2.14, which preprocessed the point cloud with the Statistical Outlier Removal denoising algorithm and the Segment Out option. The dense point clouds exhibited a range of ~250 to 300 points/m2. The CHM elevations were estimated using the filtered point cloud in conjunction with the Cloth Simulation Filter plugin, applied to a flat scene at a cloth resolution of 0.5 with 500 iterations. Subsequently, we utilized the Volume Compute 2.5D tool to represent the canopy height within a 2.5D orthomosaic. To rasterize the data, we selected the Projection Rasterize option, employing a spatial resolution of 1 m/pixel, as the computational burden associated with a higher resolution in centimeters was deemed excessive [39]. Ultimately, we exported the CHM in a TIF format and computed zonal statistics, encompassing the median, mean, minimum, and maximum values, utilizing QGIS v.3.42.2. The reader is directed to Jarahizadeh [40] for comprehensive details concerning the CHM analysis in DJI Terra.

3. Results

3.1. Hurricane Flood and Wind Impact on Marismas Nacionales

In 2022, the rainfall patterns in Marismas Nacionales reflected a semi-arid climate, characterized by an extended dry season that persisted for most of the year (Figure 3a,b). A brief yet intense rainy season occurred from July to October, frequently influenced by tropical storms and hurricanes, which brought short but concentrated rainfall. Overall, rainfall data from the ERA5 and NOAA platforms showed a similar trend, with a linear correlation of 0.87. Even so, ERA5 consistently reported lower rainfall amounts compared to those depicted by the NOAA. However, the highest rainfall levels in late October 2022 coincided with the landfall of Hurricane Roslyn. Regarding the wind data, the intensity of Hurricane Roslyn was comparable in the ERA5 and MERRA-2 datasets (Figure 3c,d). However, the wind direction appeared to be better represented in the MERRA-2 dataset, which showed a southeasterly direction during winter, originating from the cold fronts of the Gulf of California, and a northeasterly orientation during summer, resulting from tropical storms and hurricanes.
The impact of flooding and wind damage within the Marismas Nacionales coastal complex was substantial (Figure 4). A comparative analysis of two satellite images—one taken on October 17, six days before the event, and the other on October 27, four days after—reveals that the flooded area expanded to approximately 60,000 ha mainly from the Acaponeta River in the north to the San Pedro and Santiago rivers in the south. Furthermore, massive defoliation is clearly observed in areas dominated by monospecific forests, particularly where the predominant mangrove species—Rhizophora mangle and Laguncularia racemosa—thrive within the southern coastal ecosystem.

3.2. Mangrove Vegetation Index Time Series

The annual CMRI standard deviation trend anomaly results for the 2020–2025 period reveal notable variations before and after the impact of Hurricane Roslyn (Figure 5). During the pre-impact phase (January to June 2020–2022), a generally positive trend in the standard deviation is observed across the Marismas Nacionales complex. This trend is particularly pronounced at the mouth of the Acaponeta River and within fringe-type mangrove forests. However, some areas exhibit a negative trend, indicating a decrease in mangrove canopy cover. This pattern is especially clear in basin-type shrub mangroves that lack a direct connection to open water, as well as throughout the San Pedro River watershed, where the presence of an invasive vine-type plant species has been reported to affect mangrove forests.
The CMRI standard deviation trend shows a notable negative shift in 2023 (Figure 5). During this period, direct defoliation of mangrove forests is observed along the path of Hurricane Roslyn, particularly in the southern part of Marismas Nacionales and along the edges of the Agua Brava Lagoon, located in the central section of the system. Following the hurricane’s impact, a gradual recovery in the trend is observed over the next two years (2024 and 2025). This positive change is most apparent in the areas most affected by the hurricane, located in the southern part of the estuarine system and around the margins of the Agua Brava Lagoon.
In the context of early mangrove canopy recovery, the analysis of negative standard deviations indicates that 1601 ha exhibited signs of degradation prior to the impact of Hurricane Roslyn in 2022, as indicated by the red color on the maps from 2020 to 2022 (Figure 6). Subsequently, by comparing these areas with the immediate post-hurricane damage patterns, we identified an additional 47,202 ha affected (82.8% of the total area). By 2024, approximately 3.2% (equivalent to 5668 ha) of the mangrove exhibited a slight increase in canopy cover. The initial recovery appears to accelerate in 2025, with 31,652 ha with negative values. In other words, satellite-derived CMRI preliminary analysis indicates that approximately 33% of the mangrove canopy affected by Hurricane Roslyn exhibited initial recovery trends (e.g., increased positive standard deviation) within the first two and a half years post-impact. However, it is essential to note that this indicates only a slight increase in canopy cover, i.e., early signs of recovery, and full restoration will require more time.
Based on the aforementioned results, the additional analysis regarding the rate of change in the CMRI slope and the GEE time series indicates a similar trend where the mangroves within Marismas Nacionales undergo a recovery process following the massive defoliation caused by Hurricane Roslyn (Figure 7). However, the response of the mangrove forest varies according to species composition and location within the coastal system. For instance, Mann–Kendall analysis of CMRI time series data revealed maximum recovery rates of +0.05 CMRI units per month in mangrove areas adjacent to the San Pedro, Santiago, and Acaponeta rivers, contrasting with the stagnant or negative trends in the basin-type mangroves surrounding the Agua Brava Lagoon. Monospecific stands of Rhizophora mangle appear to be recovering more rapidly than those dominated by Laguncularia racemosa. However, the majority of the affected mangrove areas demonstrate significant CMRI slope rates ranging from 0.01 to 0.03 CMRI units per month. This suggests that full recovery will require a period of 40 to 122 months, or approximately 3.3 to 10.2 years. This assessment is based on the disparity between the maximum CMRI value recorded prior to the hurricane and the duration necessary to return to that value from the minimum CMRI observed following the hurricane’s impact. Unfortunately, most of the Laguncularia racemosa forests in a degraded condition displayed a negative CMRI slope, suggesting a lack of canopy recovery so far.

3.3. Canopy Height Models

The CHM distribution of the mangrove forest in Marismas Nacionales, as analyzed using TanDEM-X data, reflects the expected characteristics of mangrove stands in a semi-arid environment prior to the impact of Hurricane Roslyn (Figure 8). Specifically, the tallest trees, reaching a maximum height of 18.9 m, are situated along the shores of the coastal Agua Brava Lagoon and at the mouth of the Acaponeta River, located in the northern section of the coastal system. These trees predominantly belong to the species Rhizophora mangle in the northern region and Laguncularia racemosa in the central lagoon area. Conversely, shrubs ranging from 0.9 to 2.9 m in height are positioned to the east of the coastal system within low-flooded zones, primarily consisting of Laguncularia racemosa stands that are in a degraded condition. The transition between these two distinct mangrove communities encompasses a variety of Laguncularia racemosa in different physiognomic forms, including basin-type mangroves in less flooded areas and over-flooded mangroves on small islands.
An analysis comparing areas with recorded UAV flights and LiDAR data reveals a reduction in canopy height of up to 3.3 m in regions where the median height was previously measured at 9.4 m. Following the impact of Hurricane Roslyn, the maximum recorded canopy height ranged from 12.3 to 13.9 m, with an average height of 6.05 ± 1.9 m. The minimum recorded canopy height post-hurricane varied from 0.3 to 1 m, while the general minimum observed before the hurricane landfall ranged from 1.1 to 6.7 m. The dense LiDAR point cloud indicates a substantial presence of downed or leaning stems, particularly in fringe-type mangroves, as well as a substantial amount of debris scattered across the ground within the flight areas.

4. Discussion

The impact of Category 3 Hurricane Roslyn on the coastal zone of Marismas Nacionales was frequently perceived as purely destructive, primarily due to the extensive short-term damage inflicted on fishing camp infrastructure. However, it has been suggested that their long-term ecological benefits will be essential for the sustained balance of Marismas Nacionales [41]. For comparison, previous research has demonstrated that hurricanes facilitate the transport of sediments and nutrients from offshore and river systems into coastal wetlands, thereby enhancing soil fertility and promoting plant growth [6]. In mangrove ecosystems, storm surges deposit organic-rich sediments, increasing productivity [42]. In Florida, a multidecadal hurricane impact assessment demonstrates that mangrove root systems effectively sequester suspended sediments from storms, driving tidal flat accretion while establishing suitable substrates for propagule colonization [43]. Notably, mangrove seedlings greatly contribute to stabilizing eroded banks—their presence often represents the critical factor preventing large-scale sediment loss and ecosystem collapse in vulnerable mangrove islands and tidal creek systems [44,45]. However, land-use alterations in degraded regions—exacerbated by storm-induced sediment mobilization (e.g., topsoil erosion or overwash deposition)—and modifications to hydrological regimes were among the dominant influencing factors on mangrove ecosystem recovery dynamics after Category 4 Hurricane Maria struck Puerto Rico in 2017 [46].
Additionally, moderate hurricane disturbances reduce mangrove stand density, improving light penetration and stimulating seedling recruitment [47]. This dynamic process prevents stagnation (e.g., brackish water pooling) and enhances biodiversity by creating favorable conditions for pioneer species [48]. Effective coastal management must acknowledge these natural processes rather than categorizing storms solely as disasters. Moreover, following hurricane events, researchers need to prioritize the assessment of canopy damage to identify areas that may require rehabilitation in future efforts.
Both ERA5 and the NOAA reported a substantial increase in rainfall at the end of October, likely due to the effects of Hurricane Roslyn. However, the values presented by each platform differed, probably due to variations in their data collection methods and analysis techniques [49]. For instance, ERA5 represents a reanalysis product that integrates model simulations with observational data through advanced data assimilation techniques, which incorporate satellite information and simulations of atmospheric dynamics [50]. In contrast, the rainfall datasets provided by the NOAA primarily rely on direct observations from gauge stations, with interpolation methods subsequently used to address data gaps and minimize errors in the datasets [51]. Nonetheless, the absence of field data renders this type of data the sole viable option for analyzing rainfall and wind trends.
Hurricane Roslyn caused extensive flooding across the Marismas Nacionales system, particularly near the Acaponeta (north) and the San Pedro (south) watersheds. This flood event plays a critical ecological role in sustaining riverine and coastal ecosystems [52]. Additionally, Hurricane Roslyn’s flooding reduced system-wide salinity—a critical function in this semi-arid environment where hypersaline conditions (exceeding 80 PSU in isolated saltpan plains) often dominate [53]. Lower salinity levels enhance mangrove recovery by promoting the dispersal of propagules and the establishment of seedlings [52]. For instance, there are reports that Laguncularia racemosa has expanded along the Presidio River (85 km north of Marismas Nacionales) due to sediment deposition from floodwaters [54]. Moreover, floodwater from these rivers transports sediments and nutrients from upstream areas into coastal zones, replenishing soil fertility and supporting adjacent ecosystems, including the region’s predominant deciduous forests [55].
Before Hurricane Roslyn made landfall, our research showed that certain mangrove areas had already been steadily deteriorating, as indicated by the red color on the maps from 2020 to 2022. This decline, reflected in negative standard deviations between 2020 and 2022, has been well-documented and is primarily linked to massive changes in water flow over the past several decades [56]. For example, the construction of dams on key rivers between 1976 and 2012, along with the opening of the Cuautla canal in 1972, which connected the coastal system to the Pacific Ocean, has led to increased salt levels and land subsidence in Marismas Nacionales [57].
The areas showing signs of degradation before the hurricane were primarily located near the Agua Brava Lagoon, especially in basin-type mangrove communities. These mangroves are highly sensitive to changes in water flow because they grow in elevated, confined areas [58]. As a result, they tend to form dense shrubs rather than the taller, more developed trees found along the lagoon’s edge. The decline of these inland mangrove communities, situated farther from regular flooding zones, has been worsened by poorly planned canal construction [26]. These constructions have disrupted the natural ebb and flow of tidal waters, particularly in the northern part of Marismas Nacionales near the Agua Grande Lagoon in the north [58]. There, a canal dug to flood a marsh in a separate coastal system has shortened the flooding cycles that basin-type mangroves depend on. Thus, massive dieback areas of Avicennia germinans have been documented in recent years [21].
Mangroves are highly resilient to hurricanes, and we expect Marismas Nacionales to recover naturally over time. However, the speed of this recovery will vary depending on the mangrove species and local hydrological conditions [59]. We estimated a maximum recovery rate of 0.05 CMRI units per month in areas near the San Pedro, Santiago, and Acaponeta rivers, anticipating a best-case scenario of approximately 2.5 years to achieve a full recovery. However, most mangrove areas exhibit CMRI rates between 0.01 and 0.03 CMRI units per month, suggesting a recovery time between 40 months (approximately 3.4 years) and 122 months (roughly 10 years). In the worst-case scenario, we found that most of the already degraded Laguncularia racemosa forests exhibited a negative CMRI slope, indicating a lack of canopy recovery to date. Compared to other studies, it is expected that Category 4 and 5 hurricanes destroy mangrove canopies, requiring decades for recovery [60]. This situation was clear when Hurricane Andrew devastated Florida in 1992, killing roughly 90% of the mangroves in affected areas [61]. The pattern continued with Hurricane Iris in Belize (2001), where mangroves needed more than a decade to recover [62]. Similarly, Florida’s mangroves took ~10 years to establish after Hurricane Wilma in 2005 [63]. Most recently, Hurricane Willa’s 2018 impact on northern Marismas Nacionales indicates recovery will likely take more than 8.5 years [64]. Overall, it is expected that the unfavorable environmental conditions in Marismas Nacionales will result in these mangroves recovering more slowly than those in healthier tropical systems with better growing conditions, such as those with higher freshwater input [8]. So far, we have not seen new mangrove seedlings taking root after the hurricane; it is still too early to spot them in satellite images or the field. Thus, these findings indicate that the positive rate of change in the canopy reflects the regrowth of hurricane-surviving trees, rather than the recruitment of new mangroves. Specifically, the median height of trees following the hurricane landfall decreased by 3.3 m. Moreover, the minimum pre-hurricane heights recorded for fringe-type trees varied between 1.1 and 6.7 m, whereas the new minimum post-hurricane heights were reported to be as low as 0.3 to 1 m for the same fringe-type mangroves. These data suggest that, although many trees were able to withstand the hurricane’s impacts, they experienced massive defoliation.
We identified a considerable accumulation of dead trunks and mangrove debris along the edges of many small lagoons within Marismas Nacionales. These debris barriers could block tidal water from reaching inland mangroves, potentially slowing their recovery, especially in the Rhizophora mangle stands [65]. For example, the rehabilitation of mangroves in Honduras was notably slow due to hydrological alterations resulting from Hurricane Mitch’s impact in 1998 [66]. In contrast, we identified that mangroves with the most substantial recovery are associated with undammed rivers in Marismas Nacionales. This situation is anticipated, as research indicates that an increased sediment supply from rivers can facilitate the recovery of mangroves by lowering salinity levels [67] and enhancing root stabilization through sediment deposition [68]. A parallel situation was observed in the Mississippi, where mangroves demonstrated a more rapid recovery following Hurricane Katrina in 2005, largely attributed to sediment deposition [69].
Our analysis indicates that approximately one-third of the mangroves affected by Hurricane Roslyn have exhibited an apparent increase in leaf growth within the canopy over the past 2.5 years. This positive change is particularly notable in Rhizophora mangle, demonstrating a substantial increase in leaf growth extending to the upper portions of the trees among the survivors. In the case of Laguncularia racemosa, new foliage primarily emerges on the branches at the base of the trunks. It is worth noting that previous studies have shown Rhizophora mangle forests to be generally healthier in Marismas Nacionales, as evidenced by higher leaf area indices and notably taller trees compared to those of Laguncularia racemosa forests [70]. The recovery rate within areas characterized by monospecific Laguncularia racemosa appears to be diminished, likely because these forests were already in a degraded state before the hurricane’s impact [71].
A critical factor that is likely to affect the rate of canopy recovery is the increasing frequency and intensity of hurricanes. Recent studies indicated that hurricanes are not only becoming more powerful but also moving at slower speeds [72]. This was exemplified by Hurricane Dorian in 2019, which impacted the Bahamas and resulted in massive mangrove mortality [73]. Moreover, the increase in sea levels associated with global warming will result in heightened flooding of coastal mangroves, potentially leading to their submergence as they cannot keep pace with rising sea levels [74]. The implications of these situations could have a substantial negative effect on the mangroves of Marismas Nacionales. Finally, remote sensing offers a viable method for tracking the impact of hurricanes on mangroves in large coastal regions. By analyzing spaceborne-based imagery or UAVs, researchers can identify damaged areas while substantially reducing fieldwork costs. In addition, we recommend establishing permanent plots as a way to monitor the impacts of a hurricane with field data on the structure, leaf area index (LAI), and canopy height before and after landfall.

5. Conclusions

When Hurricane Roslyn made landfall as a Category 3 storm in October 2022, it struck southern Marismas Nacionales, Mexico, severely damaging mangrove forests through widespread defoliation. We tested a combined approach using Sentinel-2 satellite imagery (CMRI vegetation index) and UAV-LiDAR data to monitor mangrove damage and the early signs of canopy recovery. The wind gusts from Hurricane Roslyn caused an immediate defoliation of 47,202 ha of mangrove canopy (primarily Rhizophora mangle and Laguncularia racemosa). However, the CMRI standard deviation series reveals early signs of canopy recovery in at least one-third of the mangrove areas damaged by Hurricane Roslyn, 2.5 years after the impact. The CMRI time series and slope indicated distinct trends regarding canopy recovery: within regions adjacent to the San Pedro, Santiago, and Acaponeta rivers, observations indicate a maximum recovery rate of 0.05 CMRI units per month. This rate implies a projected minimum recovery time of approximately 25 months based on the pre- and post-impact CMRI trends. However, the majority of the positive trend zones exhibited slopes ranging from 0.01 to 0.03. This indicates that the duration required to reach maximum values of the CMRI prior to the hurricane’s impact varies between 40 months (around 3.4 years) and 122 months (roughly 10 years). Conversely, certain areas exhibit negative trends in the CMRI slope, marking a lack of canopy recovery. Notably, monospecific Laguncularia racemosa forests exhibit particularly clear signs of this trend, which were already experiencing degradation prior to the hurricane’s impact. The difference between satellite and UAV data revealed a substantial 3.3 m median difference in the canopy height of fringe-type mangrove forests following Hurricane Roslyn’s impact. This study examines the challenges and opportunities related to the development of satellite and UAV-based monitoring of mangrove ecosystems. The findings aim to support complementary approaches for environmental assessments of mangrove forests in various regions globally.

Author Contributions

Conceptualization, S.V.-S., L.V.-L. and F.F.-d.-S.; methodology, S.V.-S. and E.V.-C.; software, C.G.C.-R. and C.T.-S.; validation, J.A.A.-M. and M.T.R.-Z.; formal analysis, F.F.-d.-S.; investigation, S.V.-S., L.V.-L., E.V.-C., C.T.-S., J.A.A.-M. and F.F.-d.-S.; resources, M.I.C.-L.; data curation, C.G.C.-R., B.V.-B. and F.F.-d.-S.; writing—original draft preparation, F.F.-d.-S.; writing—review and editing, S.V.-S. and C.T.-S.; visualization, S.V.-S., E.V.-C. and F.F.-d.-S.; supervision, B.V.-B. and M.T.R.-Z.; project administration, M.I.C.-L.; funding acquisition, F.F.-d.-S. and M.I.C.-L. All authors have read and agreed to the published version of the manuscript.

Funding

The World Wildlife Fund (WWF), with support from The Bezos Earth Fund, provided financing through agreement MX13531 ‘Strengthening the Mexico’s Mangrove Monitoring System (SMMM)’, granted to CONABIO. F.F.d.-S. thanks the Nature Conservancy through project number TNC-G-MX-260124 and the Programa de Apoyo a Proyectos de Investigación e Innovación Tecnológica (PAPIIT, UNAM, Mexico) under grant agreement IN226724.

Data Availability Statement

These data are available at UNINMAR: http://www.icmyl.unam.mx/uninmar/ (accessed on 29 May 2025). The GEE code can be found here https://code.earthengine.google.com/ce8a2443d3c09a583a8466f5342ae166 (accessed on 12 July 2025).

Acknowledgments

We would like to express our sincere gratitude to Francisco Flores-Verdugo (retired) for his invaluable insights and feedback regarding the mangrove forests of Marismas Nacionales. Special thanks go to L.F. Álvarez-Sánchez for processing the NOAA and MERRA-2 data, and to M. Reyes-Sánchez, C. Mascote-Maldonado and O.G. Rosas-Aceves for their assistance with field logistics. The Comisión Nacional de Áreas Naturales Protegidas (CONANP) authorized the following permits for scientific endeavors conducted within the confines of the natural protected area: DROPC/RBMNN/055/2023, DROPC/RBMNN/069/2023, DROPC/RBMNN/153/2023, DROPC/RBMNN/173/2023, and DROPC/RBMNN/071/2024. The Instituto Nacional de Estadística y Geografía (INEGI) and the Secretaría de la Defensa Nacional (SEDENA) provided the following permits to operate the Matrice 300-UAV drone: LA0032023, LA0222023, LA0952023, LA1002023, LA0122024, and LA0212024.

Conflicts of Interest

The authors declare no conflicts of interest.

References

  1. Floriano, B.R.O.; Hanson, B.; Bewley, T.; Ishihara, J.Y.; Ferreira, H.C. A Novel Policy for Coordinating a Hurricane Monitoring System Using a Swarm of Buoyancy-Controlled Balloons Trading off Communication and Coverage. Eng. Appl. Artif. Intell. 2025, 139, 109495. [Google Scholar] [CrossRef]
  2. Islam, A.M.; Assal, T.J. Rapid, Landscape-Scale Assessment of Cyclonic Impacts on Mangrove Forests Using MODIS Imagery. Coasts 2023, 3, 280–293. [Google Scholar] [CrossRef]
  3. Robles-Archundia, D.A.; López-Vivas, J.M.; León-Cisneros, K.; Vargas-Betancourt, F.; Lara-Uc, M.M.; Hernández-Martínez, L.A.; Hernández-Stefanoni, J.L. Assessment of the Impact of Hurricane Lorena (2019) on the Mangrove Forest of Espiritu Santo Archipelago, Mexico Using Sentinel-2 Imagery. Rev. Teledetección 2025, 65, 21747. [Google Scholar] [CrossRef]
  4. Fanous, M.; Eden, J.M.; Remesan, R.; Daneshkhah, A. Challenges and Prospects of Climate Change Impact Assessment on Mangrove Environments through Mathematical Models. Environ. Model. Softw. 2023, 162, 105658. [Google Scholar] [CrossRef]
  5. Sunkur, R.; Kantamaneni, K.; Bokhoree, C.; Rathnayake, U.; Fernando, M. Mangrove Mapping and Monitoring Using Remote Sensing Techniques towards Climate Change Resilience. Sci. Rep. 2024, 14, 6949. [Google Scholar] [CrossRef] [PubMed]
  6. Abu Bakar, N.A.; Wan Mohd Jaafar, W.S.; Abdul Maulud, K.N.; Muhmad Kamarulzaman, A.M.; Saad, S.N.M.; Mohan, M. Monitoring Mangrove-Based Blue Carbon Ecosystems Using UAVs: A Review. Geocarto. Int. 2024, 39, 2405123. [Google Scholar] [CrossRef]
  7. Ferreira, A.C.; de Lacerda, L.D.; Rodrigues, J.V.M.; Bezerra, L.E.A. New Contributions to Mangrove Rehabilitation/Restoration Protocols and Practices. Wetl. Ecol. Manag. 2023, 31, 89–114. [Google Scholar] [CrossRef]
  8. Zhang, Y.; Li, H.; Li, D.; Hou, X.; Guo, P.; Guo, J. Evolutionary Dynamics of Island Shoreline in the Context of Climate Change: Insights from Extensive Empirical Evidence. Int. J. Digit. Earth 2024, 17, 2329816. [Google Scholar] [CrossRef]
  9. Fan, C.; Hou, X.; Zhang, Y.; Li, D. Satellite Data Reveal Concerns Regarding Mangrove Restoration Efforts in Southern China. Remote Sens. 2023, 15, 4151. [Google Scholar] [CrossRef]
  10. Makumbura, R.K.; Rathnayake, U. Variation of Leaf Area Index (LAI) under Changing Climate: Kadolkele Mangrove Forest, Sri Lanka. Adv. Meteorol. 2022, 2022, 9693303. [Google Scholar] [CrossRef]
  11. Hao, Q.; Song, Z.; Zhang, X.; He, D.; Guo, L.; van Zwieten, L.; Yu, C.; Wang, Y.; Wang, W.; Fang, Y.; et al. Organic Blue Carbon Sequestration in Vegetated Coastal Wetlands: Processes and Influencing Factors. Earth Sci. Rev. 2024, 255, 104853. [Google Scholar] [CrossRef]
  12. Kang, Y.; Kaplan, D.A.; Osland, M.J.; David Kaplan, C.A. Linking Temperature Sensitivity of Mangrove Communities, Populations and Individuals across a Tropical-Temperate Transitional Zone. J. Ecol. 2024, 112, 1256–1274. [Google Scholar] [CrossRef]
  13. Ramesh, M.; Swathy Krishna, P.S.; Amrutha Raj, V.; Sheela Nair, L. Coupled Coastal Monitoring Framework for the Analysis of Beach Stability and Nearshore Hydrodynamics of a Structure Influenced Medium Energy Coast in India. Ocean. Coast Manag. 2023, 239, 106619. [Google Scholar] [CrossRef]
  14. Lassalle, G.; Ferreira, M.P.; Cué La Rosa, L.E.; Del’Papa Moreira Scafutto, R.; de Souza Filho, C.R. Advances in Multi- and Hyperspectral Remote Sensing of Mangrove Species: A Synthesis and Study Case on Airborne and Multisource Spaceborne Imagery. ISPRS J. Photogramm. Remote Sens. 2023, 195, 298–312. [Google Scholar] [CrossRef]
  15. Rodríguez-Esparragón, D.; Marcello, J.; Eugenio, F.; Gamba, P. Index-Based Forest Degradation Mapping Using High and Medium Resolution Multispectral Sensors. Int. J. Digit. Earth 2024, 17, 2365981. [Google Scholar] [CrossRef]
  16. Paramanik, S.; Deep, N.R.; Dev Behera, M.; Kumar Bhattacharya, B.; Dash, J. Remote Sensing Letters Species-Level Classification of Mangrove Forest Using AVIRIS-NG Hyperspectral Imagery Species-Level Classification of Mangrove Forest Using AVIRIS-NG Hyperspectral Imagery. Remote. Sens. Lett. 2023, 14, 522–533. [Google Scholar] [CrossRef]
  17. Cavalli, R.M. Remote Data for Mapping and Monitoring Coastal Phenomena and Parameters: A Systematic Review. Remote Sens. 2024, 16, 446. [Google Scholar] [CrossRef]
  18. Evagorou, E.; Hasiotis, T.; Petsimeris, I.T.; Monioudi, I.N.; Andreadis, O.P.; Chatzipavlis, A.; Christofi, D.; Kountouri, J.; Stylianou, N.; Mettas, C.; et al. A Holistic High-Resolution Remote Sensing Approach for Mapping Coastal Geomorphology and Marine Habitats. Remote. Sens. 2025, 17, 1437. [Google Scholar] [CrossRef]
  19. Wu, Y.; Lu, C.; Wu, K.; Gao, W.; Yang, N.; Lin, J. Advancements and Trends in Mangrove Species Mapping Based on Remote Sensing: A Comprehensive Review and Knowledge Visualization. Glob. Ecol. Conserv. 2025, 57, e03408. [Google Scholar] [CrossRef]
  20. Ameca, E.I.; Nie, Y.; Wu, R.; Mittermeier, R.A.; Foden, W.; Wei, F. Identifying Protected Areas in Biodiversity Hotspots at Risk from Climate and Human-Induced Compound Events for Conserving Threatened Species. Sci. Total Environ. 2024, 938, 173192. [Google Scholar] [CrossRef] [PubMed]
  21. Valderrama-Landeros, L.; Troche-Souza, C.; Alcántara-Maya, J.A.; Velázquez-Salazar, S.; Vázquez-Balderas, B.; Villeda-Chávez, E.; Cruz-López, M.I.; Ressl, R.; Flores-Verdugo, F.; Flores-De-Santiago, F. An Assessment of Mangrove Forest in Northwestern Mexico Using the Google Earth Engine Cloud Computing Platform. PLoS ONE 2024, 19, e0315181. [Google Scholar] [CrossRef] [PubMed]
  22. Valderrama-Landeros, L.; Camacho-Cervantes, M.; Velázquez-Salazar, S.; Villeda-Chávez, E.; Flores-Verdugo, F.; Flores-de-Santiago, F. Detection of an Invasive Plant (Cissus verticillata) in the Largest Mangrove System on the Eastern Pacific Coast—A Remote Sensing Approach. Wetl. Ecol. Manag. 2025, 33, 13. [Google Scholar] [CrossRef]
  23. Berlanga-Robles, C.A. Trends in Mangrove Canopy and Cover in the Teacapan-Agua Brava Lagoon System (Marismas Nacionales) in Mexico: An Approach Using Open-Access Geospatial Data Mapping Mangrove Dynamics in Teacapan-Agua Brava. Wetlands 2025, 45, 1. [Google Scholar] [CrossRef]
  24. Blanco y Correa, M.; Flores-Verdugo, F.; Ortiz-Pérez, M.A.; de la Lanza-Espino, G.; López-Portillo, J.; Valdez-Hernández, I. Diagnostico Funcional de Marismas Nacionales; Universidad Autónoma de Nayarit and Secretaría de Medio Ambiente y Recursos Nautrales: Nayarit, Mexico, 2011. [Google Scholar]
  25. Serrano, D.; Flores-Verdugo, F.; Ramírez-Félix, E.; Kovacs, J.M.; Flores-de-Santiago, F. Modeling Tidal Hydrodynamic Changes Induced by the Opening of an Artificial Inlet within a Subtropical Mangrove Dominated Estuary. Wetl. Ecol. Manag. 2020, 28, 103–118. [Google Scholar] [CrossRef]
  26. Kovacs, J.M.; King, J.M.L.; Flores de Santiago, F.; Flores-Verdugo, F. Evaluating the Condition of a Mangrove Forest of the Mexican Pacific Based on an Estimated Leaf Area Index Mapping Approach. Environ. Monit. Assess. 2009, 157, 137–149. [Google Scholar] [CrossRef] [PubMed]
  27. Beselly, S.M.; Grueters, U.; van Der Wegen, M.; Reyns, J.; Dijkstra, J.; Roelvink, D. Modelling Mangrove-Mudflat Dynamics with a Coupled Individual-Based-Hydro-Morphodynamic Model. Environ. Model. Softw. 2023, 169, 105814. [Google Scholar] [CrossRef]
  28. Ochoa-Gómez, J.G.; Acosta-Velázquez, J.; Anguamea-Valenzuela, C.A.; Martinetto, P. Distribution and Structure of Conocarpus erectus L. (Combretaceae) in the Northern Limit of the Pacific Ocean (Gulf of California). Ocean Coast. Manag. 2021, 209, 105645. [Google Scholar] [CrossRef]
  29. Ferreira, A.C.; Freire, F.A.M.; Rodrigues, J.V.M.; Bezerra, L.E.A. Mangrove Recovery in Semiarid Coast Shows Increase of Ecological Processes from Biotic and Abiotic Drivers in Response to Hydrological Restoration. Wetlands 2022, 42, 80. [Google Scholar] [CrossRef]
  30. Hernández-Guzmán, R.; Ruiz-Luna, A. Combining Multisensor Images and Social Network Data to Assess the Area Flooded by a Hurricane Event. PeerJ 2024, 12, e17319. [Google Scholar] [CrossRef] [PubMed]
  31. Fu, B.; Zhang, S.; Li, H.; Yao, H.; Sun, W.; Jia, M.; Yang, Y.; He, H.; Li, Y. Exploring the Effects of Different Combination Ratios of Multi-Source Remote Sensing Images on Mangrove Communities Classification. Int. J. Appl. Earth Obs. Geoinf. 2024, 134, 104197. [Google Scholar] [CrossRef]
  32. Gorelick, N.; Hancher, M.; Dixon, M.; Ilyushchenko, S.; Thau, D.; Moore, R. Google Earth Engine: Planetary-Scale Geospatial Analysis for Everyone. Remote Sens. Environ. 2017, 202, 18–27. [Google Scholar] [CrossRef]
  33. Gupta, K.; Mukhopadhyay, A.; Giri, S.; Chanda, A.; Datta Majumdar, S.; Samanta, S.; Mitra, D.; Samal, R.N.; Pattnaik, A.K.; Hazra, S. An Index for Discrimination of Mangroves from Non-Mangroves Using LANDSAT 8 OLI Imagery. MethodsX 2018, 5, 1129–1139. [Google Scholar] [CrossRef] [PubMed]
  34. Chen, C.; Wu, W.; Fan, X.; Zhou, C.; Cui, T.; Wu, T.; Zhao, Q.; Jia, M. Linkage Analysis Between Coastline Change and Both Sides of Coastal Ecological Spaces. Water 2025, 17, 1505. [Google Scholar] [CrossRef]
  35. Sokal, R.R.; Rohlf, F.J. Biometry: The Principles and Practice of Statistics in Biological Research, 3rd ed.; W.H. Freeman and Co.: New York, NY, USA, 1995. [Google Scholar]
  36. Panuntun, I.A.; Jamaluddin, I.; Chen, Y.N.; Lai, S.N.; Fan, K.C. LinkNet-Spectral-Spatial-Temporal Transformer Based on Few-Shot Learning for Mangrove Loss Detection with Small Dataset. Remote. Sens. 2024, 16, 1078. [Google Scholar] [CrossRef]
  37. Simard, M.; Fatoyinbo, L.; Thomas, N.M.; Stovall, A.E.; Parra, A.; Barenblitt, A.; Bunting, P.; Hajnsek, I. New Global Mangrove Height Map with a 12 Meter Spatial Resolution. Sci. Data 2025, 12, 15. [Google Scholar] [CrossRef] [PubMed]
  38. Prodanov, B.; Gussev, C.; Sopotlieva, D.; Valcheva, M.; Bekova, R.; Baltakova, A.; Tzonev, R.; Popov, J. A Standard Procedure for Dune Mapping along the Bulgarian Black Sea Coast: An Integrated Approach Combining UAS Photogrammetry, Geomorphological and Phytocoenological Surveys. Front. Mar. Sci. 2025, 12, 1579724. [Google Scholar] [CrossRef]
  39. Price, C.A.; Papeş, M.; Sgouralis, I.; Schroeder, T.A. Surface Area to Volume Scaling of Alpha Shapes and Convex Hulls Fit to Lidar Derived Mangrove Island Point Clouds. Remote Sens. Lett. 2024, 15, 1259–1269. [Google Scholar] [CrossRef]
  40. Jarahizadeh, S.; Salehi, B. A Comparative Analysis of UAV Photogrammetric Software Performance for Forest 3D Modeling: A Case Study Using AgiSoft Photoscan, PIX4DMapper, and DJI Terra. Sensors 2024, 24, 286. [Google Scholar] [CrossRef] [PubMed]
  41. Rubio-Cisneros, N.T.; Aburto-Oropeza, O.; Jackson, J.; Ezcurra, E. Coastal Exploitation throughout Marismas Nacionales Wetlands in Northwest Mexico. Trop. Conserv. Sci. 2017, 10, 1940082917697261. [Google Scholar] [CrossRef]
  42. Castañeda-Moya, E.; Twilley, R.R.; Rivera-Monroy, V.H.; Zhang, K.; Davis, S.E.; Ross, M. Sediment and Nutrient Deposition Associated with Hurricane Wilma in Mangroves of the Florida Coastal Everglades. Estuaries Coasts 2010, 33, 45–58. [Google Scholar] [CrossRef]
  43. Liang, X.; Dai, Z.; Mei, X.; Wang, R.; Zeng, W.; Fagherazzi, S. Hurricanes Induced Irreversible Large-Scale Loss of Mangrove Forests. Geophys. Res. Lett. 2025, 52, e2025GL115692. [Google Scholar] [CrossRef]
  44. Lewis, J.P.; Giery, S.T.; Rossin, K.A.; Rossin, K.A.; Cissell, J.R.; Steinberg, M.K.; Sanchez, N.L.; Adams, A.J.; Layman, C.A.; Lewis, J.P.; et al. Community-Based Mangrove Restoration Following a Catastrophic Hurricane in The Bahamas. Wetl. Ecol. Manag. 2025, 33, 46. [Google Scholar] [CrossRef]
  45. Walcker, R.; Herteman, M.; Lambs, L. Damages Caused by Hurricane Irma in the Human-Degraded Mangroves of Saint Martin (Caribbean). Sci. Rep. 2018, 9, 18971. [Google Scholar] [CrossRef]
  46. Howe, J.; Merchant, S.; Hern Andez, W.J.; Pessutti, J.; Groffman, P. Assessing Mangrove Canopy Height and Health Changes in Puerto Rico Post-Hurricane Maria Using Remote-Sensing Techniques. Ecosphere 2025, 16, e70226. [Google Scholar] [CrossRef]
  47. Baldwin, A.; Egnotovich, M.; Ford, M.; Platt, W. Regeneration in fringe mangrove forests damaged by Hurricane Andrew. Plant Ecol. 2001, 157, 151–164. [Google Scholar] [CrossRef]
  48. Krauss, K.W.; Osland, M.J. Tropical Cyclones and the Organization of Mangrove Forests: A Review. Ann. Bot. 2020, 125, 213–234. [Google Scholar] [CrossRef] [PubMed]
  49. Hersbach, H. The ERA5 Atmospheric Reanalysis. In Proceedings of the AGU Fall Meeting Abstracts; American Geophysical Union: Washington, DC, USA, 2016; Volume 2016. [Google Scholar]
  50. Potisomporn, P.; Adcock, T.A.A.; Vogel, C.R. Evaluating ERA5 Reanalysis Predictions of Low Wind Speed Events around the UK. Energy Rep. 2023, 10, 4781–4790. [Google Scholar] [CrossRef]
  51. Langousis, A.; Mamalakis, A.; Puliga, M.; Deidda, R. Threshold Detection for the Generalized Pareto Distribution: Review of Representative Methods and Application to the NOAA NCDC Daily Rainfall Database. Water Resour. Res. 2016, 52, 2659–2681. [Google Scholar] [CrossRef]
  52. Shih, S.S.; Huang, Z.Z.; Hsu, Y.W. Nature-Based Solutions on Floodplain Restoration with Coupled Propagule Dispersal Simulation and Stepping-Stone Approach to Predict Mangrove Encroachment in an Estuary. Sci. Total Environ. 2022, 851, 158097. [Google Scholar] [CrossRef] [PubMed]
  53. Pranchai, A.; Jenke, M.; Thongmee, J.; Sutthinon, P.; Karuna, S.; Wongkamhaeng, K.; Berger, U. Artificial Macropores Enhance Mangrove Establishment in Hypersaline Environments. Restor. Ecol. 2025, 33, e70015. [Google Scholar] [CrossRef]
  54. Flores-de-Santiago, F.; Rodríguez-Sobreyra, R.; Álvarez-Sánchez, L.F.; Valderrama-Landeros, L.; Amezcua, F.; Flores-Verdugo, F. Understanding the Natural Expansion of White Mangrove (Laguncularia racemosa) in an Ephemeral Inlet Based on Geomorphological Analysis and Remote Sensing Data. J. Environ. Manage. 2023, 338, 117820. [Google Scholar] [CrossRef] [PubMed]
  55. Tysiąc, P.; Moskalewicz, D. Janowski Development of UAV-Based LiDAR and Multispectral Measurement Techniques for Monitoring Sediment Intrusion in Coastal Wetlands. Measurement 2025, 253, 117459. [Google Scholar] [CrossRef]
  56. Kovacs, J.M.; Liu, Y.; Zhang, C.; Flores-Verdugo, F.; de Santiago, F.F. A Field Based Statistical Approach for Validating a Remotely Sensed Mangrove Forest Classification Scheme. Wetl. Ecol. Manag. 2011, 19, 409–421. [Google Scholar] [CrossRef]
  57. Rivera-Trejo, F.; Radecki-Pawlik, A.; Filipczyk, J.; Priego-Hernandez, G.; Soto-Cortes, G. On Predicting of Some Consequences of Planned Dam Construction in a Pristine Sand-Gravel River Large Catchment: Rio San Pedro, Nayarit, Northwest Mexico. Ecol. Eng. 2022, 184, 106785. [Google Scholar] [CrossRef]
  58. Rodríguez-Sobreyra, R.; Valderrama-Landeros, L.; Flores-Verdugo, F.; Green-Ruiz, C.; Flores-de-Santiago, F. The Influence of Hydrological Variability, Geomorphology, and Salinity Determines the Allocation of Two Dominant Fringe Mangrove Species in Semiarid Coastal Systems. Discov. Conserv. 2025, 2, 10. [Google Scholar] [CrossRef]
  59. Wei, S.; Zhang, H.; Ling, J. A Review of Mangrove Degradation Assessment Using Remote Sensing: Advances, Challenges, and Opportunities. IScience Remote. Sens. 2025, 62, 2491920. [Google Scholar] [CrossRef]
  60. Minh, P.; Id, H.; Tinh, H.; Son, N.P.; Van Thuy, T.; Thi, N.; Hanh, H.; Sharma, S.; Hoai, D.T.; Duy, V.C. Mangrove Health Assessment Using Spatial Metrics and Multi-Temporal Remote Sensing Data. PLoS ONE 2022, 17, e0275928. [Google Scholar] [CrossRef]
  61. Doyle, T.W.; Smith, T.J.I.; Robblee, M.B. Wind Damage Effects of Hurricane Andrew on Mangrove Communities along the Southwest Coast of Florida, USA. J. Coast Res. 1995, 21, 159–168. [Google Scholar]
  62. Murray, M.R.; Zisman, S.A.; Furley, P.A.; Munro, D.M.; Gibson, J.; Ratter, J.; Bridgewater, S.; Minty, C.D.; Place, C.J. The Mangroves of Belize Part 1. Distribution, Composition and Classification. For. Ecol. Manage. 2003, 174, 265–279. [Google Scholar] [CrossRef]
  63. Rivera-Monroy, V.H.; Danielson, T.M.; Castañeda-Moya, E.; Marx, B.D.; Travieso, R.; Zhao, X.; Gaiser, E.E.; Farfan, L.M. Long-Term Demography and Stem Productivity of Everglades Mangrove Forests (Florida, USA): Resistance to Hurricane Disturbance. For. Ecol. Manage. 2019, 440, 79–91. [Google Scholar] [CrossRef]
  64. Vizcaya-Martínez, D.A.; Flores-de-Santiago, F.; Valderrama-Landeros, L.; Serrano, D.; Rodríguez-Sobreyra, R.; Álvarez-Sánchez, L.F.; Flores-Verdugo, F. Monitoring Detailed Mangrove Hurricane Damage and Early Recovery Using Multisource Remote Sensing Data. J. Environ. Manag. 2022, 320, 115830. [Google Scholar] [CrossRef] [PubMed]
  65. Peralta-Carreta, C.; Medrano-Pérez, O.R.; Alcudia-Aguilar, A.; Pham, Q.B.; Megia-Vera, H.J. Spatial Distribution of Relict Inland Mangrove (Rhizophora mangle L.) in the San Pedro River Basin: A Transboundary Analysis between Mexico and Guatemala. Estuaries Coasts 2025, 48, 59. [Google Scholar] [CrossRef]
  66. Cahoon, D.R.; Hensel, P.; Rybczyk, J.; McKee, K.L.; Proffitt, C.E.; Perez, B.C. Mass Tree Mortality Leads to Mangrove Peat Collapse at Bay Islands, Honduras after Hurricane Mitch. J. Ecol. 2003, 91, 1093–1105. [Google Scholar] [CrossRef]
  67. Yu, M.; Gao, Q. Drought, Topographic Depression, and Severe Damage Slowed Down and Differentiated Recovery of Mangrove Forests from Major Hurricane Disturbance. Remote. Sens. 2025, 17, 2223. [Google Scholar] [CrossRef]
  68. Xu, Y.; Qin, Y.; Li, B.; Li, J. Estimating Vegetation Aboveground Biomass in Yellow River Delta Coastal Wetlands Using Sentinel-1, Sentinel-2 and Landsat-8 Imagery. Ecol. Inform. 2025, 87, 103096. [Google Scholar] [CrossRef]
  69. McKee, K.L.; Cherry, J.A. Hurricane Katrina Sediment Slowed Elevation Loss in Subsiding Brackish Marshes of the Mississippi River Delta. Wetlands 2009, 29, 2–15. [Google Scholar] [CrossRef]
  70. Kovacs, J.M.; Wang, J.; Flores-Verdugo, F. Mapping Mangrove Leaf Area Index at the Species Level Using IKONOS and LAI-2000 Sensors for the Agua Brava Lagoon, Mexican Pacific. Estuar. Coast Shelf. Sci. 2005, 62, 377–384. [Google Scholar] [CrossRef]
  71. Valderrama-Landeros, L.; Flores-de-Santiago, F.; Kovacs, J.M.; Flores-Verdugo, F. An Assessment of Commonly Employed Satellite-Based Remote Sensors for Mapping Mangrove Species in Mexico Using an NDVI-Based Classification Scheme. Environ. Monit Assess 2018, 190, 23. [Google Scholar] [CrossRef] [PubMed]
  72. Bhatia, K.; Baker, A.; Yang, W.; Vecchi, G.; Knutson, T.; Murakami, H.; Kossin, J.; Hodges, K.; Dixon, K.; Bronselaer, B.; et al. A Potential Explanation for the Global Increase in Tropical Cyclone Rapid Intensification. Nat. Commun. 2022, 13, 6626. [Google Scholar] [CrossRef] [PubMed]
  73. Ozigis, M.; Ogundipe, O.; Valman, S.J.; Decker Sparks, J.L.; McCabe, H.; Yore, R.; Jackson, B. Utility of Earth Observation Data in Mapping Post-Disaster Impact: A Case of Hurricane Dorian in the Bahamas. Remote. Sens. Appl. 2025, 37, 101466. [Google Scholar] [CrossRef]
  74. Lovelock, C.E.; Cahoon, D.R.; Friess, D.A.; Guntenspergen, G.R.; Krauss, K.W.; Reef, R.; Rogers, K.; Saunders, M.L.; Sidik, F.; Swales, A.; et al. The Vulnerability of Indo-Pacific Mangrove Forests to Sea-Level Rise. Nature 2015, 526, 559–563. [Google Scholar] [CrossRef] [PubMed]
Figure 1. (a) Location of the Marismas Nacionales wetland complex on the northwestern coast of Mexico. The basemap shows a digital elevation model (m) derived from freely available TOPEX data https://topex.ucsd.edu/index.html (accessed on 18 July 2025). (b) Hurricane Roslyn’s approach vector with the corresponding Saffir–Simpson Hurricane Scale at the south section of Marismas Nacionales. The green circles show the position of the field photograph stations. The yellow triangle and square indicate the locations of representative field photographs, showing examples of Laguncularia racemosa (c) and Rhizophora mangle (d) monospecific forests after hurricane landfall.
Forests 16 01207 g001
Figure 3. Rainfall time series at Marismas Nacionales from the ERA5 (a) and NOAA (b) datasets. Wind speed and direction time series from the ERA5 (c) and MERRA2 (d) datasets. The two black rectangles indicate a visual enhancement during the hurricane impact.
Forests 16 01207 g003
Figure 4. Enhanced near-infrared, red, and green band composites of Sentinel-2 imagery at Marismas Nacionales, before impact (17 October 2022) (a) and after impact (27 October 2022) (b). The green and yellow circles indicate the location of the lower subfigures in monospecific Laguncularia racemosa (before impact (c) and after impact (d)) and Rhizophora mangle forests (before impact (e) and after impact (f)).
Forests 16 01207 g004
Figure 5. Thematic classifications of CMRI standard deviations from January to June for 2020 (a), 2021 (b), 2022 (c), 2023 (d), 2024 (e), and 2025 (f).
Forests 16 01207 g005
Figure 6. Areas (hectares) of pixels classified according to CMRI standard deviations for 2020 (a), 2021 (b), 2022 (c), 2023 (d), 2024 (e), and 2025 (f).
Forests 16 01207 g006
Figure 7. CMRI slope trend following the impact of Hurricane Roslyn (a). Symbols indicate representative forests in the CMRI time series: Agua Brava Lagoon (b), L. racemosa degraded (c), R. mangle (d), San Pedro River (e). The orange arrow indicates the date of the hurricane’s impact.
Forests 16 01207 g007
Figure 8. The upper map presents the canopy height model (CHM) of the Marismas Nacionales mangrove forest for the year 2015 (a), derived from TanDEM-X data provided by Simard [37]. The two polygons delineate the locations of representative flight zones adjacent to the Acaponeta River. The left side illustrates a mangrove zone exhibiting gaps in the canopy prior to the impact of the hurricane, whereas the right side features a monospecific mangrove forest. The two image subsets at the bottom depict the 2015 (pre-impact) CHMs (b,c), the 2023 (post-impact) CHMs (d,e), and an angular representation of the dense LiDAR point cloud collected in 2023 (f,g).
Forests 16 01207 g008
Disclaimer/Publisher’s Note: The statements, opinions and data contained in all publications are solely those of the individual author(s) and contributor(s) and not of MDPI and/or the editor(s). MDPI and/or the editor(s) disclaim responsibility for any injury to people or property resulting from any ideas, methods, instructions or products referred to in the content.

