Article

Shading Effects on the Growth and Physiology of Endangered Hopea hainanensis Merr. & Chun Seedlings

1
Hainan Academy of Forestry (Hainan Academy of Manyrove), Haikou 571100, China
2
The Innovation Platform for Academicians of Hainan Province, Haikou 571100, China
3
Key Laboratory of Tropical Forestry Resources Monitoring and Application of Hainan Province, Haikou 571100, China
4
Research Institute of Forest Resource Information Techniques, Chinese Academy of Forestry, Beijing 100091, China
*
Author to whom correspondence should be addressed.
Forests 2025, 16(7), 1193; https://doi.org/10.3390/f16071193
Submission received: 18 June 2025 / Revised: 11 July 2025 / Accepted: 16 July 2025 / Published: 19 July 2025
(This article belongs to the Special Issue Physiological Mechanisms of Plant Responses to Environmental Stress)

Abstract

To determine optimal light conditions for Hopea hainanensis Merr. & Chun seedling growth, this study examined growth and physiological parameters under four shading treatments (0%, 30%, 60%, and 90% irradiance reduction) over 12 months. Shading significantly affected the growth adaptability of seedlings. As shading increased, height, leaf traits (area, length, width), and light saturation point all initially increased, peaked at 30% shading, and then decreased. Conversely, basal diameter, leaf thickness, the maximum net photosynthetic rate, net photosynthetic rate, photosynthetic quantum efficiency, transpiration rate, and stomatal conductance progressively declined as shading increased. Biomass accumulation (in stems and roots), dark respiration rate, and light compensation point exhibited a U-shaped response to shading, being minimized under low or moderate shading. All shading treatments significantly reduced biomass and photosynthetic performance compared to controls. Multivariate analysis identified 0%–30% shading as optimal for cultivation, with 30% shading enhancing photomorphogenic responses while maintaining photosynthetic efficiency. The study findings suggest a novel seedling cultivation protocol for nursery use, in which initial establishment occurs under 30% shading to maximize vertical elongation, followed by the progressive reduction in shading to stimulate radial growth and optimal biomass partitioning. This approach mimics natural canopy gap dynamics, effectively mimicking natural regeneration in tropical rainforest ecosystems.

1. Introduction

Light serves a dual role in plant physiology, acting as both the primary energy source for metabolic processes (via photosynthesis) and as a pivotal regulator of plant processes, such as plant development, growth, metabolism, and morphogenesis, which function to enhance environmental acclimatization [1,2]. Light stress in plants manifests differently across the light intensity gradient, with excessive irradiance inducing photoinhibition through the structural degradation of photosynthetic complexes [3,4]; by contrast, low light levels constrain photosynthetic carbon assimilation, potentially leading to mortality when chronic [5]. Thus, variation in light intensity drives the evolutionary optimization of light-harvesting strategies across plant taxa. In high-light regimes, plants employ chlorophyll catabolism, non-photochemical quenching, and stomatal closure to maintain photosynthetic efficiency [6,7]. Conversely, low-light acclimation involves enhanced carboxylation capacity, photosynthetic pigment optimization, and strategic photon allocation [8,9], as demonstrated in Castanopsis hystrix Hook. f. & Thomson ex A. DC. and Quercus mongolica Fisch. ex Ledeb. seedlings under shaded conditions [10,11]. Chlorophyll fluorescence analysis can provide critical insights into these photoadaptive processes, enabling the real-time quantification of excitation energy partitioning dynamics, photosystem II (PSII) operational efficiency, and thylakoid membrane integrity across environmental gradients [12,13].
Light management is critical for seedling production systems, where improper shading (including excessive or insufficient coverage) may compromise photosynthetic efficiency and thereby seedling vigor through three principal pathways: (1) the suppression of carbon assimilation enzymes, (2) the disruption of photosynthate translocation dynamics, and (3) reductions in net primary productivity [14]. Over-shading induces chronic energy deprivation when below the subcompensation point, precipitating the depletion of carbohydrate reserves and eventual growth retardation [15], as observed in severely shaded Chamaecyparis obtusa (Siebold & Zucc.) Endl. and Lespedeza buergeri Miq. seedlings [16,17]. Conversely, excessive solar exposure triggers photooxidative stress, characterized by the degradation of ROS-mediated PSII core proteins (D1 subunit) and the depletion of non-structural carbohydrates; this ultimately leads to foliar necrosis and seedling growth inhibition [18,19]. Therefore, optimal lighting regimes support photomorphogenic optimization, whereby photon use efficiency is maximized via changes to chloroplast positioning, the photosynthetic apparatus, and stomatal conductance. By strategically regulating light levels, photosynthetic plasticity is maintained while preventing photodamage, allowing for efficient seedling production [20,21], as evidenced in Pterocarpus indicus Willd., Pinus halepensis Mill. and Quercus ilex L. [5,22].
The seedling phase represents a critical developmental window marked by heightened environmental sensitivity, during which photomorphogenic responses determine establishment success [23,24]. Seedling survival is a key demographic bottleneck in plant population dynamics, directly mediating population recruitment rates and indirectly shaping forest community assembly through species sorting mechanisms [25,26]. Light intensity gradients can regulate seedling performance through three pathways: biomass partitioning, photosynthetic acclimation, and stress mitigation. Experimental studies employing controlled shading treatments have demonstrated that moderate shading (30%–50% reduction in irradiance) enhances carbon allocation efficiency in Hernandia nymphaeifolia (C. Presl) Kubitzki [27] and Populus qiongdaoensis T. Hong & P. Luo [28], while elevating PSII photochemical efficiency in Michelia chapensis Dandy [29]. Similarly, many ecophysiological traits are optimized in Acanthus ilicifolius L. under partial shading, with these effects mediated through changes to stomata and non-structural carbohydrate reallocation [30]. Conversely, irradiance exceeding species-specific tolerance thresholds induces chronic photodamage, as manifested by D1 protein turnover imbalances and ROS-mediated membrane peroxidation [17,31]. Elucidating species-specific photoadaptive strategies should therefore provide critical insights for forest restoration efforts and climate-resilient silviculture.
Hopea hainanensis Merr. & Chun (Dipterocarpaceae), a canopy-emergent dipterocarp endemic to the disjunct tropical forests of Hainan Island (China) and northern Vietnam, represents a flagship species for Asian tropical rainforest conservation [32]. Its timber ranks among Hainan’s premium hardwoods, distinguished by exceptional flood tolerance, natural decay resistance, and specific gravity, all properties conferring superior durability in marine applications [33]. Intensive logging since the 1970s has precipitated catastrophic population declines in H. hainanensis, reducing this once-dominant forest species to a few fragmented subpopulations [34]. Consequently, H. hainanensis is recognized as Endangered (EN) by the IUCN and holds Category I status (nationally protected) under China’s Biodiversity Conservation Strategy, with extant wild individuals estimated to number below 2500 mature specimens [35]. Given the ecological and economic significance of H. hainanensis and the severe threat to its survival, understanding its seedling photobiology is crucial for developing effective integrated conservation measures (combining ex situ propagation, habitat corridor restoration, and community-based protection initiatives), thereby benefiting both scientific understanding and practical conservation efforts for this endangered species and similar threatened flora, such as Horsfieldia hainanensis Merr. [36].
Field surveys of H. hainanensis populations have revealed a severe recruitment bottleneck. Although seedling banks exist beneath maternal trees, the transition from seedling to sapling has less than a 5% success rate [37]. This demographic constraint likely stems from two synergistic effects: (1) transient recruitment pulses following mast fruiting events and (2) competitive exclusion during the establishment phase. While the high fecundity of H. hainanensis trees ensures the establishment of an initial seedling cohort, seedling survival is compromised by light competition in the understory and edaphic stressors. Notably, H. hainanensis exhibits an ontogenetic shift in light requirements, with the light compensation point increasing by 300% from the seedling to sapling stage. This physiological transition conflicts with conditions in the tropical rainforest understory, where photosynthetically active radiation (PAR) rarely exceeds 2% of canopy-level irradiance [38,39]. Light limitation, therefore, likely constitutes the primary filter constraining natural H. hainanensis regeneration, making it an ideal model species to investigate seedling shade tolerance mechanisms critical for its conservation. Research to date on H. hainanensis has focused on its population genetics [33,40,41], reproductive ecology [32,35,42], and silvicultural propagation [43,44]; however, shade tolerance in seedlings remains underexplored.
Based on the observed ontogenetic shift in light requirements and the critical bottleneck at the seedling–sapling transition under low light, we hypothesize that H. hainanensis seedlings exhibit a specific, quantifiable optimal range of shading intensity that maximizes their growth and photosynthetic efficiency, distinct from both deep shade and full sunlight conditions. To test these hypotheses, in this study, controlled shading experiments were conducted to simulate a natural light gradient. The study systematically evaluated the following: (1) allometric responses to shading intensity (i.e., biomass partitioning and the leaf area ratio); (2) acclimation in photosynthetic efficiency (i.e., chlorophyll fluorescence and light response curves); and (3) optimal growth irradiance thresholds. The study findings will support the development of evidence-based protocols for enrichment planting and habitat restoration, particularly in degraded rainforest ecosystems requiring assisted natural regeneration.

2. Materials and Methods
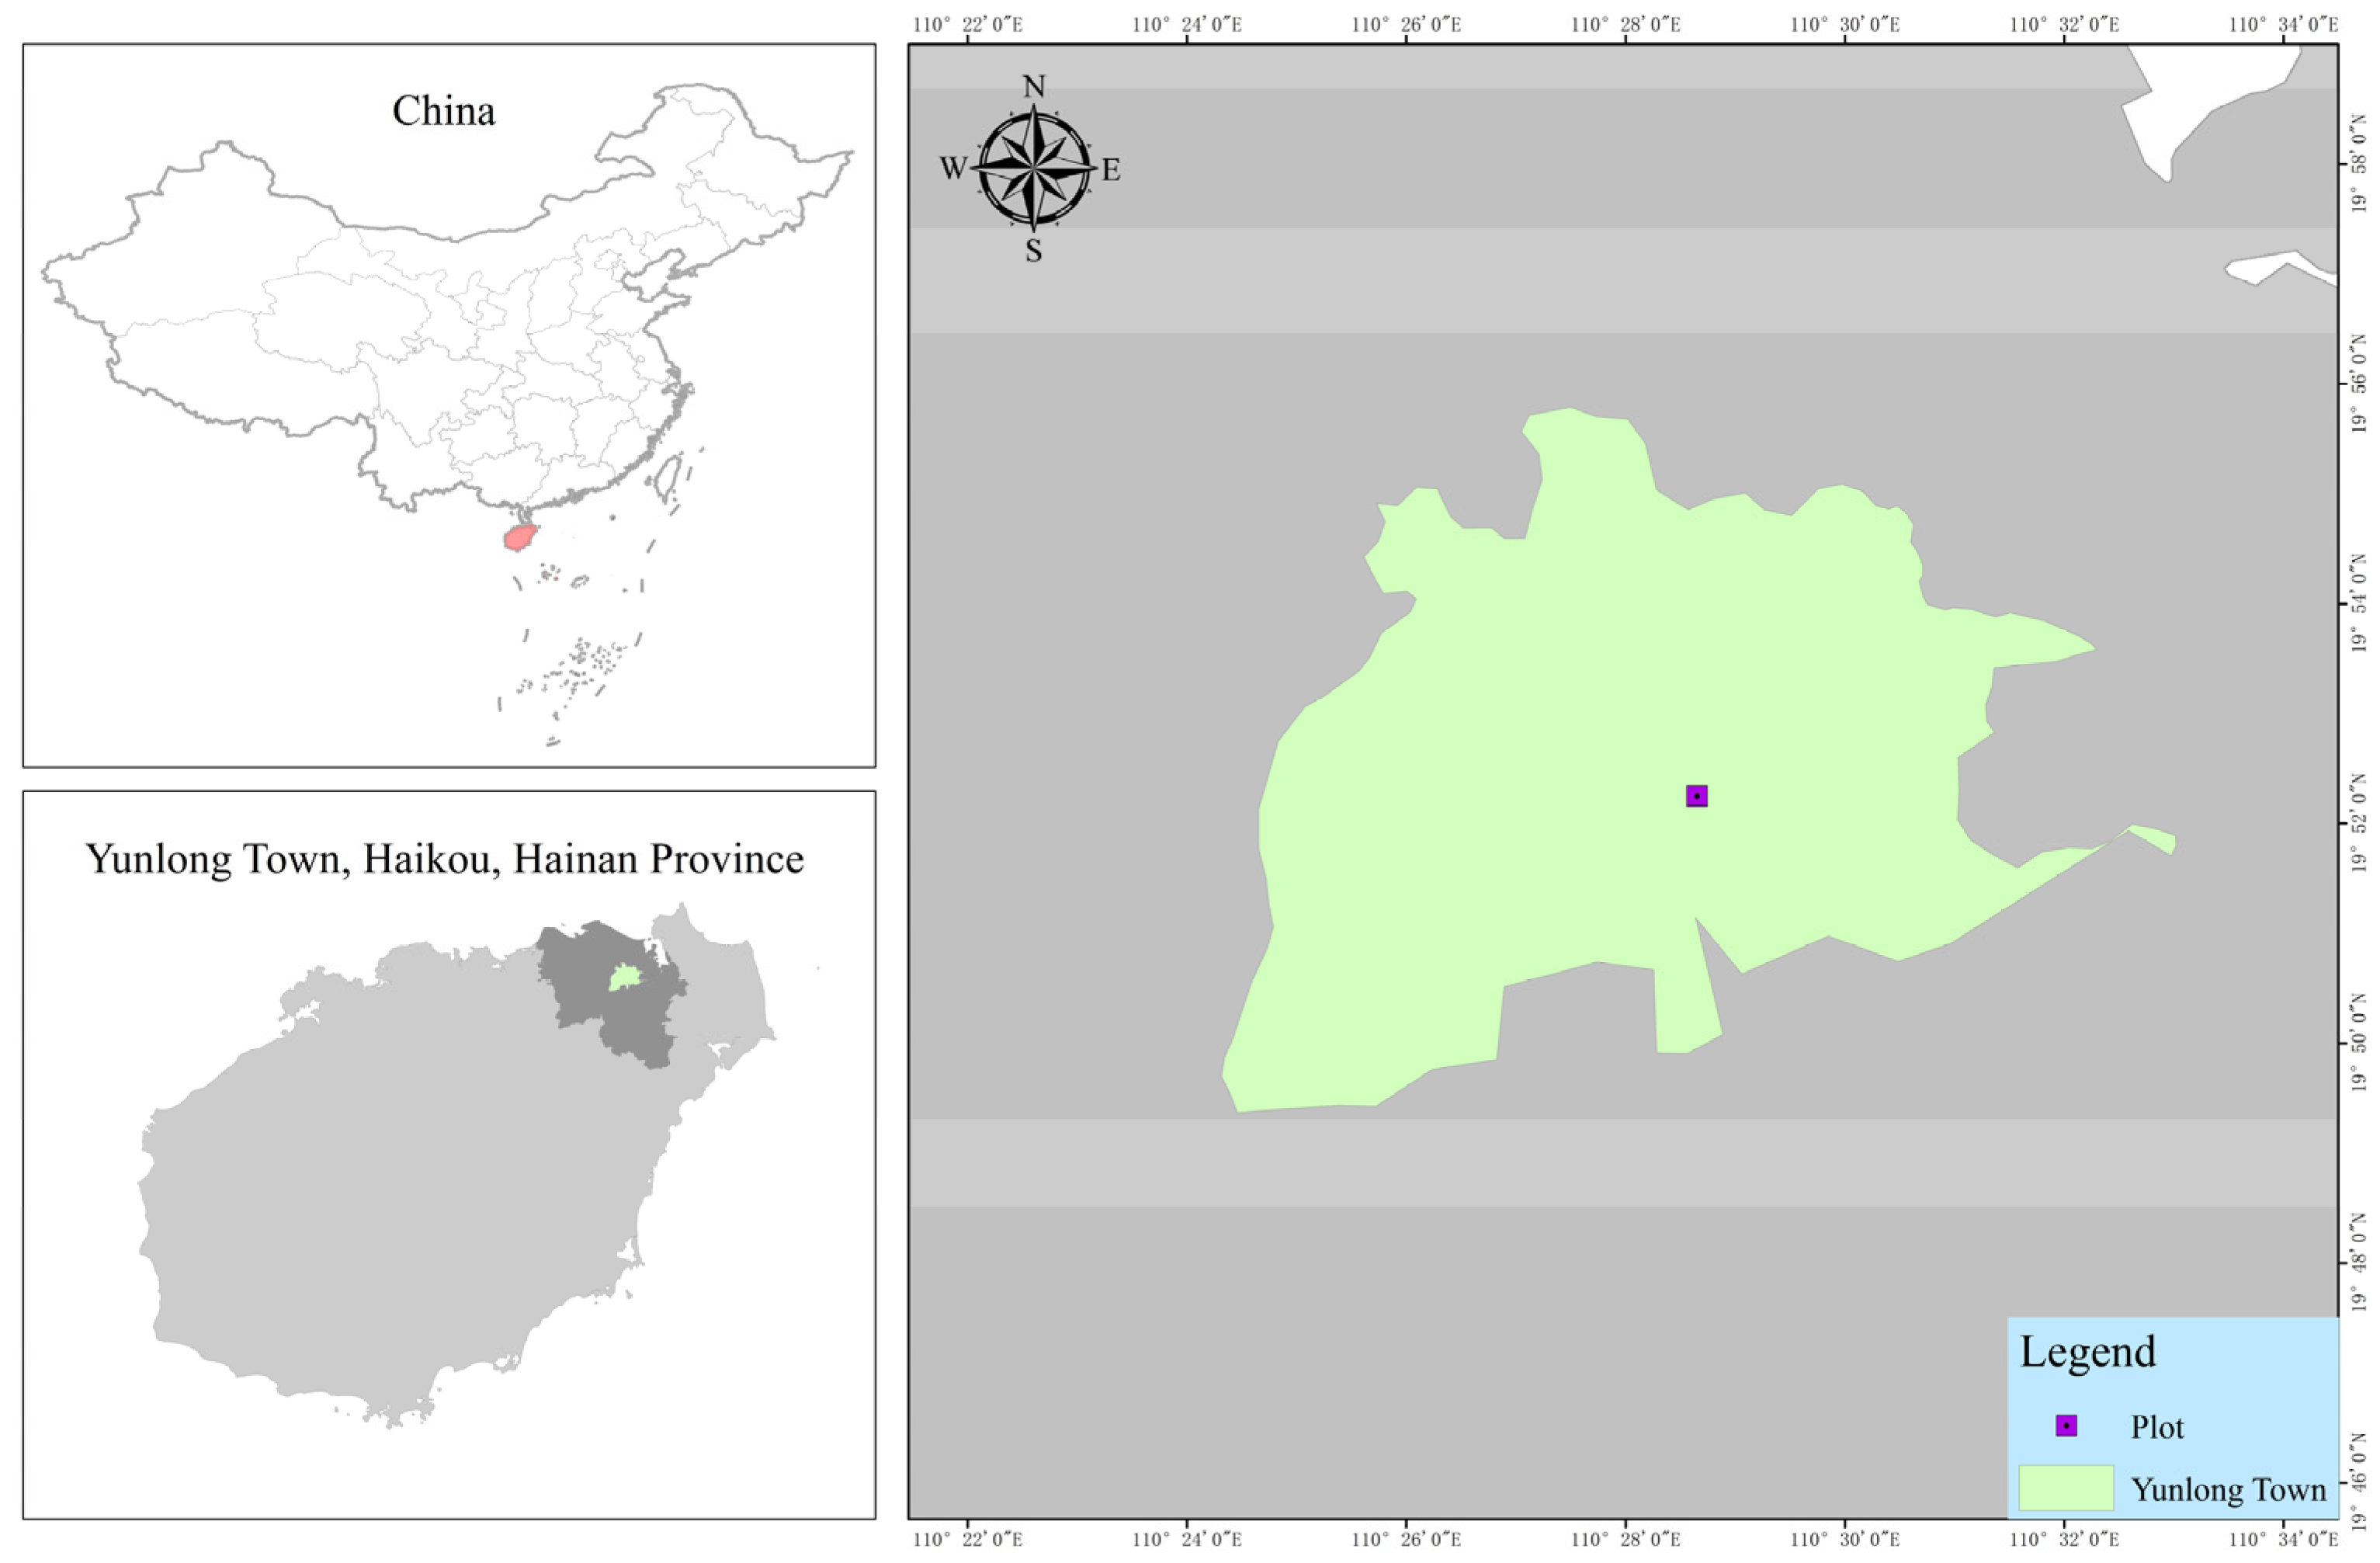
2.1. Study Area

This study was conducted within the experimental nursery of the Hainan Academy of Forestry (Hainan Academy of Mangrove), located in Yunlong Town, Haikou City, Hainan Province, China (19°52′23″ N, 110°28′06″ E). This region experiences a tropical maritime climate and warm temperatures (mean annual: 24.9 °C), with summer maxima exceeding 30 °C and winter minima averaging 20 °C (Figure 1). Annual precipitation ranges from 1500 to 2000 mm and predominantly occurs during the summer-to-autumn monsoon season. The study site receives >2000 annual sunshine hours with continuously high solar irradiance, as characteristic of coastal tropical environments [28].

2.2. Methods

2.2.1. Plant Materials

Hopea hainanensis Merr. & Chun seeds were collected from primary forest stands within the Hainan Bawangling National Nature Reserve (19°07′ N, 109°12′ E) in April 2020 and transported to the nursery for controlled propagation. Following a 24-month nursery cultivation period, in May 2022, uniformly developed container-grown seedlings exhibiting vigorous growth and no visible phytopathological symptoms were selected for use in the study experiment. Seedlings were transplanted to experimental plots with 1.5 × 1.5 m spacing; plots were preestablished within a leveled experimental field. The field consisted of lateritic soils with the following initial nutrient concentrations: total N 5.53 mg/g, total P 6.20 mg/g, and total K 14.36 mg/g.

2.2.2. Experimental Design

In June 2022, black polyethylene shade nets (Lvandi, Greenland Shade Co., Taizhou, China) were installed in the experimental nursery, suspended 2.0 m above the ground to maintain optimal aeration. Four light intensity treatments were established based on net transmittance, calibrated using a LI-COR LI-190SA quantum sensor (LI-COR Biosciences, Lincoln, NE, USA): T0 (full sunlight, 0% shading with 100% PAR transmittance), T1 (light shading, 30% shading via 70% transmittance nets), T2 (moderate shading, 60% shading with 40% transmittance), and T3 (heavy shading, 90% shading with 10% transmittance). Each treatment was arranged in a randomized block design with three biological replicates, each containing five H. hainanensis seedlings (n = 60 total). Seedlings were positioned under corresponding nets with 50 cm spacing to minimize canopy interference. Irrigation was standardized via drip systems to maintain soil moisture at 60%–70% field capacity. Shade net integrity and light transmittance were verified biweekly using the quantum sensor to ensure treatment accuracy throughout the experiment.

2.2.3. Data Collection

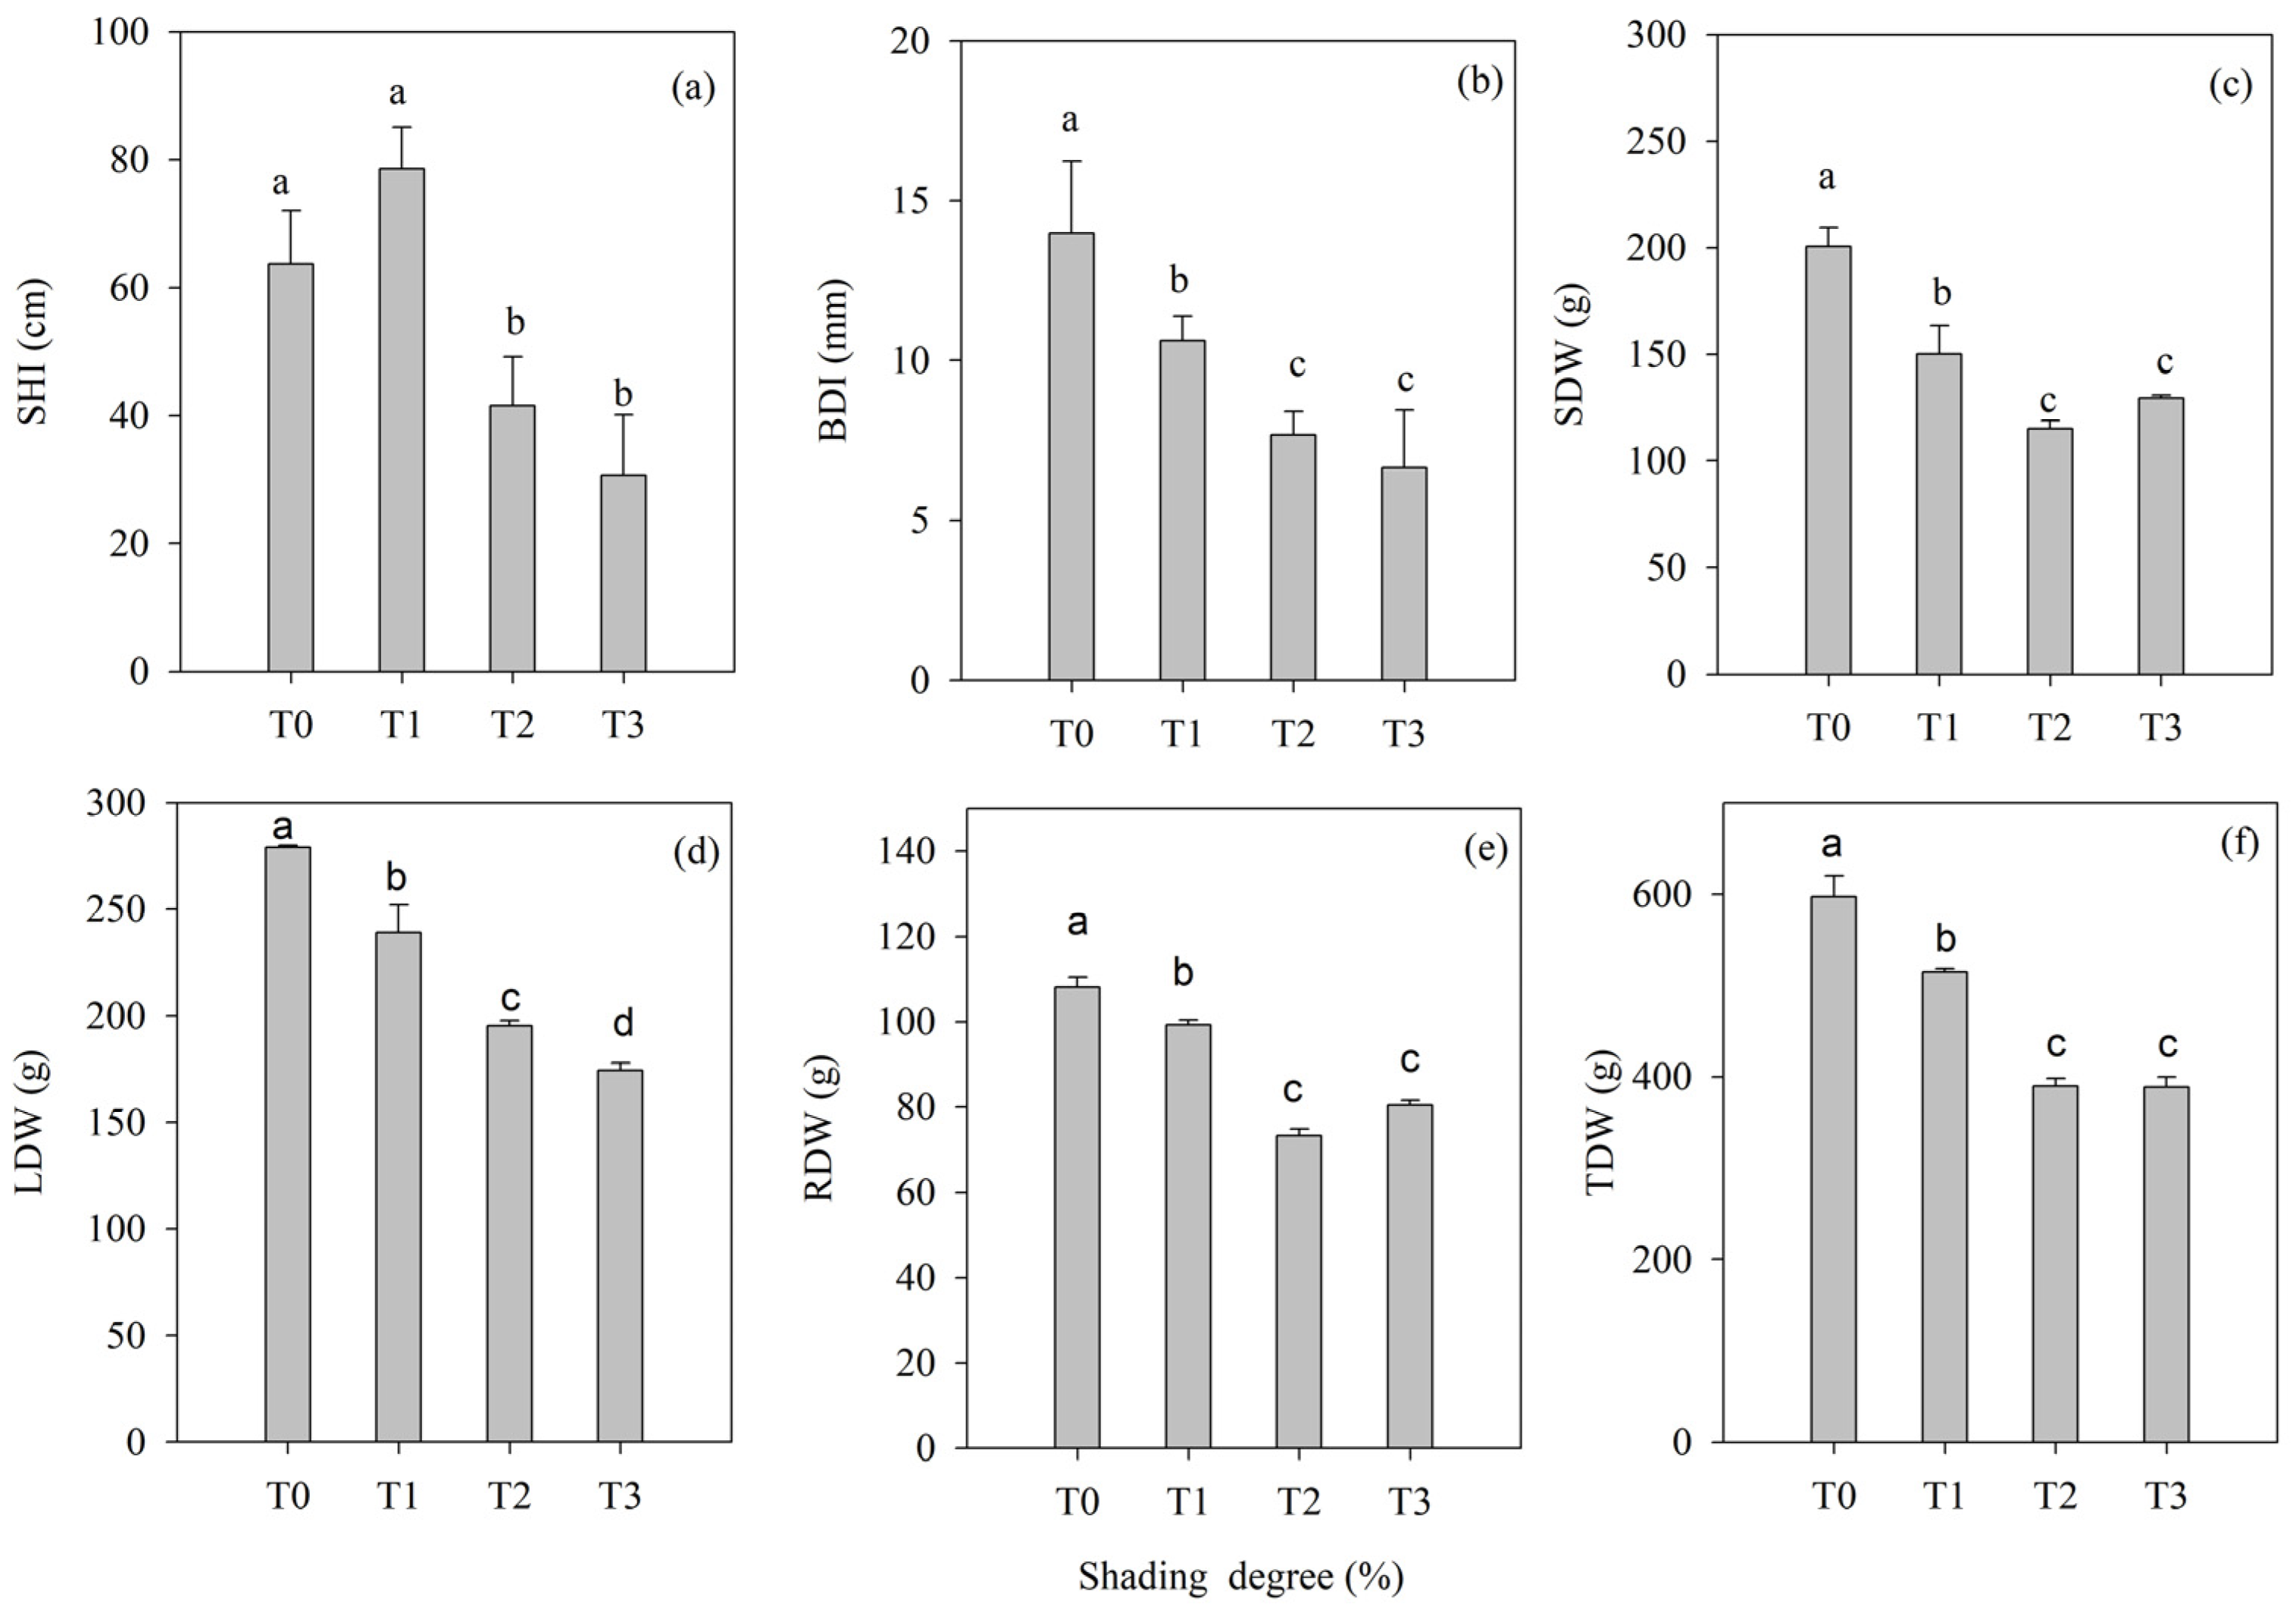
  • Growth parameters: Five randomly selected seedlings were sampled per treatment at experiment initiation (June 2022) and termination (June 2023). The seedling height (SH) and basal diameter (BD; measured at the ground) were measured using steel tape (8208, Deli Group Co., Ltd., Ningbo, China) and digital calipers (SHG-200MM, Shanghai Tool Works Co., Ltd., Shanghai, China), respectively. Growth over the experimental period was calculated by subtracting the initial measurements from the final values. After thoroughly rinsing the harvested seedlings, the leaves, stems, and roots were separated. Tissues were oven-dried (105 °C for 30 min to ensure enzyme deactivation, then 80 °C to constant mass), and the dry weight of the leaves (LDW), stems (SDW), and roots (RDW) was recorded using an analytical balance, as well as the total biomass (TDW) [45].
  • Leaf morphometrics: For each seedling, five mature leaves from the upper canopy were analyzed using a leaf area meter (LI-3000C, LI-COR Biosciences, Lincoln, NE, USA) to determine the leaf length (LL), width (LW), and area (LA). A digital micrometer (SYNTEK ST-124, Zhejiang Deqing Shengtai Core Electronics Technology Co., Ltd., Deqing, China) was used to quantify leaf thickness (LT). A SPAD chlorophyll meter (JN-4N, Zhengzhou Jinnong Technology Co., Ltd., Zhengzhou, China) was used to record the leaf chlorophyll content. After measurement, leaves were dried (80 °C, 72 h) and weighed (0.01 mg precision) to calculate the specific leaf area (SLA = LA/dry mass) [46].
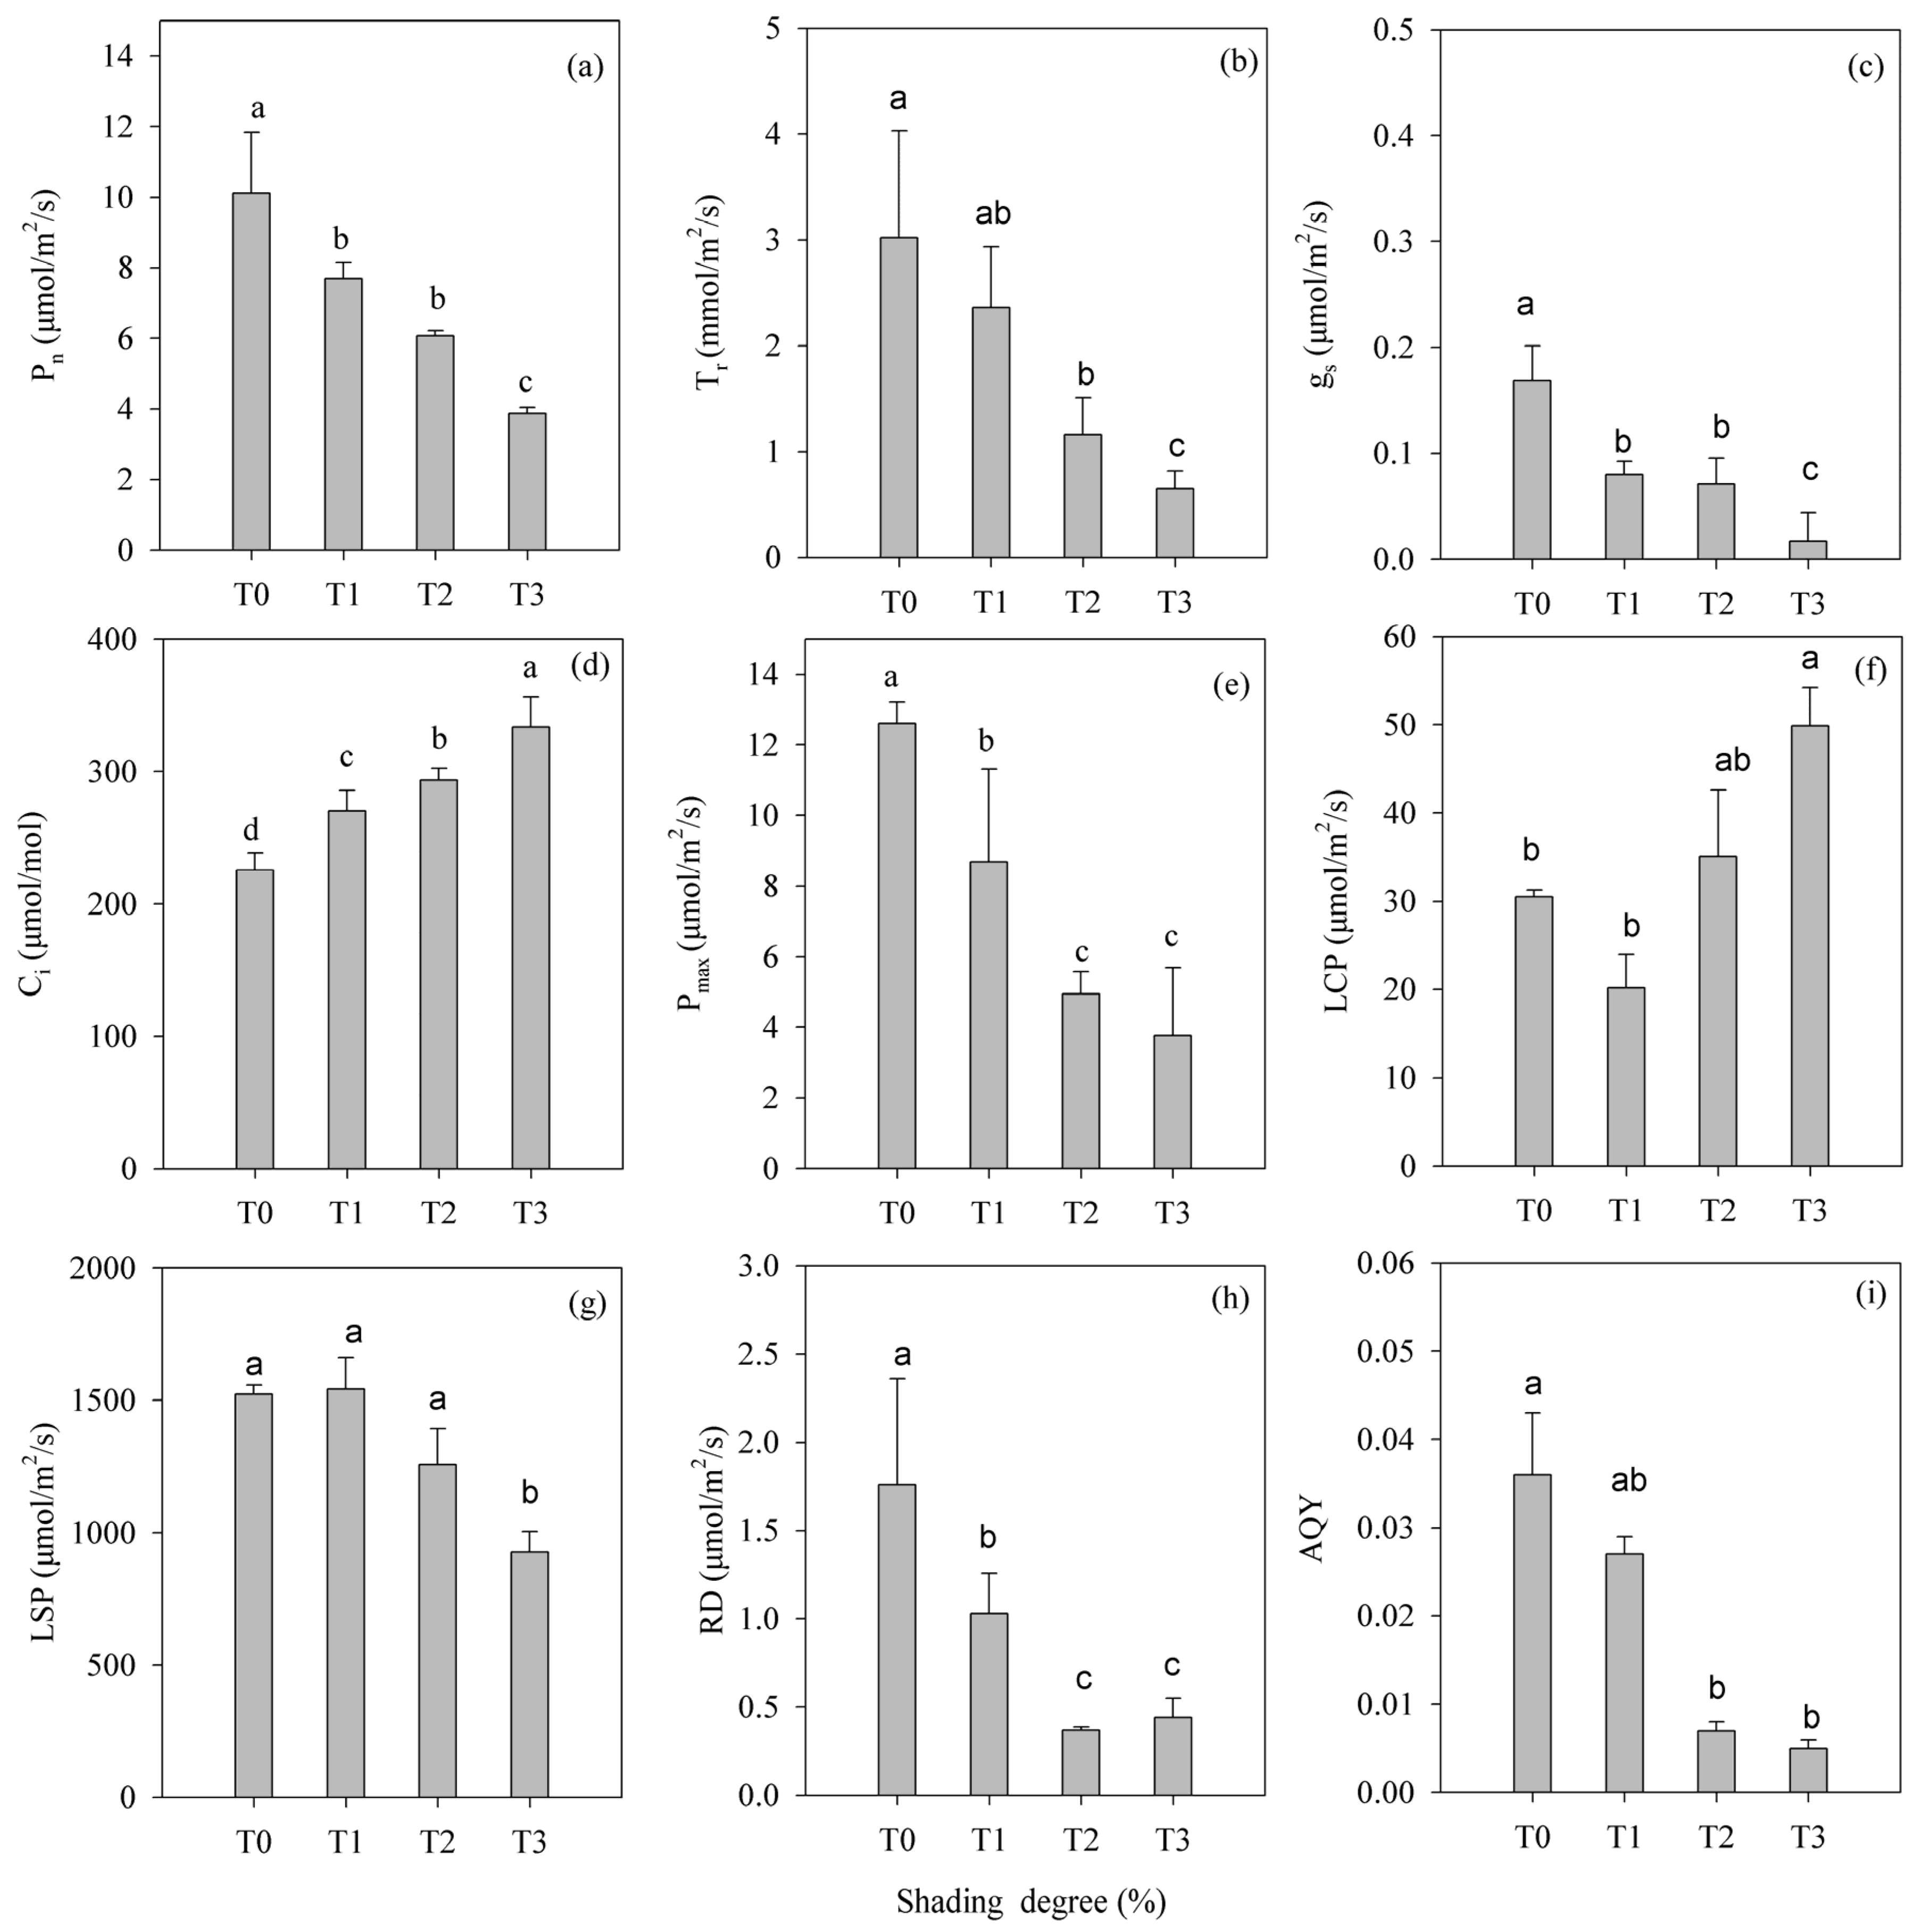
  • Photosynthetic characterization: Photosynthetic light-response curves were generated over a photosynthetically active radiation (PAR) gradient of 0–1800 μmol/m2/s (12-step protocol) using a Li-6800 Portable Photosynthesis System (LI-COR Biosciences, Lincoln, NE, USA) for five mature leaves per treatment. The following settings were used: 500 μmol/s airflow, 400 μmol·mol−1 reference CO2 level, 25 °C leaf chamber temperature, 50% relative humidity, and 10,000 rpm cooling fan speed. Real-time measurements captured the intercellular CO2 concentration (Ci), net photosynthetic rate (Pn), stomatal conductance (gs), and transpiration rate (Tr). A non-linear regression analysis of the light-response data was implemented to determine the apparent quantum yield (AQY), dark respiration rate (RD), light compensation point (LCP), light saturation point (LSP), and maximum photosynthetic capacity (Pmax) following established protocols [29].

2.3. Data Statistics and Analysis

The experimental data were analyzed using Microsoft Excel (v.2019). Analysis of variance (ANOVA) was employed to statistically assess the overall impact of shading on 21 key parameters—encompassing growth indices (plant height increment, stem diameter increment, and dry weights of various organs), leaf morphological indices (e.g., leaf length, leaf width), and photosynthetic parameters (e.g., net photosynthetic rate, stomatal conductance). The original data were log-transformed to satisfy the normality and homoscedasticity assumptions of ANOVA. The means of 21 key parameters were compared via Duncan’s new multiple range method, and ith statistical significance was defined at p < 0.05. All statistical analyses were conducted using SPSS Statistics (v.26.0). Seedling shade tolerance was comprehensively evaluated using a principal component analysis (PCA). Results were visualized in OriginPro (v.2021b) with standard formatting; error bars represent standard errors (SEs). All tabular and graphical data presentations illustrate the mean ± SE.

3. Results

3.1. Shading Intensity Effects on Hopea hainanensis Merr. & Chun Seedling Growth

Shading treatments induced significant morphological differentiation in H. hainanensis seedlings. The SHI showed no significant change under light shading (T1) compared to full-light controls (T0), whereas moderate (T2) and heavy shading (T3) reduced SHI by approximately 35% and 42%, respectively (Figure 2a). The BDI decreased progressively with shading intensity, showing marked reductions across all shaded treatments (Figure 2b). Biomass partitioning revealed organ-specific responses: SDW and RDW exhibited a U-shaped response to shading (maxima at T0), while LDW and TDW declined continuously with shading intensity (Figure 2c–f). Notably, the TDW was 35% lower in T3 than T0. All shading treatments showed reduced biomass accumulation relative to the control.

3.2. Shading Intensity Effects on Leaf Morphology in H. hainanensis Seedlings

Shading intensity significantly affected H. hainanensis seedling leaf morphology. The LL was higher in T1 than in all other treatments, being 32% higher in T1 than in the full-light control T0 (Figure 3a). Similarly, the LW was also maximized in T1 and T3, with values 30% and 21% higher than that of the control T0, respectively (Figure 3b).
The LT declined progressively with shading intensity, showing significant reductions of approximately 14% (T2) and 18% (T3) compared to T0; however, T1 remained comparable to controls (Figure 3c). The LA peaked in T1, whereas SLA was maximized in T2 due to biomass reallocation (Figure 3d,e). The SPAD increased consistently across shaded treatments, climbing by approximately 20%–25% relative to T0 (Figure 3f).

3.3. Shading Intensity Effects on Photosynthetic Parameters in H. hainanensis Seedlings

Shading treatments significantly altered photosynthetic efficiency in H. hainanensis seedlings. Key photosynthetic parameters progressively declined as shading increased. For example, compared to the control, Pn decreased by 24% (T1), 40% (T2), and 62% (T3), while AQY declined by 25%–86%, gs by 53%–90%, Pmax by 31%–70%, and Tr by 22%–78% (Figure 4a–c,e,i). In contrast, Ci monotonically increased with shading intensity (by 20%–48%) (Figure 4d). Both LCP and RD showed nonlinear responses to shading; the LCP achieved minimum and maximum values in T1 and T3, respectively, whereas RD showed a different pattern, being highest in T0 and lowest in T2 (Figure 4f,h). Notably, the LSP showed no significant differences among T0–T2 treatments but declined markedly in T3 (Figure 4g).

3.4. Comprehensive Evaluation of Shade Tolerance in H. hainanensis Seedlings

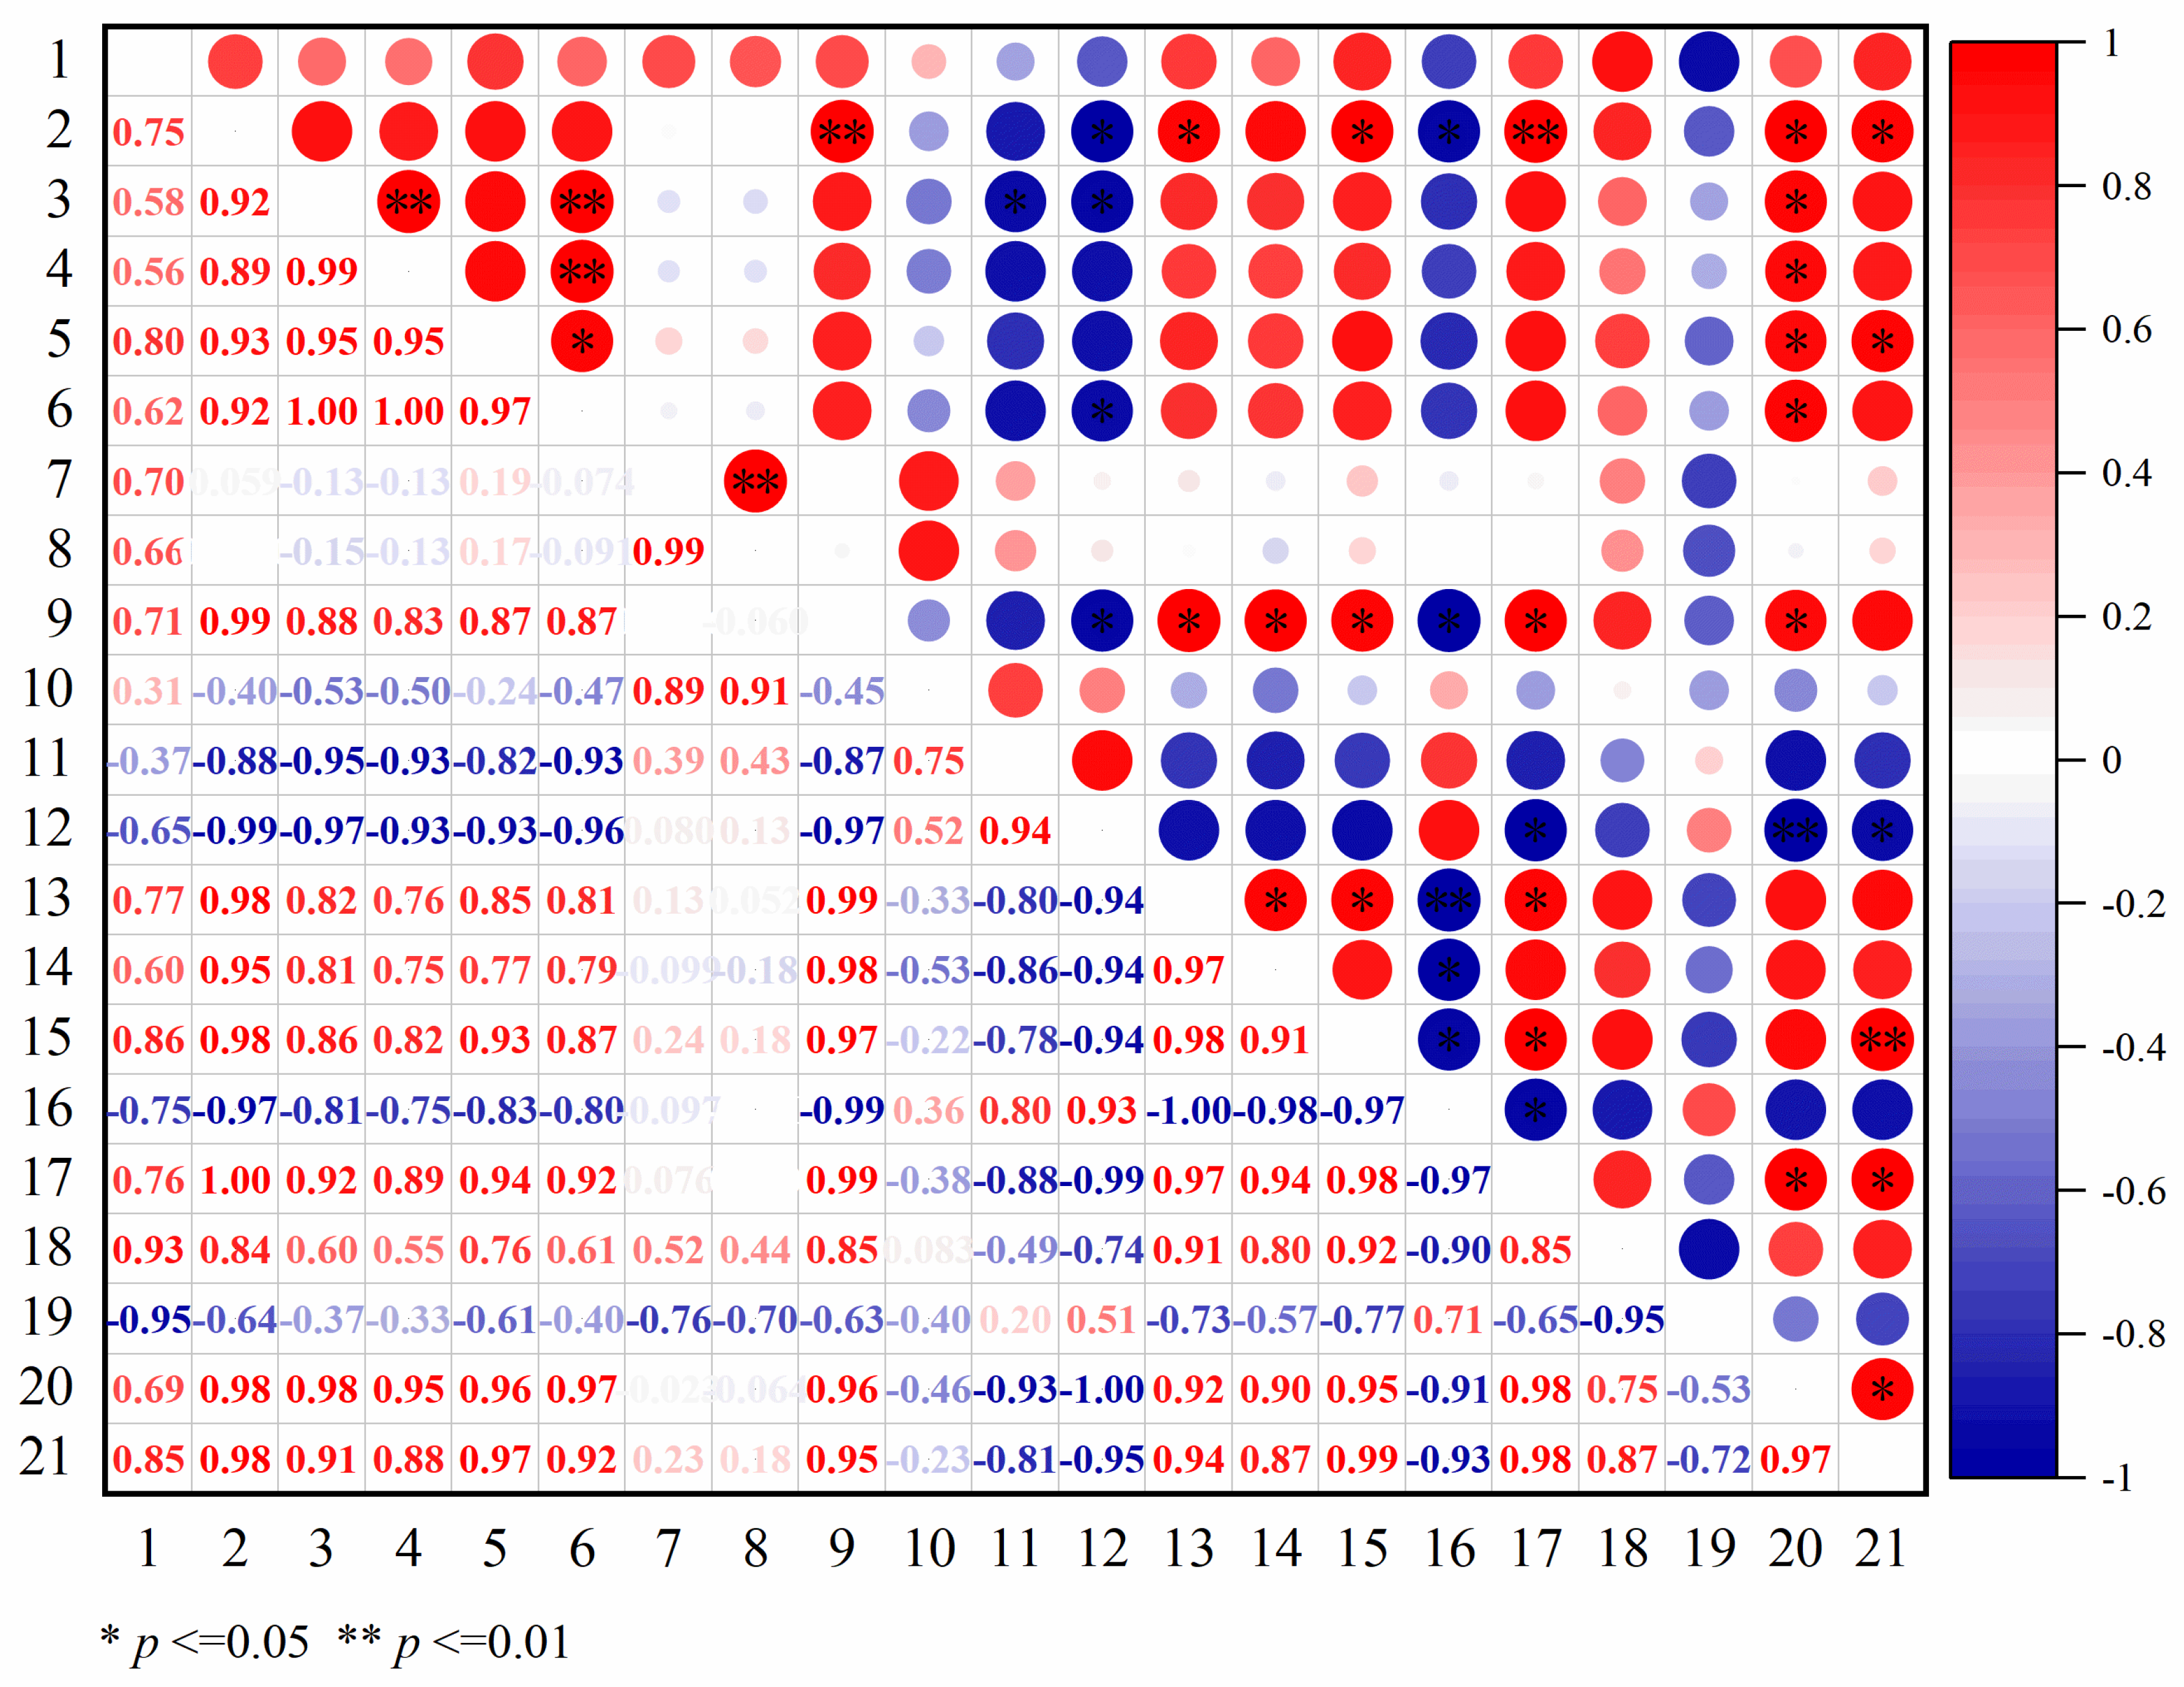
3.4.1. Trait Correlations in the Shading Experiment

A correlation matrix was constructed for all 21 growth-related, leaf morphological, and photosynthetic traits, revealing complex interdependencies across functional domains (Figure 5). Seedling structural traits were generally strongly correlated, suggesting coordinated regulation. For example, LT was positively correlated with GD and several metrics of photosynthetic capacity and negatively correlated with SPAD and Ci. The photosynthetic capacity metrics were also tightly clustered, with Pmax positively linked to RD, AQY, and the gas exchange parameters Pn and Tr. In terms of biomass allocation patterns, SDW was positively correlated with LDW and TDW, yet negatively correlated with SPAD. Notably, energy balance traits exhibited compensatory relationships: RD was strongly negatively associated with SPAD, while AQY was positively linked to Tr. The negative correlations between Ci and both gs and Tr imply coordinated stomatal regulation to optimize seedling water use.

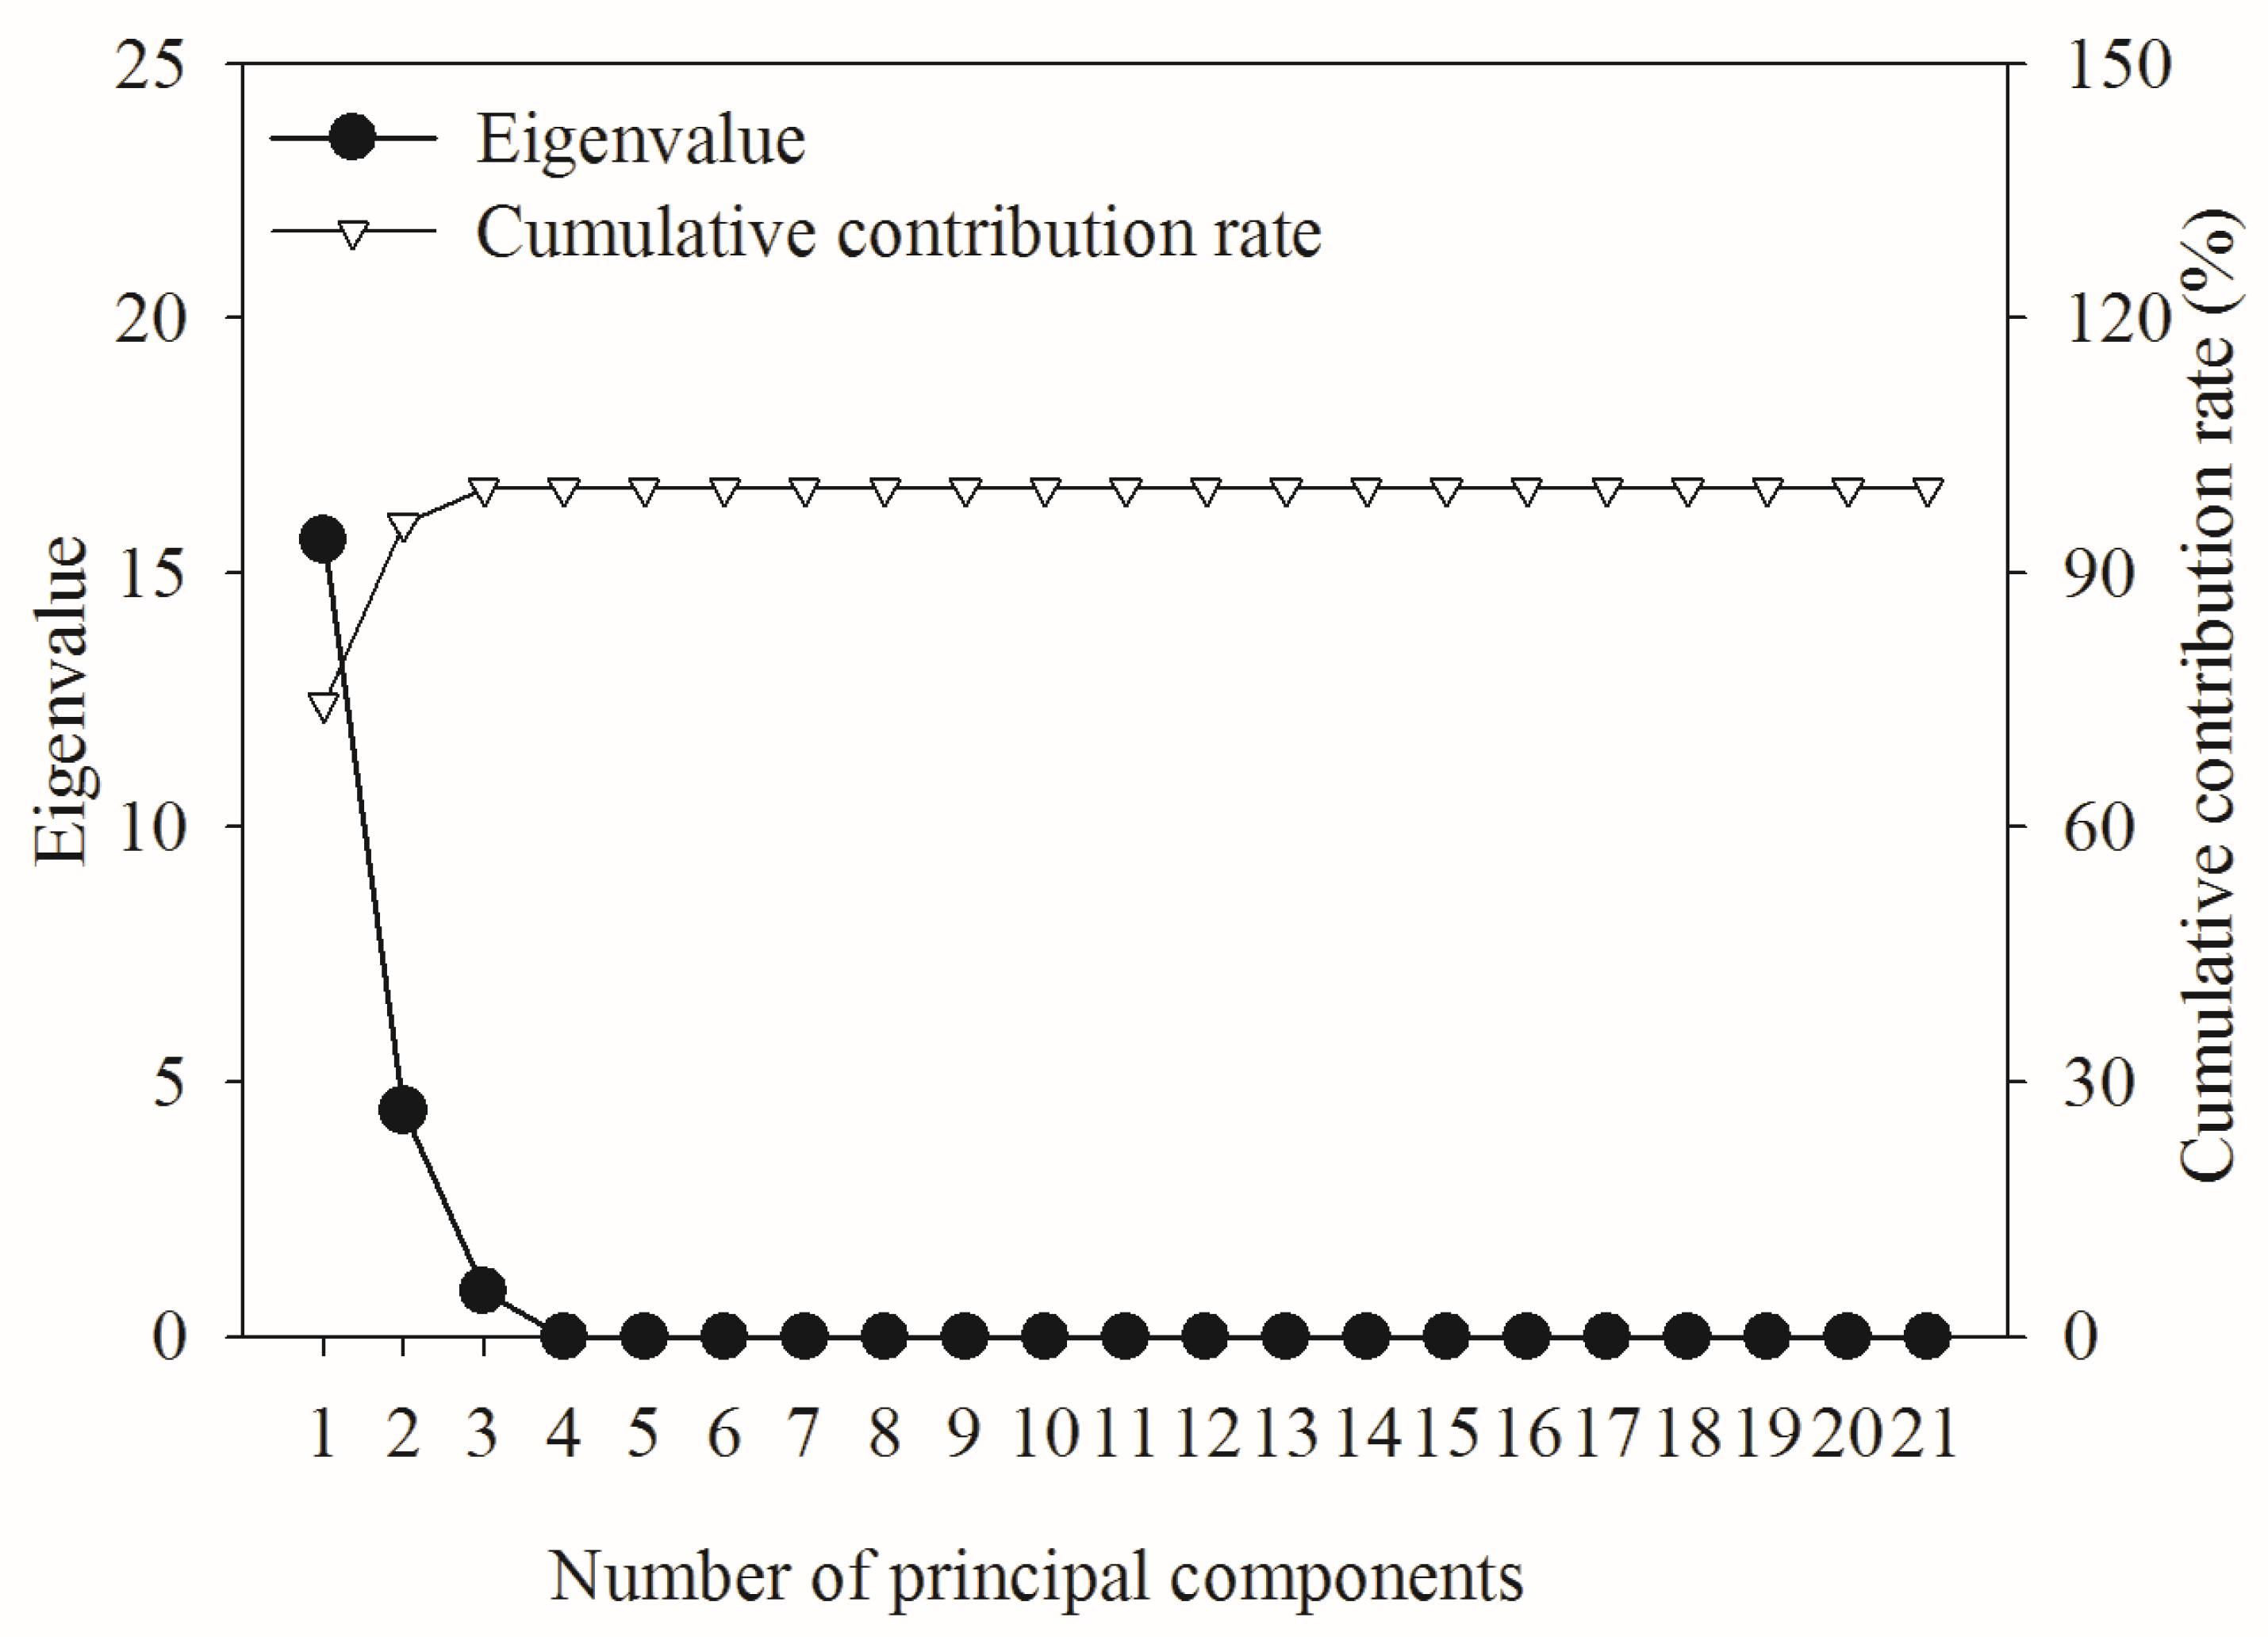
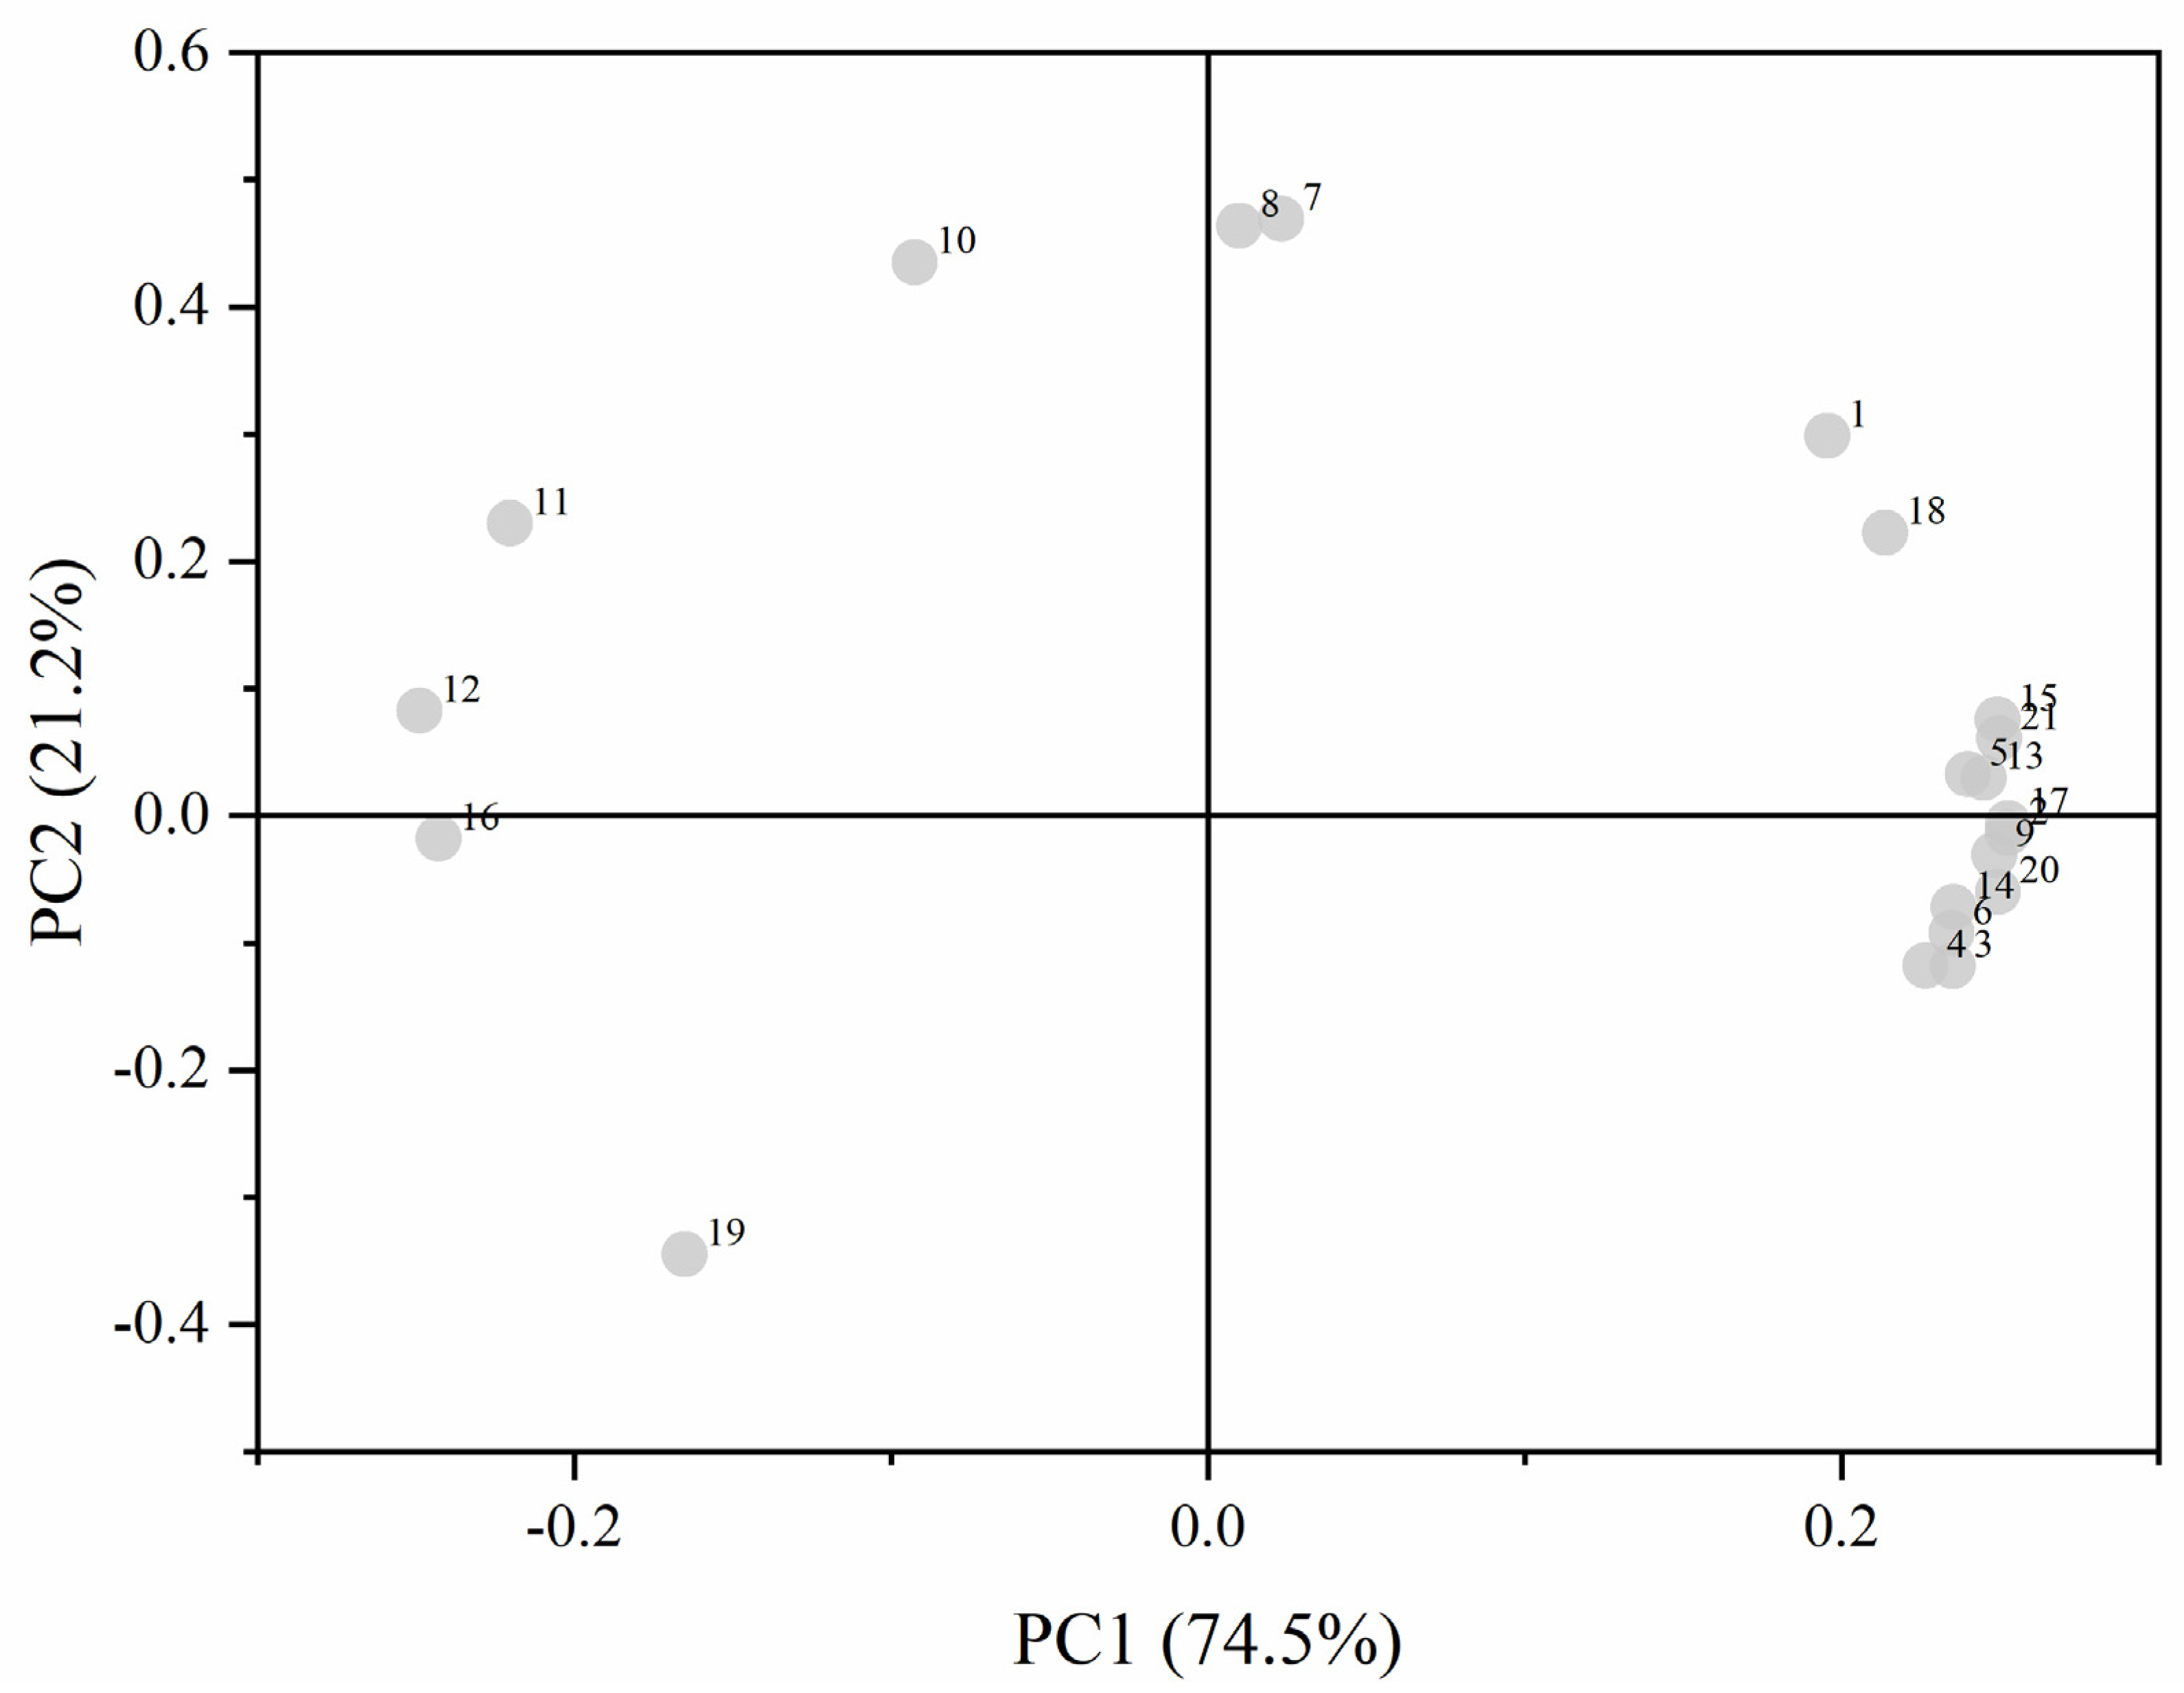
3.4.2. Principal Component Analysis

A principal component analysis (PCA) was performed for all 21 growth-related, leaf morphological, and photosynthetic traits across all shading treatments. The first two principal components together explained 95.74% of the total variance (Figure 6), effectively capturing most of the phenotypic variation. These two components were thus retained for use as composite variables, with the first principal component (PC1) exhibiting high positive loadings (>0.8) for all metrics except Ci, LA, LCP, and the SPAD chlorophyll content (Figure 7).
The PCA scores were used to construct a weighted model of shading tolerance: Y = 0.745Y1 + 0.212Y2, where Y1 and Y2 represent the PC1 and PC2 scores, respectively. The composite shading tolerance indices (Table 1) followed the hierarchy: T0 (0% shading) > T1 (30%) > T2 (60%) > T3 (90%). Unimpaired growth occurred at ≤30% shading intensity, with growth inhibition becoming statistically significant beyond this threshold.

4. Discussion

Plants can strategically adjust their morphology to optimize light capture under shading stress, a critical survival mechanism in dynamic environments [45,47]. Here, height–diameter allometry in H. hainanensis Merr. & Chun seedlings was responsive to shade stress. Light shading (T1) maximized height growth rates, while basal diameter increment and total biomass declined progressively with increasing shade intensity, reaching minimal values under heavy shading (T3) (Figure 2). Meanwhile, the basal diameter increment and total biomass (of stems, leaves, and roots) progressively declined with the shading intensity, with a 54.3% reduction in total biomass observed under heavy shading (T3) as compared to full-light controls. This contrasts with findings for Cercidiphyllum japonicum Siebold & Zucc. and Keteleeria fortunei var. cyclolepis (Flous) Silba, where seedling growth was maintained under similar shading treatments [1,45], suggesting species-specific carbon allocation priorities. The observed response to shading in H. hainanensis implies an evolutionary strategy: under moderate shading, vertical elongation is prioritized over radial growth to ensure canopy access. However, when shading is more severe, photosynthetic limitations (e.g., the 61.75% reduction in Pn observed in T3) constrain carbohydrate availability, compromising structural growth, as seen in Lespedeza buergeri Miq. and Chamaecyparis obtusa (Siebold & Zucc.) Endl. under heavy shade [16,17]. Full sunlight may conversely induce UV-B stress and limit plant height through photomorphogenic regulation [29]. These ecophysiological trade-offs highlight an adaptive dilemma: while shade tolerance ensures seedling persistence in the understory, chronic light limitation creates an ecological trap, reinforced by similar recruitment bottlenecks in H. hainanensis [36]. When light is insufficient, limitations to biomass accumulation delay the seedling-to-sapling transition, potentially explaining the observed recruitment bottleneck in natural forests.
Leaf morphological plasticity constitutes a potential adaptive strategy, with H. hainanensis seedlings demonstrating non-monotonic responses to light availability. Optimal leaf expansion occurred at 30% shading, and the specific leaf area (SLA) was maximized at 60% shading (Figure 3). In contrast, Phoebe bournei (Hemsl.) Yen C. Yang seedlings have been shown to maintain a normal leaf size under deep shade [10], while Cunninghamia lanceolata (Lamb.) Hook. and Michelia chapensis Dandy exhibited peak SLA at 50–70% shading [20,29]. This discrepancy suggests threshold-mediated photoacclimation in H. hainanensis: moderate shading (T1–T2) enhances light harvesting through SLA optimization, while further reductions in light (e.g., beyond 60%; T3) promote metabolic conservation over investments in growth. This shift likely reflects proximity to a light compensation point. As shading increased, the chlorophyll content also steadily increased, as found in Hopea reticulata Tardieu [48]; this increase was supported by the phytochrome-mediated upregulation of light-harvesting complexes. Conversely, leaf thickness progressively declined with shading intensity, potentially maximizing light penetration through reductions in the palisade parenchyma. The decline in leaf thickness would have compromised mechanical resilience, suggesting a metabolic trade-off favoring photosynthetic efficiency over structural investment. These coordinated adjustments reflect an ecological strategy to cope with variation in light availability; morphological plasticity is seen under suboptimal light conditions, transitioning to more extensive physiological adjustments under severe shade. This strategy prioritizes the photosynthetic quantum yield over carbon-intensive structural growth when light is limiting [49]. This explains the understory persistence of H. hainanensis seedlings in the face of limits on recruitment in closed-canopy forests, where chronic light limitation restricts biomass accumulation below regeneration thresholds.
Using controlled shading treatments, this study elucidated the coupled bioenergetic and photophysiological responses of H. hainanensis seedlings to reductions in light availability. Progressive shading (T0–T3) induced monotonic declines in the net photosynthetic rate, quantum yield, and stomatal conductance (Figure 4). At the same time, Ci elevation was observed, indicating the occurrence of non-stomatal limitations, such as those mediated through Rubisco deactivation and/or electron transport chain impairment [39]. Unlike typical shade responses where Ci decreases with gs, the opposite was observed here, suggesting carbon assimilation enzyme dysfunction; such enzyme dysfunction has been observed in endangered Dipterocarpus retusus Blume seedlings maintained under low light conditions [50] and Pterocarpus indicus Willd. under 4% full sunlight [5]. Here, H. hainanensis seedling energy metabolism exhibited threshold-dependent regulation, with dark respiration (RD) and the light compensation point (LCP) showing nonlinear responses to shading intensity. The LCP was lowest in T1 and highest in T3, reflecting a shift from optimal light-use efficiency under moderate shading to respiratory dysregulation under extreme shade, paralleling photosynthetic dysregulation in severely shaded Horsfieldia hainanensis Merr. [36]. The light saturation point (LSP) was highest in T1, suggesting greater PSII plasticity mediated through chloroplast ultrastructure reorganization (e.g., heightened grana stacking); in contrast, LSP was lowest in T3, indicating D1 protein degradation and irreversible PSII damage, consistent with PSII damage thresholds in Q. mongolica under 3% light [11]. These responses reveal an evolutionary adaptation to tropical rainforest gap dynamics: moderate shading enhances photochemical competitiveness through morphological and chloroplast-level optimizations, while severe shading triggers downshifting to prioritize plant basal metabolism [29].
Plant shade stress tolerance emerges from integrated growth-physiology trade-offs, necessitating multivariate assessments of plant shade responses [1]. Here, a principal component analysis revealed a consistent hierarchy in H. hainanensis seedling performance across shading treatments: T0 (full light) > T1 (30% shading) > T2 (60%) > T3 (90%). Physiological suppression became significant when shading caused more than a 30% reduction in irradiance—a critical threshold aligning with the species’ photoadaptive capacity and optimal shade ranges for Castanopsis hystrix Hook. f. & Thomson ex A. DC (60%) and Quercus ilex L. (40–70%) [10,22]. In the tropical rainforest understory, dense canopy layers typically permit < 2% light transmission [39], suggesting chronic light limitation as a primary constraint to natural regeneration in H. hainanensis. Notably, light requirements for this species increase ontogenetically, demanding dynamic cultivation protocols that mirror natural regeneration niches [38]. To resolve this light-limitation bottleneck, we propose a light-gradient acclimation cultivation strategy: initial cultivation under 30% shading optimizes stem elongation; subsequent developmental phases progressively increase irradiance to stimulate radial growth, ultimately transitioning seedlings to full sunlight during maturation. While acknowledging study limitations—particularly the simplified nursery environment omitting natural biotic interactions (e.g., competition, herbivory) and abiotic heterogeneity (e.g., soil moisture gradients), alongside the focus on short-term (one-year) seedling responses—these findings provide mechanistic insights into photoadaptive thresholds. Future research should (1) validate cultivation protocols in field settings incorporating edaphic and biotic variables; (2) quantify long-term photoinhibition dynamics under sustained shade regimes; and (3) integrate transcriptomic analyses to elucidate molecular drivers of observed ontogenetic shifts in light adaptation.

5. Conclusions

Hopea hainanensis seedlings exhibited light-dependent growth regulation, surviving across a gradient of 0%–90% shading, but developing optimally only when shading was ≤30%. Access to full sunlight maximized 13 of 21 evaluated parameters (including biomass accumulation, photosynthetic efficiency, and stomatal function), while moderate shading (30%) led to morphological adaptations prioritizing leaf expansion (LA: +41.8%), light-harvesting efficiency (SPAD: +46.4%), and vertical elongation (SH: +31.7%). Beyond this threshold, photosynthetic suppression and respiratory imbalances significantly compromised seedling vigor. These ecophysiological responses suggest a two-phase cultivation protocol, whereby initial shading (30% irradiance reduction) is used to maximize height growth, followed by the progressive removal of shading to stimulate structural development. These measures are important to support the renewal of natural H. hainanensis populations and to enhance the population size.

Author Contributions

Conceptualization, C.H. and X.W.; data curation, L.L., X.D. and L.C.; funding acquisition, F.C.; investigation, M.S. and X.Y.; methodology, M.Z.; project administration, C.H.; resources, F.C.; writing—original draft, C.H.; writing—review and editing, M.Z. All authors have read and agreed to the published version of the manuscript.

Funding

This research was funded by the specific research fund of the Innovation Platform for Academicians of Hainan Province (YSPTZX202001).

Data Availability Statement

The original contributions presented in this study are included in the article. Further inquiries can be directed to the corresponding author.

Acknowledgments

The fieldwork was aided by the Administration Bureau of the Hainan Bawangling National Nature Reserve, which granted us permission to conduct surveys and procure samples at the site.

Conflicts of Interest

The authors declare no conflicts of interest.

References

  1. Li, D.L.; Jin, Y.Q.; Cui, M.F.; Wang, H.; Jiang, H.; Zhu, Y.Y. Effects of shading on photosynthetic characteristics and leaf anatomical structure of Cercidiphyllum japonicum seedlings. Acta Bot. Boreal.-Occident. Sin. 2019, 39, 1053–1063. [Google Scholar]
  2. Umesh, M.R.; Angadi, S.; Begna, S.; Gowda, P.; Prasad, P.V.V. Shade tolerance response of legumes in terms of biomass accumulation, leaf photosynthesis, and chlorophyll pigment under reduced sunlight. Crop Sci. 2023, 63, 278–292. [Google Scholar] [CrossRef]
  3. Chai, S.F.; Tang, J.M.; Mallik, A.; Shi, Y.C.; Zou, R.; Li, J.T.; Wei, X. Eco-physiological basis of shade adaptation of Camellia nitidissima, a rare and endangered forest understory plant of Southeast Asia. BMC Ecol. 2018, 18, 5. [Google Scholar] [CrossRef] [PubMed]
  4. Gong, J.R.; Zhang, Z.H.; Zhang, C.L.; Zhang, J.Q.; Ran, A. Ecophysiological responses of three tree species to a high altitude environment in the southeastern Tibetan plateau. Forests 2018, 9, 48. [Google Scholar] [CrossRef]
  5. Lee, K.-A.; Kim, Y.-N.; Kantharaj, V.; Lee, Y.B.; Woo, S.Y. Seedling growth and photosynthetic response of Pterocarpus indicus L. to shading stress. Plant Signal. Behav. 2023, 18, 2245625. [Google Scholar] [CrossRef] [PubMed]
  6. Dai, D.C.; Hu, H.L.; Chen, H.; Hu, T.X.; Zhang, J.; Tie, D.X.; Zhang, C.H.; Liu, X.J. Effects of shading on growth and photosynthetic physiological characteristics of Phoebe zhennan seedlings. J. Northwest A&F Univ. (Nat. Sci. Ed.) 2020, 48, 56–64. [Google Scholar]
  7. Chen, C.; Jin, Z.X.; Yuan, M.; Luo, G.Y.; Li, Y.L.; Shan, F.Q. Seasonal variation of photosynthetic characteristics in endangered Magnolia sinostellata seedlings under different light intensities. J. Zhejiang A&F Univ. 2022, 39, 950–959. [Google Scholar]
  8. Shi, K.; Li, Z.; Zhang, W.J.; He, X.; Zeng, Y.L.; Tan, X.F. Effects of different light conditions on growth, photosynthetic diurnal variation and chlorophyll fluorescence parameters of Vernicia fordii seedlings. J. Cent. South Univ. For. Technol. 2018, 38, 35–42+50. [Google Scholar]
  9. Liu, J.C.; Zhao, L.J.; Zhu, L.Q. Effects of shading on growth and photosynthetic characteristics of three Magnoliaceae seedlings. Guihaia 2020, 40, 1159–1168. [Google Scholar]
  10. Xue, G.Y.; Wu, J.D.; Zhou, B.J.; Zhu, X.P.; Zeng, J.; Ma, Y.; Wang, Y.N.; Jia, H.Y. Effects of shading on the growth and photosynthetic fluorescence characteristics of Castanopsis hystrix seedlings of top community-building species in southern subtropical China. Forests 2023, 14, 1659. [Google Scholar] [CrossRef]
  11. Li, X.M.; Jiang, M.; Ren, Y.C.; Pang, J.S.; Ren, J.J.; Li, G.F.; Yuan, Y.C.; Xing, X.D.; Zhou, M.M.; Wang, J.M.; et al. Growth, physiological, and transcriptome analyses reveal Mongolian Oak seedling responses to shading. Forests 2024, 15, 538. [Google Scholar] [CrossRef]
  12. Tang, X.L.; Liu, G.Z.; Jiang, J.; Liu, B.; Zhang, Y.X.; Di, L. Effects of shading on chlorophyll fluorescence characteristics and energy allocation in one-year and three-year-old Phoebe bournei seedlings. Chin. J. Ecol. 2020, 39, 3247–3254. [Google Scholar]
  13. Azevedo, G.F.C.; Marenco, R.A. Growth and physiological changes in saplings of Minquartia guianensis and Swietenia macrophylla during acclimation to full sunlight. Photosynthetica 2012, 50, 86–94. [Google Scholar] [CrossRef]
  14. Xu, S.S.; Tang, Y.; Zhong, M.H.; Li, L.Y.; Wu, L.H.; Lin, K.M.; Cao, G.Q.; Ye, Y.Q. Effects of shading on growth, photosynthetic characteristics and nutrient content of Aglaonema spp. Pratac. Sci. 2022, 39, 2083–2094. [Google Scholar]
  15. Wang, Z.X.; Zhu, J.M.; Wang, J.; Wang, Y.; Lu, Y.X.; Zheng, Q.R. Responses of photosynthetic characteristics and biomass allocation of Phoebe bournei saplings to light environment. Acta Ecol. Sin. 2012, 32, 3841–3848. [Google Scholar] [CrossRef]
  16. Kanga, D.B.; Sungb, J.W.; Leec, D.H. Effects of shading and fertilizer treatments on the growth characteristicsof Chamaecyparis obtusa (S. et Z.) Endlicher seedlings. For. Sci. Technol. 2021, 17, 125–134. [Google Scholar]
  17. Duan, R.Y.; Ma, Y.H.; Yang, L.M. Effects of shading on photosynthetic pigments and photosynthetic parameters of Lespedeza buergeri seedlings. IOP Conf. Ser. Mater. Sci. Eng. 2018, 452, 022158. [Google Scholar] [CrossRef]
  18. Luo, G.Y.; Chen, C.; Li, Y.L.; Jin, Z.X. Effects of light intensity on photosynthetic characteristics of endangered Ulmus elongata. Chin. J. Ecol. 2021, 40, 980–988. [Google Scholar]
  19. Yin, D.S.; Shen, H.L. Shade tolerance of forest plants and their morphological and physiological adaptations: A review. Chin. J. Appl. Ecol. 2016, 27, 2687–2698. [Google Scholar]
  20. Tang, Y.; Yang, P.R.; Lü, N.N.; Liu, Z.H.; Zhong, S.F.; Huang, J.H.; Shen, Z.Y.; Zheng, X.Y.; Xu, S.S.; Cao, G.Q.; et al. Effects of shading on growth and photosynthetic characteristics of Cunninghamia lanceolata seedlings. Chin. J. Appl. Environ. Biol. 2023, 29, 1084–1092. [Google Scholar]
  21. Lv, N.N.; Liu, Z.H.; Yang, P.R.; Zhong, S.F.; Zheng, X.Y.; Tang, Y.; Ye, Y.Q.; Cao, G.Q.; Xu, S.S. Effects of different shading treatments on growth and soil carbon and nitrogen metabolic enzyme activities of Cunninghamia lanceolata seedlings. Acta Ecol. Sin. 2024, 44, 3600–3611. [Google Scholar]
  22. Puértolas, J.; Benito, L.F.; Peñuelas, J.L. Effects of nursery shading on seedling quality and post-planting performance in two mediterranean species with contrasting shade tolerance. New For. 2009, 38, 295–308. [Google Scholar] [CrossRef]
  23. Abiem, I.; Kenfack, D.; Chapman, H. Assessing the impact of abiotic and biotic factors on seedling survival in an African montane forest. Front. For. Glob. Change 2023, 6, 1108257. [Google Scholar] [CrossRef]
  24. Martini, F.; Zou, C.; Goodale, U.M. Intrinsic biotic factors and microsite conditions drive seedling survival in a species with masting reproduction. Ecol. Evol. 2019, 9, 14261–14272. [Google Scholar] [CrossRef] [PubMed]
  25. Johnson, D.J.; Condit, R.; Hubbell, S.P.; Comita, L.S. Abiotic niche partitioning and negative density dependence drive tree seedling survival in a tropical forest. Proc. R. Soc. B Biol. Sci. 2017, 284, 20172210. [Google Scholar] [CrossRef] [PubMed]
  26. Ssali, F.; Moe, S.; Sheil, D. Damage to artificial seedlings across a disturbed Afromontane forest landscape. Biotropica 2019, 51, 652–663. [Google Scholar] [CrossRef]
  27. Fang, Z.S.; Zhong, C.R.; Cheng, C.; Lü, X.B.; Chen, X. Effects of shading on the growth and biomass allocation of Hernandia nymphaeifolia seedlings. Mol. Plant Breed. 2024, 22, 7837–7844. [Google Scholar]
  28. Rao, D.D.; Han, Y.; Wu, E.H.; Chen, Y. Growth and photosynthetic characteristics of Populus qiongdaoensis seedlings under different light intensities. J. Shanxi Agric. Univ. (Nat. Sci. Ed.) 2024, 44, 61–69. [Google Scholar]
  29. Zhou, H.; Wei, R.P.; Li, J.Y.; Su, Y.; Hu, D.H.; Zheng, H.Q. Effects of light intensity on growth and photosynthetic characteristics of Michelia chapensis seedlings. Chin. J. Ecol. 2024, 43, 709–715. [Google Scholar]
  30. Liu, B.E.; Liao, B.W. Physiological and ecological responses of Acanthus ilicifolius seedlings to different light intensities under tidal environments. For. Res. 2013, 26, 192–199. [Google Scholar]
  31. Gao, Z.; Khalid, M.; Jan, F.; Saeed-ur-Rahman; Jiang, X.; Yu, X. Effects of light-regulation and intensity on the growth, physiological and biochemical properties of Aralia elata (miq.) seedlings. S. Afr. J. Bot. 2019, 121, 456–462. [Google Scholar] [CrossRef]
  32. Xiao, Y.X.; Yin, L.H.; Yu, W.B.; Tang, J.W. Study on population structure and seedling regeneration of ex-situ cultivated Hopea hainanensis. Plant Sci. J. 2023, 41, 604–612. [Google Scholar]
  33. Luo, W.; Xu, H.; Li, Y.P.; Xie, C.P.; Lu, C.Y.; Liang, C.S.; Su, H.H.; Li, Z.L. Population structure and quantitative dynamics of Hopea hainanensis, a wild plant with extremely small populations. For. Res. 2023, 36, 169–177. [Google Scholar]
  34. Zang, R.G.; Dong, M.; Li, J.Q.; Chen, X.Y.; Zeng, S.J.; Jiang, M.X.; Li, Z.Q.; Huang, J.H. Research on conservation and restoration techniques for typical wild plants with extremely small populations. Acta Ecol. Sin. 2016, 36, 7130–7135. [Google Scholar]
  35. Song, Y.B.; Shen-Tu, X.L.; Dong, M. Intraspecific variation of samara dispersal traits in the endangered tropical tree Hopea hainanensis (Dipterocarpaceae). Front. Plant Sci. 2020, 11, 599764. [Google Scholar] [CrossRef] [PubMed]
  36. Wang, R.J.; Ma, J.M.; Huang, R.L.; Wang, Y.; Jiang, Y.; Ling, Y.M.; Yang, J.S.; Liang, H.Z.; Liu, X.S.; Liao, N.Y. The effects of shading on the photosynthetic performance of endangered plant Horsfieldia Hainanensis seedlings. Forests 2024, 15, 3. [Google Scholar] [CrossRef]
  37. Lu, X.X.; Zang, R.G.; Ding, Y.; Huang, J.H.; Xu, Y. Habitat characteristics of Hopea hainanensis, a wild plant with extremely small populations, and their effects on seedling abundance. Biodivers. Sci. 2020, 28, 289–295. [Google Scholar]
  38. Laurance, W.F. Reflections on the tropical deforestation crisis. Biol. Conserv. 1999, 91, 109–117. [Google Scholar] [CrossRef]
  39. Zhang, L.; Yang, X.B.; Nong, S.Q.; Li, D.H.; Li, Y.L.; Song, J.Y. Developmental characteristics of Hopea hainanensis population under two different protection modes. Acta Ecol. Sin. 2019, 39, 3740–3748. [Google Scholar]
  40. Wang, S.B.; Liang, H.P.; Wang, H.L.; Li, L.Z.; Xu, Y.; Liu, Y.; Liu, M.; Wei, J.P.; Ma, T.; Le, C.; et al. The chromosome-scale genomes of Dipterocarpus turbinatus and Hopea hainanensis (Dipterocarpaceae) provide insights into fragrant oleoresin biosynthesis and hardwood formation. Plant Biotechnol. J. 2021, 20, 538–553. [Google Scholar] [CrossRef] [PubMed]
  41. Chen, Y.K.; Zhang, H.L.; Zhang, L.; Nizamani, M.M.; Zhou, T.X.; Zhang, H.Y.; Liu, T.T. Genetic diversity assessment of Hopea hainanensis in Hainan Island. Front. Plant Sci. 2022, 14, 1075102. [Google Scholar] [CrossRef] [PubMed]
  42. Lan, Q.Y.; Jiang, X.C.; Song, S.Q.; Lei, Y.B.; Yin, S.H. Changes in germinability and desiccation-sensitivity of recalcitrant Hopea hainanensis Merr. et Chun seeds during development. Seed Sci. Technol. 2007, 35, 21–31. [Google Scholar] [CrossRef]
  43. Li, G.Y.; Chen, F.F.; Yang, Z.L. Study on seedling raising techniques of Hopea hainanensis seeds. Trop. For. 2015, 43, 7–8+13. [Google Scholar]
  44. Wen, X.Y.; Huang, F.F.; Gan, X.H.; Zhang, W.Q.; Huang, Y.H.; Xu, X.Y.; Zhou, Y. Introduction performance of Hopea hainanensis and Vatica mangachapoi in Guangdong Arboretum. For. Environ. Sci. 2017, 33, 52–56. [Google Scholar]
  45. Zhang, P.; Pang, S.J.; Liu, S.L.; Chen, H.H.; Duan, R.M.; Zeng, Q.Y. Effects of shading on growth and chlorophyll fluorescence parameters of Keteleeria cyclolepis seedlings. Acta Bot. Boreal.-Occident. Sin. 2023, 43, 1716–1722. [Google Scholar]
  46. Yao, Y.H.; Li, L.; Yu, L.; Wang, W.G.; Chen, K.M.; Fu, W.Y.; Zhou, X.Y.; Xia, G.H. Effects of shading on growth and physiological characteristics of Photinia glabra var. magnoliaefolia seedlings. J. Northeast. For. Univ. 2025, 53, 67–78. [Google Scholar]
  47. Li, X.Q.; Zhang, F.L.; Yang, T.; Zhe, G.X.; Mao, C.L.; Wu, Y. Effects of shading on leaf morphology and photosynthetic parameters of endangered Horsfieldia amygdalina seedlings. Plant Physiol. J. 2019, 55, 80–90. [Google Scholar]
  48. Hu, X.; Xu, R.J.; Shu, Q.; Guo, W.; Zhang, J.; Shang, Z.A.; Qi, L.H. Population structure and dynamics of Hopea reticulata, an endemic plant in Ganshiling, Hainan Island. Chin. J. Trop. Crops 2020, 41, 1939–1945. [Google Scholar]
  49. Li, Y.P.; Xu, H.; Chen, J.; Lei, J.; Luo, W. Research status and prospects of Hopea hainanensis, a wild plant with extremely small populations. J. Trop. Subtrop. Bot. 2024, 32, 685–694. [Google Scholar]
  50. Jin, X.J.; Yin, X.S.; Xu, Y.T. Effects of different light and soil moisture on seed germination of three Dipterocarpaceae species. J. West China For. Sci. 2015, 44, 36–40. [Google Scholar]
Figure 1. Schematic diagram of the geographical location of the study area.
Forests 16 01193 g001
Figure 2. Effects of shading intensity on seedling height increment (a), basal diameter increment (b), stem dry weight (c), leaf dry weight (d), root dry weight (e), and total dry weight (f) of Hopea hainanensis Merr. & Chun seedlings. Analysis indices: seedling height increment (SHI), basal diameter increment (BDI), stem dry weight (SDW), leaf dry weight (LDW), root dry weight (RDW), and total dry weight (TDW). Shading treatments: T0 (full sunlight, 0%), T1 (light shading, 30%), T2 (moderate shading, 60%), T3 (heavy shading, 90%). Data are presented as mean ± SE (n = 3 biological replicates, 5 seedlings per replicate). Different lowercase letters within each subplot indicate significant differences determined by one-way ANOVA with Tukey’s post-hoc test.
Forests 16 01193 g002
Figure 3. Effects of shading intensity on leaf length (a), leaf width (b), leaf thickness (c), leaf area (d), specific leaf area (e), and chlorophyll content (f) of H. hainanensis seedlings. Analysis indices: leaf length (LL), leaf width (LW), leaf thickness (LT), leaf area (LA), specific leaf area (SLA), and chlorophyll content (SPAD). Shading treatments: T0 (full sunlight, 0%), T1 (light shading, 30%), T2 (moderate shading, 60%), T3 (heavy shading, 90%). Data are presented as mean ± SE (n = 3 biological replicates, 5 seedlings per replicate). Different lowercase letters within each subplot indicate significant differences determined by one-way ANOVA with Tukey’s post-hoc test.
Forests 16 01193 g003
Figure 4. Effects of shading intensity on net photosynthetic rate (a), transpiration rate (b), stomatal conductance (c), intercellular CO2 concentration (d), maximum photosynthetic capacity (e), light compensation point (f), light saturation point (g), dark respiration rate (h), and apparent quantum yield (i) of H. hainanensis seedlings. Analysis indices: net photosynthetic rate (Pn), stomatal conductance (gs), transpiration rate (Tr), intercellular CO2 concentration (Ci), maximum net photosynthetic rate (Pmax), light saturation point (LSP), light compensation point (LCP), dark respiration rate (RD), and apparent quantum yield (AQY). Shading treatments: T0 (full sunlight, 0%), T1 (light shading, 30%), T2 (moderate shading, 60%), T3 (heavy shading, 90%). Data are presented as mean ± SE (n = 3 biological replicates, 5 seedlings per replicate). Different lowercase letters within each subplot indicate significant differences determined by one-way ANOVA with Tukey’s post-hoc test.
Forests 16 01193 g004
Figure 5. Heatmap depicting correlations among growth, leaf morphology, and photosynthetic parameters of H. hainanensis seedlings across different shading treatments. * indicates significant correlation (p < 0.05), ** indicates extremely significant correlation (p < 0.01). Analysis indices: seedling height increment (1), basal diameter increment (2), stem dry weight (3), leaf dry weight (4), root dry weight (5), total dry weight (6), leaf length (7), leaf width (8), leaf thickness (9), leaf area (10), specific leaf area (11), chlorophyll content (12), net photosynthetic rate (13), stomatal conductance (14), transpiration rate (15), intercellular CO2 concentration (16), maximum photosynthetic capacity (17), light saturation point (18), light compensation point (19), dark respiration rate (20), and apparent quantum yield (21).
Forests 16 01193 g005
Figure 6. Principal component variance explanations of effect of light on the growth of H. hainanensis seedlings.
Forests 16 01193 g006
Figure 7. Component plots of principal component 1 and principal component 2. Analysis indices: seedling height increment (1), basal diameter increment (2), stem dry weight (3), leaf dry weight (4), root dry weight (5), total dry weight (6), leaf length (7), leaf width (8), leaf thickness (9), leaf area (10), specific leaf area (11), chlorophyll content (12), net photosynthetic rate (13), stomatal conductance (14), transpiration rate (15), intercellular CO2 concentration (16), maximum photosynthetic capacity (17), light saturation point (18), light compensation point (19), dark respiration rate (20), and apparent quantum yield (21).
Forests 16 01193 g007
Table 1. Effect score of light on seedling growth of Hopea hainanensis Merr. & Chun seedlings.
Shading Degree1st Principal Component Score (Y1)2nd Principal Component Score (Y1)Aggregate Score (Y)
T05.001−1.6773.373
T11.2982.9081.584
T2−2.6900.200−1.963
T3−3.610−1.430−2.994
Disclaimer/Publisher’s Note: The statements, opinions and data contained in all publications are solely those of the individual author(s) and contributor(s) and not of MDPI and/or the editor(s). MDPI and/or the editor(s) disclaim responsibility for any injury to people or property resulting from any ideas, methods, instructions or products referred to in the content.

