Article

Simulation and Prediction of the Potential Distribution of Two Varieties of Dominant Subtropical Forest Oaks in Different Climate Scenarios

1
College of Life Science, Shanxi Normal University, Taiyuan 030031, China
2
Key Laboratory of Resource Biology and Biotechnology in Western China (Ministry of Education), College of Life Sciences, Northwest University, Xi’an 710069, China
3
School of Biological Sciences, Guizhou Education University, Guiyang 550018, China
*
Authors to whom correspondence should be addressed.
Forests 2025, 16(7), 1191; https://doi.org/10.3390/f16071191
Submission received: 6 June 2025 / Revised: 3 July 2025 / Accepted: 13 July 2025 / Published: 19 July 2025
(This article belongs to the Section Forest Ecology and Management)

Abstract

Climatic oscillations in the Quaternary are altering the performance of angiosperms, while the species’ distribution is regarded as a macroscopic view of these spatial and temporal changes. Oaks (Quercus L.) are important tree models for estimating the abiotic impacts on the distribution of forest tree species. In this study, we modeled the past, present, and future suitable habitat for two varieties of deciduous oaks (Quercus serrata and Quercus serrata var. brevipetiolata), which are widely distributed in China and play dominant roles in the local forest ecosystem. We evaluated the importance of environmental factors in shaping the species’ distribution and identified the “wealthy” habitats in harsh conditions for the two varieties. The ecological niche models showed that the suitable areas for these two varieties are mainly concentrated in mountain ranges in central China, while Q. serrata var. brevipetiolata is also widely distributed in the middle-east mountain range. The mean temperature of the coldest quarter was identified as the critical factor in shaping the habitat availability for these two varieties. From the last glacial maximum (LGM) to the present, the potential distribution range of these two sibling species has obviously shifted northward and expanded from the inferred refugia. Under the optimistic (RCP2.6), moderate (RCP 4.5)-, and higher (RCP 6.0)-concentration greenhouse gas emissions scenarios, our simulations suggested that the total area of suitable habitats in the 2050s and 2070s will be wider than it is now for these two varieties of deciduous oaks, as the distribution range is shifting to higher latitudes; thus, low latitudes are more likely to face the risk of habitat losses. This study provides a case study on the response of forest tree species to climate changes in the north temperate and subtropical zones of East Asia and offers a basis for tree species’ protection and management in China.

1. Introduction

The climate alterations of the Quaternary have a profound impact on biodiversity, the geographical distribution of species, and the function of essential terrestrial ecosystems [1,2]. The local extinction risk for plant species or populations under climate change varies, depending on their ability to cope with altered habitat conditions [3,4]. They could migrate/disperse to new favorable locations, adapting locally to novel environments [3], which results in range expansion or contraction [5,6]. Consequently, the capacity to trace the potential distribution patterns of species under different climate conditions would contribute substantially to the academic disciplines of biogeography and global change biology [7]. Particularly for large and long-lived forest trees, many of which have commercial, ecological, and societal relevance, the pace of climate change could be too fast for the populations to adapt [3]. Consequently, the urgency of simulating forest tree species’ distributions lies in isolating critical stressors and susceptibility loci, thereby enabling evidence-based management frameworks for ecological sustainability.
Species distribution modeling (SDM) has been employed as part of a variety of statistical techniques to predict the geographic distribution of and potential threats to species. It is accomplished by analyzing the existing data on species occurrences and the associated environmental factors (e.g., [1,7,8]). The realized niche reflects a species’ actual geographical distribution shaped by biotic and abiotic constraints [9]. In recent years, maximum entropy (Maxent) has emerged as one of the most influential methods for the prediction of biodiversity loss under future climate scenarios [10] and the rational use of environmental resources [11].
Quercus is one of the most diverse and ecologically important tree genera, occurring throughout the Northern Hemisphere [12,13]. These oaks are the keystone species in many temperate forests, subtropical forests, and woodlands, providing fundamental regulation, provision, support, and cultural ecosystem services for people and nature [14]. Climate change is leading to a reduction in biodiversity, ecosystem services, and forest resilience within forest ecosystems; therefore, predicting the geographical distribution of oak species under climate change has become crucial [15]. White oaks (Quercus Section), which are mainly distributed in North America and Eurasia [12], have been well studied in North America and Europe, primarily by detailed phylogeographic studies using molecular data and species distribution using SDM [14,16,17,18]. However, while Asia is a major center of species diversity for white oaks [19], studies on distribution models and refugia in this region are still lacking.
A total of seven white oaks are found in East Asia, with Quercus serrata Murray and Quercus serrata var. brevipetiolata (A.DC.) Nakai, recognized as a variation of Q. serrata widely distributed in China [20]. According to the Flora Reipublicae Popularis Sinicae (FRPS), the stable morphological difference between the variety Q. serrata var. brevipetiolata and the original Q. serrata is the smaller leaves and shorter petioles of Q. serrata var. brevipetiolata [21]. These two varieties are distributed in warm temperate forests, serving as important components of both deciduous broad-leaved and mixed broad-leaved forests [20], and provide multiple important ecosystem services such as the enhancement of plant and animal biodiversity, carbon sequestration, protection from soil erosion, and provision of wood and timber resources. Another highly significant usage is of its seed, known as Chinese acorn, which is rich in starch and multiple amino acids and has also served as a traditional Chinese medicine and foodstuff [22]. Additionally, the acorn has seen extensive application in various industries, including fermentation and brewing, as a sizing agent in the textile industry, and in the production of modified starch, organic acids, green fuels, and eco-friendly membrane materials [13,23]. Therefore, selecting these two taxa as research subjects has important ecological significance and economic value.
Geological activities and past climate fluctuations are considered to be the two historical factors that have caused changes in oak distribution patterns [24]. Recently, paleodistribution model projections of SDM have suggested geological movements and climatic turbulence caused similar and synchronous dynamics of three sclerophyllous oaks (Q. spinosa, Q. aquifolioides, and Q. rehderiana) during the last interglacial period (LIG, ~120,000 years BP), indicating that their potentially suitable area was the smallest, mainly distributed in the Eastern Himalayas and Hengduan Mountains. During the last glacial maximum (LGM, ~22,000 years BP), their potentially suitable area experienced an expansion [24]. Some plant studies in subtropical China suggest that Quaternary climatic change caused populations to moved southward to lower latitudes during periods of glaciation, and then a northward colonization from south refugia could have occurred when the temperatures increased post glaciation [25,26,27]. However, the possible patterns of refugia and the postglacial population dynamic of deciduous oak species distributed China remain largely uncertain. Q. serrata and Q. serrata var. brevipetiolata can be used as models to explore the dynamics of deciduous oaks in response to climate change.
Based on an extensive collection of species records and high-resolution bioclimatic variables of different climate periods, the objectives of this study are (1) to estimate the potential distribution of two variants (Q. serrata and Q. serrata var. brevipetiolata) under current, past, and future climatic scenarios and identify the main factors causing a shift in the suitable habitat of the tree species and (2) to infer the distribution and potential glacial refugia under the LGM and forecast the areal extent of the suitable habitat under future climate conditions for these two varieties. The results will provide a theoretical reference framework for the protection, management, and utilization of Q. serrata and Q. serrata var. brevipetiolata.

2. Materials and Methods

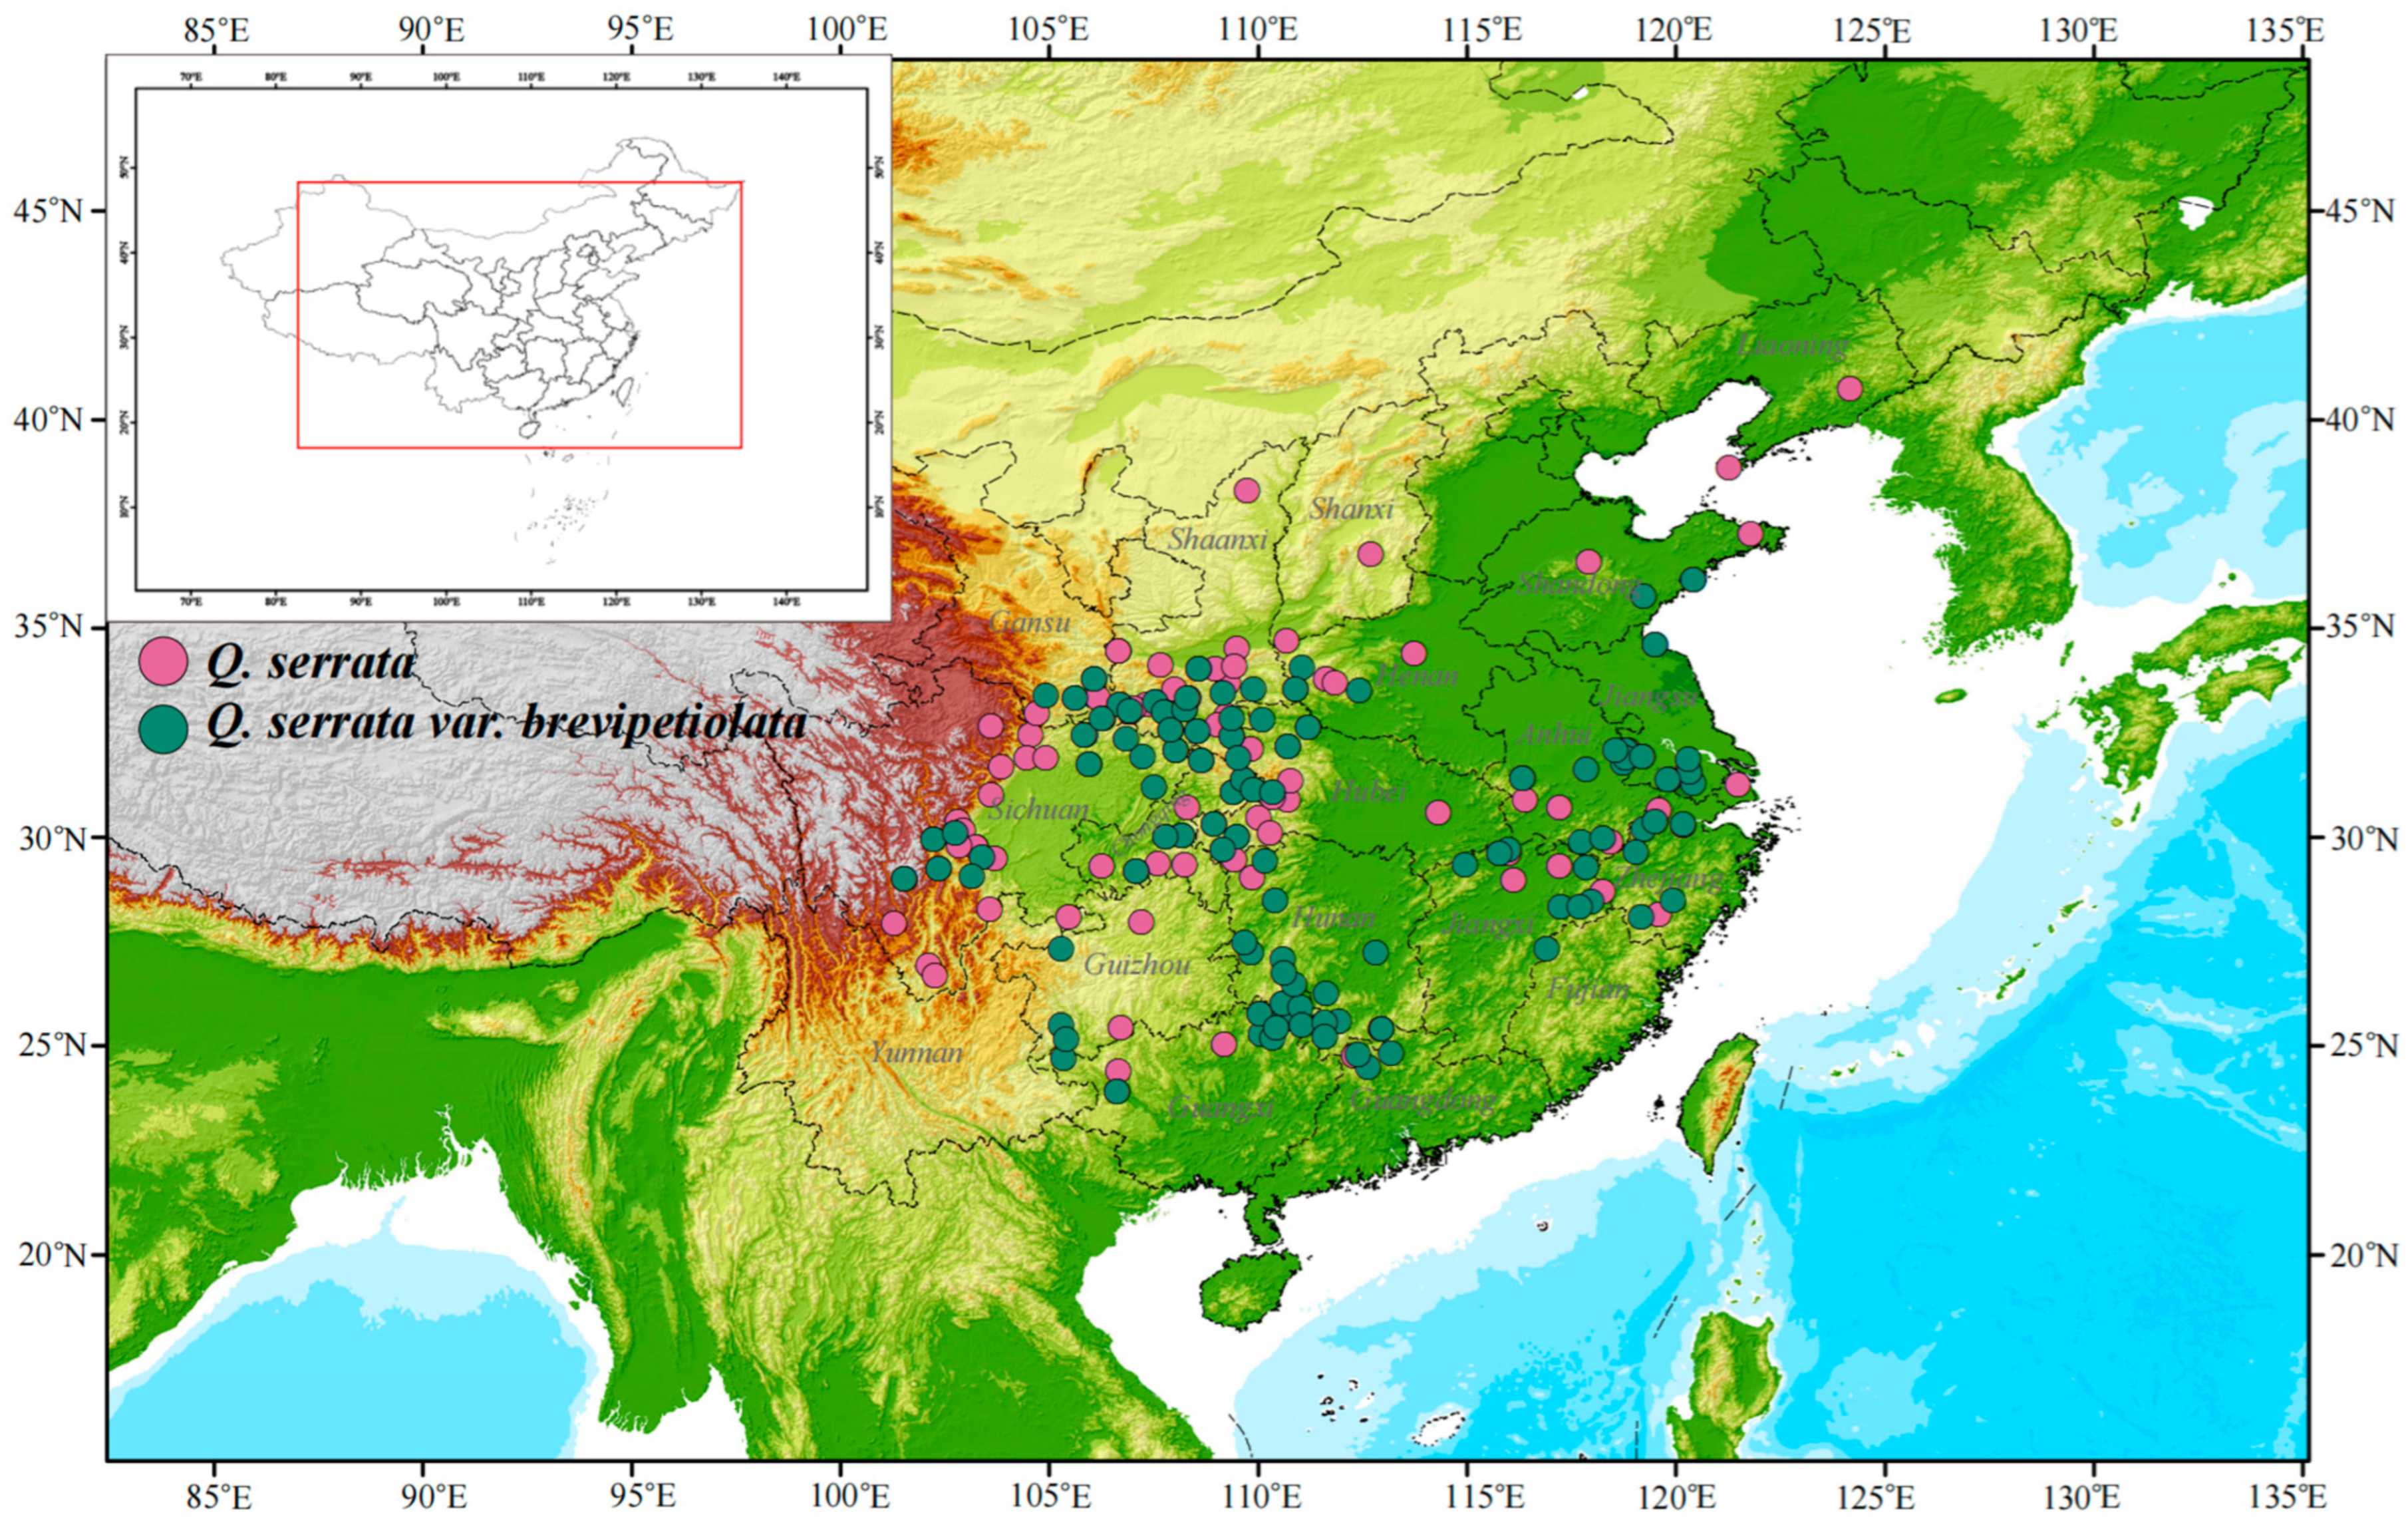
2.1. Species Occurrence Data

Q. serrata and Q. serrata var. brevipetiolata are deciduous forest tree species distributed in East Asia. The data of these two varieties throughout the geographic distribution range were compiled from the Chinese Virtual Herbarium platform, the Global Biodiversity Information Facility, and our team’s filed surveys on the geographical distribution of oak species. After removing duplicates and ambiguous records, 228 occurrences (120 for Q. serrata, 108 for Q. serrata var. brevipetiolata) were retained. The detailed distribution sites of the occurrences of these two variants are shown in Figure 1.

2.2. Environmental Variables

Bioclimatic data for current conditions (ca. 1960–1990), comprising 19 variables at 2.5 arc-min resolution, were sourced from the WorldClim database (www.worldclim.org). In order to avoid overfitting linked to correlated climatic parameters, only those variables with low correlation coefficients with one another (r < |0.8|) were retained for subsequent analysis. The variable contribution rates were assessed using the knife-cutting method in Maxent, and the environmental variables were pre-selected by synthesizing these outcomes with response curve data from both varieties. Finally, eight climatic variables were selected as data predictors (Table S1). The paleoclimatic data for the last glacial maximum (LGM, ~22,000 years BP) were derived from CCSM4 [28] and MIROC [29]; the future climate data are from the CCSM4 projections used in the Fifth Assessment IPCC report with representative concentration pathways (RCPs) for carbon dioxide for the 2050s (average of predictions for 2041–2060) and 2070s (average of predictions for 2061–2080). The RCP scenarios have been used in other Quercus species research. Some studies have found that RCP 8.5 is a pessimistic scenario, due to overestimating the future supply of fossil fuels, while 90% of fossil fuels will be exhausted by 2070 [30]. Thus, the relatively pessimistic scenario (RCP 6.0) was used to analyze the distribution area of Q. serrata and Q. serrata var. brevipetiolata. In addition, we also simulated the optimistic (RCP 2.6) and moderate (RCP 4.5) emission scenarios to analyze the distribution area of these two varieties.

2.3. Niche Analyses in Geographical Space (G-Space)

We constructed reciprocal species distribution models (SDMs) for Q. serrata and Q. serrata var. brevipetiolata across China using the maximum entropy algorithm implemented in MaxEnt ver. 3.4.1 [31]. Eight bioclimatic variables (BIO1, BIO2, BIO6, BIO7, BIO11, BIO12, BIO15, BIO19; Table S1) were spatially clipped to the study region using ArcGIS 9.3 (ESRI, Redlands, CA, USA). The model settings followed Zhou et al. (2024) [32]. The model performance was evaluated using the area under the receiver operating characteristic curve (AUC), with values interpreted as: >0.9 (high accuracy), 0.7–0.9 (good accuracy), and <0.7 (low accuracy) according to Swets (1988) [33]. The potential habitats were classified into four suitability levels in ArcGIS using manual classification: unsuitable (0–0.2), low suitability (0.2–0.4), moderate suitability (0.4–0.6), and high suitability (0.6–1.0).

2.4. Niche Analyses in Environmental Space (E-Space)

Environmental niche comparisons employed a PCA-env approach following Broennimann et al. (2012) [34], implemented via R scripts adapted from Herrando-Moraira et al. (2019) [35]. We extracted values for the eight climatic variables and calculated the population occurrence densities using kernel smoothing [36]. This generated PCA-env plots simultaneously representing available climates and occupied conditions at 20% and 100% occurrence density thresholds. To quantify climatic niche overlap across geographic ranges, we constructed an uncorrelated multivariate climate space using the first three principal components derived from the PCA of all climatic variable values. Occurrence data were visualized in this space as minimum-volume ellipsoids (MVEs) encompassing presence points. Additionally, we generated niche occupancy profiles along individual ecological gradients using MAXENT and the R package ‘pno’ v0.9.5 [37].

2.5. Shifts in the Centroids of Suitable Distribution Areas

To comprehensively assess the distributional changes, we calculated the centroids of suitable habitats and generated vector diagrams to visualize the direction and magnitude of the centroid shifts for both varieties across the climate scenarios. Using the SDM_Toolbox v2.4 package, we identified suitable habitat locations. We computed centroid migration distances by comparing positional changes from the last interglacial (LIG), last glacial maximum (LGM; MIROC and CCSM scenarios), present day, and future projections (2050s and 2070s). The workflow comprised three stages: (1) converting simulated potential distribution areas to binary vector layers, (2) calculating centroid coordinates within suitable habitats using spatial analysis tools, and (3) quantifying centroid shifts for Q. serrata and Q. serrata var. brevipetiolata across temporal periods and climate regimes using species distribution models (SDMs), enabling the systematic evaluation of suitable habitat migration distances for both taxa.

3. Results

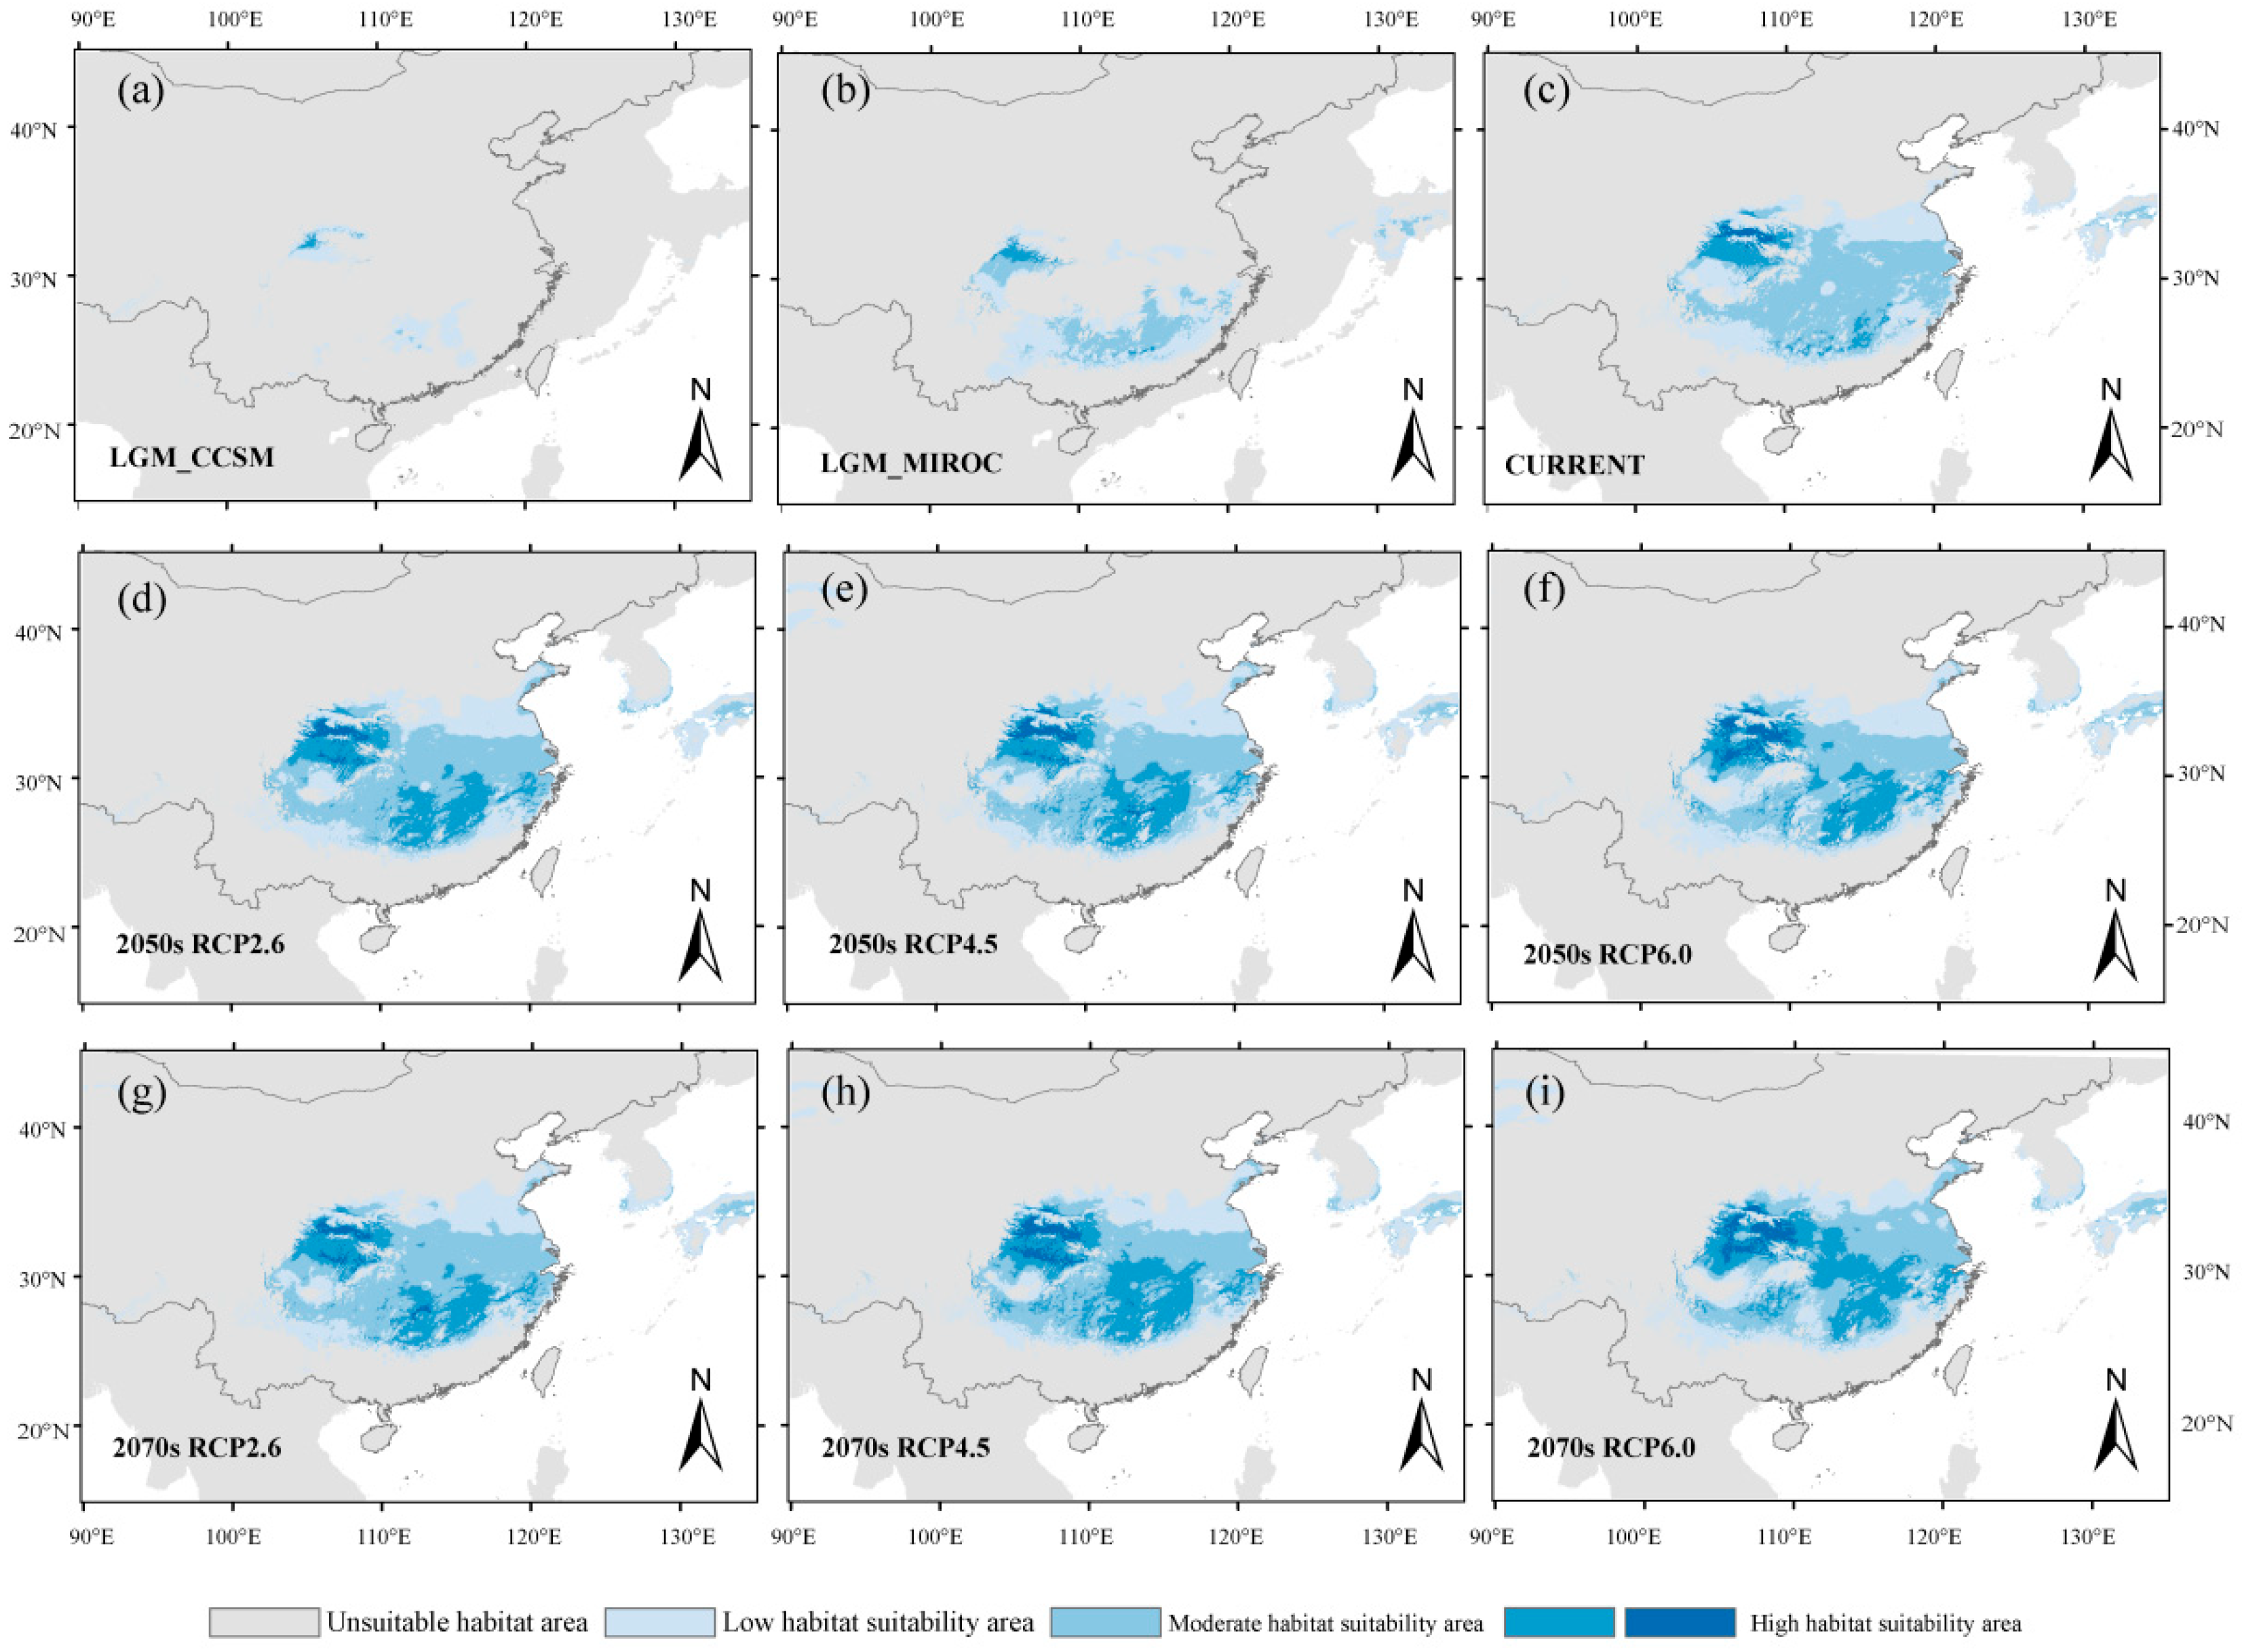
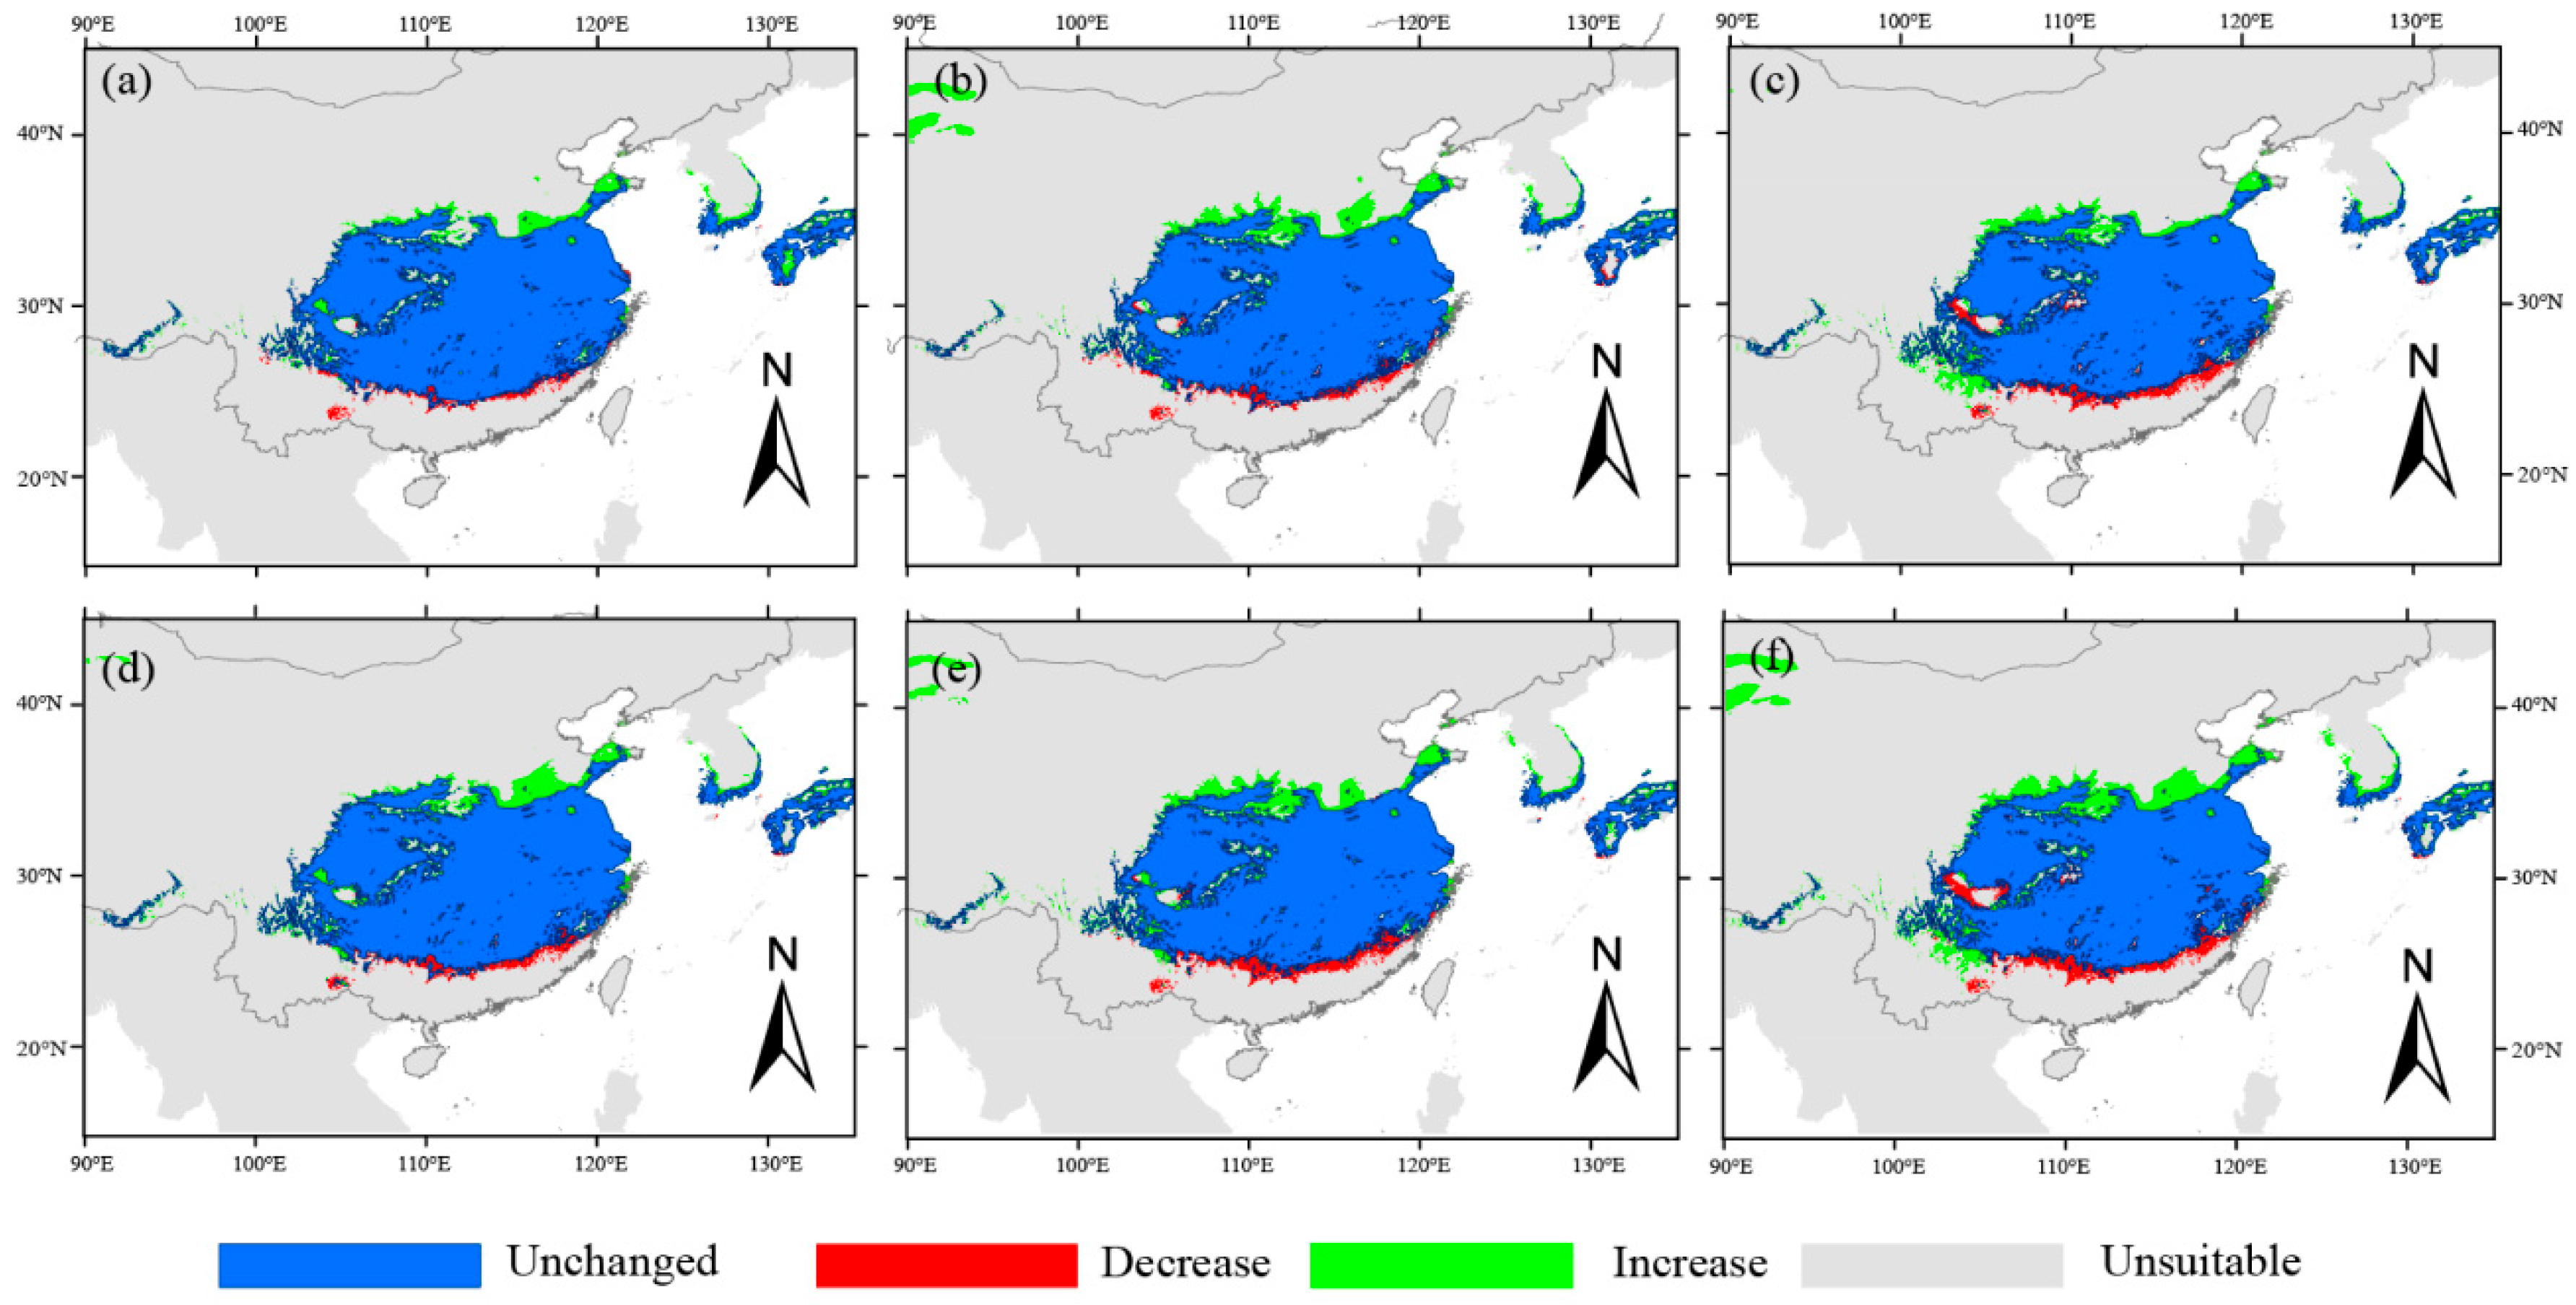
3.1. Potential Geographical Distribution of Q. serrata and Q. serrata var. brevipetiolata Under Different Climatic Scenarios

MaxEnt model projections for Q. serrata and Q. serrata var. brevipetiolata distributions across temporal periods are presented in Figure 2 and Figure 3. Currently, Q. serrata occupies mountainous areas of central–eastern Sichuan, the Qinling Mountains, and adjacent ranges in Hubei and Hunan. In contrast, Q. serrata var. brevipetiolata exhibits broader distribution across central–eastern China, encompassing mountainous regions of Shaanxi, Hunan, Hubei, Anhui, Jiangsu, and Zhejiang Provinces (Figure 2a,b and Figure 3a,b). Both taxa show distributional overlap in the Qinling Mountains. Current habitat suitability analysis reveals that the low-, moderate-, and high-suitability areas are 87,929 km2, 71,627 km2, and 21,280 km2 for Q. serrata versus 62,929 km2, 79,559 km2, and 14,997 km2 for Q. serrata var. brevipetiolata (see Table S2 for complete metrics).
During the LGM, the potential distributions of Q. serrata and Q. serrata var. brevipetiolata underwent significant changes (Figure 2a,b and Figure 3a,b). Both climate models indicated that Q. serrata var. brevipetiolata occupied more restricted moderate- and high-suitability areas than Q. serrata during the LGM (moderate suitability: 1.1319 km2 vs. 14.8750 km2 [CCSM], 23.5608 km2 vs. 32.5382 km2 [MIROC]; high suitability: 0.7049 km2 vs. 9.1059 km2 [CCSM], 2.9028 km2 vs. 11.3455 km2 [MIROC]; Table S2). Relative to the present, Q. serrata exhibited reductions in moderate- and high-suitability areas under both LGM models: decreases of 56.7517 km2 (8.80%) and 12.1736 km2 (1.89%), respectively, under CCSM, and 39.0885 km2 (6.06%) and 9.9340 km2 (1.54%), respectively, under MIROC (Tables S2 and S3). Q. serrata var. brevipetiolata showed greater reductions: moderate-suitability areas declined by 78.4271 km2 (12.15%) [CCSM] and 55.9983 km2 (8.68%) [MIROC], while high-suitability areas decreased by 14.2917 km2 (2.21%) [CCSM] and 12.093 km2 (1.87%) [MIROC] (Tables S2 and S3). Refugia for both taxa were consistently identified in the mountains of central and southern China, including the Qinling and Nanling ranges (Figure 2a,b and Figure 3a,b).
Under future climate scenarios, both varieties showed potential distribution gains compared to their current habitats (Figure 2d–i and Figure 3d–i). Although moderate-suitability areas for Q. serrata var. brevipetiolata may contract during the 2050s and 2070s, its high-suitability areas are projected to nearly double, offsetting these losses. Q. serrata, however, is projected to expand significantly in both moderate- and high-suitability areas across all scenarios (Table S2). Under RCP 2.6 (450 ppm CO2-eq by 2100; ΔT = 0.2–1.8 °C), the low-suitability area for Q. serrata increased to ~2.1094 × 10⁶ km2 by the 2050s but decreased by 10.8733 × 10⁶ km2 by the 2070s, with net gains in the total suitable area across both periods. For Q. serrata var. brevipetiolata, the low- and moderate-suitability areas declined during the 2050s and 2070s, while the high-suitability areas nearly doubled, relative to current projections. Under RCP 4.5 (moderate emissions) and RCP 6.0 (high emissions), both varieties exhibited similar distribution patterns for low-, moderate-, and high-suitability areas during the 2050s and 2070s (Tables S2 and S3).

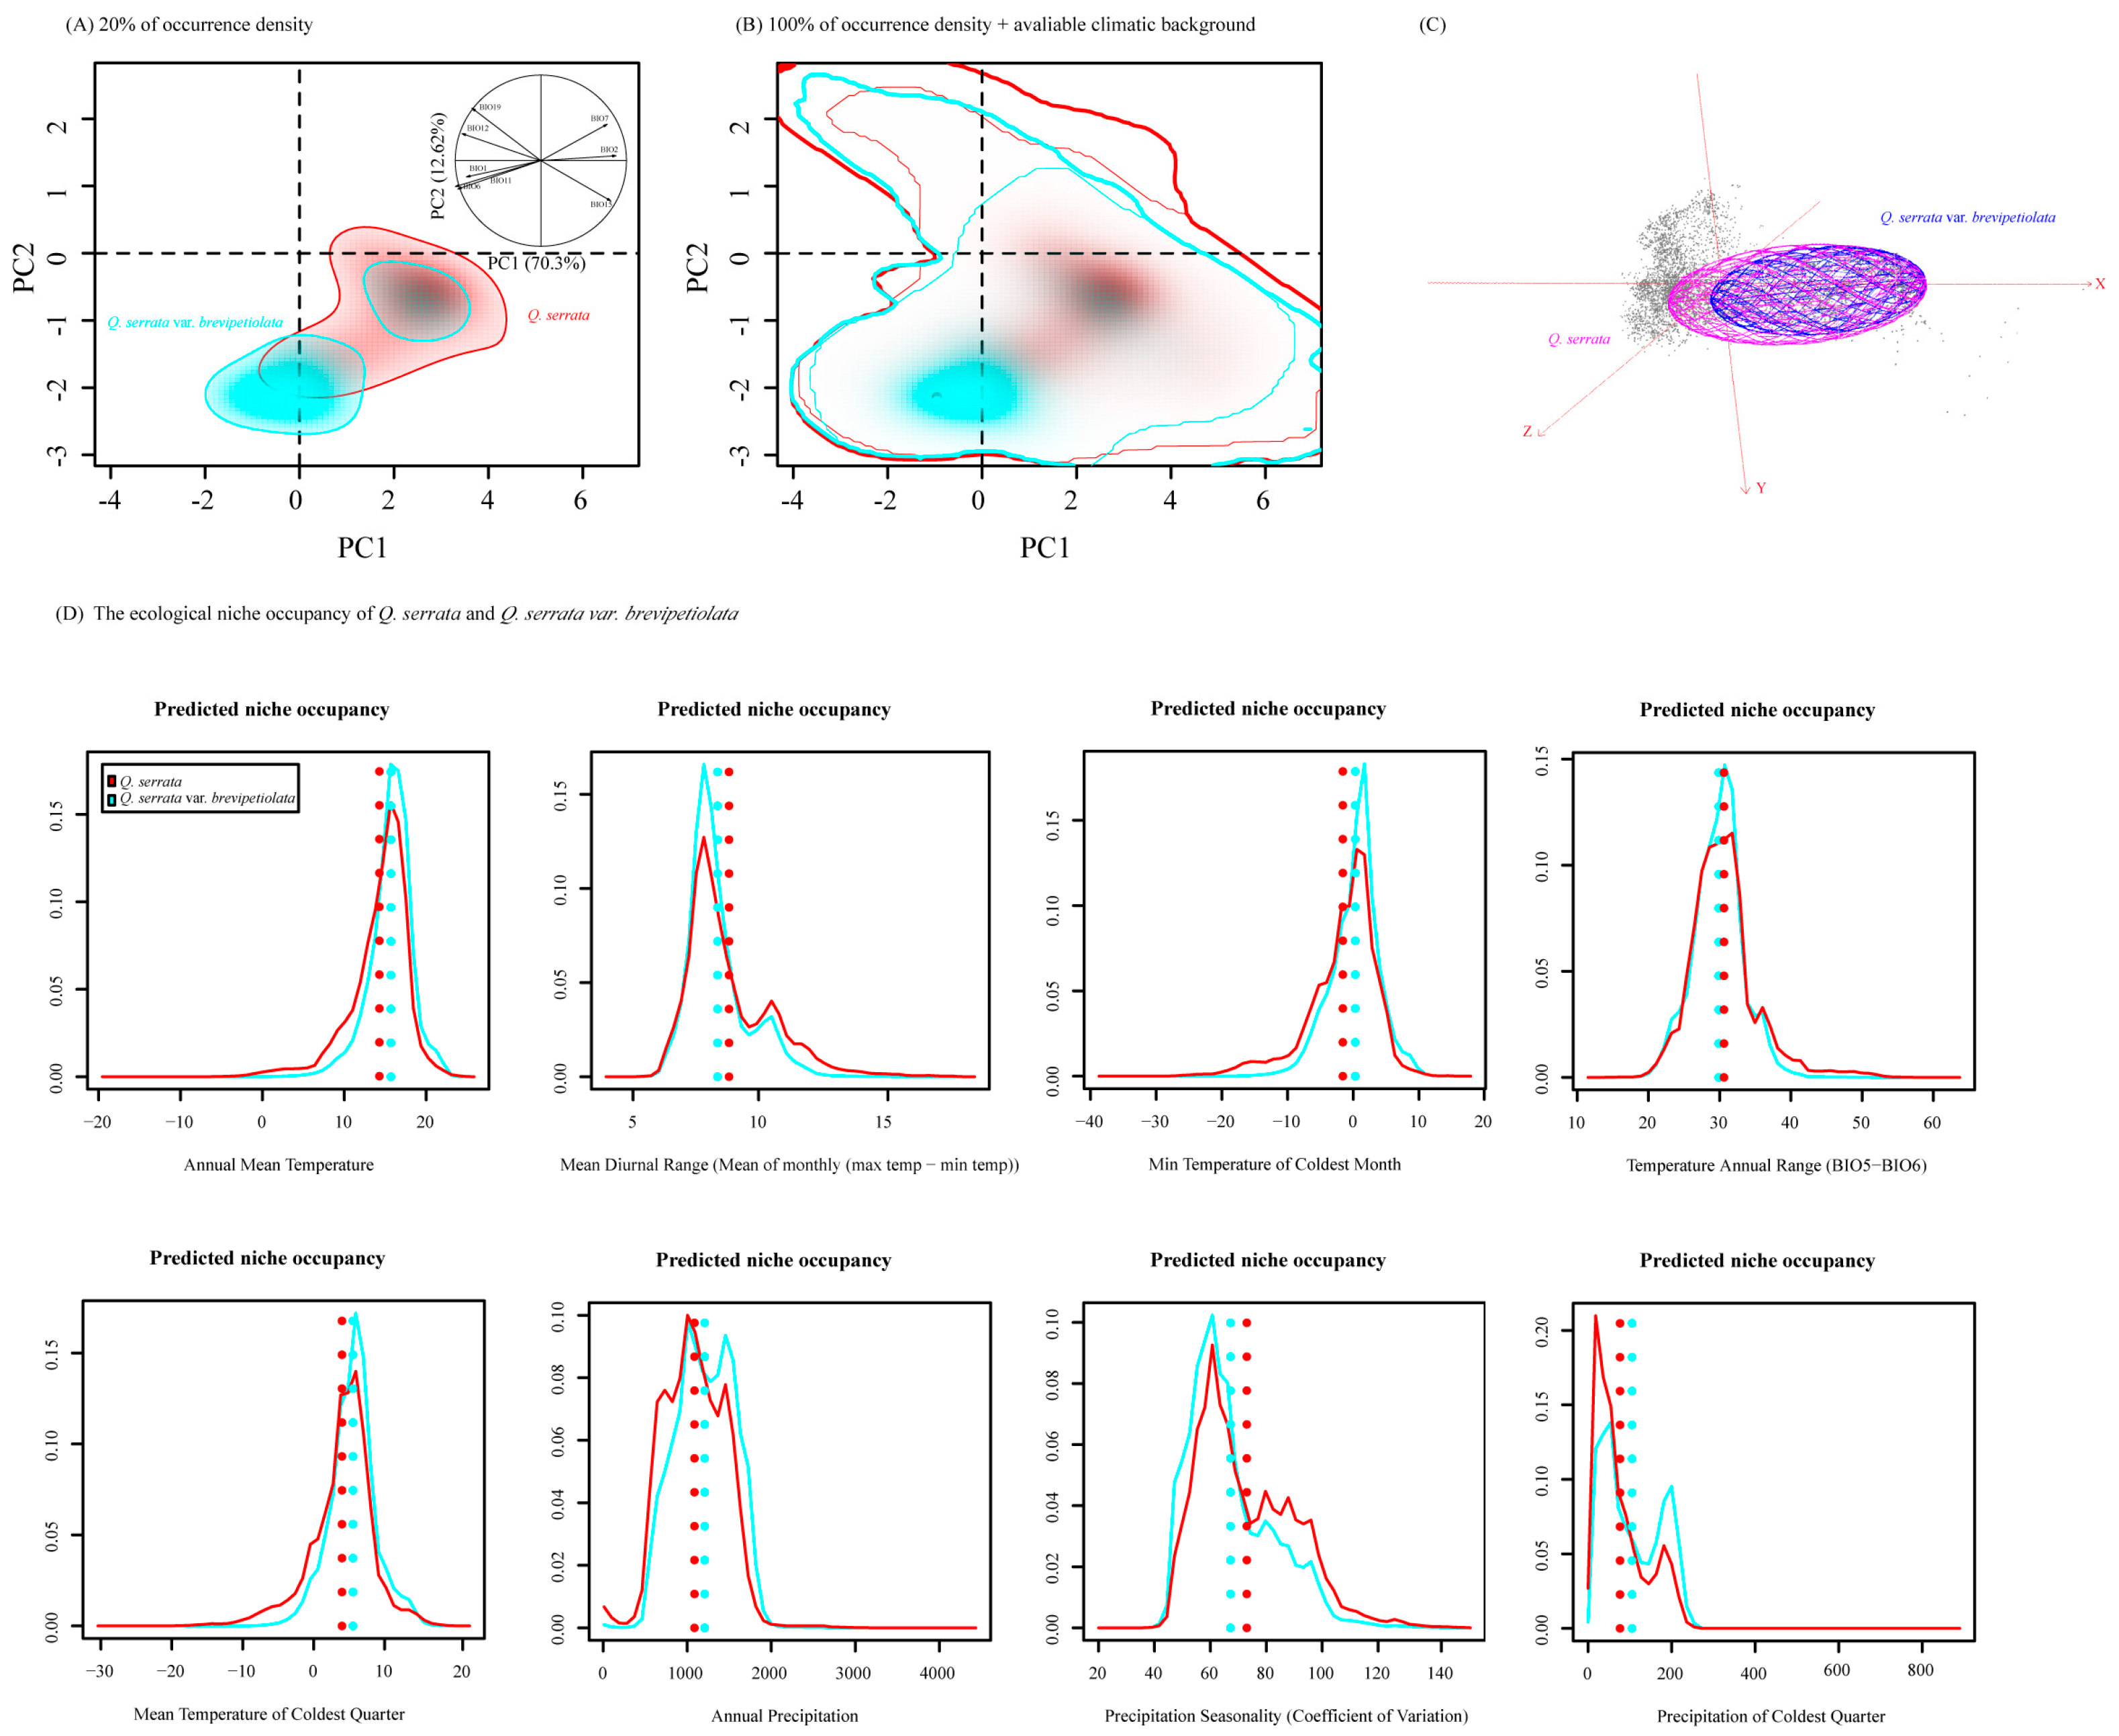
3.2. Niche Variation on E-Space

PCA-env revealed 82.92% of the variance was explained by PC1 (70.3%) and PC2 (12.62%). PC1 correlated with the annual mean temperature and PC2 with the mean coldest quarter temperature (Figure S3). The niche plots showed substantial overlap but distinct core distributions (Figure 4). MVEs indicated similar climatic niches (Figure S3). Fine-scale phenological niche modeling further showed that the weighted average of the niche occupancy of the two species in the precipitation- and temperature-dependent dimension had differences to some extent, although the differences were not significant.

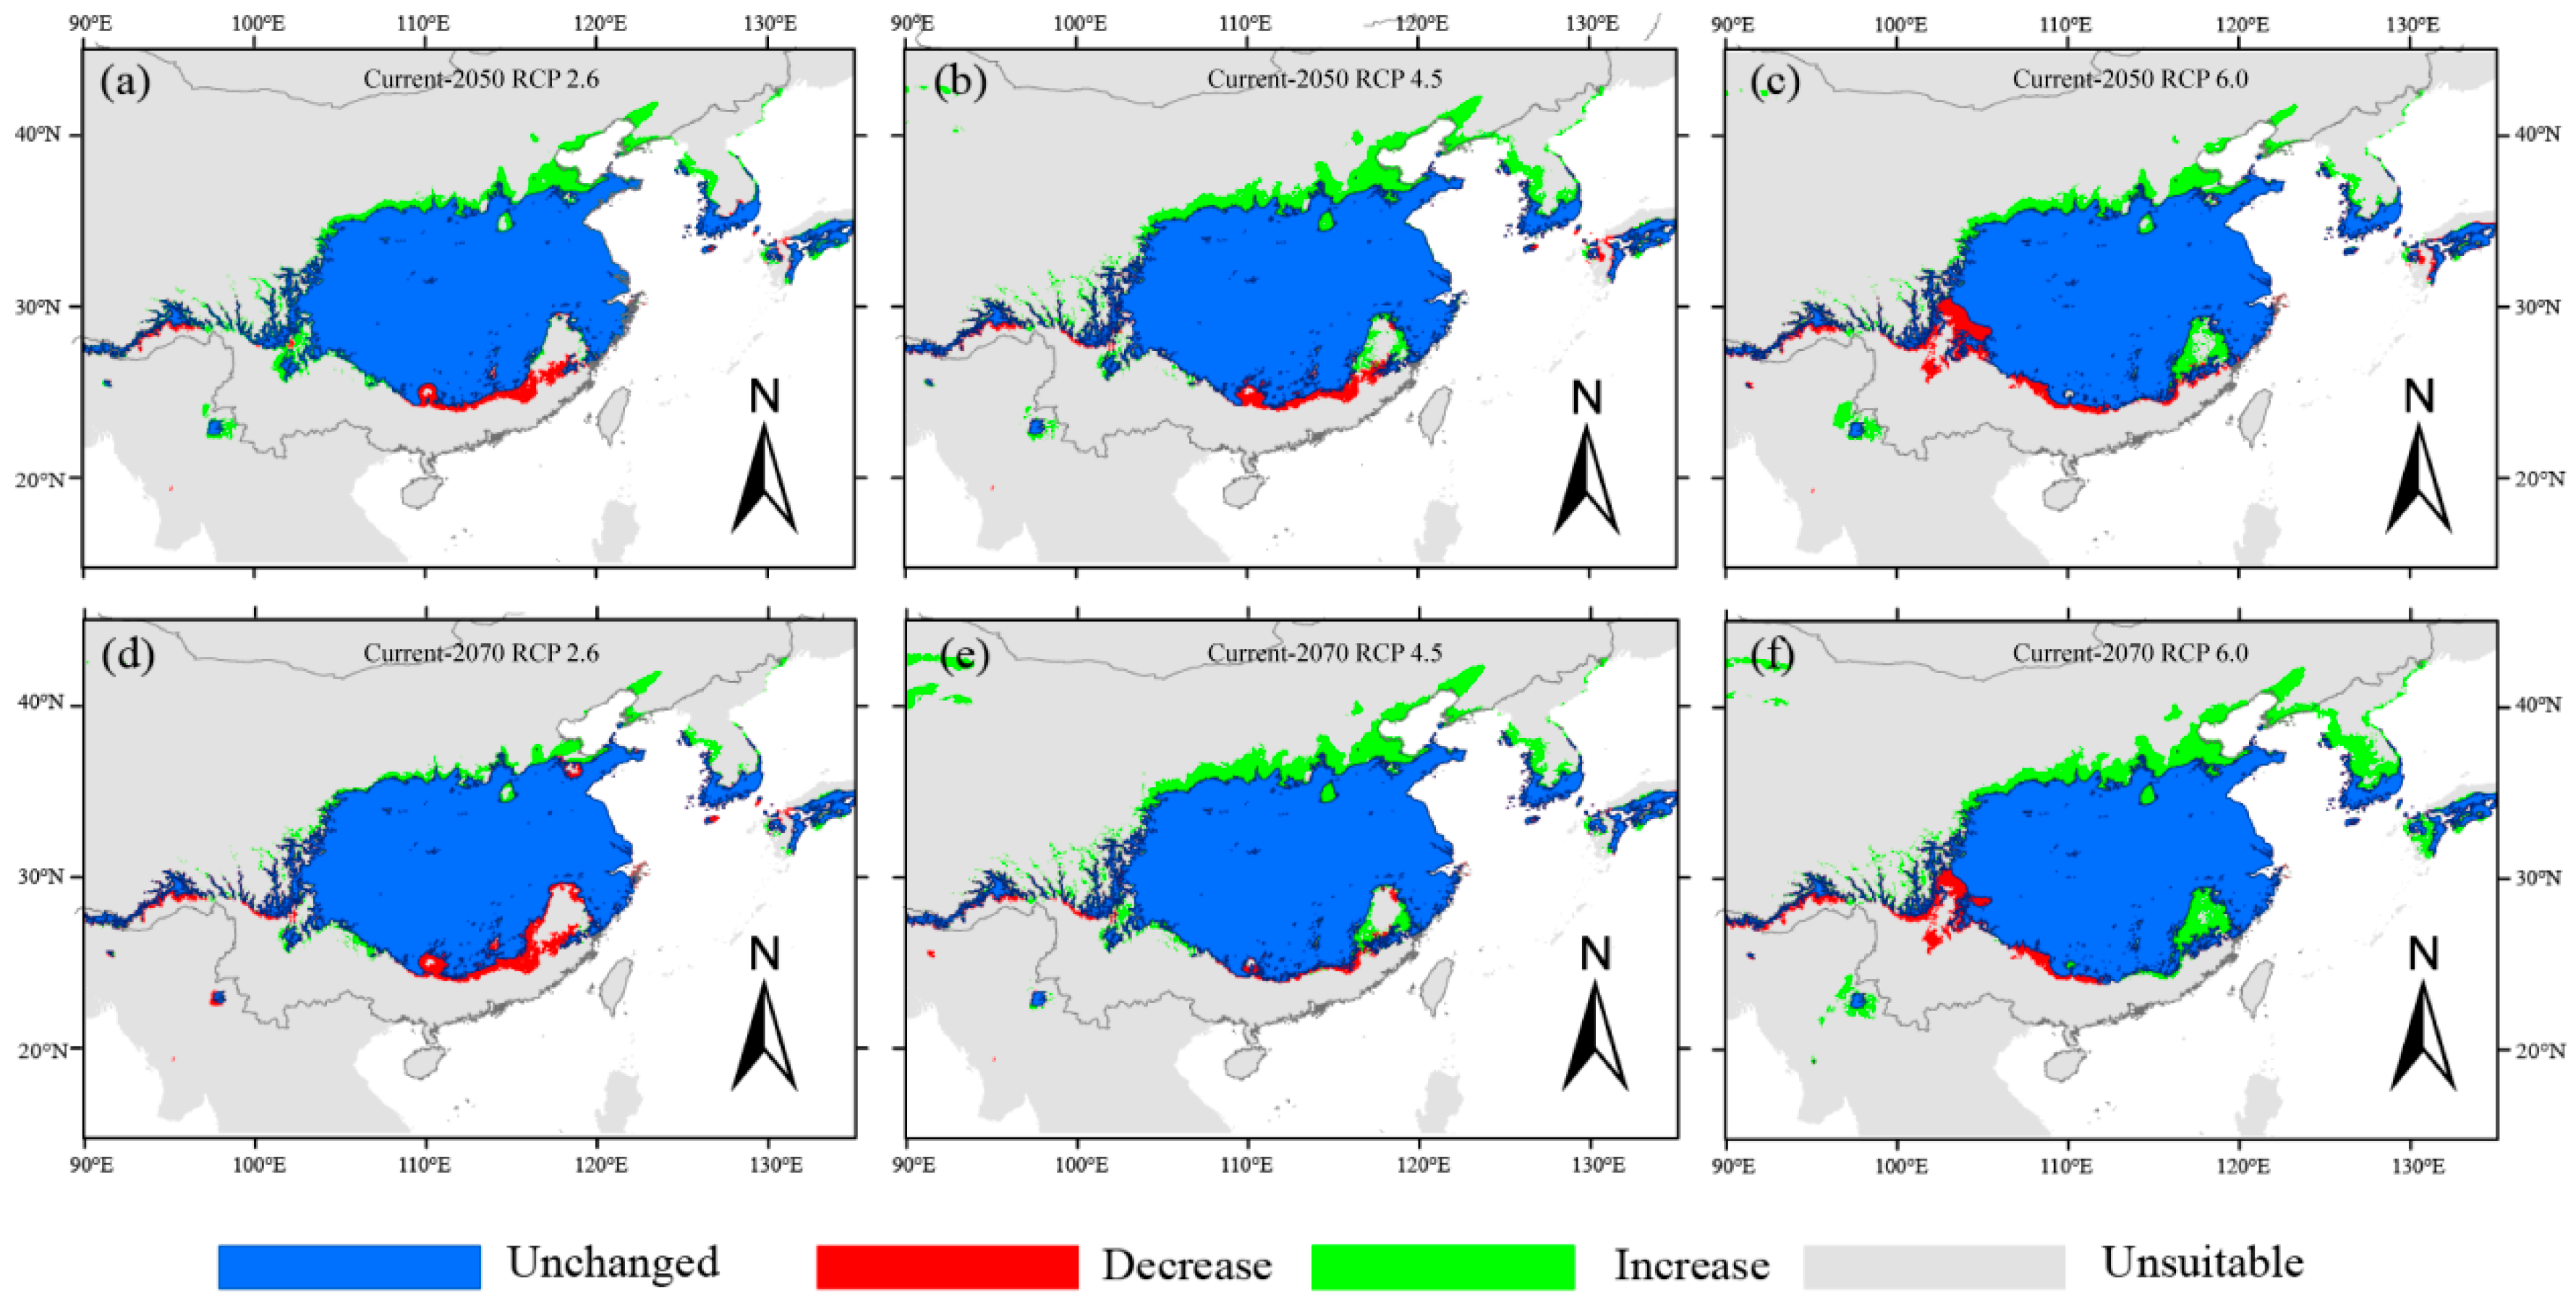
3.3. Changes in Habitat Suitability of Q. serrata and Q. serrata var. brevipetiolata

Figure 5 and Figure 6 illustrate the projected changes in the potential distribution areas of Q. serrata and Q. serrata var. brevipetiolata for future periods (2050s and 2070s). Under the RCP 2.6 scenario, the potential distribution of Q. serrata at its southern edge is projected to be lost by both the 2050s and 2070s (Figure 5a,d). This loss appears more pronounced under RCP 2.6 than the RCP 4.5 and RCP 6.0 scenarios for the 2050s (Figure 5b,c,e,f). Similarly, Q. serrata var. brevipetiolata shows a comparable trend, with a significant decrease projected for its southern edge under all the 2050s and 2070s climate scenarios examined (Figure 6a–f). Conversely, the potential distribution of both taxa is projected to expand northwards to varying degrees. Notably, Q. serrata exhibited a more extensive potential northward expansion than Q. serrata var. brevipetiolata.

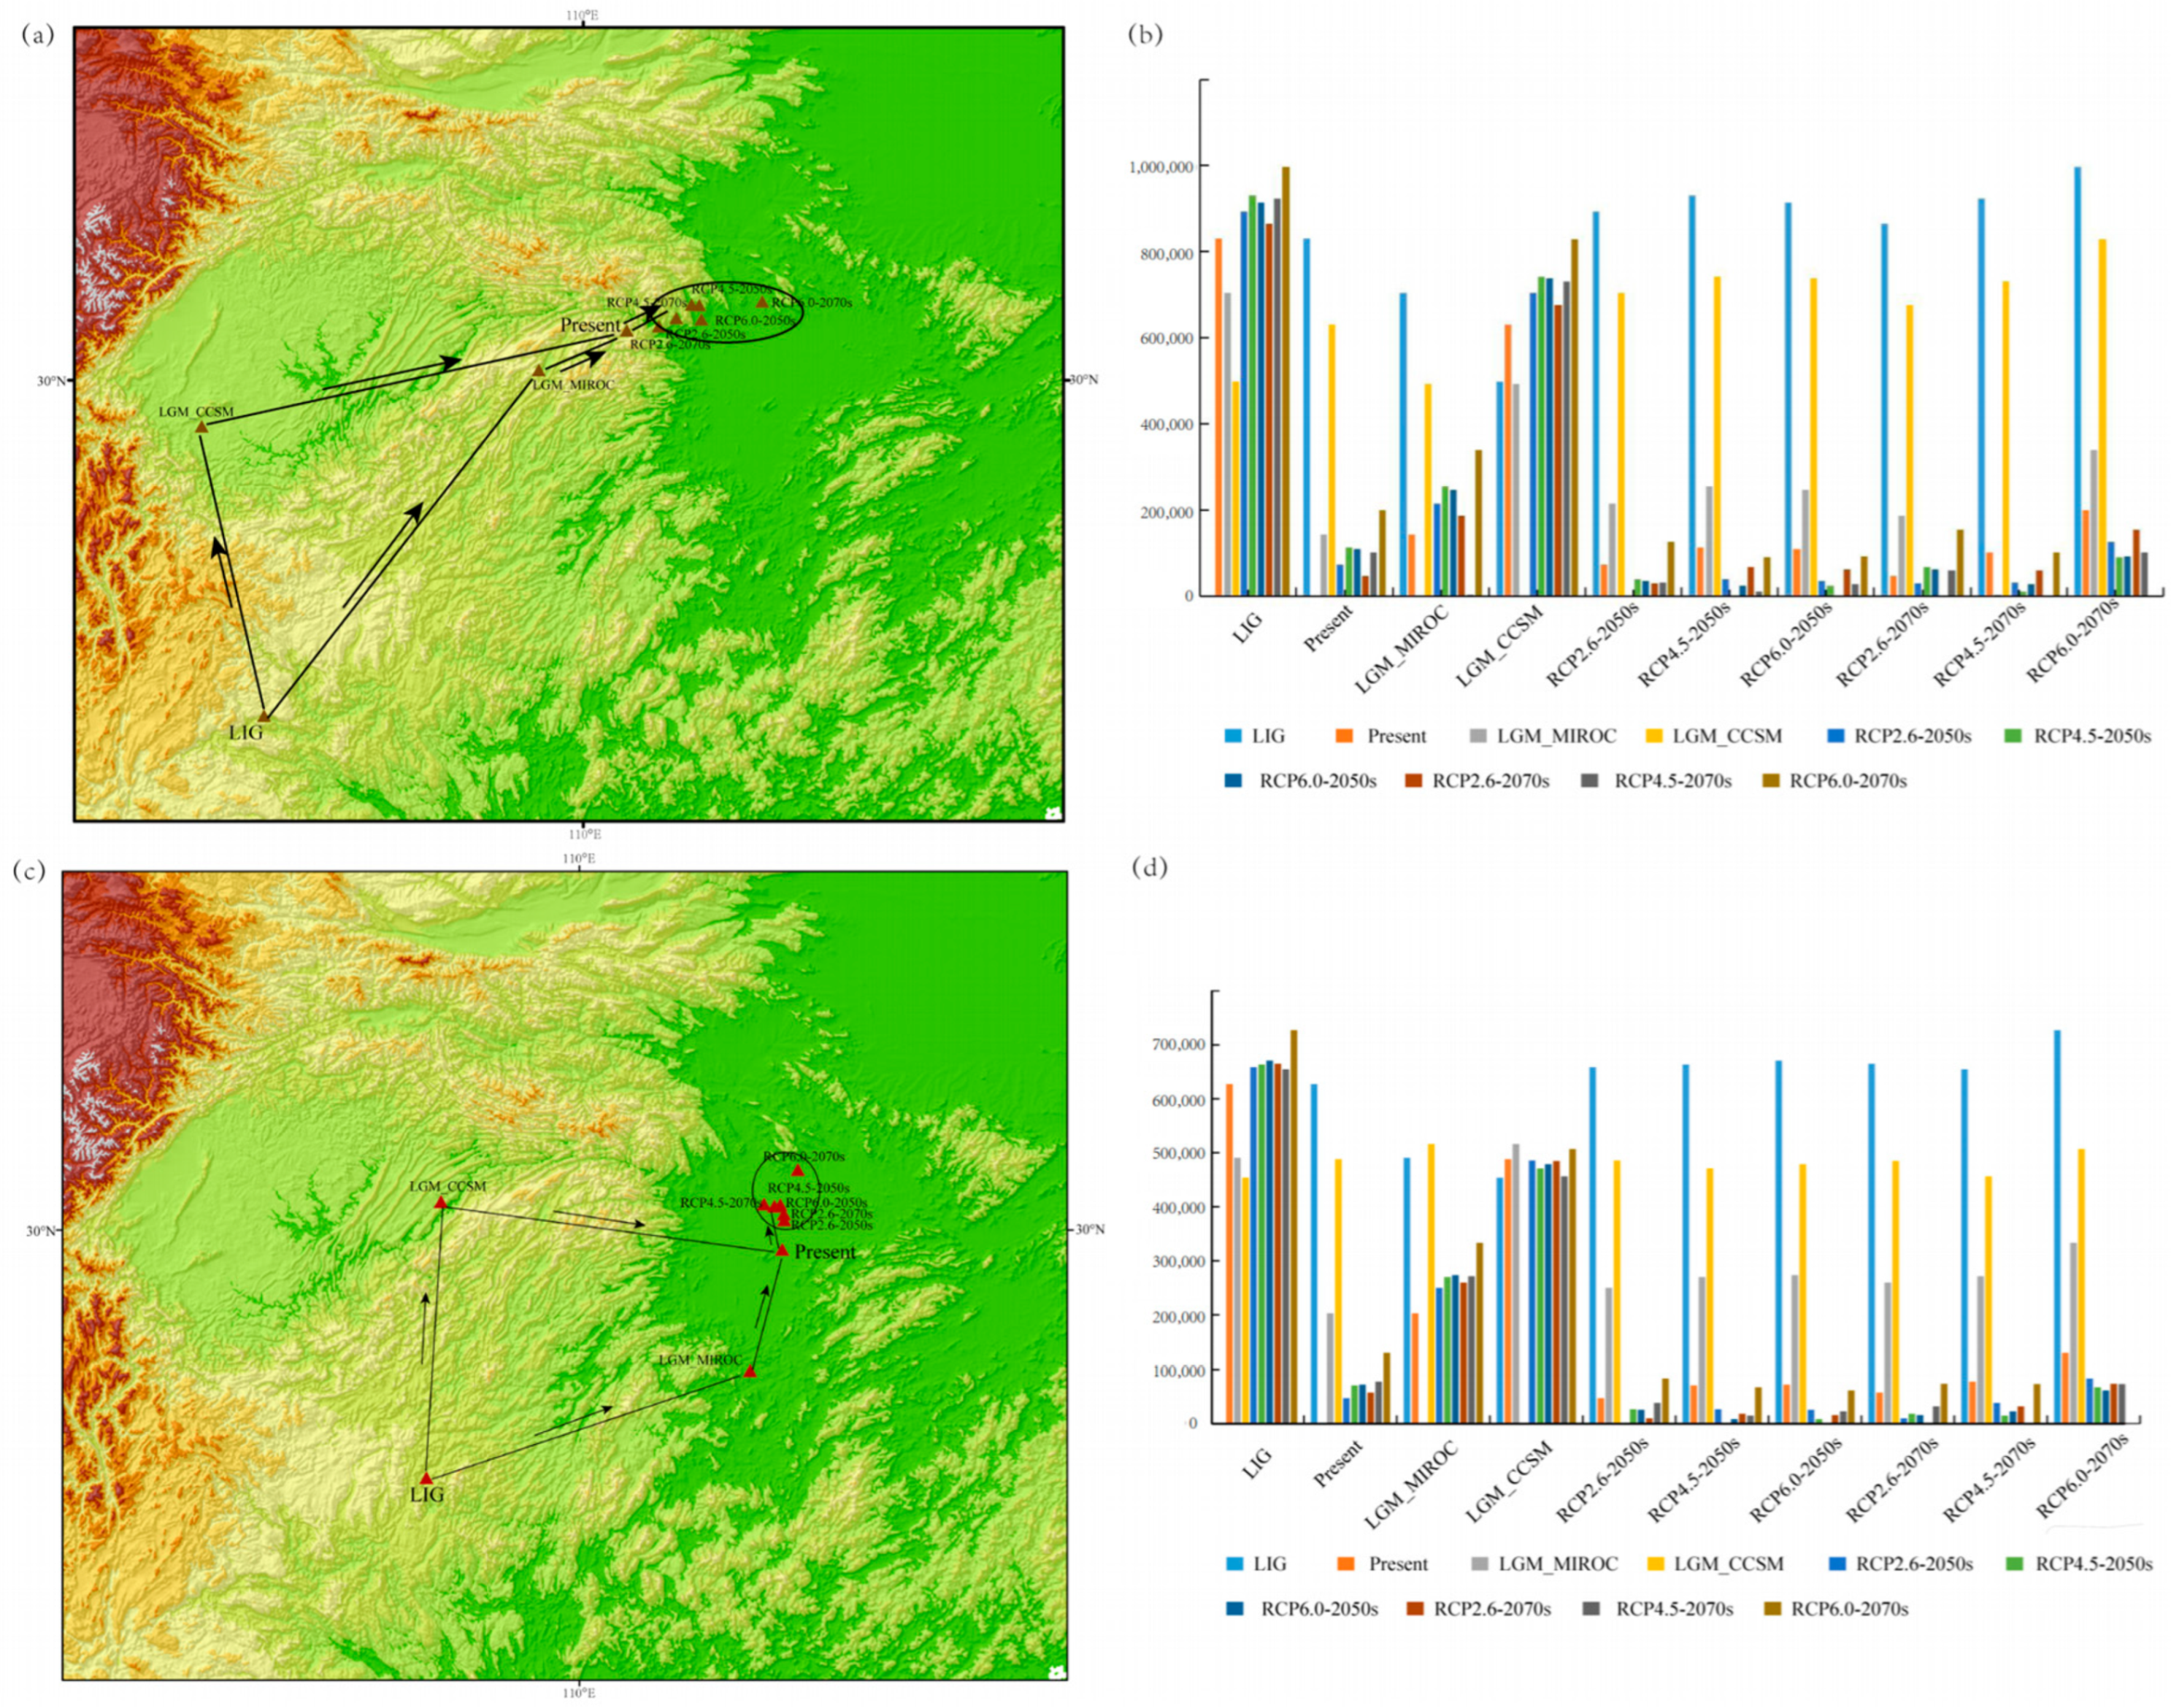
3.4. Displacement Trends Based on the Geometric Centers of Suitable Habitats

The current geometric centers of the potentially suitable habitat for Q. serrata and Q. serrata var. brevipetiolata were located in the Qinling-Ba Mountains (110.64617° N, 30.74621° E) and Yueyang city (112.96361° N, 29.72494° E), respectively. By the 2050s, the centroids of the suitable habitat for both taxa under RCP 2.6, 4.5, and 6.0 scenarios are predicted to shift northeastward: Q. serrata centroids move toward Jiangmen City and Dangyang City, and Q. serrata var. brevipetiolata centroids move northward toward Xishui County, Laoliwan, and Qianjiang City. The estimated migration distances for Q. serrata are 73.723 km (RCP 2.6), 112.033 km (RCP 4.5), and 108.202 km (RCP 6.0), while those for Q. serrata var. brevipetiolata are 47.290 km (RCP 2.6), 70.656 km (RCP 4.5), and 72.178 km (RCP 6.0) (Figure 7a–d).
By the 2070s, the Q. serrata habitat centroids are projected to shift further northeastward under RCP 6.0, potentially reaching Jiangjiawan and Xiaozhoujiawan in Hubei Province (migration distance: 199.643 km). Concurrently, Q. serrata var. brevipetiolata centroids are anticipated to shift further northward under RCP 6.0, reaching Jingshan City in Hubei Province (migration distance: 130.095 km). Historical reconstructions indicate a consistent northward migration trajectory for both taxa from the last interglacial (LIG) through the last glacial maximum (LGM) to the present (Figure 7).

4. Discussion

A detailed knowledge of forest tree species’ distribution is an essential prerequisite for rehabilitating and utilizing species in the forest ecosystem [38,39]. Climate modeling of tree species distribution indicates that both past and future global climate changes likely exert substantial influence on the spatial and temporal dynamics of forests [35]. Despite advances in climate research, most studies on ecologically significant Quercus species in China (e.g., Q. acutissima, Q. glauca, and Q. variabilis [40,41,42]) provide only approximate habitat shift locations and qualitative trend assessments. In this study, we employed maximum entropy (MaxEnt) modeling to predict the distribution patterns and identify high-resolution suitable habitats for Q. serrata and Q. serrata var. brevipetiolata. This approach elucidates how environmental drivers shape the distributions of these foundational oak species.
The climate fluctuations during the Quaternary have left imprints on the distribution patterns of organisms [43,44]. Sympatric and closely related species often exhibit similar distributional responses within the same spatial environments [6]. Using all occurrence records of Q. serrata and Q. serrata var. brevipetiolata, along with eight bioclimatic variables, we applied the maximum entropy (MaxEnt) model to predict their potential geographic distributions. The model performances for late Quaternary conditions, including the last glacial maximum (LGM) based on CCSM and MIROC climate reconstructions, as well as current and future (2050 and 2070) scenarios, yielded AUC values exceeding 0.895 and 0.918 for the two varieties, respectively. These results indicate a high level of reliability in the model simulations based on bioclimatic variables and occurrence data (see Figure S1). Under the past climate scenarios of the LGM, simulated using CCSM and MIROC models (approximately 22,000 years BP), the potential habitats of Q. serrata and Q. serrata var. brevipetiolata show a partial reduction—17.10% and 5.19% for Q. serrata, and 21.50% and 13.22% for Q. serrata var. brevipetiolata, respectively. Notably, it is important to emphasize that, during this period, not only in China [45] but also across many regions of Asia [46] and globally [47], the climate was significantly drier than it is today. The prevailing consensus is that access to sufficient moisture was critical for the survival of species amid the climatic fluctuations of the Pleistocene [48,49]. Additionally, the temperature across mainland China during the LGM was approximately 5–11 °C lower than current levels [50]. On the other hand, the more unstable areas of these two deciduous oaks indirectly mirror the intensity of past climate fluctuations and contributed to shaping their current spatial distribution patterns. Moreover, deciduous oaks appear to be more sensitive to temperature and precipitation variations than alpine sclerophyllous oak species. Feng et al. (2016) also suggested that sclerophyllous oaks (e.g., Q. spinosa, Q. aquifolioides, and Q. rehderiana) could adapt to cold habitats and expanded their ranges during the LGM, which contrasts with our findings that deciduous oaks showed a significant contraction during this harsh period [51]. The identification and characterization of climate refugia are crucial for understanding the development of current species distributions, trait diversity, and patterns of local adaptation [52,53,54]. In our study, the “wealth” of potential habitats for Q. serrata during the LGM was primarily located in Enshi City, Hubei Province, within the Qinling–Bashan Mountains, and Rong County, Sichuan Province (Figure 2a,b and Figure 7a). Conversely, the potential habitats for Q. serrata var. brevipetiolata during the LGM were concentrated in Shaoshan County, Hunan Province, and Zhong County, Chongqing (Figure 3a,b and Figure 7c). The topographically diverse landscapes of the Qinling and Daba Mountains likely served as refugia, providing suitable climatic conditions for both plants and animals [55,56,57]. Additionally, the role of the Qinling–Bashan region as a corridor has been documented in studies of various species, including Sinopotamon acutum (Fang et al., 2015) and Dipteronia sinensis (Zhou et al., 2024) [32,58].
Climatic variables are widely recognized for their direct influence on tree species dynamics by affecting survival, growth rates, and dispersal abilities [7,8]. In our study, we identified that the primary climatic factors explaining the environmental preferences of Q. serrata included two temperature-related variables and one precipitation-related variable: the mean temperature of the coldest quarter (BIO 11), the annual temperature range (BIO 7), and the annual precipitation (BIO 12). The average contribution rate of the bioclimatic variables BIO 11 and BIO 7 across the nine models were 32.24% and 30.22%, respectively. Conversely, the most significant environmental factors for Q. serrata var. brevipetiolata were temperature-related variables, including the mean diurnal range (BIO 2), the mean temperature of the coldest quarter (BIO 11), and the annual mean temperature (BIO 1). The average contribution rates of BIO 2 and BIO 1 were 23.57% and 21.64%, respectively (Figure 5). These findings demonstrate that temperature serves as a critical constraint on both deciduous oak species’ distributions, with the mean temperature of the coldest quarter (BIO11) acting as a key limiting factor. PCA-env and minimum-volume ellipsoid (MVE) analyses further indicate partially differentiated yet overlapping core distributions between Q. serrata and Q. serrata var. brevipetiolata (Figure 4). Field surveys confirm sympatry along the Qinling–Daba Mountain continuum, though Q. serrata var. brevipetiolata exhibits broader occupancy across central–eastern China. This distributional divergence is primarily mediated by thermal gradients, particularly in the annual mean temperature and coldest quarter means (Figure S3). Furthermore, fine-scale phenological niche modeling revealed that the eight key precipitation and temperature-dependent bioclimatic dimensions differentially influenced niche occupation and local adaptation between the two oak taxa. Seasonal temperature emerged as the most critical ecological driver, directly regulating plant phenology (e.g., flowering time), seedling establishment, photosynthetic efficiency, and growth trajectories [7,59,60]. Consistent with the established literature, our simulations confirmed precipitation’s significant role in modulating oak growth dynamics—specifically affecting growth rates, leaf morphology, and biomass allocation [61,62]. These physiological processes collectively determine plant height and reproductive output, ultimately governing distribution patterns. Recent studies indicate intraspecific character displacement (ICD) can promote phenotypic divergence through resource competition or alternative strategy evolution [63]. Although genetic differentiation between sympatric and allopatric populations of Q. serrata and Q. serrata var. brevipetiolata remains undetected, sympatric populations exhibit significantly greater leaf morphological variation. This suggests Q. serrata var. brevipetiolata is undergoing active ecological divergence from its ancestral lineage (Q. serrata) [63]. We therefore conclude that bioclimatic gradients and ICD mechanisms collectively drive the adaptive trajectories and distributional boundaries of these taxa.
Northern Hemisphere mountain forests are projected to shift toward higher elevations and latitudes under future atmospheric warming [7,64,65]. Such climate-driven redistribution may force species toward geographic range adjustments, potentially culminating in local extinction or expansion events [66,67]. Our simulations confirm analogous shifts in both Quercus taxa, with habitat centroids migrating poleward under the 2050s and 2070s emission scenarios (Figure 7). Concurrently, southern marginal habitats in low-latitude regions exhibit significant contraction and potential loss (Figure 5 and Figure 6). These findings align with established patterns of climate-disrupted distributions, where suitable habitats progressively shift toward higher latitudes/elevations with warming [7,68,69]. Crucially, our research demonstrates that climate change disproportionately threatens low-latitude marginal populations through habitat degradation (Figure 5 and Figure 6). Consequently, we advocate for enhanced forest monitoring systems, evidence-based conservation strategies integrating population niche models, prioritized in situ protection of southern marginal forests, and curbing of anthropogenic deforestation in vulnerable ecotones. While climate remains the primary driver, non-climatic factors—including topography, life-history traits (e.g., genetic drift, introgression), overexploitation, and anthropogenic pressure—significantly modulate distribution dynamics [70]. We acknowledge that climate data resolution and specimen spatial bias may limit fine-scale distributional insights. Future studies should integrate phylogeographic and population-level approaches to disentangle abiotic and biotic contributions to distribution changes.

5. Conclusions

This study demonstrates that climatic oscillations, particularly the mean temperature of the coldest quarter, are the dominant environmental factor shaping the distribution of Q. serrata and its variety Q. serrata var. brevipetiolata in China. Their current suitable habitats are primarily concentrated in central China’s mountain ranges, with the variety showing a wider distribution extending into the middle-east mountain ranges. Historical niche modeling reveals a clear northward expansion of both taxa from inferred glacial refugia since the Last Glacial Maximum (LGM). Under future climate change scenarios (RCP2.6, RCP4.5, RCP6.0), the total suitable habitat area for both varieties is projected to increase by the 2050s and 2070s, driven primarily by a continued poleward (northward) range shift towards higher latitudes. However, this expansion comes at the cost of significant habitat loss in lower latitudes. These findings highlight the dynamic response of dominant forest tree species to climate change in East Asia’s temperate and subtropical zones and provide a critical scientific basis for future conservation and management strategies for oaks in China.

Supplementary Materials

The following supporting information can be downloaded at: https://www.mdpi.com/article/10.3390/f16071191/s1, Figure S1: AUC for Q. serrata (I) and Q. serrata var. brevipetiolata (II) under different periods using ROC methods to test the results of Maxent. Figure S2. The key bioclimatic variables affecting the growth and distribution of Q. serrata and Q. serrata var. brevipetiolata. Statistics of the bioclimatic variables with cumulative contribution rates and the average contribution rate of bioclimatic variables in our models for Q. serrata (a,b) and Q. serrata var. brevipetiolata (c,d), respectively. Figure S3. Contribution of each environmental variable to spatial distribution of the PCA-env. Table S1. Environmental variables used in the study for the Q. serrata and Q. serrata var. brevipetiolata. Table S2. Characteristics of potential distribution in different periods for Q. serrata and Q. serrata var. brevipetiolata. Table S3. Percentage land surface area of different Q. serrata and Q. serrata var. brevipetiolata habitat suitability types under various climate scenarios.

Author Contributions

Conceptualization, X.-D.C., Z.-F.W. and L.-J.Z. Resource and Data Curation, X.-D.C., J.Y., L.-Q.J., Y.L. and H.-Y.G. Formal Analysis and Validation, X.-D.C. and Y.-M.Z. Writing, X.-D.C. All authors have read and agreed to the published version of the manuscript.

Funding

This study was financially supported by the Natural Science Basic Research Program of Shanxi (202203021212400; 20210302123328), the Project of Scientific and Technological Innovation Plan of Shanxi Higher Education Institutions (2022L257), the Shaanxi Fundamental Science Research Project for Chemistry & Biology (22JHQ041), the National Natural Science Foundation of China (31901077; 42071067; 42471068), and the Central Government Guidance Funds for Local Science and Technology Development Projects (YDZJSX2024D059).

Data Availability Statement

The original contributions presented in this study are included in the article and Supplementary Materials. Further inquiries can be directed to first authors or corresponding authors.

Conflicts of Interest

The authors declare no conflicts of interest.

References

  1. Guo, Y.L.; Li, X.; Zhao, Z.; Wei, H.; Gao, B.; Gu, W. Prediction of the potential geographic distribution of the ectomycorrhizal mushroom Tricholoma matsutake under multiple climate change scenarios. Sci. Rep. 2017, 7, 46221. [Google Scholar] [CrossRef] [PubMed]
  2. Euskirchen, E.S.; Carman, T.B.; McGuire, A.D. Changes in the structure and function of Northern Alaskan ecosystems when considering variable leaf-out times across groupings of species in a dynamic vegetation model. Glob. Change Biol. 2014, 20, 963–978. [Google Scholar] [CrossRef] [PubMed]
  3. Aitken, S.N.; Yeaman, S.; Holliday, J.A.; Wang, T.; Curtis-McLane, S. Adaptation, migration or extirpation: Climate change outcomes for tree populations. Evol. Appl. 2008, 1, 95–111. [Google Scholar] [CrossRef] [PubMed]
  4. Rellstab, C.; Zoller, S.; Walthert, L.; Lesur, I.; Pluess, A.R.; Graf, R.; Bodénès, C.; Sperisen, C.; Kremer, A.; Gugerli, F. Signatures of local adaptation in candidate genes of oaks (Quercus spp.) with respect to present and future climatic conditions. Mol. Ecol. 2016, 25, 5907–5924. [Google Scholar] [CrossRef] [PubMed]
  5. Fordham, D.A.; Resit Akçakaya, H.; Araújo, M.B.; Elith, J.; Keith, D.A.; Pearson, R.; Auld, T.D.; Mellin, C.; Morgan, J.W.; Regan, T.J.; et al. Plant extinction risk under climate change: Are forecast range shifts alone a good indicator of species vulnerability to global warming? Glob. Change Biol. 2012, 18, 1357–1371. [Google Scholar] [CrossRef]
  6. Chen, X.D.; Yang, J.; Guo, Y.F.; Zhao, Y.M.; Zhou, T.; Zhang, X.; Ju, M.M.; Li, Z.H.; Zhao, G.F. Spatial genetic structure and demographic history of the dominant forest oak Quercus fabri hance in subtropical China. Front. Plant Sci. 2021, 11, 583284. [Google Scholar] [CrossRef] [PubMed]
  7. Hu, X.G.; Jin, Y.; Wang, X.R.; Mao, J.F.; Li, Y. Predicting impacts of future climate change on the distribution of the widespread conifer Platycladus orientalis. PLoS ONE 2015, 10, e0132326. [Google Scholar] [CrossRef] [PubMed]
  8. Zhang, X.; Wei, H.; Zhang, X.; Liu, J.; Zhang, Q.; Gu, W. Non-pessimistic predictions of the distributions and suitability of Metasequoia glyptostroboides under climate change using a random forest model. Forests 2020, 11, 62. [Google Scholar] [CrossRef]
  9. Hutchinson, G.E. Population studies-Animal ecology and demography-Concluding remarks. Cold Spring Harb. Symp. Quant. Biol. 1957, 22, 415–427. [Google Scholar] [CrossRef]
  10. Bertrand, R.; Perez, V.; Gégout, J.C. Disregarding the edaphic dimension in species distribution models leads to the omission of crucial spatial information under climate change: The case of Quercus pubescens in France. Glob. Change Biol. 2012, 18, 2648–2660. [Google Scholar] [CrossRef]
  11. Faleiro, F.V.; Machado, R.B.; Loyola, R.D. Defining spatial conservation priorities in the face of land-use and climate change. Biol. Conserv. 2013, 158, 248–257. [Google Scholar] [CrossRef]
  12. Denk, T.; Grimm, G.W.; Manos, P.S.; Deng, M.; Hipp, A.L. An updated infrageneric classification of the oaks: Review of previous taxonomic schemes and synthesis of evolutionary patterns. In Oaks Physiological Ecology. Exploring the Functional Diversity of Genus Quercus L.; Springer: Cham, Switzerland, 2017; pp. 13–38. [Google Scholar]
  13. Wang, Y.; Lei, Y.; Huang, Y.; Wang, Z.; Xu, J.; He, X. Jasmonates from Chinese acorns (Quercus serrata var. brevipetiolata) exert pronounced anti-neuroinflammatory activities. Bioorg. Chem. 2020, 103, 104143. [Google Scholar] [CrossRef] [PubMed]
  14. Vila-Viçosa, C.; Arenas-Castro, S.; Marcos, B.; Honrado, J.; García, C.; Vázquez, F.M.; Almeida, R.; Gonçalves, J. Combining Satellite Remote Sensing and Climate Data in Species Distribution Models to Improve the Conservation of Iberian White Oaks (Quercus L.). ISPRS Int. J. Geo-Inf. 2020, 9, 735. [Google Scholar] [CrossRef]
  15. Mirhashemi, H.; Heydari, M.; Ahmadi, K.; Karami, O.; Kavgaci, A.; Matsui, T.; Heung, B. Species distribution models of Brant’s oak (Quercus brantii Lindl.): The impact of spatial database on predicting the impacts of climate change. Ecol. Eng. 2023, 194, 107038. [Google Scholar] [CrossRef]
  16. Dumolin-Lapègue, S.; Demesure, B.; Fineschi, S.; Le Corre, V.; Petit, R.J. Phylogeographic structure of white oaks throughout the European continent. Genetics 1997, 146, 1475–1487. [Google Scholar] [CrossRef] [PubMed]
  17. Petit, R.J.; Brewer, S.; Bordács, S.; Burg, K.; Cheddadi, R.; Coart, E.; Cottrell, J.; Csaikl, U.M.; van Dam, B.; Deans, J.D.; et al. Identification of refugia and post-glacial colonisation routes of European white oaks based on chloroplast DNA and fossil pollen evidence. For. Ecol. Manag. 2002, 156, 49–74. [Google Scholar] [CrossRef]
  18. Grivet, D.; Deguilloux, M.F.; Petit, R.J.; Sork, V.L. Contrasting patterns of historical colonization in white oaks (Quercus spp.) in California and Europe. Mol. Ecol. 2006, 15, 4085–4093. [Google Scholar] [CrossRef] [PubMed]
  19. Oldfield, S.; Eastwood, A. The Red List of Oaks; Fauna and Flora International (FFI): Cambridge, UK, 2007. [Google Scholar]
  20. Xu, Y.C.; Ren, X.W. Flora of China; Science Press: Beijing, China, 1998; pp. 235–236. [Google Scholar]
  21. Huang, C.C.; Chang, Y.C. Fagaceae. In Flora Reipublicae Popularis Sinicae; Huang, C.C., Ed.; Science Press: Beijing, China, 1998; Volume 22. [Google Scholar]
  22. Huang, J.; Wang, Y.; Li, C.; Wang, X.; He, X. Triterpenes isolated from acorns of Quercus serrata var. brevipetiolata exert anti-inflammatory activity. Ind. Crops Prod. 2016, 91, 302–309. [Google Scholar] [CrossRef]
  23. Lei, Y.; Huang, Y.; Wang, Y.; He, X. Potential anti-neuroinflammatory triterpenoids isolated from Chinese acorns (Quercus serrata var. brevipetiolata). J. Funct. Foods 2018, 50, 18–25. [Google Scholar] [CrossRef]
  24. Ju, M.; Yang, J.; Yue, M.; Zhao, G. Speciation patterns of related species under the hybrid zone: A case study of three sclerophyllous oaks in the east Himalaya-Hengduan Mountains. Mol. Ecol. 2023, 32, 4610–4626. [Google Scholar] [CrossRef] [PubMed]
  25. Yu, G.; Chen, X.; Ni, J.; Cheddadi, R.; Guiot, J.; Han, H.; Harrison, S.P.; Huang, C.; Ke, M.; Kong, Z.; et al. Palaeovegetation of China: A pollen databased synthesis for the mid-Holocene and last glacial maximum. J. Biogeogr. 2000, 27, 635–664. [Google Scholar] [CrossRef]
  26. Harrison, S.P.; Yu, G.; Takahara, H.; Prentice, I.C. Palaeovegetation: Diversity of temperate plants in East Asia. Nature 2001, 413, 129–130. [Google Scholar] [CrossRef] [PubMed]
  27. Li, X.H.; Shao, J.W.; Lu, C.; Zhang, X.P.; Qiu, Y.X. Chloroplast phylogeography of a temperate tree Pteroceltis tatarinowii (Ulmaceae) in China. J. Syst. Evol. 2012, l50, 325–333. [Google Scholar] [CrossRef]
  28. Collins, W.D.; Bitz, C.M.; Blackmon, M.L.; Bonan, G.B.; Bretherton, C.S.; Carton, J.A.; Chang, P.; Doney, S.C.; Hack, J.J.; Henderson, T.B.; et al. The community climate system model version 3 (CCSM3). J. Clim. 2006, 19, 2122–2143. [Google Scholar] [CrossRef]
  29. Hasumi, H.; Emori, S. K-1 Coupled GCM (MIROC) Description Center for Climate System Research. University of Tokyo: Tokyo, Japan, 2004. [Google Scholar]
  30. Rutledge, D. Estimating long-term world coal production with logit and probit transforms. Int. J. Coal Geol. 2011, 85, 23–33. [Google Scholar] [CrossRef]
  31. Phillips, S.J.; Anderson, R.P.; Schapire, R.E. Maximum entropy modeling of species geographic distributions. Ecol. Model. 2006, 190, 231–259. [Google Scholar] [CrossRef]
  32. Zhou, T.; Chen, X.D.; López-Pujol, J.; Bai, G.Q.; Herrando-Moraira, S.; Nualart, N.; Zhang, X.; Zhao, Y.M.; Zhao, G.F. Genetically-and environmentally-dependent processes drive interspecific and intraspecific divergence in the Chinese relict endemic genus Dipteronia. Plant Divers. 2024, 46, 585–599. [Google Scholar] [CrossRef] [PubMed]
  33. Swets, J.A. Measuring the accuracy of diagnostic systems. Science 1988, 240, 1285–1293. [Google Scholar] [CrossRef] [PubMed]
  34. Broennimann, O.; Fitzpatrick, M.C.; Pearman, P.B.; Petitpierre, B.; Pellissier, L.; Yoccoz, N.G.; Thuiller, W.; Fortin, M.-J.; Randin, C.; Zimmermann, N.E.; et al. Measuring ecological niche overlap from occurrence and spatial environmental data. Glob. Ecol. Biogeogr. 2012, 21, 481–497. [Google Scholar] [CrossRef]
  35. Herrando-Moraira, S.; Nualart, N.; Herrando-Moraira, A.; Chung, M.Y.; López-Pujol, J. Climatic niche characteristics of native and invasive Lilium lancifolium. Sci. Rep. 2019, 9, 14334. [Google Scholar] [CrossRef] [PubMed]
  36. Chen, X.D.; Zhang, X.; Zhang, H.; Zhou, T.; Zhao, Y.M.; Yang, J.; Zhao, G.F. Genetic Differentiation and Demographic History of Three Cerris Oak Species in China Based on Nuclear Microsatellite Makers. Forests 2021, 12, 1164. [Google Scholar] [CrossRef]
  37. Evans, M.E.; Smith, S.A.; Flynn, R.S.; Donoghue, M.J. Climate, niche evolution, and diversification of the “bird-cage” evening primroses (Oenothera, sections Anogra and Kleinia). Am. Nat. 2009, 173, 225–240. [Google Scholar] [CrossRef] [PubMed]
  38. Chen, X.D.; Yang, J.; Feng, L.I.; Zhou, T.; Zhang, H.; Li, H.M.; Zhao, G.F. Phylogeography and population dynamics of an endemic oak (Quercus fabri Hance) in subtropical China revealed by molecular data and ecological niche modeling. Tree Genet. Genomes 2020, 16, 2. [Google Scholar] [CrossRef]
  39. Tang, C.Q.; Dong, Y.F.; Herrando-Moraira, S.; Matsui, T.; Ohashi, H.; He, L.Y.; Nakao, K.; Tanaka, N.; Tomita, M.; Li, X.S.; et al. Potential effects of climate change on geographic distribution of the Tertiary relict tree species Davidia involucrata in China. Sci. Rep. 2017, 7, 43822. [Google Scholar] [CrossRef] [PubMed]
  40. Zhang, X.W.; Li, Y.; Zhang, Q.; Fang, Y.M. Ancient east-west divergence, recent admixture, and multiple marginal refugia shape genetic structure of a widespread oak species (Quercus acutissima) in China. Tree Genet. Genomes 2018, 14, 88. [Google Scholar] [CrossRef]
  41. Xu, J.; Deng, M.; Jiang, X.L.; Westwood, M.; Song, Y.G.; Turkington, R. Phylogeography of Quercus glauca (Fagaceae), a dominant tree of East Asian subtropical evergreen forests, based on three chloroplast DNA interspace sequences. Tree Genet. Genomes 2015, 11, 805. [Google Scholar] [CrossRef]
  42. Chen, D.; Zhang, X.; Kang, H.; Sun, X.; Yin, S.; Du, H.; Yamanaka, N.; Gapare, W.; Wu, H.X.; Liu, C.J. Phylogeography of Quercus variabilis based on chloroplast DNA sequence in East asia: Multiple glacial refugia and mainland-migrated island populations. PLoS ONE 2012, 7, e47268. [Google Scholar] [CrossRef] [PubMed]
  43. Hewitt, G. The genetic legacy of the Quaternary ice ages. Nature 2000, 405, 907–913. [Google Scholar] [CrossRef] [PubMed]
  44. Stewart, J.R.; Lister, A.M.; Barnes, I.; Dalen, L. Refugia revisited: Individualistic responses of species in space and time. Proc. R. Soc. B Biol. Sci. 2010, 277, 661–671. [Google Scholar] [CrossRef] [PubMed]
  45. Tian, Z.; Jiang, D. Revisiting last glacial maximum climate over China and East Asian monsoon using PMIP3 simulations. Palaeogeogr. Palaeoclimatol. Palaeoecol. 2016, 453, 115–126. [Google Scholar] [CrossRef]
  46. Chabangborn, A.; Brandefelt, J.; Wohlfarth, B. Asian monsoon climate during the Last Glacial Maximum: Palaeo-data–model comparisons. Boreas 2014, 43, 220–242. [Google Scholar] [CrossRef]
  47. Alder, J.R.; Hostetler, S.W. Global climate simulations at 3000 year intervals for the last 21000 years with the GENMOM coupled atmosphere–ocean model. Clim. Past Discuss 2014, 10, 2925–2978. [Google Scholar]
  48. Birks, H.J.B.; Willis, K.J. Alpines, trees, and refugia in Europe. Plant Ecol. Divers 2008, 1, 147–160. [Google Scholar] [CrossRef]
  49. Fan, D.; Hu, W.; Li, B.; Morris, A.B.; Zheng, M.; Soltis, D.E.; Soltis, P.S.; Zhang, Z. Idiosyncratic responses of evergreen broad-leaved forest constituents in China to the late Quaternary climate changes. Sci. Rep. 2016, 6, 31044. [Google Scholar] [CrossRef] [PubMed]
  50. Shi, Y.F.; Cui, Z.J.; Su, Z. The Quaternary glaciations and environmental variations in China. Hebei Sci. Technol. Press Shijiazhuang 2006, 65, 101. [Google Scholar]
  51. Feng, L.; Zheng, Q.J.; Qian, Z.Q.; Yang, J.; Zhang, Y.P.; Li, Z.H.; Zhao, G.F. Genetic structure and evolutionary history of three Alpine Sclerophyllous oaks in East Himalaya-Hengduan Mountains and adjacent regions. Front. Plant Sci. 2016, 7, 1688. [Google Scholar] [CrossRef] [PubMed]
  52. Davis, M.B.; Shaw, R.G. Range shifts and adaptive responses to Quaternary climate change. Science 2001, 292, 673–679. [Google Scholar] [CrossRef] [PubMed]
  53. Jansson, R.; Dynesius, M. The fate of clades in a world of recurrent climatic change: Milankovitch oscillations and evolution. Annu. Rev. Ecol. Syst. 2002, 33, 741–777. [Google Scholar] [CrossRef]
  54. Petit, R.J.; Hampe, A.; Cheddadi, R. Climate changes and tree phylogeography in the Mediterranean. Taxon 2005, 54, 877–885. [Google Scholar] [CrossRef]
  55. Fang, F.; Sun, H.; Zhao, Q.; Lin, C.; Sun, Y.F.; Gao, W.; Xu, J.J.; Zhou, J.Y.; Ge, F.; Liu, N.F. Patterns of diversity, areas ofendemism, andmultiple glacial refuges for freshwater crabs of the genus Sinopotamon in China Decapoda: Brachyura: Potamidae). PLoS ONE 2013, 8, e53143. [Google Scholar]
  56. Qu, Y.; Ericson, P.G.P.; Quan, Q.; Song, G.; Zhang, B.G.; Lei, F.M. Long-term isolation and stability explainhigh genetic diversity in the Eastern Himalaya. Mol. Ecol. 2014, 23, 705–720. [Google Scholar] [CrossRef] [PubMed]
  57. Yuan, S.; Huang, M.; Wang, X.S.; Ji, L.Q.; Zhang, Y.L. Centers of endemism and diversitypatterns for typhlocybine leafhoppers (Hemiptera: Cicadellidae: Typhlocybinae) in China. Insect Sci. 2014, 21, 523–536. [Google Scholar] [CrossRef] [PubMed]
  58. Fang, F.; Ji, Y.K.; Zhao, Q.; Wang, Y.J.; Gao, W.; Chu, K.L.; Sun, H.Y. Phylogeography of the Chinese endemic freshwater crab Sinopotamon acutum (Brachyura, Potamidae). Zoo. Scr. 2015, 44, 653–666. [Google Scholar] [CrossRef]
  59. Li, J.; Wen, X. A study on the sources variation test of Platycladus orientalis seedling. Liaoning For. Sci. Technol. 1986, 6, 005. [Google Scholar]
  60. Liang, Y. Canonical correlation analysis of Platycladus orientalis between seedling growth and climatic factors. Sci. Silvae Sin. 1990, 26, 308–315. [Google Scholar]
  61. Yang, J.; Guo, Y.F.; Chen, X.D.; Zhang, X.; Ju, M.M.; Bai, G.Q.; Liu, Z.L.; Zhao, G.F. Framework phylogeny, evolution and complex diversification of Chinese oaks. Plants 2020, 9, 1024. [Google Scholar] [CrossRef] [PubMed]
  62. Liu, Y.; Li, Y.; Song, J.; Zhang, R.; Yan, Y.; Wang, Y.; Du, F.K. Geometric morphometric analyses of leaf shapes in two sympatric Chinese oaks: Quercus dentata Thunberg and Quercus aliena Blume (Fagaceae). Ann. For. Sci. 2018, 75, 90. [Google Scholar] [CrossRef]
  63. Qi, M.; Wang, J.; Wang, R.; Song, Y.; Ueno, S.; Luo, Y.; Du, F.K. Intraspecific character displacement in oaks. Plant J. 2025, 122, e70165. [Google Scholar] [CrossRef] [PubMed]
  64. Bertrand, R.; Lenoir, J.; Piedallu, C.; Riofrío-Dillon, G.; de Ruffray, P.; Vidal, C.; Pierrat, J.C.; Gégout, J.C. Changes in plant community composition lag behind climate warming in lowland forests. Nature 2011, 479, 517–520. [Google Scholar] [CrossRef] [PubMed]
  65. Walther, G.R.; Beißner, S.; Burga, C.A. Trends in the upward shift of alpine plants. J. Veg. Sci. 2005, 16, 541–548. [Google Scholar] [CrossRef]
  66. Parmesan, C. Ecological and evolutionary responses to recent climate change. Annu. Rev. Ecol. Evol. Syst. 2006, 37, 637–669. [Google Scholar] [CrossRef]
  67. Massot, M.; Clobert, J.; Ferrière, R. Climate warming, dispersal inhibition and extinction risk. Glob. Change Biol. 2008, 14, 461–469. [Google Scholar] [CrossRef]
  68. Root, T.L.; Price, J.T.; Hall, K.R.; Schneider, S.H.; Rosenzweig, C.; Pounds, J.A. Fingerprints of global warming on wild animals and plants. Nature 2003, 421, 57–60. [Google Scholar] [CrossRef] [PubMed]
  69. Zhang, Y.J.; Dai, L.M.; Pan, J. The trend of tree line on the northern slope of Changbai Mountain. J. For. Res. 2001, 12, 97–100. [Google Scholar]
  70. Barnosky, A.D.; Matzke, N.; Tomiya, S.; Wogan, G.O.U.; Swartz, B.; Quental, T.B.; Marshall, C.; McGuire, J.L.; Lindsey, E.L.; Maguire, K.C.; et al. Has the Earth’s sixth mass extinction already arrived? Nature 2011, 471, 51–57. [Google Scholar] [CrossRef] [PubMed]
Figure 1. Distribution of the occurrence sites of Q. serrata and Q. serrata var. brevipetiolata in China. Each circle represents a sample distribution point.
Forests 16 01191 g001
Figure 2. Potential distribution of Q. serrata under each climatic scenario. (a) under the climatic scenario mid-Holocene-CCSM; (b) under the climatic scenario mid-Holocene-MIROC; (c) under the present climate; (d) under RCP 2.6 in the 2050s; (e) under RCP 4.5 in the 2050s; (f) under RCP 6.0 in the 2050s; (g) under RCP 2.6 in the 2070s; (h) under RCP 4.5 in the 2070s; (i) under RCP 6.0 in the 2070s.
Forests 16 01191 g002
Figure 3. Potential distribution of Q. serrata var. brevipetiolata under each climatic scenario. (a) Under the climatic scenario mid-Holocene-CCSM; (b) under the climatic scenario mid-Holocene-MIROC; (c) under the present climate; (d) under RCP 2.6 in the 2050s; (e) under RCP 4.5 in the 2050s; (f) under RCP 6.0 in the 2050s; (g) under RCP 2.6 in the 2070s; (h) under RCP 4.5 in the 2070s; (i) under RCP 6.0 in the 2070s.
Forests 16 01191 g003
Figure 4. (A) The 20% occurrence density and the contribution and direction of each variable to the first two components of the PCA-env; (B) 100% of occurrence density with a thin line and 100% of available climatic background with a thick line; (C) minimum-volume ellipsoids (MVE) of Q. serrata and Q. serrata var. brevipetiolata in the environmental space using NicheA; (D) distribution of the niche occupancy under different climatic dimensions, where the curve represents the distribution of the niche occupancy of two oak species under each climatic dimension, and the dotted lines represent the weighted average of each species under a single climate factor.
Forests 16 01191 g004
Figure 5. A comparison of the potential habitats of Q. serrata under the present climate and six climatic scenarios in the future. (a) Overlapping areas of the 2050-RCP 2.6 and the present; (b) overlapping areas of the 2050-RCP 4.5 and the present; (c) overlapping areas of the 2050-RCP 6.0 and the present; (d) overlapping areas of the 2070-RCP 2.6 and the present; (e) overlapping areas of the 2070-RCP 4.5 and the present; (f) overlapping areas of the 2070-RCP 6.0 and the present.
Forests 16 01191 g005
Figure 6. A comparison of the potential habitats of Q. serrata var. brevipetiolata under the present climate and six climatic scenarios in the future. (a) Overlapping areas of the 2050-RCP 2.6 and the present; (b) overlapping areas of the 2050-RCP 4.5 and the present; (c) overlapping areas of the 2050-RCP 6.0 and the present; (d) overlapping areas of the 2070-RCP 2.6 and the present; (e) overlapping areas of the 2070-RCP 4.5 and the present; (f) overlapping areas of the 2070-RCP 6.0 and the present.
Forests 16 01191 g006
Figure 7. Migration of the center of the suitable habitat for two oak species of Q. serrata and Q. serrata var. brevipetiolata since the last interglacial period (migration route (a) and migration distance (b) of Q. serrata; migration route (c) and migration distance (d) of Q. serrata var. brevipetiolata).
Forests 16 01191 g007
Disclaimer/Publisher’s Note: The statements, opinions and data contained in all publications are solely those of the individual author(s) and contributor(s) and not of MDPI and/or the editor(s). MDPI and/or the editor(s) disclaim responsibility for any injury to people or property resulting from any ideas, methods, instructions or products referred to in the content.

