Article

Characterization and Mapping of Conservation Hotspots for the Climate-Vulnerable Conifers Abies nephrolepis and Picea jezoensis in Northeast Asia

1
Department of Forestry, The Graduate School, Kyungpook National University, Daegu 41566, Republic of Korea
2
Baekdudaegan National Arboretum, Korea Arboreta and Gardens Institute, Bonghwa 36209, Republic of Korea
3
Department of Forest Ecology and Protection, Kyungpook National University, Sangju 37224, Republic of Korea
4
School of Forest Sciences and Landscape Architecture, Kyungpook National University, Daegu 41566, Republic of Korea
*
Author to whom correspondence should be addressed.
Forests 2025, 16(7), 1183; https://doi.org/10.3390/f16071183
Submission received: 14 June 2025 / Revised: 15 July 2025 / Accepted: 17 July 2025 / Published: 18 July 2025
(This article belongs to the Section Forest Ecology and Management)

Abstract

Abies nephrolepis and Picea jezoensis are native Pinaceae trees distributed in high mountainous regions of Northeast Asia (typically above ~1000 m a.s.l. on the Korean peninsula, northeastern China, Sakhalin, and the Russian Far East) and southern boreal forests, vulnerable to climate change and human disturbances, necessitating accurate habitat identification for effective conservation. While protected areas (PAs) are essential, merely expanding existing ones often fail to protect populations under human pressure and climate change. Using species distribution models with current and projected climate data, we mapped potential habitats across Northeast Asia. Spatial clustering analyses integrated with PA and land cover data helped identify optimal sites and priorities for new conservation areas. Ensemble species distribution models indicated extensive suitable habitats, especially in southern Sikhote-Alin, influenced by maritime-continental climates. Specific climate variables strongly affected habitat suitability for both species. The Kamchatka peninsula consistently emerged as an optimal habitat under future climate scenarios. Our study highlights essential environmental characteristics shaping the habitats of these species, reinforcing the importance of strategically enhancing existing PAs, and establishing new ones. These insights inform proactive conservation strategies for current and future challenges, by focusing on climate refugia and future habitat stability.

1. Introduction

Forest ecosystems are critical for maintaining biodiversity, sequestering carbon, and providing habitats for diverse flora and fauna [1,2,3]. However, climate change and rising temperatures caused by increased greenhouse gas emissions threaten these ecosystems [4,5,6,7]. Globally, forests face substantial challenges, with numerous studies highlighting the effect of climate factors on tree health and growth [8,9,10,11,12]. One noticeable change within forest ecosystems is the shift in species distribution, particularly alpine and subalpine vegetation zones, threatening species adapted to consistently low temperatures [13,14,15,16,17]. Recent global syntheses indicate that most tracked taxa are shifting their ranges poleward in latitude and upward in elevation as they follow warming isotherms [18,19]. These species, isolated in high mountains, struggle to migrate and adapt, risking habitat reduction [20,21]. Thus, gymnosperms such as Abies, Picea, Larix, and Pinus—all genera of the Pinaceae family which dominate boreal forests and northern temperate regions—are particularly vulnerable. Pinaceae trees native to Northeast Asia, such as Khingan fir (Abies nephrolepis) and Yeddo spruce (Picea jezoensis) are widely distributed in these regions and are expected to encounter considerable distribution changes and disturbances due to the combined effects of climate change and human activities [22].
In the 1890s, the Abies-Picea forests of Sikhote-Alin covered 30,000 km2. However, owing to human activities, primarily logging, this area has shrunk to 26,000 km2 [23]. Although instances of increased reforestation rates have been noted immediately after harvesting, areas disturbed by logging activities considerably outweigh those affected by natural causes [24]. In South Korea, at the southern distribution limit of these species, the distribution has been steadily shrinking owing to mass deaths within populations [25,26]. In this situation, the Global Biodiversity Framework aims to conserve 30% of the world’s terrestrial and marine areas as protected areas (PAs) by 2030. PAs are crucial for biodiversity conservation, serving as buffers against human activities and preserving critical habitats [27,28].
However, the mere spatial expansion of existing PAs has proven ineffective in providing substantial conservation benefits to populations under human pressure [28]. Thus, the international community advocates for a two-pronged approach: qualitative improvements in the systematic management of existing PAs and designating additional PAs considering the impacts of global climate change [28,29]. This initiative should focus on maintaining representative species under changing climate conditions, and designing a protection system that represents all current and future species [30]. This necessitates customized strategies to designate future suitable PAs or improve existing ones [31,32].
Understanding the impact of climate change on species requires accurate comprehension of spatiotemporal patterns and reliable predictions of future conditions [33,34,35,36]. This knowledge is crucial for developing effective conservation management guidelines and adaptive strategies to help species and habitats cope with environmental changes. species distribution models (SDMs) have emerged as powerful tools in this context, offering a framework for predicting shifts in species distribution under various climate scenarios [37,38]. SDMs provide valuable insights into spatial distribution patterns by assessing habitat suitability and exploring the intricate relationships between climate variables and species occurrence [39,40]. These models are useful for selecting potential PAs and large-scale preservation plans by identifying species’ habitat ranges [41,42,43,44]. Furthermore, analyzing SDMs helps identify key environmental characteristics influencing species distribution across their natural habitat ranges. Although many recent studies rely solely on bioclimatic variables, topographical factors such as elevation, slope, aspect, and terrain ruggedness strongly influence species distribution by modulating microclimatic conditions, moisture availability, and habitat connectivity [45]. Therefore, integrating topographical information with climatic variables is essential for accurate prediction and management of species distributions, especially in mountainous regions.
This study uses an ensemble modeling approach, integrating multiple SDMs, to investigate suitable habitats for A. nephrolepis and P. jezoensis, and examine their responses to climate change. The research objectives are threefold: (a) To identify and analyze the critical environmental factors influencing the geographical distribution of these species; (b) to simulate and project potential shifts in species distribution under various climate change scenarios; and (c) to identify hotspots of species distribution change, incorporating land cover data and existing PAs. By combining these elements, this study provides a comprehensive assessment of the current and future distribution of these key tree species, offering valuable insights into conservation planning and forest management amid climate change.

2. Materials and Methods

2.1. Species Occurrence Data

We collected GPS coordinates for A. nephrolepis, P. jezoensis, and A. nephrolepisP. jezoensis stands through field surveys conducted from 2019 to 2022. To supplement our field data and overcome limitations inherent to field surveys, we obtained secondary data from various sources, including the T.B. Lee Herbarium (South Korea) [46], Moscow Digital Herbarium (Russia) [47], Chinese Academy of Sciences (China) [48], Herbarium of Shinshu University (Japan) [49], MHA Herbarium (Russia) [50], National Museum of Nature and Science (Japan) [51], and the Global Biodiversity Information Facility. The data obtained from secondary sources underwent a rigorous cleaning process for analysis. First, we removed coordinates outside native habitats of plant species based on recorded distributions from previous studies [15,20]. Second, we eliminated coordinates from non-forest areas (e.g., artificial coordinates influenced by human activity, such as those from botanical gardens, parks, or private gardens), validating locations using Google Earth. The occurrence data used from the secondary data source encompassed the temporal range of the environmental reference period (CHELSA) used in this study, specifically utilizing data from the 1990s onwards. Finally, the field survey data and the organized secondary source data were used to prevent spatial autocorrelation from sampling bias by refining occurrence points to ensure only one presence point per environmental variable grid cell [52,53,54,55,56,57]. After eliminating overlap points, ensuring one presence point per environmental variable grid cell, our final dataset comprised 314 for A. nephrolepis and 429 for P. jezoensis (Figure 1).

2.2. Environmental Data

The CHELSA dataset (www.chelsa-climate.org) is the first global climate dataset to employ statistical downscaling techniques. It demonstrated superior performance in predicting terrain precipitation patterns compared to other datasets, such as WORLDCLIM, particularly when modeling potential distributions of alpine biota such as Betula utilis [58]. Thus, the CHELSA v2.1 dataset was used in this study [59].
Environmental variables were extracted from CHELSA at a 30 arcsecond resolution. Digital elevation model data from SRTMv3 were processed to match this resolution. To address multicollinearity frequently present between environmental variables, we performed Pearson correlation analysis, eliminating one variable from each pair with a correlation coefficient exceeding 0.75. Supplementary Figure S1 illustrates the correlation analysis results between terrain and environmental variables. Ultimately, 11 independent variables were selected for model development (Table 1). Correlation analysis was conducted using R Studio version 4.3.1.
For future climate projections, the UKESM1-0-LL climate model was used under SSP370 and SSP585 scenarios, employing the same variables used in the current distribution analysis. We defined three future periods: near future (2011–2040), middle future (2041–2070), and far future (2071–2100). Thematic mapping and habitat evaluation were performed using ArcGIS Pro and QGIS 3.16.

2.3. Model Development

This study analyzed the potential distribution of target species by implementing an ensemble model that integrates statistical and machine learning approaches. Six models were selected for ensemble modeling: two statistical-based models (Generalized Linear Model, Generalized Additive Model) and four machine learning-based models [random forest (RF), classification tree analysis (CTA), generalized boosting model (GBM), and extreme gradient boosting (XGBOOST)]. Pseudo-absence data were used alongside presence data as dependent variables for models. As pseudo-absence data significantly influences model outcomes, current best practices recommend using >1000 pseudo-absence data points in 10 repetitions to ensure consistency in species distribution models [60]. To determine the optimal number of pseudo-absence samples for our analysis, we compared the accuracy of individual models using 3000, 5000, 10,000, 15,000, and 20,000 pseudo-absence data points. Model performance, evaluated using AUC (area under the curve) and TSS (true skill statistics), was, on average, most optimal with 10,000 pseudo-absence data points (Table S1), employed in 10 repetitions across the study area to analyze potential distributions of A. nephrolepis and P. jezoensis.
Default hyperparameters sufficed for A. nephrolepis whereas hyperparameter tuning was conducted for P. jezoensis owing to lower explanatory power in some models (Table S2). For GLM, a “Quadratic” model form was used with an interaction level set to “1” and “maxit” to 300 (range: 50–500) to account for environmental factor interactions. For CTA, we used five-fold cross-validation, with the minimum observation count for all terminal nodes (minbucket) set to 5 (range: 1–5), the minimum number of observations before splitting a node (minsplit) to 5 (range: 1–5), the complexity parameter to 0.001 (range: 0.001–0.1), and the maximum tree depth (maxlength) to 9 (range: 5–25). Default hyperparameters provided by biomod2 were used for the remaining models.
To construct individual models, we performed five-fold cross-validation by dividing the presence/pseudo-absence data and environmental variables into training (80%) and test (20%) datasets. Ensemble modeling was performed using R package’s biomod2. Ensemble construction involved assigning weights based on TSS values derived from individual models. The ensemble model was constructed to predict the relative occurrence ratio across the study area. We selected TSS over AUC owing to its tendency to provide more accurate performance assessments in widespread occurrence scenarios while avoiding overestimation in localized occurrence scenarios [61]. However, TSS is largely insensitive to the ratio and spatial distribution of pseudo-absence [62]. Based on the TSS values derived from the individual species distribution models, we selected models with TSS ≥ 0.8 for the potential distribution of A. nephrolepis and models with TSS ≥ 0.7 for P. jezoensis. These selected models were then weighted to construct the ensemble model. Threshold values were set to classify occurrence and non-occurrence areas into binary forms. The thresholds were set based on the point where the sum of sensitivity, which describes the accuracy of occurrence points, and specificity, which describes the accuracy of absence points, was maximized [63,64]. This threshold was then used to convert the predictions into presence/absence maps.

2.4. Model Evaluation

To validate model performance, we concurrently used both the AUC value of the receiver operating characteristic curve and the TSS value. AUC values range from 0.5 (random prediction) to 1.0 (perfect prediction), with values ≥ 0.8 considered good performance [65]. TSS ranges from −1 to +1, with model accuracy categorized into moderate (0.4–0.6), good (0.6–0.7), and very good (≥0.7) [62].

2.5. Analysis of Potential Hot Spot Areas for Species Conservation

The Getis-Ord (Gi*) method [66,67] is an effective tool for identifying statistically significant clusters of high or low values in geographical spaces [68]. We applied this method to the numerical probabilities of species occurrence derived from our ensemble model to determine statistically significant hotspot locations. The Gi* statistic uses p-values and z-scores to classify occurrence points as hotspots or coldspots.
Based on the analysis of hotspot locations, we characterized neighboring areas and quantified spatial autocorrelation using the Anselin Local Moran I test to identify which cells represent outliers of importance for z-scores. This technique generates a grid of z-scores to identify spatial clusters (high–high [HH] and low–low [LL]) or outliers (high–low [HL] and low–high [LH]), enabling assessment of similarity to surrounding areas based on these values. Subsequently, to construct data overlapping with land-use data and PAs, we superimposed the results of climate change scenarios SSP370 and SSP585 (HH and HL points derived from Gi* and Anselin Local Moran I).
For land-use data, we used ESA WorldCover (https://worldcover2021.esa.int/, Accessed on 6 January 2024.) to extract data indicating land cover points where vegetation can grow (e.g., tree cover, shrubland, and grassland). For PA data, we used data registered in WDPA (https://www.protectedplanet.net/en/thematic-areas/wdpa, Accessed on 6 January 2024.) (covering Republic of Korea, China, Japan, and Russia). North Korea was excluded from the analysis owing to the lack of registered polygon data. Additionally, we explored new PA candidate areas for species conservation by superimposing land-use data with HH and HL points. Notably, not considering LH and LL points in PA selection does not mean that these areas are insignificant. We undertook this process to prioritize immediate conservation measures and designate additional PAs in crucial regions capable of sustaining forest ecosystems amidst current and future climate change impacts.

3. Results

3.1. Model Evaluation and Importance of Factors

We predicted the potential distribution of A. nephrolepis and P. jezoensis using six models and calculated the mean, maximum, and minimum values for each model (Table 2). Most models demonstrated above-average performance, with RF and GBM notably outperforming others.
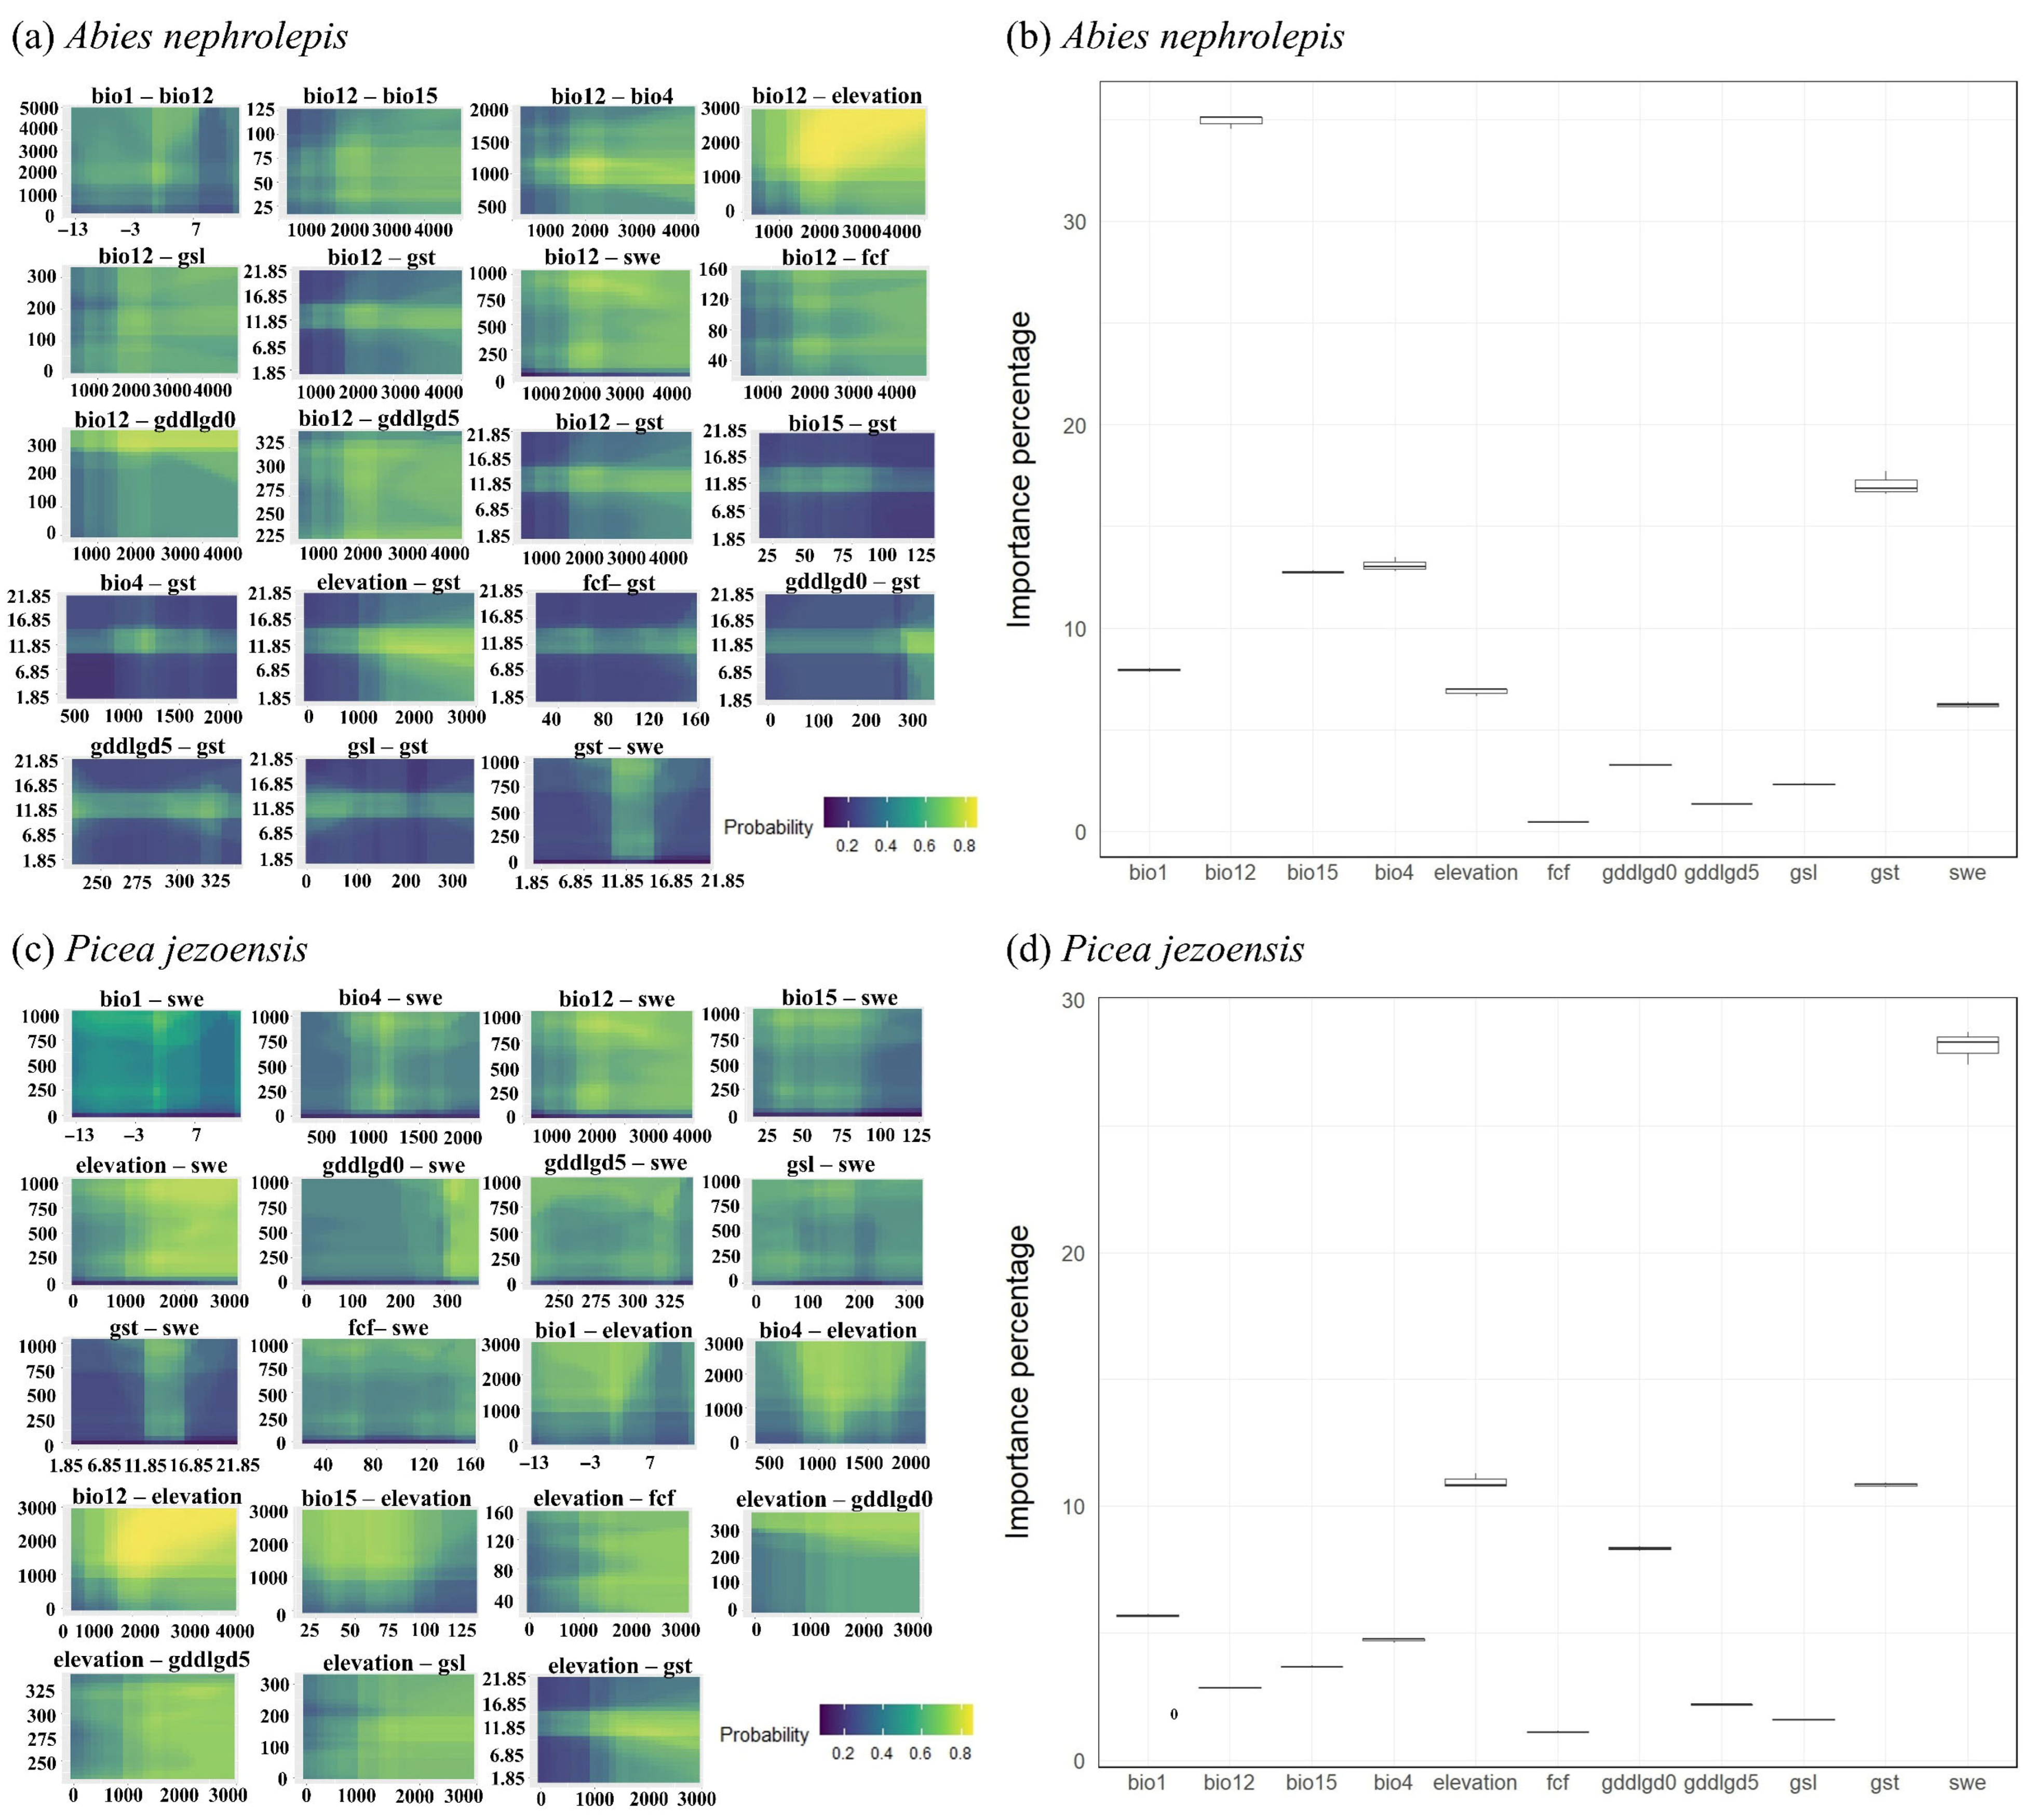
Through variable contribution analysis, we identified the important factors the influencing habitat distribution of these species. Mean annual precipitation (bio12) had the highest influence on A. nephrolepis at 34.92%, followed by mean temperature of the growing season TREELIM (gst, 17.05%), and temperature seasonality (bio4, 13.09%) (Figure 2b). For P. jezoensis, snow water equivalent (swe) was the most influential variable (28.14%), followed by elevation (10.95%), and mean temperature of the growing season TREELIM (gst, 10.82%) (Figure 2d). Section 3.1.
We conducted bivariate analysis using response curves for each environmental variable to explore how interactions between two environmental variables affect species distribution. In the case of the bivariate analysis results, the relationships between the top two significant environmental variables and other factors are presented for readability, while the bivariate analysis results for all factors are shown in Figures S2 and S3. Both A. nephrolepis and P. jezoensis preferred regions with elevations > 1000 m and bio12 > 1000 mm (Figure 2). Additionally, the gst consistently showed a high contribution, with conditions below 11.85 °C proving crucial for species occurrence.

3.2. Potential Distribution of A. nephrolepis and P. jezoensis Under Current Climate

We predicted the potential distribution of A. nephrolepis and P. jezoensis using six models and calculated the mean, maximum, and minimum values for each model (Table 2).
Most models demonstrated an above-average performance, with RF and GBM notably outperforming others. Under current climate conditions, except for specific areas where A. nephrolepis and P. jezoensis exhibit similar potential distribution patterns, distinct distribution patterns are observed, influenced by different environmental factors. The region extending from the Changbai range in Northeast China to the Sikhote-Alin, Badzhal, and Bureinskij ranges in the Russian Far East is the largest common habitat for A. nephrolepis and P. jezoensis (Figure 3). A. nephrolepis was observed in extensive potential habitat areas, such as the northern and central Korean peninsula, Jilin (China), and Mt. Wutai. Similarly, potential habitats were identified in Honshu and Kyushu in Japan, and in the Kamchatka peninsula in Russia. Large stretches of potential habitats were identified in Russia and Japan for P. jezoensis. Moreover, potential habitats were identified in southern Mt. Wutai, China, where occurrence data were not used.

3.3. Potential Distribution of A. nephrolepis and P. jezoensis Under Future Climate

Under future climate conditions, substantial changes are projected in the potential distribution areas of all two species.
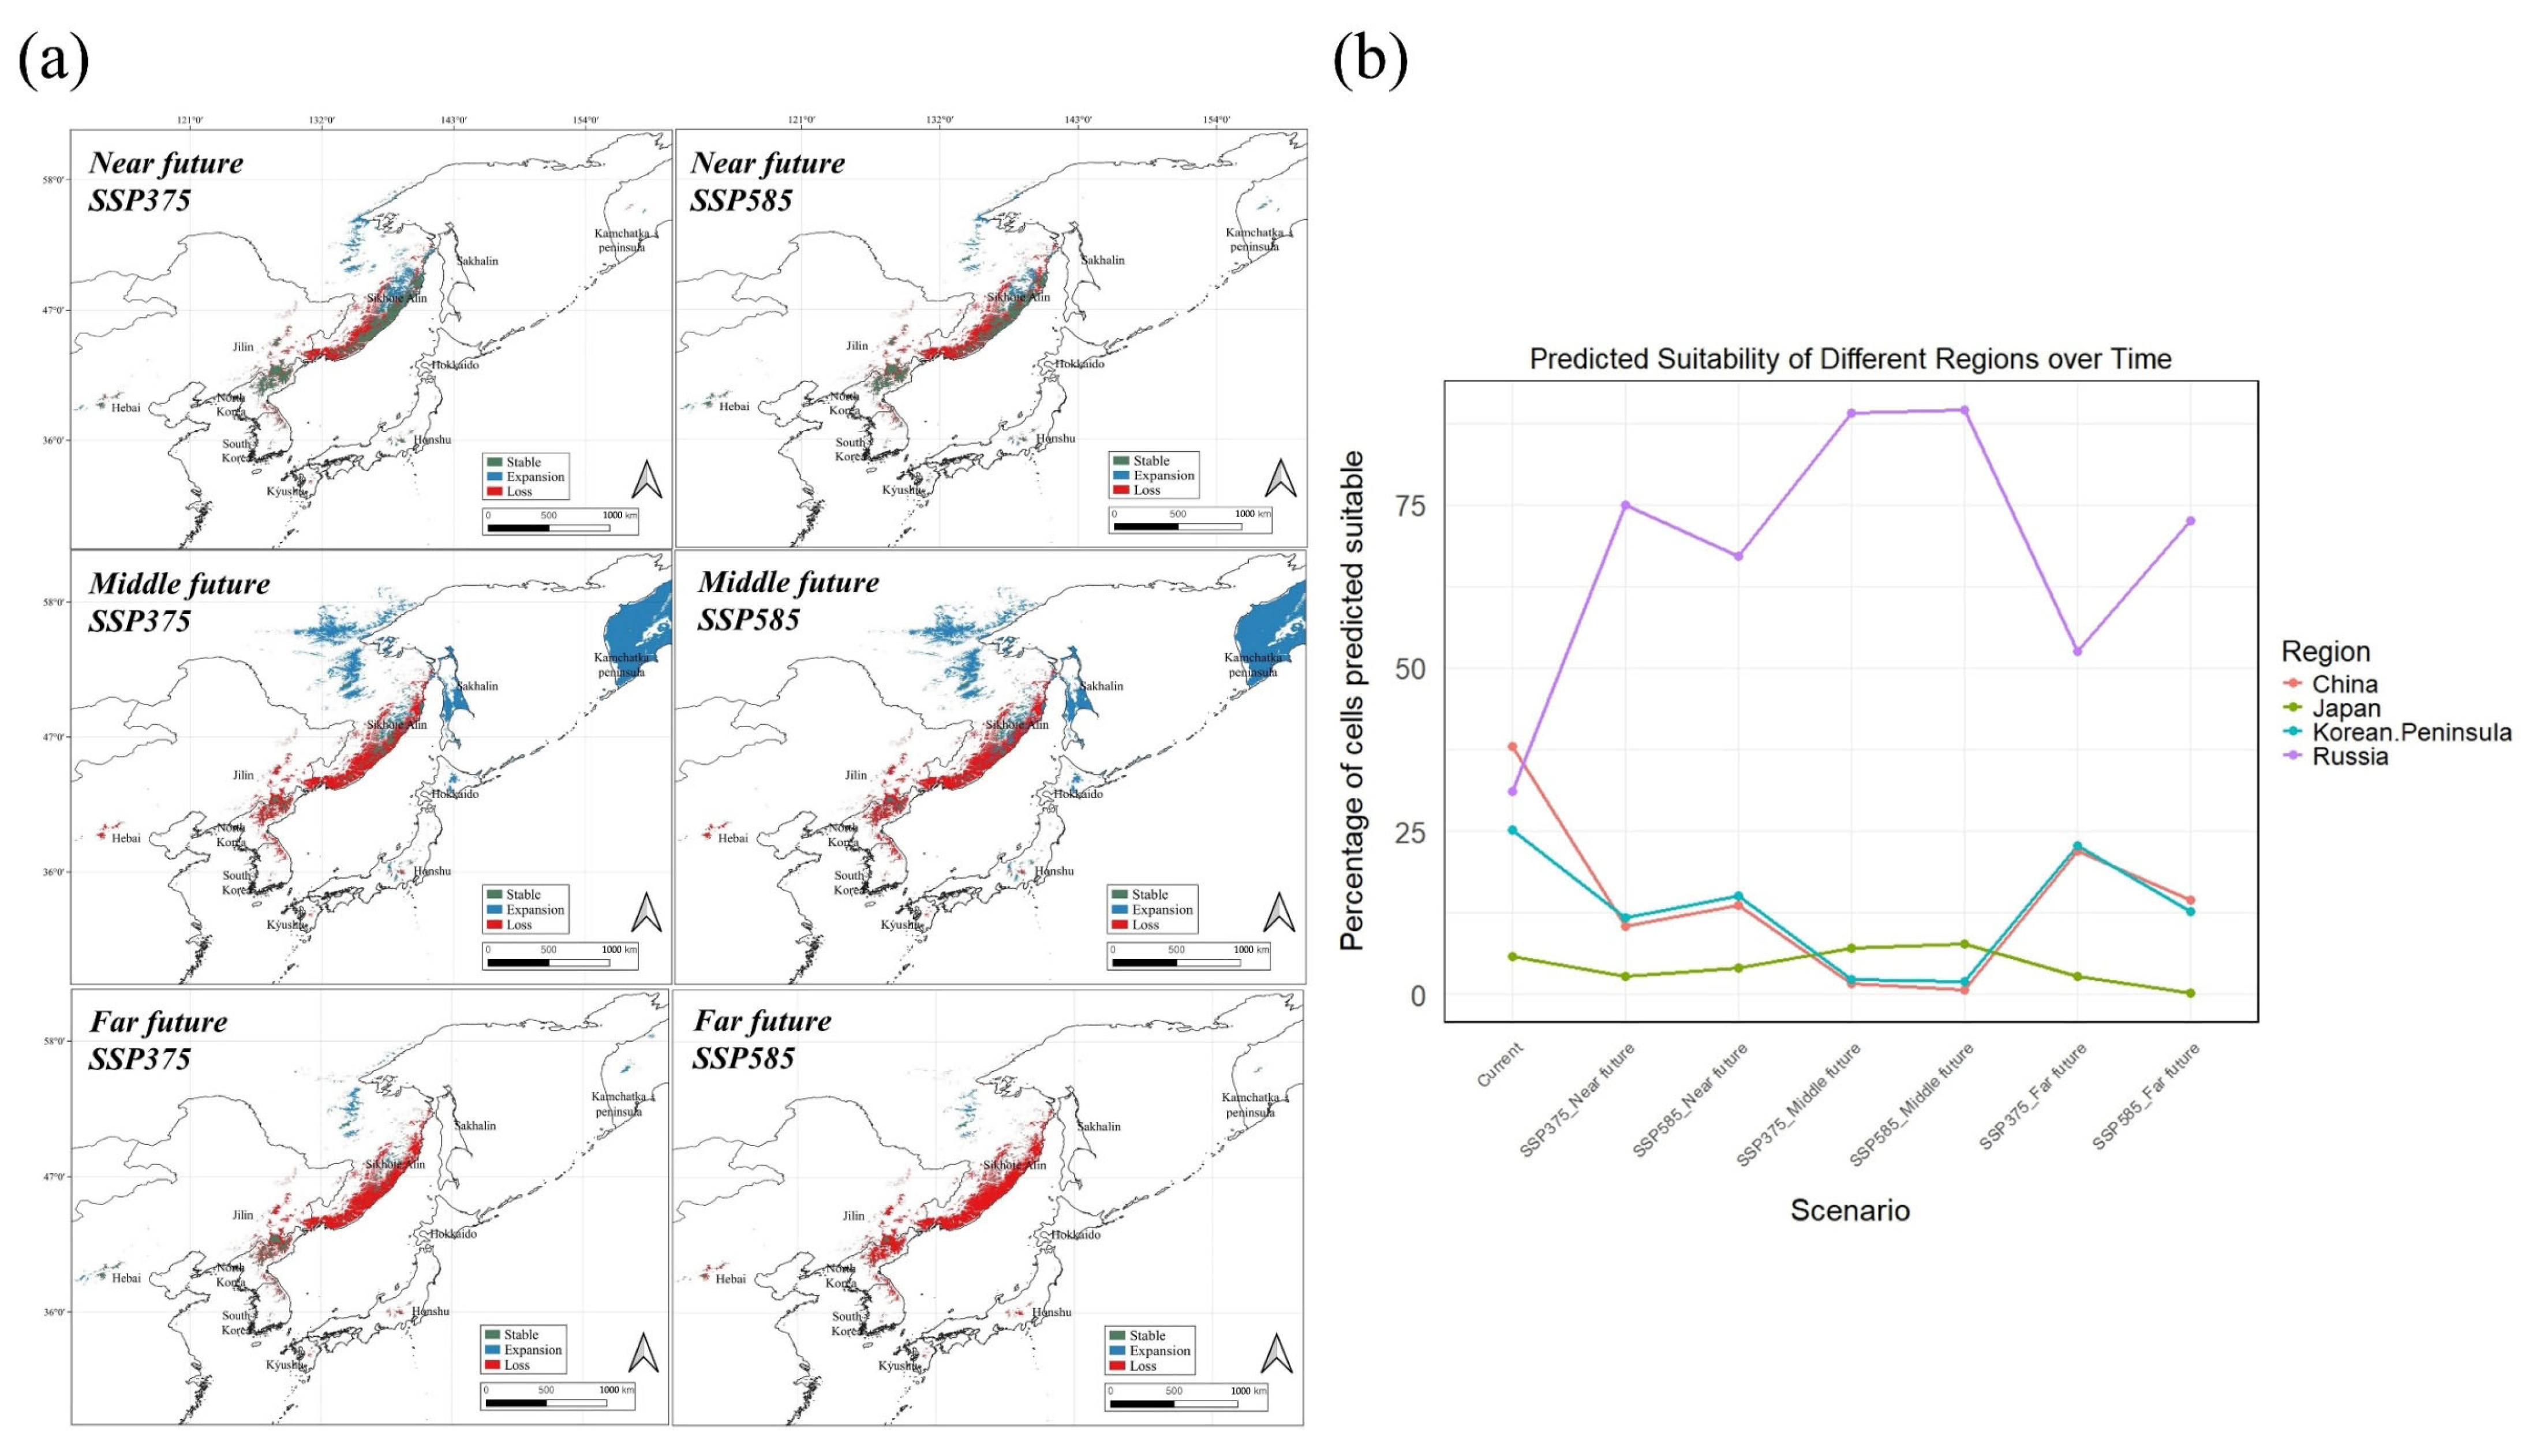
The following changes are projected for A. nephrolepis: (1) In the near future, a significant decrease in suitable habitats is expected across the Korean peninsula, Kyushu (Japan), and Jilin-Heilongjiang (China) (Table 3 and Figure 4). Conversely, suitable habitats are expected to increase in the Russian Far East, with new areas emerging in Sakhalin (Figure 4a); (2) by the middle- to far-future, a substantial decline in suitable habitats is expected across most countries. However, some persistence is projected in the Baekdu/Changbai Range and Mt. Wutai (China). Additionally, Russia’s Sikhote-Alin Range, Badzhal Range, Bureya Nature Reserve, and Kamchatka peninsula are expected to see potential habitat gains; and (3) in the far future, a further decrease in suitable habitat areas is likely, particularly in Sakhalin and the Kamchatka peninsula, which were previously projected to be suitable up to the middle future.
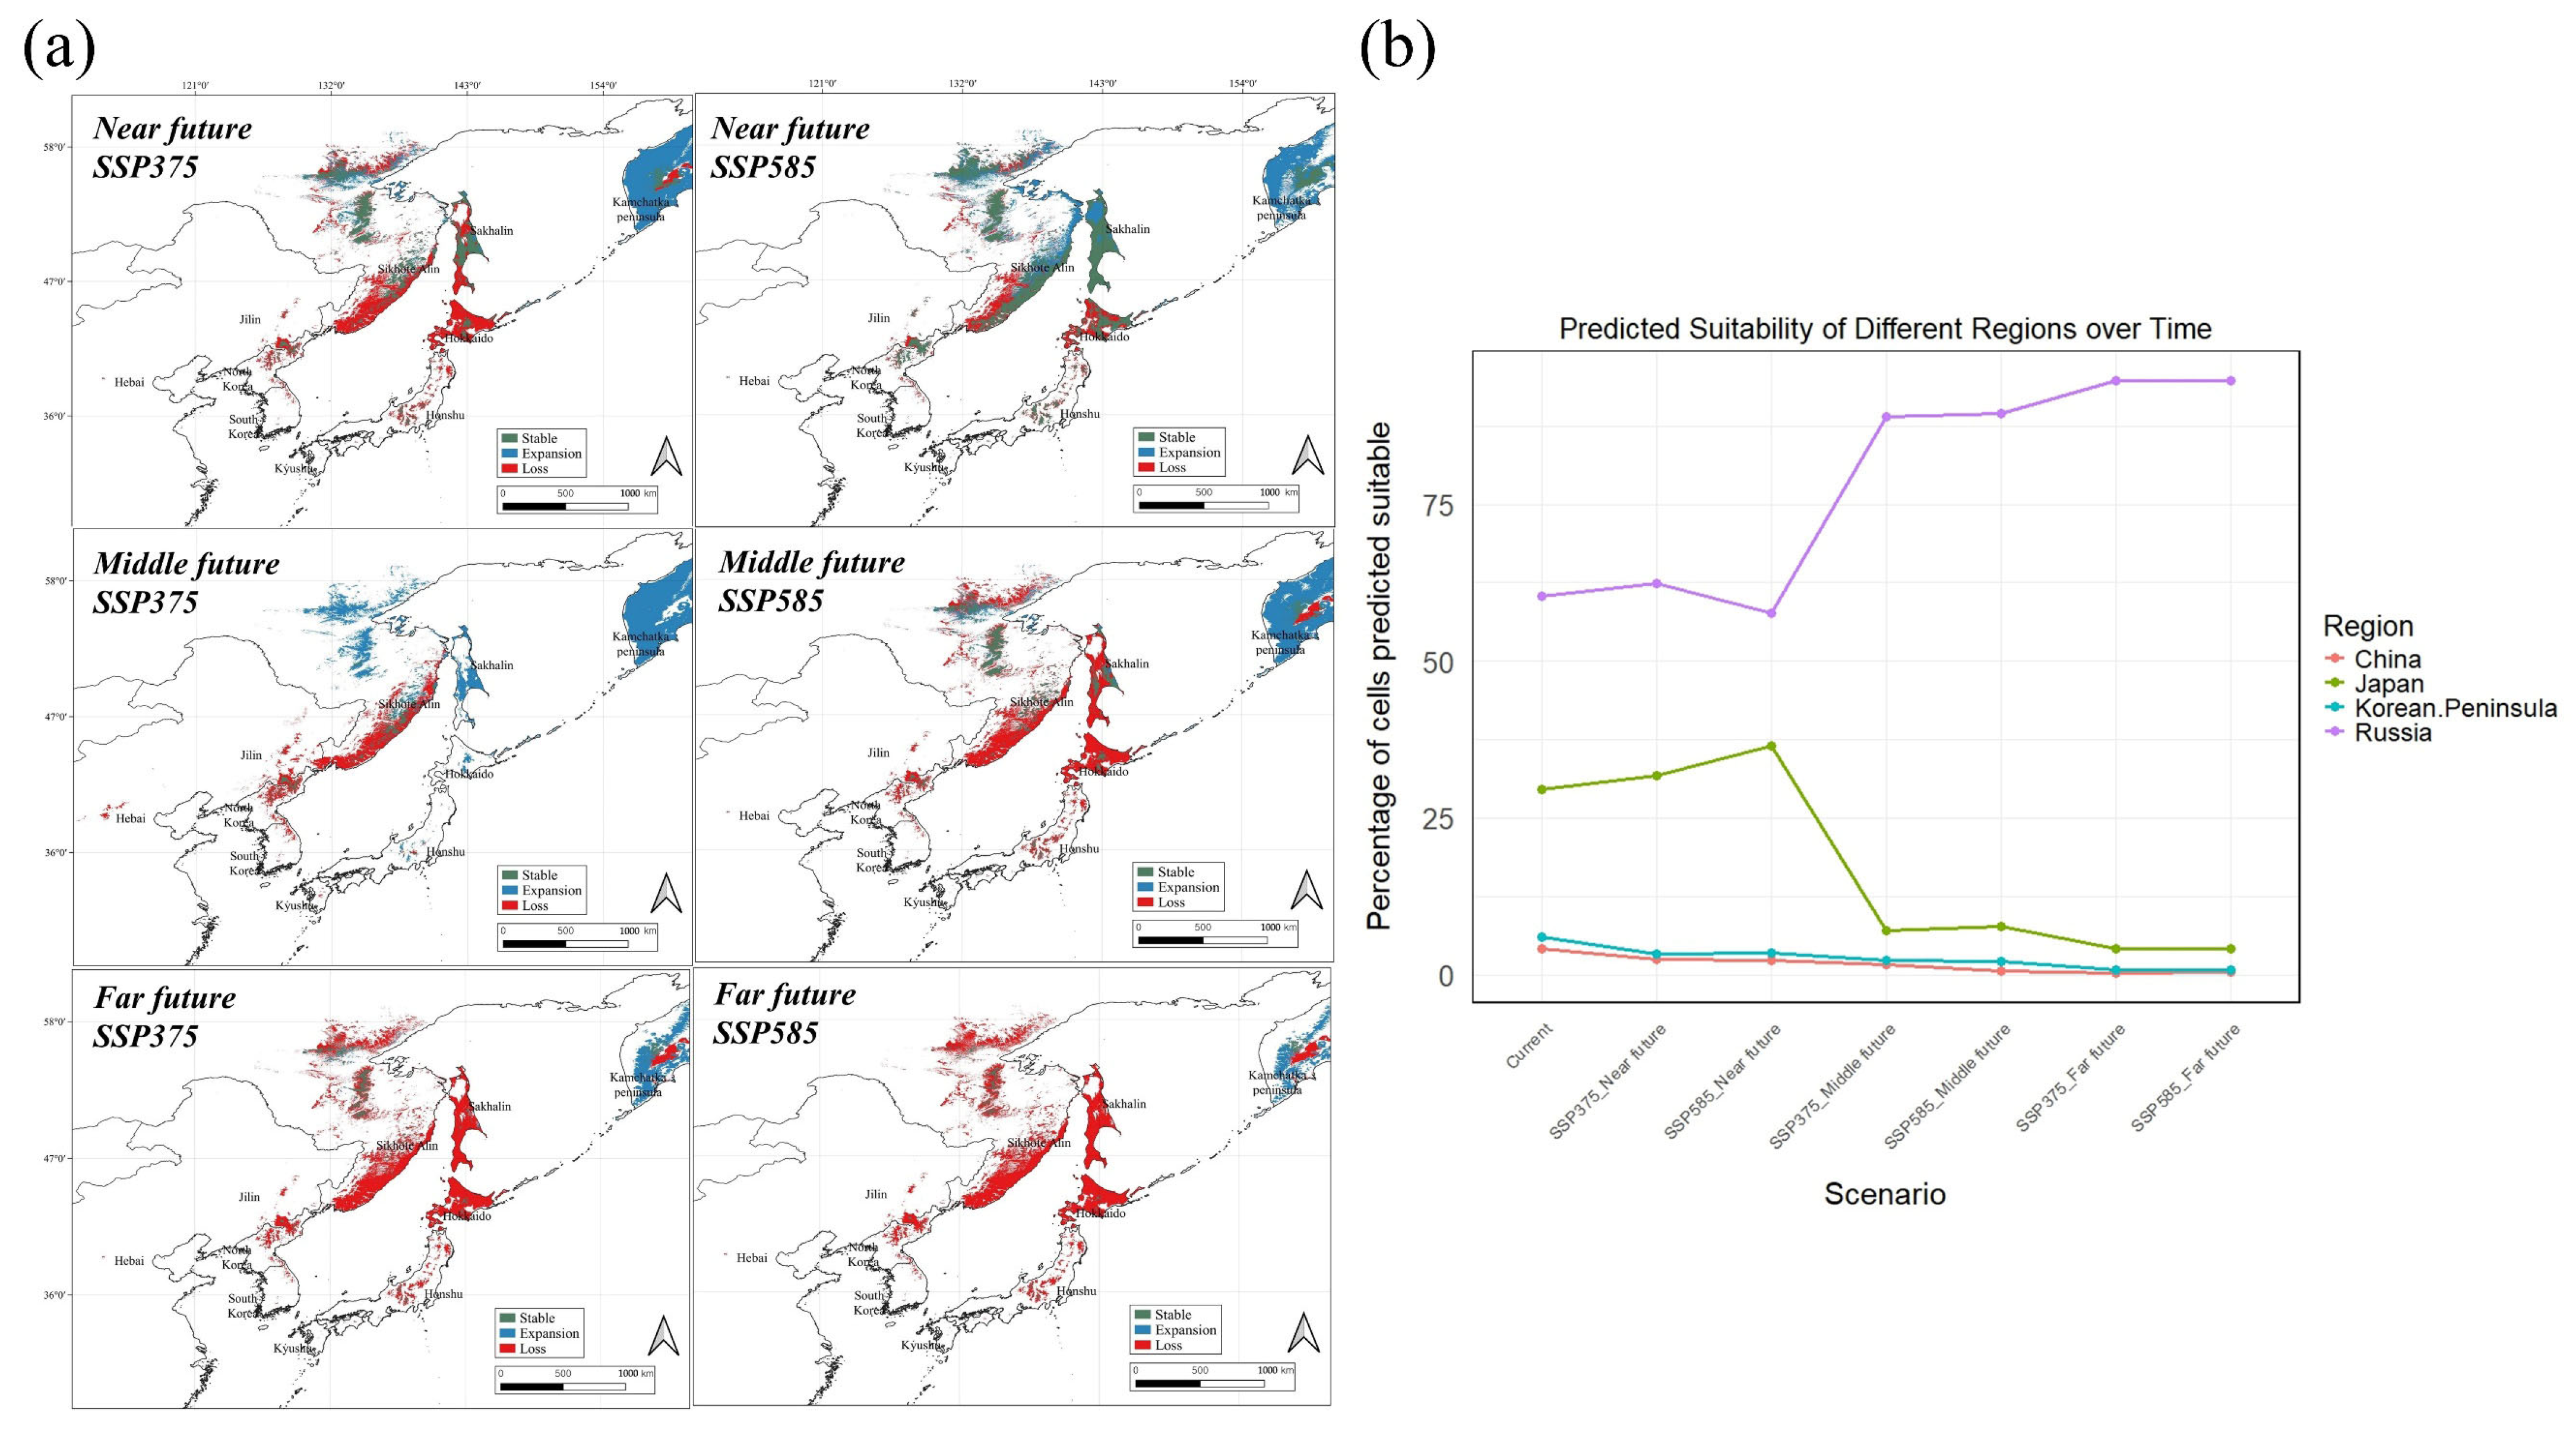
The following changes are projected for P. jezoensis: (1) In the near future, marked decreases in suitable habitats are expected in Japan’s Kyushu and Hokkaido, the Baekdu range in the Korean peninsula and China, and the Sakhalin and Primor’ye–Khabarovsk regions in Russia (Table 3 and Figure 5); (2) similar trends are projected for A. nephrolepis in the middle- to far-future. However, extensive suitable habitats are expected to emerge in Russia’s Kamchatka peninsula (Figure 5a). Additionally, habitat persistence is expected in China’s Mt. Baekdu (high elevation), Japan’s Honshu and Hokkaido, and the northern Korean peninsula; (3) By the far future, South Korea is projected to have no remaining suitable habitat areas for these species (Figure 5b).

3.4. Hotspot Identification for Conservation

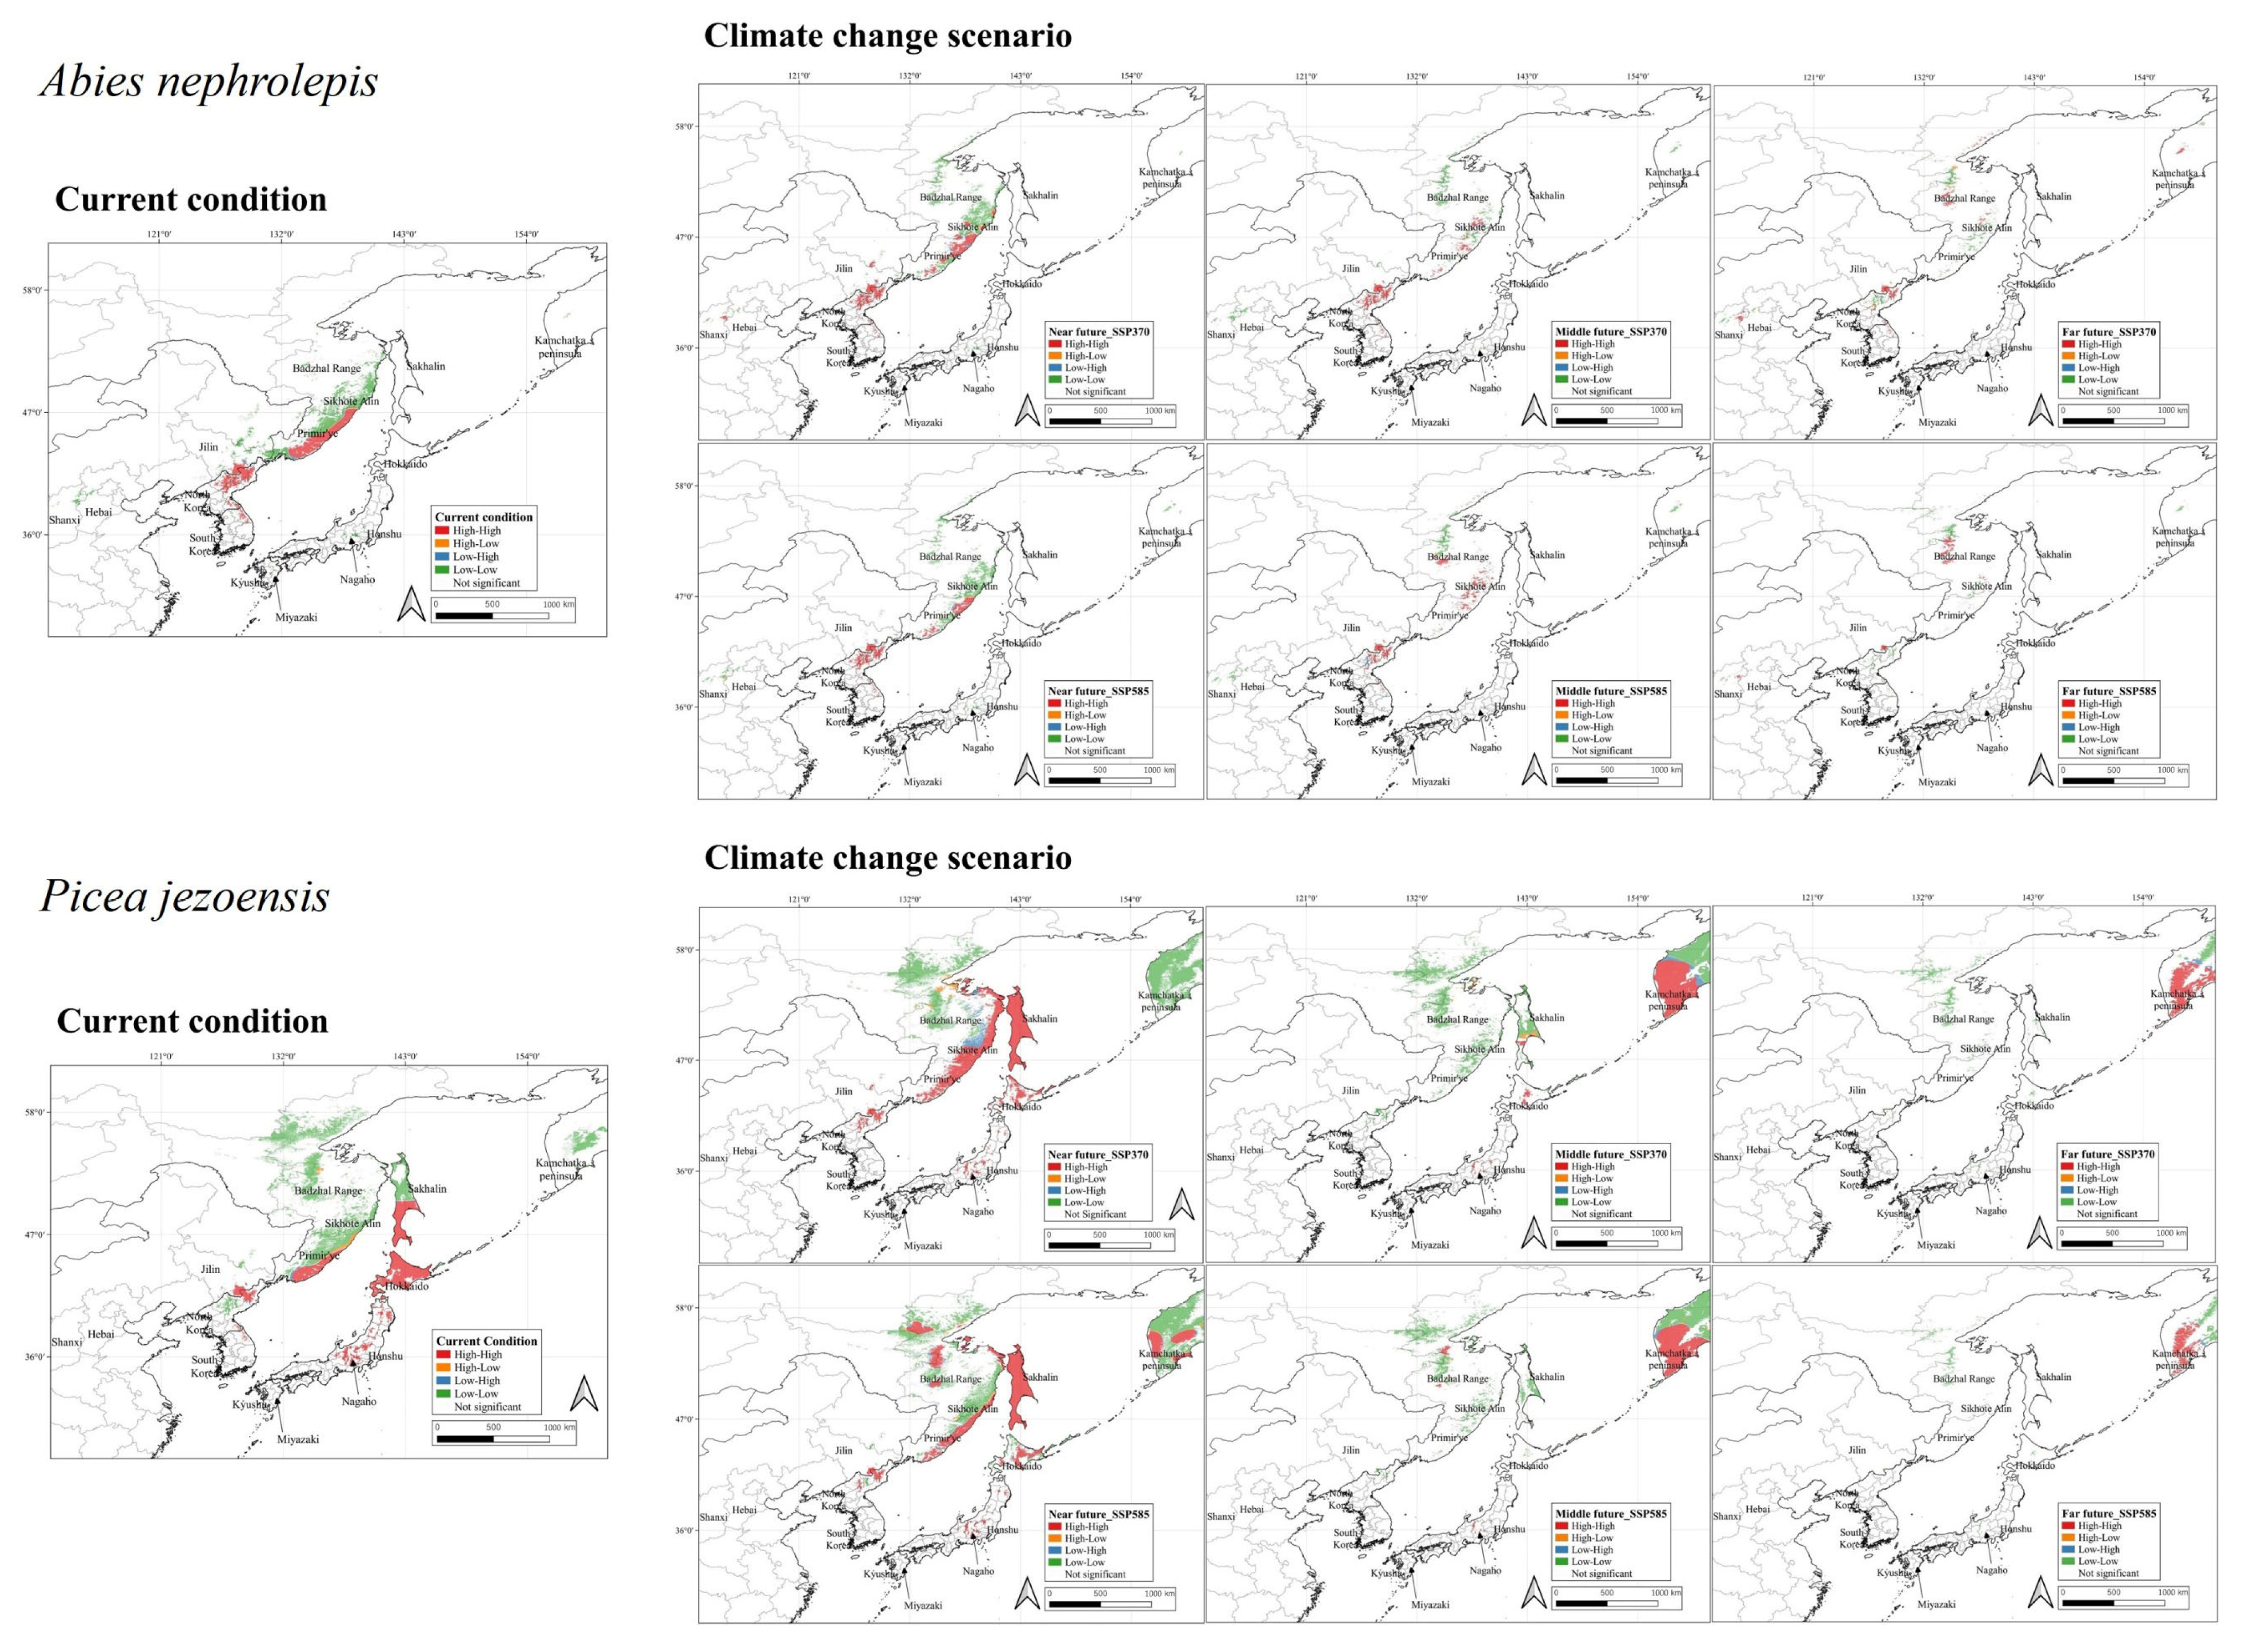
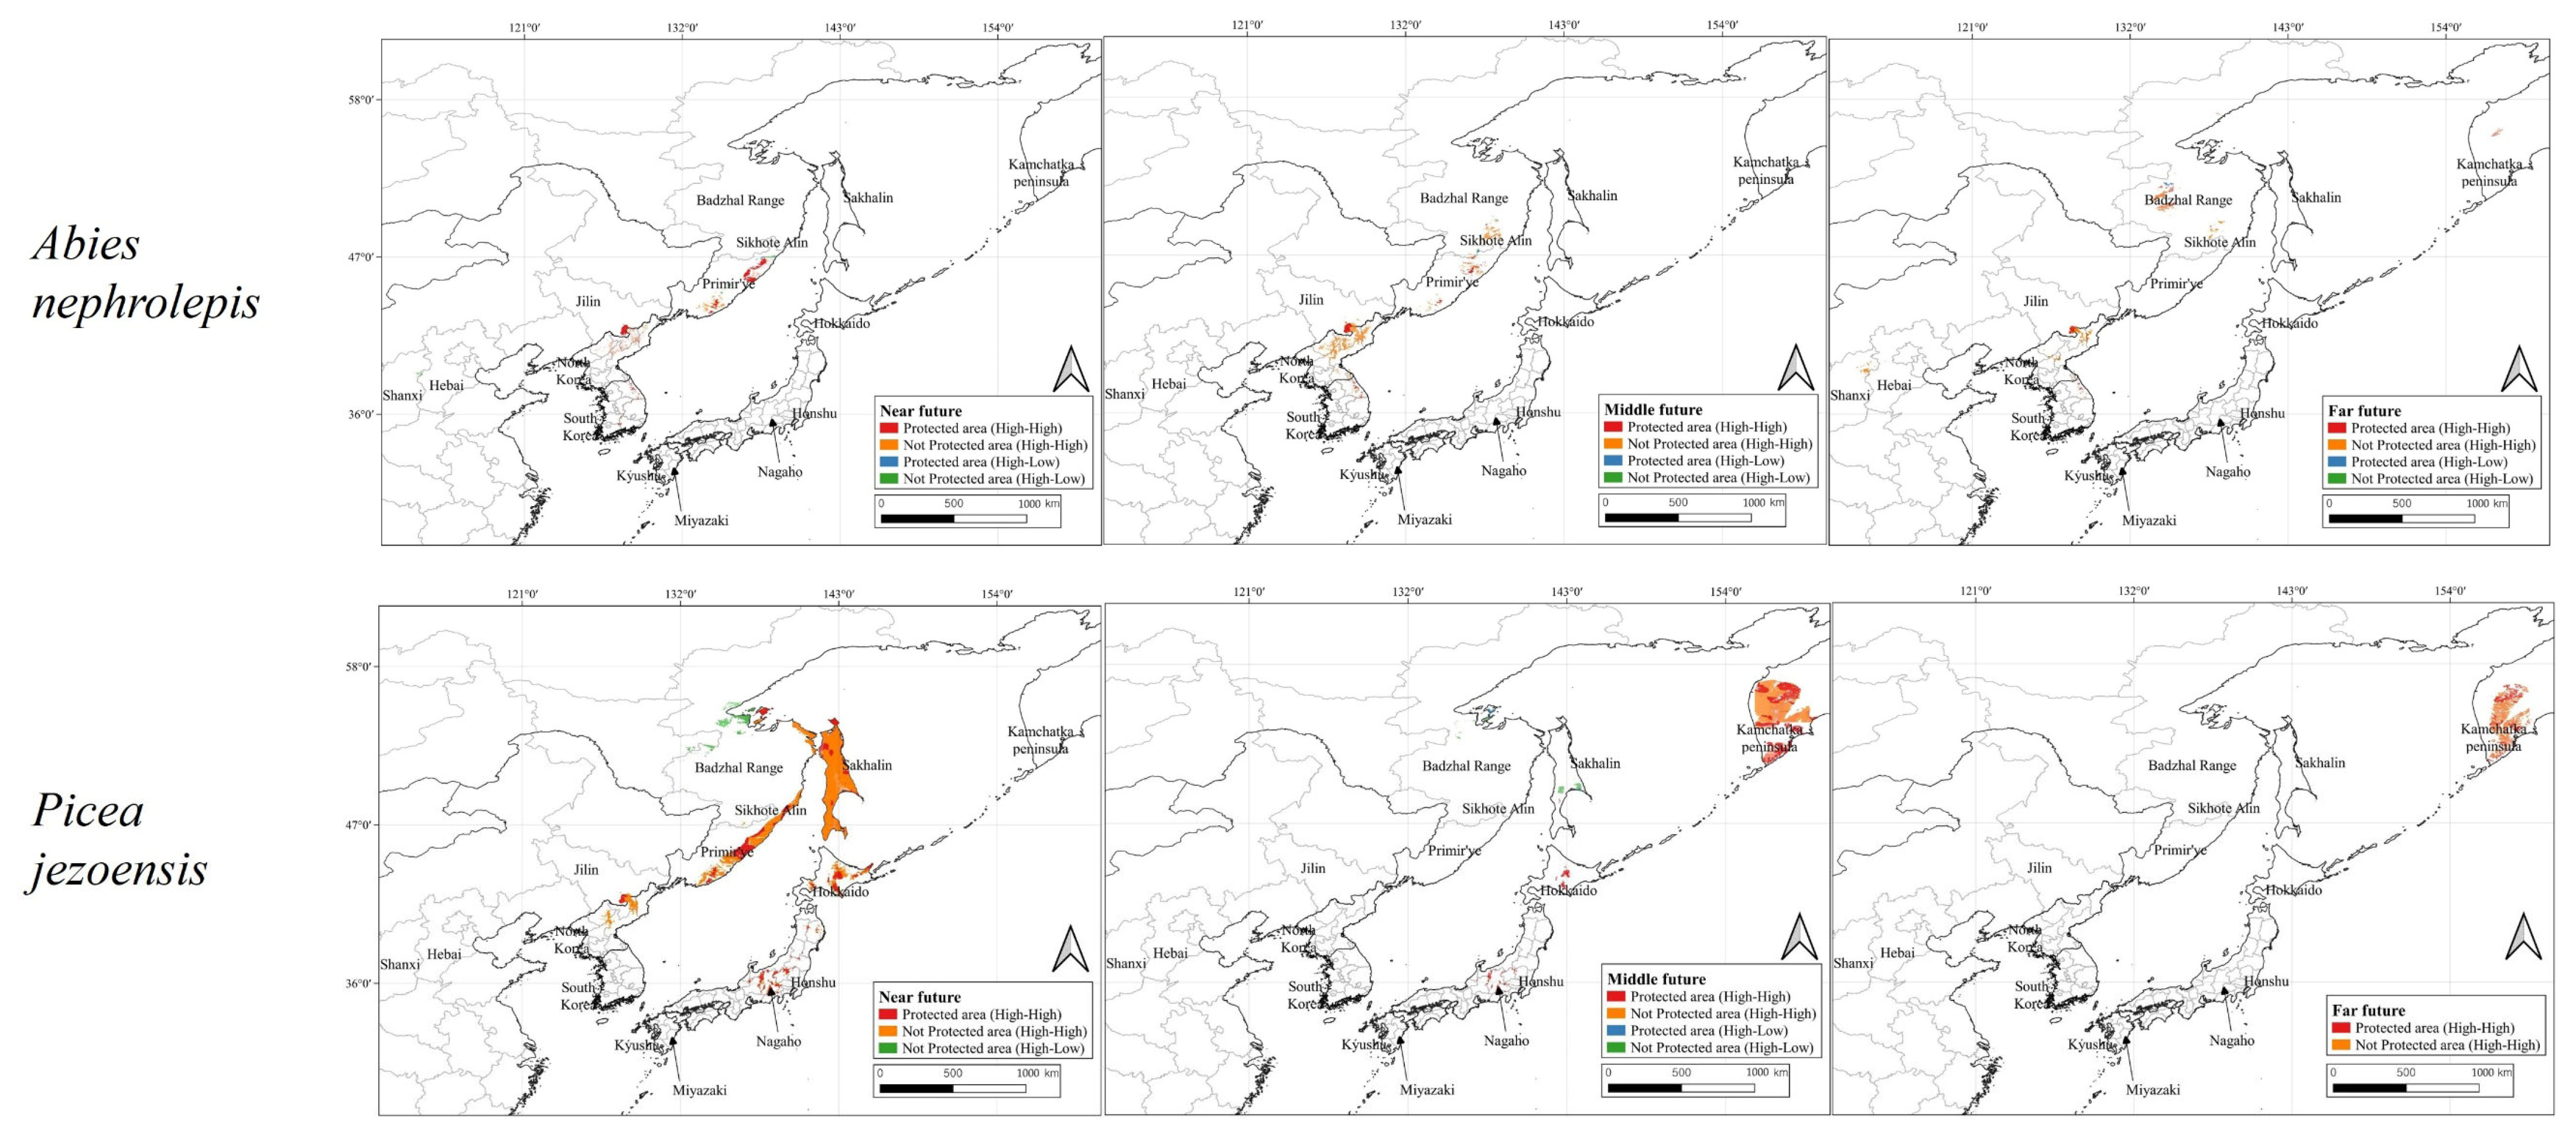
A. nephrolepis and P. jezoensis shared extensive optimal (HH) habitat areas in South Korea and the Baekdu region–Sikhote-Alin region in both current and near-future periods (Figure 6). These regions were also identified as HH points for A. nephrolepis and P. jezoensis (Figure 7) and are predominantly designated as PAs (Figure 7, Figures S4 and S5). A. nephrolepis consistently showed extensive HH cells in these regions for the middle- to far-future, whereas P. jezoensis’ HH and HL cells significantly decreased (Figure 6). Additionally, A. nephrolepis consistently exhibited HH cells up to the far future (SSP370 scenario) in Mt. Seorak, Mt. Odae–Mt. Gyebang, Mt. Hwaak, and Mt. Taebaek, all located in South Korea; however, no HH cells were observed in any locations in South Korea, which represents the phytogeographical southern limit, in the far future (SSP585 scenario). Conversely, in the Mt. Wutai area of China and the Badzhal Range of Russia, LL cells were observed to transition to HH cells by the middle future, emerging as important future climate refuges for A. nephrolepis (Figure 7, Figures S5 and S6).
P. jezoensis is projected to expand its habitat areas in North Korea and parts of Russia (Sakhalin and Kamchatka peninsula) in the near future, with most of these expanded areas classified as optimal (HH) habitats, particularly in Sakhalin and Sikhote-Alin, which are not yet designated as PAs (Figure 6 and Figure S5). By the middle future, HH and HL points were observed in Japan’s Honshu (Mt. Shirouma–Mt. Dainichi Dake, Mt. Ontake, Mt. Tekari Dake–Mt. Kotaro, Mt. Naeba, and Mt. Haku) and Hokkaido, alongside Yam–Alin and Sakhalin in Russia. However, these areas are projected to significantly decrease in the far future, except for the Kamchatka peninsula (Figure 6), which consistently appears as an optimal habitat area throughout the middle- to far-future periods (Figure 6, Figures S5 and S7).

4. Discussion

4.1. Model Evaluation and Key Environmental Factors Affecting A. nephrolepis and P. jezoensis Distribution

By integrating various models into an ensemble, we aimed to reduce the uncertainty of single models. This method demonstrates excellent performance (based on evaluation metrics such as AUC and TSS) for studying species distribution across wide areas, particularly with models such as RF and GBM. The ensemble model’s TSS values demonstrated superior accuracy compared to single models, supporting ensemble modeling for species distribution prediction [69,70,71].
This study aimed to understand species distribution by analyzing bioclimatic variables and various environmental factors. Extensive regions, including the Baekdu region–Sikhote-Alin, commonly emerged as potential habitats for A. nephrolepis and P. jezoensis up to the middle-future period. The characteristics of these regions suggest that suitable habitats will form under meteorological conditions between northern temperate and central boreal climates, bridging continental and maritime climates.
A. nephrolepis and P. jezoensis are found to be greatly influenced by specific climatic parameters. These species prefer regions with elevations above 1000 m, annual precipitation exceeding 1000 mm, and a mean temperature of growing season TREELIM (gst) below 11.85 °C, indicating vulnerability to climate change owing to the narrow range of suitable environments, potentially reducing available habitats. Notably, snow water equivalent (swe) greatly influences P. jezoensis’ distribution, providing greater water availability, consistent soil moisture, and protecting roots from freezing conditions, thus supporting its growth. Furthermore, as climate change accelerates, extensive changes are predicted in forest ecosystems because of not only climate factors but also the interactions between disturbance factors and changes in the frequency, size, and range of pests, which will become even more severe [72,73]. Several studies reported that an increase in average global temperatures because of climate change will increase the incidence of various pests. Particularly, the incidence of pests is predicted to continually increase in the colder northern latitudes and high-altitude regions [74]. Marini et al. [75] analyzed the climate change factors involved in damage by Ips typographus (L.), a species that causes severe damage to European spruce forests, and tested the extent of damage by altitude. The authors reported that low summer rainfall (<500 mm) is a major factor determining the severity of the damage by I. typographus and determined that lower-than-average rainfall in the southern part of the spruce forest range would lead to more damage. As such, there is a need to monitor and compare the range of pests and damage at various altitudes on the Korean peninsula and in Japan, located at the southern limits of A. nephrolepis and P. jezoensis. This represents a key task for the conservation of these species against disturbance factors attributed to environmental change. Meanwhile, our modelling relied on climate and elevation variables. While fine-scale edaphic traits (e.g., soil texture, drainage) and topographic characteristics (e.g., aspect direction, topographical position) can influence microclimates and seedling establishment, some studies suggest that incorporating such variables does not necessarily improve predictive performance [76]. Nonetheless, omitting these layers restricts landscape-level applications. Consequently, an integrated modelling approach that accounts for all major factors is required and should be a core objective in future species-distribution model development.

4.2. Exploring Changes in Distribution According to Climate Change Scenarios

Our findings indicate that, under the SSP370 and SSP585 climate scenarios, the suitable habitats for A. nephrolepis and P. jezoensis will progressively diminish from the southern regions. However, some regions within each country showed stability or slower changes in habitat suitability.
Notably, prominent suitable distributions remained in high-altitude areas: Mt. Jiri (≥1500 m asl) in southern Korea, Mt. Seorak (≥1500 m asl) and Mt. Geumgang (≥1300 m asl) in central Korea, Mt. Mantap (≥1700 m asl) and Mt. Baekdu (≥1800 m asl) in northern Korea, the Mt. Wutai region in China (≥2500 m asl), the Kamchatka peninsula in Russia, the Badzhal Range (≥1400 m asl), and Sikhote-Alin (≥1400 m asl).
This widespread presence of suitable habitat at higher elevations highlights the importance of altitude for these species, as it creates natural gradients of temperature and precipitation within forest ecosystems, thereby fostering cooler, moister microclimates and potentially promoting distinct soil-forming processes that may influence seedling establishment and survival [77]. Moreover, elevational shifts in vegetation structure can in turn modulate understory temperature and moisture regimes, reinforcing these microclimatic gradients and creating feedback that shape species distributions along the slope. Consequently, our findings suggest that lowland and highland ecosystems may respond differently to climate change due to these physical variations, leading to spatial heterogeneity [78,79]. However, further research is necessary to explore how additional factors, such as terrain heterogeneity and other environmental characteristics, might influence these responses within forest ecosystems.
An examination of the current potential habitats of P. jezoensis revealed that the species shows a marked distribution in regions strongly influenced by maritime climates. Under projected climate change scenarios, broader suitable habitats, particularly for P. jezoensis, were identified in Russia’s Kamchatka peninsula and inland regions such as the Badzhal Range. The prominent distribution of P. jezoensis in the Kamchatka peninsula is still influenced by seasonal dynamics, but for P. jezoensis, the expansion of their distribution into inland regions with relatively lower temperatures is expected to be significantly affected by future temperature changes.
For A. nephrolepis, although extensive suitable distribution areas persist in Japan and the Kamchatka peninsula in Russia in the near- to middle-future, these areas sharply decline in the far future. Conversely, Mt. Wutai in China and the Badzhal Range in Russia exhibited sustained suitable distribution areas compared to other regions. The annual precipitation amount (bio12) significantly influences A. nephrolepis distribution, positively affecting habitat suitability in areas with favorable moisture conditions until the near- to middle-future. However, in the far future, A. nephrolepis distribution shifts to regions with lower temperatures rather than higher precipitation, potentially adversely affecting its growth owing to temperature increases [12].
Our results revealed that the distribution of species primarily inhabiting temperate and boreal high-elevation forests is continuously declining owing to climate change, potentially increasing their extinction risk. Understanding these climate-driven changes in suitable distribution sites and identifying current and future habitable areas is crucial for developing effective species conservation strategies. Moreover, this knowledge is essential for understanding the key environmental factors influencing species distribution [80,81].

4.3. Conservation Priority Areas Strategy Proposals

To understand spatial trends and patterns of A. nephrolepis and P. jezoensis, we conducted hotspot analysis to identify potential suitable habitat zones for each species. For enhanced accuracy, we incorporated Anselin Local Moran I operations, leading to de-tailed insights into spatial relationships and subtle variations within the hotspots thus identified. Our methodology integrated climate change scenarios and land cover data to estimate potential population distributions and designate suitable protected areas (PAs) for each region. Strengthening existing PAs and identifying new candidates is crucial for effective species conservation amidst climate change, serving as climate refuges. Additionally, we identified key conservation areas by country, proposing strategies and highlighting the need for further research.
The Korean peninsula, representing the southernmost natural habitat, i.e., the phytogeographical southern limit for A. nephrolepis and P. jezoensis, is particularly vulnerable to climate change. Hotspot analysis identified a substantial portion of South Korea’s potential habitat as PAs. However, the future outlook was less promising for P. jezoensis with hotspot areas expected to decrease under future climate scenarios, with no hotspots remaining in the middle-term future. This highlights the need for tailored conservation strategies for each species and continuous and precise monitoring of current distribution sites for effective conservation efforts. Furthermore, examining whether areas with extensive suitable habitat are designated as PAs and considering further PA expansion are essential for sustainable conservation.
Mt. Illwol in South Korea represents a critical case. Initially identified as an optimal (HH) potential distribution area for A. nephrolepis in the near future, this southernmost habitat has not reported any occurrences since then. Given its outstanding geographical features and diverse endemic plant species [82,83], protecting Mt. Illwol is crucial. Despite its significance, it currently lacks formal protection designation. Although possible concerns exist that the dense canopy of A. nephrolepis may affect shade formation or allelopathy in nearby forest ecosystems, the extinction of A. nephrolepis from forests could have extensive effects on plants and animals across all forest ecosystems. Conclusively, the conservation of A. nephrolepis can play an important role in maintaining ecosystem balance and mitigating the effects of change. Therefore, proactive management and consideration for PA status are essential for the conservation of A. nephrolepis and maintaining forest biodiversity.
The North Korean regions of Mt. Baekdu, Mt. Sungjok, and Mt. Rangrim have been identified as core areas for species conservation, with more extensive optimal (HH) potential distribution areas analyzed than South Korea. However, no reports exist on the growth status and stand characteristics of subalpine pine in North Korea. Therefore, academic exchanges on population dynamics and decline trends are needed to explore cooperative measures, such as sharing current species status and establishing databases. China’s Mt. Baekdu and Russia’s Sikhote–Alin are key regions for conserving A. nephrolepis and P. jezoensis. Notably, A. nephrolepis s exhibits consistent suitability (HH potential) far into the future, whereas P. jezoensis faces limitations in achieving optimal distribution. The A. nephrolepisP. jezoensis forests dominate this region, characterized by a high and dense canopy that limits light penetration, promoting specific understory vegetation and creating a competitive environment deterring invasive species [20]. Thus, it is necessary to develop a strategy to conserve these species together, rather than establish individual conservation strategies for each species. Observations in Russia’s Badzhal Range revealed extensive potential habitats for A. nephrolepis into the far future and wide potential habitat areas in the northern part until the middle future for P. jezoensis. The Badzhal Range’s convergence of continental and marine climates fosters contrasting plant communities. This unique environment makes it an ideal location to study ecological impacts amidst changing conditions [84]. In conclusion, given that the two species have been consistently analyzed as having potential habitats in this region, continuous monitoring here could provide valuable insights into species conservation. Therefore, the Badzhal Range, where continental and marine climates coexist, can serve as an important in situ/ex situ conservation site for A. nephrolepis and P. jezoensis.
The Kamchatka peninsula was identified as an optimal (HH) distribution area for all three species until the far future. Its forests, designated as world cultural heritage sites, are strictly controlled to limit human impact [85]. The slow summer melting of snow in Kamchatka’s inland areas prevents forest fires and positively influences plant growth despite its continental climate [85]. This unique capacity to sustain suitable habitats despite climate variability underscores the Kamchatka Peninsula’s global significance for climate change impact assessment and long-term conservation planning. The peninsula also hosts the serial UNESCO World Heritage property “Volcanoes of Kamchatka”, which protects approximately 3.67 million ha—about 7% of the region—across six federal reserves and parks [86]. These areas form an ecologically significant and continuous protected forest landscape in Russia. Within this network, Kronotsky Biosphere Reserve conserves a relict Abies gracilis grove of ~30,000 trees [87], demonstrating that sizeable, cool-adapted conifer populations can persist under current management and highlighting realistic in situ potential for conserving A. nephrolepis and P. jezoensis. Nonetheless, sustaining adequate funding, enforcement capacity, and geopolitical stability will be essential to uphold the long-term resilience and functionality of this protected area network. Furthermore, establishing a long-term monitoring program will be crucial for preserving the ecological integrity of the region.
The Mt. Wutai region of China was identified as an optimal (HH) potential distribution area for A. nephrolepis until the far future and as a potential suitable, albeit not optimal, area for P. jezoensis across all climate change scenarios. Consequently, this region is a crucial area for in situ/ex situ conservation sites, similar to Mt. Baekdu.
In Japan, potential habitats for P. jezoensis are projected to persist well into the far future, encompassing mountains in Honshu (Mt. Shirouma-Mt. Dainichi Dake, Mt. Ontake, Mt. Tekari Dake–Mt. Kotaro, Mt. Naeba, and Mt. Haku) and Hokkaido. Notably, no migration has been observed of these species from their southern habitats northward, and most distribution points are already designated as PAs, highlighting the importance of ongoing monitoring in these critical areas. For P. jezoensis, significant genetic differences exist between populations in Honshu and those on the Korean peninsula [88], making regular growth assessments critical for understanding adaptation abilities.
This study assessed how current environmental conditions and climate change affect species distribution, identified key environmental variables affecting habitat distribution, and identified hotspot areas to support new designations of PAs and reinforce the roles of existing ones. Using species distribution models (SDMs), we evaluated the broad impacts of projected climate changes across various scenarios. However, to comprehensively understand the effects of climate change on complex forest ecosystems, integrating vegetation dynamics into the analysis is essential [12,89]. Climate change alters disturbance regimes, exacerbating the impacts of interacting disturbance factors such as changes in floral composition and invasive species, which hinder forest ecosystem recovery alongside direct climate impacts (e.g., climate elements) [90,91,92,93]. Lee et al. [89] reported that, as climate change caused tree deaths and a shift in species composition in the upper vegetation layers of A. nephrolepis and P. jezoensis communities in South Korea, disturbance interactions would be present as the newly invading vines would have a negative effect on the regeneration of young trees. Particularly, environments with more bare rock were reported to suffer less invasive damage, as exposed rock facilitated bryophyte cover and reduced direct damage by the wind, supporting the regeneration of young trees and alleviating water stress on adult trees [12,89]. Summarily, to understand the regeneration and survival of saplings, it is essential to consider not only climatic conditions, but also the effects of non-climatic conditions on climate shelters.
To fully understand the decline of subalpine conifers and associated disturbance factors, research must encompass the entire range of natural habitats to explore regional variations. Alpine and subalpine ecosystems, which have evolved in isolation over extended periods, require tailored conservation strategies based on a precise, region-specific understanding of species rather than uniform approaches. In addition, continuous monitoring is in essential ecosystem restoration: tracking which plants benefit from the decline of certain conifers and establish themselves in the newly available space, and examining environmental conditions that support the growth of young trees into mature stands.
Future research should use advanced methodologies to explore the evolutionary ecological mechanisms trees use to adapt to changing environments. A diverse array of studies will provide the comprehensive understanding needed to manage evolving ecosystems effectively.

4.4. Importance and Challenges of Ecological Corridors Between Protected Areas

It is paramount to strengthen ecological connections between protected areas (PAs) in the study region. In our results, we observed significant connectivity between the habitats of A. nephrolepis and P. jezoensis across the northern Korean peninsula, China, and the Primorye region of Russia. Ecological corridors are a key element that aid in the migration and spread of species in the face of environmental changes, and play important roles in supporting the maintenance and recovery of ecosystems. If connectivity is lacking, isolated populations are at risk of inbreeding, local extinction, and reduced adaptability to changing conditions. According to earlier studies, ecological corridors are beneficial to species conservation because they strengthen habitat functions, prevent threats, such as human access, and provide a broad potential habitat [94,95,96]. As such, wide corridors should be prepared between PAs to promote the natural spread of species. A well-documented illustration of successful cross-border corridor design is the Yellowstone to Yukon Conservation Initiative (Y2Y) [97], which has progressively linked over 1.3 million km2 of protected and multiple-use lands across the Canada–USA border through collaborative governance by federal, provincial/state, Indigenous, and NGO partners [97]. Based on the above corridor case, key lessons relevant to future efforts include (1) agreeing on a science-based corridor vision among all participating jurisdictions, (2) establishing a permanent transboundary secretariat to coordinate funding, data sharing, and adaptive management, and (3) evolving the initially loose partnership model into a legally binding, multi-level governance framework that secures long-term financing and enforces consistent corridor standards across borders [97]. However, ecological corridors often cross multiple countries, and major difficulties are involved in conservation efforts that cross national borders. For example, international differences in conservation policies, legal systems, and priorities can exacerbate the complexity of establishing and managing PAs across multiple countries. Furthermore, political or diplomatic tensions can prevent effective cooperation and sharing of data, leading to difficulties in achieving consistent management practices. Thus, to ensure the long-term efficacy of PAs, it will be essential to discuss and develop strategies for the harmonization of conservation efforts across borders.

5. Conclusions

This study provides a continent-scale, climate-explicit projection of future range shifts for two high-elevation Northeast Asian conifers, A. nephrolepis and P. jezoensis, and outlines a step-wise protocol for expanding protected areas to secure their long-term persistence. Under climate-change scenarios, suitable habitats are projected to diminish progressively from the southern portions of the range, yet persistent climatic refugia (≥1300 m a.s.l.) are identified in high-elevation zones such as Kamchatka, the southern Sikhote-Alin, and Mount Wutai. These long-term climate-stable areas warrant immediate prioritization for sustained monitoring and protection, as they are likely to function as source populations for future recolonization. Conversely, remnant low-latitude stands already facing thermal stress may require active measures—such as assisted gene flow or micro-site restoration—to avert local extirpation. By overlaying ensemble modelling outputs with Getis-Ord Gi* and Local Moran I hotspot analyses, including existing protected-area boundaries and land-cover layers, we pinpointed priority refugia that retain the most favorable climatic conditions for these conifers under future scenarios. Our integrative framework—combining robust climate projections with spatial conservation planning—can be readily applied to other climate-sensitive taxa and regions, providing clear guidance for targeting conservation investments in a warming world and advancing global biodiversity goals.

Supplementary Materials

The following supporting information can be downloaded at: https://www.mdpi.com/article/10.3390/f16071183/s1, Figure S1: Correlation analysis results of topographic and environmental variables for species distribution model development of Abies nephrolepis and Picea jezoensis. Figure S2. Bivariate analysis results of environmental factors influencing Abies nephrolepis identified through ensemble analysis under current climate conditions. Figure S3. Bivariate analysis results of environmental factors influencing Picea jezoensis identified through ensemble analysis under current climate conditions. Figure S4. The geographical distribution of priority areas for the conservation of Abies nephrolepis and Picea jezoensis in the Korean peninsula. Figure S5. The geographical distribution of priority areas for the conservation of Abies nephrolepis and Picea jezoensis in Russia. Figure S6. The geographical distribution of priority areas for the conservation of Abies nephrolepis in China. Figure S7. The geographical distribution of priority areas for the conservation of Picea jezoensis in Japan. Table S1. Comparison of model performance based on the number of pseudo-absences used in the species distribution modeling of Abies nephrolepis and Picea jezoensis. Table S2. Comparison of the performance between default hyperparameters and tuned hyperparameters for the species distribution modeling of Picea jezoensis.

Author Contributions

Conceptualization, S.-J.L.; methodology, S.-J.L.; software, S.-J.L.; validation, S.-J.L. and D.-B.S.; formal analysis, S.-J.L.; investigation, S.-J.L., D.-B.S., J.-G.B., S.-H.L., D.-H.L., and S.-H.O.; resources, S.-J.L. and D.-B.S.; data curation, S.-J.L. and D.-B.S.; writing—original draft preparation, S.-J.L.; writing—review and editing, S.-J.L., D.-B.S., J.-G.B., S.-H.L., D.-H.L., S.-H.O., S.H.C., and K.H.B.; visualization, S.-J.L.; supervision, S.-H.O. and J.-G.B.; project administration, S.-H.O. and J.-G.B. All authors have read and agreed to the published version of the manuscript.

Funding

This study was supported by a Baekdudaegan National Arboretum (BDNA) grant funded by the Korea Forest Service (KFS) (2022-KS-OB-02-01-03) and ‘R&D Program for Forest Science Technology (RS-2024-00404388)’ provided by Korea Forest Service (Korea Forestry Promotion Institute).

Data Availability Statement

The original contributions presented in the study are available in Supplementary Materials. Further inquiries can be directed to the authors of this study.

Conflicts of Interest

The authors declare that there are no conflicts of interest.

References

  1. Dixon, R.K.; Solomon, A.; Brown, S.; Houghton, R.; Trexier, M.; Wisniewski, J. Carbon pools and flux of global forest ecosystems. Science 1994, 263, 185–190. [Google Scholar] [CrossRef] [PubMed]
  2. Paoletti, E.; Schaub, M.; Matyssek, R.; Wieser, G.; Augustaitis, A.; Bastrup-Birk, A.; Bytnerowicz, A.; Günthardt-Goerg, M.; Müller-Starck, G.; Serengil, Y. Advances of air pollution science: From forest decline to multiple-stress effects on forest ecosystem services. Environ. Pollut. 2010, 158, 1986–1989. [Google Scholar] [CrossRef] [PubMed]
  3. Körner, C. A matter of tree longevity. Science 2017, 355, 130–131. [Google Scholar] [CrossRef] [PubMed]
  4. Seidel, D.J.; Fu, Q.; Randel, W.J.; Reichler, T.J. Widening of the tropical belt in a changing climate. Nat. Geosci. 2008, 1, 21–24. [Google Scholar] [CrossRef]
  5. Anderson-Teixeira, K.J.; Miller, A.D.; Mohan, J.E.; Hudiburg, T.W.; Duval, B.D.; DeLucia, E.H. Altered dynamics of forest recovery under a changing climate. Glob. Change Biol. 2013, 19, 2001–2021. [Google Scholar] [CrossRef] [PubMed]
  6. McDowell, N.G.; Allen, C.D.; Anderson-Teixeira, K.; Aukema, B.H.; Bond-Lamberty, B.; Chini, L.; Clark, J.S.; Dietze, M.; Grossiord, C.; Hanbury-Brown, A.; et al. Pervasive shifts in forest dynamics in a changing world. Science 2020, 368, eaaz9463. [Google Scholar] [CrossRef] [PubMed]
  7. Forzieri, G.; Dakos, V.; McDowell, N.G.; Ramdane, A.; Cescatti, A. Emerging signals of declining forest resilience under climate change. Nature 2022, 608, 534–539. [Google Scholar] [CrossRef] [PubMed]
  8. Allen, C.D.; Macalady, A.K.; Chenchouni, H.; Bachelet, D.; McDowell, N.; Vennetier, M.; Kitzberger, T.; Rigling, A.; Breshears, D.D.; Hogg, E.T.; et al. A global overview of drought and heat-induced tree mortality reveals emerging climate change risks for forests. For. Ecol. Manag. 2010, 259, 660–684. [Google Scholar] [CrossRef]
  9. Bose, A.K.; Gessler, A.; Bolte, A.; Bottero, A.; Buras, A.; Cailleret, M.; Camarero, J.J.; Haeni, M.; Hereş, A.M.; Hevia, A.; et al. Growth and resilience responses of Scots pine to extreme droughts across Europe depend on predrought growth conditions. Glob. Change Biol. 2020, 26, 4521–4537. [Google Scholar] [CrossRef] [PubMed]
  10. Gazol, A.; Camarero, J.J.; Vicente-Serrano, S.M.; Sánchez-Salguero, R.; Gutiérrez, E.; de Luis, M.; Sangüesa-Barreda, G.; Novak, K.; Rozas, V.; Tíscar, P.A.; et al. Forest resilience to drought varies across biomes. Glob. Change Biol. 2018, 24, 2143–2158. [Google Scholar] [CrossRef] [PubMed]
  11. Shao, J.; Zhou, X.; van Groenigen, K.J.; Zhou, G.; Zhou, H.; Zhou, L.; Lu, M.; Xia, J.; Jiang, L.; Hungate, B.A.; et al. Warming effects on grassland productivity depend on plant diversity. Glob. Ecol. Biogeogr. 2022, 31, 588–598. [Google Scholar] [CrossRef]
  12. Lee, S.-J.; Shin, D.-B.; Byeon, J.-G.; Oh, S.-H. Climate Change Vulnerability Assessment and ecological characteristics study of Abies nephrolepis in South Korea. Forests 2023, 14, 855. [Google Scholar] [CrossRef]
  13. Delcourt, H.R.; Delcourt, P.A.; Webb, T., III. Dynamic plant ecology: The spectrum of vegetational change in space and time. Quat. Sci. Rev. 1982, 1, 153–175. [Google Scholar] [CrossRef]
  14. Williams, J.W.; Shuman, B.N.; Webb, T., III. Dissimilarity analyses of late-Quaternary vegetation and climate in eastern North America. Ecology 2001, 82, 3346–3362. [Google Scholar] [CrossRef]
  15. Kong, W. Species composition and distribution of native Korean conifers. J. Geol. Soc. 2004, 39, 528–543. [Google Scholar]
  16. Gottfried, M.; Pauli, H.; Futschik, A.; Akhalkatsi, M.; Barančok, P.; Benito Alonso, J.L.; Coldea, G.; Dick, J.; Erschbamer, B.; Fernández Calzado, M.R.; et al. Continent-wide response of mountain vegetation to climate change. Nat. Clim. Change 2012, 2, 111–115. [Google Scholar] [CrossRef]
  17. Pauli, H.; Gottfried, M.; Dullinger, S.; Abdaladze, O.; Akhalkatsi, M.; Alonso, J.L.B.; Coldea, G.; Dick, J.; Erschbamer, B.; Calzado, R.F.; et al. Recent plant diversity changes on Europe’s mountain summits. Science 2012, 336, 353–355. [Google Scholar] [CrossRef] [PubMed]
  18. Chan, W.P.; Lenoir, J.; Mai, G.S.; Kuo, H.C.; Chen, I.C.; Shen, S.F. Climate velocities and species tracking in global mountain regions. Nature 2024, 629, 114–120. [Google Scholar] [CrossRef] [PubMed]
  19. Lawlor, J.A.; Comte, L.; Grenouillet, G.; Lenoir, J.; Baecher, J.A.; Bandara, R.M.W.J.; Sunday, J. Mechanisms, detection and impacts of species redistributions under climate change. Nat. Rev. Earth Environ. 2024, 5, 351–368. [Google Scholar] [CrossRef]
  20. Parmesan, C. Ecological and evolutionary responses to recent climate change. Annu. Rev. Ecol. Evol. Syst. 2006, 37, 637–669. [Google Scholar] [CrossRef]
  21. Leonelli, G.; Pelfini, M.; Morra di Cella, U.; Garavaglia, V. Climate warming and the recent treeline shift in the European Alps: The role of geomorphological factors in high-altitude sites. Ambio 2011, 40, 264–273. [Google Scholar] [CrossRef] [PubMed]
  22. Nakamura, Y.; Krestov, P.V. Coniferous forests of the temperate zone of Asia. Conifer. For. Ser. Ecosyst. World 2005, 6, 163–220. [Google Scholar]
  23. Petropavlovskiy, B.; Chavtur, N.; Dochevaia, N. Antropogenniye izmenenia lesnogo pokrova Primorskogo kraya [Antropogenic changes in the forests of Primorskiy region]. In Dinamika Rastitelnosti Yuga Dalnego Vostoka [Dynamics of Vegetation of the Southern Far East]; Dalnauka: Vladivostok, Russia, 1985; pp. 44–51. [Google Scholar]
  24. Venier, L.A.; Thompson, I.D.; Fleming, R.; Malcolm, J.; Aubin, I.; Trofymow, J.A.; Langor, D.; Sturrock, R.; Patry, C.; Outerbridge, R.; et al. Effects of natural resource development on the terrestrial biodiversity of Canadian boreal forests. Environ. Rev. 2014, 22, 457–490. [Google Scholar] [CrossRef]
  25. Kim, E.-S.; Lee, J.-S.; Park, G.-E.; Lim, J.-H. Change of subalpine coniferous forest area over the last 20 years. J. Korean Soc. 2019, 108, 10–20. [Google Scholar]
  26. Park, G.E.; Kim, E.-S.; Jung, S.-C.; Yun, C.-w.; Kim, J.-s.; Kim, J.-d.; Kim, J.; Lim, J.-H. Distribution and Stand Dynamics of Subalpine Conifer Species (Abies nephrolepis, A. koreana, and Picea jezoensis) in Baekdudaegan Protected Area. J. Korean Soc. 2022, 111, 61–71. [Google Scholar]
  27. Rodrigues, A.S.; Andelman, S.J.; Bakarr, M.I.; Boitani, L.; Brooks, T.M.; Cowling, R.M.; Fishpool, L.D.; Da Fonseca, G.A.; Gaston, K.J.; Hoffmann, M.; et al. Effectiveness of the global protected area network in representing species diversity. Nature 2004, 428, 640–643. [Google Scholar] [CrossRef] [PubMed]
  28. Geldmann, J.; Manica, A.; Burgess, N.D.; Coad, L.; Balmford, A. A global-level assessment of the effectiveness of protected areas at resisting anthropogenic pressures. Proc. Natl. Acad. Sci. USA 2019, 116, 23209–23215. [Google Scholar] [CrossRef] [PubMed]
  29. Wang, D.; de Knegt, H.J.; Hof, A.R. The effectiveness of a large protected area to conserve a global endemism hotspot may vanish in the face of climate and land-use changes. Front. Ecol. Evol. 2022, 10, 984842. [Google Scholar] [CrossRef]
  30. Hannah, L.; Midgley, G.; Andelman, S.; Araújo, M.; Hughes, G.; Martinez-Meyer, E.; Pearson, R.; Williams, P. Protected area needs in a changing climate. Front. Ecol. Environ. 2007, 5, 131–138. [Google Scholar] [CrossRef]
  31. Stein, B.A.; Staudt, A.; Cross, M.S.; Dubois, N.S.; Enquist, C.; Griffis, R.; Hansen, L.J.; Hellmann, J.J.; Lawler, J.J.; Nelson, E.J.; et al. Preparing for and managing change: Climate adaptation for biodiversity and ecosystems. Front. Ecol. Environ. 2013, 11, 502–510. [Google Scholar] [CrossRef]
  32. Tingley, M.W.; Darling, E.S.; Wilcove, D.S. Fine-and coarse-filter conservation strategies in a time of climate change. Ann. N. Y. Acad. Sci. 2014, 1322, 92–109. [Google Scholar] [CrossRef] [PubMed]
  33. Thom, D.; Seidl, R. Natural disturbance impacts on ecosystem services and biodiversity in temperate and boreal forests. Biol. Rev. 2016, 91, 760–781. [Google Scholar] [CrossRef] [PubMed]
  34. Seidl, R.; Thom, D.; Kautz, M.; Martin-Benito, D.; Peltoniemi, M.; Vacchiano, G.; Wild, J.; Ascoli, D.; Petr, M.; Honkaniemi, J.; et al. Forest disturbances under climate change. Nat. Clim. Change 2017, 7, 395–402. [Google Scholar] [CrossRef] [PubMed]
  35. Liu, Y.; Fan, P.; Yue, W.; Huang, J.; Li, D.; Tian, Z. Assessing polycentric urban development in mountainous cities: The case of Chongqing Metropolitan Area, China. Sustainability 2019, 11, 2790. [Google Scholar] [CrossRef]
  36. Cerioni, M.; Brabec, M.; Bače, R.; Bāders, E.; Bončina, A.; Brůna, J.; Chećko, E.; Cordonnier, T.; de Koning, J.H.; Diaci, J.; et al. Recovery and resilience of European temperate forests after large and severe disturbances. Glob. Change Biol. 2024, 30, e17159. [Google Scholar] [CrossRef]
  37. Guisan, A.; Thuiller, W. Predicting species distribution: Offering more than simple habitat models. Ecol. Lett. 2005, 8, 993–1009. [Google Scholar] [CrossRef] [PubMed]
  38. Merow, C.; Smith, M.J.; Silander, J.A., Jr. A practical guide to MaxEnt for modeling species’ distributions: What it does, and why inputs and settings matter. Ecography 2013, 36, 1058–1069. [Google Scholar] [CrossRef]
  39. Li, J.; Fan, G.; He, Y. Predicting the current and future distribution of three Coptis herbs in China under climate change conditions, using the MaxEnt model and chemical analysis. Sci. Total Environ. 2020, 698, 134141. [Google Scholar] [CrossRef] [PubMed]
  40. Shi, X.; Yin, Q.; Sang, Z.; Zhu, Z.; Jia, Z.; Ma, L. Prediction of potentially suitable areas for the introduction of Magnolia wufengensis under climate change. Ecol. Indic. 2021, 127, 1077. [Google Scholar] [CrossRef]
  41. Franklin, J. Species distribution models in conservation biogeography: Developments and challenges. Divers. Distrib. 2013, 19, 1217–1223. [Google Scholar] [CrossRef]
  42. Farashi, A.; Shariati, M. Biodiversity hotspots and conservation gaps in Iran. J. Nat. Conserv. 2017, 39, 37–57. [Google Scholar] [CrossRef]
  43. Lanzas, M.; Hermoso, V.; de-Miguel, S.; Bota, G.; Brotons, L. Designing a network of green infrastructure to enhance the conservation value of protected areas and maintain ecosystem services. Sci. Total Environ. 2019, 651, 541–550. [Google Scholar] [CrossRef] [PubMed]
  44. Ma, B.; Zeng, W.; Xie, Y.; Wang, Z.; Hu, G.; Li, Q.; Cao, R.; Zhuo, Y.; Zhang, T. Boundary delineation and grading functional zoning of Sanjiangyuan National Park based on biodiversity importance evaluations. Sci. Total Environ. 2022, 825, 154068. [Google Scholar] [CrossRef] [PubMed]
  45. Title, P.O.; Bemmels, J.B. ENVIREM: An expanded set of bioclimatic and topographic variables increases flexibility and improves performance of ecological niche modeling. Ecography 2018, 41, 291–307. [Google Scholar] [CrossRef]
  46. Kim, H.T.B. Lee Herbarium Vascular Plant Collection. Version 1.21. TB Lee Herbarium. 2021. Occurrence Dataset. Available online: https://doi.org/10.15468/3lchvw (accessed on 5 January 2024).
  47. Seregin, A. Moscow University Herbarium (MW). Version 1.312. Lomonosov Moscow State University. 2023. Occurrence Dataset. Available online: https://doi.org/10.15468/cpnhcc (accessed on 2 January 2024).
  48. Yang, L.; Xu, Z. 2023 Contributions of Plant Specimen Data inside China. Chinese Academy of Sciences (CAS). 2023. Occurrence Dataset. Available online: https://doi.org/10.15468/9us6fb (accessed on 3 January 2024).
  49. Tojo, K. Herbarium of Shinshu University. Version 1.6. National Museum of Nature and Science, Japan. 2023. Occurrence Dataset. Available online: https://doi.org/10.15468/6docrj (accessed on 5 January 2024).
  50. Seregin, A.; Stepanova, N. MHA Herbarium: Collections of vascular plants. Version 1.243. Tsitsin Main Botanical Garden Russian Academy of Sciences. 2024. Occurrence Dataset. Available online: https://doi.org/10.15468/827lk2 (accessed on 5 January 2024).
  51. Ebihara, A. Vascular plant specimens of National Museum of Nature and Science (TNS). National Museum of Nature and Science, Japan. 2023. Occurrence Dataset. Available online: https://doi.org/10.15468/6rld6e (accessed on 5 January 2024).
  52. Betts, M.G.; Diamond, A.; Forbes, G.; Villard, M.-A.; Gunn, J. The importance of spatial autocorrelation, extent and resolution in predicting forest bird occurrence. Ecol. Modell. 2006, 191, 197–224. [Google Scholar] [CrossRef]
  53. Segurado, P.; Araujo, M.B.; Kunin, W. Consequences of spatial autocorrelation for niche-based models. J. Appl. Ecol. 2006, 43, 433–444. [Google Scholar] [CrossRef]
  54. Dormann, C.F. Effects of incorporating spatial autocorrelation into the analysis of species distribution data. Glob. Ecol. Biogeogr. 2007, 16, 129–138. [Google Scholar] [CrossRef]
  55. Pearson, R.G.; Raxworthy, C.J.; Nakamura, M.; Townsend Peterson, A. Predicting species distributions from small numbers of occurrence records: A test case using cryptic geckos in Madagascar. J. Biogeogr. 2007, 34, 102–117. [Google Scholar] [CrossRef]
  56. Veloz, S.D. Spatially autocorrelated sampling falsely inflates measures of accuracy for presence-only niche models. J. Biogeogr. 2009, 36, 2290–2299. [Google Scholar] [CrossRef]
  57. Naimi, B.; Skidmore, A.K.; Groen, T.A.; Hamm, N.A. Spatial autocorrelation in predictors reduces the impact of positional uncertainty in occurrence data on species distribution modelling. J. Biogeogr. 2011, 38, 1497–1509. [Google Scholar] [CrossRef]
  58. Maria, B.; Udo, S. Why input matters: Selection of climate data sets for modelling the potential distribution of a treeline species in the Himalayan region. Ecol. Modell. 2017, 359, 92–102. [Google Scholar] [CrossRef]
  59. Karger, D.N.; Conrad, O.; Böhner, J.; Kawohl, T.; Kreft, H.; Soria-Auza, R.W.; Kessler, M. Climatologies at high resolution for the earth’s land surface areas. Sci. Data 2017, 4, 170122. [Google Scholar] [CrossRef] [PubMed]
  60. Barbet-Massin, M.; Jiguet, F.; Albert, C.H.; Thuiller, W. Selecting pseudo-absences for species distribution models: How, where and how many? Methods Ecol. Evol. 2012, 3, 327–338. [Google Scholar] [CrossRef]
  61. Lobo, J.M.; Jiménez-Valverde, A.; Real, R. AUC: A misleading measure of the performance of predictive distribution models. Glob. Ecol. Biogeogr. 2008, 17, 145–151. [Google Scholar] [CrossRef]
  62. Allouche, O.; Tsoar, A.; Kadmon, R. Assessing the accuracy of species distribution models: Prevalence, kappa and the true skill statistic (TSS). J. Appl. Ecol. 2006, 43, 1223–1232. [Google Scholar] [CrossRef]
  63. Manel, S.; Williams, H.C.; Ormerod, S.J. Evaluating presence–absence models in ecology: The need to account for prevalence. J. Appl. Ecol. 2001, 38, 921–931. [Google Scholar] [CrossRef]
  64. Liu, C.; White, M.; Newell, G. Selecting thresholds for the prediction of species occurrence with presence-only data. J. Biogeogr. 2013, 40, 778–789. [Google Scholar] [CrossRef]
  65. Swets, J.A. Measuring the accuracy of diagnostic systems. Science 1988, 240, 1285–1293. [Google Scholar] [CrossRef] [PubMed]
  66. Getis, A.; Ord, J.K. The analysis of spatial association by use of distance statistics. Geogr. Anal. 1992, 24, 189–206. [Google Scholar] [CrossRef]
  67. Ord, J.K.; Getis, A. Local spatial autocorrelation statistics: Distributional issues and an application. Geogr. Anal. 1995, 27, 286–306. [Google Scholar] [CrossRef]
  68. Anselin, L. Local indicators of spatial association—LISA. Geogr. Anal. 1995, 27, 93–115. [Google Scholar] [CrossRef]
  69. Thuiller, W.; Lafourcade, B.; Engler, R.; Araújo, M.B. BIOMOD—A platform for ensemble forecasting of species distributions. Ecography 2009, 32, 369–373. [Google Scholar] [CrossRef]
  70. Samal, P.; Srivastava, J.; Singarasubramanian, S.; Saraf, P.N.; Charles, B. Ensemble modeling approach to predict the past and future climate suitability for two mangrove species along the coastal wetlands of peninsular India. Ecol. Inform. 2022, 72, 101819. [Google Scholar] [CrossRef]
  71. Samal, P.; Srivastava, J.; Charles, B.; Singarasubramanian, S. Species distribution models to predict the potential niche shift and priority conservation areas for mangroves (Rhizophora apiculata, R. mucronata) in response to climate and sea level fluctuations along coastal India. Ecol. Indic. 2023, 154, 110631. [Google Scholar] [CrossRef]
  72. Bale, J.S.; Masters, G.J.; Hodkinson, I.D.; Awmack, C.; Bezemer, T.M.; Brown, V.K.; Butterfield, J.; Buse, A.; Coulson, J.C.; Farrar, J.; et al. Herbivory in global climate change research: Direct effects of rising temperature on insect herbivores. Glob. Change Biol. 2002, 8, 1–16. [Google Scholar] [CrossRef]
  73. Jaime, L.; Batllori, E.; Lloret, F. Bark beetle outbreaks in coniferous forests: A review of climate change effects. Eur. J. For. Res. 2024, 143, 1–17. [Google Scholar] [CrossRef]
  74. Sambaraju, K.R.; Carroll, A.L.; Zhu, J.; Stahl, K.; Moore, R.D.; Aukema, B.H. Climate change could alter the distribution of mountain pine beetle outbreaks in western Canada. Ecography 2012, 35, 211–223. [Google Scholar] [CrossRef]
  75. Marini, L.; Ayres, M.P.; Battisti, A.; Faccoli, M. Climate affects severity and altitudinal distribution of outbreaks in an eruptive bark beetle. Clim. Change 2012, 115, 327–341. [Google Scholar] [CrossRef]
  76. Guisan, A.; Graham, C.H.; Elith, J.; Huettmann, F.; NCEAS Species Distribution Modelling Group. Sensitivity of predictive species distribution models to change in grain size. Divers. Disrib. 2007, 13, 332–340. [Google Scholar] [CrossRef]
  77. Körner, C. The use of ‘altitude’ in ecological research. Trends Ecol. Ecol. 2007, 22, 569–574. [Google Scholar] [CrossRef] [PubMed]
  78. Pepin, N.; Bradley, R.S.; Diaz, H.F.; Baraer, M.; Caceres, E.B.; Forsythe, N. Elevation-dependent warming in mountain regions of the world. Nat. Clim. Change 2015, 5, 424–430. [Google Scholar]
  79. Saatkamp, A.; Argagnon, O.; Noble, V.; Finocchiaro, M.; Meineri, E. Climate change impacts on Mediterranean vegetation are amplified at low altitudes. Glob. Ecol. Biogeogr. 2023, 32, 1113–1126. [Google Scholar] [CrossRef]
  80. Rather, Z.A.; Ahmad, R.; Khuroo, A.A. Ensemble modelling enables identification of suitable sites for habitat restoration of threatened biodiversity under climate change: A case study of Himalayan Trillium. Ecol. Eng. 2022, 176, 106534. [Google Scholar] [CrossRef]
  81. Lee, S.-J.; Byeon, J.-G.; Kim, J.-S.; Cho, J.-h.; Oh, S.-H. Modeling Habitat Suitability of the Climate-vulnerable Plant Thuja koraiensis in Response to Climate Change. Sens. Mater. 2024, 36, 1511–1523. [Google Scholar] [CrossRef]
  82. Jang, D.-H. The Excavation of Geomorphological Landscape Resources and Assessment of Value for Designating Ecological and Landscape Conservation Area in Mt. Ilwol. J. Assoc. Korean Geogr. 2012, 1, 205–216. [Google Scholar]
  83. Oh, H.-K.; Son, B.-Y.; You, J.-H. Vascular Plants and Characteristics by Type in Mt. Ilwolsan (Yeongyang, Gyeongbuk) for Designating an Ecological and Landscape Conservation Area. J. Korean Soc. Environ. Restor. Technol. 2015, 18, 43–62. [Google Scholar] [CrossRef]
  84. Pisarenko, O.Y.; Fedosov, V.; Korznikov, K.A.; Shkurko, A.V.; Ignatova, E. The moss flora of the Badzhal Mountain Range (Khabarovsk Territory, Russian Far East). Bot. Pac. 2022, 11, 98–114. [Google Scholar] [CrossRef]
  85. Eichhorn, M.P. Boreal forests of Kamchatka: Structure and composition. Forests 2010, 1, 154–176. [Google Scholar] [CrossRef]
  86. IUCN. World Heritage Nomination IUCN Technical Evaluation: Volcanoes of Kamchatka (Russian Federation)—Extension to include Kluchevskoy Nature Park; UNESCO World Heritage Centre: Paris, France, 2001; 4p. [Google Scholar]
  87. Semerikov, V.L.; Semerikova, S.A. Genetic variation and population history of three related fir species Abies sachalinensis, A. nephrolepis and A. gracilis (Pinaceae) revealed by nuclear microsatellites. Bot. Pac. 2023, 12, 145–154. [Google Scholar] [CrossRef]
  88. Krestov, P.V.; Omelko, A.M.; Nakamura, Y. Vegetation and natural habitats of Kamchatka. Ber. Reinh.-Tüxen-Ges. 2008, 20, 195–218. [Google Scholar]
  89. Lee, S.-J.; Lee, A.-R.; Byeon, J.-G.; Oh, S.-H. Pre-drought effects on northern temperate trees and vine invasion in forest gaps hindering regeneration. Sci. Total Environ. 2024, 951, 175707. [Google Scholar] [CrossRef] [PubMed]
  90. Aizawa, M.; Yoshimaru, H.; Saito, H.; Katsuki, T.; Kawahara, T.; Kitamura, K.; Shi, F.; Kaji, M. Phylogeography of a northeast Asian spruce, Picea jezoensis, inferred from genetic variation observed in organelle DNA markers. Mol. Ecol. Resour. 2007, 16, 3393–3405. [Google Scholar] [CrossRef] [PubMed]
  91. Seidl, R.; Rammer, W.; Scheller, R.M.; Spies, T.A. An individual-based process model to simulate landscape-scale forest ecosystem dynamics. Ecol. Modell. 2012, 231, 87–100. [Google Scholar] [CrossRef]
  92. Buma, B.; Wessman, C. Disturbance interactions can impact resilience mechanisms of forests. Ecosphere 2011, 2, 1–13. [Google Scholar] [CrossRef]
  93. Buma, B. Disturbance interactions: Characterization, prediction, and the potential for cascading effects. Ecosphere 2015, 6, 1–15. [Google Scholar] [CrossRef]
  94. Harvey, I.F.; Corbet, P.S. Territorial behaviour of larvae enhances mating success of male dragonflies. Anim. Behav. 1985, 33, 561–565. [Google Scholar] [CrossRef]
  95. Haddad, N.M.; Tewksbury, J.J. Low-quality habitat corridors as movement conduits for two butterfly species. Ecol. Appl. 2005, 15, 250–257. [Google Scholar] [CrossRef]
  96. Kietzka, G.J.; Pryke, J.S.; Gaigher, R.; Samways, M.J. Webs of well-designed conservation corridors maintain river ecosystem integrity and biodiversity in plantation mosaics. Biol. Conserv. 2021, 254, 108965. [Google Scholar] [CrossRef]
  97. Chester, C.C. Yellowstone to Yukon: Transborder conservation across a vast international landscape. Environ. Sci. Policy 2015, 49, 75–84. [Google Scholar] [CrossRef]
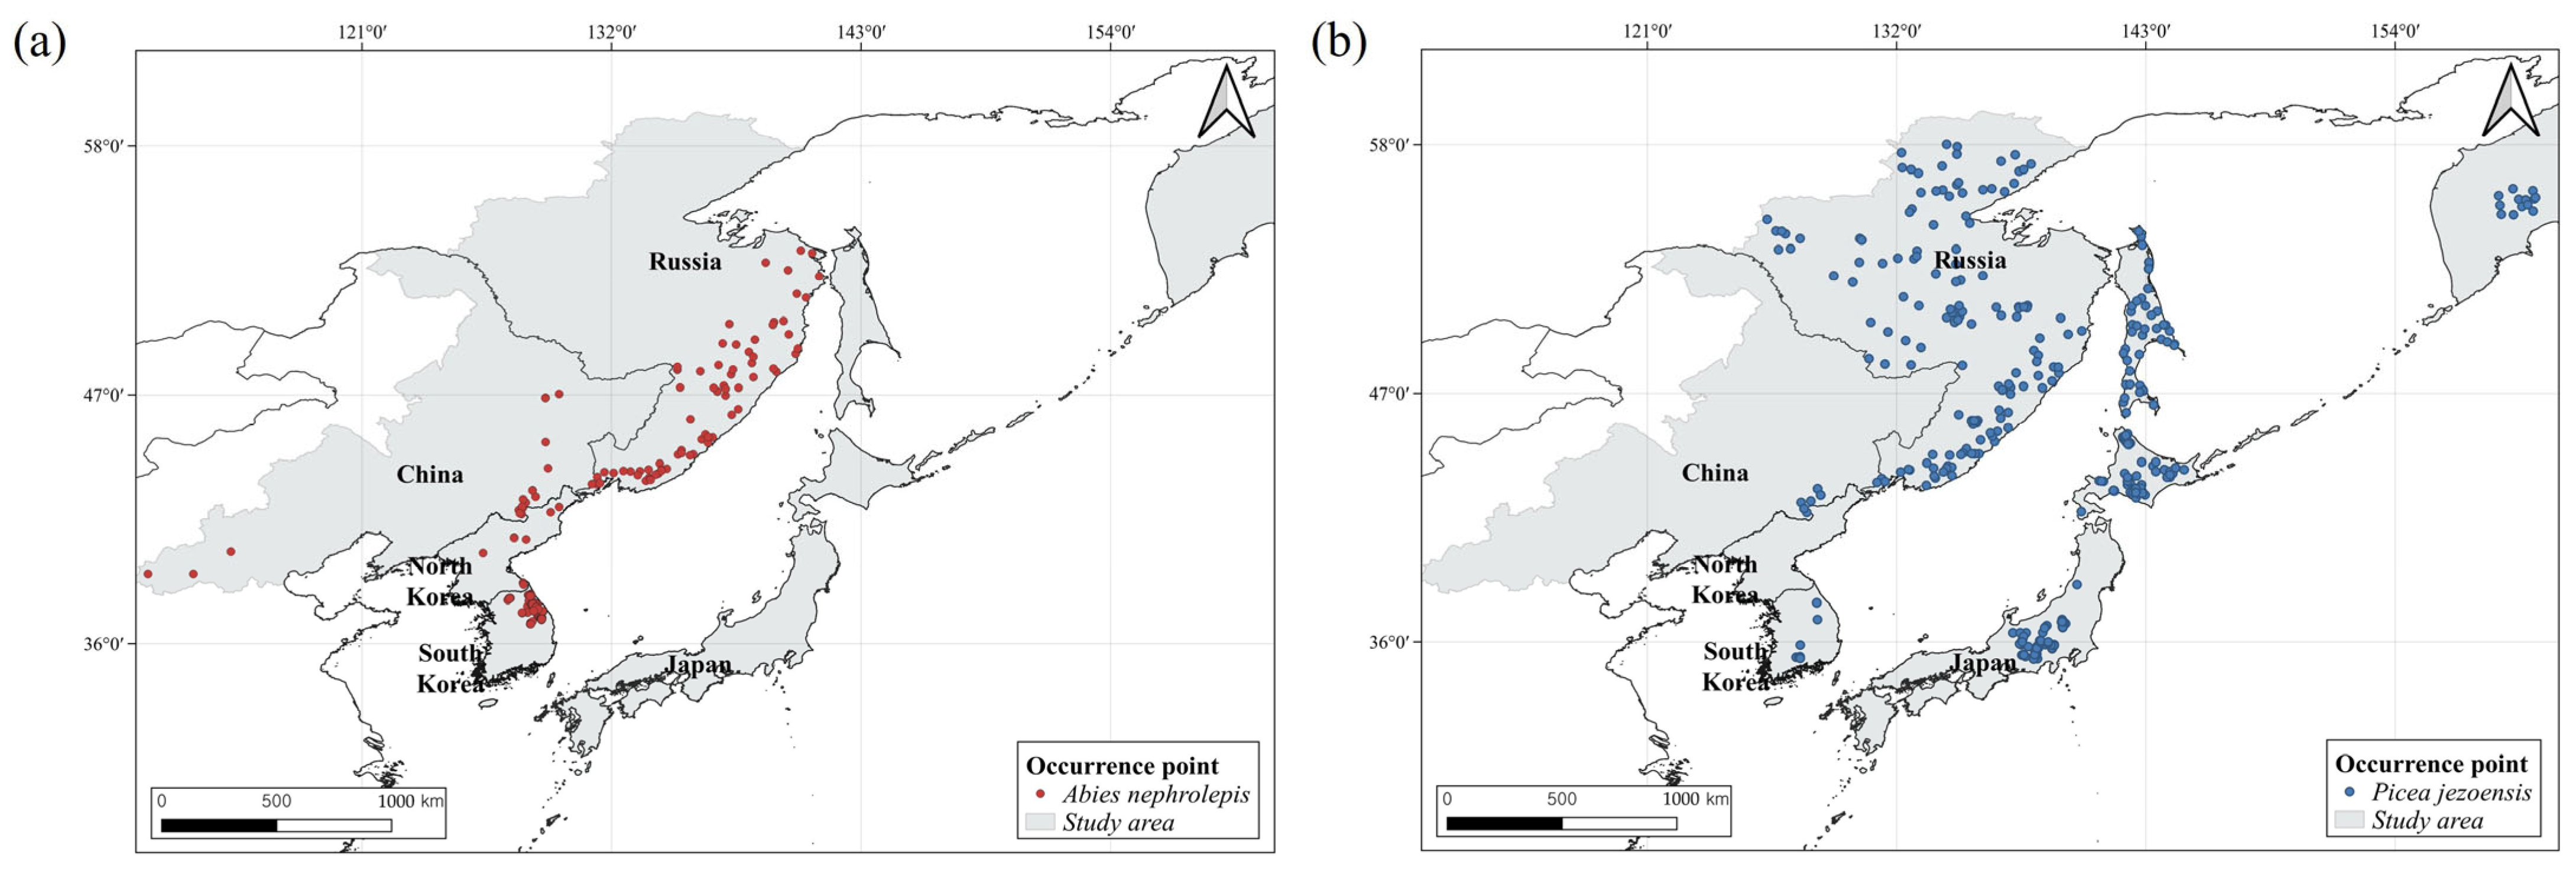
Figure 1. The occurrence points of (a) A. nephrolepis and (b) P. jezoensis in study area.
Forests 16 01183 g001
Figure 2. Environmental factors influencing (a,b) A. nephrolepis and (c,d) P. jezoensis distribution identified through ensemble analysis in the current climate. In this figure, the bivariate analysis presents the relationship between the top two significant environmental variables and other factors for readability. Bivariate analysis was employed in (a,c) to investigate the effects on species occurrence. (b,d) present the importance of variables that affect species distribution.
Forests 16 01183 g002
Figure 3. The potential distribution map of A. nephrolepis and P. jezoensis under current climatic conditions.
Forests 16 01183 g003
Figure 4. Future potential distribution of A. nephrolepis under climate change scenarios (SSP370 and SSP585) across three time periods: near future (2011–2040), middle future (2041–2070), and far future (2071–2100). (a) A. nephrolepis future potential distribution; (b) changes in potential distribution area of A. nephrolepis by country. The legend colors on the map represent the following: “Loss (Red color)” indicates areas that have disappeared compared to the current potential distribution. “Expansion (Blue color)” denotes areas that have expanded compared to the current potential distribution. “Suitable (Green color)” refers to areas that are maintained compared to the current potential distribution.
Forests 16 01183 g004
Figure 5. Future potential distribution of P. jezoensis under climate change scenarios (SSP370 and SSP585) across three time periods: near future (2011–2040), middle future (2041–2070), and far future (2071–2100) (a) P. jezoensis future potential distribution; (b) changes in potential distribution area of P. jezoensis by country. The legend colors on the map represent the following: “Loss (Red color)” indicates areas that have disappeared compared to the current potential distribution. “Expansion (Blue color)” denotes areas that have expanded compared to the current potential distribution. “Suitable (Green color)” refers to areas that are maintained compared to the current potential distribution.
Forests 16 01183 g005
Figure 6. Results of the hotspot analysis and Anselin Local Moran’s I Analysis for A. nephrolepis and P. jezoensis. The legend colors on the map represent the following: “High–High (Red color)”. “High–Low (Orange color)”. “Low–High (Blue color)”. “Low–Low (Green color)”. “Near” indicates the near future (2011–2040), “Middle” indicates the middle future (2041–2070), and “Far” indicates the far future (2071–2100).
Forests 16 01183 g006
Figure 7. The geographical distribution of priority areas for the conservation of A. nephrolepis and P. jezoensis. The results are derived from combining species distribution areas identified through hot spot analysis and Anselin Local Moran’s I with protected area and land cover data. Protected areas refer to regions that have already been designated as protected, while not protected areas indicate regions where species distribution is present but are not designated as protected areas. The legend colors on the map represent the following: “Protected area High–High (Red color) indicates areas that are both designated as protected areas and analyzed as High–High.” “Not Protected area High–High (Orange color) indicates areas that are not designated as protected areas but have been analyzed as High–High.” “Protected area High–Low (Blue color) indicates areas that are both designated as protected areas and analyzed as High–Low.” “Not Protected area High–Low (Green color) indicates areas that are not designated as protected areas but have been analyzed as High–Low.” “Near” indicates the near future (2011–2040), “Middle” indicates the middle future (2041–2070), and “Far” indicates the far future (2071–2100).
Forests 16 01183 g007
Table 1. The description of terrain and environmental variables used for the prediction of suitable habitat.
Variable NameUnitDescription
bio1°CMean annual temperature
bio4°C/month × 100Temperature seasonality (standard deviation × 100)
bio12mmAnnual precipitation amount
bio15mmPrecipitation seasonality
fcfcountNumber of events in which tmin or tmax go above, or below 0 °C
gslnumber of daysLength of the growing season
gst°CMean temperature of all growing season days based on TREELIM
swekg m−2 year−1Amount of liquid water if snow is melted
gdd1gd0Last day of the year above 0 °C
gdd1gd5Last day of the year above 5 °C
DEMmDigital elevation model
Table 2. The evaluation of the single-species distribution model for the potential distribution of A. nephrolepis and P. jezoensis.
IndicatorsSpeciesGLMGAMCTAGBMRFXGBOOST
AUCAvgA. nephrolepis0.9670.9570.9280.9750.9750.969
(S.D)(0.010)(0.019)(0.027)(0.008)(0.009)(0.011)
Max0.9870.9880.9750.9910.9940.994
Min0.9410.8770.8510.9540.9480.943
AvgP. jezoensis0.8720.8970.8570.9120.9120.905
(S.D)(0.052)(0.017)(0.026)(0.014)(0.014)(0.015)
Max0.9300.9330.9050.9450.9430.942
Min0.6970.8430.7890.8760.8680.859
TSSAvgA. nephrolepis0.8040.7770.7880.8170.8140.803
(S.D)(0.037)(0.047)(0.047)(0.033)(0.039)(0.044)
Max0.9020.8980.8710.9120.9270.902
Min0.7270.6580.6320.7420.7320.681
AvgP. jezoensis0.5700.6140.5910.6440.6240.601
(S.D)(0.057)(0.043)(0.051)(0.043)(0.051)(0.047)
Max0.7200.7290.7340.7440.7570.714
Min0.3940.4960.4510.5240.4880.483
SD: Standard deviation.
Table 3. Changes in the habitat distribution of A. nephrolepis and P. jezoensis under various climate scenario conditions. The numbers in the table represent the percentage change compared to the potential distribution area under current climate conditions, with a dash indicating areas do not present under current climate conditions and are therefore unable to be represented by a percentage change. A value of 0.00 means it is rounded to the third decimal place. “Near” indicates the near future (2011–2040), “Middle” indicates the middle future (2041–2070), and “Far” indicates the far future (2071–2100). The “West” region of China refers to all areas located to the west of Liaoning, while the “East” region includes the areas of Liaoning, Jilin, and Heilongjiang. The distribution area covering all regions from Primor’ye to Khabarovsk is denoted as Primor’ye–Khabarovsk.
SpeciesScenarioChinaJapanRussiaKorean
Peninsula
WestEastKyushuHonshuHokkaidoPrimor’Ye–KhabarovskKamchatka PeninsulaSakhalinRepublic of
Korea
North
Korea
A. nephrolepisNear370−13.03−64.67−81.25−22.14254.428.31−60.27−27.60
Near58515.00−69.71−61.06−56.30−18.11−22.92131.50−60.51−31.83
Middle370−99.48−91.26−99.7977.14288.959926.98−99.71−82.16
Middle585−99.07−97.75−99.7933.92156.069653.55−99.97−89.17
Far37025.42−84.85−100.0−77.87−26.56654.51−68.81−57.61
Far585−76.87−97.78−100.0−99.40−73.9626.41−98.80−93.64
P. jezoensisNear370−36.52−85.67−95.38−63.18−90.02−72.98−27.91−97.70−90.69−86.44
Near585−36.59−86.06−95.14−58.37−85.92−72.22−55.57−96.56−90.19−84.95
Middle370−83.89−75.33−99.90−82.95−90.83−6.3418.77−42.35−99.30−75.93
Middle585−71.32−93.66−99.90−87.11−93.84−38.3415.53−72.10−99.93−85.39
Far370−84.86−97.73−100.0−93.88−97.86−77.65354.73−96.31−100.0−95.49
Far585−96.13−98.44−100.0−96.66−98.81−91.57189.87−99.22−100.0−97.55
Disclaimer/Publisher’s Note: The statements, opinions and data contained in all publications are solely those of the individual author(s) and contributor(s) and not of MDPI and/or the editor(s). MDPI and/or the editor(s) disclaim responsibility for any injury to people or property resulting from any ideas, methods, instructions or products referred to in the content.