Article

Assessing Forest Succession Along Environment, Trait, and Composition Gradients in the Brazilian Atlantic Forest

1
Department of Forestry and Wood Science, Federal University of Espírito Santo, Jerônimo Monteiro 29550-000, Brazil
2
Vale Natural Reserve, Linhares 29909-030, Brazil
*
Author to whom correspondence should be addressed.
Forests 2025, 16(7), 1169; https://doi.org/10.3390/f16071169
Submission received: 16 November 2024 / Revised: 31 January 2025 / Accepted: 3 February 2025 / Published: 16 July 2025

Abstract

Tropical forests face increasing threats and are often replaced by secondary forests that regenerate after disturbances. In the Atlantic Forest, this creates fragments of different successional stages. The aim of this study is to understand how soil nutrients and light availability gradients influence the species composition and structure of trees and regenerating strata in remnants of lowland rainforest. We sampled 15 plots for the tree stratum (DBH ≥ 5 cm) and 45 units for the regenerating stratum (height ≥ 50 cm, DBH < 5 cm), obtaining phytosociological, entropy and equitability data for both strata. Canopy openness was assessed with hemispherical photos and soil samples were homogenized. To analyze the interactions between the vegetation of the tree layer and the environmental variables, we carried out three principal component analyses and two redundancy analyses and applied a linear model. The young fragments showed good recovery, significant species diversity, and positive successional changes, while the older ones had higher species richness and were in an advanced stage of succession. In addition, younger forests are associated with sandy, nutrient-poor soils and greater exposure to light, while mature forests have more fertile soils, display a greater diversity of dispersal strategies, are rich in soil clay, and have less light availability. Mature forests support biodiversity and regeneration better than secondary forests, highlighting the importance of preserving mature fragments and monitoring secondary ones to sustain tropical biodiversity.

Graphical Abstract

1. Introduction

Most of the world’s tropical forests are not primary forests, but naturally regenerating forests [1]. This is the case of the Brazilian Atlantic Forest, which is home to 70% of Brazilians, where vegetation cover is estimated at around 24%, and around half is already secondary forest [2]. Espírito Santo state is located entirely within the Atlantic Forest biome. In a survey conducted by MapBiomas in collaboration with the SOS Mata Atlântica Foundation in 2024 [3], it was estimated that the remaining vegetation coverage currently stands at approximately 10.5%. The factors that led to the loss of vegetation in this state were mainly related to activities such as selective logging, the opening of pasture areas, and deforestation to establish coffee plantations and mining [4].
Tropical forests are rapidly being converted into other land uses, especially for agriculture and pasture [5,6]. These forests can be described as secondary forests that regrow after almost complete or complete removal of forest cover [7]. Therefore, the regeneration of these secondary forests is an important component of tropical landscapes that have been modified by human activities and thus has the potential to contribute significantly to biodiversity conservation [6], climate change mitigation, and landscape restoration [6]. Mature forests, on the other hand, are defined as forest ecosystems with characteristics similar to old-growth forests in terms of composition, structure, and function, but which have been subjected to low-intensity human disturbance (minor impacts) [8,9,10]. Thus, these forests are still at a stage of development prior to the complete establishment of the characteristic attributes of old-growth forests [11].
Some characteristics of secondary forests have already been effectively described, such as changes in stem density and mortality rates, as well as the relocation of species over the course of succession [5]. In addition, their biodiversity, as well as their physical structure, which is relatively simple compared to that of mature and old-growth forests, gradually improves as the time since the beginning of the stand increases and recovery progresses [12]. However, the increase in the complexity and biodiversity of the forest depends on the level of disturbance experienced. Studies show that when a certain threshold of disturbance is reached, the forest can collapse or stabilize in a state of stagnant succession [1].
Thus, secondary succession is the process in which the sequential replacement of species occurs over time or after a disturbance [5,6,13]. Although successional trajectories are traditionally reported as processes with a certain degree of predictability, they can also be considered uncertain due to local stochastic factors, as supported by Hubbell’s unified neutral theory, where stochastic factors are especially important in shaping species abundance and diversity rather than being attributed solely to deterministic ecological interactions [7,14].
Community assembly during succession comprises a hierarchical set of factors (e.g., environmental filters) that operate at different scales, from the landscape scale, as reported by Laurance’s landscape divergence hypothesis [15], to the regional scale, such as climate and soil that influence resource availability, and the local scale, (e.g., the history of land use and occupation) and the current uses of the forest that leave their mark on the vegetation and soil [6,12,16]. On a local scale, light availability typically decreases as succession progresses, while changes in other resources, such as water and nutrients, are more variable [17]. This leads to the gradual replacement of early successional species that demand greater availability of light (acquisitive) by late successional species (conservative), which are more shade-tolerant and focused on resource conservation [18,19].
However, successional trajectories can also be influenced by large-scale environmental gradients, which depend on the characteristics of the regional species pool and changes in biotic and abiotic conditions throughout succession [20]. One such important factor is the different dispersal strategies used by species, playing a highly relevant role in the succession process, since these dispersal processes are essential for molding the floristic composition and successional dynamics of the fragments and are especially deterministic regarding regeneration and the diversity of late secondary species in more advanced fragments [21,22].
Another element intrinsic to forest succession is natural regeneration. Several studies have already pointed out that regeneration characteristics such as structure, floristic and functional composition, species diversity, and environmental variables vary throughout succession and can also be used to infer the successional trajectory of a forest [1,23,24,25,26]. By also assessing the regenerating stratum of the forest, we can obtain relevant and valuable information on the floristic and structural composition that will be formed and therefore on future successional dynamics (species turnover) and on the ecosystem’s capacity for self-sufficiency [27].
Furthermore, most successional theories focus on specific ecosystem traits, such as species composition, forest structure, or soils. However, these traits are rarely integrated in studies that evaluate them together [17]. This integration is fundamental since the recovery of these traits does not occur in isolation, but rather in an interdependent manner.
Thus, this study aims to understand how soil and light gradients affect the functional and structural floristic composition of the tree and regenerating strata of different lowland forest remnants, with a focus on dispersal strategies and the differences between mature and secondary forests. Therefore, we expect to observe that (1) mature forest fragments have a greater availability of nutrients in the soil and lower luminosity, associated with a greater presence of zoochory as a dispersal strategy and slow-growing species; (2) secondary forest fragments have a greater presence of dispersal by anemochory and autochory than zoochory, associated with fast-growing species; and (3) mature forests have more nutrients in the soil and less light availability than secondary forests.

2. Materials and Methods

2.1. Study Area
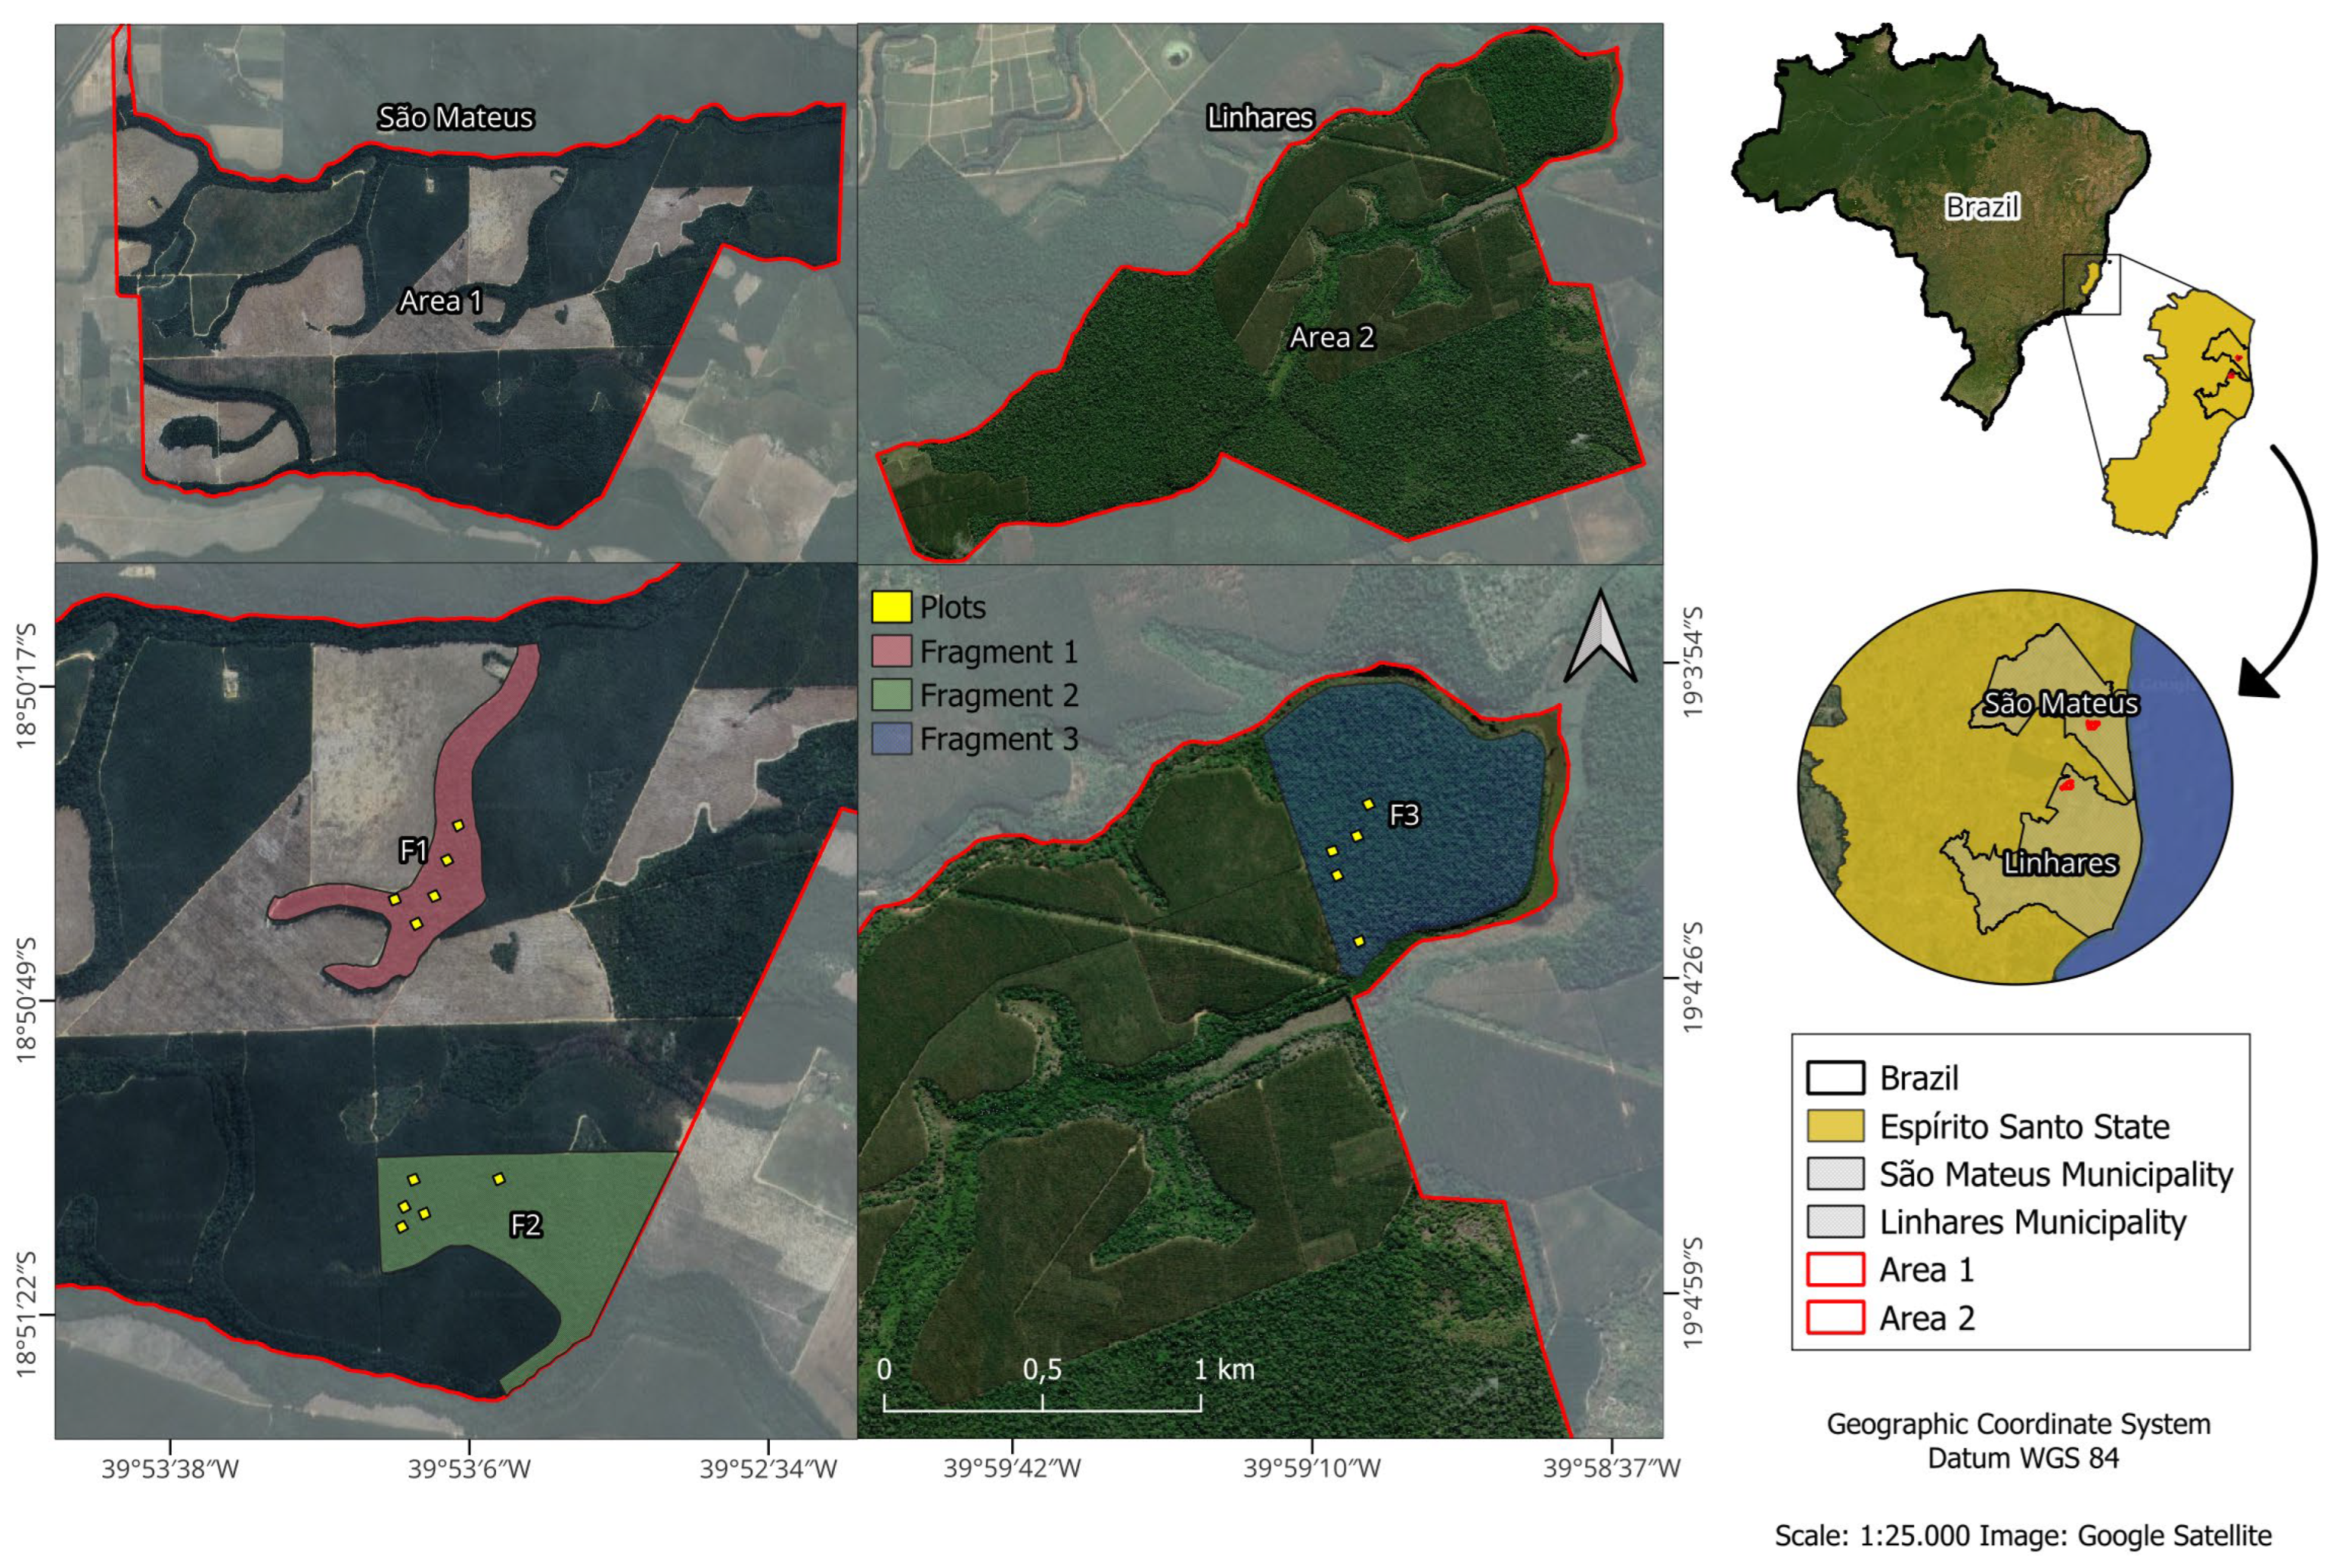
This study was carried out on two private properties located in Linhares and São Mateus municipalities in the northern region of Espírito Santo, Brazil (Figure 1). These areas are part of the Central Atlantic Forest Corridor [28] and are considered Lowland Rainforest. This designation describes areas with flat to gently undulating terrain at an elevation between 20 and 200 m above sea level. These areas are mainly characterized by the presence of yellow allophanic soils and dystrophic podzolic soils, typical of coastal plains, which are generally nutrient-deficient [29,30,31,32]. The climate, according to Köppen, is predominantly humid tropical (Af), with an average annual rainfall of 1403 mm for Linhares and 1271 mm for São Mateus. Both locations have a rainy period in the summer and a dry period in the winter, with an average annual temperature of 23 °C [33].
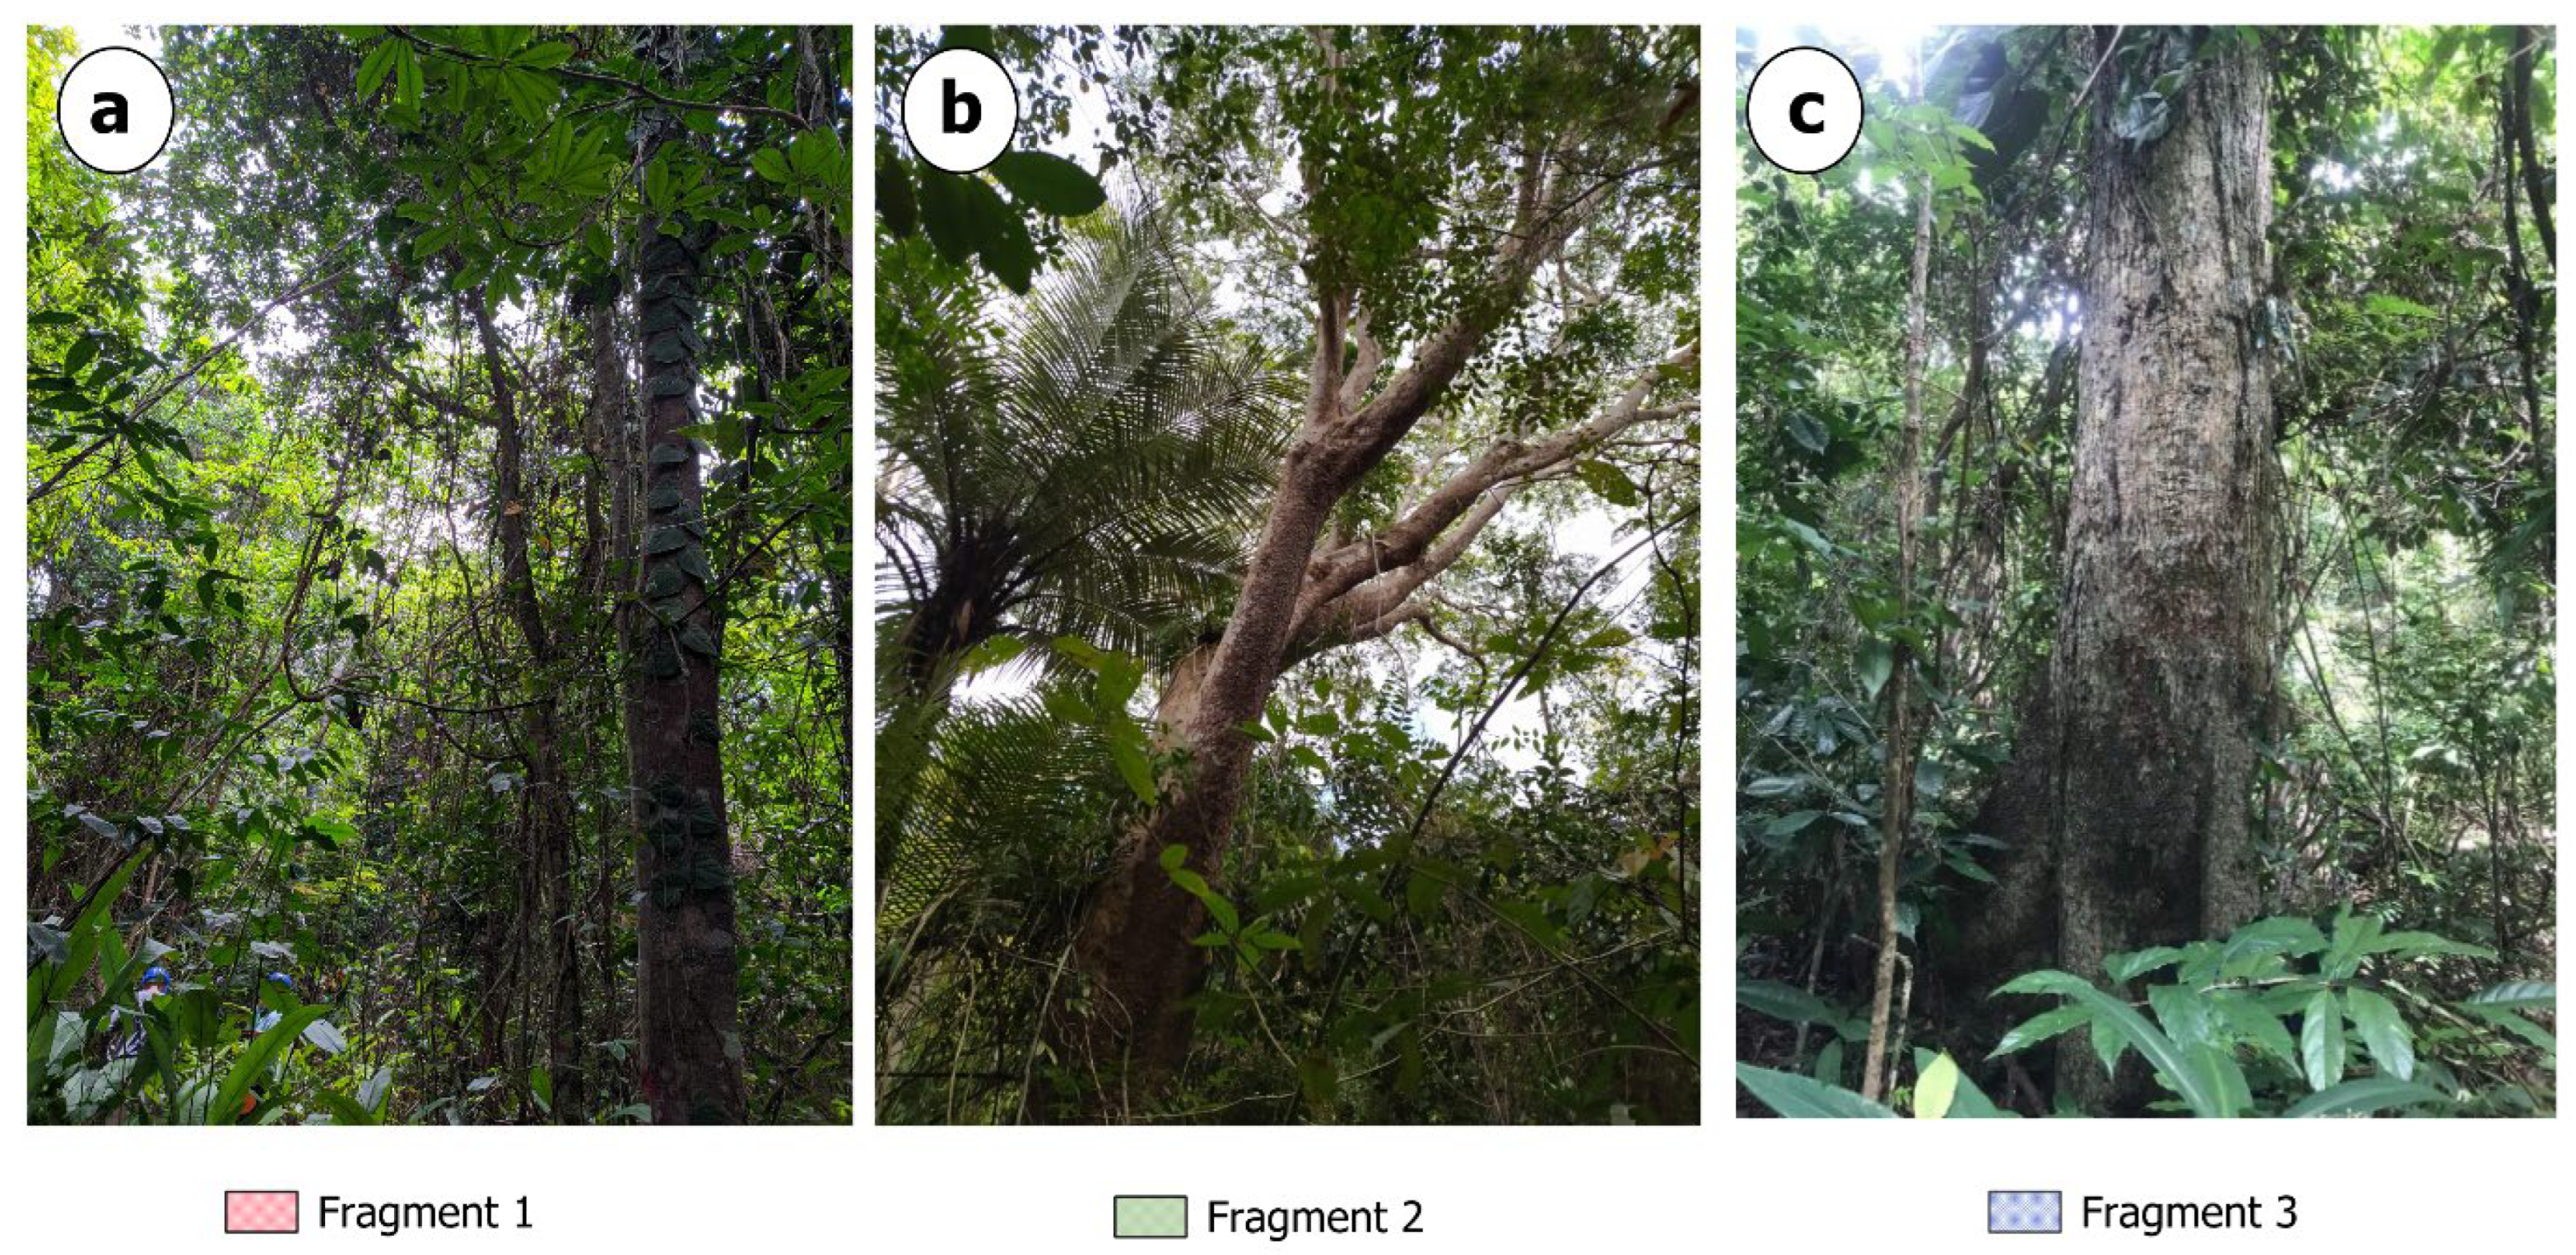
Area 1 is located in São Mateus and comprises two disturbed forest fragments measuring 20 ha (F1) and 35.7 ha (F2). Fragment 1 is the youngest, a 23-year-old forest fragment that suffered extensive deforestation due to the expansion of forest plantations (Eucalyptus) and agricultural activities during the 1990s (Figure 2a). Fragment 2 underwent the same process but did not expand. Based on MapBiomas data from 2023 [34], it was found that the area had already been established by 1985 (Figure 2b). However, its integrity has been compromised due to fragmentation, resulting in planted forests and agriculture.
Area 2 consists of a 57-hectare fragment (F3) that is part of the Recanto das Antas Private Natural Heritage Reserve (Figure 2c). This reserve is an RPPN, which is a privately owned conservation unit that allows for sustainable use, as provided for in Brazilian legislation (No. 9.985 of 2000) which established the national system of nature conservation units, known as SNUC [35]. This reserve is part of a significant vegetation mosaic, along with other essential units such as the Sooretama Biological Reserve, the Vale Nature Reserve, and the Mutum Preto RPPN. It constitutes the most extensive continuous fragment in the state of Espírito Santo and the most extensive remnant of Lowland Rainforest in southeastern Brazil [36]. Thus, the surrounding matrix of the area is mainly composed of well-preserved forest remnants and Eucalyptus forests. Conservation efforts, applied since the 1950s, are considered critical to preserving this forest remnant [37]. In addition, it should be noted that the choice of study areas, sampling procedures, and fixed plots was not solely for this research work, but was part of a larger project in collaboration with Suzano S.A., which encompassed other projects utilizing the same data. This context explains the variations in sample sizes across the different forest fragments analyzed in this study.
Figure 1. Placement of fragments F1, F2, and F3 within their respective study sites, along with the distribution of plots within the Lowland Rainforest in northern Espírito Santo, Brazil. Adapted from [38].
Forests 16 01169 g001
Figure 2. Photographs of the three forest fragments located in the northern region of Espírito Santo State, Brazil, characterized as Lowland Rainforests. The fragments represent distinct successional stages, highlighting variations in vegetation structure and composition influenced by historical land use and ecological dynamics. Where: (a) is the youngest intermediate fragment; (b) is the intermediate fragment 2, which was partially deforested; and (c) is the mature forest fragment.
Forests 16 01169 g002

2.2. Data Collection in the Tree and Regenerating Strata

In the tree layer, a total of 15 plots, each 30m × 30 m (0.09 ha), were distributed across the 3 fragments on the two properties, with 5 plots within each fragment, for a total of 1.35 ha. All live trees with a DBH at 1.30 m ≥ 5 cm were sampled and the sampling method used was the fixed area plot method [39]. Each plot was randomly distributed within the fragments and all individuals with DBH < 5 cm and a minimum height of 50 cm within the boundaries of the regeneration sub-plots were sampled. These subplots were installed within the existing plots in the tree stratum. Each sampling unit consisted of three 5 m × 5 m subplots, totaling 45 subplots per fragment (Figure 3). For installation, the natural regeneration subplots were randomly positioned at one of the four vertices of the tree stratum plots, using the 30 m × 30 m plots as a reference. For regeneration, 3 sub-plots were allocated to each plot of the tree stratum.
The species sampled in the tree stratum were classified based on their ecological group (pioneer, early secondary, and late secondary) following Gandolfi et al. [40] Additionally, they were categorized based on their seed dispersal strategy, including anemochory, autochory, and zoochory [41], as well as their life form, such as tree, shrub, herb, and liana. The information on the classifications was obtained by consulting scientific articles and the specific literature and by means of observations in the field.

2.3. Canopy Openness Assessment

The hemispherical digital photography method was employed to evaluate canopy openness [42]. A smartphone equipped with a 180° hemispherical lens was attached to a tripod at 1.30 m above ground level, with the top aligned with magnetic north and the lens pointing upwards (Figure 4). Within each sampled plot, three photographs were taken at different points to account for light variation. After image processing, canopy openness values were obtained, and the mean was calculated to obtain a single value per plot.

2.4. Soil Physical-Chemical Attributes

Soil samples were systematically collected at five points (four at each vertex and one in the center) within each plot, at a depth of 0–20 cm. Subsequently, the samples were homogenized to obtain a composite sample per plot.
The 45 composite samples were analyzed according to the methodology proposed by Embrapa [43] at the Laboratory of Fertilizers, Water, Minerals, Residues, Soils and Plants of the Federal University of Espírito Santo. The following physical–chemical attributes were analyzed: pH (hydrogen potential), P (phosphorus), K (potassium), Na (sodium), Ca (calcium), Mg (magnesium), Al (aluminum), H + Al (potential acidity), C (carbon), M.O. (organic matter), CTC(t) (effective cation exchange capacity), CTC(T) (potential cation exchange capacity), S.B. (sum of bases), V (base saturation), m (aluminum saturation), ISNa (sodium saturation index), Fe (iron), Cu (copper), Zn (zinc), Mn (manganese), clay, silt and sand.

2.5. Data Analysis

The present study adopted the phytosociological approach described by Mueller-Dombois and Ellenberg [39], which considers the absolute and relative parameters of density, dominance, frequency, and importance value to depict the horizontal structure of the plant community. The species diversity and evenness were calculated using the Shannon–Weaver (H′) and Pielou (J) diversity indices according to Magurran [44]. All parameters and indices were computed in R software version 4.1.3 [45] using the ‘forestmangr’ package version 0.9.8 [46].

2.6. Vegetation-Environment Relationship

To analyze the interaction between the vegetation of the tree layer and the environmental variables of the study, redundancy analysis (RDA) was conducted using the free statistical software R version 4.1.3 [45] using the ‘vegan’ version 2.7.1 and ‘ggplot2’ 3.5.2 packages [47,48]. RDA combines linear regression and principal component analysis (PCA) and does not use chi-squared as a distance measure, avoiding bias and making it an alternative to CCA (canonical correspondence analysis) for studying vegetation–environment interactions in gradient analyses [49]. Three data matrices were drawn up for the analysis: the first consisted of species abundance data; the second comprised two types of environmental variables: soil physical–chemical attributes and canopy openness; and the third consisted of ecological characteristics such as the ecological group and species dispersal strategy.

2.6.1. Species Abundance Matrix

The species abundance matrix underwent data processing, removing all species with less than 15 individuals. This criterion was necessary because the database contains 220 species in total. This was performed to avoid multicollinearity and visual pollution, which would have made it difficult to generate results and interpret the graph using RDA. The species included in the abundance data matrix for the RDA were limited to those with 15 or more individuals. The final matrix contained a total of 19 species and the Hellinger transformation method was then adopted for the species abundance values [50].

2.6.2. Environmental and Successional Data Matrix

As a previous step, in order to establish the gradient of the data, it was necessary to perform PCA. However, the data from the environmental variables had to be pre-selected, because when trying to perform PCA with all 25 variables together, there was saturation due to the large number of variables, and only a few were plotted on the graph.
The most significant variables were then pre-selected using the ‘ordstep’ function from the ‘vegan’ package version 2.7.1 in R [45,47]. This function is a variable selection model that uses a permutation test with 999 repetitions to select maximally related explanatory variables. After using the ordstep function, only 10 significant variables (p ≤ 0.05) were included in the environmental data matrix, namely clay, silt, sand, manganese (Mn), magnesium (Mg), potassium (K), calcium (Ca), copper (Cu), effective cation exchange capacity (CTC.t), and canopy openness index (Canopy).
The data on environmental and successional variables were transformed by standardizing their values to a mean of zero and a standard deviation of one, using the ‘standardize’ method and the ‘decostand’ function of the vegan package in the R software version 4.1.3 [45,47].

3. Results

A total of 2617 individuals were sampled across the three fragments and both strata, with distinct characteristics in vegetation diversity and structure. The tree layer contained 1750 individuals, distributed among 220 species, 136 genera, and 52 botanical families, resulting in a basal area of 21.40 m2·ha−1. The species with the highest importance value index (IVI) for each fragment were Tapirira guianensis Aubl. (14.96%) in F1, Handroanthus chrysotrichus (Mart. ex DC.) Mattos (17.90%) in F2, and Astronium concinnum Schott (4.96%) in F3. In the regenerating stratum, 867 individuals were recorded, encompassing 127 species, 93 genera, and 40 botanical families, with 52 species unique to this layer, accounting for 40% of the total diversity. The species with the highest importance value index (IVI) in each fragment were Macrolobium latifolium Vogel (5.30%) in Fragment 1, Handroanthus chrysotrichus (Mart. ex DC.) Mattos (21.37%) in Fragment 2, and Eugenia excelsa O.Berg (4.52%) in Fragment 3. The most representative plant families exhibited variability, with Myrtaceae and Fabaceae being predominant in F1 and F3, respectively, whereas Bignoniaceae and Fabaceae were notable in F2. This fragment (F2) also showed the highest abundance of individuals, while the Shannon (H) and Pielou (J) diversity indices were higher in F3, reflecting the greater number of families and species found. A summary of the information found in the structure of these fragments is shown in the table (Table 1).

3.1. Ecological Indicators of the Successional Trajectories of the Tree and Regenerating Strata

A general analysis of all three fragments in both strata revealed a predominance of zoochorous species, ranging from 73% to 83%, especially more prevalent in Fragment 3. In terms of ecological group, most of the species sampled were classified as late secondary species. In the tree stratum, among the 220 species sampled, 208 are trees, 9 are shrubs, 2 are subshrubs, 1 is a liana, and the other 6 could not be classified because they were only identified at the genus level. An analysis of species ecological group data for each fragment showed that in the youngest fragments (F1 and F2), late secondary species were slightly more abundant, with early secondary species following closely behind. Of the three fragments, F1 had the highest number of pioneer species (11%). However, it is important to note that although late secondary species are present in all three fragments, the mature fragment (F3) has a much higher number of late secondary species than the younger fragments, and is also more diverse, with almost 60% of the species found classified as late secondary.
The dispersal strategies of the two species strata in the three fragments also followed a general pattern of greater predominance of dispersal by zoochory, but Fragment 3 showed a greater association with this dispersal strategy, but also a high presence of anemochoric species, due to the fact that it is a more diverse site and therefore, in addition to the greater number of species found in relation to the younger fragments, there was also a greater diversity of dispersal strategies. The ecological dynamics in the regenerating stratum exhibited a dominance of early secondary species in the younger fragments (F1 and F2). Furthermore, there was a heightened representation of pioneer species (12.5%), which reflects an increase of approximately 4% in comparison to the data obtained from the tree stratum of the corresponding fragment. Fragment 3 mirrored the tree stratum’s pattern, characterized by late secondary species and a minimal occurrence of pioneer species (approximately 2%), which is consistent with the observations obtained in the regenerating stratum.

3.2. Redundancy Analysis—RDA

3.2.1. Vegetation–Environment Interactions (Environmental and Successional Data)

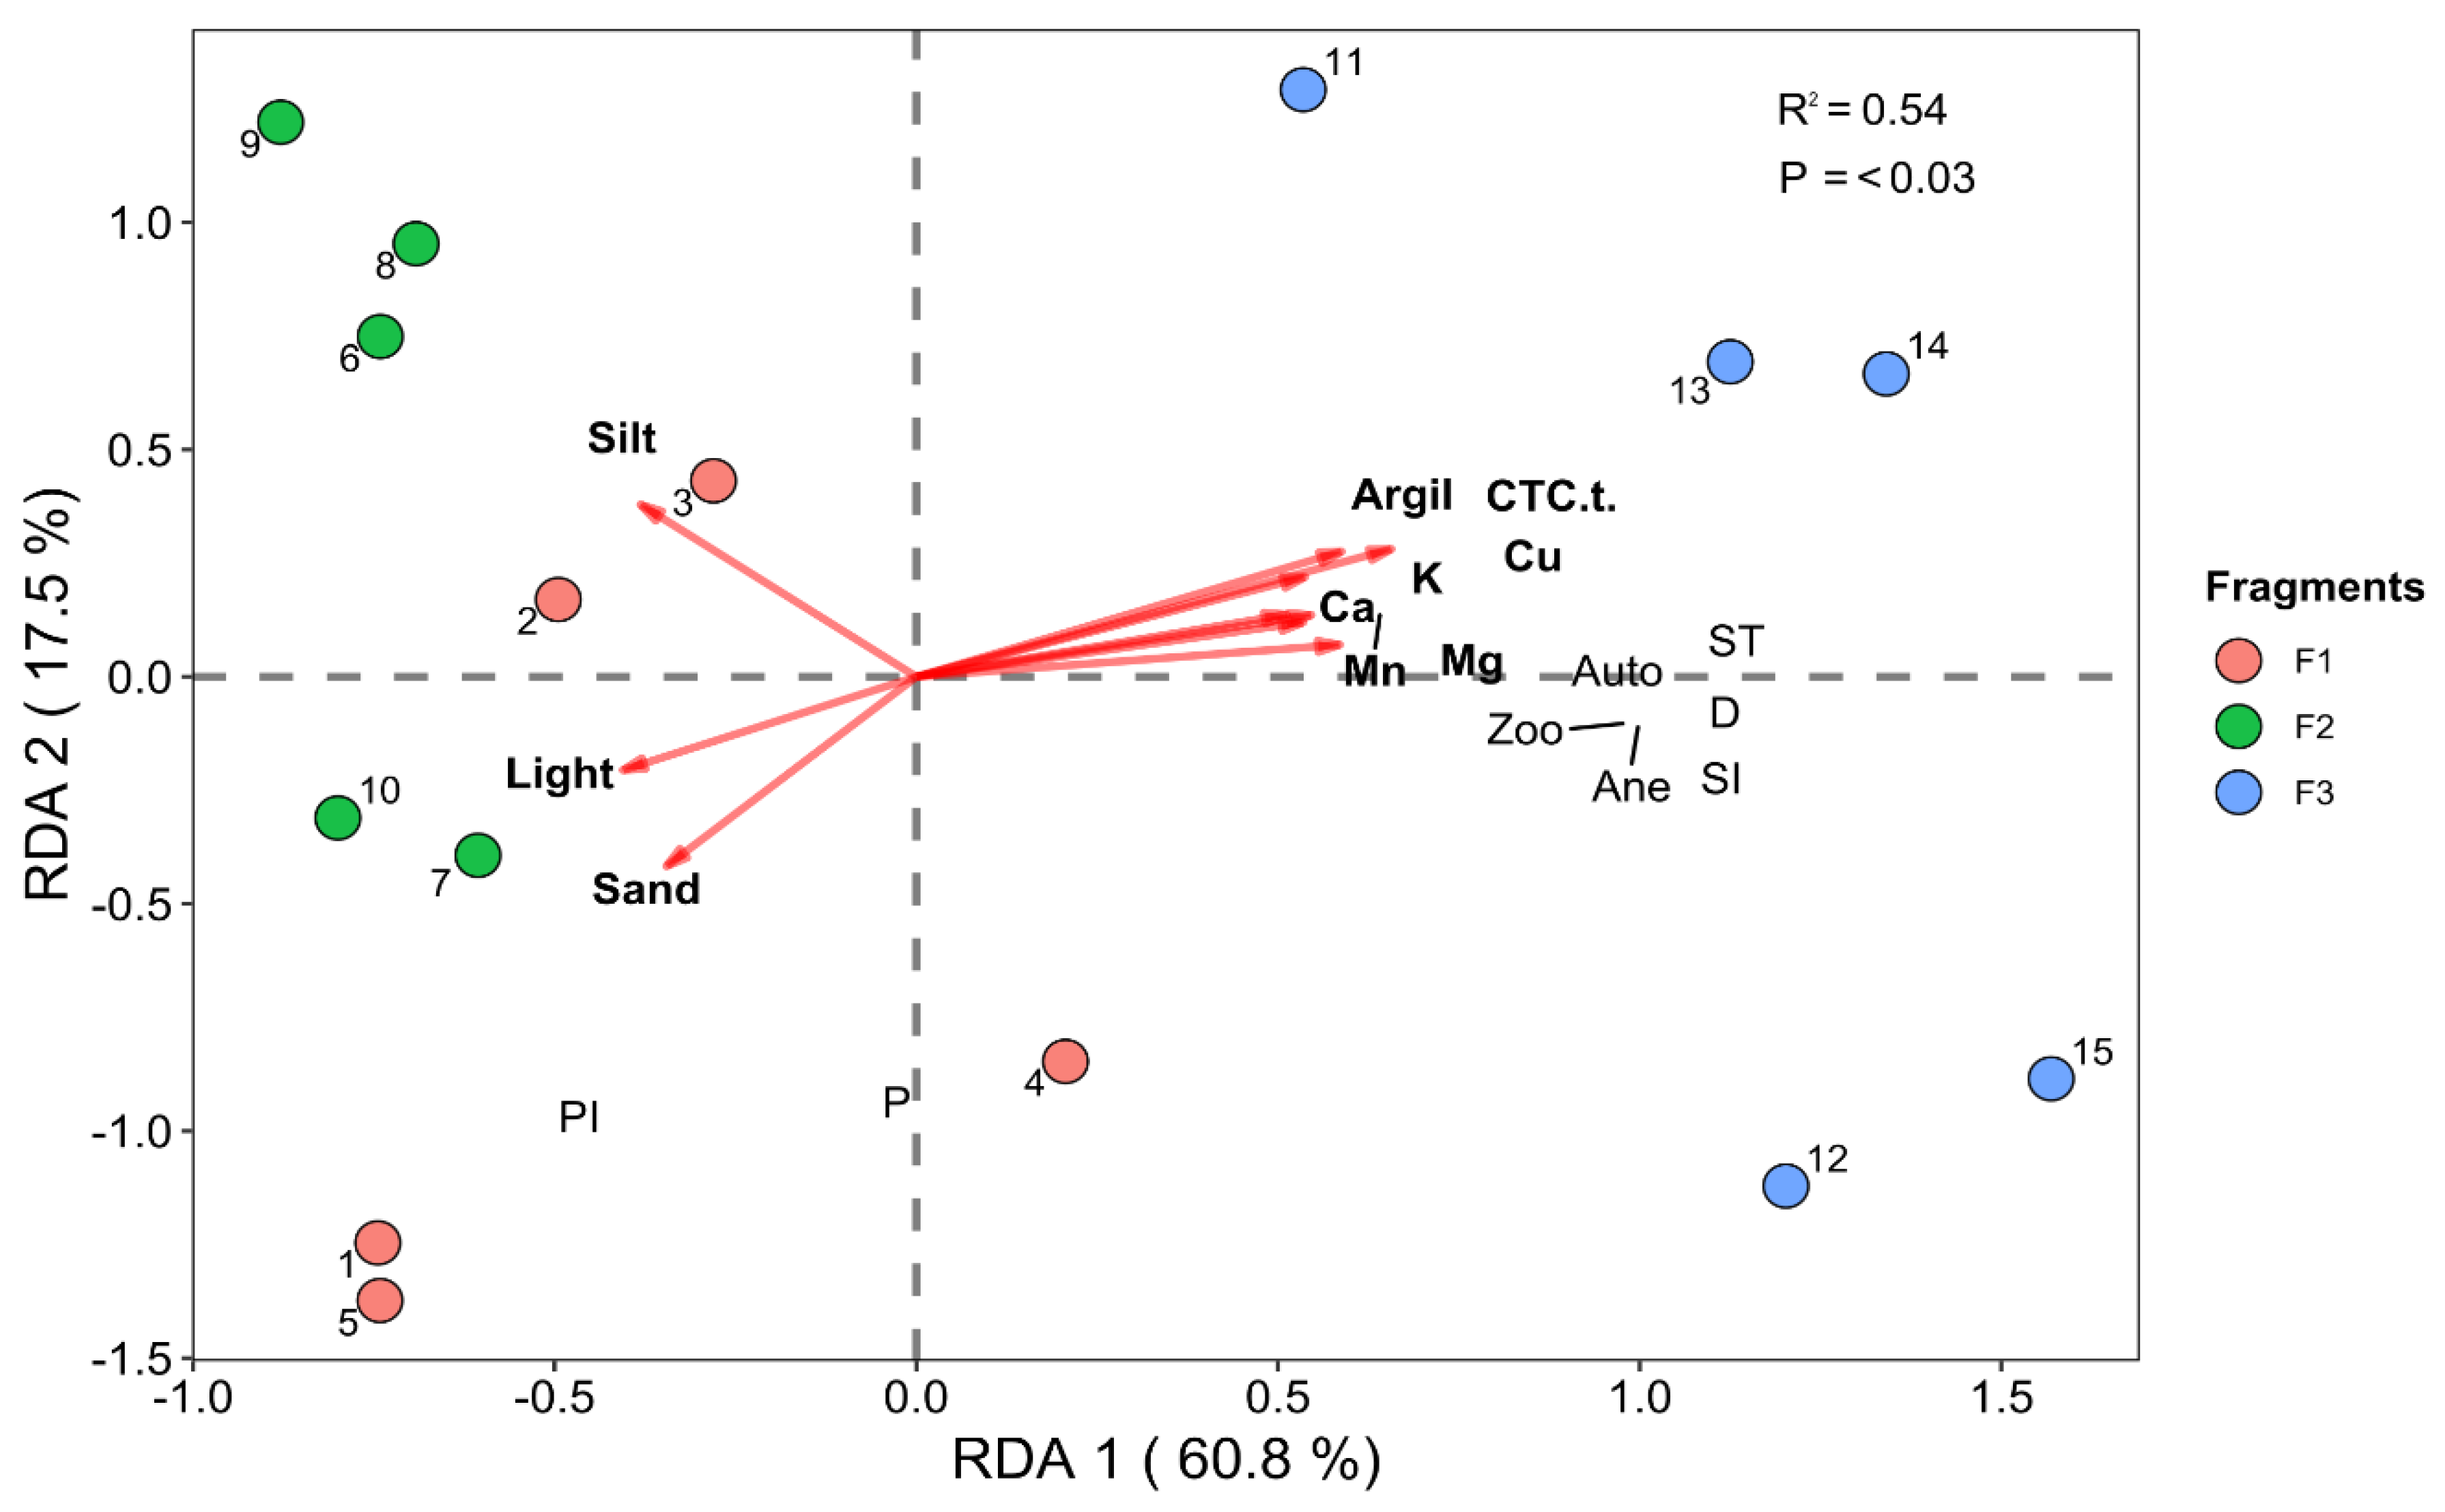
Two RDAs were carried out for each stratum: the first between environmental and successional data and the second between compositional and successional data from the three fragments. For the tree stratum, there was an association between plots 1 and 5 in Fragment 1 and plots 10 and 7 in Fragment 2 and the variables luminosity and sand. Plots 2 and 3 in Fragment 1 and plots 6, 8, and 9 in Fragment 2 were more influenced by the variable silt (Figure 5). Plot 4 was the only one in Fragment 1 that displayed the opposite trend to the rest of the plots in the fragment when analyzing axis 1 (horizontal), and Fragment 3 was more associated with all the other seven soil variables in general, with plots 11, 13, and 14 standing out as receiving more influence from the explanatory variables. The two axes of RDA 1 explain 78.3% of the data.
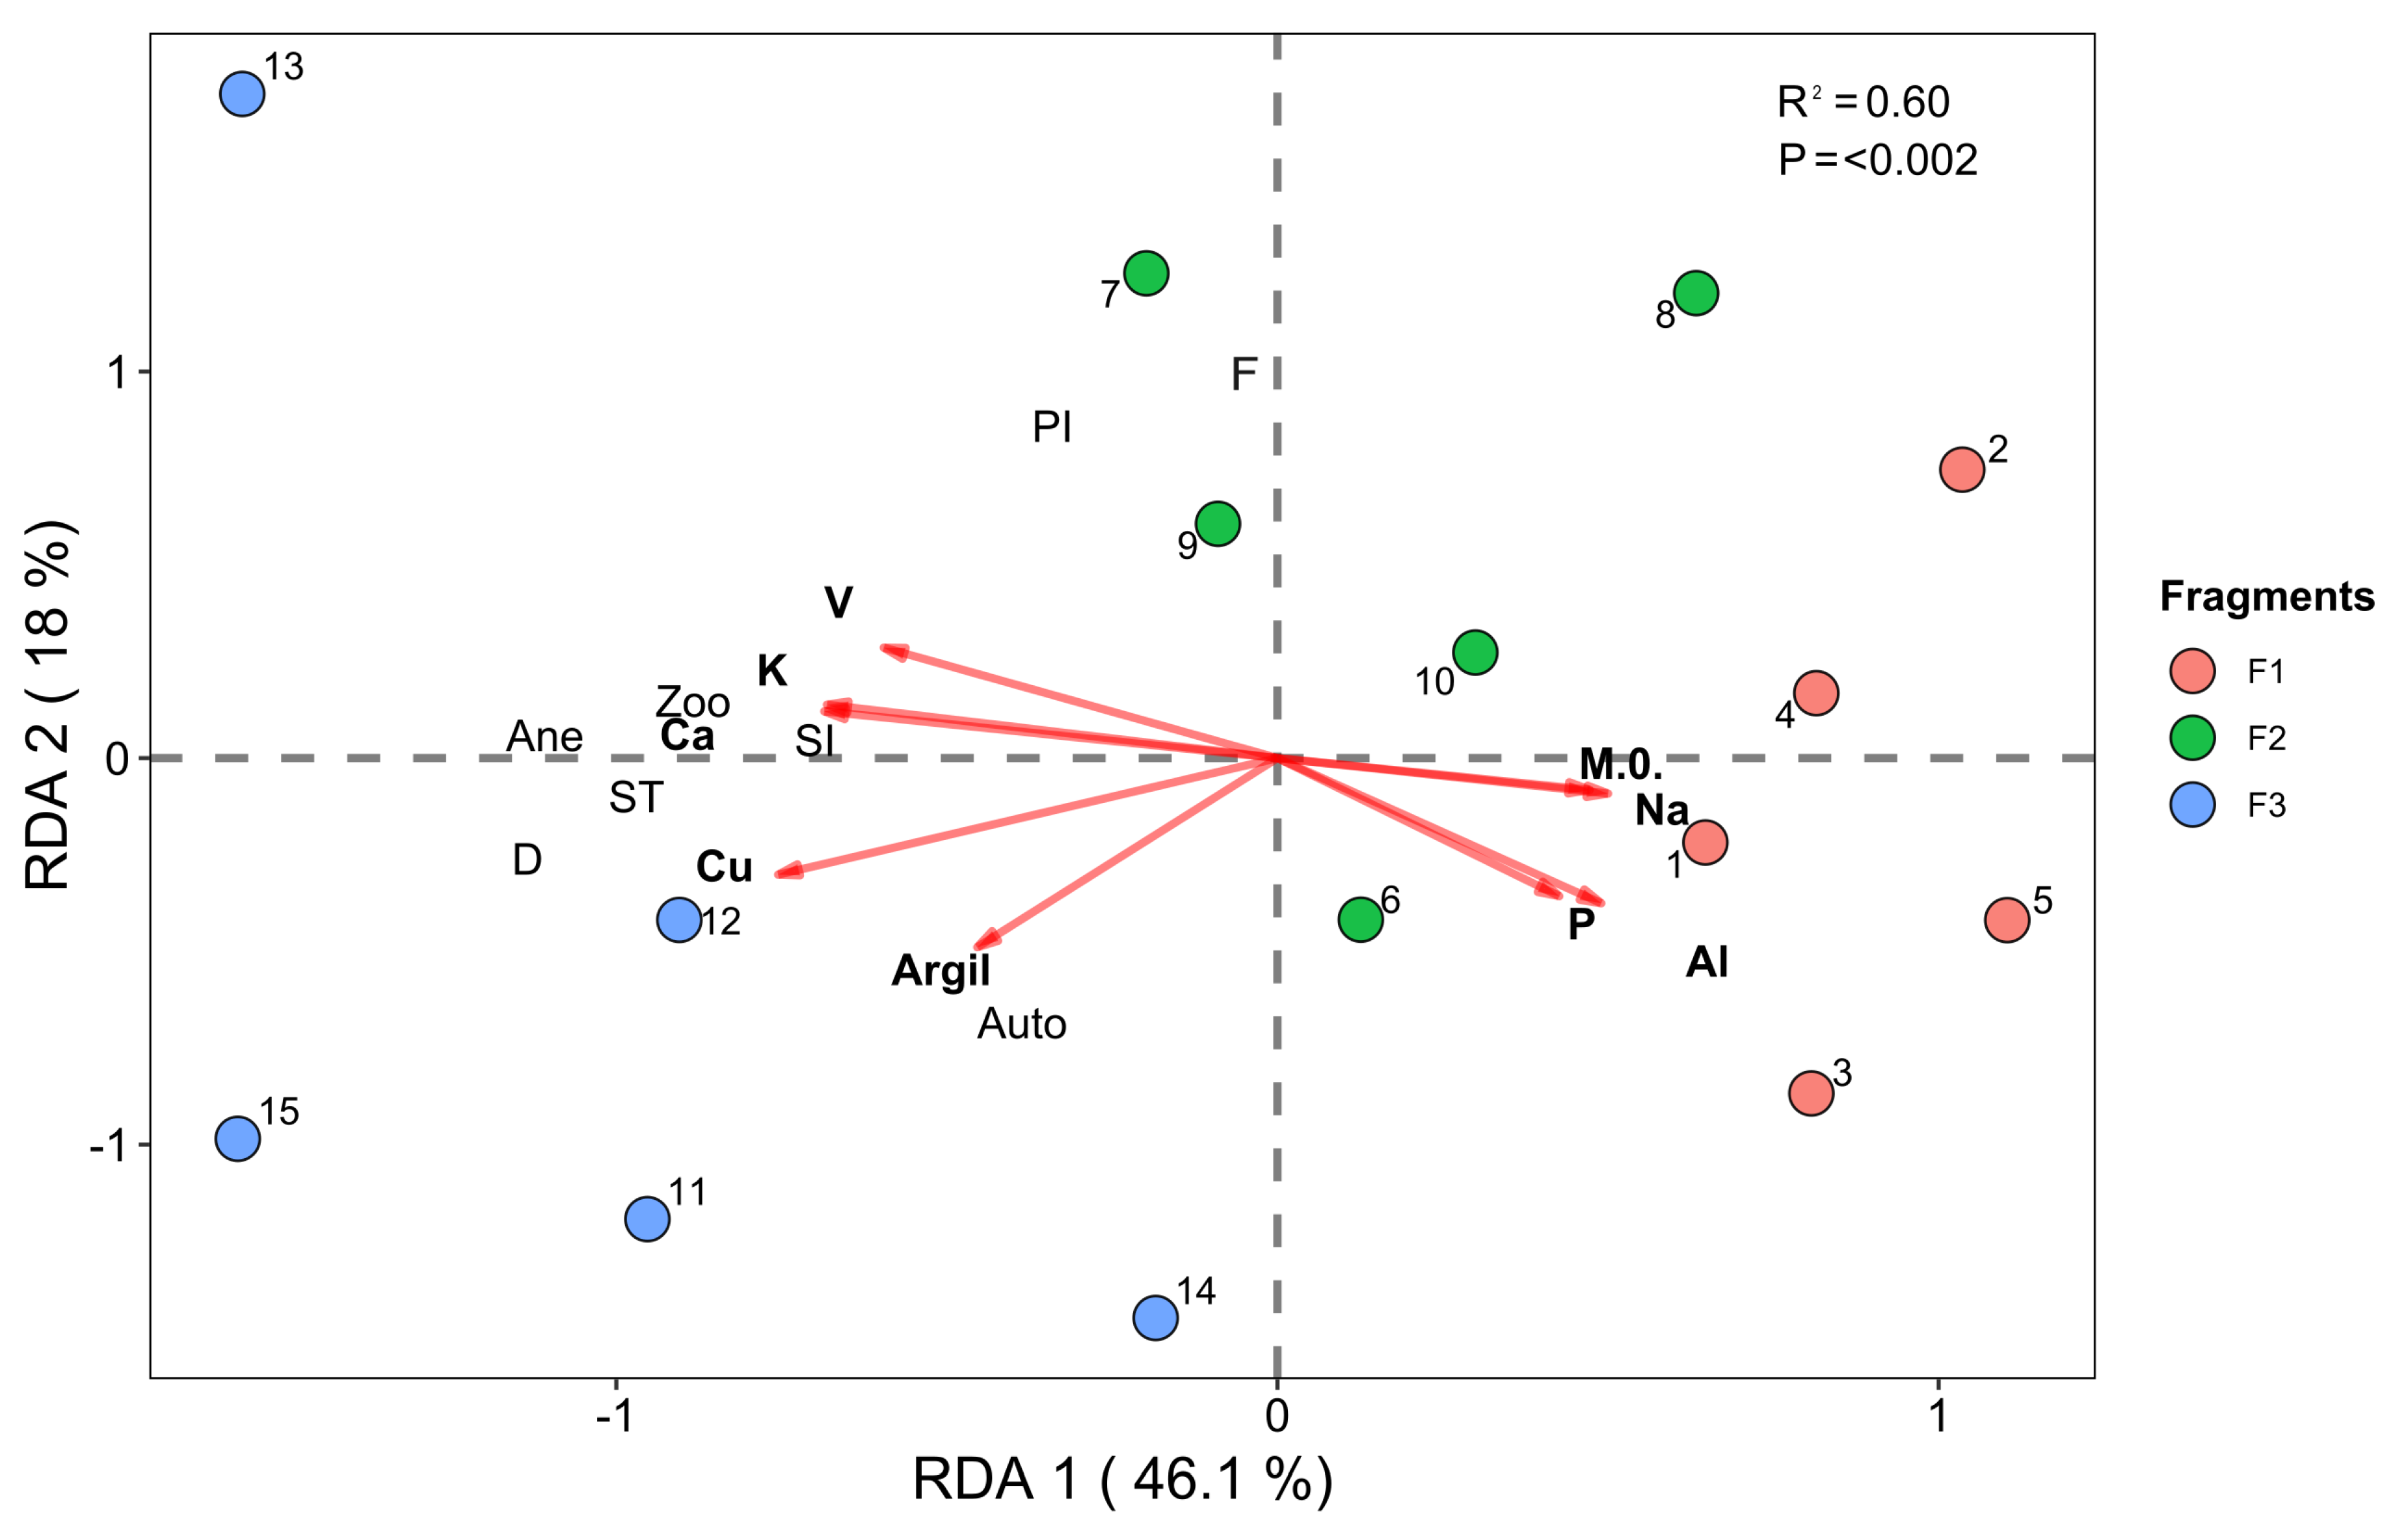
For the regenerating stratum (Figure 6), environmental and successional data showed a relationship between the plots in Fragment 1 and the variables m (aluminum saturation) and P (phosphorus); in addition, plot 2 was also influenced by the variable light (luminosity). In F2, plots 6, 8, and 10 were also associated with the variables m (aluminum saturation), P (phosphorus), and light; however, plots 7 and 9 were more influenced by the variables K (potassium), Mn (Manganese), V (base saturation), Ca (calcium), S.B (base saturation), and Cu (copper), as well as being more associated with filler species (P). These same variables were also strongly associated with the F3 plots, which in turn showed a stronger association with with late secondary and early successional species (SI and ST) than P (filler species), in addition to the D variable (diversity group). The dispersal strategies (anemochoric and zoochoric) were also more associated with these plots, possibly demonstrating greater diversity in this environment. Only plot 14 of this fragment showed no association with the others. The two axes of RDA 1 of the regenerating stratum explain a significantly high proportion (60.3%) of the data.

3.2.2. Vegetation–Environment Interactions (Environmental and Species Composition Data)

The RDA analyzed the composition and environmental data of the three fragments of the tree layer (Figure 7). The plots were checked for their association with the species. Plots 1, 2, 3, and 4 were more associated with Tapirira guianensis (Tap), Macrolobium latifolium (Mac), and Inga subnuda (Ing), respectively. Plot 5 proved to be more associated with the plots in Fragment 2 and the species most associated with them, Handroanthus chrysotrichus (Han), Xylopia frutescens (Xyl), Vismia brasiliensis (Vis), and Myrcia splendens (Myr). In Fragment 3, Senefeldera verticillata (Sen), Rinorea bahiensis (Rin), Astronium concinnum (Ast), Brasiliocroton mamoninha (Bra) and Eriotheca macrophylla (Eri) were considered the most associated species. For the environmental variables observed, the species in Fragments 1 and 2 were more closely associated with three variables: sand, silt, and light. Meanwhile, Fragment 3 was associated with all the remaining variables, indicating an environment with greater nutrient availability. The proportion of data explained by the two RDA axes adds up to 64%.
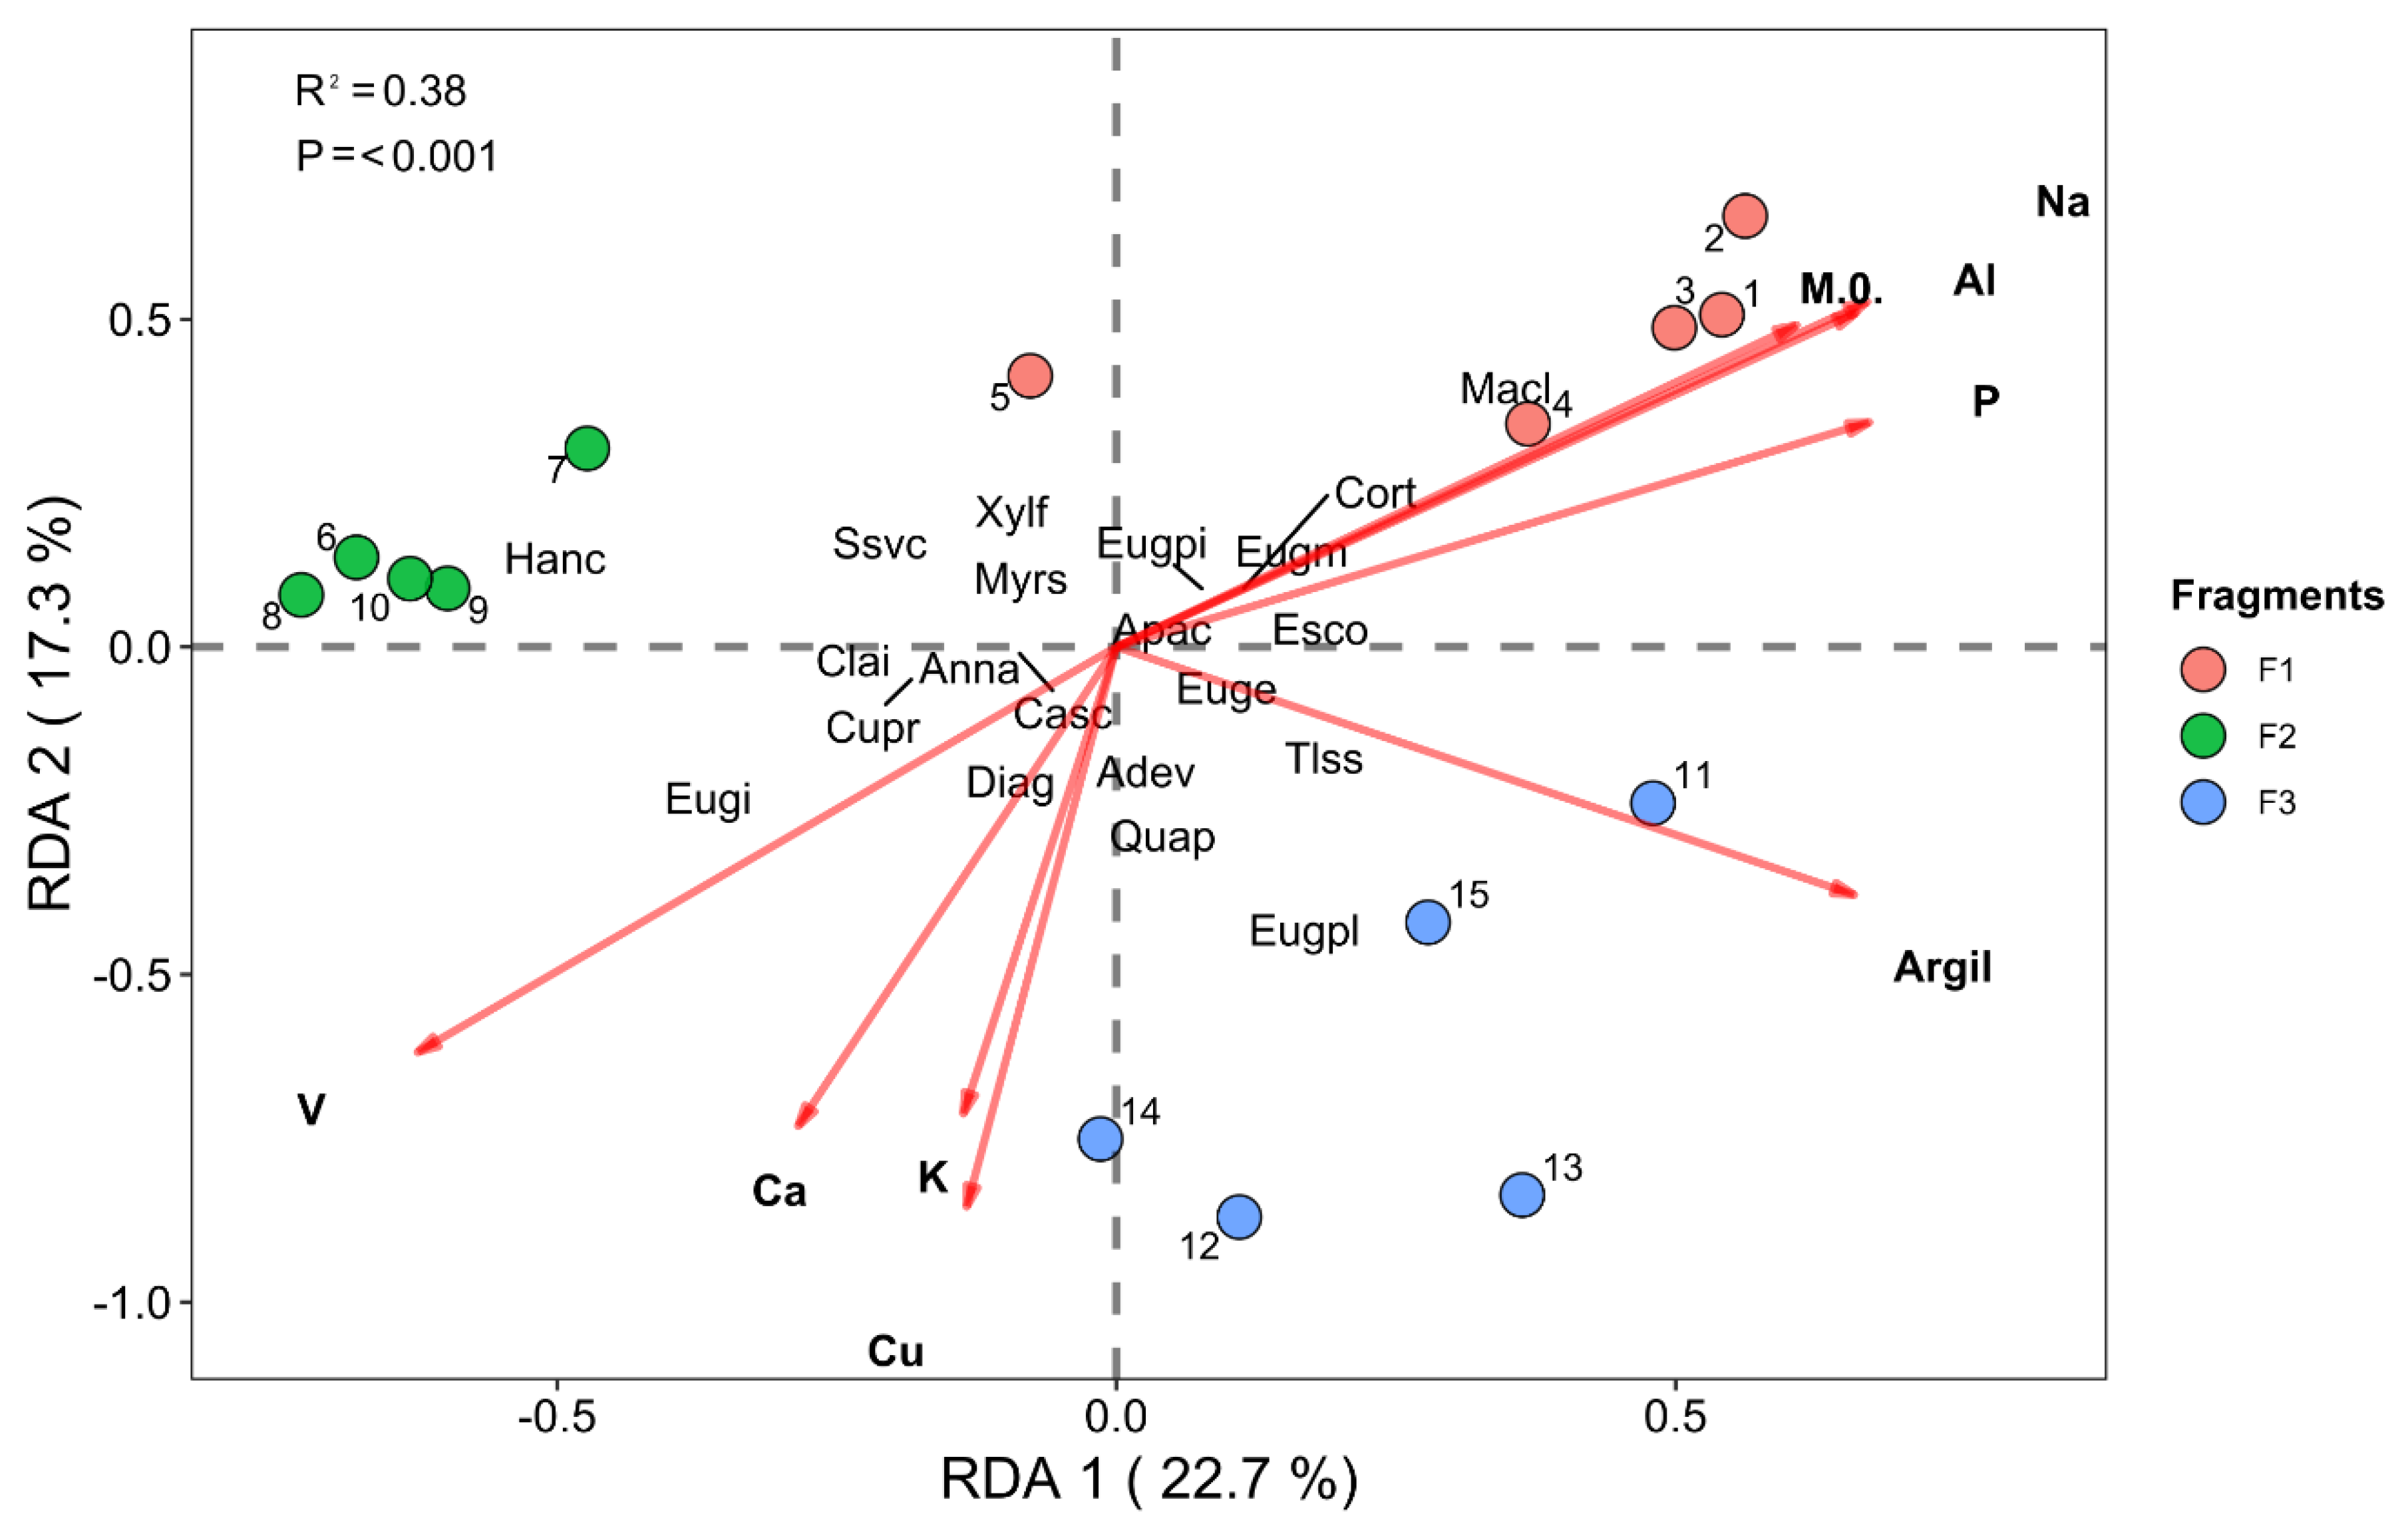
For the regenerating stratum, using the composition and succession of the three fragments presented in Figure 8, we checked which plots are associated with which species. The majority of the F1 plots are associated with the same species: Eschweilera ovata (Esco), Eugenia melanogyna (Eugm), Eugenia inversa (Eugpi), Aparisthmium cordatum (Apac), and Macrolobium latifolium (Macl). The latter had a greater influence than the others. Only plot 5 showed no association with these species, instead being associated with Casearia commersoniana (Casc), Myrcia splendens (Myrs), Xylopia frutescens (Xylf) and Swartzia simplex var. continentalis (Ssvc), which were also closely associated with the F2 plots. Although this fragment showed some relations with the aforementioned species, the greatest association in F2 was with Handroanthus chrysotrichus (Hanc) in all of its plots. For F3, the species most associated with the plots were Eugenia platyphylla (Eugpl), Quararibea penduliflora (Quap), Adenocalymma valida (Adev), Trichilia lepidota subsp. schumanniana (Tlss), and Dialium guianense (Diag), all late secondary species. Together, the proportion of data explained by the two axes of this RDA adds up to 39.7%.
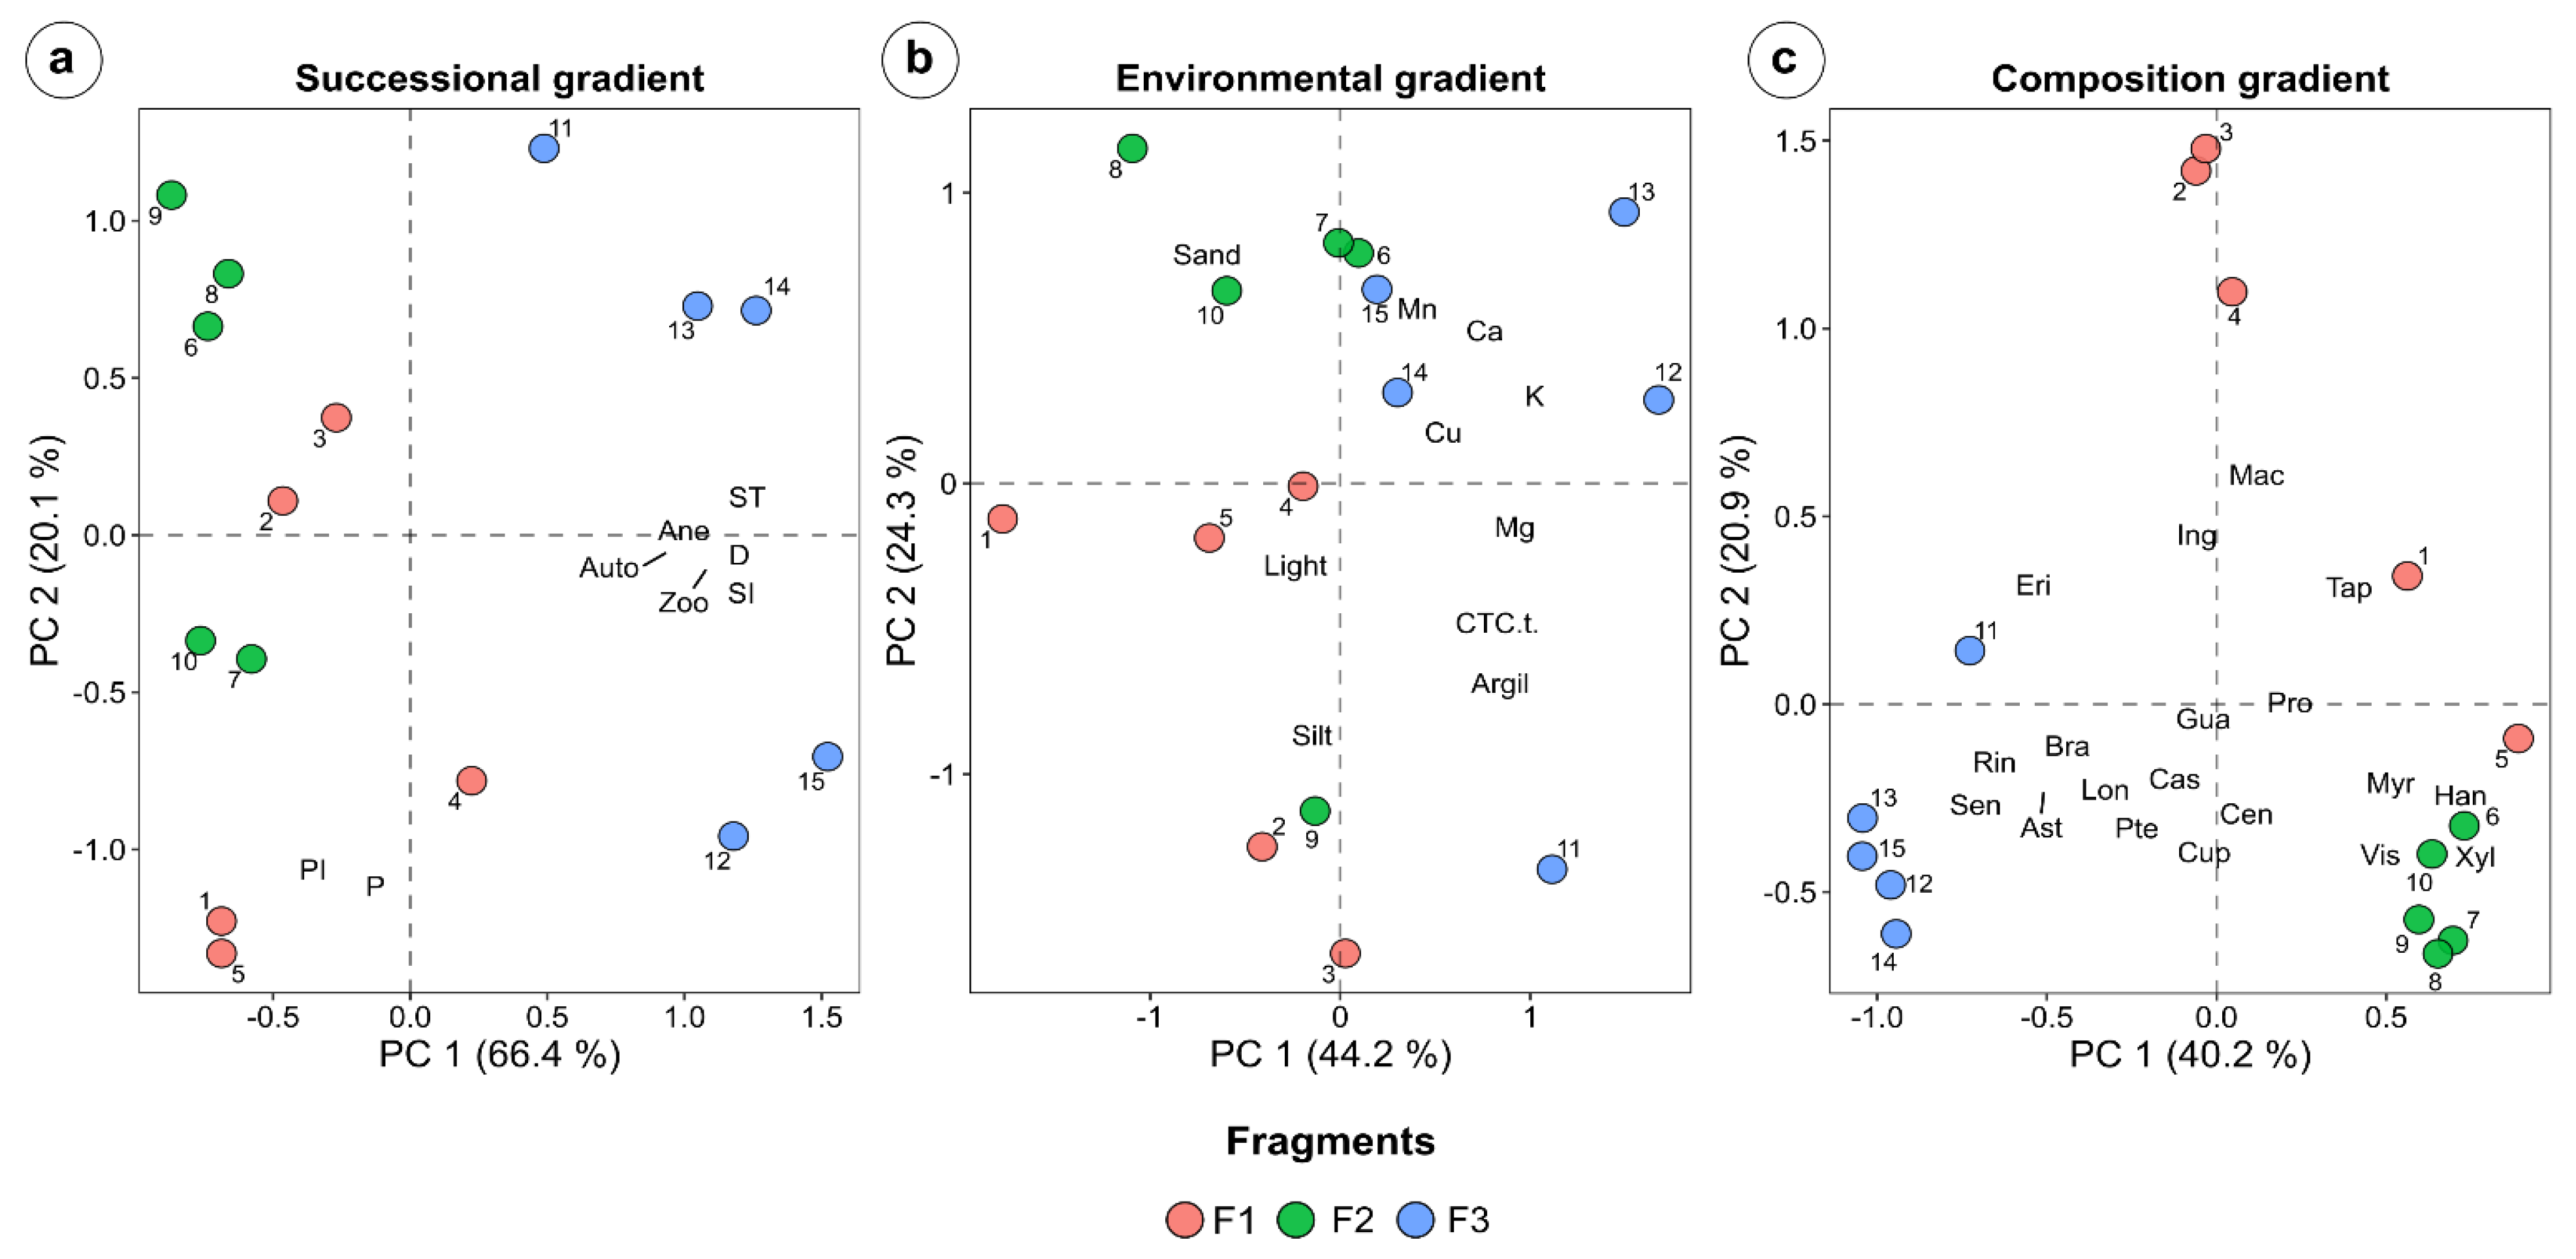
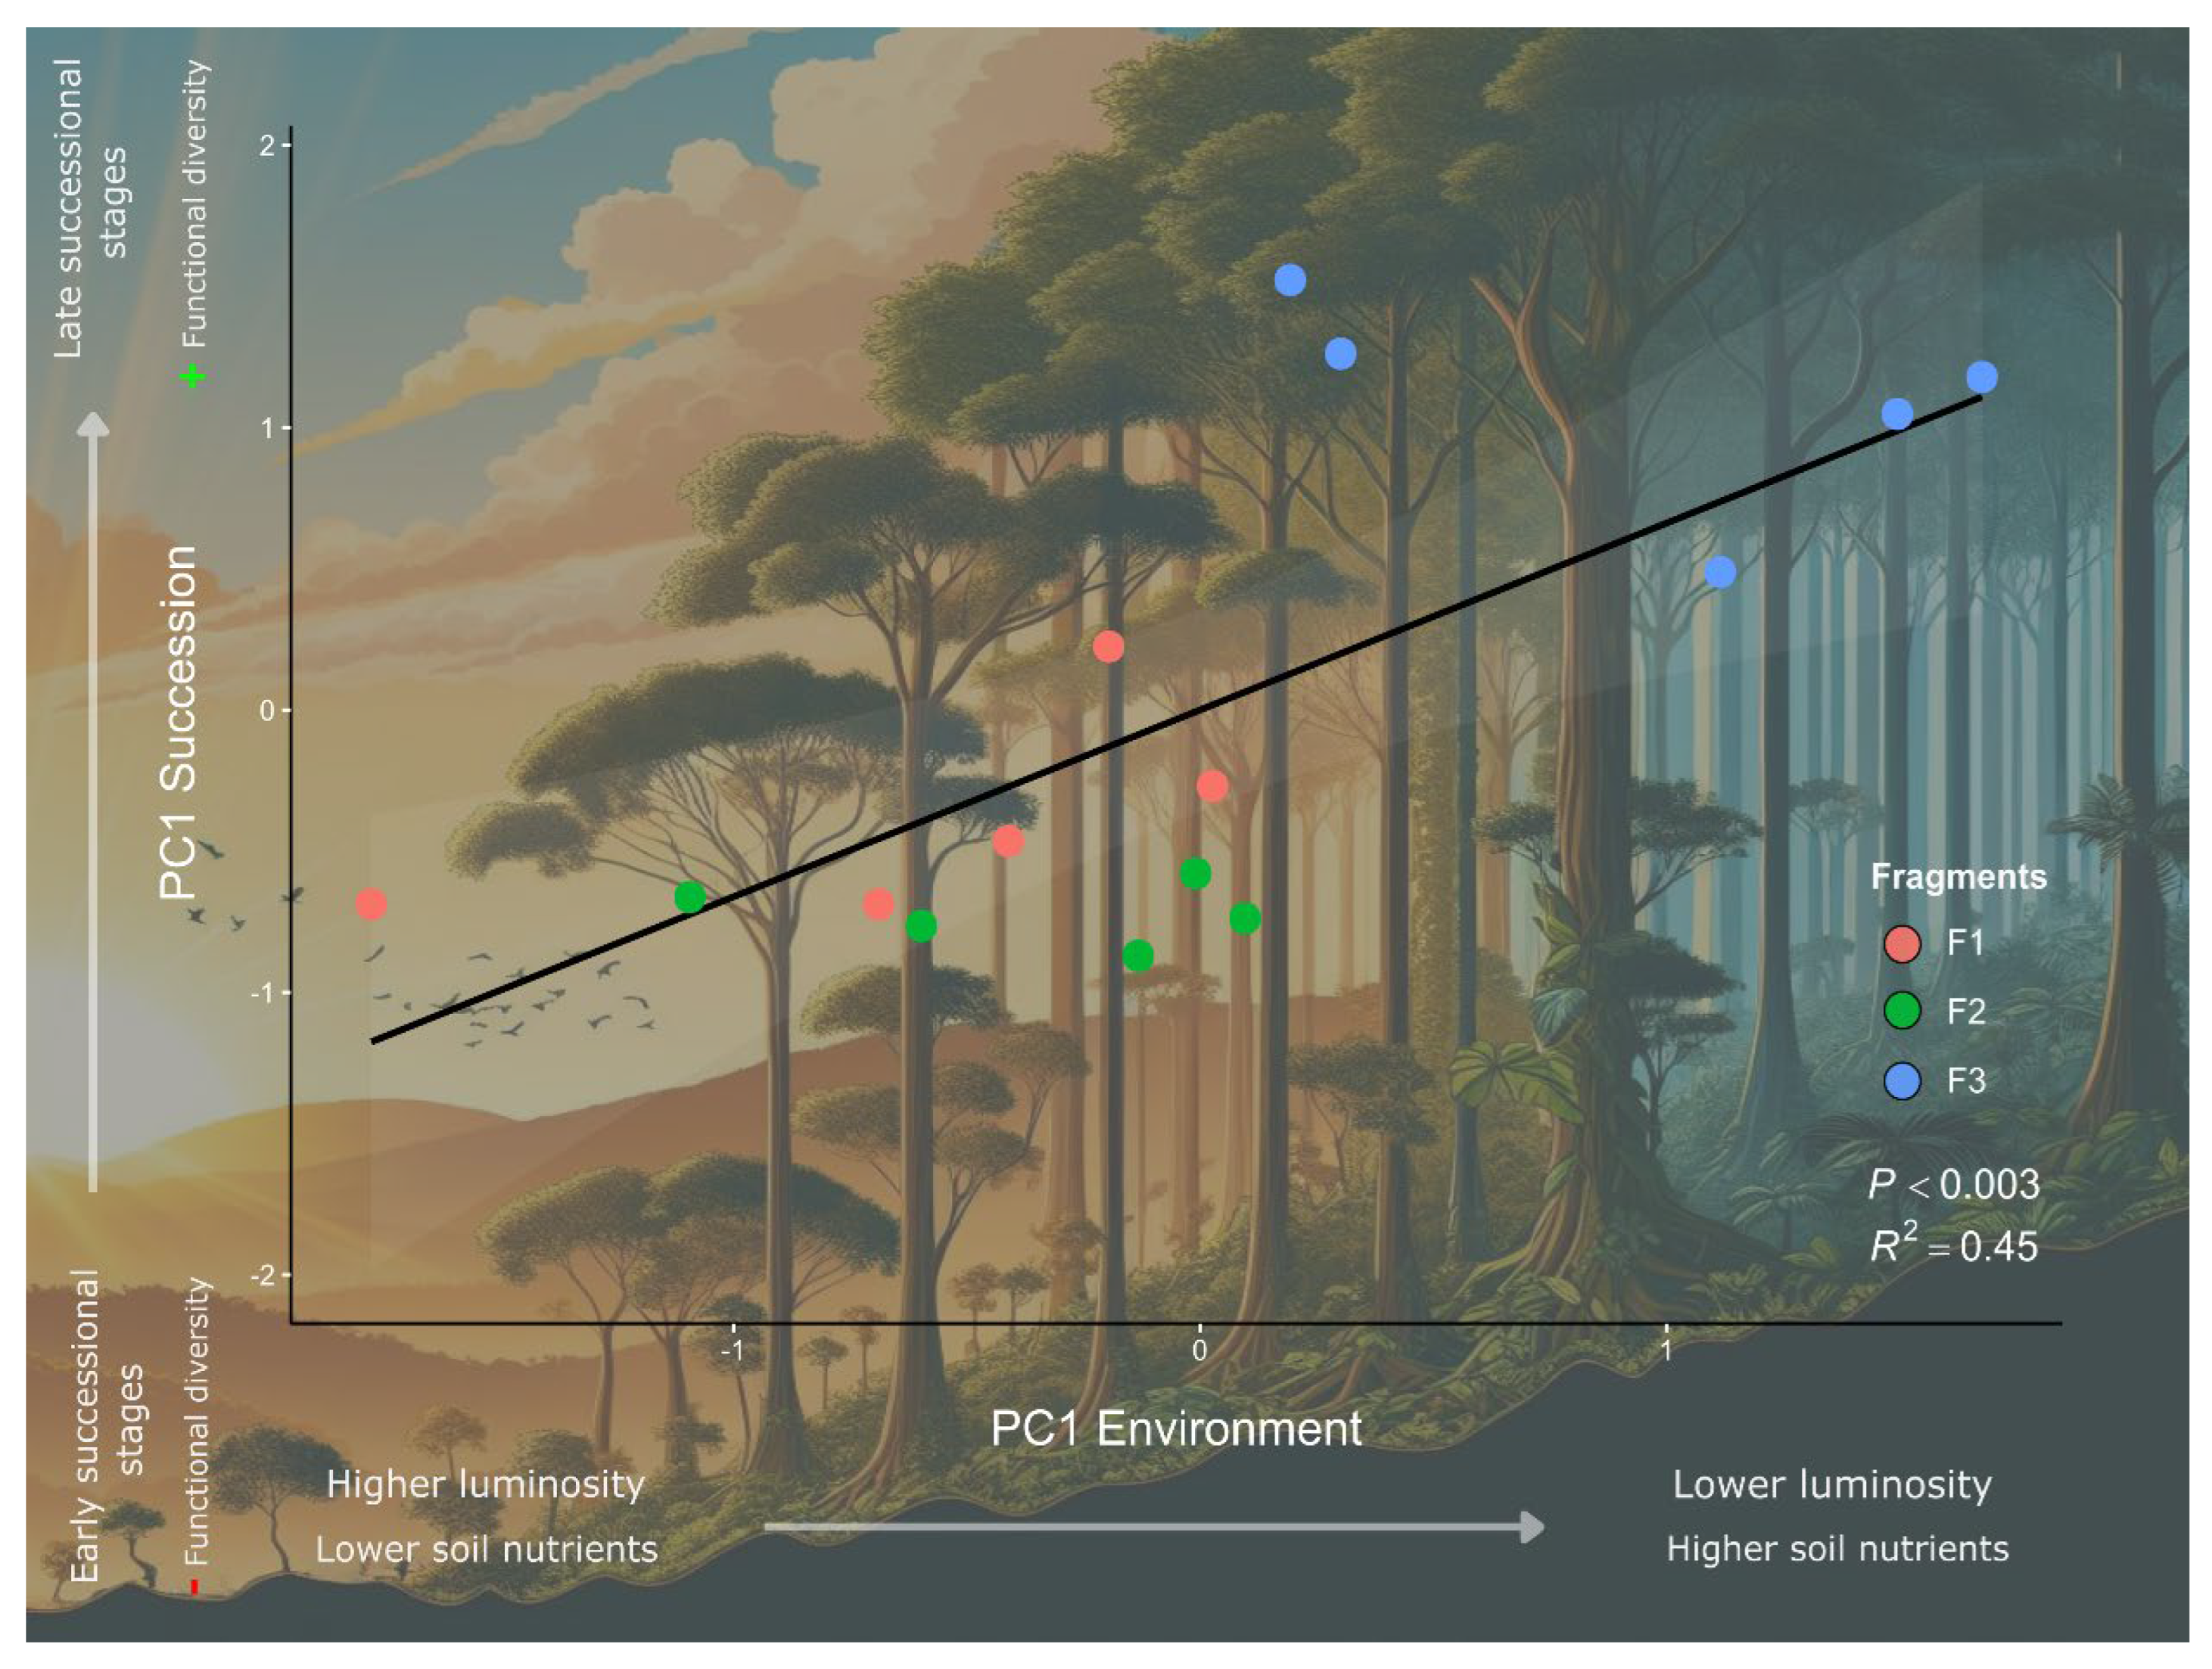
Based on the successional and environmental gradients obtained from the principal component analysis (PCA, Figure 9), two linear regressions were carried out using axis 1 of the successional PCA and axis 1 of the environmental PCA of the tree stratum. The first regression revealed a positive correlation between the successional gradient and the environmental gradient (Figure 10). This relationship indicates that, throughout the later stages of succession, there is a gradual increase in functional diversity, followed by a lower availability of luminosity and greater nutrient richness in the soil. The youngest fragments had greater light availability but relatively nutrient-poor soils. In contrast, the mature fragment (F3) was associated with low-light conditions and richer soils, as well as harboring higher functional diversity.
The second regression was obtained using data from axis 1 of the PCA of species composition in the tree layer and axis 1 of the environmental PCA (Figure 11). The second regression showed a negative relationship between the gradient of species composition in the tree layer and the environmental gradient (luminosity and soil nutrients), where the youngest fragments, with a greater presence of early secondary and pioneer species and fast-growing species, were more associated with an environment poorer in soil nutrients and with higher luminosity, while the mature fragment (F3) was more associated with slow-growing species, associated with conditions of lower luminosity and greater soil nutrient availability.

4. Discussion

This study evaluated the structure, diversity, composition, and environmental variables in two strata of three Lowland Rainforest fragments with distinct successional histories, which best reflect the current landscape of the Atlantic Forest: a mosaic of forest remnants with different land uses. The importance of sampling the regenerating stratum under environmental gradients, such as soil conditions and light availability, to understand how abiotic factors influence natural regeneration is highlighted here, potentially acting as an effective indicator to help elucidate the successional trajectories.
Fragment 3 (F3) showed higher levels of soil nutrients and higher functional diversity. This was indicated by the higher correlation of F3 with soil macro- and micronutrients, such as potassium (K), calcium (Ca), copper (Cu), magnesium (Mg), and manganese (Mn), respectively [51]. Furthermore, the good correlation with base saturation (V) is also a good indication of the general good state of the soil [46]. Increased soil nutrients can help to mitigate the resource limitations of tree species, potentially leading to greater species diversity through the creation of niches [52]. These more fertile soils are then able to allow a greater number of trees to grow, thus reducing the importance of specific functional traits and increasing the species richness [52,53].
In this context, the pattern observed in the mature fragment (F3), both in the tree and regenerating strata, along with the high species diversity, suggests that this fragment is in a more advanced successional stage. This part of the Atlantic Forest, located between northern Espírito Santo and southern Bahia, is considered one of the most diverse within the biome [54] and is surrounded by a matrix predominantly composed of well-preserved fragments and Eucalyptus forests [37,55]. This further underscores the importance of preserving fragments in late successional stages for the maintenance and conservation of the Atlantic Forest’s biodiversity [1,6,56]. For the two youngest fragments (F1 and F2), the pattern observed mostly displayed a higher correlation with the variables phosphorus (P) and aluminum saturation (m). Dystrophic soils can be deficient in Ca2+, Mg2+, and K+ and have a high exchangeable aluminum content, resulting in aluminum saturation (m%) of over 50% [57]. Such soils are classified as alkalic (very poor) soils, which is the case for the soil in this study, composed predominantly of alkalic and dystrophic yellow podzolic soils. It also points out that this is a common situation for sandier soils. The distinct conditions observed mainly in the youngest fragments are influenced by other factors, such as age, the presence, size, and integrity of nearby mature forests, and the history of land use and occupation, which influences soil fertility, as well as other environmental and ecological filters. These factors also have a direct impact on the composition, recruitment and establishment of individuals and, consequently, species and, therefore, can affect the successional trajectory [52,53].
A pattern of predominance of secondary species (late and early) was identified in the tree stratum of the three fragments. However, Fragment 3 exhibited a significantly higher number of late secondary species and greater diversity. In the regenerating stratum, this pattern shifted, with an abundance of early secondary species observed in the youngest fragments (F1 and F2). Fragments in the early stages of succession are often dominated by fast-growing species, as observed in other studies on tropical secondary forests [58]. In the mature fragment (F3), the pattern observed in the tree stratum was repeated in the regenerating one, with a predominance of late secondary species. This indicates that the fragment is well established, suggesting that even as the trees age, a stable base of late-successional species is maintained, thereby demonstrating the ecosystem’s self-sufficiency [38].
Thus, the early stages of forest succession generally show less functional diversity due to habitat filtering, which favors species with similar functional traits [59]. In this way, as succession progresses, competitive exclusion and greater environmental heterogeneity promote greater functional diversity [59,60]. In tropical montane forests, the results found by Fan [61] showed that the richness of functional groups is lower in the early stages than in the late stages. Similarly, in tropical dry forests, habitat filtering in the early stages reduces the variation in functional traits [60,62]. Given the current panorama of Atlantic Forest fragments, where we observe a predominant composition of small (<50 ha) and isolated fragments [63], this scenario represents a significant challenge for the conservation of the Atlantic Forest biome, since the limited diversity in these fragments compromises the resilience and preservation of biodiversity. This highlights the importance of preserving fragments in late successional stages to ensure seed dispersal and gene flow between fragments, as well as providing important ecosystem services and being essential for natural regeneration [64].
An important pattern observed in our study was the predominance of species with the zoochory dispersal strategy, which stood out as the main dispersal mechanism in all three fragments and in both strata. The importance of zoochory as a dispersal strategy is widely known, especially in humid tropical forests [65,66,67], such as the Atlantic Forest biome [68]. These interactions between plants and dispersing animals are very important for maintaining gene flow between fragments [67], especially for this study area, which is in a matrix dominated by eucalyptus monocultures. This is also particularly relevant in the context of Atlantic Forest remnants, which are mostly small and isolated fragments [63,69,70], which makes these interactions fundamental for the connectivity and genetic diversity of species.
In the mature fragment (F3), there was a greater overall diversity, not only of zoochoric species, but also of anemochoric species. This reflects the maturity of the ecosystem, which directly influences the diversity found [71]. These findings lead us to partially accept our first initial hypothesis, as we anticipated a stronger association with the zoochory dispersal strategy, which was confirmed. Nevertheless, a broader diversity of dispersal strategies overall was observed in this forest fragment.
Furthermore, the coexistence of different dispersal strategies, together with a greater diversity of late secondary species, indicates that the ecological dynamics of Fragment 3 are possibly more complex and balanced, suggesting a more advanced successional scenario compared to Fragments 1 and 2. Studies such as that of Chazdon [72] also suggest that the presence of remnant species in these fragments and their interactions with frugivores over time play a crucial role in the composition of natural regeneration, and therefore directly influence the successional dynamics and recovery of forest fragments. Understanding these patterns is an important tool for understanding how species diversity and dispersal interactions shape the succession process in fragmented tropical forests, such as the Atlantic Forest.
The species composition and environmental data in Fragment 1 revealed a predominant association with Macrolobium latifolium and Tapirira guianensis in the tree layer and Macrolobium latifolium and Eugenia melanogyna in the regenerating layer. These species are known to colonize more humid and disturbed environments, usually with sandy soils with low soil fertility [73,74]. At this stage, it is common to find pioneer and early secondary species, which are more tolerant of adverse conditions such as nutrient-poor soils and high luminosity, making it easier for them to colonize the site [75]. In Fragment 2, there was a greater association with the species Handroanthus chrysotrichus and Xylopia frutescens. These species are common in sandy soils with high luminosity, characterized by being drier, less acidic, and without flooding periods, compared to Fragment 1. Handroanthus chrysotrichus is found abundantly in both strata, benefiting from favorable luminosity conditions and its autochoric dispersal strategy. These species are frequently found in regeneration areas in the Atlantic Forest biome [76,77]. In addition, there was a significant change in the composition of regenerating patches, with an increase in some species that were not found in the tree stratum. Although Xylopia frutescens was abundant in the tree stratum, only six individuals of this species were found in the regeneration patches, while there was a significant presence of Swartzia simplex var. continentalis, a species categorized as late secondary and zoochoric [78]. This presence may be indicative of a possible change in the environmental conditions of this environment, since late secondary species are species that establish themselves late in the succession process and have a good tolerance to shade [8]. In this way, it may indicate that the successional trajectory of this fragment is heading towards a possible successional advance in the near future.
In Fragment 3, we found a composition pattern of predominantly late secondary species. The soil is more clayey and has greater nutrient availability, given its association with most of the soil’s chemical attributes in the RDAs in both strata. The species most associated with this fragment in the tree layer were Astronium concinumm and Rinorea bahiensis, and in the regenerating layer they were Eugenia platyphylla and Quararibea penduliflora. In particular, Rinorea bahiensis, categorized as vulnerable by the List of Endangered Species of Espírito Santo State Decree No. 5.238/2022-R, was also associated with this fragment.
Eugenia platyphylla is found abundantly in the regenerating stratum and is a species reported in other regions of the same phytophysiognomy [79]. Quararibea penduliflora, like the other species observed, with the exception of Astronium concinnum, which has already been reported in other works as having a high level of importance for other phytophysiognomies such as Semideciduous Seasonal Forest [80], is found exclusively in Lowland Ombrophilous Dense Forests between the north of Espírito Santo and the south of Bahia, growing in areas with well-drained soils [81]. This geographical distribution helps to characterize these species as typical of this phytophysiognomy [82] and highlights the importance of these remnants and their contribution to preserving the biodiversity of the Central Atlantic Rainforest.
Fragment 3 is also the oldest of the three fragments under study. It is set in a surrounding matrix made up of eucalyptus, coffee, and papaya plantations. However, this fragment is surrounded by a large expanse of well-preserved mature forest, forming a vegetation mosaic of great importance for the state of Espírito Santo [36]. This region has undergone significant conservation efforts since the 1950s. Although it shows signs of anthropogenic pressures, such as selective logging, these initiatives were probably essential for maintaining the preservation of this and other important fragments in the region [83]. All of these factors together reinforce the importance of conserving these forest fragments, especially those in more advanced stages, such as Fragment 3. Understanding the successional process and stages of forest development is crucial for conserving biodiversity and ecosystem services [84,85].
There was a positive correlation between the successional gradient and the environment; as the successional gradient progresses to more advanced stages, there is an increase in nutrients in the soil and a decrease in luminosity. Linear regression also showed a negative relationship between composition and environmental gradient. As luminosity decreases and nutrient content increases, the density of individuals decreases and diversity increases, a pattern observed by other authors [18,86]. The density of individuals decreases with increasing forest size due to inter- and intraspecies competition [13]. These associations identified in both strata and later in the linear regressions are reported in Tilman’s [87] successional model. This model predicts that, as the environment progresses through succession, light intensity decreases, the canopy becomes more closed, and available nutrients increase. These changes are expected to lead to variations in composition and abundance. In fact, nutrient levels can directly influence composition and subsequent distribution [4,13].

5. Conclusions

This study shows that mature forests are different from secondary forests in terms of their functional traits, species composition, and environmental characteristics. Mature and preserved forests have a higher functional diversity of dispersal traits, which are essential for connecting forest patches and the natural regeneration of closer degraded areas. On the other hand, our findings highlight that secondary forests are poor in terms of functional traits and soil fertility. Efforts to maintain the mature fragments and monitor the quality of the secondary ones are important to maintain and preserve tropical biodiversity. Finally, the limitations of this study are acknowledged; however, it is considered important as it provides an initial basis for future research. The inclusion of additional variables and theories is recommended to further enrich this discussion.

Author Contributions

Conceptualization, H.D.; Data curation, G.S.; Formal analysis, C.V. and R.H.; Funding acquisition, G.d.S.; Investigation, C.V., R.H., C.M., G.S., H.D. and G.d.S.; Methodology, C.V. and H.D.; Project administration, G.d.S.; Supervision, H.D. and G.d.S.; Validation, C.V. and R.H.; Writing—original draft, C.V. and H.D.; Writing—review and editing, C.V., R.H. and C.M. All authors have read and agreed to the published version of the manuscript.

Funding

This research was financed in part by the Coordenação de Aperfeiçoamento de Pessoal de Nível Superior—Brasil (CAPES)—Finance Code 001.

Data Availability Statement

The raw data supporting the conclusions of this article will be made available by the authors on request.

Acknowledgments

The authors would like to thank the Federal University of Espírito Santo (UFES) for funding the publication of this article. We thank Suzano S.A. for making the study areas available and for all the support offered during the execution of this research. We also would like to thank the Espírito Santo Research and Innovation Support Foundation (FAPES) (process 2020-4KK4L), and Espírito Santo Institute of Agricultural and Forestry Defense (IDAF) and the Laboratory of Forest Measurement and Management (Lamflor) of the Federal University of Espírito Santo for all the support offered for the execution of this research. H.D. received support for the project by FAPES—Research Fellowship for Capixaba Researchers—BPC (Grant Term no. 580/2023 and Process no. 2023–5671F).

Conflicts of Interest

The authors declare no conflicts of interest.

References

  1. Poorter, L.; Bongers, F.; Aide, T.M.; Almeyda Zambrano, A.M.; Balvanera, P.; Becknell, J.M.; Boukili, V.; Brancalion, P.H.S.; Broadbent, E.N.; Chazdon, R.L.; et al. Biomass Resilience of Neotropical Secondary Forests. Nature 2016, 530, 211–214. [Google Scholar] [CrossRef] [PubMed]
  2. MapBiomas. Destaque Do Mapeamento Anual Da Cobertura e Uso Do Terra No Brasil de 1985 a 2021—Mata Atlântica; MapBiomas: São Paulo, Brazil, 2022. [Google Scholar]
  3. Fundação SOS Mata Atlântica, Instituto Nacional de Pesquisas Espaciais. Atlas Dos Remanescentes Florestais Da Mata Atlântica Período 2022–2023; Fundação SOS Mata Atlântica, Instituto Nacional de Pesquisas Espaciais: São Paulo, Brazil, 2024.
  4. Dias, P.B.; Moreira, L.N.; Da Silva, G.F.; Pezzopane, J.E.M.E.; Dias, H.M. Richness, Structure and Environmental Relations in a National Forest in Southeast Brazil. Rev. Bras. Cienc. Agrar. 2019, 14, 1–8. [Google Scholar] [CrossRef]
  5. Zhang, X.; Zhao, W.; Liu, Y.; He, H.; Kou, Y.; Liu, Q. Dominant Plant Species and Soil Properties Drive Differential Responses of Fungal Communities and Functions in the Soils and Roots during Secondary Forest Succession in the Subalpine Region. Rhizosphere 2022, 21, 100483. [Google Scholar] [CrossRef]
  6. Poorter, L.; Craven, D.; Jakovac, C.C.; van der Sande, M.T.; Amissah, L.; Bongers, F.; Chazdon, R.L.; Farrior, C.E.; Kambach, S.; Meave, J.A.; et al. Multidimensional Tropical Forest Recovery. Science 2021, 374, 1370–1376. [Google Scholar] [CrossRef] [PubMed]
  7. Norden, N.; Angarita, H.A.; Bongers, F.; Martínez-Ramos, M.; Granzow-de la Cerda, I.; van Breugel, M.; Lebrija-Trejos, E.; Meave, J.A.; Vandermeer, J.; Williamson, G.B.; et al. Successional Dynamics in Neotropical Forests Are as Uncertain as They Are Predictable. Proc. Natl. Acad. Sci. USA 2015, 112, 8013–8018. [Google Scholar] [CrossRef] [PubMed]
  8. Marks, P.L. Reading the Landscape: Primary vs. Secondary Forests. Arnoldia 1995, 55, 2–10. [Google Scholar] [CrossRef]
  9. Woodall, C.W.; Kamoske, A.G.; Hayward, G.D.; Schuler, T.M.; Hiemstra, C.A.; Palmer, M.; Gray, A.N. Classifying Mature Federal Forests in the United States: The Forest Inventory Growth Stage System. For. Ecol. Manag. 2023, 546, 121361. [Google Scholar] [CrossRef]
  10. Martin, P.; Jung, M.; Brearley, F.Q.; Ribbons, R.R.; Lines, E.R.; Jacob, A.L. Can We Set a Global Threshold Age to Define Mature Forests? PeerJ 2016, 4, e1595. [Google Scholar] [CrossRef] [PubMed]
  11. Gray, A.N.; Pelz, K.; Hayward, G.D.; Schuler, T.; Salverson, W.; Palmer, M.; Schumacher, C.; Woodall, C.W. Perspectives: The Wicked Problem of Defining and Inventorying Mature and Old-Growth Forests. For. Ecol. Manag. 2023, 546, 121350. [Google Scholar] [CrossRef]
  12. Safar, N.V.H.; van der Sande, M.; Carlos, C.E.; Luiz, L.F.; Martins, S.V.; Simonelli, M.; Poorter, L. Landscape Openness Has Different Effects on the Structure, Diversity and Functional Composition of Brazilian Rainforests. For. Ecol. Manag. 2022, 520, 120395. [Google Scholar] [CrossRef]
  13. Magnago, L.F.S.; Simonelli, M.; Martins, S.V.; Matos, F.A.R.; Demuner, V.G. Variações Estruturais e Características Edáficas Em Diferentes Estádios Sucessionais de Floresta Ciliar de Tabuleiro, ES. Rev. Árvore 2011, 35, 445–456. [Google Scholar] [CrossRef]
  14. Hubbell, S.P. The Unified Neutral Theory of Species Abundance and Diversity; Princeton University Press: Princeton, NJ, USA, 2001. [Google Scholar]
  15. Laurance, W.F.; Nascimento, H.E.M.; Laurance, S.G.; Andrade, A.; Ewers, R.M.; Harms, K.E.; Luizão, R.C.C.; Ribeiro, J.E. Habitat Fragmentation, Variable Edge Effects, and the Landscape-Divergence Hypothesis. PLoS ONE 2007, 2, e1017. [Google Scholar] [CrossRef] [PubMed]
  16. Pyles, M.V.; Magnago, L.F.S.; Borges, E.R.; van den Berg, E.; Carvalho, F.A. Land Use History Drives Differences in Functional Composition and Losses in Functional Diversity and Stability of Neotropical Urban Forests. Urban For. Urban Green. 2020, 49, 126608. [Google Scholar] [CrossRef]
  17. Poorter, L.; Rozendaal, D.M.A.; Bongers, F.; de Jarcilene, S.A.; Àlvarez, F.S.; Luìs Andrade, J.; Arreola Villa, L.F.; Becknell, J.M.; Bhaskar, R.; Boukili, V.; et al. Functional Recovery of Secondary Tropical Forests. Proc. Natl. Acad. Sci. USA 2021, 118, e2003405118. [Google Scholar] [CrossRef] [PubMed]
  18. Marques, M.C.M.; Zwiener, V.P.; Ramos, F.M.; Borgo, M.; Marques, R. Forest Structure and Species Composition along a Successional Gradient of Lowland Atlantic Forest in Southern Brazil. Biota Neotrop. 2014, 14, e20140094. [Google Scholar] [CrossRef]
  19. Garnier, E.; Navas, M.L.; Grigulis, K. Plant Functional Diversity: Organism Traits, Community Structure, and Ecosystem Properties Oxford University Press; Oxford University Press: Oxford, UK, 2016. [Google Scholar]
  20. Letcher, S.G.; Lasky, J.R.; Chazdon, R.L.; Norden, N.; Wright, S.J.; Meave, J.A.; Pérez-García, E.A.; Muñoz, R.; Romero-Pérez, E.; Andrade, A.; et al. Environmental Gradients and the Evolution of Successional Habitat Specialization: A Test Case with 14 Neotropical Forest Sites. J. Ecol. 2015, 103, 1276–1290. [Google Scholar] [CrossRef]
  21. Knapp, S.; Stadler, J.; Harpke, A.; Klotz, S. Dispersal Traits as Indicators of Vegetation Dynamics in Long-Term Old-Field Succession. Ecol. Indic. 2016, 65, 44–54. [Google Scholar] [CrossRef]
  22. Huanca-Nuñez, N.; Chazdon, R.L.; Russo, S.E. Determinism and Stochasticity in Seed Dispersal-Successional Feedbacks. bioRxiv 2019, 791988. [Google Scholar] [CrossRef]
  23. Chazdon, R.L. Second Growth: The Promise of Tropical Forest Regeneration in an Age of Deforestation; University of Chicago Press: Chicago, IL, USA, 2014. [Google Scholar]
  24. Chazdon, R.L.; Guariguata, M.R. Natural Regeneration as a Tool for Large-Scale Forest Restoration in the Tropics: Prospects and Challenges. Biotropica 2016, 48, 716–730. [Google Scholar] [CrossRef]
  25. Chazdon, R.L.; Peres, C.A.; Dent, D.; Sheil, D.; Lugo, A.E.; Lamb, D.; Stork, N.E.; Miller, S.E. The Potential for Species Conservation in Tropical Secondary Forests. Conserv. Biol. 2009, 23, 1406–1417. [Google Scholar] [CrossRef] [PubMed]
  26. Lebrija-Trejos, E.; Pérez-García, E.A.; Meave, J.A.; Poorter, L.; Bongers, F. Environmental Changes during Secondary Succession in a Tropical Dry Forest in Mexico. J. Trop. Ecol. 2011, 27, 477–489. [Google Scholar] [CrossRef]
  27. Callegaro, R.M.; Longhi, S.J.; Andrzejewski, C.; Araujo, M.M. Regeneração Natural de Espécies Arbóreas Em Diferentes Comunidades de Um Remanescente de Floresta Ombrófila Mista. Ciência Rural 2015, 45, 1795–1801. [Google Scholar] [CrossRef]
  28. Ministerio do Meio Ambiente; Conservação Internacional; Fundação SOS Mata Atlântica. O Corredor Central Da Mata Atlantica. Uma Nova Escala de Conservacao Da Biodiversidade. 2006. Available online: https://www.conservation.org/docs/default-source/brasil/corredorcentraldamataatlantica.pdf?sfvrsn=8e09808_2 (accessed on 15 November 2024).
  29. IBGE (Fundação Instituto Brasileiro de Geografia e Estatística). Rio Doce: Geologia, Geomorfologia, Pedologia, Vegetação e Uso Potencial Da Terra. Projeto Radambrasil, Volume SF.34; IBGE: Rio de Janeiro, Brazil, 1987.
  30. Instituto Brasileiro de Geografia e Estatística (IBGE). Manual Técnico Da Vegetação Brasileira. Manuais Técnicos Em Geociências; IBGE: Rio de Janeiro, Brazil, 2012.
  31. Rizzini, C.T. Tratado de Fitogeografia Do Brasil—Aspectos Ecológicos, Sociológicos e Florísticos, 2nd ed.; Âmbito Cultural Edições Ltda.: Rio de Janeiro, Brazil, 1997. [Google Scholar]
  32. ICMBIO Reserva Biológica de Sooretama—Aspectos Físicos e Biológicos. Available online: https://www.icmbio.gov.br (accessed on 4 May 2022).
  33. Magnago, L.F.S.; Edwards, D.P.; Edwards, F.A.; Magrach, A.; Martins, S.V.; Laurance, W.F. Functional Attributes Change But Functional Richness Is Unchanged After Fragmentation of Brazilian Atlantic Forests. J. Ecol. 2014, 102, 475–485. [Google Scholar] [CrossRef]
  34. MapBiomas. Projeto MapBiomas—Coleção 7.0 Da Série Anual de Mapas de Cobertura e Uso de Solo Do Brasil. Available online: https://plataforma.brasil.mapbiomas.org (accessed on 25 May 2023).
  35. Brasil. Lei No 9.985, de 18 de Julho de 2000. Sistema Nacional de Unidades de Conservação Da Natureza; The Ministry of Environment and Climate Change: Brasilia, Brazil, 2000.
  36. Srbek-Araujo, A.C.; Kierulff, M.C.M. Mammals of Medium and Large Size of the Tabuleiro Forests in Northern Espírito Santo: Functional Groups and Main Threats. In Atlantic Forest of Tabuleiro: Diversity and Endemisms in the Vale Natural Reserve; Rolim, S.G., Menezes, L.F.T., Srbek-Araujo, A.C., Eds.; Rupestre: Belo Horizonte, Brazil, 2016; pp. 469–479. [Google Scholar]
  37. Peixoto, A.L.; De Jesus, R.M. Reserva Natural Vale: Memórias de 65 Anos de Conservação. In Floresta Atlântica de Tabuleiro: Diversidade e endemismos na Reserva Natural da Vale; Rupestre: Belo Horizonte, Brazil, 2016; pp. 21–30. ISBN 9788562805639. [Google Scholar]
  38. Valente, C.; Moura, C.; Hollunder, R.; Cabral, R.; Rodrigues, N.; Lobato, L.; Dias, H.; Da Silva, G. Diversity and Structure of Tree and Regenerating Strata in Fragments at Different Successional Stages in the Atlantic Forest of Brazil. Phytocoenologia 2024, 52, 71–85. [Google Scholar] [CrossRef]
  39. Mueller-Dombois, D.; Ellenberg, H. Aims and Methods Vegetation Ecology; J. Wiley: New York, NY, USA, 1974. [Google Scholar]
  40. Gandolfi, S.; Leitão Filho, H.d.F.; Bezerra, C.L.F. Floristic Survey and Successional Character of Shrub-Tree Species in a Semideciduous Mesophytic Forest in the Municipality of Guarulhos, SP. Bol. Mus. Biol. Mello Leitão 1995, 55, 753–767. [Google Scholar]
  41. Pijl, V.D.L. Principles of Dispersal in Higher Plants; Springer: New York, NY, USA, 1982; 215p. [Google Scholar]
  42. Tichý, L. Field Test of Canopy Cover Estimation by Hemispherical Photographs Taken with a Smartphone. J. Veg. Sci. 2016, 27, 427–435. [Google Scholar] [CrossRef]
  43. Teixeira, P.C.; Donagemma, G.K.; Fontana, A.; Teixeira, W.G. Manual de Métodos de Análise de Solo, 3rd ed.; Embrapa: Brasília, Brazil, 2017; ISBN 9788570357717. [Google Scholar]
  44. Magurran, A.E. Medindo a Diversidade Biológica; UFPR: Curitiba, Brazil, 2013. [Google Scholar]
  45. R Core Team. R Core Team R: A Language and Environment for Statistical Computing; R Core: Vienna, Austria, 2022. [Google Scholar]
  46. Braga, S.R.; Oliveira, M.L.R.; Gorgens, E.B. Forestmangr: Forest Mensuration and Management Package Version 0.9.6. Available online: https://cran.r-project.org/web/packages/forestmangr/index.html (accessed on 20 November 2022).
  47. Oksanen, J.; Blanchet, F.G.; Kindt, R.; Legendre, P.; Minchin, P.R.; O’Hara, R.B.; Wagner, H.; Vegan: Community Ecology Package. R Package Version 2.3-2. Available online: https://cran.r-project.org/web/packages/vegan/index.html (accessed on 26 April 2022).
  48. Wickham, H. Ggplot2: Elegant Graphics for Data Analysis; Springer: New York, NY, USA, 2016. [Google Scholar]
  49. Legendre, P.; Legendre, L. Numerical Ecology; Elsevier: Amsterdam, The Netherlands, 2012. [Google Scholar]
  50. Legendre, P.; Gallagher, E. Ecologically Meaningful Transformations for Ordination of Species Data. Oecologia 2001, 129, 271–280. [Google Scholar] [CrossRef] [PubMed]
  51. Batista, M.A.; Inoue, T.T.; Neto, M.E.; Muniz, A.S. Princípios de Fertilidade Do Solo, Adubação e Nutrição Mineral. In Hortaliças-fruto; Eduem, Ed.; EUDEM: Maringá, Brazil, 2018; pp. 113–162. [Google Scholar]
  52. Yuan, Z.; Ali, A.; Ruiz-Benito, P.; Jucker, T.; Mori, A.S.; Wang, S.; Zhang, X.; Li, H.; Hao, Z.; Wang, X.; et al. Above-and below-Ground Biodiversity Jointly Regulate Temperate Forest Multifunctionality along a Local-Scale Environmental Gradient. J. Ecol. 2020, 108, 2012–2024. [Google Scholar] [CrossRef]
  53. Furey, G.N.; Tilman, D. Plant Biodiversity and the Regeneration of Soil Fertility. Proc. Natl. Acad. Sci. USA 2021, 118, e2111321118. [Google Scholar] [CrossRef] [PubMed]
  54. Rolim, S.G.; Machado, R.E.; Pillar, V.D. Divergence in a Neotropical Forest during 33 Years of Succession Following Clear-Cutting. J. Veg. Sci. 2017, 28, 495–503. [Google Scholar] [CrossRef]
  55. Saiter, F.Z.; Rolim, S.G.; Oliveira-Filho, A.T. A Floresta de Linhares No Contexto Fitogeográfico Do Leste Do Brasil. In Floresta Atlântica Tabuleiro: Diversidade e Endemismos na Reserva Natural Vale; Rolim, S.G., Menezes, L.F.T., Srbek-Araujo, A.C., Eds.; Rupestre: Belo Horizonte, Brazil, 2016; pp. 61–69. [Google Scholar]
  56. Souza, C.R.; Maia, V.A.; de Aguiar-Campos, N.; Santos, A.B.M.; Rodrigues, A.F.; Farrapo, C.L.; Gianasi, F.M.; de Paula, G.G.P.; Fagundes, N.C.A.; Silva, W.B.; et al. Long-Term Ecological Trends of Small Secondary Forests of the Atlantic Forest Hotspot: A 30-Year Study Case. For. Ecol. Manag. 2021, 489, 119043. [Google Scholar] [CrossRef]
  57. Ronquim, C.C. Conceitos de Fertilidade Do Solo e Manejo Adequado Para as Regiões Tropicais; Campinas, EMBRAPA: Brasilia, Brazil, 2010. [Google Scholar]
  58. Pinotti, B.T.; Pagotto, C.P.; Pardini, R. Habitat Structure and Food Resources for Wildlife across Successional Stages in a Tropical Forest. For. Ecol. Manag. 2012, 283, 119–127. [Google Scholar] [CrossRef]
  59. Purschke, O.; Schmid, B.C.; Sykes, M.T.; Poschlod, P.; Michalski, S.G.; Durka, W.; Kühn, I.; Winter, M.; Prentice, H.C. Contrasting Changes in Taxonomic, Phylogenetic and Functional Diversity during a Long-Term Succession: Insights into Assembly Processes. J. Ecol. 2013, 101, 857–866. [Google Scholar] [CrossRef]
  60. Bhaskar, R.; Dawson, T.E.; Balvanera, P. Community Assembly and Functional Diversity along Succession Post-Management. Funct. Ecol. 2014, 28, 1256–1265. [Google Scholar] [CrossRef]
  61. Fan, K.; Tao, J.; Zang, L.; Yao, J.; Huang, J.; Lu, X.; Ding, Y.; Xu, Y.; Zang, R. Changes in Plant Functional Groups During Secondary Succession in a Tropical Montane Rain Forest. Forests 2019, 10, 1134. [Google Scholar] [CrossRef]
  62. Sanaphre-Villanueva, L.; Dupuy, J.M.; Andrade, J.L.; Reyes-García, C.; Paz, H.; Jackson, P.C. Functional Diversity of Small and Large Trees Along Secondary Succession in a Tropical Dry Forest. Forests 2016, 7, 163. [Google Scholar] [CrossRef]
  63. Ribeiro, M.C.; Metzger, J.P.; Martensen, A.C.; Ponzoni, F.J.; Hirota, M.M. The Brazilian Atlantic Forest: How Much Is Left, and How Is the Remaining Forest Distributed? Implications for Conservation. Biol. Conserv. 2009, 142, 1141–1153. [Google Scholar] [CrossRef]
  64. Bovo, A.A.A.; Ferraz, K.M.P.M.B.; Magioli, M.; Alexandrino, E.R.; Hasui, É.; Ribeiro, M.C.; Tobias, J.A. Habitat Fragmentation Narrows the Distribution of Avian Functional Traits Associated with Seed Dispersal in Tropical Forest. Perspect. Ecol. Conserv. 2018, 16, 90–96. [Google Scholar] [CrossRef]
  65. Wendt, A.L.; Chazdon, R.L.; Vargas Ramirez, O. Successional Trajectories of Seed Dispersal Mode and Seed Size of Canopy Tree Species in Wet Tropical Forests. Front. For. Glob. Change 2022, 5, 946541. [Google Scholar] [CrossRef]
  66. Medeiros, A.d.S.; Pereira, M.G.; Braz, D.M. Estrutura e Conservação de Um Trecho de Floresta Estacional Em Piraí, RJ. Floresta Ambiente 2016, 23, 330–339. [Google Scholar] [CrossRef]
  67. Da Rocha, M.J.R.; Cupertino-Eisenlohr, M.A.; Leoni, L.S.; Gomes Da Silva, A.; Nappo, M.E. Floristic and Ecological Attributes of a Seasonal Semideciduous Atlantic Forest in a Key Area for Conservation of the Zona Da Mata Region of Minas Gerais State, Brazil. Hoehnea 2017, 44, 29–43. [Google Scholar] [CrossRef]
  68. Lima, P.I.; Nogueira, R.M.; Monteiro, R.L.; Peracchi, A.L. Frugivoria e Dispersão de Sementes Por Morcegos Na Reserva Natural Vale, Sudeste Do Brasil. In Floresta Atlântica de Tabuleiro: Diversidade e endemismos na Reserva Natural da Vale; Rolim, S.G., de Menezes, L.F.T., Srbek-Araujo, A.C., Eds.; Rupestre: Belo Horizonte, Brazil, 2016; pp. 433–452. [Google Scholar]
  69. Fundação SOS Mata Atlântica; Instituto Nacional de Pesquisas Espaciais. Relatório Técnico: Atlas Dos Remanescentes Florestais Da Mata Atlântica Período 2021-2022; Fundação SOS Mata Atlântica, Instituto Nacional de Pesquisas Espaciais—INPE: São Paulo, Brazil, 2023.
  70. Rezende, C.L.; Scarano, F.R.; Assad, E.D.; Joly, C.A.; Metzger, J.P.; Strassburg, B.B.N.; Tabarelli, M.; Fonseca, G.A.; Mittermeier, R.A. From Hotspot to Hopespot: An Opportunity for the Brazilian Atlantic Forest. Perspect. Ecol. Conserv. 2018, 16, 208–214. [Google Scholar] [CrossRef]
  71. Aslan, C.; Beckman, N.G.; Rogers, H.S.; Bronstein, J.; Zurell, D.; Hartig, F.; Shea, K.; Pejchar, L.; Neubert, M.; Poulsen, J.; et al. Employing Plant Functional Groups to Advance Seed Dispersal Ecology and Conservation. AoB Plants 2019, 11, plz006. [Google Scholar] [CrossRef] [PubMed]
  72. Chazdon, R. Regeneração de Florestas Tropicais Tropical Forest Regeneration. Bol. Mus. Para. Emílio Goeldi-Ciências Nat. 2012, 7, 195–218. [Google Scholar] [CrossRef]
  73. Carvalho, P.E.R. Cupiúva: Tapirira guianensis. In Espécies Arbóreas Brasileiras; Embrapa Informação Tecnológica: Brasília, Brazil; Embrapa Florestas: Colombo, Brazil, 2006; pp. 189–198. [Google Scholar]
  74. León, M.L.V. Macrolobium latifolium (Fabaceae). In Lista Vermelha Da Flora Brasileira; Centro Nacional de Conservação Da Flora; Instituto de Pesquisas Jardim Botânico Do Rio de Janeiro: Rio de Janeiro, Brazil, 2020. Available online: https://proflora.jbrj.gov.br/html/Macrolobium latifolium_2020.html (accessed on 19 May 2022).
  75. Seng, V.; Bell, R.W.; Willett, I.R. Effect of Lime and Flooding on Phosphorus Availability and Rice Growth on Two Acidic Lowland Soils. Commun. Soil Sci. Plant Anal. 2006, 37, 313–336. [Google Scholar] [CrossRef]
  76. Martins, S.V. Potencial de Regeneração Natural de Florestas Nativas Nas Diferentes Regiões do Estado do Espírito Santo; Vitória, CEDAGRO: Vitória, Brazil, 2014.
  77. Barbosa, M.R.; Souza, L.M.; de Souza, R.A.; Houllou, L.M. Aspectos Aspects of the In Vitro Establishment of Handroanthus Chrysotrichus (Bignoniaceae) for the Production of Seedlings. Braz. J. Dev. 2020, 6, 2830–2840. [Google Scholar] [CrossRef]
  78. Costa, M.B. Sucessão Ecológica Pós-Fogo Em Fragmentos de Mata Atlântica Sobre Tabuleiros Costeiros No Sudeste Do Brasil. Master’s Thesis, Universidade Federal do Espírito Santo, São Mateus, Brazil, 2014; p. 111. [Google Scholar]
  79. Rolim, S.G.; Peixoto, A.L.; Pereira, O.J.; de Araujo, D.S.D.; Siqueira, G.; de Menezes, L.F.T. Angiospermas da Reserva Natural Vale, na Floresta Atlântica do Norte do Espírito Santo. In Floresta Atlântica de Tabuleiro: Diversidade e Endemismos na Reserva Natural Vale; Rolim, S.G., de Menezes, L.F.T., Srbek-Araujo, A.C., Eds.; Rupestre: Belo Horizonte, Brazil, 2016; pp. 167–230. [Google Scholar]
  80. Archanjo, K.M.P.d.A.; da Silva, G.F.; Chichorro, J.F.; Soares, C.P.B. Structure of the Arboreal Component of Cafundó Natural Heritage Private Reserve, Cachoeiro de Itapemirim, Espírito Santo, Brazil. Floresta 2012, 42, 145–160. [Google Scholar] [CrossRef]
  81. Jardim Botânico do Rio de Janeiro Quararibea in Flora Do Brasil 2020 Em Construção. Available online: https://floradobrasil2020.jbrj.gov.br/FB16495 (accessed on 14 March 2023).
  82. Ribeiro, M.; Peixoto, A.L.; Pereira, O.J.; De Menezes, L.F.T. Tabuleiro Forest in Southeast Brazil: Exploring the Neglected Diversity of a Forest Fragment. Pesqui. Botânica 2022, 76, 149–191. [Google Scholar]
  83. Garbin, M.L.; Saiter, F.Z.; Carrijo, T.T.; Peixoto, A.L. Breve Histórico e Classificação Da Vegetação Capixaba. Rodriguésia 2017, 68, 1883–1894. [Google Scholar] [CrossRef]
  84. Barros, M.F.; Ribeiro, E.M.S.; Vanderlei, R.S.; de Paula, A.S.; Silva, A.B.; Wirth, R.; Cianciaruso, M.V.; Tabarelli, M. Resprouting Drives Successional Pathways and the Resilience of Caatinga Dry Forest in Human-Modified Landscapes. For. Ecol. Manag. 2021, 482, 118881. [Google Scholar] [CrossRef]
  85. Dente, D.H.; Estrada-Villegas, S. Uniting Niche Differentiation and Dispersal Limitation Predicts Tropical Forest Succession. Trends Ecol. Evol. 2021, 36, 700–708. [Google Scholar] [CrossRef] [PubMed]
  86. Dias, P.B.; Gomes, L.P.; Callegaro, R.M.; Carvalho, F.A.; Dias, H.M. Structural and Environmental Variability from the Edge to the Interior of an Atlantic Forest Remnant in Brazil. J. Trop. For. Sci. 2021, 33, 308–332. [Google Scholar] [CrossRef]
  87. Tilman, D. Plant Strategies and the Dynamics and Structure of Plant Communities; Princeton University Press: Princeton, NJ, USA, 1988. [Google Scholar]
Figure 3. The configuration of sampling units for natural regeneration. Adapted from [38].
Forests 16 01169 g003
Figure 4. The sampling configuration for the hemispherical photographs in the plots.
Forests 16 01169 g004
Figure 5. Results of the redundancy analysis between successional and environmental data from the tree stratum of three fragments of Lowland Rainforest in northern Espírito Santo. Environmental data: Ca = calcium; CTC.t. = effective cation exchange capacity; Cu = copper; K = potassium; Light = canopy openness index; Mg = magnesium; Mn = manganese; sand; silt; and argil. Successional data: Ane = anemochoric; Auto = autochoric; Zoo = zoochoric; PI = pioneer; SI = early secondary; ST = Late secondary; P = filling functional species; D = functional diversity species.
Forests 16 01169 g005
Figure 6. Results of the redundancy analysis between successional and environmental data from the regenerating stratum of three fragments of Lowland Rainforest in northern Espírito Santo. Environmental data: Al = aluminum; Ca = calcium; Cu = copper; K = potassium; M.0. = organic matter; Na = sodium; P = phosphorus; V = base saturation; and argil. Successional data: Ane = anemochoric; Auto = autochoric; Zoo = zoochoric; PI = pioneer; SI = early secondary; ST = late secondary; F = filling functional species; D = functional diversity species.
Forests 16 01169 g006
Figure 7. Results of the redundancy analysis between species composition and environmental data from the tree stratum of three fragments of Lowland Rainforest in northern Espírito Santo. Environmental data: Ca = calcium; CTC.t. = effective cation exchange capacity; Cu = copper; K = potassium; Light = canopy openness index; Mg = magnesium; Mn = manganese; sand; silt; and argil. Species composition data: Ast = Astronium concinnum; Bra = Brasiliocroton mamoninha; Cas = Casearia commersoniana; Cen = Centrolobium tomentosum; Cup = Cupania racemosa; Eri = Eriotheca macrophylla; Gua = Guapira opposita; Han = Handroanthus chrysotrichus; Ing = Inga subnuda; Lon = Lonchocarpus cultratus; Mac = Macrolobium latifolium; Myr = Myrcia splendens; Pro = Protium heptaphyllum subsp. heptaphyllum; Pte = Pterocarpus violaceus; Rin = Rinorea bahiensis; Sen = Senefeldera verticillate; Tap = Tapirira guianensis; Vis = Vismia brasiliensis; Xyl = Xylopia frutescens.
Forests 16 01169 g007
Figure 8. Results of the redundancy analysis between species composition and environmental data from the regenerating stratum of three fragments of Lowland Rainforest in northern Espírito Santo. Environmental data: Al = aluminum; Ca = calcium; Cu = copper; K = potassium; M.0. = organic matter; Na = sodium; P = phosphorus; V = base saturation; and argil. Species composition data: Adev = Adenocalymma valida; Anna = Annona acutiflora; Apac = Aparisthmium cordatum; Casc = Casearia commersoniana; Clai = Clarisia ilicifolia; Cort = Cordia taguahyensis; Cupr = Cupania racemosa; Diag = Dialium guianense; Esco = Eschweilera ovata; Euge = Eugenia excelsa; Eugi = Eugenia inversa; Eugm = Eugenia melanogyna; Eugpi = Eugenia pisiformis; Eugpl = Eugenia platyphylla; Hanc = Handroanthus chrysotrichus; Macl = Macrolobium latifolium; Myrs = Myrcia splendens; Quap = Quararibea penduliflora; Ssvc = Swartzia simplex var. continentalis; Tlss = Trichilia lepidota subsp. schumanniana; Xylf = Xylopia frutescens.
Forests 16 01169 g008
Figure 9. Results of the tree principal component analysis (PCA) for the three study areas.
Forests 16 01169 g009
Figure 10. Linear regression between axis 1 of the successional PCA and axis 1 of the environmental PCA for the tree stratum of the three fragments of Lowland Rainforest in northern Espírito Santo, Brazil.
Forests 16 01169 g010
Figure 11. Linear regression between axis 1 of the species composition PCA and axis 1 of the environmental PCA for the tree stratum of the three fragments of Lowland Rainforest in northern Espírito Santo, Brazil.
Forests 16 01169 g011
Table 1. Results for the Shannon diversity index (H), Pielou’s evenness (J), number of individuals, families, and species for the tree and regenerating strata.
StratumF1F2F3
Tree---
Total number of individuals545710495
Shannon index3.632.684.49
Pielou’s evenness index0.800.660.89
Total families293642
Total species8455149
Regeneration---
Total number of individuals137448282
Shannon index3.452.754.07
Pielou’s evenness index0.950.870.98
Total families252229
Total species403783
Disclaimer/Publisher’s Note: The statements, opinions and data contained in all publications are solely those of the individual author(s) and contributor(s) and not of MDPI and/or the editor(s). MDPI and/or the editor(s) disclaim responsibility for any injury to people or property resulting from any ideas, methods, instructions or products referred to in the content.