1. Introduction
Mangroves are among the most productive and carbon-dense ecosystems globally. Their role in the carbon cycle has gained increasing importance, especially in the context of global climate change. Through efficient photosynthesis and organic carbon deposition, mangroves capture atmospheric carbon dioxide and regulate the global carbon balance by storing carbon over the long term [
1]. As a key “blue carbon” ecosystem, mangrove carbon sequestration plays a critical role in mitigating climate change [
2]. Studies show that mangroves can store carbon at rates per unit area three to five times higher than those of terrestrial forests [
3,
4,
5]. Therefore, the protection and restoration of mangroves are vital strategies for reducing greenhouse gas emissions and combating climate change [
6].
However, mangroves face significant ecological threats, not only from direct human activities such as urban expansion and agricultural reclamation, but also from the increasing frequency of extreme climate events [
7,
8]. Typhoons, storm surges, and rising sea levels, driven by climate change, have become major factors affecting the growth, structure, and carbon stocks of mangrove ecosystems [
9,
10]. Typhoons, in particular, are common natural disasters in tropical regions, with characteristics such as strong winds, heavy rainfall, and high-water levels that severely impact mangrove structure and functions [
11]. The rising frequency and intensity of typhoons pose a long-term threat to mangrove carbon stocks. For example, the super typhoon that hit Haikou City, Hainan Province, in 2024 caused significant mangrove mortality [
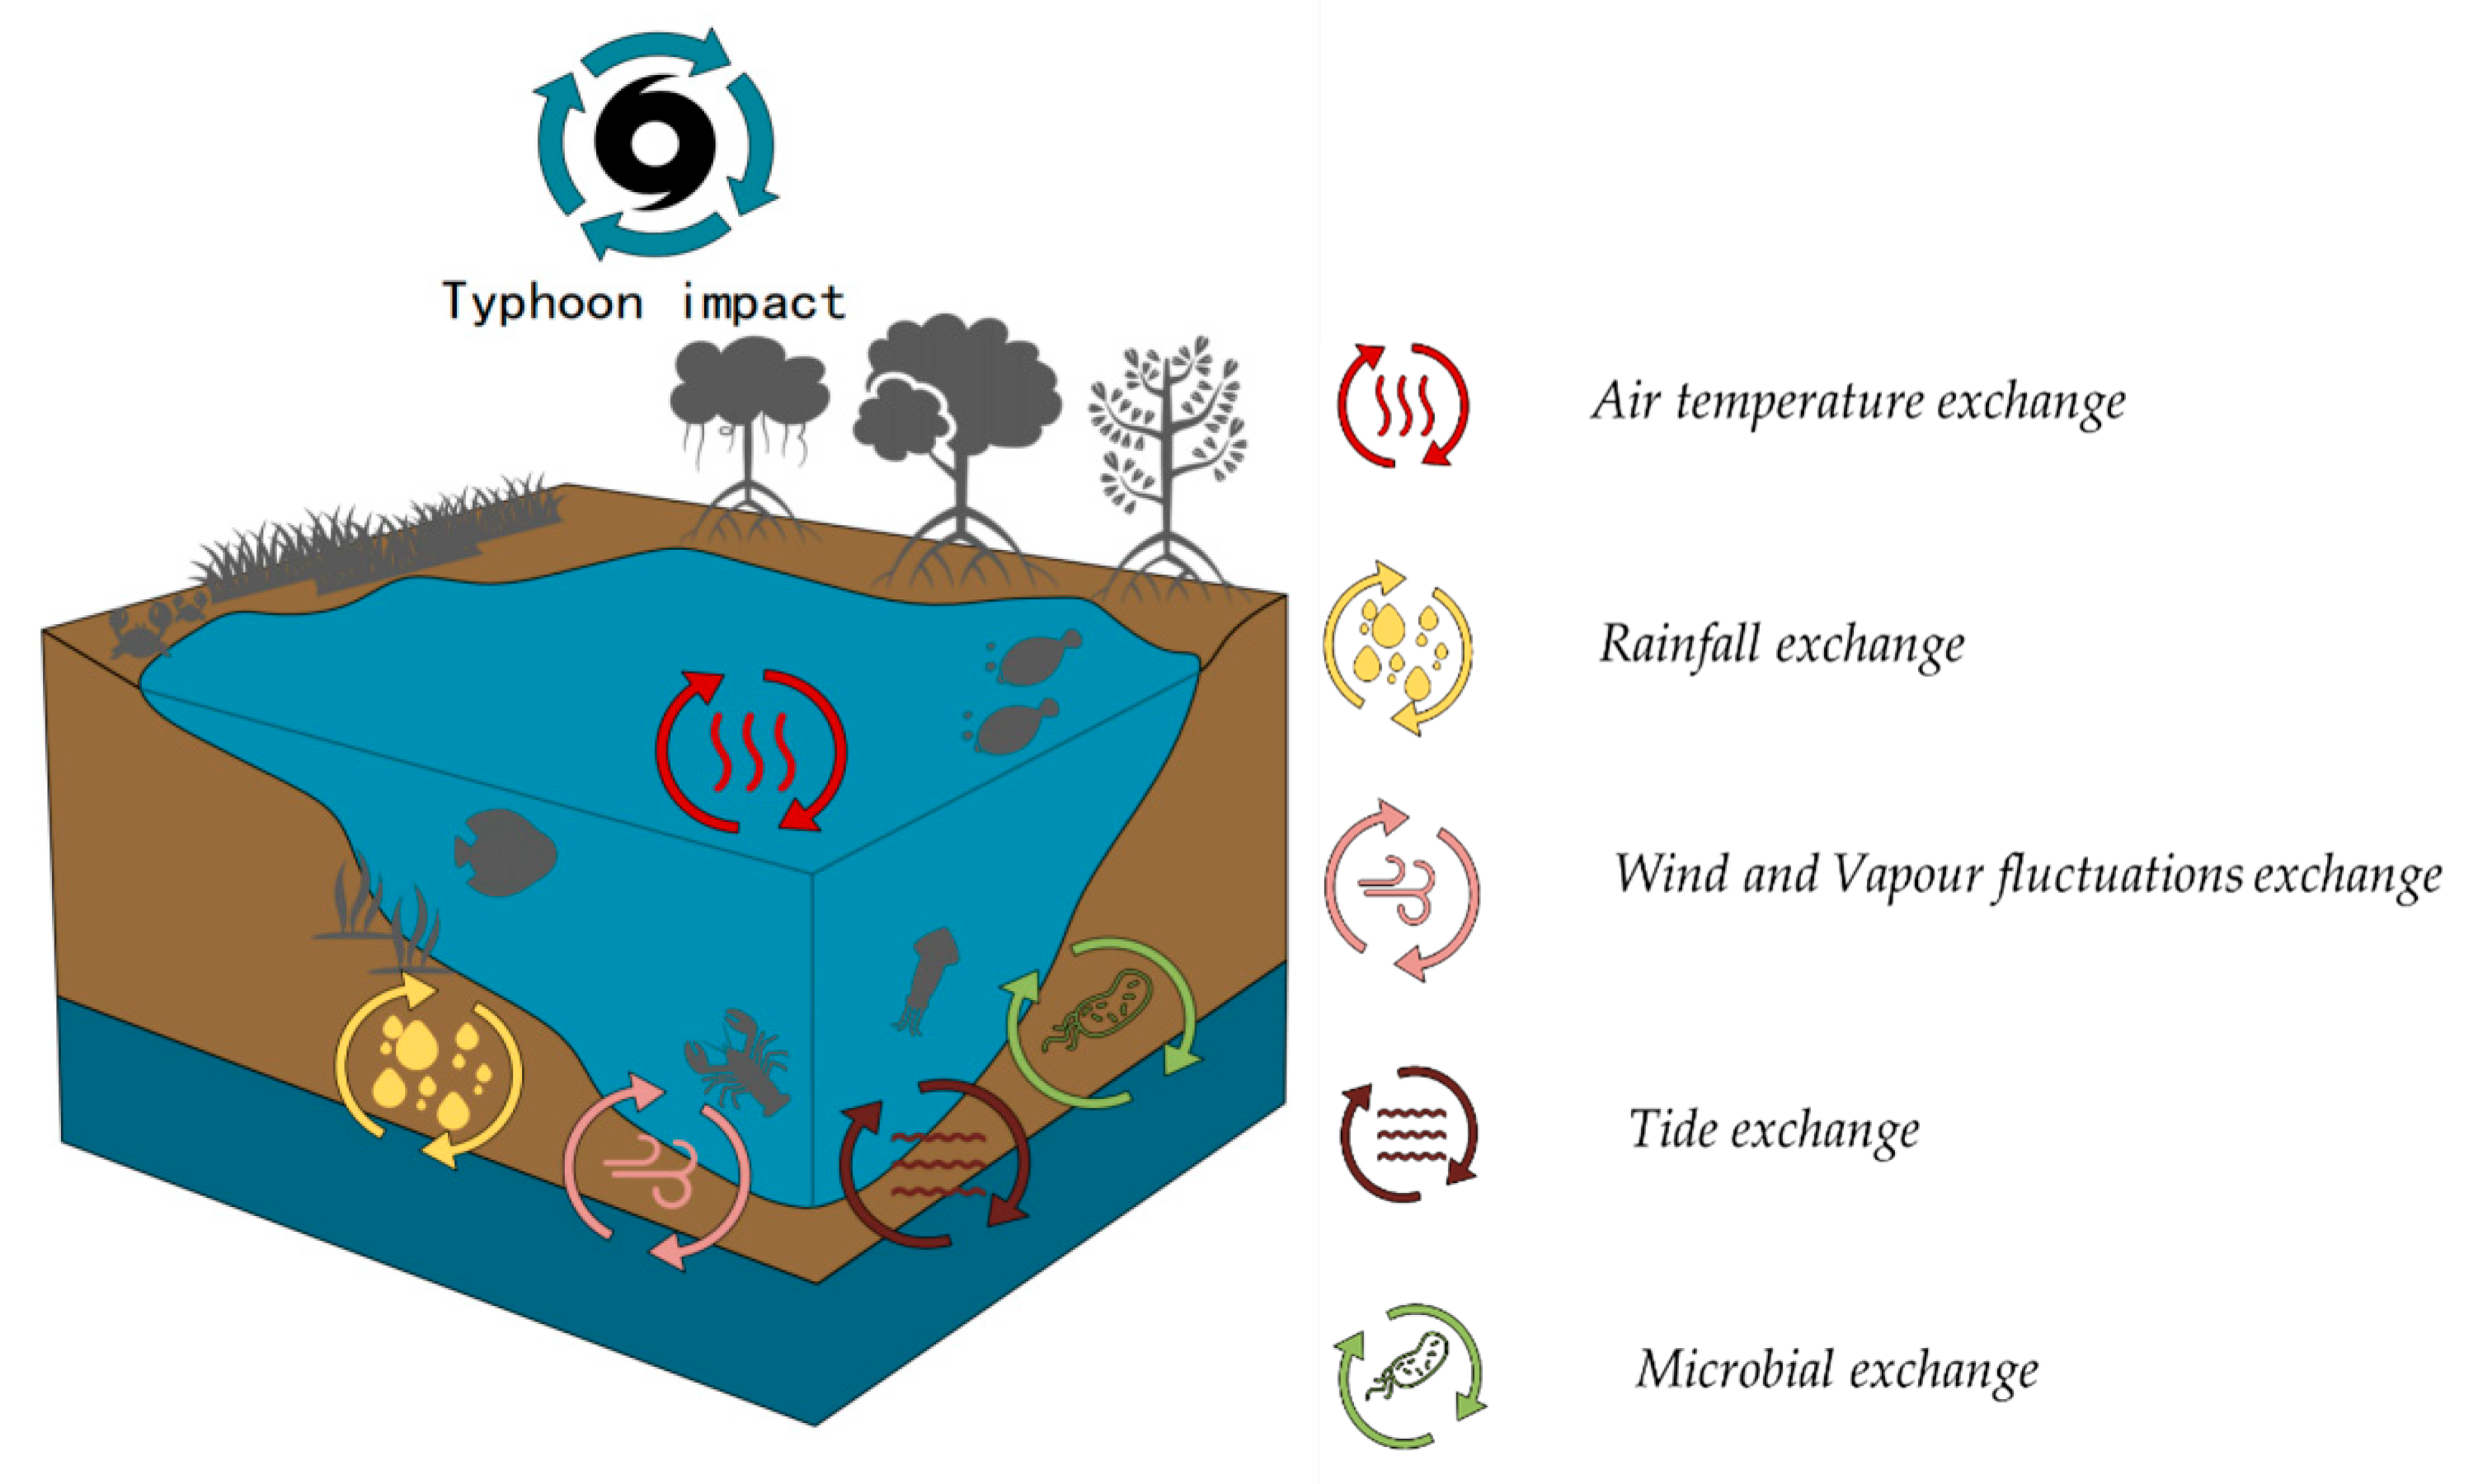
12]. While mangroves possess natural recovery mechanisms, their recovery capacity and the speed at which carbon stocks are restored are influenced by various factors, including wind speed, air temperature, and tide levels [
13], as well as the age and restoration status of the mangrove communities (
Figure 1).
Typhoons damage mangrove growth, root structures, and soil carbon stocks through strong winds, heavy rainfall, and seawater erosion [
11]. Following a typhoon, changes in species composition, community structure, and ecological functions can be significant. For example, typhoons can uproot or kill many mangrove trees, leading to a reduction in carbon storage [
14]. Additionally, soil erosion and changes in salinity can alter growth conditions, further affecting long-term carbon accumulation [
15]. Some studies suggest that the impact of typhoons on mangrove carbon stocks varies spatially and temporally, with different regions and ecosystem types experiencing different degrees of impact [
16].
The restoration age of mangroves is a critical factor in their recovery from disturbances. As mangrove communities recover, their plant biomass and soil carbon stocks gradually accumulate [
17]. However, the restoration age significantly influences a community’s ability to recover from extreme events like typhoons. Younger mangrove communities, with slower growth rates and lower biomass, tend to have weaker carbon stock recovery following disasters [
1]. In contrast, mature mangrove communities, with more developed root systems and higher biodiversity, recover more quickly and maintain higher carbon stocks after a typhoon [
18,
19]. Therefore, the restoration age plays a key role in determining the stability of the carbon sink function and the resilience of mangroves during disturbances like typhoons. Understanding carbon stock changes in mangrove communities at different restoration ages is crucial for evaluating the ecological resilience of mangroves under climate change.
While research on the carbon sink function of mangroves has increased, there is a growing need for more comprehensive studies on soil organic carbon (SOC) content under mangrove covers, particularly under the stress of extreme climate events like typhoons [
20,
21]. Soil organic carbon in mangrove ecosystems is critical as it not only reflects the long-term carbon sequestration capacity of these environments but also plays a vital role in ecosystem functions such as soil fertility, water retention, and nutrient cycling [
20]. Recent studies indicate that SOC stocks in mangrove soils are highly sensitive to environmental disturbances, including temperature fluctuations, salinity changes, and increased storm frequency [
21]. Moreover, studies have shown that mangroves exhibit different SOC storage potentials depending on their age, with younger mangrove ecosystems storing less SOC due to slower accumulation rates, while mature ecosystems tend to sequester more carbon due to the larger root biomass and more established soil organic matter dynamics [
22,
23]. However, limited studies focus on the recovery of SOC stocks following typhoon-induced disturbances, leaving a significant gap in our understanding of the long-term impact of such extreme events on SOC cycling and stability in mangrove ecosystems [
22,
23,
24,
25].
Additionally, there is a lack of standardized methodologies to quantify SOC content across different mangrove restoration ages, as various ecological and climatic factors influence the SOC storage potential differently at various stages of mangrove restoration [
5,
6,
26]. Further research is needed to establish more precise models that account for both natural and anthropogenic factors affecting SOC dynamics in mangroves, especially during recovery phases after a disturbance [
27]. This gap underscores the need for studies that specifically investigate SOC responses to climatic extremes and its interplay with mangrove resilience [
28].
While some studies suggest that mature mangrove communities exhibit stronger resilience to disasters, the specific mechanisms by which mangroves of different ages respond to extreme events remain unclear [
29]. Additionally, there is a lack of data and theoretical frameworks in this area. Therefore, exploring how carbon stocks, recovery pathways, and carbon sink functions of mangroves at varying restoration ages are affected by typhoon disturbances is an urgent scientific issue [
28,
29,
30].
The Tielu Port mangrove area in Haitang Bay, Sanya City, Hainan Province, China, has undergone significant anthropogenic disturbances, including large-scale mangrove deforestation for fish and shrimp pond construction. Despite this degradation, some natural mangrove forests remain, offering an opportunity for restoration. In 2012, the Sanya City government began artificial mangrove restoration efforts in several regions, based on geographical location, area, and local environmental conditions. These restoration activities were carried out over different time periods, resulting in varying restoration ages. The restoration age of each area was determined by the time elapsed since the initiation of artificial restoration. The study area has also experienced natural disasters, including typhoons. The frequency and severity of typhoons vary across restoration zones, leading to differences in the extent of damage. Some regions were affected by typhoons earlier than others, resulting in uneven damage across different restoration ages.
This study aims to investigate the impact of typhoon disturbances on the carbon stocks of mangrove communities at different restoration ages and assess their ability to recover carbon stocks during extreme climate events. The specific objectives are (1) to analyze the changes in carbon stocks of mangrove communities before and after typhoons, comparing carbon stock loss and recovery rates; (2) to examine the influence of restoration age on mangrove resilience and recovery ability, and explore differences in carbon sink function across mangroves of varying ages; (3) to identify how factors such as wind speed, rainfall, and tidal changes impact mangrove carbon stocks. This research will deepen the understanding of the effects of extreme climate events on mangrove carbon stocks and their recovery, providing practical guidance for mangrove restoration and management. In the context of climate change and increasing natural disasters, the study will provide scientific support for optimizing mangrove restoration strategies, enhancing carbon sink functions, and promoting the use of mangroves as tools for climate change mitigation and adaptation.
2. Materials and Methods
2.1. Experimental Sites
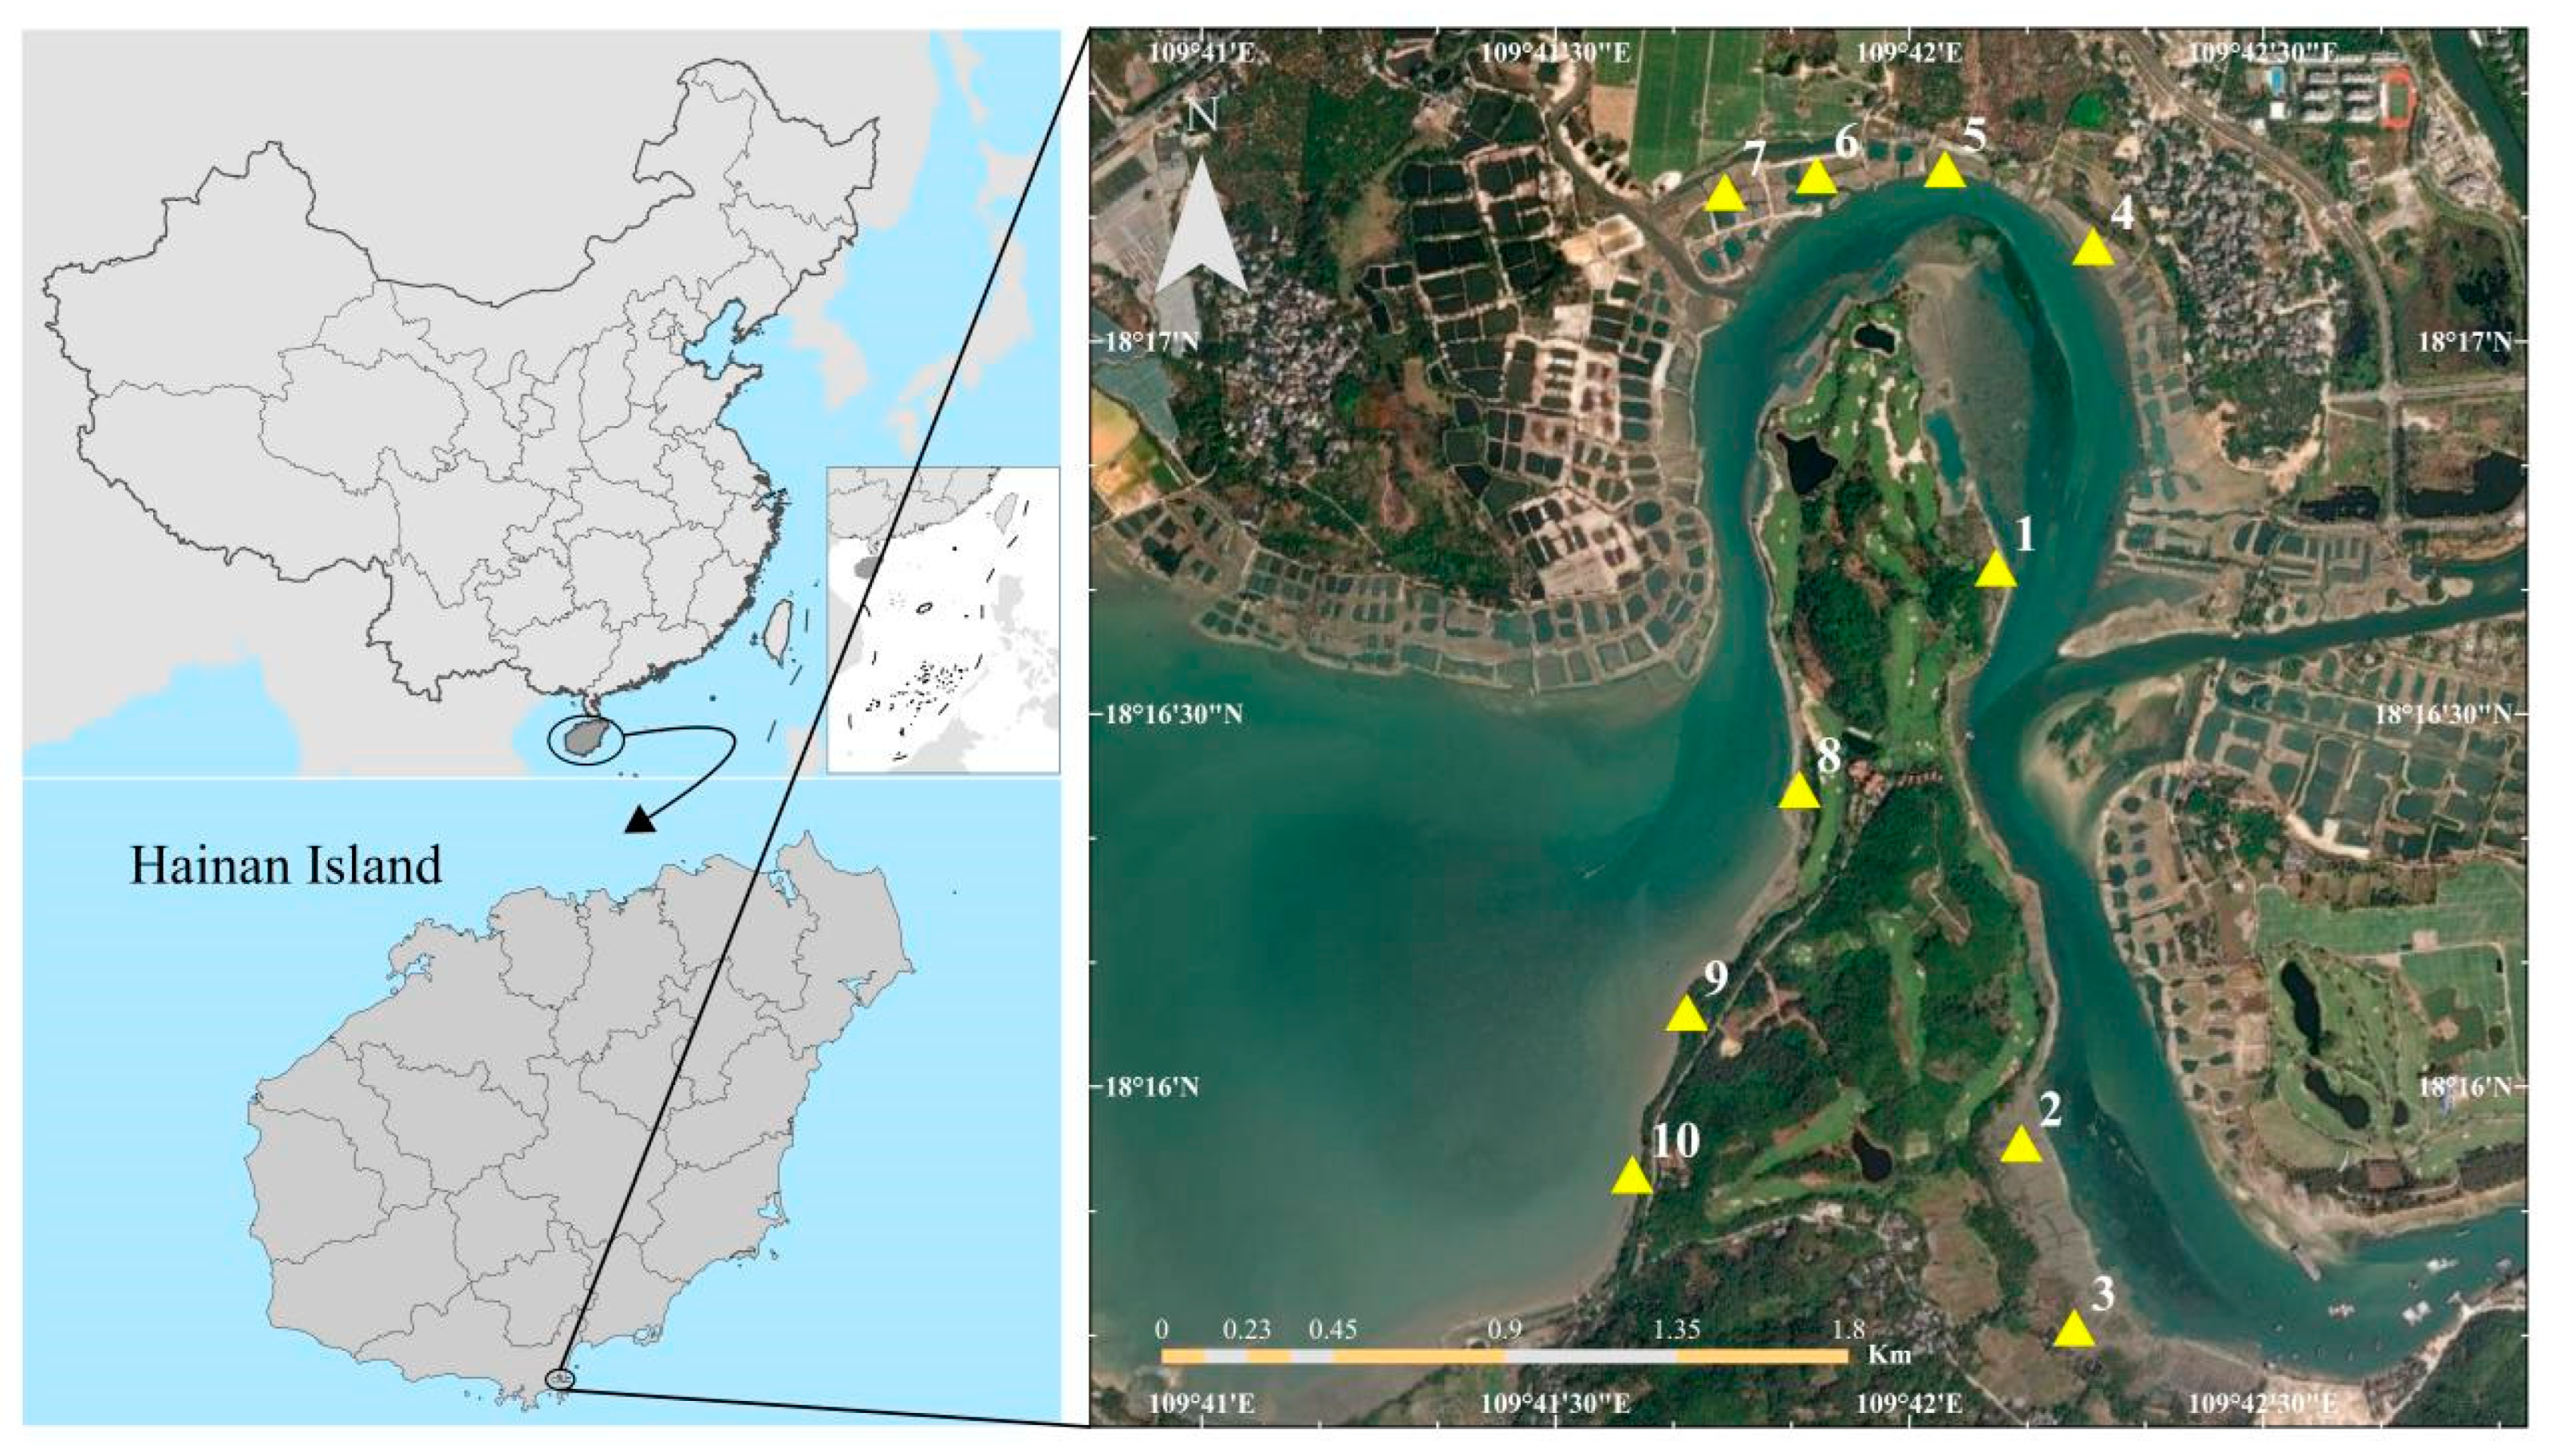
The study site is located in a typical tropical mangrove area of Hainan Province in southern China (109°41′56″ E, 18°17′15″ N) (
Figure 2). We have installed small weather stations and other instruments related to measuring environmental factors, which can measure the local environment (
Figure 1 and
Table 1). The average annual temperature is 23.8 °C, with a mean monthly maximum temperature of 28.4 °C in July and a mean monthly minimum temperature of 16.9 °C in January. The annual precipitation is 1431.2 mm, and it is mostly concentrated from May to October. The annual average rain period is 85–110 days. In this region, the annual total sunshine hours are 5.9 h per day, and the annual UV index range is 10.9 in the region (
Figure 3). Hainan Province is a province in China with a relatively high frequency of typhoons, with at least 3–7 typhoons every year [
22].
The total area of Tielugang in Sanya is 7.9 hectares, and the average age of the local ancient mangrove trees are about 100 years old. According to the results of the 2022 plot survey, although the total area of mangroves in Sanya only accounts for 2.6% of the provincial total, it carries the richest resources of ancient mangrove trees. The native mangroves in Tielugang have been designated as a “Protected Area for Ancient Mangroves”. Despite its relatively small area of 4.3 km2, it is home to over 100 ancient mangrove trees, including 9 specimens of the national first-class protected plant, the red-leaved mangrove (Kandelia candel), 20 specimens of the second-class protected plant, Blackfruit Terminalia (Terminalia catappa), and many other precious species such as true mangrove, olive mangrove, wood mangrove, and sea lotus. These ancient trees play a crucial role in the ecosystem, providing habitats for marine life, mitigating storm surges, promoting sediment accumulation, and coastal protection, while also purifying the atmosphere and marine environment and maintaining the coastal landscape.
Tielu Bay mangrove forest in Sanya City has been damaged and is currently in the recovery stage. Due to human destruction, the area of the remaining native mangroves in Tielu Bay is less than 4 km2. At present, mangrove restoration has been carried out in the area. The main part of the restoration area is dominated by native mangroves, which are in patches and clusters, accounting for 70% of the total area. The mangrove restoration area is dominated by Sonneratia apetala, Avicennia corniculatum, Avicennia marina, and Laguncularia racemosa L. Among them, Laguncularia racemosa L. accounts for 5% and is dominant locally, and Avicennia corniculatum is more scattered, accounting for 2% to 3%. As a research site located in the coastal region, the reserve is a typical mangrove ecosystem, covering a large area of mangrove forests. Most of the area in the Tielu Bay had previously been degraded due to aquaculture activities, and subsequent mangrove restoration efforts were carried out. Due to the nature of these restoration efforts, the ecological layers in most of the plots do not show distinct patterns, especially in mangrove plots of different restoration ages, where no obvious ecosystem stratification is observed.
The only shrub and herbaceous communities are found in the original mangrove plots, which include Sesuvium portulacastrum and Ipomoea pes-caprae. The presence of these plant communities reflects the preliminary results of mangrove ecosystem restoration and provides a basis for comparing the succession of plant communities across different restoration ages in this study.
The characteristics of this area are that there are a lot of ancient trees. Among the mangrove wetlands in China, the largest individuals of
Lumnitzera racemosa Willd.
Lumnitzera littorea (Jack) Voigt,
Xylocarpus granatum J. Koenig,
Bruguiera sexangula (Lour.) Poir., and
Bruguiera gymnorrhiza (L.)
Savigny are all distributed in this tidal flat. It is one of the oldest mangrove forests in China [
23]. The pH of the Ferralsols ranges from 4.5 to 5.5, while the pH of the Gleysols is between 4.5 and 5.0. The Ferralsols are heavier in texture, with a high content of clay and sand, and have a cation exchange capacity (CEC) of approximately 10–20 cmol/kg. The Gleysols have a higher CEC, typically between 20–30 cmol/kg. The Gleysols has a higher CEC, typically between 20 and 30 cmol/kg. The sediment depth of mangrove wetlands is about 30–40 cm, with a top organic layer that is between 5 and 20 cm thick; furthermore, the sediment layer is a mixture of sandy clay, gravel, and an organic layer (
Table 1). A systematic sampling method was conducted because of the homogeneous distribution of the plant species in small sub-strata.
2.2. Meteorological Instrumentation
The experiment was conducted from 30 December 2022 to 30 December 2024, and details are provided in
Table 1. The instruments were mainly installed at an 8 m height flux tower. According to the weather observation data of the weather station and the observation data of surface temperature data below the flux tower, the entire period was divided into two stages: rainfall season period and dry season period. Additionally, atmospheric pressure data were obtained from the nearby Tielu Bay Forest Ecosystem Research Station. The dry season period was from 21 November 2023 to 28 April 2024; the rainfall season period and the dry season period was from 1 May 2024 to 28 March 2025. In addition, there were two rainfall events during the dry season period.The instruments and equipment in the sample plot are shown in
Table 2.
2.3. Selection of Study Sites
Three mangrove sites were selected based on their different restoration ages: Site No. 5–7 (young mangrove, restoration age of 1–5 years), Site No. 8–10 (moderately restored mangrove, restoration age of 5–10 years), and Site No. 1–3 (mature mangrove, restoration age of 10+ years). Site 4 is bare land without any plant cover (
Figure 2). The carbon storage of the mangrove ecosystem is estimated by a two-step method: after each typhoon, sampling is carried out once on the third day after the typhoon.
2.4. Field Sampling
Field sampling was carried out both before and after a typhoon event to capture the full scope of its impact on mangrove carbon stocks. The methods described below were employed.
2.4.1. Vegetation Survey
A series of permanent plots (each measuring 20 m2) was established in each study site. Within each plot, the species composition, tree height, and diameter at breast height (DBH) of all mangrove trees were recorded. In each plot, a minimum of 20 individual trees were measured. Vegetation surveys were conducted during the pre-typhoon phase (30 days prior to the typhoon) and post-typhoon phase (30 days after the typhoon), to assess the direct effects on tree density, mortality, and growth.
2.4.2. Soil Carbon Stock Assessment
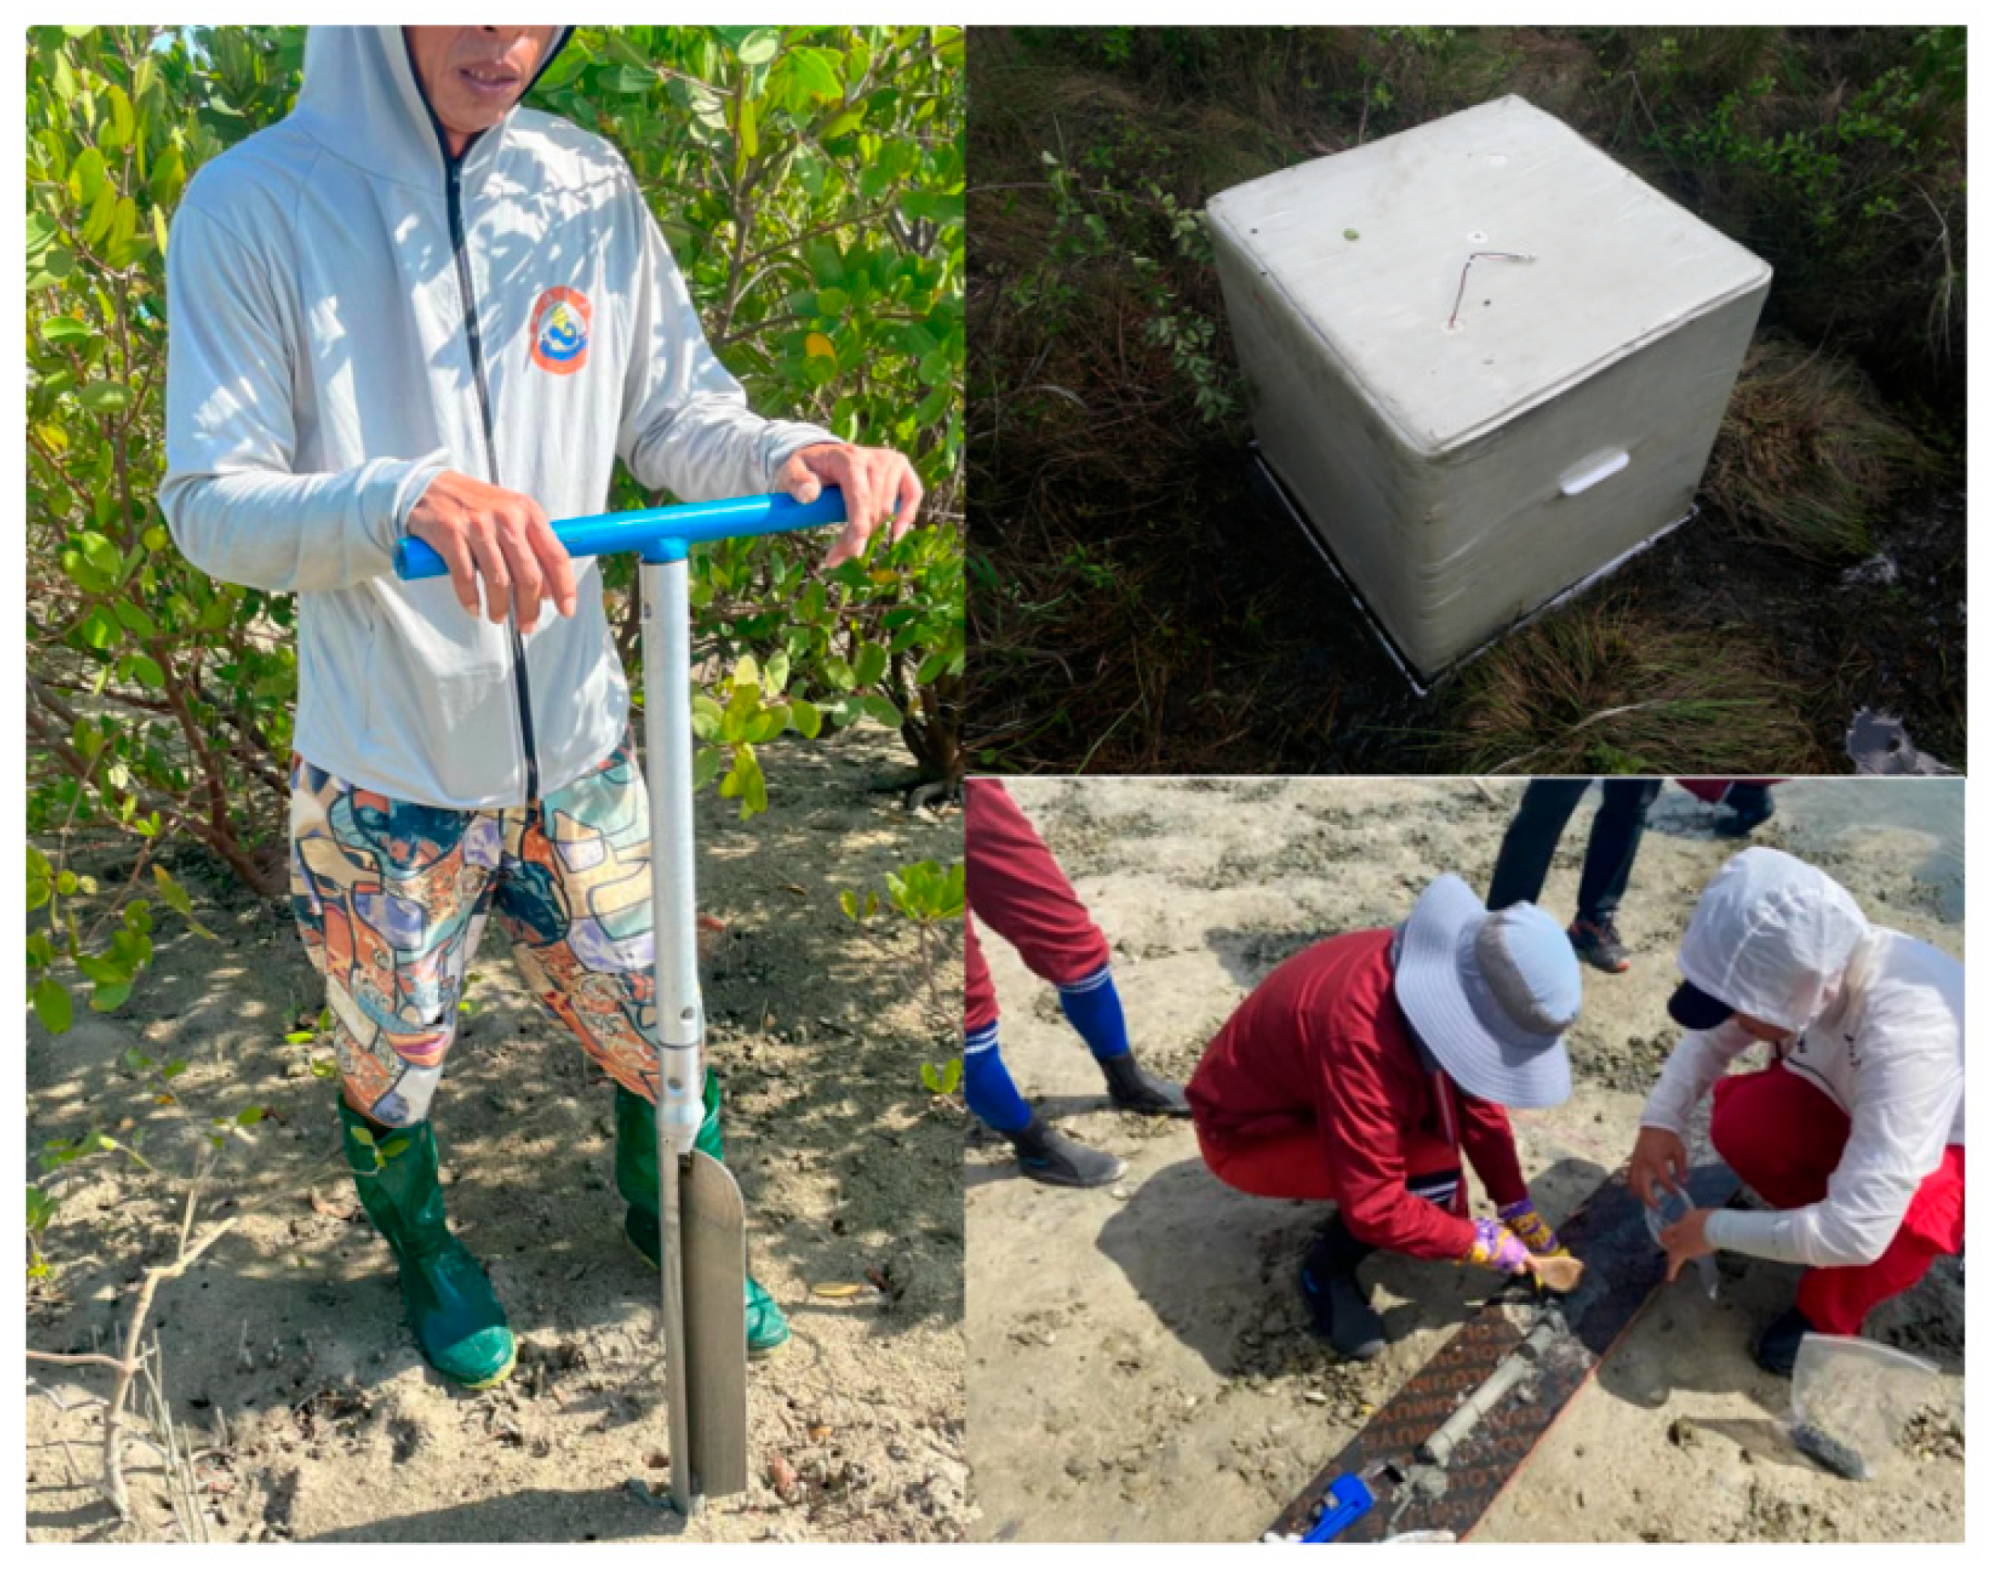
Soil samples were collected to a depth of 40 cm using a soil corer at 9 randomly selected points within each plot. During collection, the soil cores were sliced into sections at 5 cm depth intervals, with each section representing a different soil layer. Samples from each soil layer were sealed and stored, then analyzed in the laboratory. To measure the organic carbon content in the soil, we followed the method described by Ellert et al. [
24], which involves combusting the samples in a high-temperature furnace and then determining the organic carbon content. The soil carbon stock was calculated by measuring the bulk density of the soil in each plot (conducted in a subset of the plots), and multiplying the carbon content of each soil layer by the corresponding bulk density. The total carbon stock was obtained by summing the carbon stock across all depth intervals. In addition, measuring soil respiration carbon flux, we placed a static chamber in the sample plot and calculated the soil respiration rate based on changes in gas concentrations within the chamber (
Figure 3).
2.4.3. Hydrological Data
Water salinity and tidal height were monitored before and after the typhoon event using automated water level loggers and handheld refractometers for salinity measurements [
25]. These data were used to assess the impact of the typhoon’s storm surge and changes in salinity on the mangrove environment.
2.5. Typhoon Disturbance Parameters
Data regarding the typhoon event was obtained from the Sanya Meteorological Bureau. Key disturbance parameters, including maximum wind speed, rainfall intensity, and storm surge, were recorded. The specific typhoon event considered for this study was Typhoon Maliksi (31 May 2024–1 June 2024), Typhoon Yagi (30 August 2024–9 September 2024), and Typhoon Trami (27 October 2024–30 October 2024) and which occurred in 2024. These typhoons were chosen because of their significant impact on the study region, with wind speeds exceeding 21–89 km/h, rainfall of 568.4–722.8 mm, and storm surge levels reaching 3–6 m.
2.6. Carbon Stock Estimation
Soil carbon content was measured using the dry combustion method, which is a well-established technique in soil science. Briefly, soil samples were collected from different depths, air-dried, and ground. The carbon content was determined using an elementary analyzer, which measures the amount of CO2 released upon combustion at high temperatures. In our study, we modified the standard procedure by conducting the analysis on sub-samples from each depth at different time intervals to capture seasonal variations in soil carbon content. The carbon stock of the mangrove ecosystem was estimated using a two-step approach:
Aboveground Carbon Stock (AGC):
Aboveground biomass (AGB) was estimated using allometric equations specific to mangrove species in the study region. The general equation used for mangrove AGB estimation is:
where DBH is the diameter at breast height of the tree, and β
0 and β
1 are species-specific constants. The specific values for β
0 and β
1 used in this study are as follows: for
Avicennia marina, β
0 = 2.465 and β
1 = 0.696; for
Sonneratia apetala, β
0 = 0.034 and β
1 = 0.966; and for
Avicennia corniculatum, β
0 = 0.251 and β
1 = 2.46. These parameter values were obtained from the Technical Specification for Investigation and Assessment of Carbon Stocks in Blue Carbon Ecosystems: Mangroves (HY-T 0349-2022) [
31] of the People’s Republic of China. A subset of 20 trees of each species was measured for DBH at each site, and the biomass values were converted to carbon content using a carbon conversion factor of 0.47× biomass, as specified in the technical regulations for assessing carbon sequestration capacity of mangrove wetland ecosystems, China (DB 45/T 1230-2015) [
32].
2.7. Belowground Carbon Stock (BGC)
Belowground biomass (roots and soil organic matter) was estimated using root coring at specific points in the study sites. The root biomass of mangroves was quantified using allometric models specific to the region or derived from literature. The method for measuring mangrove root biomass follows the Technical Specification for Investigation and Assessment of Carbon Stocks in Blue Carbon Ecosystems: Mangroves (HY-T 0349-2022) [
31] published by China. The SOC analysis was performed using the dry combustion method. The belowground carbon stock was also analyzed through soil carbon content as described earlier [
16]. The total carbon stock (TCS) in the mangrove ecosystem was calculated by summing the aboveground and belowground carbon stocks:
2.8. CO2 Flux Observation
NEE (net exchange of CO
2) and
Reco (ecosystem respiration) were measured using a transparent box-infrared gas analyzer method [
24]. The transparent box was made of acrylic resin and had two specifications: 50 × 50 × 50 cm and 50 × 50 × 150 cm. When the plant height was high during the growing season, a tall box was used, and a short box was used during the non-growing season to reduce sampling errors caused by low greenhouse gas emission rates in winter. There was a sealable cylindrical opening on the top of the box, which could be connected to an infrared gas analyzer (LI-COR 7000 infrared gas analyzer, LI-COR Instruments, Lincoln, NE, USA). The side of the box was opened, and a steel pipe with an inner diameter of 2 mm and a sealable outer end passed through the box wall. The inside and outside of the box were connected during gas sampling to avoid the influence of the pressure difference between the inside and outside of the box on the CO
2 flux during observation. Before sampling, a stainless-steel base with a size of 50 × 50 × 20 cm was inserted into the marsh wetland soil by 20 cm. The base was placed in the experimental site for the entire growing season to ensure minimal disturbance to the vegetation and soil inside the base. NEE and
Reco observations were conducted at the following four time periods: 6:00–9:00, 9:00–12:00, 12:00–15:00, and 15:00–18:00; night observations were conducted at two time periods: 20:00–23:00 and 1:00–4:00. NEE was not observed in the two time periods at night, only
Reco was observed. During each observation, NEE was first observed in a light box under natural light. In order to avoid excessive temperature, rise in the box, each observation lasted for 60 s. Then the gas in the box was emptied, the light box was covered with a light shield, and
Reco was observed. The observation lasted for 60 s. During each 60-s observation, a data point was recorded every 10 s to calculate the CO
2 flux. In addition, the same number of research points were selected, and the plants above the ground were removed to observe
Rs (soil respiration). The observation time and frequency were the same as
Reco.
2.9. Analytical Techniques
The data were analyzed using SPSS 18. Descriptive statistics (mean, standard deviation) were calculated for all variables, including species composition, tree biomass, and carbon stocks. The impact of typhoon disturbance on carbon stocks was assessed using ANOVA to compare pre- and post-typhoon carbon stocks across the different restoration age sites. A multiple regression analysis was conducted to identify the key factors (e.g., storm surge, wind speed, salinity changes) that influenced carbon stock recovery. In addition, the relationship between restoration age and carbon stock recovery was examined using correlation analysis, with a focus on how mangroves of different restoration ages responded to the disturbance.
2.10. Limitations
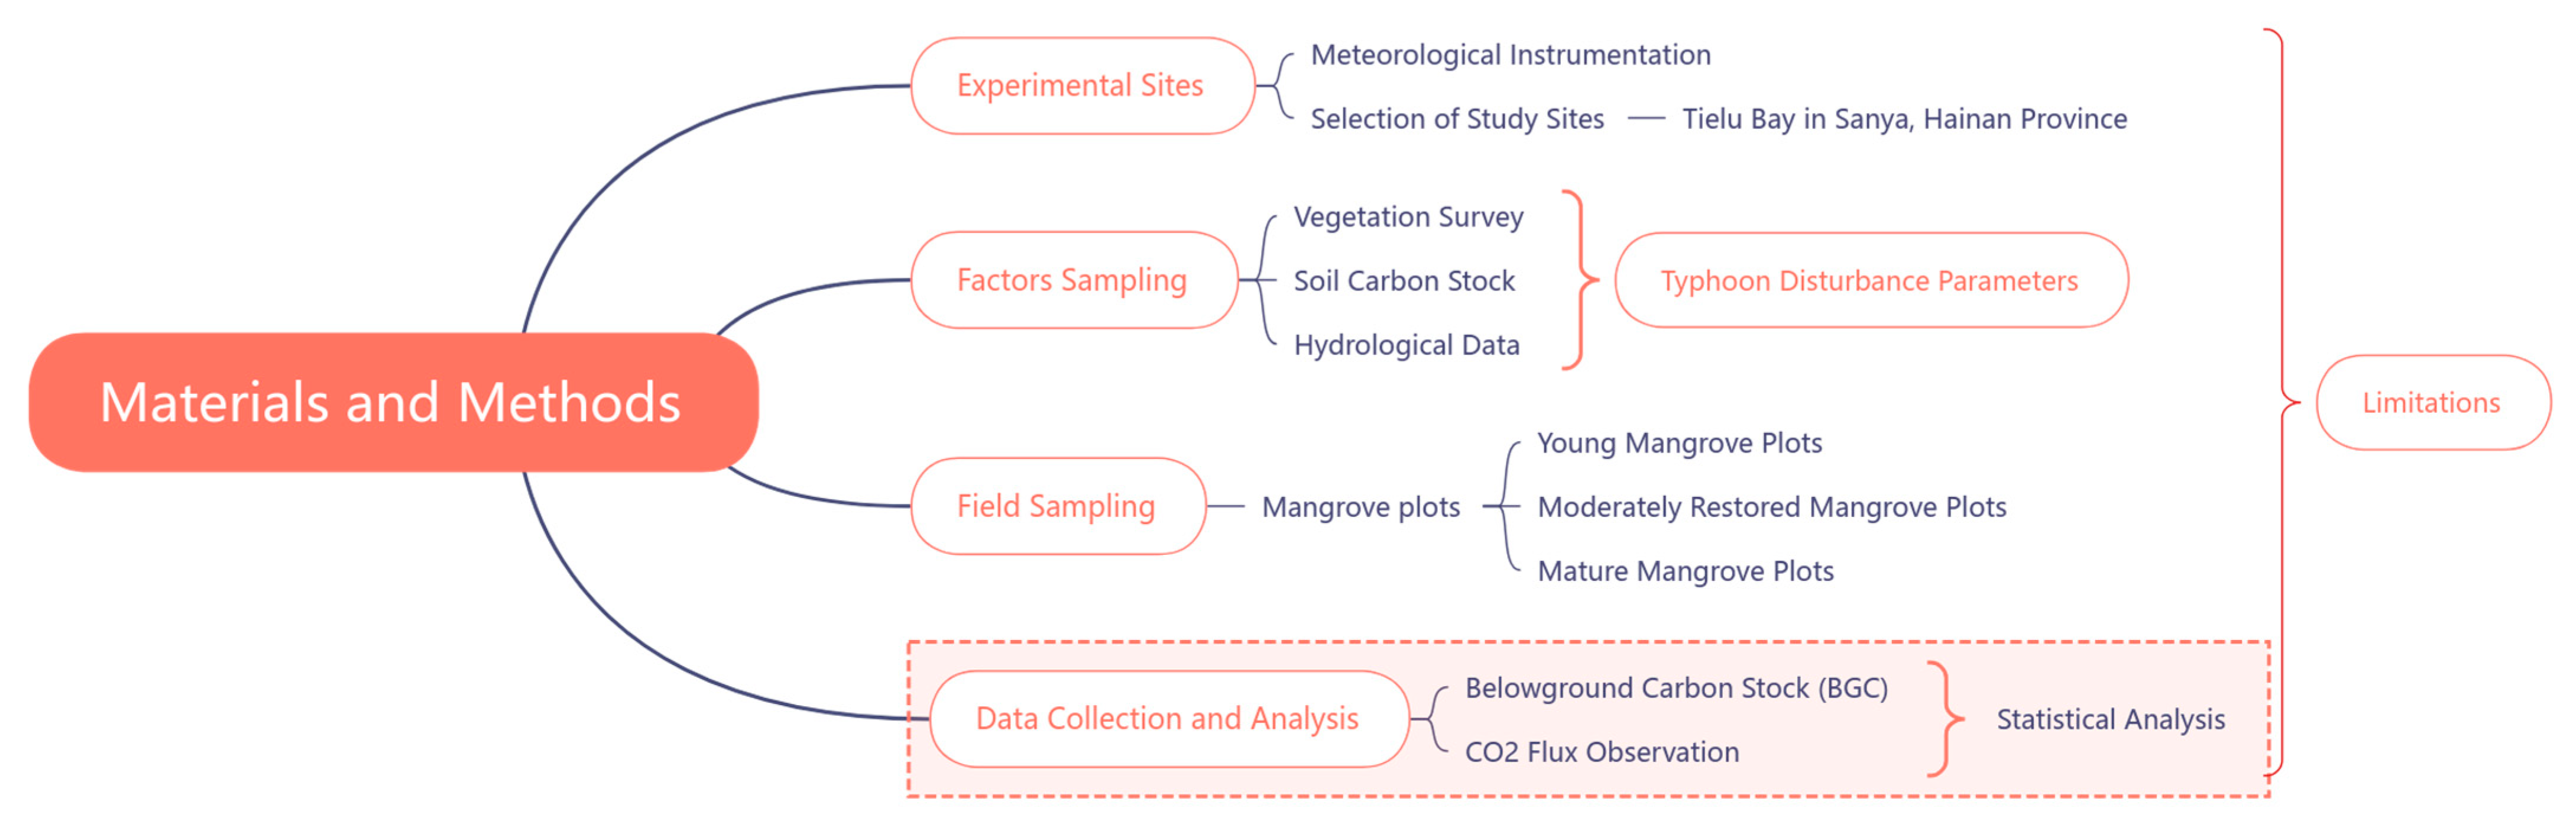
The study has several limitations that must be acknowledged. First, the data collected post-typhoon may not capture the full temporal extent of recovery, as long-term monitoring was not possible. Additionally, there may be site-specific variations that are not fully accounted for due to the spatial heterogeneity of mangrove ecosystems. The methods used to estimate carbon stock are based on standard models, but they may not fully reflect local variations in biomass density or soil carbon content. The overall road-map of the methodology is shown below (
Figure 4).
3. Results
3.1. Changes in Mangrove Species Composition and Vegetation Structure
Significant changes in species composition and vegetation structure were observed in mangrove communities after typhoon disturbances.
At the young mangrove site (recovery age 1–5 years), tree density significantly decreased following Typhoon Yagi. The number of live trees dropped by 29%–36%, with several young trees uprooted or severely damaged by strong winds and storm surges. Dominant species in younger mangrove communities, such as Avicennia marina and Avicennia corniculatum, were particularly vulnerable, with mortality rates of 33% and 36%, respectively. However, Sonneratia apetala exhibited better resistance to disturbance, showing minimal damage.
At the moderately restored mangrove site (recovery age 5–10 years), tree mortality was also high, though not as severe as at the young mangrove site. Overall density decreased by 9%–16%, with Sonneratia apetala showing the highest mortality rate (about 16%), while other species demonstrated moderate resilience. Some mature trees that survived Typhoon Yagi showed signs of regeneration, such as new shoots and leaves.
In contrast, at the mature mangrove site (recovery age 10+ years), the vegetation structure remained relatively stable post-typhoon. Although some mature trees were affected by storm surges and strong winds, the mortality rate was low (approximately 2%–5%). The recovery speed at this site was notably faster, with a higher proportion of surviving trees re-growing leaves within a month. The species composition remained similar to pre-typhoon conditions, and no significant changes in community structure were observed (
Figure 5), with a statistical probability level (
p-value) of 0.08 indicating that the observed changes were not statistically significant (
Figure 5).
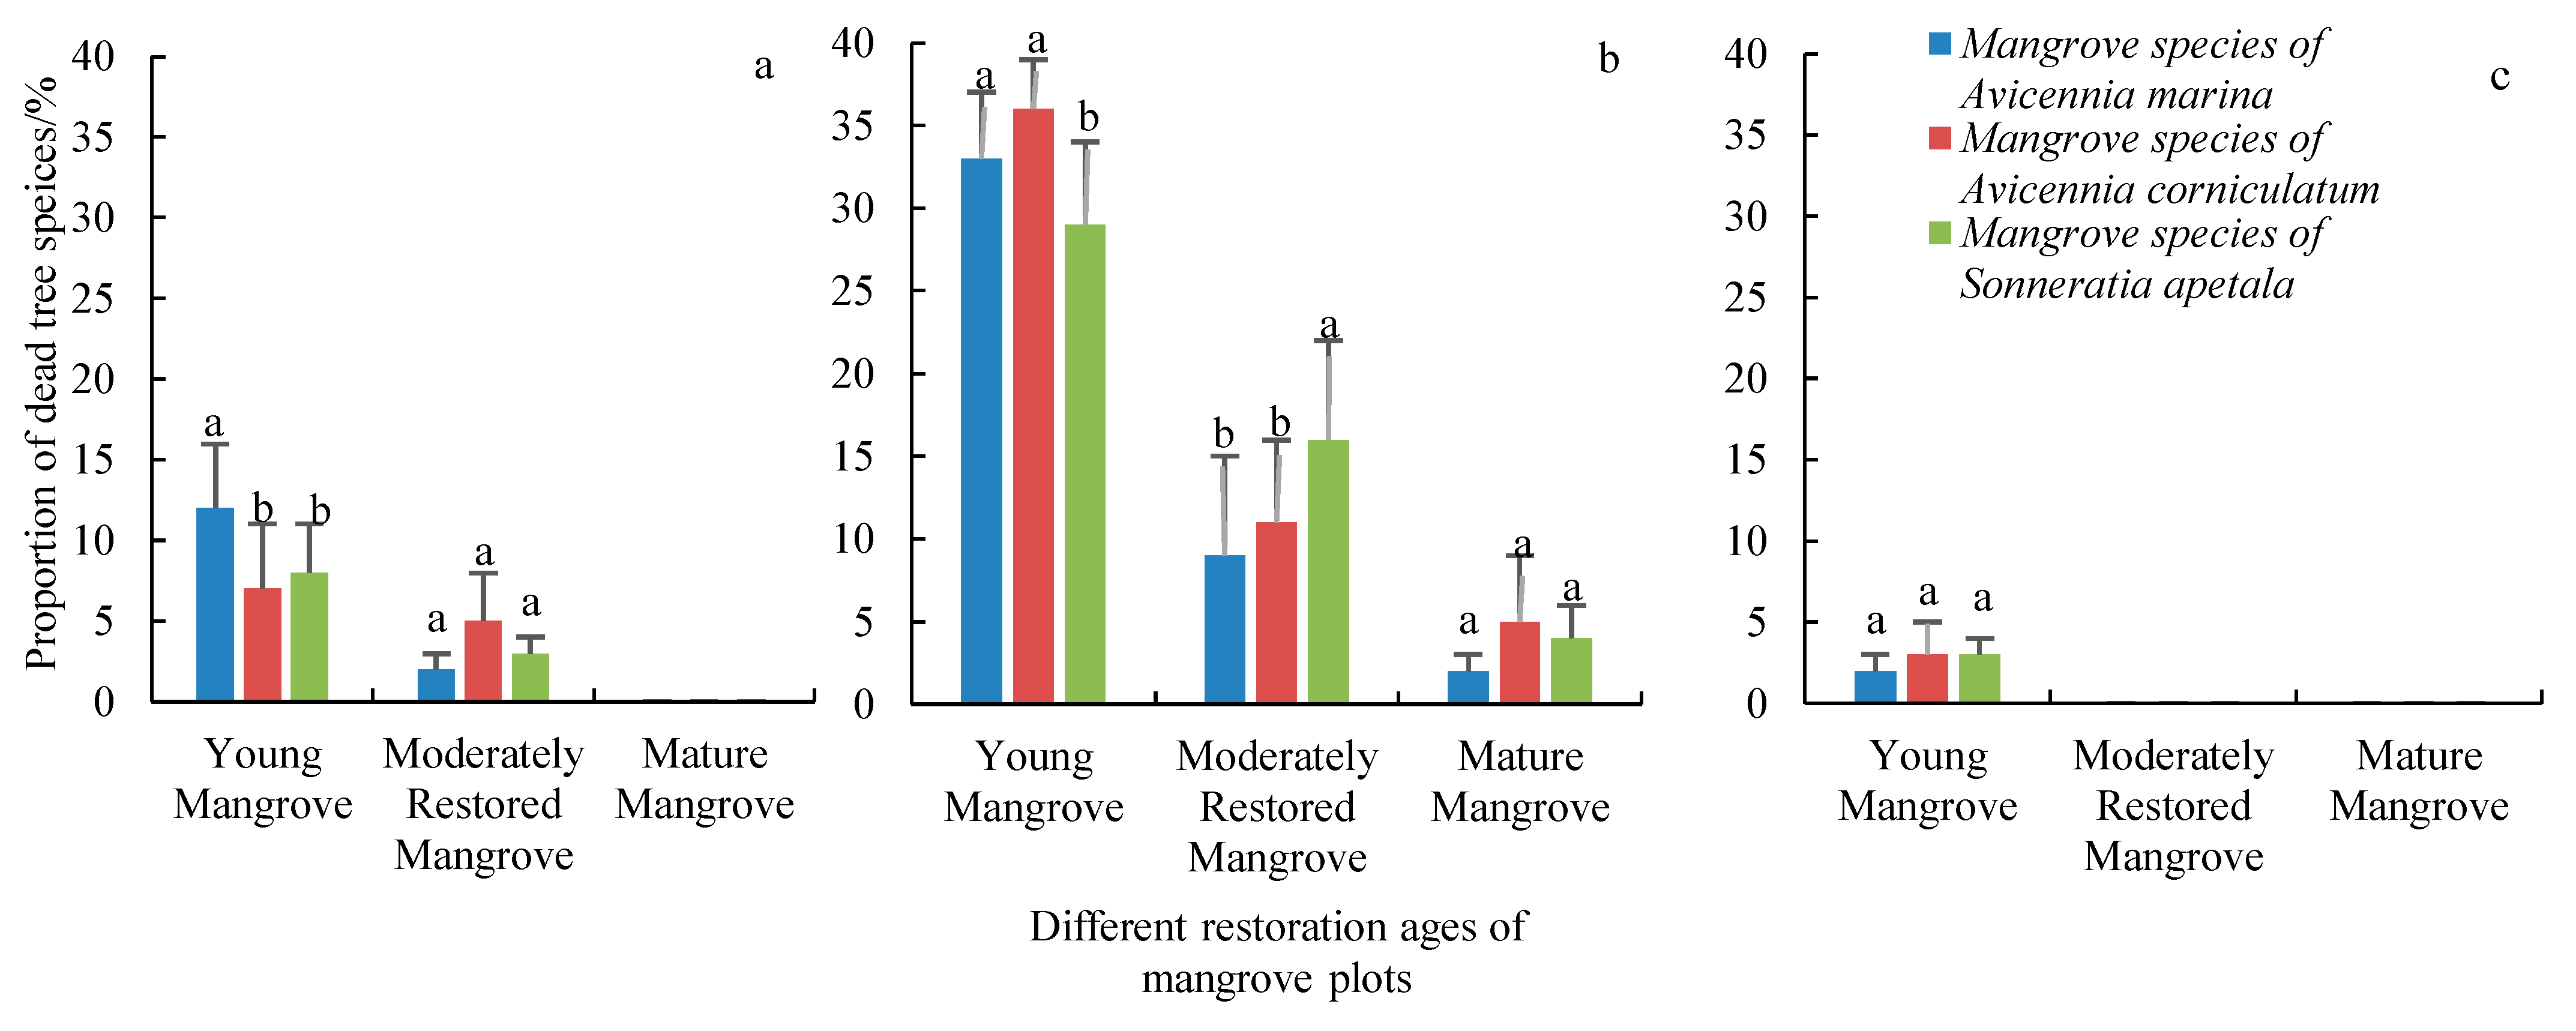
Mortality rates of different tree species in mangrove sites of varying restoration ages were calculated following different typhoon events. These rates were based on the total number of trees on each site. The number of original mangrove trees in each site prior to the typhoon events was as follows: Young mangrove site: 200 trees, moderately restored mangrove site: approximately 167 to 200 trees, mature mangrove site: 200 trees.
After Typhoon Maliksi, mortality rates were 12%, 8%, and 7% for Avicennia marina, Sonneratia apetala, and Avicennia corniculatum, respectively, at the young mangrove site. The number of dead trees was 24, 16, and 14. At the moderately restored mangrove site, mortality rates were 2%, 3%, and 5%, with 4, 5, and 9 dead trees, respectively.
After Typhoon Yagi, mortality rates were higher at the young mangrove site, with 33%, 29%, and 36% mortality for Avicennia marina, Sonneratia apetala, and Avicennia corniculatum, resulting in 66, 58, and 72 dead trees, respectively. At the moderately restored mangrove site, mortality rates were 9%, 16%, and 11%, with 16, 28, and 19 dead trees. In the mature mangrove site, mortality rates were 2%, 4%, and 5%, with 4, 8, and 10 dead trees.
After Typhoon Trami, mortality rates were lower at the young mangrove site, with 2% for Avicennia marina, 3% for Sonneratia apetala, and 3% for Avicennia corniculatum, corresponding to 4, 6, and 6 dead trees, respectively. Mortality rates were calculated relative to the total number of trees at each site.
3.2. Impact of Typhoon on Carbon Stocks
The total carbon stock (TCS) in mangrove ecosystems was significantly affected by the typhoon, with varying impacts observed across different restoration ages.
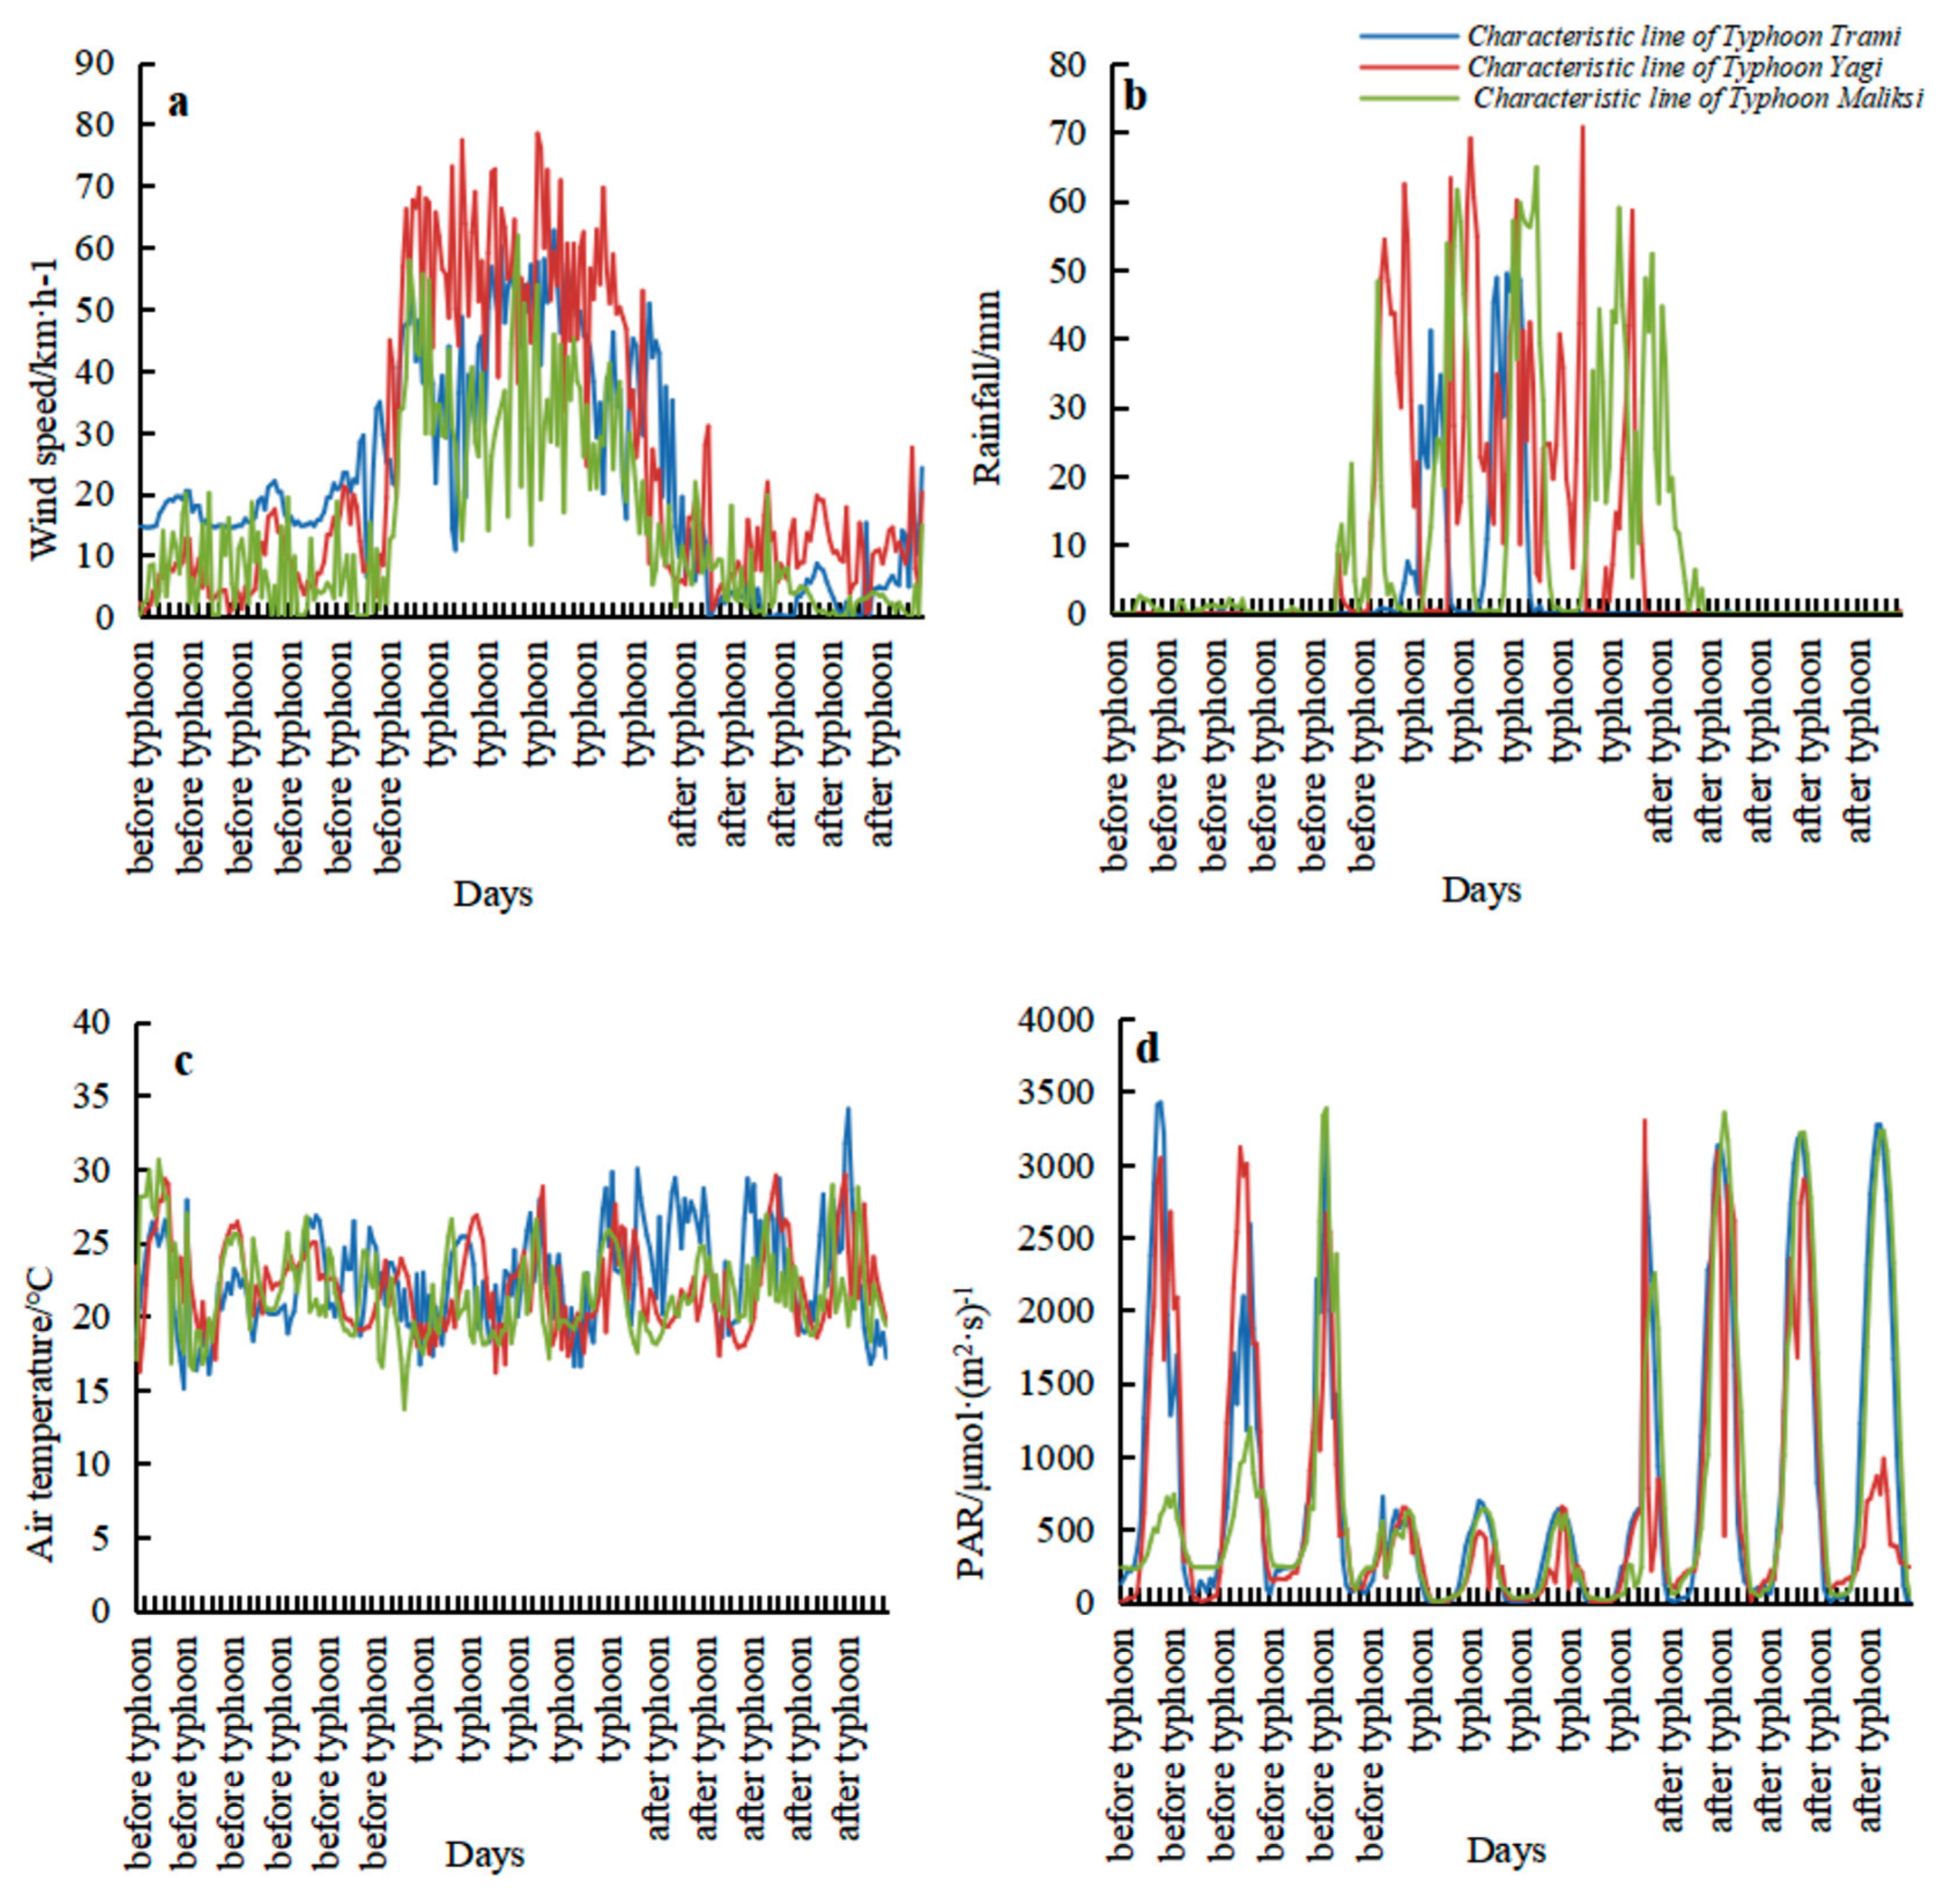
Strong winds and rainfall are the most prominent features during the typhoon period. As shown in
Figure 6a, the average maximum wind speed during the typhoon landing period was 6.28 m·s
−1 (wind speed unit (meters per second)). On 2 August, the average daily maximum wind speed reached 8.07 m·s
−1, with the highest wind speed occurring at 12:00, reaching 11.7 m·s
−1—an 86.35% increase compared to pre-typhoon conditions. After the typhoon made landfall, the average maximum wind speed rapidly decreased to 2.52 m·s
−1.
In terms of rainfall,
Figure 6b shows that precipitation gradually increased from 20:00 on 1 August. By 00:00 on 2 August, the hourly rainfall peaked at 50.6 mm, the highest during the typhoon period. After this peak, precipitation decreased, with secondary peaks at 11:00, 20:00 on 2 August, and 5:00 on 3 August, where hourly rainfall reached 12.6 mm, 15.2 mm, and 21.7 mm, respectively. Daily cumulative rainfall from 1 August to 3 August was 48.6 mm, 190.4 mm, and 76.3 mm, with the total rainfall on 2 August accounting for 58.67% of the total precipitation during the typhoon period. Precipitation before and after the typhoon landfall was significantly lower, at 6.9 mm and 6.4 mm, respectively.
Additionally, a comparison of
Figure 5a,b reveals that the timing and trends of wind speed and rainfall changes were consistent.
Photosynthetically active radiation (PAR), which is the portion of solar radiation available for photosynthesis in plants, is directly influenced by sunlight. Prior to the typhoon, PAR ranged from 0 to 3500 μmol·(m2·s)−1, with peak values occurring around midday. However, the typhoon’s strong winds and heavy rainfall significantly reduced PAR, causing fluctuations between 0 and 722.38 μmol·(m2·s)−1. The lowest PAR during the typhoon period occurred at 3290 μmol·(m2·s)−1.
As the typhoon dissipated, photosynthetically active radiation (PAR) gradually increased, though the noon peak value remained lower than before the typhoon. After the typhoon made landfall, both the average and maximum temperatures (including air temperature and 5 cm surface temperature) dropped significantly, as shown in
Figure 5c. During the typhoon, the average air temperatures were 29.7 and 30.6 °C, respectively. Before landfall, air temperatures increased sharply, while soil temperatures remained stable. However, during the later stages of the typhoon, air temperatures rose rapidly. This rise could be due to the destruction of the mangrove community structure, with a large number of canopy branches and leaves falling, allowing more solar radiation (
Figure 6d) to reach the ground, causing the air temperature to heat up quickly.
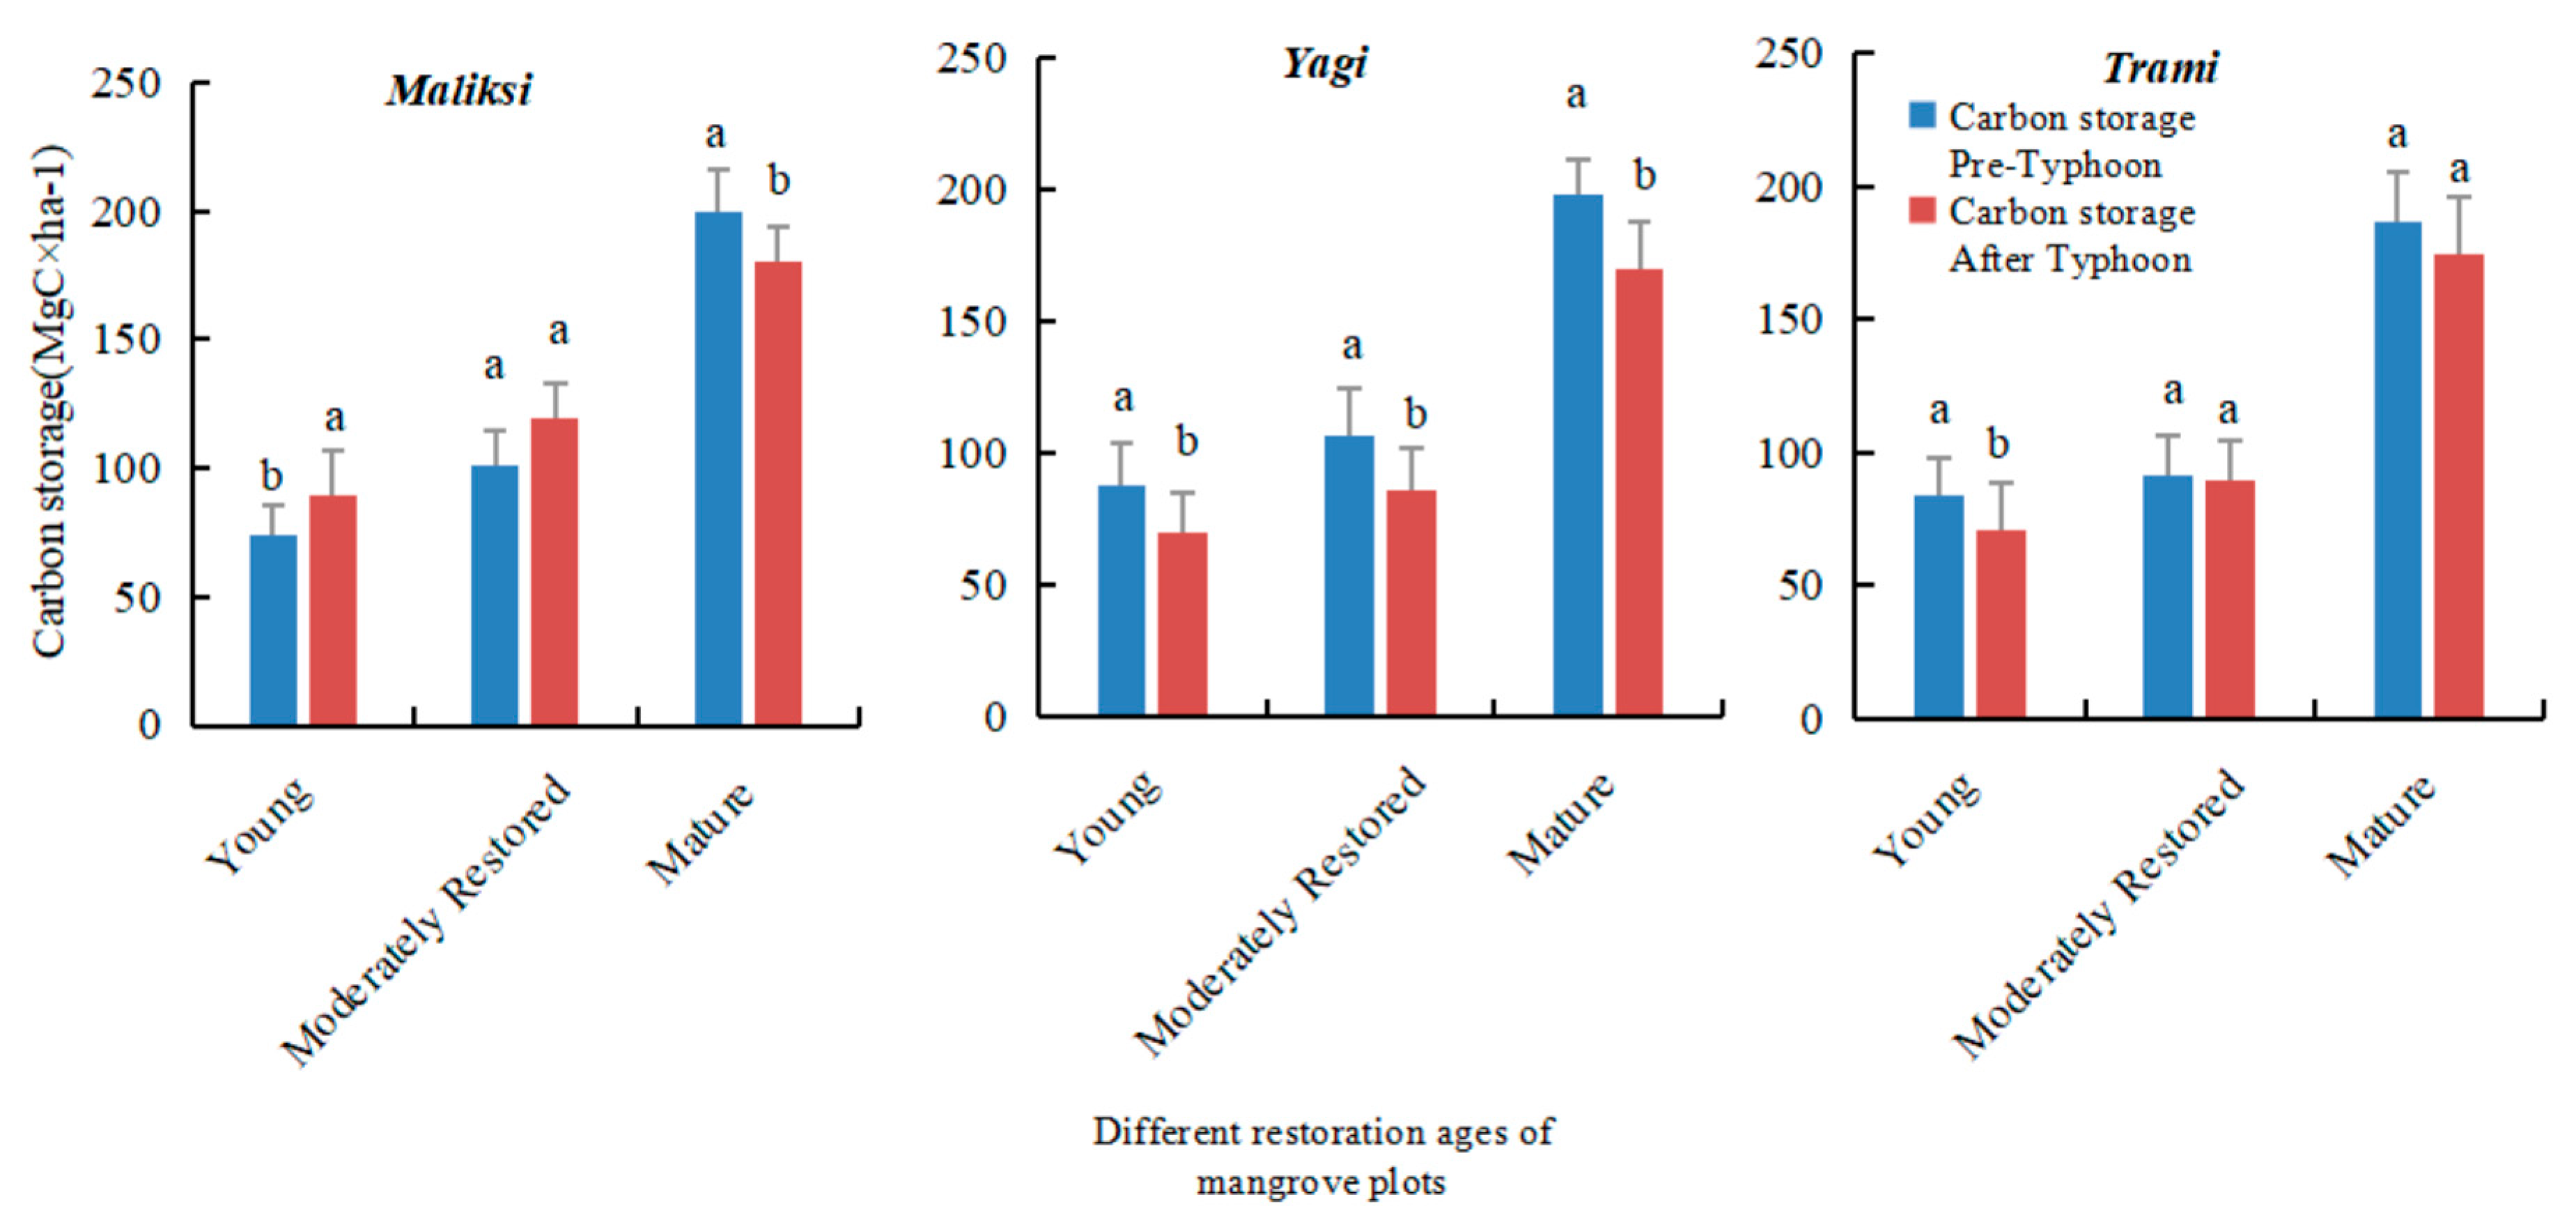
In the moderately restored mangrove plots, although carbon storage was higher than in the sapling plots, the reduction following the typhoons was more pronounced. In contrast, the mature mangrove plots experienced the least impact on total carbon storage. While aboveground biomass decreased (mainly due to tree uprooting), the mature mangrove community demonstrated significant resilience, with most of the lost carbon being re-sequestered in the soil. Soil carbon storage remained relatively stable after the typhoon, with only a slight decrease observed (
Figure 7).
In the 27 plots studied, total carbon storage significantly decreased following typhoons of varying intensities (
Figure 6). The most significant reduction in carbon storage occurred in the sapling plots, which also showed the slowest recovery prior to subsequent typhoons. This decrease was primarily caused by the high mortality rate of saplings, leading to a substantial reduction in aboveground biomass (AGB). Additionally, storm surge erosion and changes in wave height further weakened the resilience of soil carbon storage in these areas (
Table 3).
3.3. Recovery Speed and Carbon Stock Rebound
The recovery speed of carbon stocks differed across the sites with varying restoration ages.
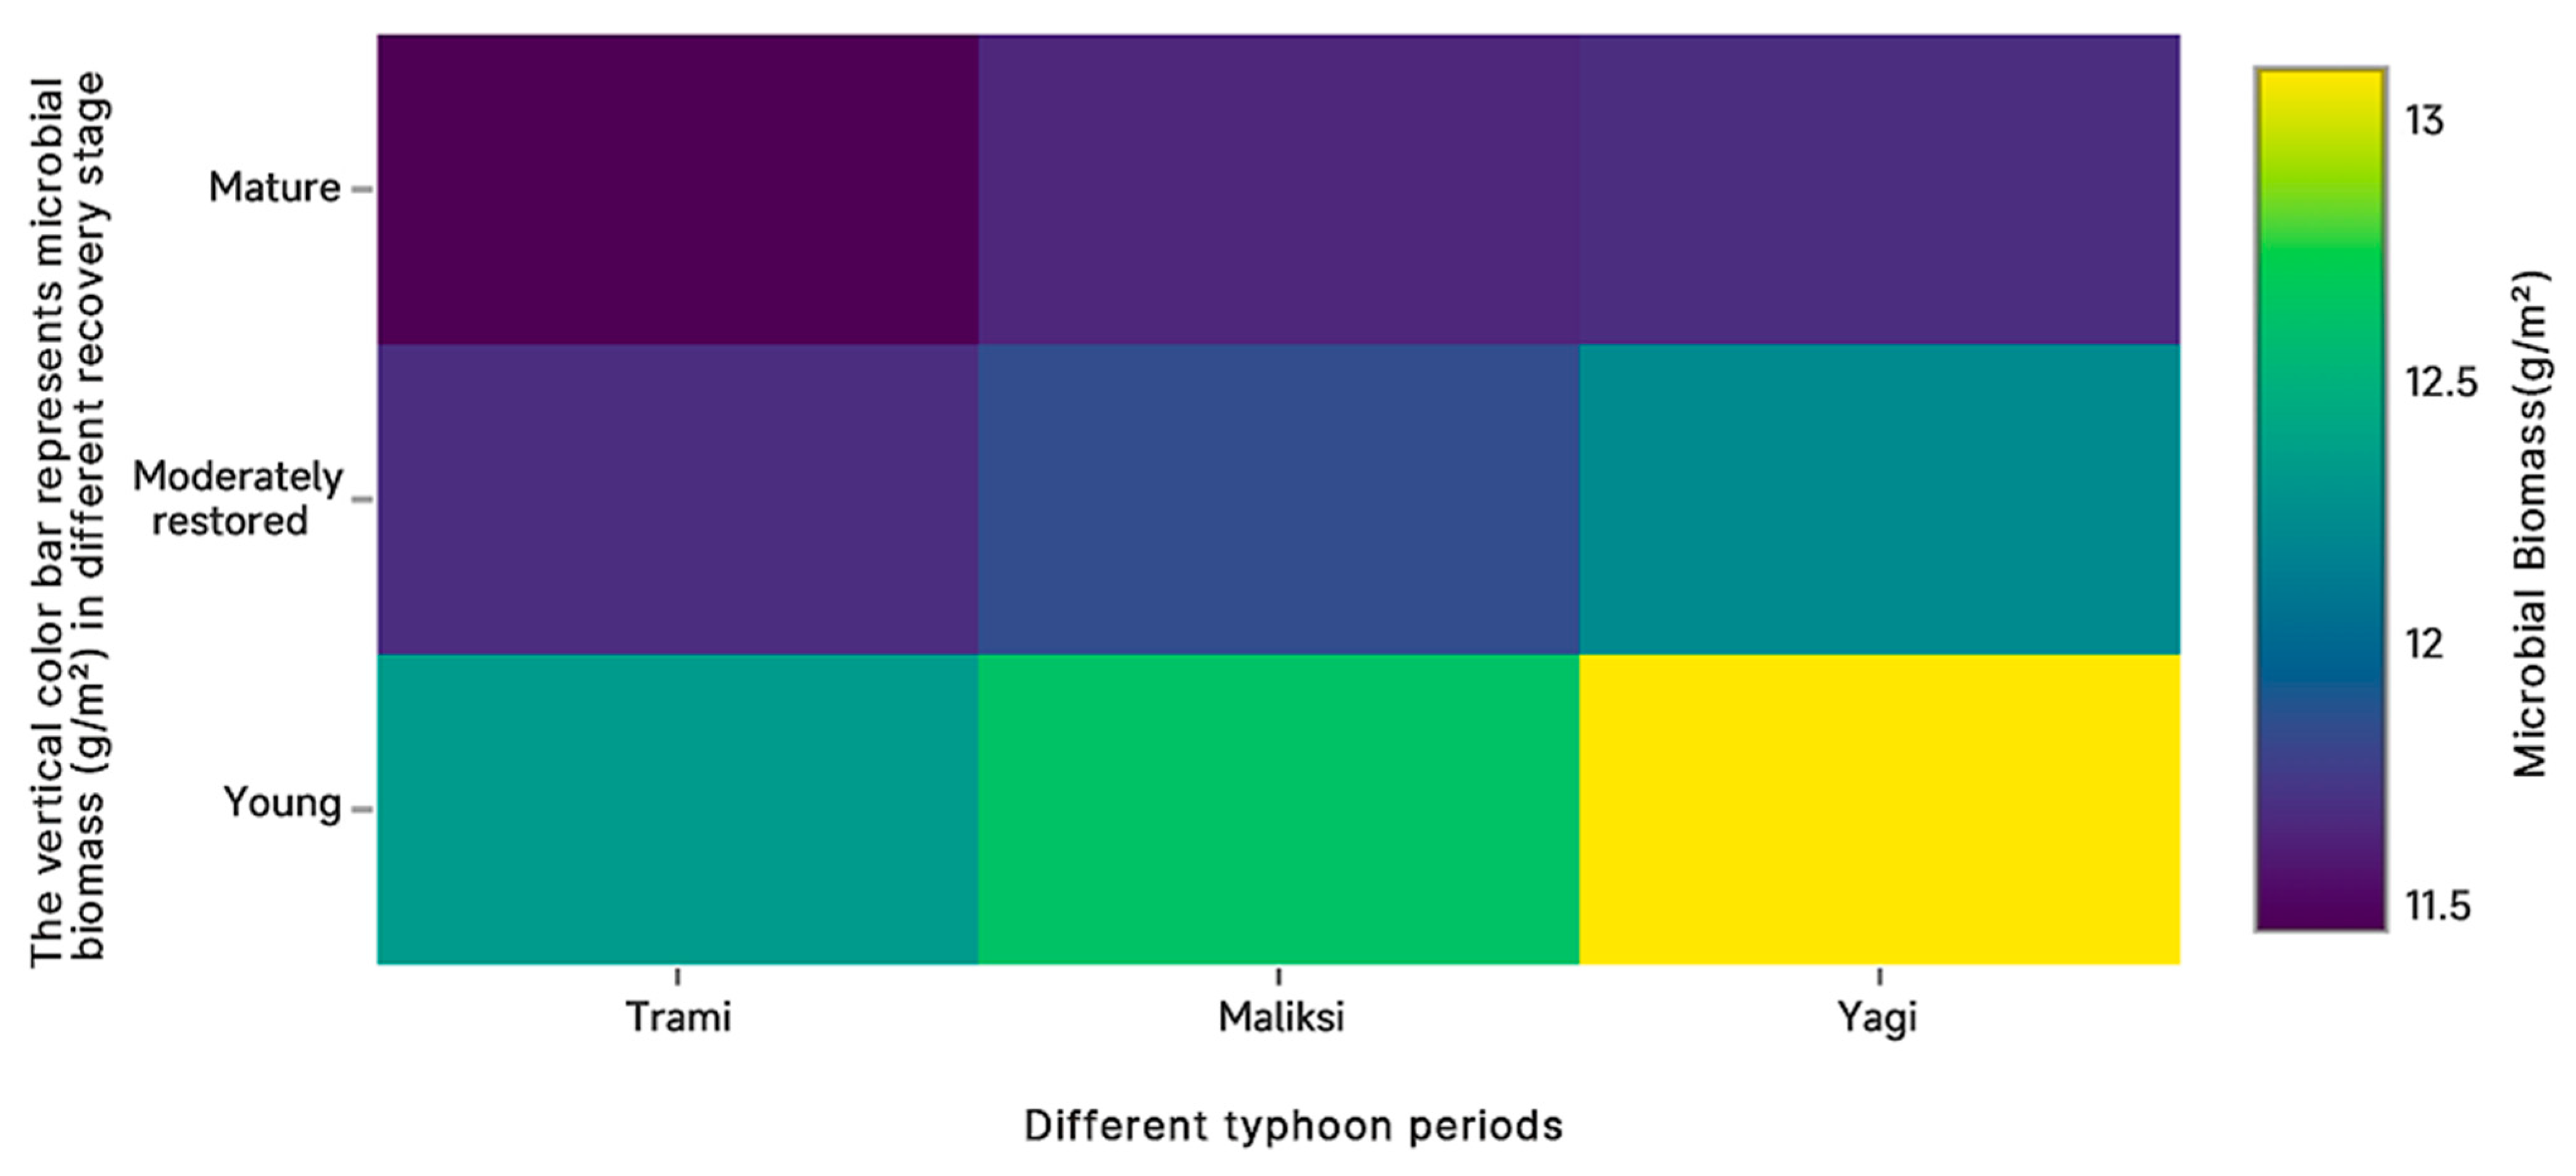
The deeper the color, the lower the impact of different typhoons on carbon storage at different recovery stages. On the contrary, the higher the impact of different typhoons on carbon storage at different recovery stages.
As shown in
Figure 8, microbial biomass in plots at different recovery stages was most affected by Typhoon
Yagi and least affected by Typhoon
Maliksi. The young plots experienced the greatest impact, while the mature plots were the least affected. Typhoon
Trami, with its relatively low wind speed and high rainfall, had the smallest impact on microbial biomass.
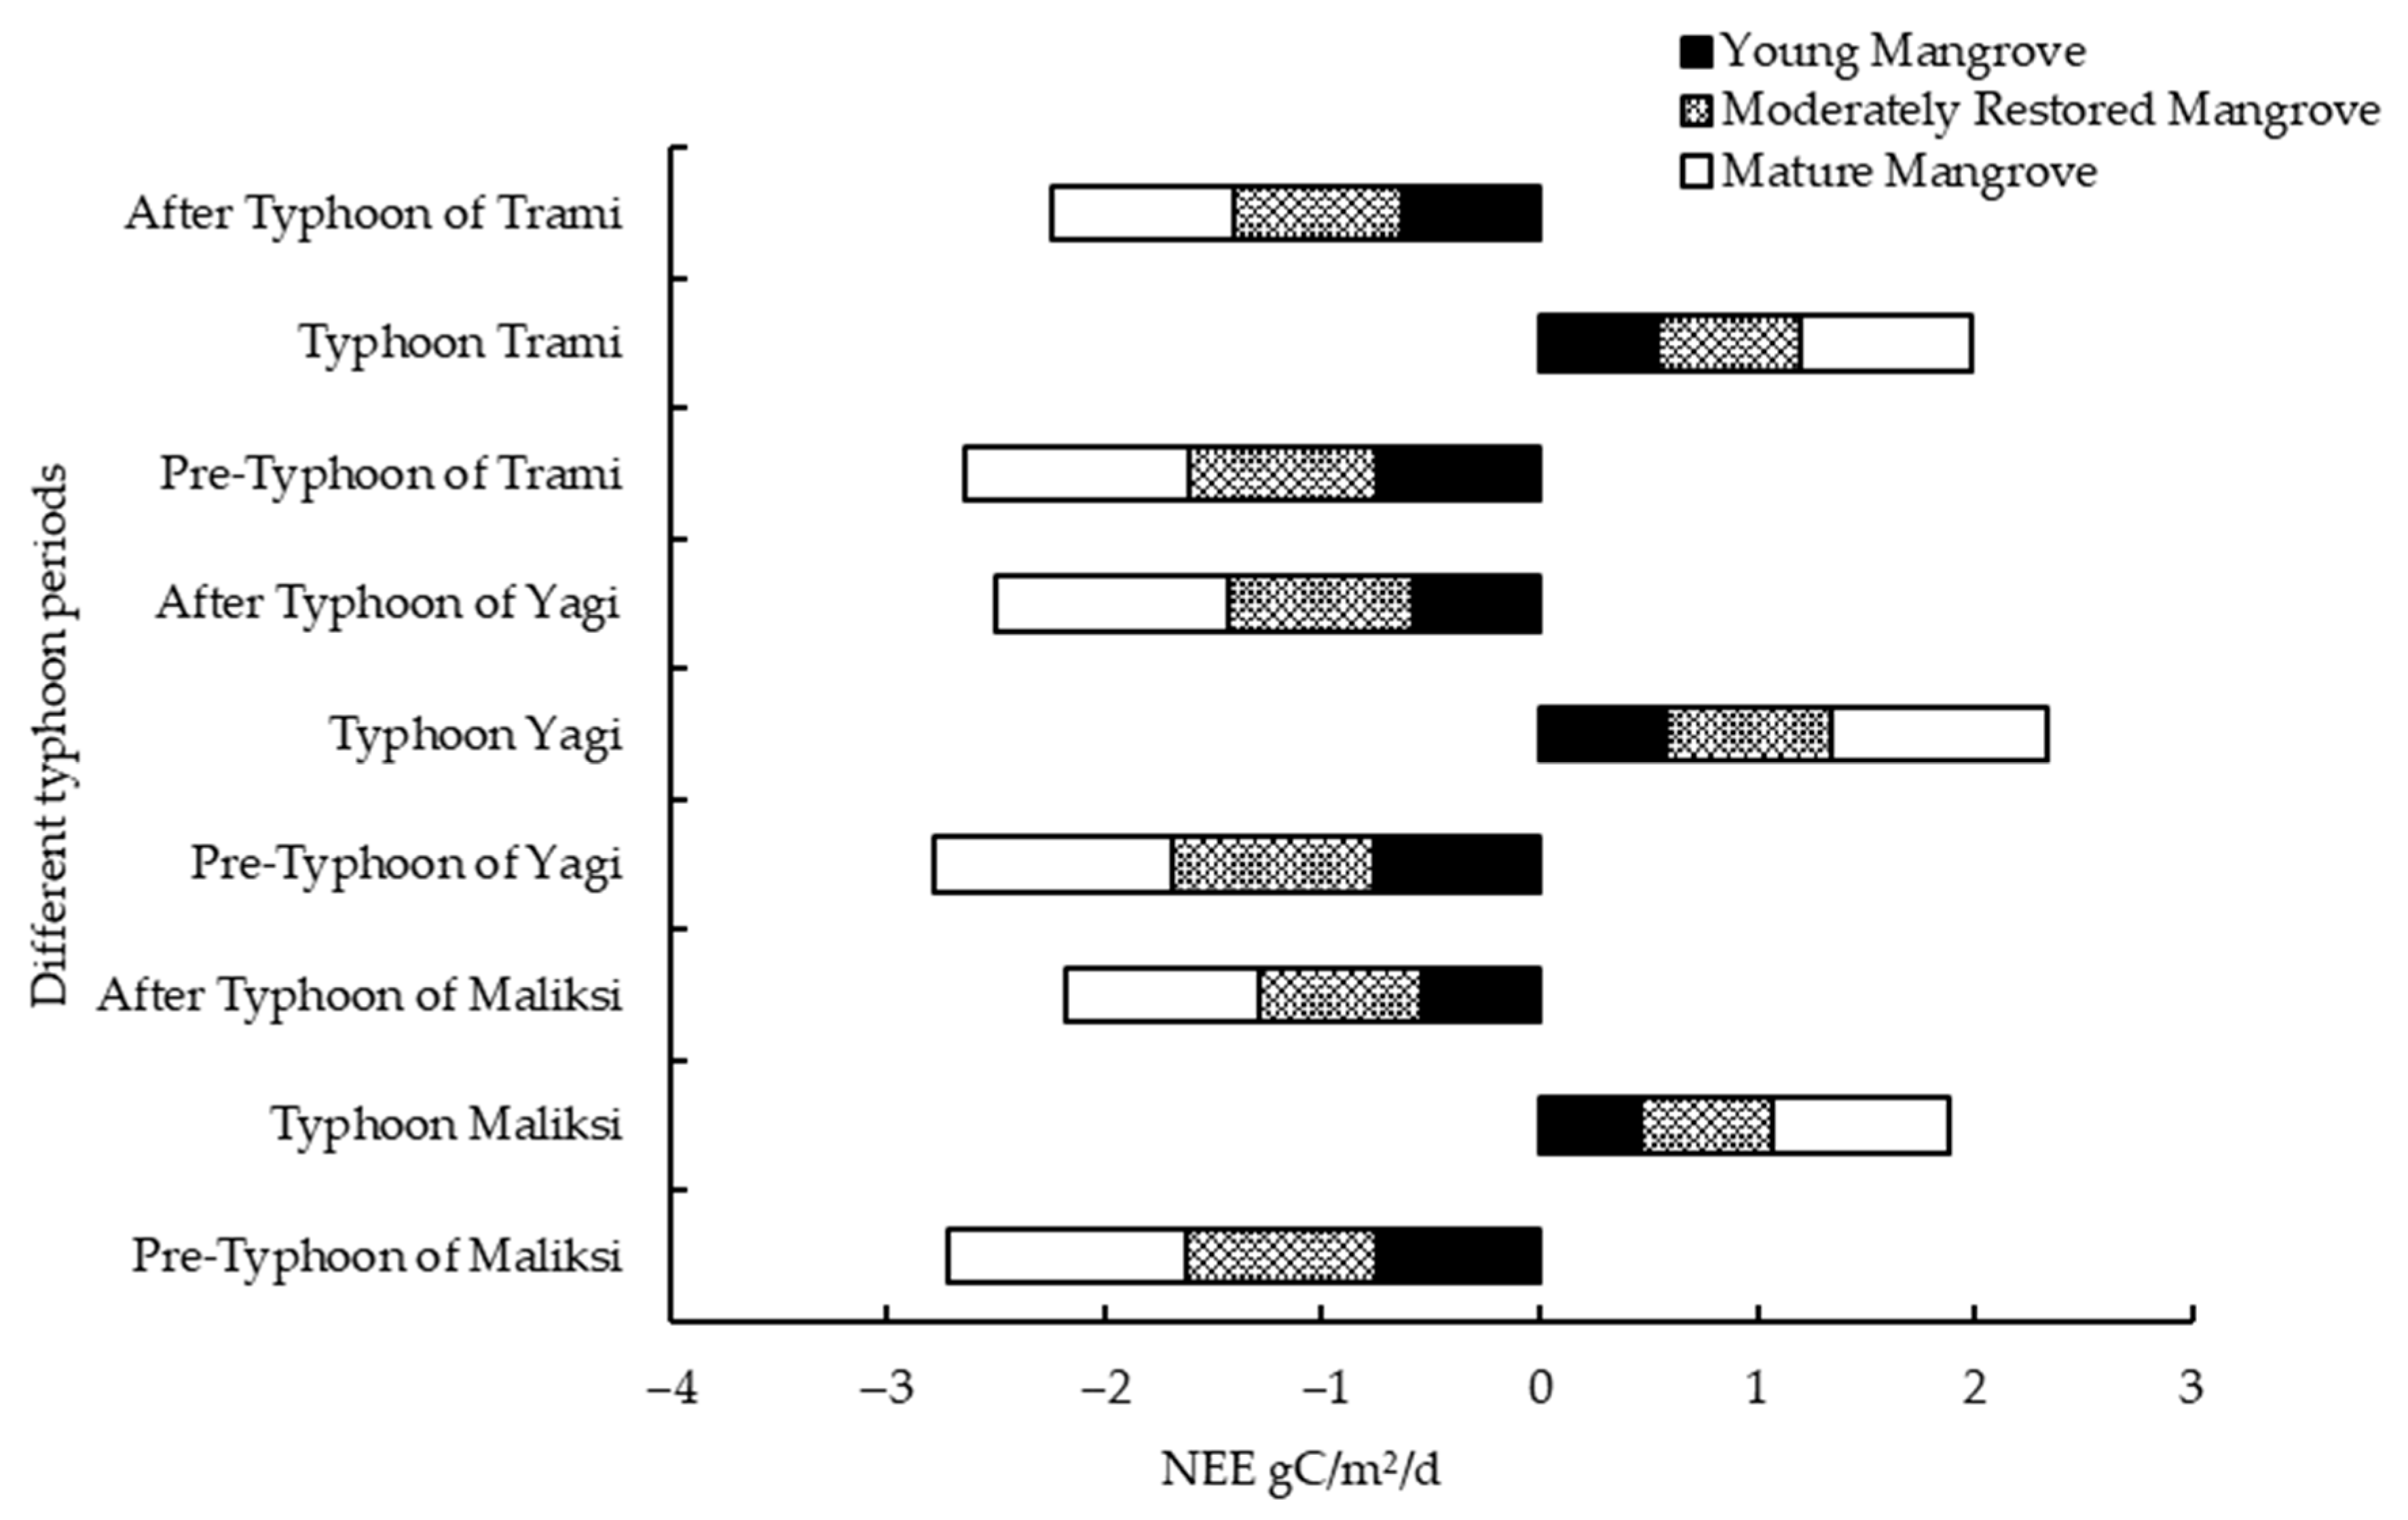
Figure 9 illustrates the daily cumulative net ecosystem exchange (NEE) of carbon storage before and after the typhoon, showing varying recovery speeds across sites with different recovery years. In the restored mangrove plots, the daily cumulative NEE gradually increased before the typhoon, with the highest value recorded in the mature forest plot at −1.11 gC·(m
2·d)
−1. During the typhoon, the NEE shifted from negative to positive, indicating that the mangrove ecosystem transitioned from a carbon sink to a carbon source, releasing CO
2 into the atmosphere. The maximum positive value occurred in the mature forest during Typhoon
Maliksi, with a value of 0.99 gC·(m
2·d)
−1. After the typhoon, the daily cumulative NEE rapidly increased in the negative direction, signaling a gradual recovery of the mangroves’ carbon sink capacity.
3.4. Statistical Analysis
The results of the analysis of variance (ANOVA) revealed that wind speed, rainfall, and photosynthetically active radiation (PAR) had significant effects on carbon flux (NEE), with all three factors showing significance (
p < 0.001). These results highlight the crucial role of wind speed, precipitation, and light intensity in plant photosynthesis and carbon absorption and emission (
Table 4).
In contrast, temperature had no significant effect on NEE (
p = 0.314), suggesting that temperature changes did not notably influence carbon flux fluctuations in this study area. Additionally, the recovery stage of the mangroves significantly impacted carbon flux (
p < 0.05), indicating differences in carbon exchange across mangroves at different recovery stages (
Table 4).


