Article

A Simplified Sigmoid-RH Model for Evapotranspiration Estimation Across Mainland China from 2001 to 2018

1
State Key Laboratory of Remote Sensing and Digital Earth, Faculty of Geographical Science, Beijing Normal University, Beijing 100875, China
2
Beijing Engineering Research Center for Global Land Remote Sensing Products, Faculty of Geographical Science, Beijing Normal University, Beijing 100875, China
3
Huairou Meteorological Bureau, Beijing 101400, China
4
School of Geography and Planning, Chengdu University of Technology, Chengdu 610059, China
5
College of Resource Environment and Tourism, Capital Normal University, Beijing 100048, China
6
Honors College, Nanjing Normal University, Nanjing 210023, China
*
Authors to whom correspondence should be addressed.
Forests 2025, 16(7), 1157; https://doi.org/10.3390/f16071157
Submission received: 4 June 2025 / Revised: 9 July 2025 / Accepted: 10 July 2025 / Published: 13 July 2025
(This article belongs to the Section Forest Meteorology and Climate Change)

Abstract

Accurate terrestrial evapotranspiration (ET) estimation is crucial for understanding land–atmosphere interactions, evaluating ecosystem functions, and supporting water resource management, particularly across climatically diverse regions. To address the limitations of traditional ET models, we propose a simple yet robust Sigmoid-RH model that characterizes the nonlinear relationship between relative humidity and ET. Unlike conventional approaches such as the Penman–Monteith or Priestley–Taylor models, the Sigmoid-RH model requires fewer inputs and is better suited for large-scale applications where data availability is limited. In this study, we applied the Sigmoid-RH model to estimate ET over mainland China from 2001 to 2018 by using satellite remote sensing and meteorological reanalysis data. Key driving inputs included air temperature (Ta), net radiation (Rn), relative humidity (RH), and the normalized difference vegetation index (NDVI), all of which are readily available from public datasets. Validation at 20 flux tower sites showed strong performance, with R-square (R2) ranging from 0.26 to 0.93, Root Mean Squard Error (RMSE) from 0.5 to 1.3 mm/day, and Kling-Gupta efficiency (KGE) from 0.16 to 0.91. The model performed best in mixed forests (KGE = 0.90) and weakest in shrublands (KGE = 0.27). Spatially, ET shows a clear increasing trend from northwest to southeast, closely aligned with climatic zones, with national mean annual ET of 560 mm/yr, ranging from less than 200 mm/yr in arid zones to over 1100 mm/yr in the humid south. Seasonally, ET peaked in summer due to monsoonal rainfall and vegetation growth, and was lowest in winter. Temporally, ET declined from 2001 to 2009 but increased from 2009 to 2018, influenced by changes in precipitation and NDVI. These findings confirm the applicability of the Sigmoid-RH model and highlight the importance of hydrothermal conditions and vegetation dynamics in regulating ET. By improving the accuracy and scalability of ET estimation, this model can provide practical implications for drought early warning systems, forest ecosystem management, and agricultural irrigation planning under changing climate conditions.

1. Introduction

Terrestrial evapotranspiration (ET) is a key component of land–atmosphere water and energy exchanges, which integrates both plant transpiration and evaporation from surfaces such as soil and vegetation [1,2,3,4]. It is especially fundamental to accurately quantify the ET which can helpfully understand ecological processes, hydrological cycles, and climate interactions [5]. Studies on land degradation [6], agricultural water use [7], ecosystem resilience [8], and climate variability [9] have all made extensive use of long-term, high-resolution ET datasets that are spatially consistent. Variegated vegetation types, monsoonal climate systems, and land use intensities impact the spatiotemporal patterns of ET in China’s expansive continent, complicated topography, and varied climate zones [10]. In order to improve understanding of regional hydrological processes and promote sustainable management of land and water resources, it is imperative to analyze ET dynamics nationwide. However, generating accurate and consistent ET estimations throughout mainland China remains a significant challenge because of the lack of ground-based data and significant surface heterogeneity [11]. Therefore, detecting long-term ET trends and identifying their driving forces has become an essential task in advancing regional hydrology and climate studies [12,13].
Currently, the terrestrial ET estimation is mainly composed by three methodological frameworks: (1) the empirical or statistical models based on meteorological observations (e.g., Penman-Monteith (PM), Hargreaves) [14,15,16]; (2) the remote sensing-based energy balance models (e.g., SEBAL, METRIC) [17,18,19]; and (3) land surface process models (e.g., CLM, Noah-MP) [20,21,22], which simulate ET as part of the water and energy flux exchanges within the land–atmosphere system. These strategies have made it easier to create a range of regional and worldwide ET products, such as MODIS MOD16 [23,24], GLEAM [25,26], GLASS [27,28], and PML-V2 [29,30], which are widely used in hydrological, agricultural, and ecological research. However, each framework has inherent limitations. PM- and PT-type models require detailed meteorological data and surface resistance parameters, which are often unavailable or uncertain over large areas. Energy balance models are affected by cloud contamination and uncertainties in remote sensing inputs. Land surface models, while physically comprehensive, are computationally expensive and require complex initialization. Additionally, recent machine learning approaches offer flexibility but often lack physical interpretability. These ET products frequently show notable differences in their temporal trends and spatial distributions, despite their wide range of applications. For example, Yao et al. [31] evaluated the performance of three global ET products (MOD16, GLEAM, and ECMWF) across the Chinese mainland on a monthly scale. They found that the spatial patterns and seasonal variability of ET products vary considerably, with root mean square error (RMSE) values ranging from 17.63 to 40.55 mm/month depending on region and vegetation type, indicating substantial uncertainty among products. Variations in model parameterization, input data quality, and land surface heterogeneity representation are mostly to blame for these uncertainties. Most studies have demonstrated that ET variability is largely shaped by water constraints, with precipitation and soil moisture emerging as the most influential drivers in arid and semi-arid regions of China [32,33]. However, some studies show that ET has grown dramatically in humid and transitional zones as a result of warming temperatures and greening vegetation brought about by ecological restoration programs (such as the Grain-for-Green program) [34,35,36]. Therefore, these challenges underscore the need for a parsimonious, physically meaningful model that can operate reliably under data-scarce conditions and heterogeneous landscapes.
To address these limitations of conventional ET models, we introduce the Sigmoid-RH model—a simplified energy balance-based approach that offers a balance between physical realism and operational applicability. This model builds upon the Priestley–Taylor (PT) framework but replaces traditional soil moisture or vapor pressure deficit (VPD) constraints with a sigmoid function of relative humidity (RH), capturing the nonlinear regulation of ET by atmospheric moisture [37,38,39]. The use of a sigmoid function is particularly justified by the observed nonlinear response of plant transpiration and soil evaporation to RH changes, especially under varying humidity and vegetation conditions. By eliminating the reliance on direct soil moisture inputs and minimizing parameter requirements, the Sigmoid-RH model requires only four input variables (Ta, Rn, RH, and NDVI), all of which are accessible from reliable satellite and reanalysis sources, making it highly suitable for large-scale and data-sparse regions. Recent studies have demonstrated the advantages of RH-based models over the classic PT method across different temporal and spatial scales. For example, Yan and Shugart [40] demonstrated that RH can effectively serve as a proxy for moisture stress using EC flux observations from various ecosystems, with their RH-based model achieving high agreement with observed ET, particularly in semi-arid and humid environments. Similarly, Zhang [32] highlighted that such RH-based modifications to PT improve model performance by better reflecting surface water availability and atmospheric demand under varying climate conditions. However, existing applications of RH-based ET models remain largely confined to local or biome-specific studies, and few efforts have extended these methods to national or continental scales. In mainland China, with its vast climatic gradient, complex topography, and diverse land cover types, implementing the Sigmoid-RH model over long time periods holds promise for revealing the spatial heterogeneity and temporal evolution of ET and for bridging gaps in current long-term, high-resolution ET datasets. Such regional applications may provide critical insights into ET responses to climate variability, vegetation dynamics, and water resource management strategies during continuous changes to the environment.
In this study, we proposed a parsimonious Sigmoid-RH model that characterizes the nonlinear relationship between relative humidity and ET, and applied it to generate daily ET products for mainland China at a spatial resolution of 0.05° from 2001 to 2018, using satellite-derived variables and reanalysis meteorological inputs. There are three main goals for this study: (1) to assess the Sigmoid-RH model’s performance using EC flux tower data in China across various land cover types and climate zones; (2) to investigate the temporal and regional patterns of annual and seasonal ET during 18 years; and (3) to explore the main climatic and ecological driving factors affecting China mainland long-term evaporation change and trend change. This work provides a valuable reference for advancing large-scale ET modeling and for guiding climate-resilient water resource management strategies in mainland China.

2. Study Area and Data
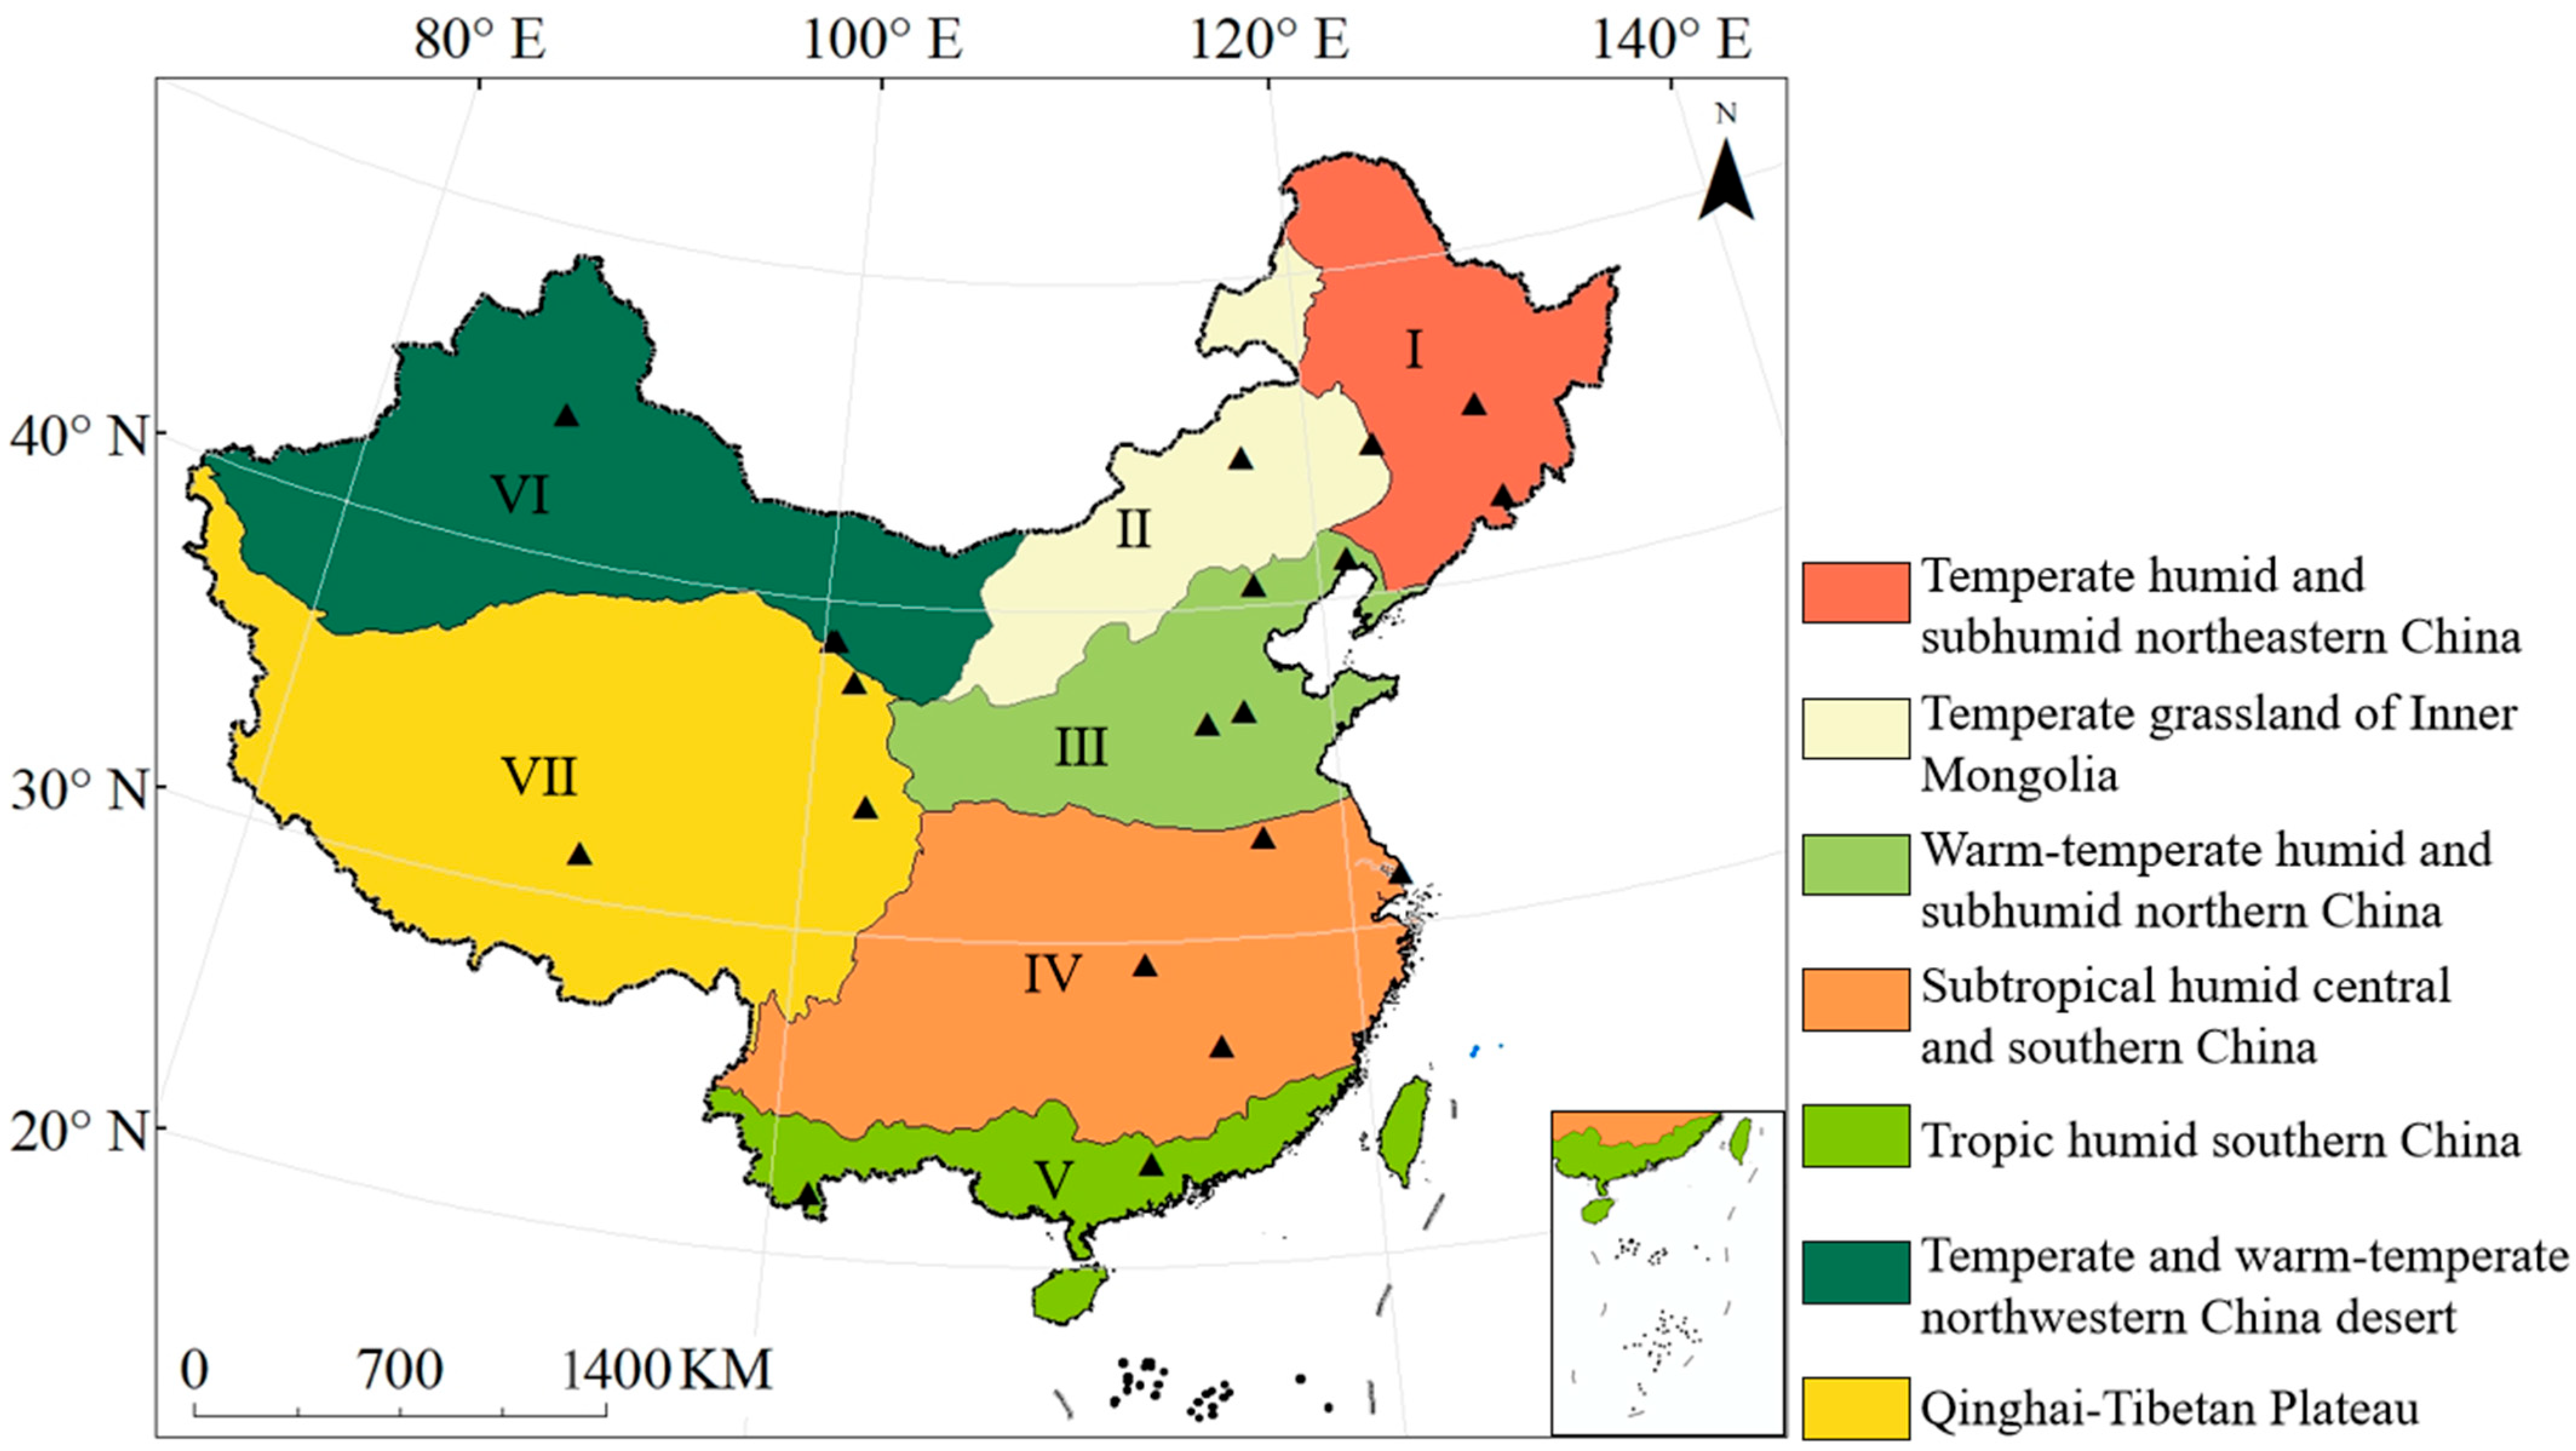
2.1. Study Area

China mainland (3°51′ N–53°33′ N, 73°33′ E–135°05′ E) spans a vast and ecologically heterogeneous area, encompassing diverse topographical features and climatic regimes (Figure 1). This broad spatial extent includes coastal lowlands, interior basins, extensive plains, and high-altitude plateaus, such as the Qinghai–Tibetan Plateau. Significant latitudinal and altitudinal gradients are also present throughout the entire country, resulting in an extensive range of precipitation and temperature conditions. These environmental variations contribute to distinct vegetation distributions and land use patterns, from the humid subtropical forests in the south to arid deserts in the northwest and alpine meadows in the west.
To better characterize this complexity, China is commonly divided into seven major climatic zones: (1) temperate humid and subhumid northeastern China, (2) temperate grasslands of Inner Mongolia, (3) warm temperate humid and subhumid northern China, (4) subtropical humid central and southern China, (5) tropical humid southern China, (6) temperate and warm temperate arid northwestern China, and (7) the high-elevation Qinghai–Tibetan Plateau. Each zone differs significantly in terms of hydrothermal conditions, vegetation structure, and surface energy balance characteristics. This diversity provides a unique natural laboratory for testing ET models such as the Sigmoid-RH framework, particularly in terms of their ability to adapt to varying climatic constraints and land surface heterogeneity across large spatial and temporal scales.

2.2. Data

2.2.1. Ground-Based ET Observations

To verify the effectiveness of the Sigmoid-RH ET model, we used ET data gathered from 20 EC stations within the research area (Figure 1, Table 1). These observational datasets originate from ChinaFLUX (https://chinaflux.org/). Based on the classification standards of the International Geosphere-Biosphere Program (IGBP), the 20 sites we selected cover 10 distinct land cover categories: Croplands (CRO, five sites), Grasslands (GRA, three sites), Bare Land (BAR, three sites), Evergreen Broadleaf Forests (EBF, two sites), Evergreen Needleleaf Forests (ENF, one site), Deciduous Broadleaf Forests (DBF, two sites), Deciduous Needleleaf Forests (DNF, one site), Mixed Forests (MIF, one sites), Open Shrublands (OSH, one site), and Permanent Wetlands (WET, one site). Hourly or half-hourly meteorological measurements including average temperature (Ta), R H , net radiation (Rn), and precipitation (Prec) were adopted in these datasets. When the proportion of missing values in the 30 min interval measurements exceeded the 25% threshold, the corresponding daily parameters were systematically excluded by assigning them a null value in the dataset.

2.2.2. Satellites and Reanalysis Data

The Normalized Difference Vegetation Index (NDVI) and R n products from the Global LAnd Surface Satellites (GLASS) dataset for 2001–2018 were used in this study. These products feature a spatial resolution of 0.05° and a temporal resolution of 8 days, providing consistent and long-term observations critical for ET estimation. In addition, meteorological variables—including Ta, RH, and Prec—were obtained from the China Meteorological Forcing Dataset version 2.0 (CMFD 2.0). This dataset integrates ERA5 reanalysis data from the European Centre for Medium-Range Weather Forecasts (ECMWF) with in situ observations from Chinese meteorological stations. It further incorporates radiation and precipitation correction schemes using the ISCCP-ITP-CNN and TPHiPr data products, which are derived from artificial intelligence and deep learning techniques.
To ensure consistency and facilitate multi-source data fusion, all datasets were resampled to a common spatial resolution of 0.05° and standardized to an 8-day temporal frequency. This harmonization facilitates robust cross-variable analysis, and enhances the reliability of subsequent ET modeling and spatiotemporal trend assessments.

3. Method

3.1. Sigmoid-RH ET Model

The Sigmoid-RH model was utilized to estimate the ET of mainland China in our study. This model is modified from the PT equation, which provides a more physically realistic representation of plant water stress response compared to the PT-JPL and PT-SinRH models. It reduces the sensitivity of ET estimation to extreme values of VPD and avoids the potential overfitting associated with trigonometric or linear approximations. This enables robust performance across diverse ecosystems, particularly in transitional or moisture-limited environments. The formula can be represented as
E T = α + γ R n G f
where
f = R H sin ( 2 π · R H ) 2 π
G = α g R n 1 f v
f v = N D V I N D V I m i n N D V I m a x N D V I m i n
f is the relative humidity constraint function introduced in the Sigmoid-RH model, α is the Priestley–Taylor coefficient, which is normally fixed at 1.26 in settings with enough watering, is the slope of the saturation vapor pressure–temperature curve (kPa/°C), γ is the psychrometric constant (0.066 kPa/°C), R n is the net radiation (W/m2), G is the ground heat flux (W/m2), α g = 0 .18 [41,42], and f v is the fraction of green vegetation in the scene [43].

3.2. Significance Evaluation and Trend Analysis

To explain the spatiotemporal features of ET and additional variables across mainland China between 2001 and 2018, we employed a combination of trend analysis and statistical significance testing at annual and seasonal scales. The temporal trends in these variables were quantified using ordinary least squares (OLS) linear regression, a widely adopted approach for detecting monotonic changes in hydroclimatic variables. For each grid cell within the study domain, the slope of the regression line (β) was computed to represent the magnitude of these parameters’ change per year, expressed as
β = n × i = 1 n i × x i i = 1 n i i = 1 n x i n × i = 1 n i 2 ( i = 1 n i ) 2
y = β x + i
where the regression coefficient β quantifies the annual rate of change in the target variable, with i denoting the temporal index corresponding to each year and n = 18, corresponding to the temporal span of the study period (2001–2018). The term x i represents the observed value of the target variable (e.g., ET, Ta, NDVI) during year i . A positive β value indicates an ascending trend in the variable over time, whereas a negative β signifies a declining tendency.
The Student’s t-test was used to assess the obtained trends’ statistical significance at a 95% confidence level. If the p-value is less than 0.05, the trend is considered significant. The t-statistic was calculated as
t = β S E β
where S E β represents the standard error of the regression slope. Grid cells with t > t c r i t i c a l were classified as exhibiting significant trends.

3.3. Validation Method

To comprehensively evaluate the performance of the proposed model, four widely accepted statistical metrics were utilized: the coefficient of determination (R2), RMSE, Bias, and Kling–Gupta Efficiency (KGE). R2 reflects the proportion of variance in the observed data explained by the predicted values and is calculated as
R 2 = 1 i = 1 n G i E i 2 i = 1 n G i G ¯ 2
where G i and E i represent the ground-measured and estimated values, respectively, G ¯ is the mean of the ground-measured data and the total number of samples. The closer the value of R2 to 1, the better the model fits the observations.
RMSE quantifies the average magnitude of the estimation errors, reflecting the overall deviation between estimated and ground-measured values. It is expressed as
R M S E = 1 n i = 1 n E i G i 2
Lower RMSE values indicate higher estimation accuracy. Bias indicates the systematic error or average tendency of the model to overestimate or underestimate observations, computed by
B i a s = 1 n i = 1 n ( E i G i )
The KGE is a comprehensive metric that integrates three components—correlation, bias ratio, and variability ratio—to provide a balanced evaluation of model performance. It is defined as
K G E = 1 E D
E D = ( r 1 ) 2 ( α 1 ) 2 ( β 1 ) 2
r = c o v ( E , G ) σ E · σ ( G )
α = σ ( G ) σ ( E )
β = μ ( G ) μ ( E )
The KGE value ranges from −∞ to 1, with values closer to 1 indicating better model performance in terms of correlation, bias, and variability.
By combining these metrics, a comprehensive understanding of model accuracy, precision, and reliability can be obtained.

4. Results

4.1. Validation of Sigmoid-RH ET Model at Site Scale

To assess the performance of the Sigmoid-RH ET model, we compared its evapotranspiration estimates with observational data collected from 20 EC sites (Figure 2). Across all sites, the model demonstrates robust accuracy, with R2 values ranging from 0.26 to 0.93, KGE from 0.16 to 0.91, RMSE between 0.5 and 1.3 mm/day, and bias ranging from −1.1 to 0.5 mm/day. These results confirm that the model reliably estimates daily ET across diverse climatic and ecological conditions. Model accuracy varies across vegetation categories. The ascending order of KGE for all vegetation types is DBF (0.60), DNF (0.61), GRA (0.62), EBF (0.69), CRO (0.69), WET (0.70), BAR (0.71), OSH (0.73), ENF (0.78), and MIF (0.90). Notably, the model exhibits its strongest performance in MIF areas, achieving an average R2 of 0.85, RMSE of 0.6 mm/day, a bias of −0.1 mm/day, and a KGE of 0.90. In contrast, its weakest results are observed in DBF, where the average R2 drops to 0.76, RMSE increases to 0.87 mm/day, bias reaches −0.4 mm/day, and KGE declines to 0.60. These variations may reflect differences in vegetation structure, rooting depth, and seasonal phenology, which affect how ET responds to relative humidity. For example, broadleaf forests often exhibit stronger seasonal water stress responses, leading to greater model uncertainty.
We compare the daily ET measurements from all 20 sites with the corresponding ET estimations obtained from the Sigmoid-RH ET model based on reanalysis and satellite data inputs (Figure 3). For the 20 sites, the estimated KGE values range from 0.16 to 0.91 for daily ground-measured ET, R2 ranges from 0.26 to 0.88, RMSE ranges from 0.5 to 1.3 mm/day, and bias ranges from −1.1 to 0.5 mm/day. From the different vegetation types, the Sigmoid-RH ET model performs best in WET, with an average KGE of 0.91, and worst in OSH, with an average KGE of 0.27. The descending order of KGE for all vegetation types is WET (0.91), MIF (0.86), ENF (0.78), DNF (0.71), CRO (0.59), GRA (0.58), DBF (0.58), EBF (0.58), BAR (0.57), and OSH (0.27). On a site scale, the Sigmoid-RH ET model based on reanalysis and satellite data inputs at the DT site has excellent simulation accuracy, with a KGE performance of 0.91, R2 of 0.88, an RMSE of 0.5 mm/day, and a bias of 0.1 mm/day. However, the estimation performance of ET of the Sigmoid-RH ET model at the NQ site is poor, with the lowest KGE of 0.16, R2 of 0.49, RMSE of 1.3 mm/day, and bias of −1.1 mm/day.

4.2. Spatial Distribution of ET over Mainland China

4.2.1. Annual

The mean annual distribution of terrestrial ET across mainland China from 2001 to 2018 (Figure 4) displays a pronounced spatial gradient, with values increasing progressively from the arid northwest to the humid southeast. On a national average, the annual terrestrial ET over mainland China is approximately 560 mm/yr, ranging regionally from less than 200 mm/yr in the arid northwest zones to over 1100 mm/yr in tropical southern China. This pattern closely aligns with the country’s seven major climatic zones and their respective hydrothermal conditions.
In the temperate and warm temperate arid regions of northwestern China (region VI), the temperate grasslands of Inner Mongolia (region II), and the Qinghai–Tibetan Plateau (region VII), annual ET remains low, generally below 300 mm/yr. These areas are constrained by low precipitation, sparse vegetation, and in the case of the Plateau, persistent low temperatures and permafrost. The temperate humid and subhumid region of northeastern China (region I) typically receives sufficient summer rainfall, allowing the annual ET to reach 400–600 mm/yr, especially in areas dominated by mixed forests and agricultural land. In the warm temperate humid and subhumid northern China (region III), and in subtropical humid central and southern China (region IV), favorable hydrothermal conditions and dense vegetation contribute to relatively high ET levels of 600–1000 mm/yr. The tropical humid southern China (region V), influenced by strong monsoonal precipitation and high temperatures year-round, supports lush vegetation and exhibits the highest ET, exceeding 1000 mm/yr. This spatial distribution highlights the dominant influence of hydrothermal gradients and vegetation patterns on regional ET regimes. The model’s spatial ET estimates are consistent with its validated performance at EC flux sites across diverse vegetation and climatic regions, indicating strong regional applicability of the Sigmoid-RH model.

4.2.2. Seasonal

The spatial distribution of terrestrial ET across mainland China exhibits pronounced seasonal variability (Figure 5). The annual distribution, characterized by a gradual increase from the arid northwest to the humid southeast, is closely mirrored by the spatial pattern of ET during spring (March, April, and May) and summer (June, July, and August). In contrast, winter (December, January, and February) ET remains consistently low across the country, with most areas recording seasonal totals below 100 mm/season. On the whole, spring and summer ET levels are significantly higher than those in autumn and winter, with seasonal ET estimates across mainland China being approximately 160 mm in summer, 140 mm in spring, 130 mm in autumn, and below 80 mm in winter, reflecting strong seasonality in hydrothermal conditions and vegetation activity.
In summer, ET reaches its annual maximum, and its spatial distribution is nearly identical to the yearly pattern. This alignment stems from the concurrent peak in both climatic and vegetative drivers. The summer monsoon delivers abundant precipitation (150–300 mm/season) to southern and eastern regions, while average temperatures ranging from 20 to 30 °C enhance atmospheric demand and surface energy availability. Simultaneously, vegetation enters its most active growth phase, with widespread crop cultivation and dense natural canopies promoting vigorous transpiration. These optimal hydrothermal conditions result in high ET values, typically exceeding 300 mm/season in southeastern regions. Conversely, winter imposes a nationwide suppression on ET. In northern and high-altitude regions, subzero temperatures (<0 °C) and extensive soil freeze severely limit surface evaporation and effectively halt transpiration due to vegetative dormancy. Even in southern areas, although temperatures remain above freezing, reduced solar radiation and limited precipitation constrain both soil evaporation and plant water use, yielding comparatively low ET values (50–150 mm/season). As a result, the winter ET distribution appears uniformly low and spatially homogeneous, in sharp contrast to the strongly differentiated summer pattern.

4.3. Temporal Features of ET Trends Across Mainland China

4.3.1. Annual

The average ET in mainland China showed no significant trend from 2001 to 2018, but the time series can be divided into two distinct phases: a declining trend from 2001 to 2009 followed by a growing trend from 2009 to 2018 (Figure 6a). The temperate humid and subhumid northeast China exhibited a significant upward ET trend, representing the only climate region with long-term statistically significant changes among the seven climate zones. This region demonstrated an annual growth rate of 2.072 mm, with notable ET increases occurring in 2003–2005 and 2009–2014 (Figure 6b). The temperate grassland of Inner Mongolia displayed substantial ET fluctuations characterized by frequent surges and sharp declines, without statistically significant trends. Peak values occurred in 2003, 2008, 2012, and 2018, while troughs appeared in 2007, 2009, and 2017 (Figure 6c). In the warm temperate humid and subhumid northern China, ET initially increased from 2001 to 2003, followed by a two-year decline. After 2005, it entered a prolonged fluctuating state, reaching a minimum in 2011 and showing decreasing oscillations from 2012 onward (Figure 6d). The average ET of the subtropical humid central and southern China showed no significant overall trend over the 18-year period. However, a distinct pattern emerged with a declining phase from 2001 to 2012, followed by an upward trend after a 2012 surge that continued through 2018 (Figure 6e). The tropical humid southern China demonstrated an overall increasing ET trend, though with temporal variations: a decline from 2001 to 2011, rapid growth in 2012–2015, and gradual decrease after 2016 (Figure 6f). The temperate and warm temperate northwestern China desert exhibited a general pattern of decreasing ET from 2001 to 2009 followed by increasing values from 2009 to 2018, with peaks in 2010 and 2016, and a notable trough in 2014 (Figure 6g). The Qinghai–Tibetan Plateau experienced substantial ET variability: relatively high values from 2001 to 2006, lower measurements for 2007–2009, a gradual decline from 2010 to 2015, and a subsequent upward trend (Figure 6h).

4.3.2. Seasonal

Figure 7 shows the average ET in spring and summer, which demonstrates trends consistent with annual ET variations. Meanwhile, ET exhibits substantial interannual variability without statistically significant trends in autumn and winter (Line 1). The temperate humid and subhumid northeast China shows a significant upward ET trend in summer and a mild downward trend in winter (Line 2). The annual ET variation pattern in the temperate grassland of Inner Mongolia most closely resembles its summer trend (Line 3). In the warm temperate humid and subhumid northern China, ET increases in spring and summer but decreases in autumn and winter, with marked interannual fluctuations (Line 4). The seasonal ET variations in the subtropical humid central and southern China align with its annual pattern, both being divided into two phases demarcated by 2012: an initial decline followed by an increase (Line 5). The tropical humid southern China similarly displays seasonal ET declines from 2001 to 2011 and increases post-2012, with winter exhibiting the most pronounced fluctuations (Line 6). In the temperate and warm temperate northwestern China desert, ET in spring shows a significant downward trend (reaching its lowest value in 2014), while ET in summer most closely mirrors the annual pattern (Line 7). The Qinghai–Tibetan Plateau features slower spring temperature recovery, resulting in lower spring ET compared to autumn. The notable ET increase in 2010 was primarily driven by summer–autumn variations (Line 8). In summary, summer—characterized by the highest temperatures and precipitation—records the largest ET magnitude in China, with summer ET changes exerting the predominant influence on annual ET variations. Spring ET remains marginally higher than autumn ET across all regions except the Tibetan Plateau.

4.4. Spatial Variation Trends of ET over the Seven Climatic Regions of Mainland China

4.4.1. Annual

The annual average spatial variation in ET across mainland China from 2001 to 2018, as shown in Figure 8, demonstrates pronounced spatial heterogeneity. A distinct west-to-east pattern is evident, with both increasing and decreasing trends influenced by regional topography and climatic conditions. In western China—particularly in arid and semi-arid regions such as Xinjiang and parts of the Tibetan Plateau—ET trends are generally weak, fluctuating between −10 and +10 mm/year. This is likely due to limited precipitation and sparse vegetation. Notably, several localized areas in the southwestern highlands exhibit significant declines in ET (as indicated by red and yellow), potentially driven by shifts in temperature and rainfall patterns.
In contrast, eastern and southeastern China—characterized by humid subtropical monsoon climates—show modest to notable increases in ET, reaching up to +20 mm/year in certain regions. These areas typically have dense vegetation cover and receive abundant precipitation. The black dots represent areas where the ET trends pass the 95% significance test, with clustered significant regions observed in parts of central, northeastern, and southern China. These changes may reflect the combined effects of climatic variability, land use changes, and ecological restoration programs such as reforestation.

4.4.2. Seasonal

The spatial distribution of ET in different seasons showed significant differences (Figure 9). The spatial distribution patterns of ET during spring and autumn closely resemble the annual average distribution pattern and generally reflect the influences of topography and regional climate. Higher ET values are observed in the southeastern regions, where precipitation and vegetation are more abundant, while lower ET values are concentrated in the western inland areas such as the Tibetan Plateau and northwestern arid zones.
During summer, ET increases substantially across most of the study area, especially in the northern and northeastern regions where the East Asian summer monsoon results in abundant rainfall. The southeastern coastal regions also exhibit high ET due to their low elevation and humid climate. In contrast, ET in the southwestern mountainous areas is relatively low, demonstrating the land surface ET’s geographical variability, which is particularly noticeable during this season.
In winter, ET values are uniformly low throughout the country due to the suppression of vegetation activity and low temperatures. A clear latitudinal gradient is observed, with higher ET in the southern subtropical regions and near-zero values in northern and high-altitude zones. Overall, elevation, climate conditions, and vegetation phenology strongly influence seasonal variations in ET across mainland China.

5. Discussion

5.1. Spatial and Temporal Variability in ET of Mainland China

In this study, the spatial distribution of interannual and seasonal changes in ET (Figure 4 and Figure 5) increases from northwest to southeast, and the interannual variation in ET in most areas of China demonstrates a rising tendency (Figure 6), and has a downward tendency in regions VI (the temperate and warm temperate northwestern China desert) and VII (Qinghai–Tibetan Plateau), which matches the findings of previous research [44,45] and further demonstrates that the spatiotemporal changes in ET in China may be simulated by the Sigmoid-RH ET model. This spatial agreement between the modeled ET and the known hydroclimatic gradients provides confidence in the model’s regional applicability and reinforces its ability to reproduce large-scale ET patterns across diverse climatic zones. The seasonal and regional variability of ET (Figure 4 and Figure 5) is closely tied to key climatic drivers such as precipitation, temperature, and NDVI, each of which influences ET through distinct mechanisms. Temperature influences ET via its control over vapor pressure deficit (VPD), which governs atmospheric demand for moisture. Meanwhile, NDVI reflects vegetation vigor and canopy structure, thus modulating transpiration rates, especially in humid and transitional zones. Precipitation, on the other hand, primarily determines soil moisture availability and is the most limiting factor in arid and semi-arid areas. The trends of ET change are different in different seasons and regions, and the spatial patterns of ET in the seven climate zones of China may be affected by the changes in NDVI, precipitation and temperature [46,47,48].
As shown in Figure 4 and Figure 10, the spatial distribution of ET across mainland China generally aligns with the patterns of NDVI and precipitation, both showing an increasing trend from northwest to southeast. In humid and subhumid regions (such as regions I, III, IV, and V), increased precipitation and NDVI drove higher ET. This is consistent with previous studies showing that, in humid regions, vegetation activity (NDVI) and moisture availability (precipitation) are the primary determinants of ET [9]. However, in temperate and warm temperate regions (such as regions II and VI), despite the high temperatures, ET remains low due to extreme moisture scarcity, indicating that while temperature provides the energy for ET, the lack of available moisture (primarily caused by low precipitation and sparse vegetation) restricts actual ET. This finding is consistent with the study of Yao et al. [49]. In addition, on the Qinghai–Tibetan Plateau (region VII), although the temperature is relatively low, the presence of glaciers, wetlands, and alpine meadows supports moderate ET, particularly where NDVI is increasing due to climate warming [50].
At the same time, the interannual trends of ET across mainland China in 2001–2018 exhibit significant relationships with NDVI, precipitation, and temperature variations, though the dominant controlling factors differ regionally. As shown in Figure 11 and Figure 12, in humid and subhumid regions (such as regions I, III, IV, and V) and Inner Mongolia (region II), ET exhibited increasing trends along with NDVI, precipitation, and temperature. A particularly noteworthy case was observed in tropical humid southern China (region V), where ET showed a significant increase (2.379 mm/yr) despite a slight decrease in precipitation. This might be explained by the combined impacts of warming—enhanced water use efficiency and NDVI growth (2.3 × 10⁻⁴/yr) [51]. In contrast, in northwestern China (region VI), the reduction in ET (−0.954 mm/yr) was directly associated with NDVI decline (−7.4 × 10⁻⁴/yr), indicating that water availability served as the primary limiting factor for ET changes. This reflects the inhibitory effect of water stress on the vegetation—the ET system [52,53]. On the Tibetan Plateau (region VII), the slight decrease in ET (−0.375 mm/yr) was mainly influenced by the combined effects of low-temperature limitation and NDVI reduction (−6.2 × 10⁻⁵/yr). Overall, the analysis highlights distinct regional drivers of ET trends: in humid regions, vegetation vigor and precipitation dominate; in arid regions, water availability is the key constraint; and in alpine regions, ET is modulated by both temperature and vegetation changes. These regional insights provide a deeper understanding of ET dynamics under shifting climate regimes. These findings align with global ET control mechanisms [54].

5.2. Limitations, Uncertainties, and Outlooks for Future Study

The Sigmoid-RH ET model has three advantages. First, compared with the original PT model, the Sigmoid-RH fully accounts for the influence of RH on ET estimation. Zhang et al. [55] demonstrated that VPD, derived from RH, is a key factor affecting ET on a daily scale. By introducing the Sigmoid function to represent the nonlinear effect of RH on ET, the model considerably increases the remote sensing-based ET models’ estimation accuracy. Second, compared to other ET estimation models, Sigmoid-RH requires fewer input variables—only T a , Rn, RH, and NDVI. These four types of inputs are readily available from well-developed and highly accurate regional reanalysis datasets, thereby reducing the uncertainty in output results caused by input data inaccuracies [56,57]. Finally, the simplified estimation procedure effectively avoids the uncertainties introduced by the extensive resistance parameterization schemes typically found in models such as the PM equation. This enhances the model’s efficiency, applicability, and robustness, particularly for large-scale ET assessments using remote sensing data.
Nonetheless, the Sigmoid-RH ET model has three limitations. First, although the model performs well in vegetation-covered areas, its estimation accuracy is poor in water-limited regions such as bare land and shrublands. In these arid environments, SM is the dominant factor controlling ET [58], yet it is not explicitly considered in the current model. This limitation may restrict the model’s applicability in dryland ecosystems. To address this issue, future work could incorporate soil moisture data from remote sensing or reanalysis sources to enhance the model’s capacity to capture moisture constraints and improve performance in arid regions such as shrublands and bare soil areas. Second, Sigmoid-RH adopts a fixed empirical value for the advection correction coefficient α. However, α is significantly influenced by external factors including land surface characteristics, solar radiation, vapor pressure deficit, and air temperature. These influences cause α to vary across different climatic regions, meaning that the assumption of a uniform α value may not be universally valid [59,60]. This introduces limitations to the model’s applicability across diverse environments. Lastly, although the model effectively reduces estimation uncertainty by simplifying input requirements and parameterizations, its underlying physical mechanisms are relatively weakened, limiting a deeper understanding of the dependencies of ET on environmental variables.
In addition to the aforementioned limitations, it is important to acknowledge the potential uncertainties embedded in the spatially explicit ET estimates produced by the Sigmoid-RH model. Although the model shows good consistency with ground observations across different vegetation types and climatic zones, the propagation of uncertainties from input datasets (e.g., Rn, RH, and NDVI) to the final ET outputs remains inevitable. These inputs, particularly remote sensing-derived variables, are subject to retrieval errors, sensor limitations, and cloud contamination, all of which can introduce spatial and temporal variability in ET estimates. Furthermore, the lack of region-specific calibration of the sigmoid parameters may cause under- or over-estimation of ET in transitional zones with mixed hydrothermal regimes. While the model has demonstrated robust large-scale performance, future work should include quantitative uncertainty assessments (e.g., through Monte Carlo simulations or ensemble modeling) and sensitivity analyses to better constrain the reliability of ET products and support their application in water resource decision-making under changing climate conditions.

6. Conclusions

The primary goal of this study is to calculate terrestrial ET over mainland China from 2001 to 2018 using the Sigmoid-RH model. The performance of this model was first validated at the site scale using observed ET data from 20 EC flux towers, demonstrating strong reliability. Based on this validation, we applied the Sigmoid-RH model in conjunction with satellite remote sensing and meteorological reanalysis datasets to investigate the spatiotemporal characteristics of ET across mainland China during the study period. The results confirm that the Sigmoid-RH model is effective for large-scale ET estimation, particularly in conical terrain regions. The following are the primary conclusions of this study:
The Sigmoid-RH model demonstrated strong accuracy across 20 EC flux tower sites, with RMSE values ranging from 0.5 to 1.2 mm/day and KGE scores between 0.38 and 0.93 at the site scale. When driven by satellite observations and reanalysis datasets, the model produced RMSE values of 0.5–1.3 mm/day and KGE values spanning from 0.16 to 0.91.
The spatial pattern of mean terrestrial ET across mainland China from 2001 to 2018, exhibits a clear gradient increasing from the arid northwest to the humid southeast. This distribution closely corresponds to climatic zonation and displays pronounced seasonal variability. Temporally, terrestrial ET across mainland China exhibits both seasonal variability and a distinct linear trend, characterized by a decreasing phase from 2001 to 2009 and an increasing phase from 2009 to 2018.
Variations in P and the NDVI have played a contributory role in shaping the temporal dynamics of terrestrial ET across mainland China.
Therefore, the reliable estimation of ET plays a vital role in advancing research on forest ecosystems and agricultural drought at the regional scale. Additionally, it supports well-informed decision-making in the areas of climate change adaptation, forest conservation, and water resource management. To achieve more efficient and sustainable forest and water resource management methods, it can be crucial to encourage science education and strengthen observational networks.

Author Contributions

Conceptualization, J.F. and Y.Y.; methodology, J.F. and Y.Y.; software, J.F. and Z.X.; validation, L.Z. and F.Q.; formal analysis, J.F.; investigation, L.L. and Y.K.; resources, J.Q. and D.S.; data curation, Y.L.; writing—original draft preparation, J.F.; writing—review and editing, Y.Y. and Y.L.; visualization, X.Z.; funding acquisition, Y.Y. All authors have read and agreed to the published version of the manuscript.

Funding

This research was funded by the Natural Science Fund of China (No. 42171310 and No. 42192581).

Data Availability Statement

The data presented in this study are available on request from the corresponding author. The data are not publicly available due to privacy.

Conflicts of Interest

The authors declare no conflicts of interest.

References

  1. Fisher, J.B.; Melton, F.; Middleton, E.; Hain, C.; Anderson, M.; Allen, R.; McCabe, M.F.; Hook, S.; Baldocchi, D.; Townsend, P.A.; et al. The future of evapotranspiration: Global requirements for ecosystem functioning, carbon and climate feedbacks, agricultural management, and water resources. Water Resour. Res. 2017, 53, 2618–2626. [Google Scholar] [CrossRef]
  2. Milly, P.C.D.; Dunne, K.A. Colorado River flow dwindles as warming-driven loss of reflective snow energizes evaporation. Science 2020, 367, 1252–1255. [Google Scholar] [CrossRef] [PubMed]
  3. Allen, R.G.; Pereira, L.S.; Howell, T.A.; Jensen, M.E. Evapotranspiration information reporting: I. Factors governing measurement accuracy. Agric. Water Manag. 2011, 98, 899–920. [Google Scholar] [CrossRef]
  4. Jasechko, S.; Sharp, Z.D.; Gibson, J.J.; Jean Birks, S.; Yi, Y.; Fawcett, P.J. Terrestrial water fluxes dominated by transpiration. Nature 2013, 496, 347–350. [Google Scholar] [CrossRef] [PubMed]
  5. Li, Z.-L.; Tang, R.; Wan, Z.; Bi, Y.; Zhou, C.; Tang, B.; Yan, G.; Zhang, X. A Review of Current Methodologies for Regional Evapotranspiration Estimation from Remotely Sensed Data. Sensors 2009, 9, 3801–3853. [Google Scholar] [CrossRef] [PubMed]
  6. Mariano, D.A.; Santos, C.a.C.D.; Wardlow, B.D.; Anderson, M.C.; Schiltmeyer, A.V.; Tadesse, T.; Svoboda, M.D. Use of remote sensing indicators to assess effects of drought and human-induced land degradation on ecosystem health in Northeastern Brazil. Remote Sens. Environ. 2018, 213, 129–143. [Google Scholar] [CrossRef]
  7. Senay, G.B.; Schauer, M.; Friedrichs, M.; Velpuri, N.M.; Singh, R.K. Satellite-based water use dynamics using historical Landsat data (1984–2014) in the southwestern United States. Remote Sens. Environ. 2017, 202, 98–112. [Google Scholar] [CrossRef]
  8. Morillas, L.; Pangle, R.E.; Maurer, G.E.; Pockman, W.T.; McDowell, N.; Huang, C.-W.; Krofcheck, D.J.; Fox, A.M.; Sinsabaugh, R.L.; Rahn, T.A.; et al. Tree Mortality Decreases Water Availability and Ecosystem Resilience to Drought in Piñon-Juniper Woodlands in the Southwestern U.S. J. Geophys. Res.-Biogeosci. 2017, 122, 3343–3361. [Google Scholar] [CrossRef]
  9. Jung, M.; Reichstein, M.; Ciais, P.; Seneviratne, S.I.; Sheffield, J.; Goulden, M.L.; Bonan, G.; Cescatti, A.; Chen, J.; Jeu, R.D.; et al. Recent decline in the global land evapotranspiration trend due to limited moisture supply. Nature 2010, 467, 951–954. [Google Scholar] [CrossRef]
  10. Fu, J.; Gong, Y.; Zheng, W.; Zou, J.; Zhang, M.; Zhang, Z.; Qin, J.; Liu, J.; Quan, B. Spatial-temporal variations of terrestrial evapotranspiration across China from 2000 to 2019. Sci. Total Environ. 2022, 825, 153951. [Google Scholar] [CrossRef]
  11. Niu, Z.; He, H.; Zhu, G.; Ren, X.; Zhang, L.; Zhang, K. A spatial-temporal continuous dataset of the transpiration to evapotranspiration ratio in China from 1981–2015. Sci. Data 2020, 7, 369. [Google Scholar] [CrossRef] [PubMed]
  12. Li, S.; Wang, G.; Sun, S.; Hagan, D.F.T.; Chen, T.; Dolman, H.; Liu, Y. Long-term changes in evapotranspiration over China and attribution to climatic drivers during 1980–2010. J. Hydrol. 2021, 595, 126037. [Google Scholar] [CrossRef]
  13. Wang, K.; Li, Z.; Cribb, M. Estimation of evaporative fraction from a combination of day and night land surface temperatures and NDVI: A new method to determine the Priestley–Taylor parameter. Remote Sens. Environ. 2006, 102, 293–305. [Google Scholar] [CrossRef]
  14. Monteith, J.L. Evaporation and environment. Symp. Soc. Exp. Biol. 1965, 19, 205–234. [Google Scholar]
  15. Hargreaves, G.H.; Samani, Z.A. Reference Crop Evapotranspiration from Temperature. Appl. Eng. Agric. 1985, 1, 96–99. [Google Scholar] [CrossRef]
  16. Shuttleworth, W.J.; Wallace, J.S. Evaporation from sparse crops-an energy combination theory. Q. J. R. Meteorol. Soc. 1985, 111, 839–855. [Google Scholar] [CrossRef]
  17. Bastiaanssen, W.G.M.; Menenti, M.; Feddes, R.A.; Holtslag, A.A.M. A remote sensing surface energy balance algorithm for land (SEBAL). 1. Formulation. J. Hydrol. 1998, 212–213, 198–212. [Google Scholar] [CrossRef]
  18. Allen, R.; Irmak, A.; Trezza, R. Satellite-based ET estimation in agriculture using SEBAL and METRIC. Hydrol. Process. 2011, 25, 4011–4027. [Google Scholar] [CrossRef]
  19. Senay, G.B.; Bohms, S.; Singh, R.K.; Gowda, P.H.; Velpuri, N.M.; Alemu, H.; Verdin, J.P. Operational Evapotranspiration Mapping Using Remote Sensing and Weather Datasets: A New Parameterization for the SSEB Approach. J. Am. Water Res. Assoc. 2013, 49, 577–591. [Google Scholar] [CrossRef]
  20. Bonan, G.B.; Lawrence, P.J.; Oleson, K.W.; Levis, S.; Jung, M.; Reichstein, M.; Lawrence, D.M.; Swenson, S.C. Improving canopy processes in the Community Land Model version 4 (CLM4) using global flux fields empirically inferred from FLUXNET data. J. Geophys. Res.-Biogeosci. 2011, 116, G02014. [Google Scholar] [CrossRef]
  21. Niu, G.-Y.; Yang, Z.-L.; Mitchell, K.E.; Chen, F.; Ek, M.B.; Barlage, M.; Kumar, A.; Manning, K.; Niyogi, D.; Rosero, E.; et al. The community Noah land surface model with multiparameterization options (Noah-MP): 1. Model description and evaluation with local-scale measurements. J. Geophys. Res.-Atmos. 2011, 116, D12109. [Google Scholar] [CrossRef]
  22. Yuan, W.; Liu, S.; Yu, G.; Bonnefond, J.; Chem, J.; Davis, K.; Desai, A.R.; Goldstein, A.H.; Gianelle, D.; Rossi, F.; et al. Global estimates of evapotranspiration and gross primary production based on MODIS and global meteorology data. Remote Sens. Environ. 2010, 114, 1416–1431. [Google Scholar] [CrossRef]
  23. Mu, Q.; Heinsch, F.A.; Zhao, M.; Running, S.W. Development of a global evapotranspiration algorithm based on MODIS and global meteorology data. Remote Sens. Environ. 2007, 111, 519–536. [Google Scholar] [CrossRef]
  24. Mu, Q.; Zhao, M.; Running, S.W. Improvements to a MODIS global terrestrial evapotranspiration algorithm. Remote Sens. Environ. 2011, 115, 1781–1800. [Google Scholar] [CrossRef]
  25. Martens, B.; Miralles, D.G.; Lievens, H.; Schalie, R.; Jeu, R.A.M.; Fernadez-Prieto, D.; Beck, H.E.; Dorigo, W.A.; Verhoest, N.E.C. GLEAM v3: Satellite-based land evaporation and root-zone soil moisture. Geosci. Model Dev. 2017, 10, 1903–1925. [Google Scholar] [CrossRef]
  26. Martens, B.; Miralles, D.; Lievens, H.; Fernandez-Prieto, D.; Verhoest, N.E.C. Improving terrestrial evaporation estimates over continental Australia through assimilation of SMOS soil moisture. Int. J. Appl. Earth Obs. 2016, 48, 146–162. [Google Scholar] [CrossRef]
  27. Liang, S.; Cheng, J.; Jia, K.; Jiang, B.; Liu, Q.; Xiao, Z.; Yao, Y.; Yuan, W.; Zhang, X.; Zhao, X.; et al. The Global Land Surface Satellite (GLASS) Product Suite. Bull. Am. Meteorol. Soc. 2021, 102, E323–E337. [Google Scholar] [CrossRef]
  28. Liang, S.; Xiang, Z.; Suhong, L.; Wenping, Y.; Xiao, C.; Zhiqiang, X.; Qiang, L.; Jie, C.; Tang, H.; Yancheng, B.; et al. A long-term Global LAnd Surface Satellite (GLASS) data-set for environmental studies. Int. J. Digit. Earth 2013, 6, 5–33. [Google Scholar] [CrossRef]
  29. Gan, R.; Zhang, Y.; Shi, H.; Yang, Y.; Eamus, D.; Cheng, L.; Chiew, F.H.S.; Yu, Q. Use of satellite leaf area index estimating evapotranspiration and gross assimilation for Australian ecosystems. Ecohydrology 2018, 11, e1974. [Google Scholar] [CrossRef]
  30. Zhang, Y.; Kong, D.; Gan, R.; Chiew, F.H.S.; McVicar, T.R.; Zhang, Q.; Yang, Y. Coupled estimation of 500 m and 8-day resolution global evapotranspiration and gross primary production in 2002–2017. Remote Sens. Environ. 2019, 222, 165–182. [Google Scholar] [CrossRef]
  31. Yao, J.; Li, C.; Yang, H.; Liu, Z. Assessments of three evapotranspiration products over China using extended triple collocation and water balance methods. J. Hydrol. 2022, 614, 0022–1694. [Google Scholar]
  32. Zhang, Y.; Peña-Arancibia, J.L.; Mcvicar, T.R.; Chiew, F.H.S.; Vaze, J.; Liu, C.; Lu, X.; Zheng, H.; Wang, Y.; Liu, Y.Y.; et al. Multi-decadal trends in global terrestrial evapotranspiration and its components. Sci. Rep. 2016, 6, 19124. [Google Scholar] [CrossRef] [PubMed]
  33. Xiao, J.; Sun, F.; Wang, T.; Wang, H. Estimation and validation of high-resolution evapotranspiration products for an arid river basin using multi-source remote sensing data. Agric. Water Manag. 2024, 298, 108864. [Google Scholar] [CrossRef]
  34. Piao, S.; Yin, G.; Tan, J.; Cheng, L.; Huang, M.; Li, Y.; Liu, R.; Mao, J.; Myneni, R.B.; Peng, S.; et al. Detection and attribution of vegetation greening trend in China over the last 30 years. Glob. Change Biol. 2015, 21, 1601–1609. [Google Scholar] [CrossRef] [PubMed]
  35. Jiang, C.; Ryu, Y.; Fang, H.; Myneni, R.; Claverie, M.; Zhu, Z. Inconsistencies of interannual variability and trends in long-term satellite leaf area index products. Glob. Change Biol. 2017, 23, 4133–4146. [Google Scholar] [CrossRef]
  36. Chen, Y.; Wang, K.; Lin, Y.; Shi, W.; Song, Y.; He, X. Balancing green and grain trade. Nat. Geosci. 2015, 8, 739–741. [Google Scholar] [CrossRef]
  37. Fisher, J.B.; Whittaker, R.J.; Malhi, Y. ET come home: Potential evapotranspiration in geographical ecology. Glob. Ecol. Biogeogr. 2011, 20, 1–18. [Google Scholar] [CrossRef]
  38. Qiu, R.; Liu, C.; Cui, N.; Wu, Y.; Wang, Z.; Li, G. Evapotranspiration estimation using a modified Priestley-Taylor model in a rice-wheat rotation system. Agric. Water Manag. 2019, 224, 105755. [Google Scholar] [CrossRef]
  39. Szilagyi, J. On the inherent asymmetric nature of the complementary relationship of evaporation. Geophys. Res. Lett. 2007, 34, L02405. [Google Scholar] [CrossRef]
  40. Yan, H.; Shugart, H.H. An air relative-humidity-based evapotranspiration model from eddy covariance data. J. Geophys. Res.-Atmos. 2010, 115, D16106. [Google Scholar] [CrossRef]
  41. Rouse, W.R. Microclimate at Arctic Tree Line 3. The Effects of Regional Advection on the Surface Energy Balance of Upland Tundra. Water Resour. Res. 1984, 20, 74–78. [Google Scholar] [CrossRef]
  42. Halliwell, D.H.; Rouse, W.R. Soil heat flux in permafrost: Characteristics and accuracy of measurement. Int. J. Climatol. 1987, 7, 571–584. [Google Scholar] [CrossRef]
  43. Zhang, K.; Kimball, J.S.; Mu, Q.; Jones, L.A.; Goetz, S.J.; Running, S.W. Satellite based analysis of northern ET trends and associated changes in the regional water balance from 1983 to 2005. J. Hydrol. 2009, 379, 92–110. [Google Scholar] [CrossRef]
  44. Yao, Y.; Liang, S.; Cheng, J.; Liu, S.; Fisher, J.B.; Zhang, X.; Jia, K.; Zhao, X.; Qin, Q.; Zhao, B.; et al. MODIS-driven estimation of terrestrial latent heat flux in China based on a modified Priestley–Taylor algorithm. Agric. For. Meteorol. 2013, 171–172, 187–202. [Google Scholar] [CrossRef]
  45. Yang, J.; Yao, Y.; Shao, C.; Li, Y.; Fisher, J.B.; Cheng, J.; Chen, J.; Jia, K.; Zhang, X.; Shang, K.; et al. A novel TIR-derived three-source energy balance model for estimating daily latent heat flux in mainland China using an all-weather land surface temperature product. Agric. For. Meteorol. 2022, 323, 109066. [Google Scholar] [CrossRef]
  46. Mo, X.; Liu, S.; Lin, Z.; Wang, S.; Hu, S. Trends in land surface evapotranspiration across China with remotely sensed NDVI and climatological data for 1981–2010. Hydrolog. Sci. J. 2015, 60, 2163–2177. [Google Scholar] [CrossRef]
  47. Zhou, L.; Wang, S.; Chen, J.; Feng, X.; Ju, W.; Wu, W. The Spatial-Temporal Characteristics of Evapotranspiration of China’s Terrestrial Ecosystems during 1991~2000. Resour. Sci. 2009, 31, 962–972. [Google Scholar]
  48. Gao, G.; Chen, D.; Xu, C.-Y.; Simelton, E. Trend of estimated actual evapotranspiration over China during 1960–2002. J. Geophys. Res.-Atmos. 2007, 112, D11120. [Google Scholar] [CrossRef]
  49. Yao, J.; Zhao, L.; Ding, Y.; Gu, L.; Jiao, K.; Qiao, Y.; Wang, Y. The surface energy budget and evapotranspiration in the Tanggula region on the Tibetan Plateau. Cold Reg. Sci. Technol. 2008, 52, 326–340. [Google Scholar] [CrossRef]
  50. Yang, K.; Wu, H.; Qin, J.; Lin, C.; Tang, W.; Chen, Y. Recent climate changes over the Tibetan Plateau and their impacts on energy and water cycle: A review. Glob. Planet. Chang. 2014, 112, 79–91. [Google Scholar] [CrossRef]
  51. Chen, C.; Park, T.; Wang, X.; Piao, S.; Xu, B.; Chaturvedi, R.K.; Fuchs, R.; Brovkin, V.; Ciais, P.; Fensholt, R.; et al. China and India lead in greening of the world through land-use management. Nat. Sustain. 2019, 2, 122–129. [Google Scholar] [CrossRef] [PubMed]
  52. Zhao, M.; Running, S.W. Drought-Induced Reduction in Global Terrestrial Net Primary Production from 2000 Through 2009. Science 2010, 329, 940–943. [Google Scholar] [CrossRef] [PubMed]
  53. Huang, J.; Yu, H.; Guan, X.; Wang, G.; Guo, R. Accelerated dryland expansion under climate change. Nat. Clim. Chang. 2016, 6, 166–171. [Google Scholar] [CrossRef]
  54. Miralles, D.G.; Holmes, T.R.H.; De Jeu, R.a.M.; Gash, J.H.; Meesters, A.G.C.A.; Dolman, A.J. Global land-surface evaporation estimated from satellite-based observations. Hydrol. Earth Syst. Sci. 2011, 15, 453–469. [Google Scholar] [CrossRef]
  55. Zhang, T.; Qiu, R.; Ding, R.; Wu, J.; Clothier, B. Multi-scale spectral characteristics of latent heat flux over flooded rice and winter wheat rotation system. Agric. Water Manag. 2023, 288, 108471. [Google Scholar] [CrossRef]
  56. Jamieson, P.D. Comparison of methods of estimating maximum evapotranspiration from a barley crop: A correction. N. Z. J. Sci. 1982, 22, 175–181. [Google Scholar]
  57. Sun, X.; Zhang, B.; Dai, M.; Gao, R.; Jing, C.; Ma, K.; Gu, S.; Gu, L.; Zhen, W.; Gu, X.; et al. Research on methods for estimating reference crop evapotranspiration under incomplete meteorological indicators. Front. Plant Sci. 2024, 15, 1354913. [Google Scholar] [CrossRef]
  58. Yao, Y.; Zhang, Y.; Liu, Q.; Liu, S.; Jia, K.; Zhang, X.; Xu, Z.; Xu, T.; Chen, J.; Fisher, J.B.; et al. Evaluation of a satellite-derived model parameterized by three soil moisture constraints to estimate terrestrial latent heat flux in the Heihe River basin of Northwest China. Sci. Total Environ. 2019, 695, 133787. [Google Scholar] [CrossRef]
  59. Liu, Y.; Sun, H.; Gui, D. Actual evapotranspiration estimation of Xinjiang based on PT—Fi model and its responses of climatic and environmental factors. J. Water Resour. Water Eng. 2020, 31, 193–198. [Google Scholar]
  60. Cheng, Q.; Xu, Q.; Chen, C.; Sun, Y.; Wang, Z.; Xue, X. Applicable Analysis and Parameter Modification of Evapotranspiration Models during Wintertime. Trans. Chin. Soc. Agric. Mach. 2018, 49, 317–325. [Google Scholar]
Figure 1. Study area with seven climate zones. (I: Temperate humid and subhumid northeastern China; II: Temperate grassland of Inner Mongolia; III: Warm-temperate humid and subhumid northern China; IV: Subtropical humid central and southern China; V: Tropic humid southern China; VI: Temperate and warm-temperate northwestern China desert; VII: Qinghai-Tibetan Plateau).
Forests 16 01157 g001
Figure 2. A Comparison of Predicted and Observed Daily ET Using the Sigmoid-RH Model Based on Site-Level Meteorological Inputs Across 20 Flux Tower Sites Representing Different Land Cover Types. R2, RMSE, Bias, and KGE are provided to evaluate model performance.
Forests 16 01157 g002
Figure 3. Scatterplots comparing daily predicted ET from the Sigmoid-RH model and ground-based observations across various land cover types, using reanalysis meteorological data as model inputs. Statistical metrics including R2, RMSE, Bias, and KGE are provided to evaluate model performance.
Forests 16 01157 g003
Figure 4. Annual spatial patterns of ET across mainland China for 2001–2018.
Forests 16 01157 g004
Figure 5. Seasonal spatial patterns of ET across mainland China from 2001 to 2018. Spring: March, April, and May; Summer: June, July, and August; Autumn: September, October, and November; Winter: December, January, and February.
Forests 16 01157 g005
Figure 6. Interannual variability of ET from 2001 to 2018 over the seven climate zones. (a) Mainland China; (b) Climate zone I; (c) Climate zone II; (d) Climate zone III; (e) Climate zone IV; (f) Climate zone V; (g) Climate zone VI; (h) Climate zone VII.
Forests 16 01157 g006
Figure 7. Seasonal ET Variability on an Interannual Scale (2001–2018) Across China’s Seven Climate Zones.
Forests 16 01157 g007
Figure 8. Annual spatiotemporal trends in ET across mainland China from 2001 to 2018 (p < 0.05). Regions marked with black dots indicate statistically significant changes at the 95% confidence level.
Forests 16 01157 g008
Figure 9. Seasonal spatiotemporal variations in ET across mainland China from 2001 to 2018. The black dots mean the regions have been checked by significant tests at a 95% confidence level.
Forests 16 01157 g009
Figure 10. Annual spatial patterns of NDVI, precipitation (P), and temperature (Ta) across mainland China from 2001 to 2018.
Forests 16 01157 g010
Figure 11. Yearly variations in NDVI, precipitation (P), and temperature (Ta) across mainland China (ac) and its seven climate zones from 2001 to 2018. (a1c1) Climate zone I; (a2c2) Climate zone II; (a3c3) Climate zone III; (a4c4) Climate zone IV; (a5c5) Climate zone V; (a6c6) Climate zone VI; (a7c7) Climate zone VII.
Forests 16 01157 g011
Figure 12. Annual spatiotemporal variations in NDVI, precipitation (P), and temperature (Ta) across mainland China and its different climate zones from 2001 to 2018. Areas marked with black dots passed significance testing at the 95% confidence threshold (p < 0.05).
Forests 16 01157 g012
Table 1. Detailed information for 20 sites.
Site NameIGBPLon (E)Lat (N)Time Period
Changbaishan (CBS)MIF128.09°42.4°2002–2007
Dinghushan (DHS)EBF112.53°23.17°2002–2007
Fukang (FK)BAR87.92°44.28°2007
Guantao (GT)CRO115.13°36.52°2009
Haibei (HB)OSH101.32°37.62°2003–2005
Huazhaizi (HZZ)BAR100.32°38.77°2015–2018
Inner Mongolia (IM)GRA117.17°44.50°2003–2007
Jinzhou (JZ)CRO121.21°41.18°2008–2009
Laoshan (LS)DNF127.58°45.28°2005
Maqu (MQ)GRA102.14°33.89°2009
Miyun (MY)CRO117.32°40.63°2008–2009
Qianyanzhou (QYZ)ENF115.05°26.74°2003–2007
Shenshawo (SSW)BAR100.49°38.79°2012–2014
Tongyu (TY)CRO122.88°44.56°2008–2009
XIshuangbanna (XSBN)EBF101.27°21.95°2004–2007
Yucheng (YC)CRO116.57°36.83°2003–2007
Naqu (NQ)GRA91.90°31.37°2008–2010
Huaining (HN)DBF117.00°33.00°2005–2006
Yueyang (YY)DBF112.51°29.31°2005–2006
Dongtan (DT)WET121.90°31.58°2005
Disclaimer/Publisher’s Note: The statements, opinions and data contained in all publications are solely those of the individual author(s) and contributor(s) and not of MDPI and/or the editor(s). MDPI and/or the editor(s) disclaim responsibility for any injury to people or property resulting from any ideas, methods, instructions or products referred to in the content.

