Article

Optimized MaxEnt Modeling of Catalpa bungei Habitat for Sustainable Management Under Climate Change in China

1
School of Horticulture, Ludong University, Yantai 264025, China
2
Shandong Mengyin State-Owned Forest Farm, Linyi 276200, China
*
Author to whom correspondence should be addressed.
Forests 2025, 16(7), 1150; https://doi.org/10.3390/f16071150
Submission received: 17 June 2025 / Revised: 7 July 2025 / Accepted: 9 July 2025 / Published: 11 July 2025
(This article belongs to the Section Forest Inventory, Modeling and Remote Sensing)

Abstract

Catalpa bungei C. A. Mey, an economically and ecologically important tree species endemic to China, exhibits notable drought resistance; however, the spatial dynamics of its habitat under future climate change have not been thoroughly investigated. We employed a parameter-optimized MaxEnt modeling framework to project current and future suitable habitats for C. bungei under two Shared Socioeconomic Pathway scenarios, SSP126 (low-emission) and SSP585 (high-emission), based on CMIP6 climate data. We incorporated 126 spatially rarefied occurrence records and 22 environmental variables into a rigorous modeling workflow that included multicollinearity assessment and systematic variable screening. Parameter optimization was performed using the kuenm package in R version 4.2.3, and the best-performing model configuration was selected (Regularization Multiplier = 2.5; Feature Combination = LQT) based on the AICc, omission rate, and evaluation metrics (AUC, TSS, and Kappa). Model validation demonstrated robust predictive accuracy. Four primary environmental predictors obtained from WorldClim version 2.1—the minimum temperature of the coldest month (Bio6), annual precipitation (Bio12), maximum temperature of the warmest month (Bio5), and elevation—collectively explained over 90% of habitat suitability. Currently, the optimal habitats are concentrated in central and eastern China. By the 2090s, the total suitable habitats are projected to increase by approximately 4.25% under SSP126 and 18.92% under SSP585, coupled with a significant northwestward shift in the habitat centroid. Conversely, extremely suitable habitats are expected to markedly decline, particularly in southern China, due to escalating climatic stress. These findings highlight the need for adaptive afforestation planning and targeted conservation strategies to enhance the climate resilience of C. bungei under future climate change.

1. Introduction

Forests are among Earth’s most critical and biodiverse ecosystems, providing multifunctional services that span ecological, socioeconomic, and environmental dimensions [1]. As a fundamental focus of forestry research, forest resources sustain human livelihoods and serve as essential biophysical and socioeconomic prerequisites for achieving the Sustainable Development Goals (SDGs) and preserving ecosystem resilience. Hence, quantifying spatiotemporal heterogeneity in forest resource dynamics is vital for advancing socio-ecological coordination and mitigating planet-wide ecological crises. By examining the niche differentiation of forest resources, particularly tree growth under variable climatic and edaphic conditions, Species Distribution Models (SDMs) and community assemblages can be delineated, thereby supporting adaptive management and biodiversity conservation [2,3]. Such strategies not only ensure sustainable yield, but also address socio-environmental trade-offs. For instance, China’s per capita forest area (0.15 ha; FAO, 2020) is only 31% of the global average (0.48 ha), underlining the need for polycentric governance to reconcile conservation objectives with resource provisioning [4,5]. Anthropogenic climate forcing further exacerbates habitat fragmentation and biome degradation, posing existential threats to biodiversity hotspots and ecosystem multifunctionality [6]. The IPCC’s Sixth Assessment Report attributes global surface warming (1.09 °C ± 0.08 °C since 1850–1900) predominantly to anthropogenic greenhouse gas emissions, with China experiencing amplified warming (1.5 °C above pre-industrial levels) due to regional feedback mechanisms [7,8]. Climatic niche constraints regulate forest stand dynamics, including recruitment rates, canopy closure, and reproductive phenology, thereby rendering climate-driven regime shifts as nonlinear threats to forests’ structural complexity [9,10]. Consequently, transdisciplinary research, landscape-scale conservation, and circular bioeconomy frameworks are urgently required to safeguard forest resources.
Catalpa bungei C. A. Mey (hereafter C. bungei) is a deciduous tree native to China, belonging to the family Bignoniaceae and the genus Catalpa [11]. Its natural geographic range spans latitudes 22°–42° N and longitudes 88°–123° E, covering regions from China’s eastern coast to Lanzhou, Tianshui, and Hanyuan in Sichuan Province, and extending northward to Shanhaiguan as well as southward to Lincang (Yunnan) and Guangzhou (Guangdong) [11]. Cultivated for over two millennia, C. bungei is among China’s most economically important timber species, valued for its dense, decay-resistant wood used in furniture, ornamental crafts, and military applications [12,13]. Beyond its commercial significance, the species exhibits notable adaptability, drought tolerance, and genetic diversity [14,15,16], along with resistance to atmospheric pollutants such as sulfur dioxide and chlorine [17]. Notably, C. bungei demonstrates dual ecological functions: it can phytoremediate antimony (Sb)-contaminated soils and enhance soil carbon sequestration [18]. Furthermore, the bioactive compounds extracted from its leaves, particularly ursolic acid, inhibit cervical cancer cell proliferation and metastasis [19], underscoring its socioeconomic, ecological, and medicinal value. Despite these advantages, the surging timber demand fueled by rapid economic growth has accelerated resource depletion and habitat fragmentation [4]. Although China’s afforestation initiatives aim to counter deforestation, poorly planned monoculture plantations—especially in arid regions—face water resource mismanagement, exacerbating ecosystem water imbalances [20]. Compounding these issues, C. bungei is hampered by intrinsic reproductive constraints: natural populations exhibit severe self-incompatibility, resulting in seedling establishment rates of less than 10%, while artificial breeding methods often yield low survival rates. Concurrently, climate change introduces extrinsic pressures, with rising temperatures and altered precipitation patterns shifting habitat suitability and forcing upward elevational migration constrained by mountainous terrain. Moreover, the increasing frequency of extreme weather events (e.g., droughts, storms) elevates mortality risks [21,22,23,24], thereby eroding the species’ ecological niche and intensifying environmental stress [25]. To date, studies on C. bungei have primarily focused on breeding techniques [26], physiological adaptations [27], pharmaceutical applications [19], and genetic markers [28]. In contrast, ecological investigations—particularly those addressing spatial distribution dynamics and climate adaptation mechanisms—remain limited [29]. Given the synergistic threats of climate change and anthropogenic exploitation, bridging this research gap is essential for developing effective, science-based conservation strategies.
Species Distribution Models (SDMs) employ statistical algorithms to quantify species–environment relationships, enabling probabilistic predictions of ecologically suitable habitats [30,31]. These models find extensive applications in (i) biodiversity hotspot identification [32], (ii) niche characterization [33], and (iii) ecosystem management [34]. Prevalent SDM implementations include the Maximum Entropy Model (MaxEnt) [35], Genetic Algorithm for Rule-set Prediction Model (GARP) [36], CLIMate Expert distribution Model (CLIMEX) [37], Ecological Niche Factor Analysis Model (ENFA) [38], Domain Distance Model (DOMAIN) [39], and BIOlogical CLIMate Model (BIOCLIM) [40]. The MaxEnt algorithm distinguishes itself through the implementation of the Maximum Entropy principle, generating probability distributions of species occurrence by optimizing environmental covariate weights derived from presence-only data [41,42]. Key advantages include the open-source architecture, the ecological relevance of the regularization parameters, and robust performance with limited samples (n ≥ 5), cementing its status as the predominant SDM in contemporary research [43]. Comparative analyses demonstrate MaxEnt’s superior predictive performance, particularly in climate–species relationship modeling. Elith et al.’s benchmark study of 16 algorithms confirmed its top-ranking accuracy [44]. Current applications span endangered species habitat mapping, invasive species risk assessment, and endemic species refuge identification [32,45]. Emerging hybrid approaches are increasingly integrating MaxEnt with ensemble forecasting techniques. Despite these advances, peer-reviewed studies applying optimized MaxEnt frameworks to C. bungei remain scarce, particularly regarding climate-adaptive trait modeling.
Optimizing the parameters of the MaxEnt model significantly enhances prediction accuracy and reliability, as model performance largely depends on parameter sensitivity and data refinement [46,47]. Overreliance on default parameters during modeling, coupled with insufficient algorithmic exploration and data filtering, may elevate model complexity and computational costs and obscure the identification of the critical environmental variables affecting habitat suitability dynamics [48]. In species invasion studies, parameter settings demand rigorous validation due to challenges in verifying ecological equilibrium assumptions. Conversely, without proper constraints, habitat prediction models risk overfitting [49,50]. Recent studies demonstrate that optimized MaxEnt parameters and filtered datasets enable the precise simulation of climate-driven species distributions, as evidenced by habitat projections for endangered Saussurea and invasive Avena weeds in Asia [51,52]. Therefore, the strategic selection of both input data and model parameters constitutes a critical step in MaxEnt optimization. Theoretically, parameter-optimized models elucidate species–environment interactions with enhanced resolution, thereby advancing the methodological frameworks in plant ecology. Practically, habitat suitability modeling for C. bungei supports evidence-based resource management and provides essential insights for ecological restoration strategies aligned with the Sustainable Development Goals. Given China’s intensified focus on ecological civilization, rational utilization and the conservation of C. bungei resources hold substantial practical value for restoration ecology. Consequently, MaxEnt model optimization serves as a fundamental prerequisite for the robust simulation of climate-responsive habitat suitability for C. bungei.
Based on previous research, this study used an optimized MaxEnt model combined with filtered species distribution data and environmental variables to simulate the dynamic distribution of C. bungei in China from 2021 to 2100 under two climate scenarios (SSP126 and SSP585). The innovation of the study lies in the systematic optimization of the MaxEnt model’s parameters, thereby enhancing the accuracy and reliability of the prediction results. The specific objectives of this study were to (a) elucidate the distribution pattern of C. bungei under the current climatic conditions; (b) explore the key environmental factors influencing its distribution; and (c) predict potential suitable areas and their changing trends for future periods. The research findings could provide a solid scientific basis for the risk assessment and long-term management planning of C. bungei resources in China.

2. Materials and Methods

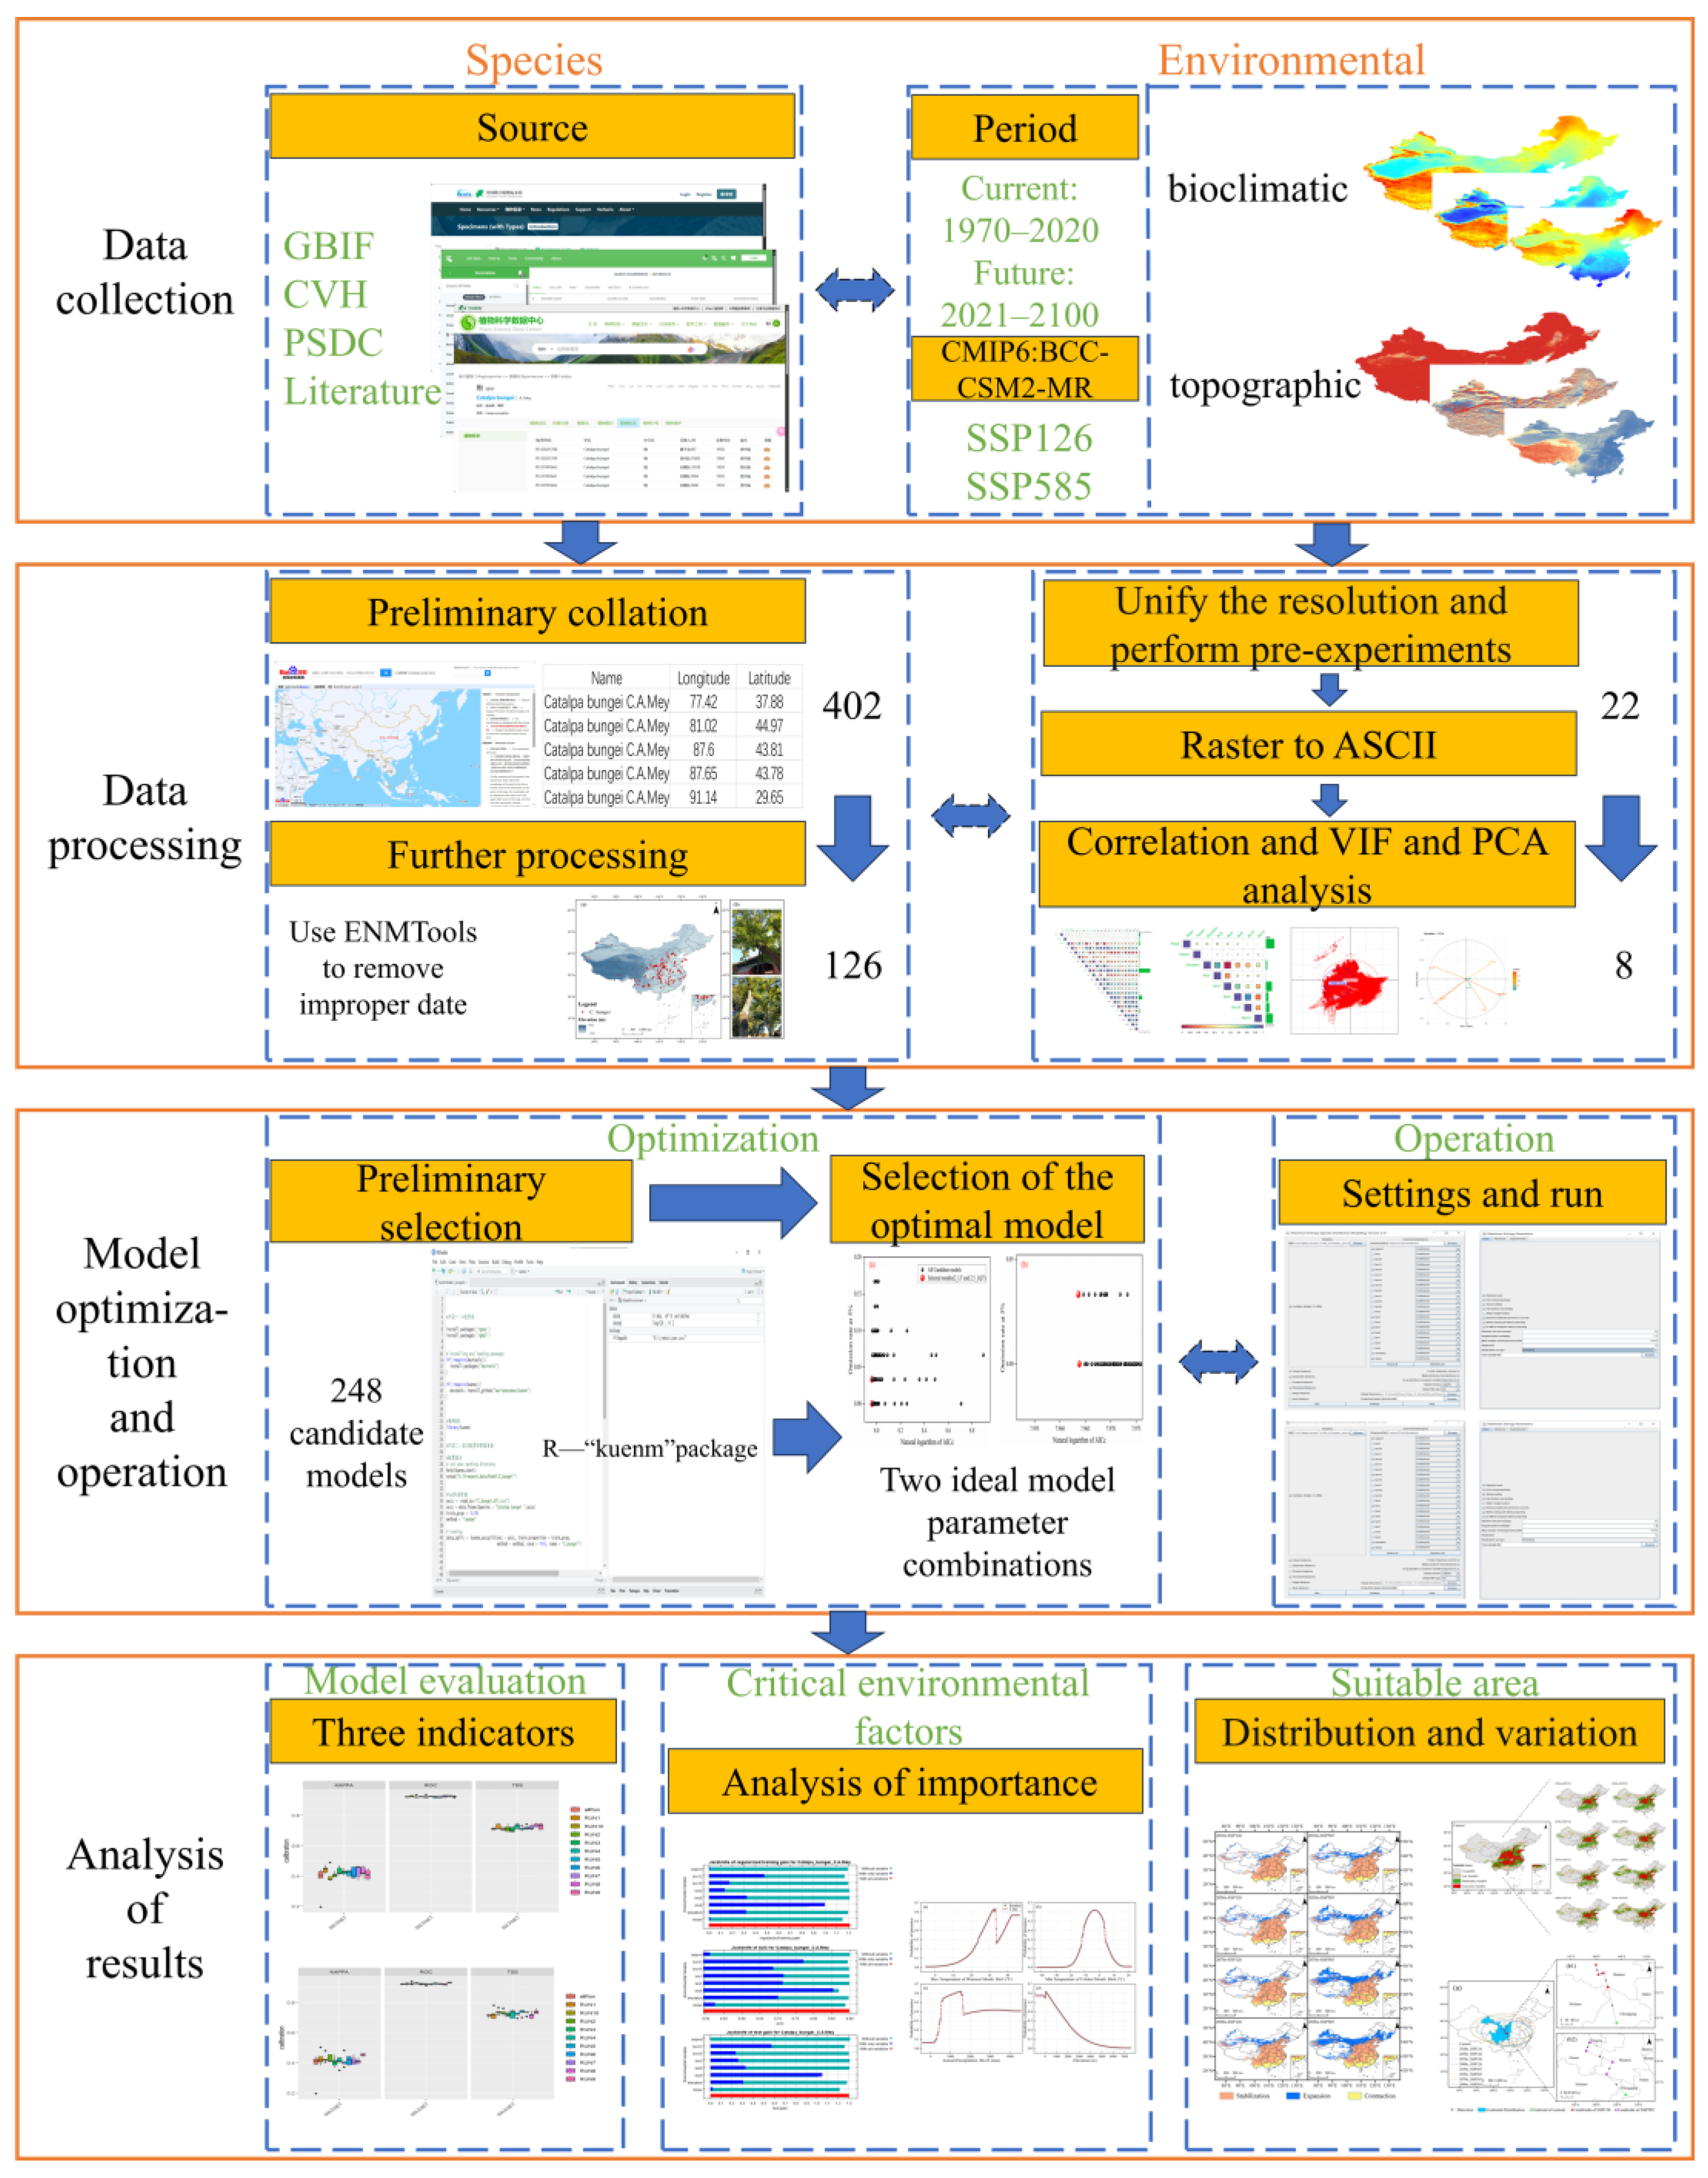
2.1. R-Based Integrated MaxEnt Modeling Framework

We developed an integrated modeling framework (Figure 1), aligned with the Maximum Entropy principle, to assess habitat suitability for C. bungei under contemporary and projected climate scenarios. This frame includes the following: (1) Data collection: Georeferenced occurrence records of C. bungei were collated from the database and the relevant literature. Bioclimatic variables and topographic indices were obtained for the baseline (1970–2020) and future SSP scenarios (2021–2100). (2) Data processing: Occurrence coordinates were converted to the decimal–degree format, and outlier records beyond China’s territorial boundaries were removed through geographic masking. Environmental layers were resampled to a 2.5′ resolution, followed by the Variance Inflation Factor (VIF < 10) and Pearson correlation (|r| < 0.8) analyses to eliminate multicollinearity. (3) Model optimization and operation: Using the kuenm package in R version 4.2.3 (R: The R Project for Statistical Computing), we implemented the machine learning-driven optimization of Regularization Multipliers (RMs) and Feature Combination (FC). Candidate models were evaluated using the TSS, ROC, and Kappa metrics to select the optimal configuration. The selected parameter set was executed in MaxEnt 3.4.1 (MaxEnt) for multitemporal habitat projections. (4) Analysis of results: Model predictions were assessed using established evaluation criteria. Key environmental factors influencing the model were identified, and their response curves were examined. Spatial distribution patterns and temporal shifts in suitable habitats for C. bungei were quantified.

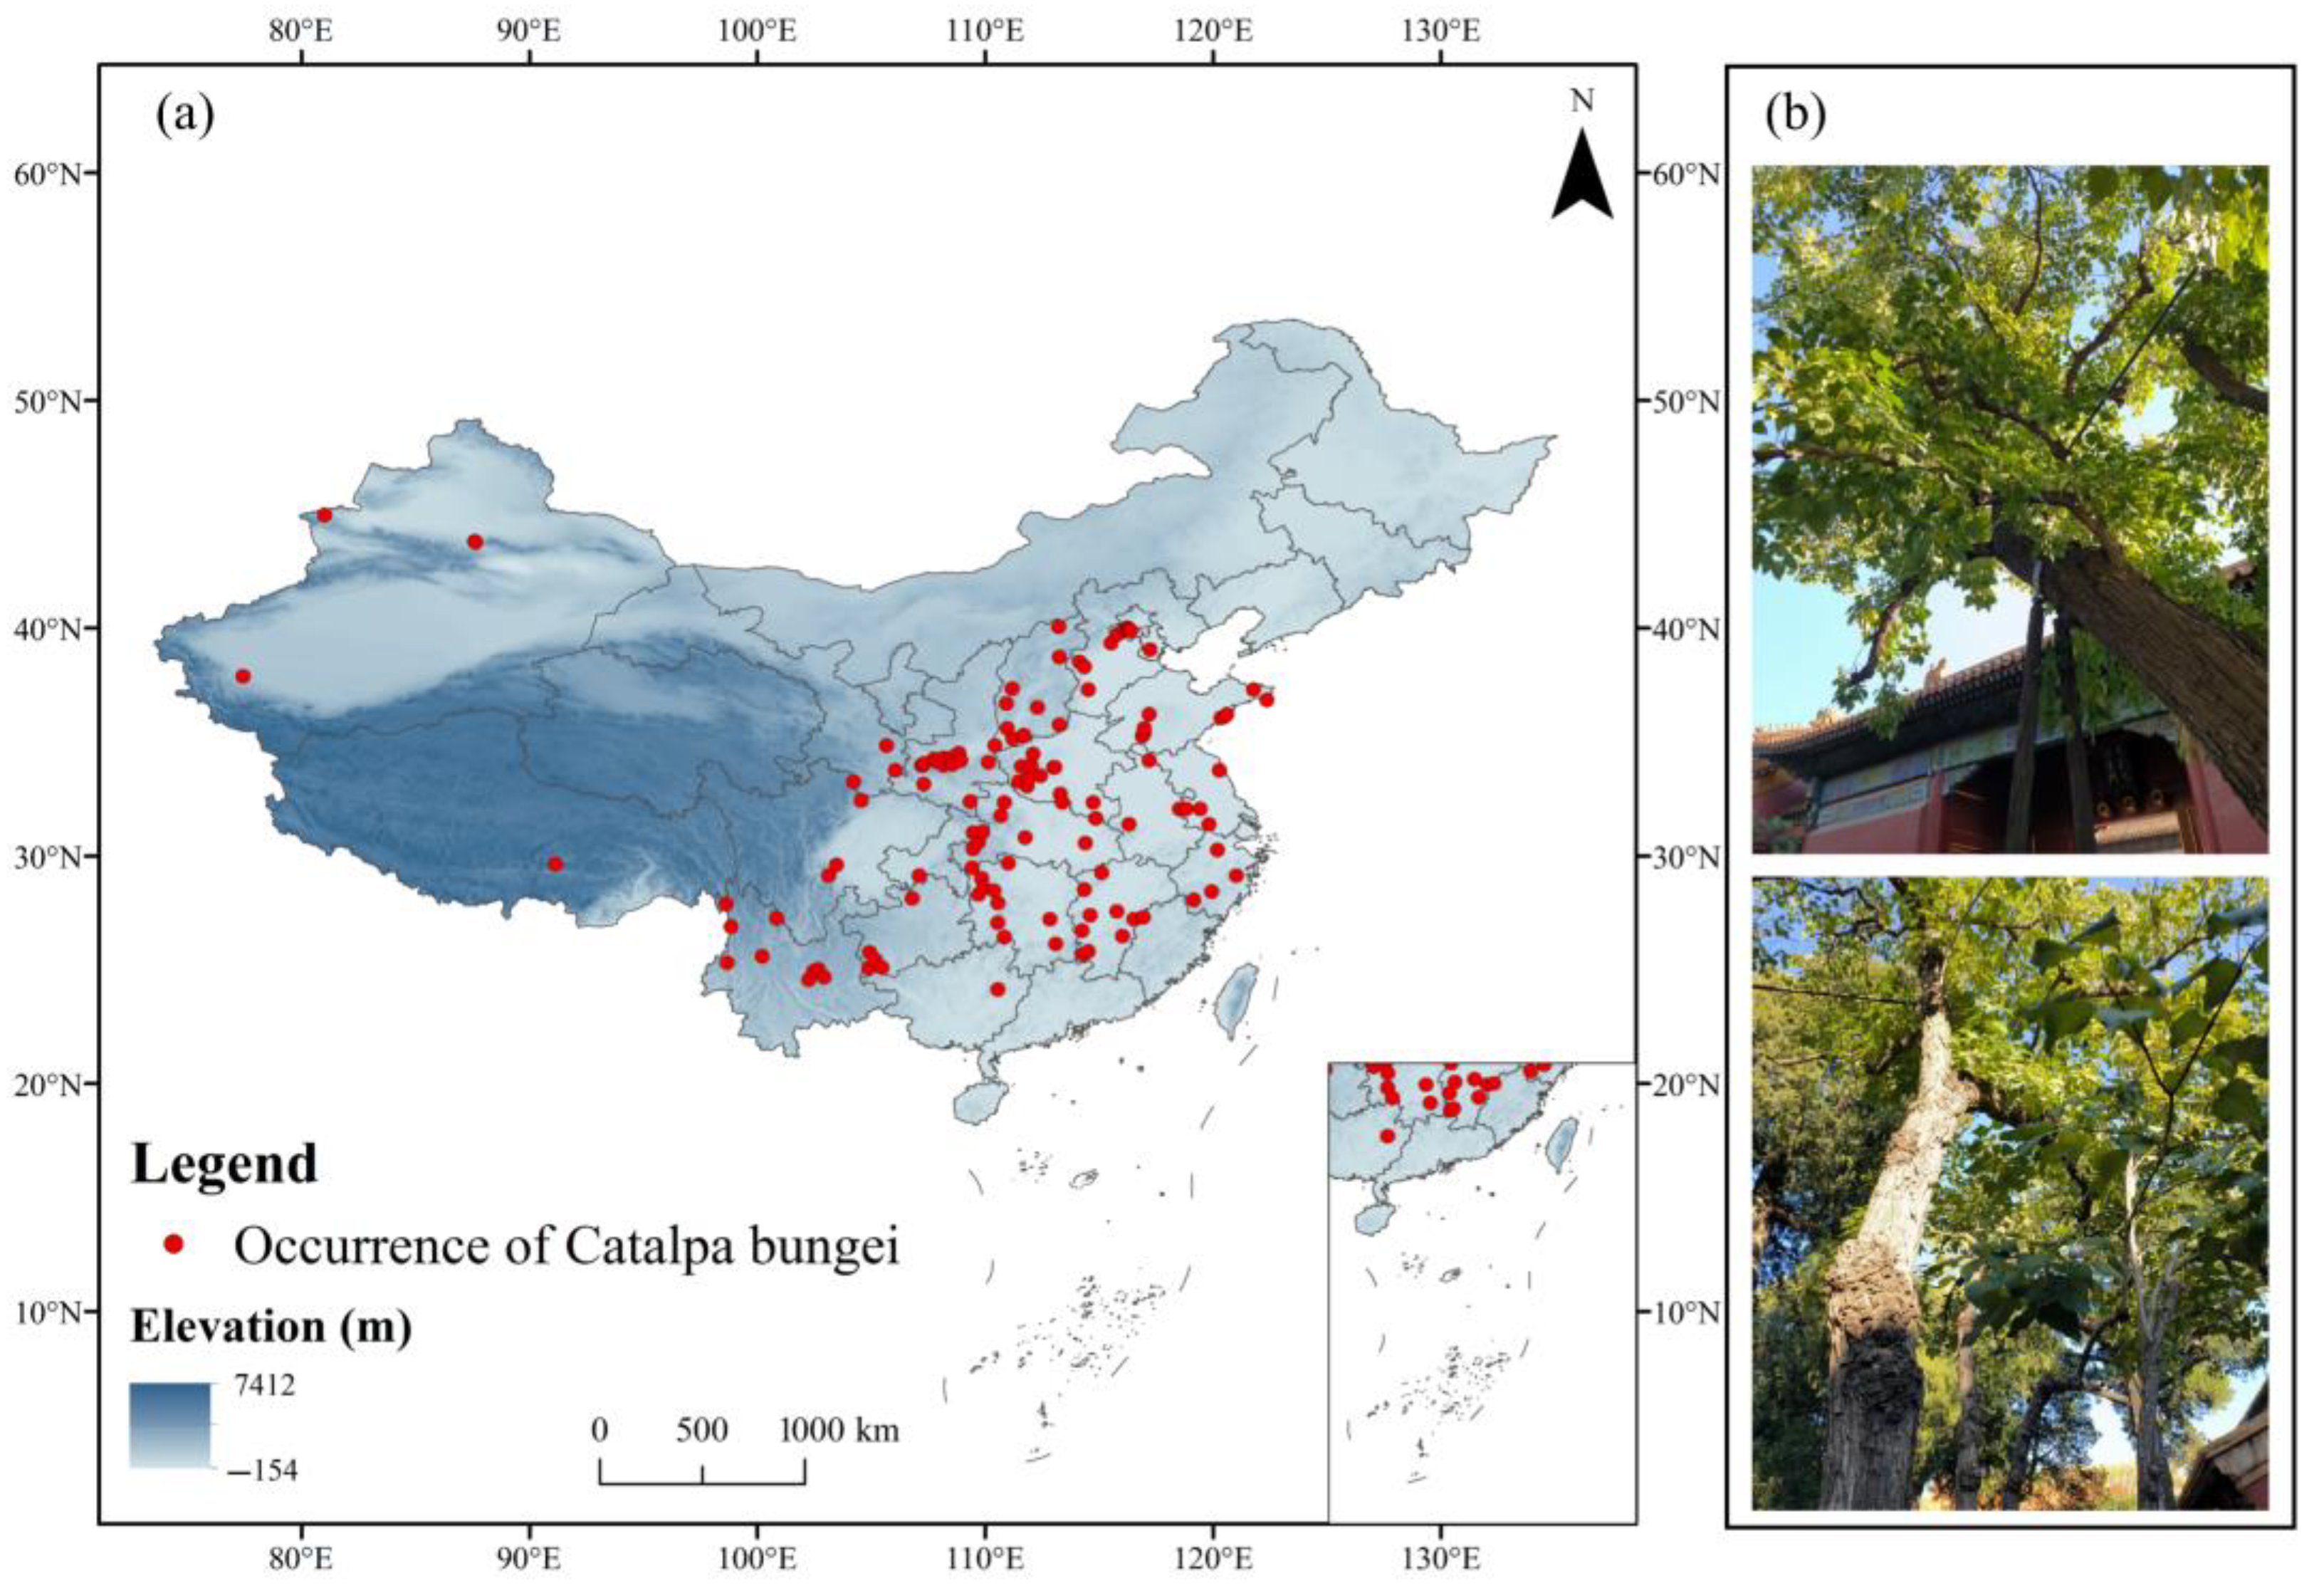
2.2. Compilation and Preprocessing of Species Occurrence Data

The species occurrence data were obtained from four sources: the Global Biodiversity Information Facility (GBIF, https://www.gbif.org/, accessed on 15 September 2024; 399 records), the China Virtual Herbarium (CVH, https://www.cvh.ac.cn/, accessed on 15 September 2024; 2 records), the Plant Science Data Center (PSDC, https://www.plantplus.cn/, accessed on 15 September 2024; 1 record), and the relevant literature [53]. We compiled 402 occurrence records, each containing precise geographical coordinates or detailed locality descriptions, ensuring the comprehensive coverage of the distribution range of C. bungei across China [53]. To minimize sampling bias and prevent model overfitting [54], we applied a multi-step filtration protocol. First, records with complete geospatial metadata were retained. Distribution records lacking coordinates were georeferenced using the Baidu Map Coordinate Extraction System. All records were standardized, georeferenced, and cross-verified to remove duplicates, resulting in a centralized Excel database. Duplicate coordinate entries and invalid zero-coordinate records were systematically removed. Spatial rarefaction was then performed using ENMTools to enhance spatial representativeness [55], retaining only one occurrence point per 5 × 5 km grid. After applying this processing pipeline, 126 spatially unique occurrence points were retained for downstream analyses (Figure 2). Finally, the curated dataset was exported as a CSV file for MaxEnt species distribution modeling.

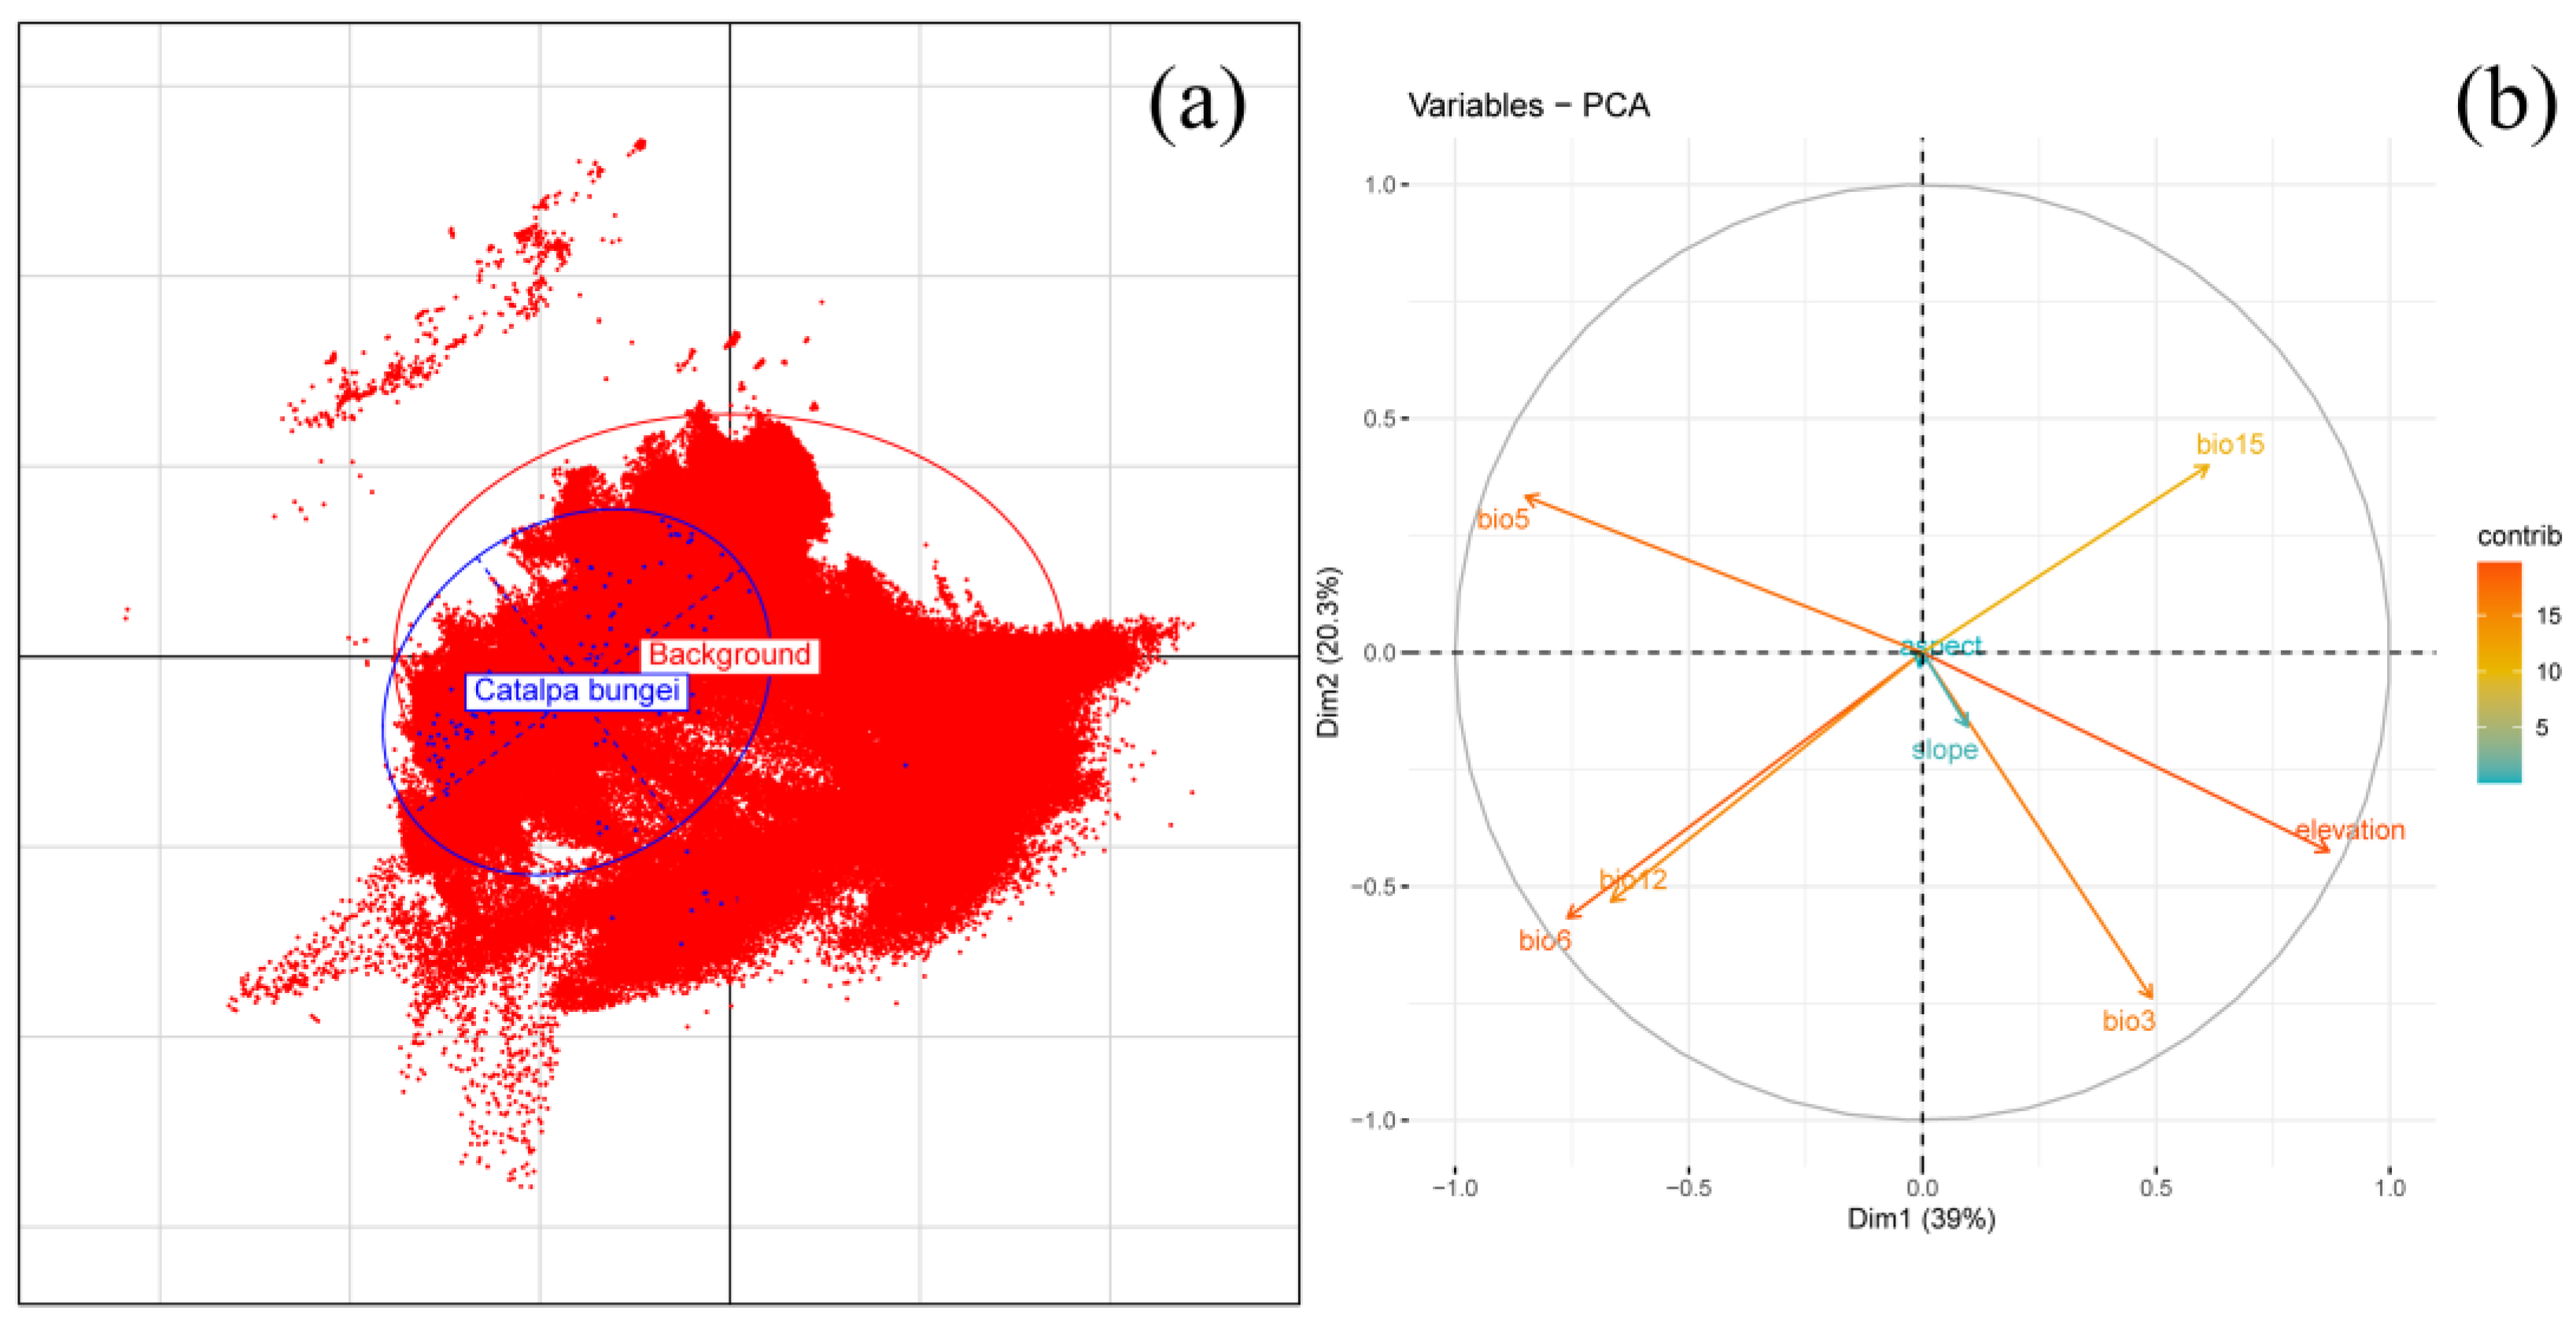
2.3. Environmental Variable Screening and Modeling Data Processing

Nineteen bioclimatic and three topographic variables (period-averaged values) were extracted from WorldClim version 2.1 (https://worldclim.org/, accessed 22 October 2024) at a 2.5 min resolution (5 × 5 km grid; Table 1) to model environmental change scenarios across five temporal intervals: current (1970–2020), 2030s (2021–2040), 2050s (2041–2060), 2070s (2061–2080), and 2090s (2081–2100). The BCC-CSM2-MR model (medium resolution) from the Coupled Model Intercomparison Project phase 6 (CMIP6) provided future climate projections under two Shared Socioeconomic Pathway (SSP) scenarios: SSP126 (low emissions) and SSP585 (high emissions) [56]. Topographic layers were resampled in ArcGIS 10.4.1 to match the climate data’s resolution, ensuring compatibility with MaxEnt 3.4.1. Variable selection followed a structured workflow to ensure statistical rigor and ecological interpretability. Specifically, the criteria included (1) evaluating the permutation importance derived from MaxEnt to assess variable contributions; (2) conducting pairwise correlation analysis with an exclusion threshold of |r| > 0.8 to eliminate highly correlated variables while retaining the more informative one [52]; (3) performing Variance Inflation Factor (VIF) analysis with a threshold of <10, balancing multicollinearity control with the retention of ecologically meaningful predictors in species distribution modeling [57]; and (4) implementing Principal Component Analysis (PCA) to verify the ecological niche representation of C. bungei within the multidimensional environmental space [58]. Following the workflow in Figure 1, processing included initialization with 126 occurrence points and 22 variables in MaxEnt 3.4.1, correlation screening via ENMTools, spatial interpolation in ArcGIS 10.4.1, and VIF verification using the car package in R. This pipeline ultimately identified eight ecologically meaningful predictors (Figure 3 and Figure 4), balancing statistical rigor and biological interpretability. Additionally, PCA validation using the ade4 package in R confirmed that the eight retained variables were well distributed across the environmental niche space of C. bungei, aligning along both the long and short axes of its ecological niche (Figure 4). The first two principal components accounted for 59.3% of the total variance, illustrating how environmental gradients shape the distribution preferences of C. bungei. This validation step reinforced the ecological interpretability of the selected variables, ensuring that they effectively represented the multidimensional environmental space relevant for robust habitat suitability modeling [59].

2.4. Parameter Optimization of MaxEnt Model Using the Kuenm Package

The Maximum Entropy (MaxEnt) principle, foundational in machine learning, provides a probabilistic framework for estimating species distributions through constrained entropy maximization. Within species distribution modeling, MaxEnt algorithms integrate bioclimatic covariates to generate spatially explicit probabilistic predictions of habitat suitability. This methodology critically supports biodiversity conservation through the identification of climatically suitable habitats, and informs evidence-based ecosystem management strategies.
P x = e x p i = 1 n λ i f i x z
The MaxEnt model’s core equation was expressed as Formula (1) [60]; P x represents the probability of a target species’ presence at location x , z is the partition function ensuring a normalized probability distribution, f i x denotes the environmental feature vector, and λ i is its weighting coefficient. The model optimizes λ i to infer species distributions accurately [61]. This calibration process adjusts parameters to fit the data, reflecting the species’ ecological traits. In MaxEnt modeling, the Feature Combination (FC) and Regularization Multiplier (RM) significantly influence predictive performance [52]. FC comprises five default feature types—Linear (L), Quadratic (Q), Product (P), Threshold (T), and Hinge (H)—which shape response curves by modifying f i x . The RM regulates model complexity, balancing generalization and preventing underfitting [61]. The kuenm package in R, a widely adopted ecological niche modeling toolkit, streamlines this calibration and supports species distribution predictions across diverse spatiotemporal scales [62,63].
Given that MaxEnt’s default parameters may lead to overfitting or poor generalization, we employed the R-based kuenm package to optimize model parameters and select the best-performing configuration. The occurrence data (126 valid records) were partitioned into a 75% training set (95 records) and a 25% testing set (31 records) based on two guiding principles: (1) random stratified sampling implemented via the kuenm_occfilt function in the kuenm package, which employed a fixed random seed (seed = 123) to ensure reproducibility and incorporated geographic stratification to mitigate spatial autocorrelation effects [64], and (2) sample size equilibrium, where the 75% training subset provides adequate records for robust model calibration, and the 25% testing subset (≥30 records) satisfies the minimum sample requirement for statistically meaningful validation [65]. The optimization process involved two key parameters: Feature Combination (FC) and the Regularization Multiplier (RM). Specifically, (1) FC configurations: a total of 31 combinations (e.g., L, LT, PH, LPH, LQT, LPTH, LQPTH) were generated based on five feature types (Linear, L; Quadratic, Q; Product, P; Threshold, T; Hinge, H) to accommodate diverse ecological response patterns [66]; (2) RM range: eight values (0.5–4.0, 0.5 increments) were tested to balance model complexity and overfitting risk [65]. This resulted in 248 candidate models (31 FC × 8 RM). Models were first filtered for statistical significance (permutation test, p < 0.05) and a 5% training omission rate (OR5) to ensure predictive reliability [52]. Finally, two optimal parameter sets were identified using the Akaike Information Criterion (AICc), with Delta.AICc < 2 indicating the top-performing models: RM = 2.0 (FC = LT) and RM = 2.5 (FC = LQT) (Figure 5a,b).

2.5. Model Operation and Evaluation

The MaxEnt model was used to simulate the current suitable habitats for C. bungei and project these areas into future periods (2030s, 2050s, 2070s, and 2090s) under SSP126 and SSP585 scenarios, predicting potential species habitats from 2020 to 2100. Two models were developed using the RM (Regularization Multiplier) and FC (Feature Combination) combinations from Section 2.4, with consistent background points. For model training, 75% of the species occurrence data were utilized, employing a bootstrap method with 10 replicates [52]. Model outputs were configured in a logistic format and exported as ASC files, with all other parameters kept at their default settings. The jackknife approach was used to assess each environmental variable’s contribution by calculating the contribution proportions and permutation importance. Environmental response curves were generated to evaluate curve shapes and factor thresholds, thereby elucidating the environmental influences on species distribution.
For model evaluation, the Area Under the Receiver Operating Characteristic Curve (AUC-ROC) was employed as a metric to assess model performance. The ROC curve is generated by iteratively adjusting the classification thresholds to compute the false positive rate (FPR, 1—specificity) and true positive rate (TPR, sensitivity), with the FPR plotted on the x-axis and the TPR on the y-axis. The AUC metric ranges from 0 to 1, where higher values reflect the superior discriminative ability of the model. However, recent studies have demonstrated the limitations in relying solely on the AUC for evaluating the MaxEnt model’s efficacy [2]. To address these limitations, we additionally employed the True Skill Statistic (TSS) and Cohen’s Kappa coefficient as complementary evaluation metrics. The TSS quantifies classification accuracy across a range from −1 to 1, where values ≤ 0 indicate random performance and scores > 0.7 demonstrate robust predictive capability [67]. Cohen’s Kappa coefficient (−1 to 1) evaluates the agreement between predicted and observed classifications, with values > 0.4 indicating statistically significant concordance [68].

2.6. Classification of Suitable Areas

This study delineated the potential distribution range of C. bungei within China using species distribution modeling. MaxEnt 3.4.1 outputs (ASC format) were geoprocessed in ArcGIS 10.4.1. The habitat suitability classification was conducted using Jenks’ natural breaks optimization in the Spatial Analyst module, resulting in four ecological zones: unsuitable (p ≤ 0.09), low suitability (0.09 < p ≤ 0.27), moderately suitable (0.27 < p ≤ 0.47), and extremely suitable (p > 0.47). Areal quantification was performed using Raster Calculator (Spatial Analyst module), followed by spatiotemporal dynamics analysis through binary reclassification (suitable/unsuitable) and vector-based intersect operations in Geoprocessing. Centroid trajectory analysis using standard deviational ellipses (SDEs) quantified the historical-to-future range shifts using Movement Ecology tools [69]. Environmental drivers were mapped through inverse distance weighting (IDW) interpolation (3D Analyst module), with factor isopleths superimposed on suitability surfaces via the Raster Domain tool.

3. Results

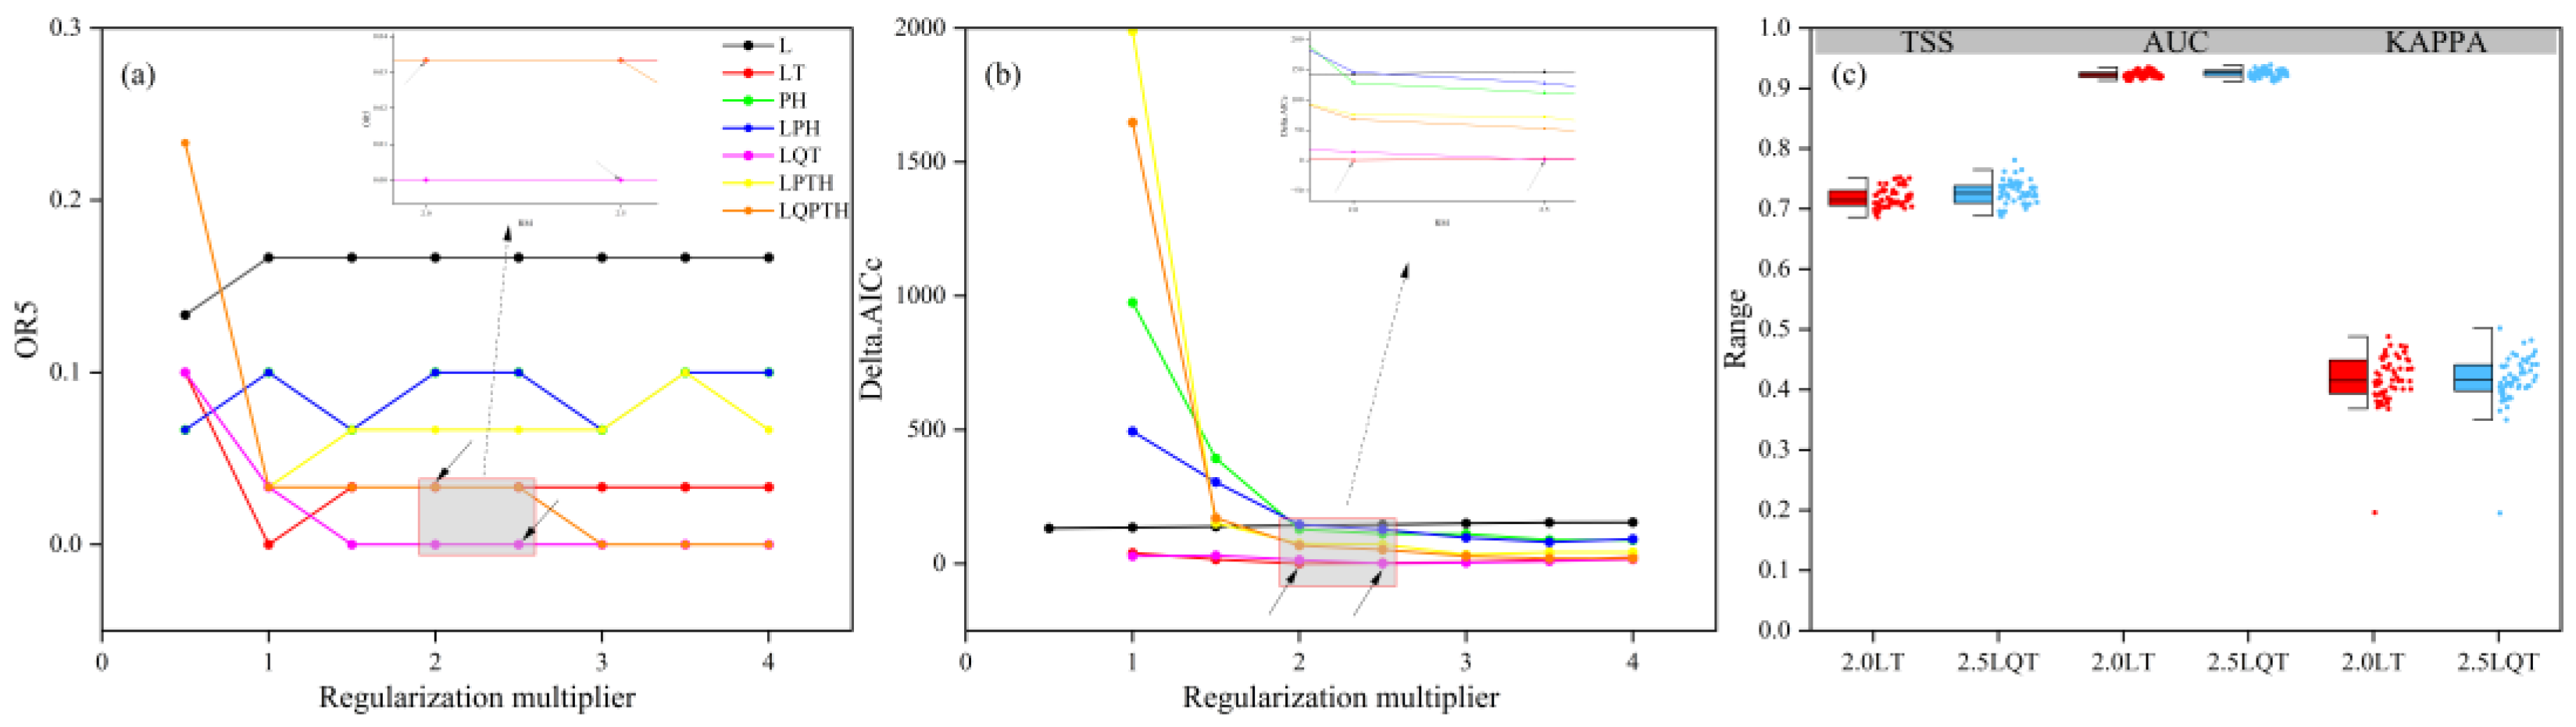
3.1. Evaluation of MaxEnt Model Optimization and Prediction Results

The kuenm package was used to optimize the MaxEnt model’s parameter settings. For comparison, we selected seven Feature Combinations (FCs)—L, LT, PH, LPH, LQT, LPTH, and LQPTH—from 31 possible combinations, focusing on those relevant to the best-performing models and reducing curve overlap for clearer visualization. Figure 5a,b present the results, highlighting two candidate models: one with a Regularization Multiplier (RM) of 2 and FC = LT, and another with RM = 2.5 and FC = LQT. Notably, the second model (RM = 2.5, FC = LQT) had an OR5 value of 0, which was lower than that of the first model, although its Delta.AICc was not the smallest among all tested combinations. Consequently, we could not select the optimal model based solely on the OR5 and Delta.AICc. To identify the optimal model, we evaluated the two models using three additional indicators: the True Skill Statistic (TSS), Area Under the Curve (AUC), and Kappa coefficient. As shown in Figure 5c, the model with FC = LQT and RM = 2.5 consistently outperformed the other model across these metrics. Specifically, this model achieved a mean TSS of 0.7259 and a mean AUC of 0.9244, both higher than those of the alternative model. Furthermore, multiple runs revealed that the TSS and AUC values for this model exhibited lower variability, indicating more consistent performance. The mean Kappa coefficients were 0.4168 for the model with RM = 2.0 and FC = LT, and 0.4153 for the model with RM = 2.5 and FC = LQT. However, the Kappa coefficients for the former model showed greater variability across runs. Based on this analysis, the model with RM = 2.5 and FC = LQT was selected as the optimal configuration.

3.2. The Current Distribution of C. bungei

The suitability classification standards categorized the suitable areas for C. bungei in China into four groups (Figure 6). This species was primarily distributed across central, eastern, and southern China, exhibiting a continuous spatial distribution pattern. Its range exhibits a broad latitudinal distribution, reflecting its ecological adaptability. In terms of east–west distribution, C. bungei is mainly found on the second and third terraces of China, illustrating the influence of topography on its distribution. A small number of occurrence points are also present in the Xinjiang and Tibet regions. The total distribution area covers 3,550,500 km2, accounting for 36.89% of the national area. Moderately suitable areas encompass 1,022,310 km2 (10.62% of the national area), primarily located in eastern Sichuan, most of Chongqing, and a significant portion of Guizhou. In contrast, low-suitability areas cover 1,339,670 km2 (13.92% of the national area), mainly concentrated in southern Liaoning, most of Ningxia and Guangxi, northern Guangdong, and Xinjiang, with a sparse distribution in Tibet.

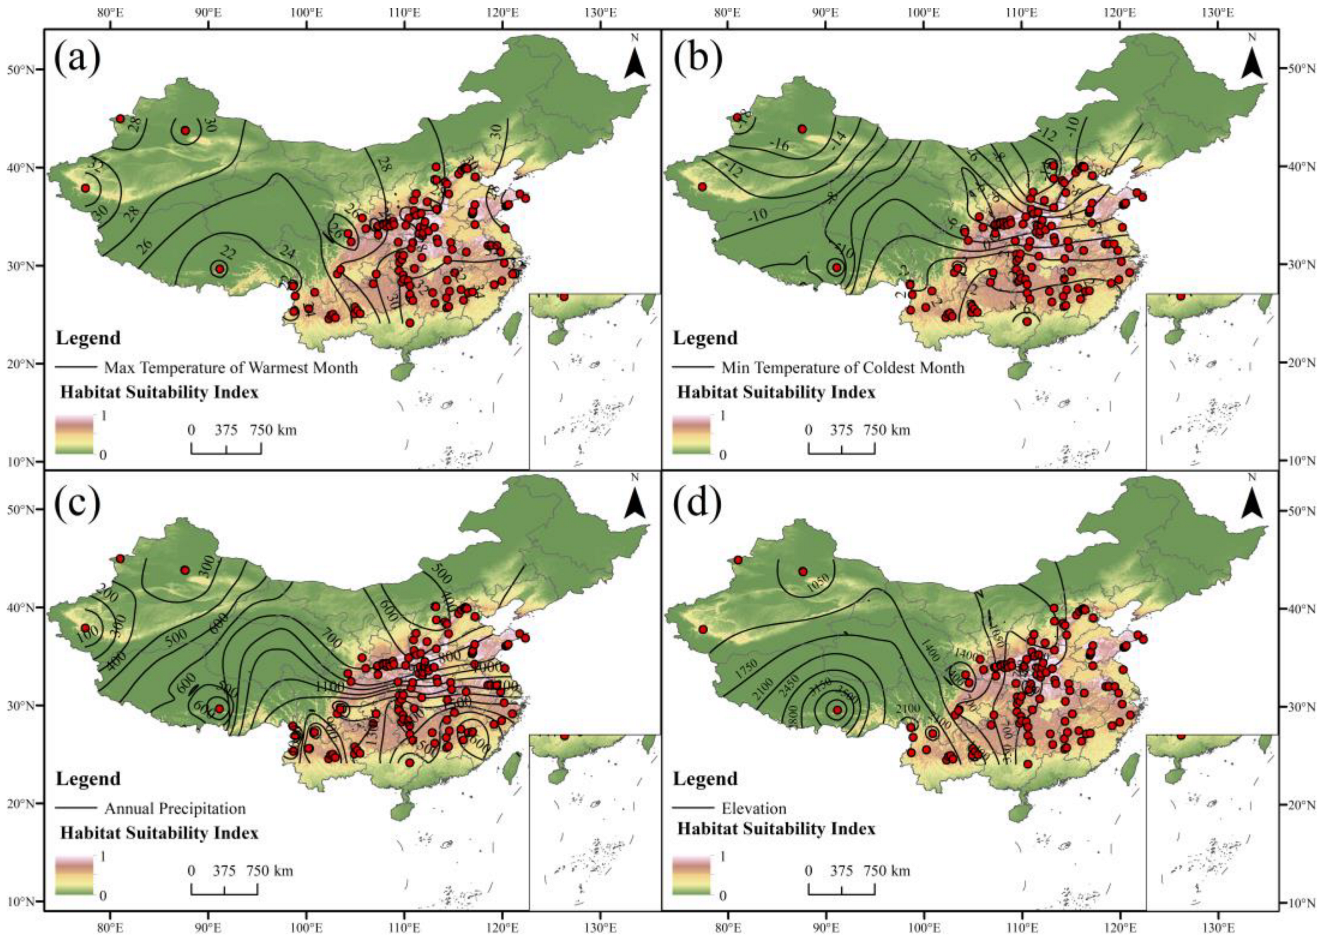
3.3. Critical Environmental Factors

The MaxEnt model was used to perform multiple runs with eight environmental factors, and the results were averaged (Table 2). The most influential factors were Bio5 (Max Temperature of Warmest Month), Bio6 (Min Temperature of Coldest Month), Bio12 (Annual Precipitation), and Elevation, which collectively contributed 91.95% to the model’s performance and accounted for 92.20% of the permutation importance. When modeled individually, these four factors consistently occupied the top four ranks in regularization gains for both training and test datasets. Additionally, their test AUC values all exceeded 0.70, further demonstrating their significance.
Figure 6. Current suitable areas and potential suitable areas of C. bungei: unsuitable (p ≤ 0.09), low suitability (0.09 < p ≤ 0.27), moderately suitable (0.27 < p ≤ 0.47), and extremely suitable (p > 0.47).
Forests 16 01150 g006
Based on the preceding analysis, Bio5 (Max Temperature of Warmest Month), Bio6 (Min Temperature of Coldest Month), Bio12 (Annual Precipitation), and Elevation were identified as key environmental factors shaping the distribution of C. bungei. The response curves derived from the MaxEnt model (Figure 7) illustrate the relationship between these factors and the species’ presence probability across China. Each factor exerted a distinct influence, with presence probability varying along the environmental gradients depicted on the horizontal axis. Analysis reveals that all four curves exhibit theoretical optima, displaying either unimodal or bimodal patterns. For Bio5, Figure 7a shows the presence probability peaking at 0.63 at 32.5 °C, declining slightly to 0.60, then rising to a second peak of 0.63 at 33.5 °C, before dropping sharply to 0.27 and stabilizing at higher temperatures. This bimodal response suggests that C. bungei thrives across multiple temperature optima rather than a single range, with the minor dip between peaks (0.63 to 0.60) deemed statistically negligible. In Figure 7b, Bio6 yields a unimodal curve, with the presence probability peaking within a narrow range of minimum temperatures (approximately −5 °C to 0 °C), reflecting limited cold tolerance. For Bio12, Figure 7c exhibits a sharp rise to a single peak at around 300 mm annual precipitation, followed by a steep decline; beyond 1600 mm, probability stabilizes, indicating sensitivity to water availability, but broad tolerance to higher precipitation levels. Previous studies confirm a significant positive correlation between temperature and radial growth in C. bungei, with growth rates increasing by approximately 0.12 mm per °C within optimal ranges [70]. Finally, Figure 7d reveals a sharply peaked curve for Elevation, centered at 0–800 m, highlighting a narrow elevational range for high-probability presence and underscoring the sensitivity to topographic variation.
Using the p-value thresholds defined in Section 2.6 as boundaries, the response range and average value of key environmental factors in different suitability levels were calculated (Table 3). Conditions exceeding a p value of 0.47 are deemed most conducive to the species’ distribution. Specifically, Bio5 (Max Temperature of Warmest Month) exhibits optima at 28.1–33.6 °C or 33.9–47.0 °C (mean: 37.6 °C), Bio6 (Min Temperature of Coldest Month) ranges from −9.8 to 3.1 °C (mean: −3.5 °C), Bio12 (Annual Precipitation) spans 542–1630 mm (mean: 1086 mm), and Elevation optima extend from −154 to 830 m (mean: 339 m). Pronounced temperature variability enhances the species’ growth and development, while optimal hydrothermal conditions facilitate its survival. Consequently, C. bungei exhibits elevated suitability in complex environments, supporting its widespread distribution across diverse Chinese landscapes.

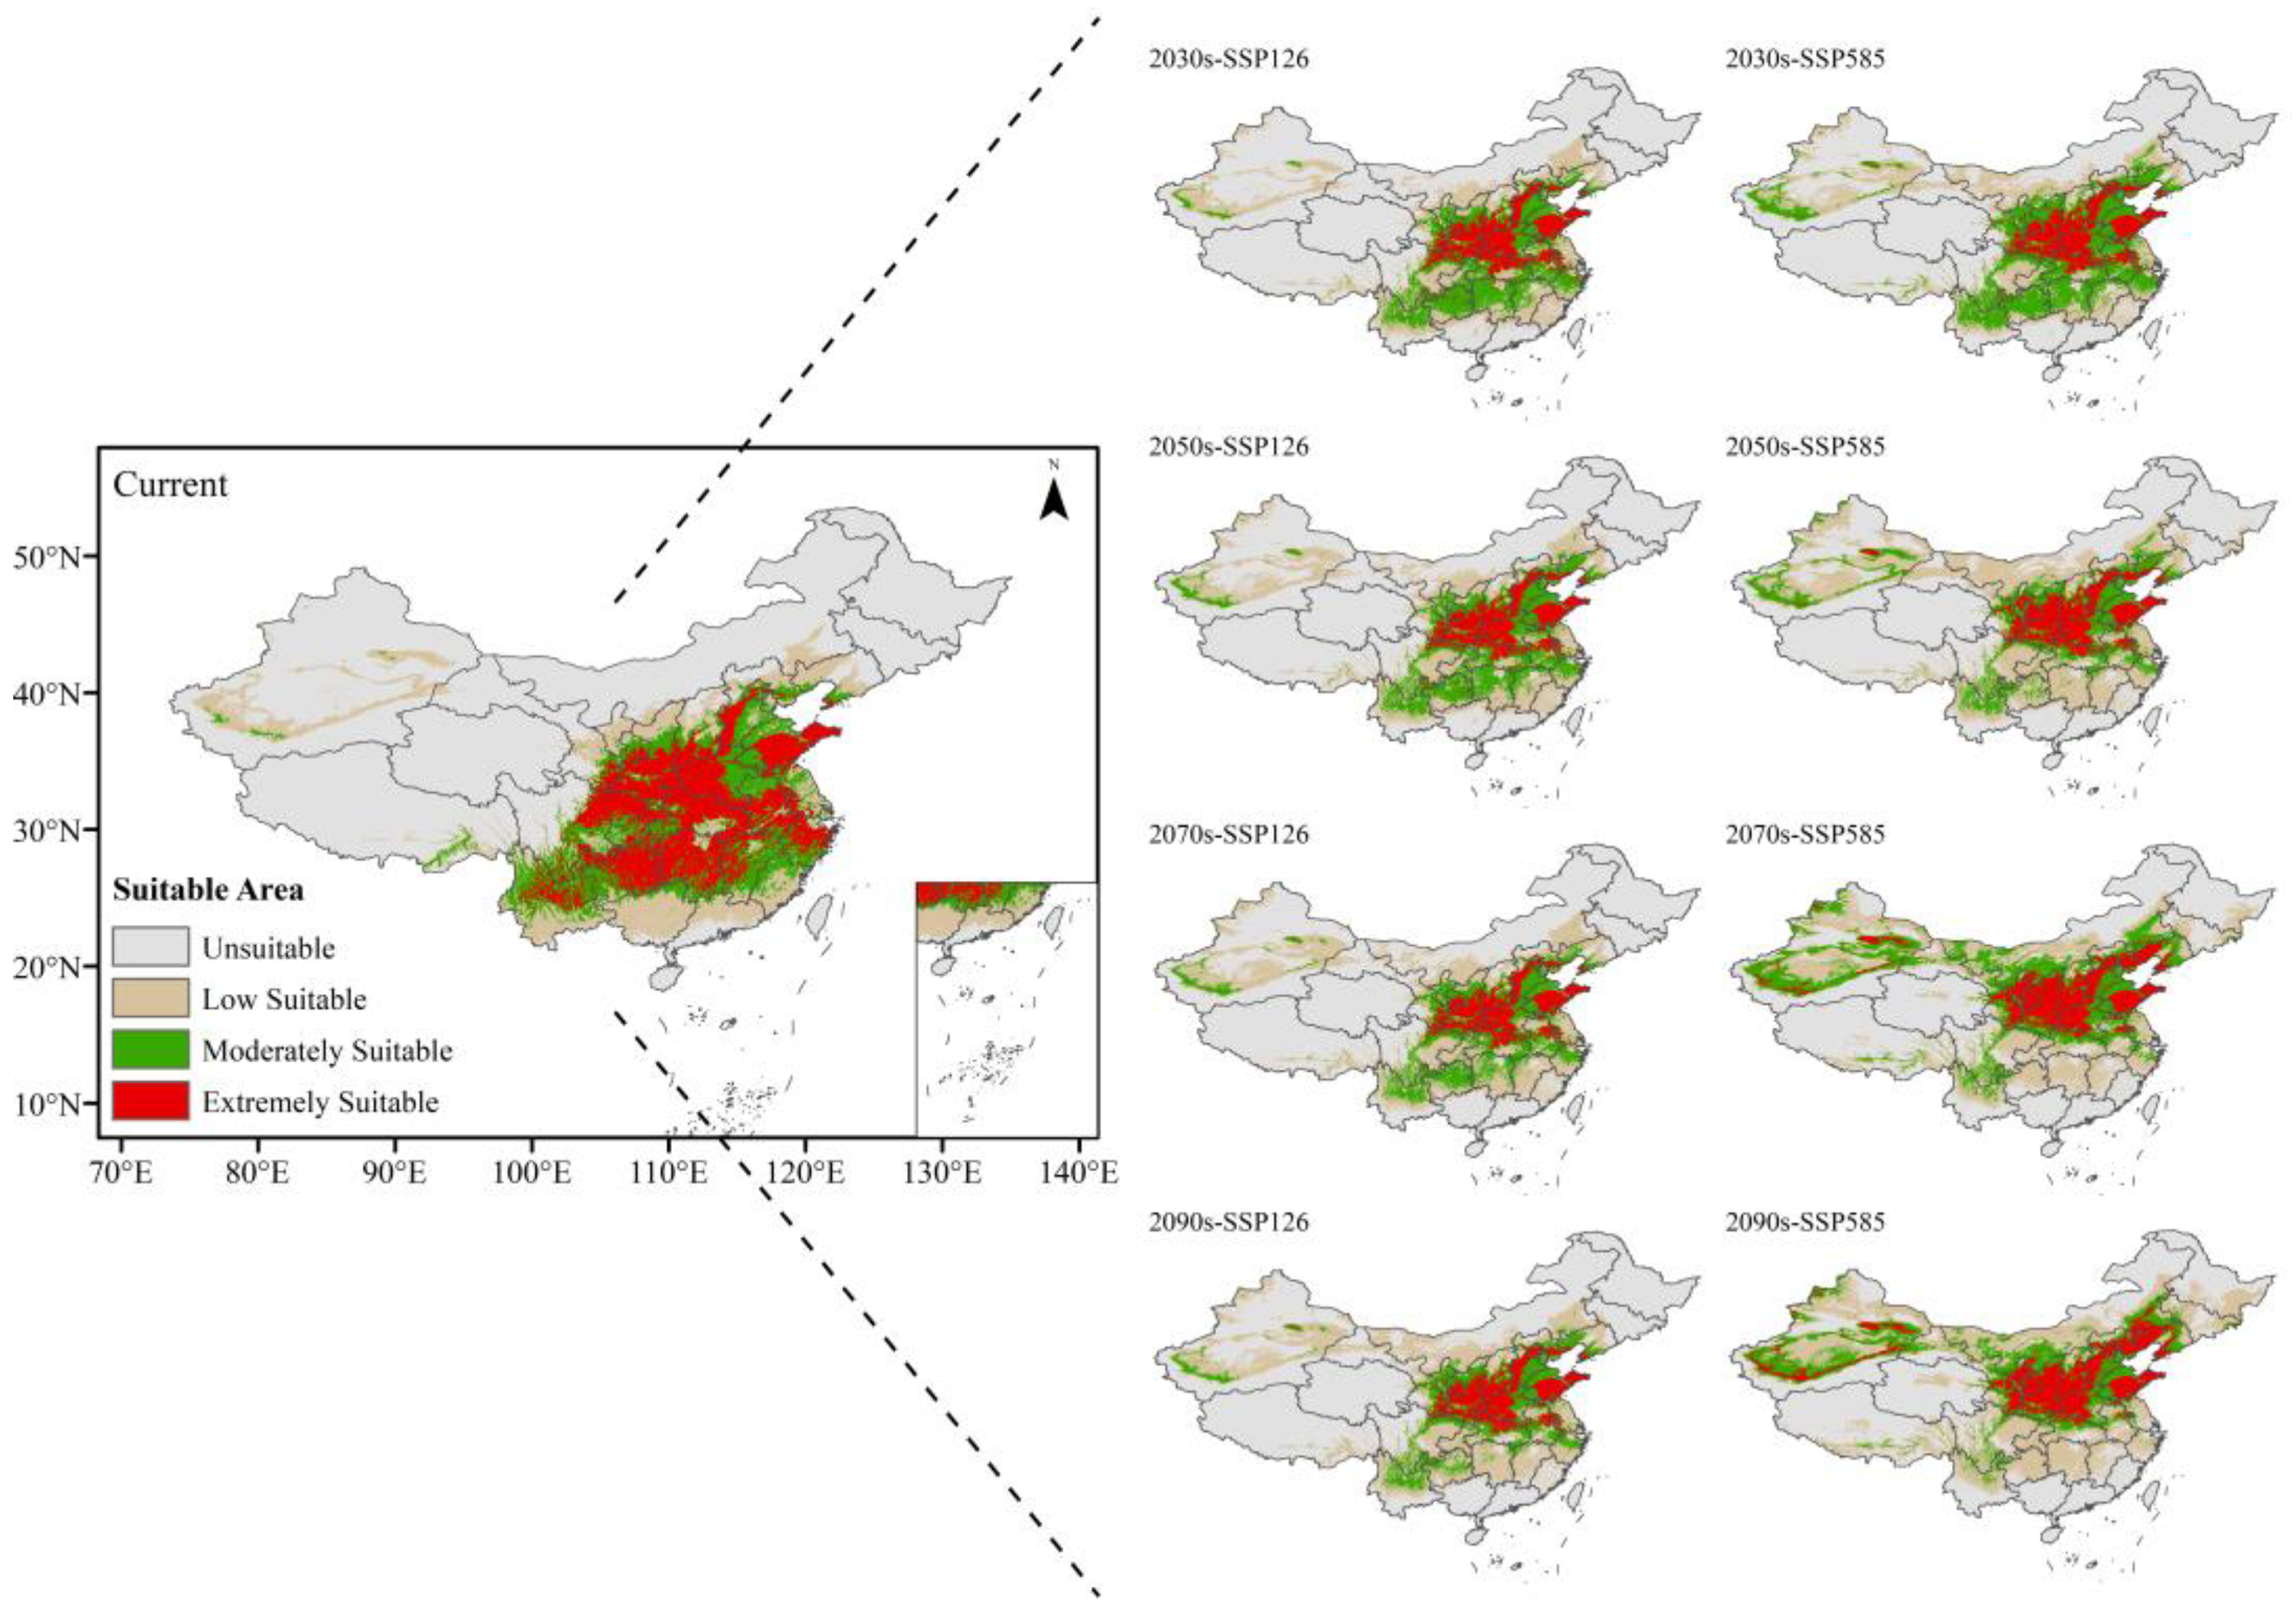
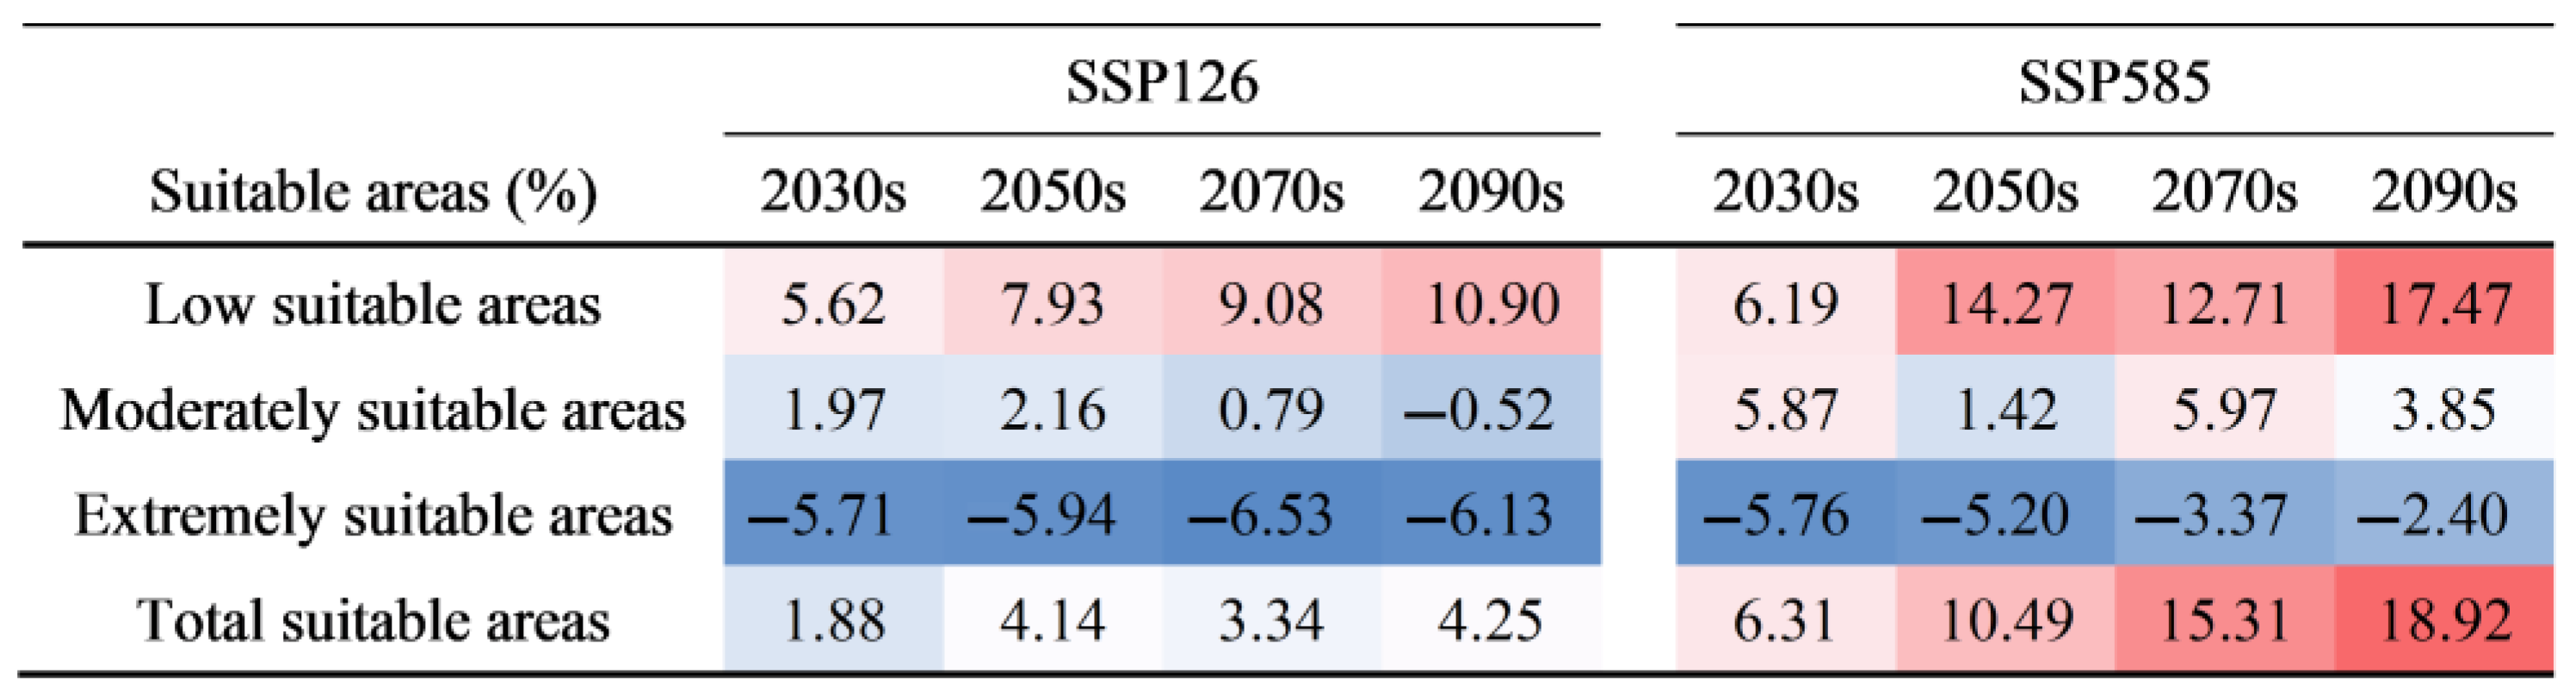
3.4. Future Potential Suitable Habitats for C. bungei

Using the current climate as a baseline, future potential suitable habitats were predicted using the MaxEnt model for C. bungei (Figure 6), with trends in area changes and suitability class proportions analyzed under future climate scenarios (Figure 8). Overall, the total area of potential suitable habitats is projected to increase. However, extremely suitable areas were expected to decline, with the most pronounced reduction occurring in the 2030s, notably in southern regions such as Sichuan and Chongqing. In contrast, low-suitability areas are projected to expand significantly, reaching 2,388,800 km2 (SSP126) and 3,021,160 km2 (SSP585) by the 2090s, with marked increases in northern regions such as Xinjiang and Inner Mongolia. Under the SSP126 scenario, extremely suitable areas decrease to 598,542 km2 (6.22% of the national total) by the 2090s, moderately suitable areas stabilize at 971,806 km2, and low-suitability areas rise substantially, accounting for 24.82% of the national total. Under the SSP585 scenario, extremely suitable areas decline sharply in the 2030s. By the 2090s, they partially recover to 957,708 km2, but remain substantially below the baseline levels. Low-suitability and moderately suitable areas exhibit anticorrelated fluctuations from the 2030s onward; by the 2090s, both expand, with low-suitability areas increasing to 2.26 times their original extent.
The future distribution patterns of potential suitable habitats for C. bungei in China, based on the current climate, largely mirror the present configurations, yet local environmental changes drive varying degrees of expansion and contraction (Figure 8b). Across all future periods, expansion consistently outpaces contraction, yielding a net increase in the total suitable area. Northern regions—such as Xinjiang, Gansu, Inner Mongolia, Liaoning, and Jilin—exhibit notable expansion, while southern regions, including Yunnan, Guangxi, Guangdong, and Fujian, undergo persistent contraction. Under the SSP126 scenario, suitable habitats expand in a fragmented pattern, with initial scattered growth in the 2030s across Xinjiang, Inner Mongolia, Gansu, Tibet, and Qinghai, alongside concentrated expansion in eastern Inner Mongolia and the adjacent Liaoning–Jilin border zones. These dynamics intensify over time, culminating in expansion and contraction rates of 21.41% and 12.35%, respectively, by the 2090s. Under the SSP585 scenario, net expansion rates escalate progressively to 13.30%, 19.91%, 25.35%, and 29.51% across the four periods, with significant growth in Xinjiang (notably the Tarim and Junggar Basins), Gansu, Inner Mongolia, and northeastern China. By the 2090s, marked expansion extends to central-western Inner Mongolia and adjacent Gansu, most of Liaoning, central Jilin, and eastern Heilongjiang, whereas contraction predominates in southern Yunnan, most of Guangxi, northern Guangdong, central Fujian, and the middle-lower Yangtze River regions near Sichuan and Chongqing. SSP585 drives more intense spatial reconfiguration than SSP126, characterized by continuous northward expansion and southward retreat. Overall, global warming favors range expansion for C. bungei, yet local adverse effects, most evident in the marked reduction in extremely suitable habitats, force the persistent contraction of optimal zones, ultimately triggering substantial ecological shifts.

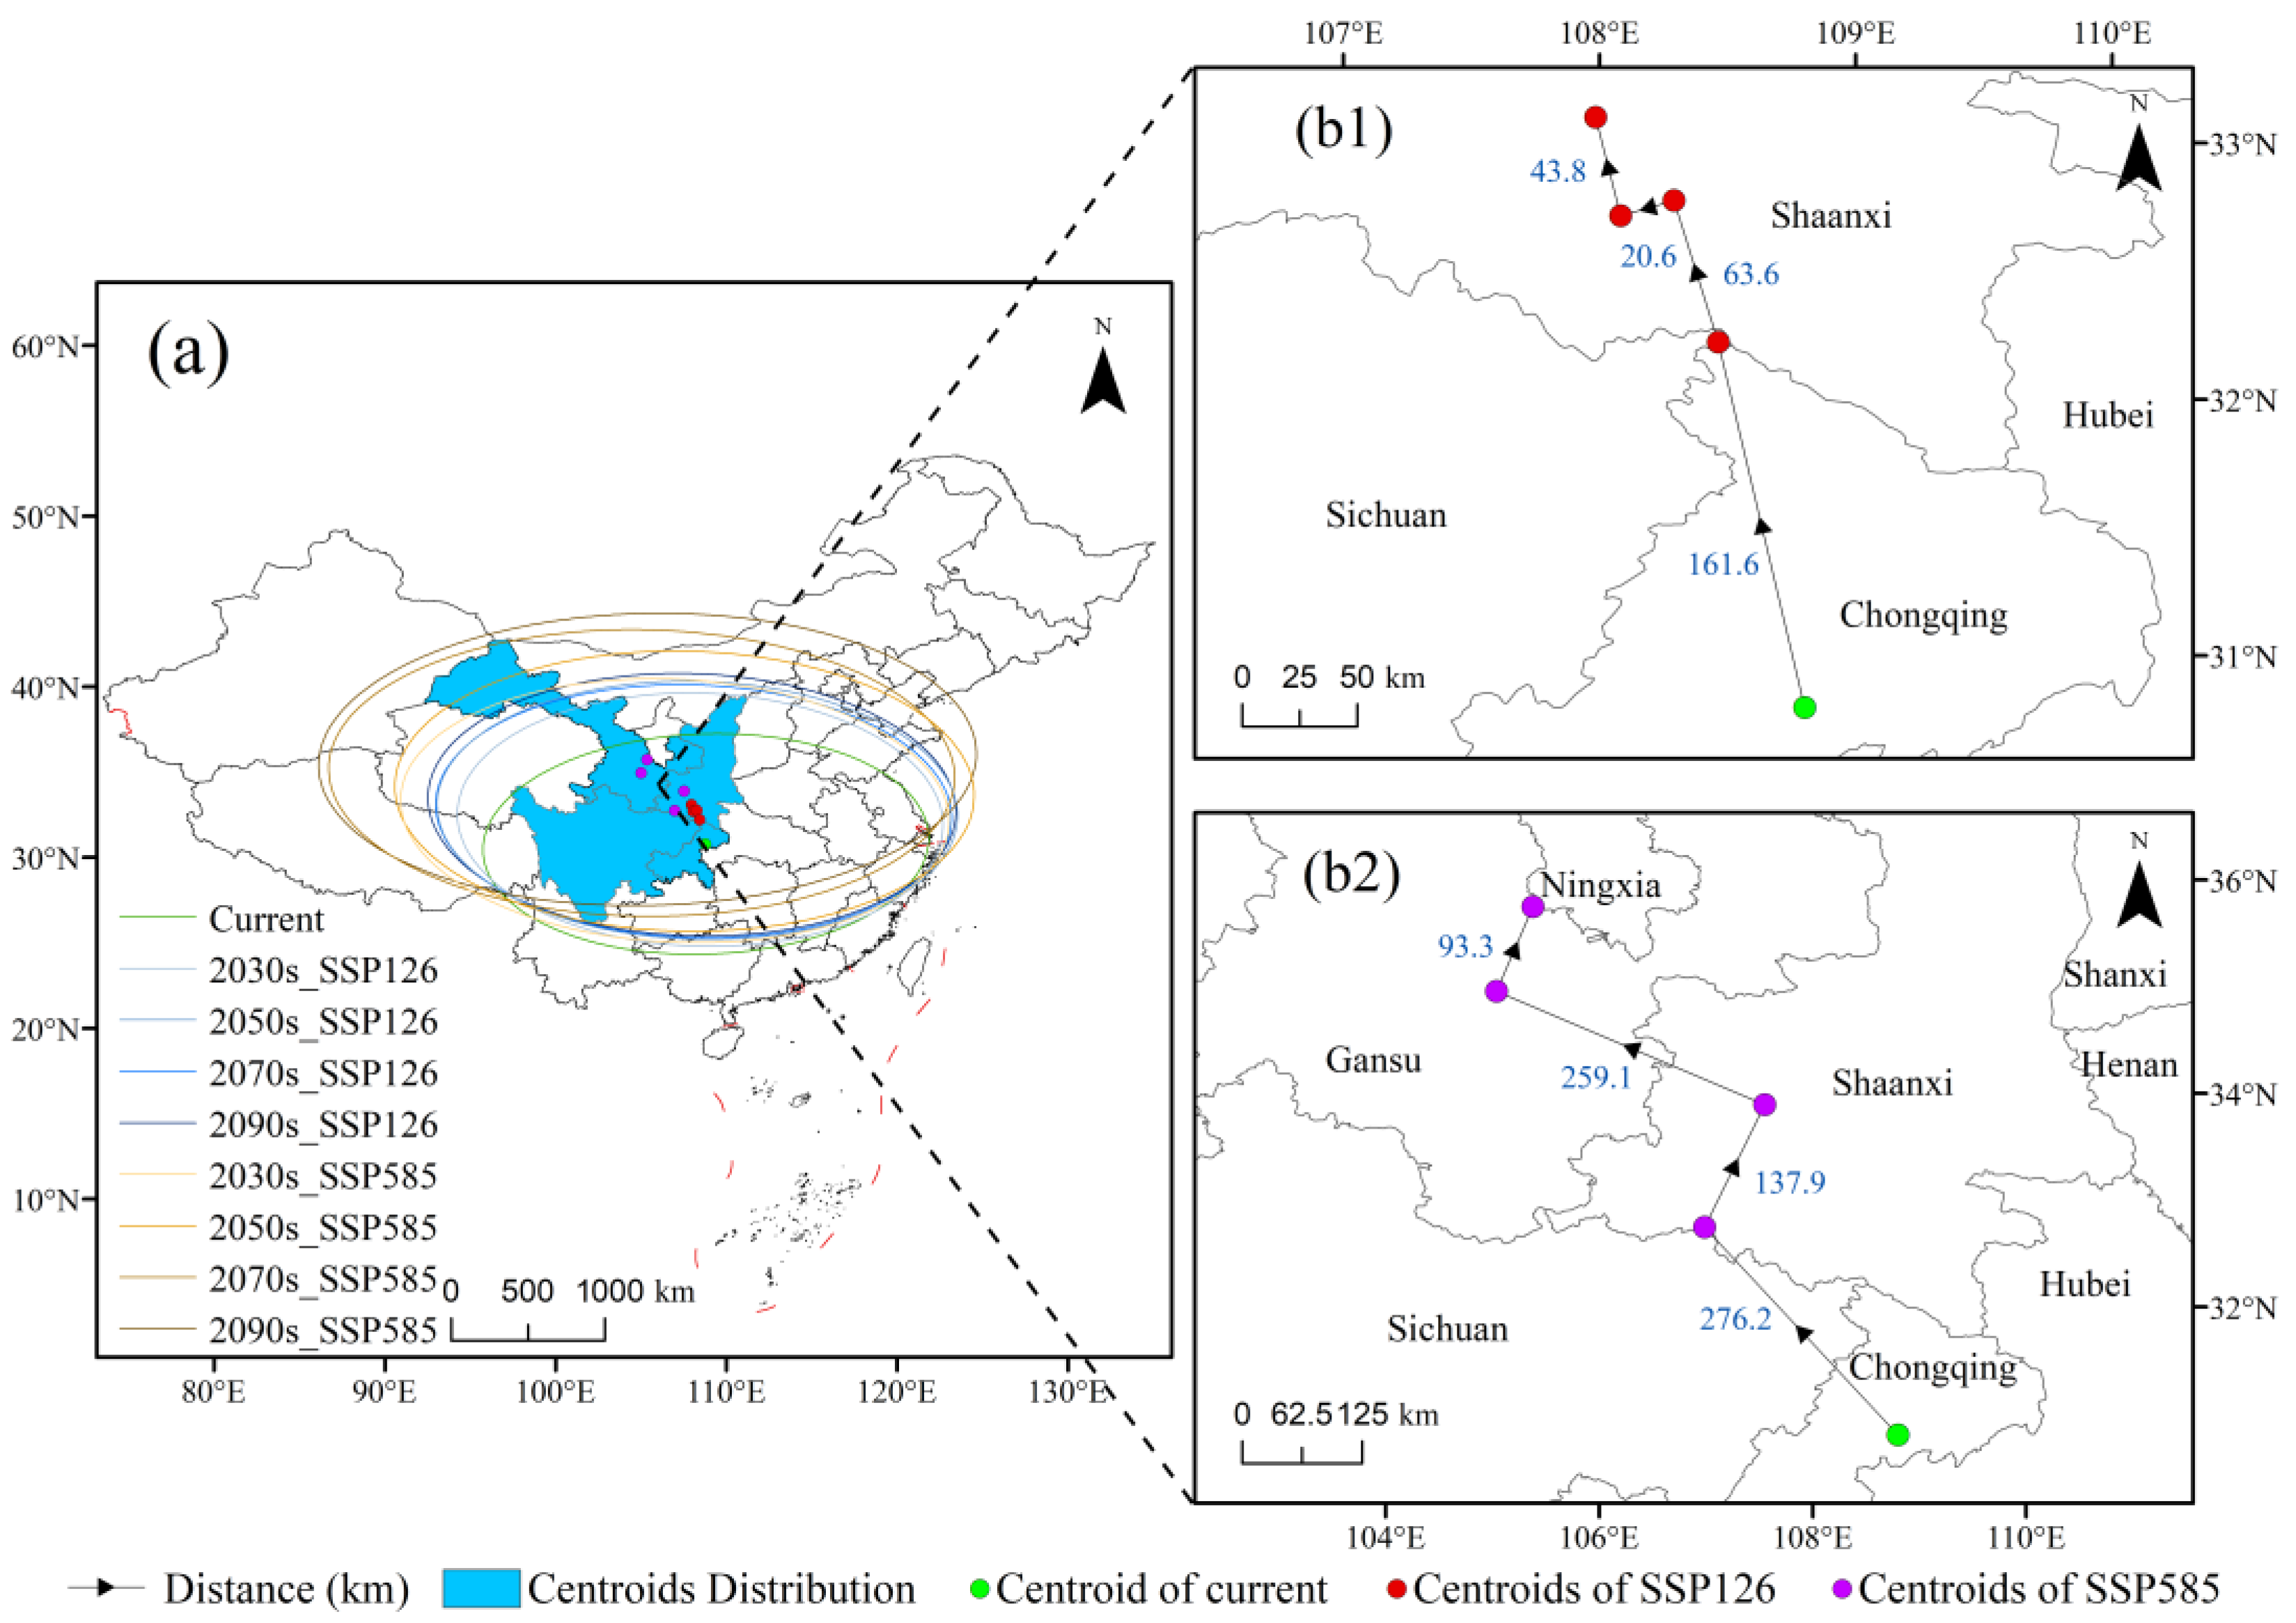
3.5. Centroid Migration of Suitable Areas Under Future Climate Scenarios

Spatial analysis revealed the centroid migration patterns of potential suitable habitats for C. bungei under two future climate scenarios (Figure 9). The current centroid is located in Yunyang County, Chongqing Municipality (30.7971° N, 108.7996° E). Under the SSP126 scenario, it is projected to shift 161.6 km northwest to Wanyuan, Sichuan (32.2220° N, 108.4631° E) by the 2030s, then 63.6 km northwest to Hanyin, Shaanxi (32.7751° N, 108.2905° E) by the 2050s. Subsequently, it moves 20.6 km southwest by the 2070s and 43.8 km northwest by the 2090s, reaching Xixiang, Shaanxi (31.8778° N, 107.9725° E) and (32.7155° N, 108.0823° E), respectively. Under the SSP585 scenario, the centroid is projected to exhibit a cyclical migration pattern, shifting from northwest to northeast approximately every 20 years, with distances initially increasing and then decreasing. From 2020 to 2040, it migrates 276.2 km northwest to Nanzheng, Shaanxi (32.7456° N, 106.9872° E), followed by a 137.9 km northeast shift to Taibai, Shaanxi (33.8938° N, 107.5489° E) by 2060. By the 2070s and 2090s, it reaches Tongwei, Gansu (34.9586° N, 105.0366° E) and Huining, Gansu (35.7501° N, 105.3788° E), with migrations of 259.1 km and 93.3 km, respectively. To further illustrate the factors driving future changes in habitat suitability, we summarized the projected trends of the most important climatic variables under the SSP126 and SSP585 scenarios. For example, Bio6 is projected to increase by 1.5–3.2 °C under SSP126 and 3.8–6.1 °C under SSP585 by the 2090s, while Bio12 shows an increasing trend of 3–10% depending on the scenario and period. These changes align with the centroid migration and distribution shifts observed in the habitat suitability projections. Figure 9 shows the spatial trajectories of these centroid migrations under future scenarios, visually illustrating the dynamic shifts in suitable habitats for C. bungei in response to climate change [69].

4. Discussion

4.1. Interpretation of Model Performance and Predictive Utility

This study utilized an optimized MaxEnt model, which demonstrated high predictive accuracy (AUC = 0.9244), exceeding typical plant distribution studies (e.g., Çoban et al., 2020: AUC = 0.83) [71], likely due to the use of high-quality occurrence data and the optimization of variables, which reduced overfitting. The model identified the maximum temperature of the warmest month (Bio5), minimum temperature of the coldest month (Bio6), annual precipitation (Bio12), and elevation as the dominant environmental determinants, collectively contributing 91.95% to the model’s predictive power. These findings corroborate results from other MaxEnt-based studies, which emphasize temperature and precipitation as critical factors influencing tree species distributions under climate change [72]. Distinct from previous studies, this research introduces multiple evaluation metrics to comprehensively and quantitatively illustrate the performance of the optimized MaxEnt model, enhancing the reliability of the projections [53]. Overall, these findings not only elucidate the spatiotemporal dynamics of suitable habitats for C. bungei in response to climate change, but also provide benchmark data for species distribution, which is essential to ecological barrier construction in northern China. Furthermore, the methodological framework developed in this study directly supports sustainable forest resource management under China’s dual carbon goals.
Species Distribution Models (SDMs) are essential tools in biogeography, primarily valued for their ability to predict suitable habitats by quantifying relationships between species and environmental variables. However, niche modeling faces three key methodological challenges: (1) the inadequate standardization of the modeling process limits result reproducibility; (2) limited model transferability caused by environmental extrapolation; and (3) potential ecological biases between simulated outputs and actual species distributions. These systematic errors may undermine the scientific basis of conservation decisions. Due to its robust performance even with limited sample sizes [73,74], the MaxEnt model has become widely adopted for predicting habitat suitability. Its algorithm is based on selecting the probability distribution that maximizes entropy under given environmental constraints [61], aligning with ecological hypotheses of optimal habitat selection. However, the default parameter settings derived from multiscale validations by Phillips et al. [45] across 266 species in six global biogeographic regions may not match the ecological scales of specific regional studies. Although the default parameters effectively balance predictive accuracy and generalization [75], practical applications reveal a paradox: when simulating current distributions, defaults may underestimate species’ environmental tolerance thresholds, whereas for potential distributions, they may overestimate ecological niche plasticity. This mismatch between the predictive objectives and parameters directly limits the model’s spatial extrapolation capabilities. Regulating model complexity involves a bias–variance trade-off [76]: oversimplified models risk underfitting environmental response curves and fail to identify niche differentiation, whereas overly complex models may yield high apparent accuracy but introduce spurious associations lacking ecological validity, especially in heterogeneous landscapes. Therefore, developing a parameter optimization framework aligned with predictive objectives is critical. This includes systematically determining optimal Regularization Multiplier intervals through sensitivity analysis, assessing model complexity thresholds using independent validation datasets, and improving spatial generalization through environmental covariate clustering. Implementing this integrated optimization strategy can significantly enhance the ecological effectiveness of potential distribution predictions.
This study established a novel MaxEnt optimization framework comprising two methodological innovations: (1) implementing a sampling bias correction protocol through spatial filtering and (2) developing regularization parameter optimization algorithms to address model complexity. Data standardization involved aggregating the occurrence records from the GBIF and CVH biodiversity portals, followed by bibliometric validation to verify taxonomic accuracy and geolocation precision. By applying Hijmans’s environmental envelope theory [77], we implemented stratified random sampling with 5 × 5 km grid constraints, generating 126 spatially balanced occurrence points within C. bungei’s native range. Environmental predictors were selected via three-stage filtering: (1) Pearson correlation pruning (|r| > 0.8), (2) multicollinearity elimination (VIF < 10), and (3) Jackknife importance evaluation, retaining eight bioclimatic variables that collectively explained 87.62% of the distribution variation. Parameter optimization integrated AICc-based model selection surfaces with 5% omission rate thresholds, implementing dual-criteria optimization through the systematic exploration of Regularization Multipliers (0.5–4.0) and 31 feature combinations, which produced 248 candidate models. Hierarchical selection using OR5 filtering and the Delta.AICc < 2 criterion identified the optimal configuration (RM = 2.5, FC = LQT). The optimized MaxEnt demonstrated enhanced spatial transferability, revealing distinct biogeographic patterns in the potential distribution of C. bungei that establish a robust baseline for climate change impact assessments.
Evaluating model performance requires integrating multiple statistical metrics to systematically assess prediction accuracy. Commonly employed metrics include the Receiver Operating Characteristic (ROC) curve, with its Area Under the Curve (AUC) reflecting the model’s discriminative capacity across classification thresholds; the True Skill Statistic (TSS), which combines sensitivity and specificity to offer robust performance in imbalanced datasets; and the Kappa coefficient, which evaluates prediction consistency by integrating the species distribution range, sensitivity, and specificity. In this study, a standardized modeling approach yielded mean performance metrics of AUC = 0.9244 (±0.0066), TSS = 0.7259 (±0.0203), and Kappa = 0.4153 (±0.0427), surpassing benchmarks from comparable studies (AUC > 0.8, TSS > 0.4, Kappa > 0.2). Spatial validation revealed that 73.02% of the known distribution points align with areas deemed highly suitable (p > 0.47) by the model, effectively capturing the spatial heterogeneity and dynamic evolution of C. bungei’s habitat suitability under the SSP126 and SSP585 climate scenarios. Environmental factor analysis showed that temperature-related (Bio6: Min Temperature of Coldest Month) and precipitation-related (Bio12: Annual Precipitation) variables contributed 86.15% to the model, corroborating Zhao et al. [52]’s findings on the limiting effects of temperature and moisture gradients on tree species distribution. Furthermore, Xu et al. [70] demonstrated that temperature significantly influences C. bungei stem xylem growth, reinforcing the critical roles of Bio6 (Min Temperature of Coldest Month) and Bio5 (Max Temperature of Warmest Month) identified here. Incorporating topographic factors and optimizing the model further enhanced prediction reliability. Collectively, multidimensional validation confirms that the model’s predictions align closely with ecological patterns, advancing the methodologies for environmental driver analysis and uncertainty quantification beyond the prior studies.

4.2. Effects of Key Environmental Factors on the Distribution of C. bungei

Understanding the environmental drivers of biogeographical patterns constitutes the core scientific objective of this research. By employing MaxEnt-derived factor response curves, we systematically identified key environmental constraints on C. bungei distribution. The Habitat Suitability Index (HSI) was implemented to quantify habitat viability, with suitability thresholds defined using the Maximum Test Sensitivity Plus Specificity threshold (MTSPS = 0.3408) [78]. Climatic spatial heterogeneity significantly governs species niche differentiation. Model simulations indicate that 77.58% of the sampling points cluster within the optimal ranges of four critical factors (Figure 10). Thermal–moisture interactions emerged as primary distribution drivers: the HSI exceeds 0.3408 when Bio5 (Max Temperature of Warmest Month) > 28.1 °C (Figure 10a) and Bio12 (annual precipitation) ranges from 542 to 1630 mm (Figure 10c). However, extreme thermal events (>35 °C) induce xylem embolism via elevated transpiration [79], while prolonged rainfall triggers root hypoxia [80], both suppressing photosynthetic productivity. Compared to Cinnamomum camphora’s broader hydrological niche (1000–3600 mm) [81], C. bungei demonstrates superior drought resistance (45% higher water-use efficiency), but lower thermal tolerance (35 °C vs. 39 °C) [15]. The Jackknife test identified Bio6 (Min Temperature of Coldest Month) as dominant (79.87% variance contribution), with optimal growth occurring at −9.8–3.1 °C (Figure 10b). This range aligns with winter bud frost hardiness thresholds (4 °C), where moderate cold enhances dormancy-mediated freeze resistance, but sub −10 °C exposure increases membrane permeability (60–80% ion leakage), reduces the photochemical efficiency of PSII, and causes 70–90% bud mortality [82]. CMIP6 multi-model projections suggest vertical biome shifts (0.36 m/decade elevation gain for subalpine conifers) under climate–topography synergies [83]. Digital elevation model (DEM) analysis reveals C. bungei’s optimal elevation ceiling at 830 m, with the HSI > 0.3408 predominating below 700 m (Figure 10d). The core habitats are in latitudinal strips (32–43° N) within warm-temperate monsoonal zones (8–13 °C mean annual temperature; 400–800 mm precipitation), matching the photosynthetic optima (20–28 °C) and peak water-use efficiency [84]. The distribution patterns in the North China Plain, Shandong Hills, Loess Plateau, and Yangtze–Huai basins corroborate prior findings [53]. However, despite increasing water and thermal resources south of the middle-lower Yangtze River, suitability significantly declines due to exceeding ecological thresholds; meanwhile, high-latitude and high-altitude regions remain below the suitability thresholds due to insufficient accumulated temperatures and precipitation (<500 mm). Notably, microrefugia like the Ili Valley (81.3° E, 43.9° N) exhibit winter thermal inversion-induced warming (3–5 °C above latitudinal averages) and runoff-enhanced habitats, forming discrete high-suitability patches (HSI > 0.3408) that transcend macroclimatic constraints. The future integration of landscape genomics could elucidate phenotypic plasticity in locally adapted populations, potentially refining Species Distribution Models’ evolutionary modules.

4.3. Changes in and Management of C. bungei’s Suitable Habitats Under Future Climate Change

Within the framework of ecological niche theory, the dynamic visualization of species’ suitable habitats can be understood as a spatial representation of their physiological and ecological adaptability. The threshold responses to environmental factors form the central mechanisms driving species–environment interactions. Climate change has posed a great challenge to global vegetation in maintaining its original ecological habits and geographical distribution, driving biodiversity loss, habitat fragmentation, and changes in species distribution patterns [85]. CMIP6 multi-model ensemble predictions suggest that China’s climate system in the 21st century will experience accelerated warming, with mean annual temperatures rising by approximately 5.4 °C under the SSP585 scenario [86]. Furthermore, precipitation patterns will undergo notable spatial redistribution, increasing by about 43% in northern China and 24% in southern China under SSP585 [86]. Extreme weather events were also projected to become more frequent, having increased by approximately 28.3% nationwide in the last 30 years [87]. Given these forecasts, this study employs the SSP126 and SSP585 climate scenarios to model shifts in habitat suitability, quantify the spatial restructuring processes of C. bungei between 2021 and 2100, and develop priority zoning plans for climate resilience protection. The model simulations indicated substantial shifts in the centroid of suitable habitats toward the northwest under both the SSP126 and SSP585 scenarios, with centroid displacements of 289.6 km and 766.5 km, respectively (Figure 9). By 2100, scenario projections under SSP126 and SSP585 suggest that the suitable areas will expand by 4.25% and 18.92% (Figure 11), respectively, with Xinjiang (+352,205 km2 and +913,490 km2), Inner Mongolia (+377,205 km2 and +731,684 km2), and northeastern China (+51,042 km2 and +348,941 km2) emerging as key expansion regions. Notably, under SSP585, habitat expansion is especially significant, including new suitable habitats in the Junggar Basin, Tarim Basin, Inner Mongolian Plateau, Northeast Plain, and the Qinghai–Tibet Plateau. Conversely, extremely suitable habitats under SSP585 display significant fragmentation in the middle and lower reaches of the Yangtze River Basin, southern China, and parts of eastern China, with a habitat contraction rate of 12.77%. This decrease is mainly due to the increase in the intensity, frequency, and duration of extreme heat events [88]. Consequently, habitat suitability in southern China will substantially diminish, highlighting the necessity of integrating population migration capacities and climate-resource matching into traditional habitat assessments. Additionally, the SSP585 scenario illustrates distinct elevation gradient responses, with suitable areas at low elevations (<500 m) decreasing by 7.23% and those at medium-to-high elevations (>500 m) expanding by 35.33%. Notably, the South Tibet Valley and the Sichuan–Tibet Alpine Valley, located at extreme elevations (3000–4000 m), are projected to emerge as newly suitable habitat corridors.
Effective forest ecosystem management is essential for preserving biodiversity and ecosystem services. However, achieving sustainable resource management across discontinuous spatiotemporal scales poses significant challenges. In China, endemic tree species such as Ginkgo biloba, Cathaya argyrophylla, and Davidia involucrata exhibit continuous habitat contraction under climate change stress [89,90,91]. The dynamic shifts in suitable habitats for C. bungei underscore the need for predictive spatial distribution models and optimized regional forest management systems. This study defines a prediction period of 2021–2100, utilizing the SSP126 and SSP585 scenarios. Simulations reveal that climate change drives the northwestward migration of C. bungei’s distribution center, with the migration amplitude increasing significantly with higher greenhouse gas concentrations. Although Jian et al. [53] did not employ an optimized MaxEnt model, their findings suggest the potential migration of C. bungei habitats toward high-elevation regions like the Tianshan Mountains. This study confirms the species’ adaptability to such environments, providing a theoretical foundation for extending beyond traditional forest boundaries through artificial introductions. Accordingly, we propose two primary recommendations: (1) enhancing the protection network of existing suitable habitats and (2) developing targeted introduction strategies for high-elevation transition zones and arid northwestern China, improving species adaptability via gradual climate acclimatization. The optimized MaxEnt model developed here quantifies the climate–habitat response, offering decision-making support for C. bungei afforestation zoning and sustainable forest management plans based on climate adaptability.

4.4. Limitations and Future Research Suggestions

Species Distribution Models (SDMs) are valuable tools for quantitatively assessing species’ geographical distribution patterns, offering substantial value for ecological conservation planning and habitat restoration. Constructing these models requires integrating biological factors, such as interspecific interactions, with environmental variables, including climate and topography, to ensure accurate predictions. However, prioritizing model interpretability in ecological niche modeling often necessitates variable selection strategies that may introduce systematic biases and prediction errors. Key factors limiting model performance include algorithm selection, the spatial completeness of species occurrence data, multicollinearity among environmental variables, and Regularization Multiplier optimization. To address these, this study employs the MaxEnt model, leveraging an existing C. bungei database to enhance the spatial integrity of the occurrence data. Jackknife testing filters climate and topographic variables, Variance Inflation Factor (VIF) calculations mitigate multicollinearity, and the kuenm package in R optimizes model parameters to improve accuracy. Nevertheless, limitations persist, including the omission of biological interactions, dynamic land-use changes, and future socioeconomic factors. Notably, spatial–temporal scale bias (using 5 km × 5 km grids), the absence of species–environment feedback mechanisms, and unpredictable disturbances (e.g., extreme weather or pest outbreaks) contribute to model uncertainty. Despite these constraints, the modeled distribution of suitable habitats aligns with SDM validation standards, retaining ecological explanatory power. Future research could integrate soil properties (e.g., pH or organic matter content) and human disturbance intensity (HDI) datasets, develop a coupled land-use change and species migration model, and refine theoretical guidance for C. bungei conservation and utilization through ensemble SDM validation.

5. Conclusions

This study employed an optimized Maximum Entropy (MaxEnt) model using the kuenm package in R, integrated with CMIP6 climate scenario data, to systematically evaluate the spatiotemporal evolution of suitable habitats for C. bungei under current and future climate conditions. The current simulation indicates that highly suitable habitats (p > 0.47) were predominantly concentrated in the Yellow, Yangtze, and Huaihe River Basins (24°–42° N, 90°–122° E), specifically at the junction of Hebei, Shaanxi, Shanxi, Shandong, and Henan provinces, extending southward to the northern slopes of Xuefeng Mountain in Hunan Province. Multi-scenario simulations project that by 2100, the total suitable habitats for C. bungei will expand by approximately 4.25% under SSP126 and 18.92% under SSP585, relative to the baseline period, accompanied by a pronounced northwestward shift in the distribution center. The middle and lower reaches of the Yellow River remain optimal distribution regions, with significant potential habitat expansion in semi-arid and arid areas of Xinjiang, Inner Mongolia, Gansu, and Liaoning. Newly suitable habitats in these regions are projected to constitute approximately 21.41% (SSP126) and 42.63% (SSP585) of the total suitable areas. In contrast, the central hilly regions of the Yangtze River Basin (Hubei and northern Hunan) and coastal regions of southern China (Fujian, Guangdong, and Guangxi) show a decrease in habitat suitability (HSI < 0.3408), highlighting a clear trend of northward expansion and southward contraction. Under the SSP585 emission scenario, by the 2090s, new suitable habitat patches are projected to emerge in the South Tibet Valley and Sichuan–Tibet Alpine Valley, with the upper elevation limit of distribution increasing by approximately 372 m compared to the current conditions. Climate factor analysis reveals that Bio6 (Min Temperature of Coldest Month), accounting for a 79.87% contribution in the Jackknife test, acts as the primary limiting factor driving habitat shifts for C. bungei. Based on these findings, this study proposes prioritizing the establishment of climate-adaptive artificial forest cultivation bases within newly identified expansion hotspots (Xinjiang, Inner Mongolia, and Northeast China), complemented by gradient transplant experiments aimed at progressively enhancing species adaptability. Additionally, in historically stable distribution zones (the border areas of Shaanxi, Shanxi, and Henan), targeted in situ conservation strategies are recommended, including ecological corridor networks designed to strengthen habitat connectivity.

Author Contributions

Conceptualization, X.S. and C.Y.; methodology, X.S. and J.Z.; formal analysis, J.Z.; data curation, J.Z., Y.W. and G.W.; writing—original draft preparation, X.S., J.Z., Y.W., G.W. and Y.H.; writing—review and editing, X.S., J.Z., Y.W. and Y.H.; funding acquisition, X.S. and C.Y. All authors have read and agreed to the published version of the manuscript.

Funding

This research was funded by the National Natural Science Foundation of China (grant number: 32271909).

Data Availability Statement

The output data of this study are available from the corresponding authors upon reasonable request.

Conflicts of Interest

The authors declare no conflicts of interest.

References

  1. Byers, B.A.; Cunliffe, R.N.; Hudak, A.T. Linking the conservation of culture and nature: A case study of sacred forests in Zimbabwe. Hum. Ecol. 2001, 29, 187–218. [Google Scholar] [CrossRef]
  2. Liu, L.; Qin, F.; Liu, Y.; Hu, Y.; Wang, W.; Duan, H.; Li, M. Forecast of potential suitable areas for forest resources in Inner Mongolia under the Shared Socioeconomic Pathway 245 scenario. Ecol. Indic. 2024, 167, 112694. [Google Scholar] [CrossRef]
  3. Luo, W.; Sun, C.; Yang, S.; Chen, W.; Sun, Y.; Li, Z.; Liu, J.; Tao, W.; Tao, J. Contrasting range changes and drivers of four forest foundation species under future climate change in China. Sci. Total Environ. 2024, 942, 173784. [Google Scholar] [CrossRef] [PubMed]
  4. Wang, C.; Yan, X.; Chang, Y.; Wang, Q.; Wang, Y.; Malik, A. Understanding the impact of interprovincial trade on forest resources in China. Renew. Sustain. Energy Rev. 2023, 186, 113673. [Google Scholar] [CrossRef]
  5. Pan, H.; Liu, G.; Muller, J.-P.; Sun, Z.; Yao, Y.; Chang, Y.; Xiong, Z.; Zhang, Y. Comprehensive Assessment of Sustainable Development of Terrestrial Ecosystem Based on SDG 15—A Case Study of Guilin City. Remote Sens. 2024, 17, 63. [Google Scholar] [CrossRef]
  6. Urban, M.C. Climate change extinctions. Science 2024, 386, 1123–1128. [Google Scholar] [CrossRef]
  7. Chen, H.; Sun, J. Anthropogenic influence has increased climate extreme occurrence over China. Sci. Bull. 2021, 66, 749–752. [Google Scholar] [CrossRef]
  8. Mukherji, A. Climate Change 2023 Synthesis Report; IPCC: Geneva, Switzerland, 2023. [Google Scholar]
  9. Liu, X.; Ma, K. Plant functional traits—Concepts, applications and future directions. Sci. Sin. Vitae 2015, 45, 325–339. [Google Scholar] [CrossRef]
  10. Chludil, D.; Čepl, J.; Steffenrem, A.; Stejskal, J.; Sagariya, C.; Pook, T.; Schueler, S.; Korecký, J.; Almqvist, C.; Chakraborty, D. A Pollen-Based Assisted Migration for Rapid Forest Adaptation. Glob. Change Biol. 2025, 31, e70014. [Google Scholar] [CrossRef]
  11. Wang, P.; Ma, L.; Li, Y.; Wang, S.A.; Li, L.; Yang, R.; Ma, Y.; Wang, Q. Transcriptome profiling of indole-3-butyric acid-induced adventitious root formation in softwood cuttings of the Catalpa bungei variety ‘YU-1’at different developmental stages. Genes Genom. 2016, 38, 145–162. [Google Scholar] [CrossRef]
  12. Wang, R.; Shi, L.; Wang, Y. Physical and mechanical properties of Catalpa bungei clones and estimation of the properties by near-infrared spectroscopy. J. Renew. Mater. 2022, 10, 3285. [Google Scholar] [CrossRef]
  13. Guo, P.; Zhao, X.; Yang, Z.; Wang, Y.; Li, H.; Zhang, L. Water, starch, and nuclear behavior in ray parenchyma during heartwood formation of Catalpa bungei ‘Jinsi’. Heliyon 2024, 10, e27231. [Google Scholar] [CrossRef] [PubMed]
  14. Mei, F.; Wang, J.-H.; Gu, J.-W.; Jiao, Y.-D.; Zhao, K. Genetic Diversity of Growth and Leaf Traits of Catalpa bungei. J. Plant Genet. Resour. 2014, 15, 207–211. [Google Scholar]
  15. Zheng, H.; Zhang, X.; Ma, W.; Song, J.; Rahman, S.U.; Wang, J.; Zhang, Y. Morphological and physiological responses to cyclic drought in two contrasting genotypes of Catalpa bungei. Environ. Exp. Bot. 2017, 138, 77–87. [Google Scholar] [CrossRef]
  16. Guan, Z.; Lin, D.; Chen, D.; Guo, Y.; Lu, Y.; Han, Q.; Li, N.; Su, Y.; Li, J.; Wang, J. Soil microbial communities response to different fertilization regimes in young Catalpa bungei plantation. Front. Microbiol. 2022, 13, 948875. [Google Scholar] [CrossRef]
  17. Zhou, X.; Hu, C.; Wang, Z. Distribution of biomass and carbon content in estimation of carbon density for typical forests. Glob. Ecol. Conserv. 2023, 48, e02707. [Google Scholar] [CrossRef]
  18. Yang, H.; Long, H.; Li, X.; Luo, X.; Liao, Y.; Wang, C.; Cai, H.; Shu, Y. Vegetation restoration improved aggregation stability and aggregated-associated carbon preservation in the karst areas of Guizhou Province, southwest China. PeerJ 2024, 12, e16699. [Google Scholar] [CrossRef]
  19. Xu, H.; Zhou, Z.; Dong, J.; Lei, M. Suppression of cervical cancer cell survival by ursolic acid extracted from Catalpa bungei leaves. Pharmacogn. Mag. 2018, 14, 425–431. [Google Scholar]
  20. Cao, S.; Zhang, J.; Chen, L.; Zhao, T. Ecosystem water imbalances created during ecological restoration by afforestation in China, and lessons for other developing countries. J. Environ. Manag. 2016, 183, 843–849. [Google Scholar] [CrossRef]
  21. Beniston, M. Climatic change in mountain regions: A review of possible impacts. Clim. Change 2003, 59, 5–31. [Google Scholar] [CrossRef]
  22. Sánchez-Benítez, A.; García-Herrera, R.; Barriopedro, D.; Sousa, P.M.; Trigo, R.M. June 2017: The earliest European summer mega-heatwave of reanalysis period. Geophys. Res. Lett. 2018, 45, 1955–1962. [Google Scholar] [CrossRef]
  23. Elisa, P.; Alessandro, P.; Andrea, A.; Silvia, B.; Mathis, P.; Dominik, P.; Manuela, R.; Francesca, T.; Voglar, G.E.; Tine, G. Environmental and climate change impacts of eighteen biomass-based plants in the alpine region: A comparative analysis. J. Clean. Prod. 2020, 242, 118449. [Google Scholar] [CrossRef]
  24. Rosa, R.; Simas, C.; Ataíde, R.; Soares, P.; Tomé, M. Optimal forest management under climate change variability. Ecol. Econ. 2024, 225, 108322. [Google Scholar] [CrossRef]
  25. Wu, W.; Zhou, G.; Xu, Z. Driving mechanisms of climate-plant-soil patterns on the structure and function of different grasslands along environmental gradients in Tibetan and Inner Mongolian Plateaus in China. J. Clean. Prod. 2022, 339, 130696. [Google Scholar] [CrossRef]
  26. Quan, J.E.; Ni, R.; Wang, Y.; Sun, J.; Ma, M.; Bi, H. Effects of different growth regulators on the rooting of Catalpa bignonioides softwood cuttings. Life 2022, 12, 1231. [Google Scholar] [CrossRef]
  27. Manzini, J.; Hoshika, Y.; Sicard, P.; De Marco, A.; Ferrini, F.; Pallozzi, E.; Neri, L.; Baraldi, R.; Paoletti, E.; Moura, B.B. Detection of morphological and eco-physiological traits of ornamental woody species to assess their potential Net O3 uptake. Environ. Res. 2024, 252, 118844. [Google Scholar] [CrossRef]
  28. Zhang, M.; Liu, B.; Fei, Y.; Yang, X.; Zhao, L.; Shi, C.; Zhang, Y.; Lu, N.; Wu, C.; Ma, W. Genetic architecture of leaf morphology revealed by integrated trait module in Catalpa bungei. Hortic. Res. 2023, 10, uhad032. [Google Scholar] [CrossRef]
  29. Kuniyal, C.P.; Rawat, Y.S.; Oinam, S.S.; Kuniyal, J.C.; Vishvakarma, S.C. Kuth (Saussurea lappa) cultivation in the cold desert environment of the Lahaul valley, northwestern Himalaya, India: Arising threats and need to revive socio-economic values. Biodivers. Conserv. 2005, 14, 1035–1045. [Google Scholar] [CrossRef]
  30. Elith, J.; Leathwick, J.R. Species distribution models: Ecological explanation and prediction across space and time. Annu. Rev. Ecol. Evol. Syst. 2009, 40, 677–697. [Google Scholar] [CrossRef]
  31. Zurell, D.; Franklin, J.; König, C.; Bouchet, P.J.; Dormann, C.F.; Elith, J.; Fandos, G.; Feng, X.; Guillera-Arroita, G.; Guisan, A. A standard protocol for reporting species distribution models. Ecography 2020, 43, 1261–1277. [Google Scholar] [CrossRef]
  32. Rivers, M.C.; Taylor, L.; Brummitt, N.A.; Meagher, T.R.; Roberts, D.L.; Nic Lughadha, E. How many herbarium specimens are needed to detect threatened species? Biol. Conserv. 2011, 144, 2541–2547. [Google Scholar] [CrossRef]
  33. Bakkenes, M.; Eickhout, B.; Alkemade, R. Impacts of different climate stabilisation scenarios on plant species in Europe. Glob. Environ. Change 2006, 16, 19–28. [Google Scholar] [CrossRef]
  34. Ma, L.; Pan, J. Spatial identification and priority conservation areas determination of wilderness in China. J. Clean. Prod. 2024, 451, 142069. [Google Scholar] [CrossRef]
  35. Baldwin, R.A. Use of maximum entropy modeling in wildlife research. Entropy 2009, 11, 854–866. [Google Scholar] [CrossRef]
  36. Adjemian, J.C.; Girvetz, E.H.; Beckett, L.; Foley, J.E. Analysis of Genetic Algorithm for Rule-Set Production (GARP) modeling approach for predicting distributions of fleas implicated as vectors of plague, Yersinia pestis, in California. J. Med. Entomol. 2006, 43, 93–103. [Google Scholar]
  37. Roigé, M.; Phillips, C.B. Validation and uncertainty analysis of the match climates regional algorithm (CLIMEX) for Pest risk analysis. Ecol. Inform. 2021, 61, 101196. [Google Scholar] [CrossRef]
  38. Costa, H.; Medeiros, V.; Azevedo, E.; Silva, L. Evaluating ecological-niche factor analysis as a modelling tool for environmental weed management in island systems. Weed Res. 2013, 53, 221–230. [Google Scholar] [CrossRef]
  39. Carpenter, G.; Gillison, A.N.; Winter, J. DOMAIN: A flexible modelling procedure for mapping potential distributions of plants and animals. Biodivers. Conserv. 1993, 2, 667–680. [Google Scholar] [CrossRef]
  40. Xu, T.; Hutchinson, M.F. New developments and applications in the ANUCLIM spatial climatic and bioclimatic modelling package. Environ. Model. Softw. 2013, 40, 267–279. [Google Scholar] [CrossRef]
  41. Elith, J.; Phillips, S.J.; Hastie, T.; Dudík, M.; Chee, Y.E.; Yates, C.J. A statistical explanation of MaxEnt for ecologists. Divers. Distrib. 2011, 17, 43–57. [Google Scholar] [CrossRef]
  42. Merow, C.; Smith, M.J.; Silander, J.A., Jr. A practical guide to MaxEnt for modeling species’ distributions: What it does, and why inputs and settings matter. Ecography 2013, 36, 1058–1069. [Google Scholar] [CrossRef]
  43. Petitpierre, B.; Kueffer, C.; Broennimann, O.; Randin, C.; Daehler, C.; Guisan, A. Climatic niche shifts are rare among terrestrial plant invaders. Science 2012, 335, 1344–1348. [Google Scholar] [CrossRef] [PubMed]
  44. Elith, J.; Graham, C.H.; Anderson, R.P.; Dudík, M.; Ferrier, S.; Guisan, A.; Hijmans, R.J.; Huettmann, F.; Leathwick, J.R.; Lehmann, A. Novel methods improve prediction of species’ distributions from occurrence data. Ecography 2006, 29, 129–151. [Google Scholar] [CrossRef]
  45. Phillips, S.J.; Dudík, M. Modeling of species distributions with Maxent: New extensions and a comprehensive evaluation. Ecography 2008, 31, 161–175. [Google Scholar] [CrossRef]
  46. Wan, J.-Z.; Wang, C.-J.; Yu, F.-H. Effects of occurrence record number, environmental variable number, and spatial scales on MaxEnt distribution modelling for invasive plants. Biologia 2019, 74, 757–766. [Google Scholar] [CrossRef]
  47. Vignali, S.; Barras, A.G.; Arlettaz, R.; Braunisch, V. SDMtune: An R package to tune and evaluate species distribution models. Ecol. Evol. 2020, 10, 11488–11506. [Google Scholar] [CrossRef]
  48. Warren, D.L.; Seifert, S.N. Ecological niche modeling in Maxent: The importance of model complexity and the performance of model selection criteria. Ecol. Appl. 2011, 21, 335–342. [Google Scholar] [CrossRef]
  49. Broennimann, O.; Treier, U.A.; Müller-Schärer, H.; Thuiller, W.; Peterson, A.; Guisan, A. Evidence of climatic niche shift during biological invasion. Ecol. Lett. 2007, 10, 701–709. [Google Scholar] [CrossRef]
  50. Fourcade, Y.; Besnard, A.G.; Secondi, J. Paintings predict the distribution of species, or the challenge of selecting environmental predictors and evaluation statistics. Glob. Ecol. Biogeogr. 2018, 27, 245–256. [Google Scholar] [CrossRef]
  51. Wu, K.; Wang, Y.; Liu, Z.; Huo, W.; Cao, J.; Zhao, G.; Zhang, F.-G. Prediction of potential invasion of two weeds of the genus Avena in Asia under climate change based on Maxent. Sci. Total Environ. 2024, 950, 175192. [Google Scholar] [CrossRef]
  52. Zhao, R.; Wang, S.; Chen, S. Predicting the potential habitat suitability of saussurea species in China under future climate scenarios using the optimized maximum entropy (maxent) model. J. Clean. Prod. 2024, 474, 143552. [Google Scholar] [CrossRef]
  53. Jian, S.; Zhu, T.; Wang, J.; Yan, D. The current and future potential geographical distribution and evolution process of Catalpa bungei in China. Forests 2022, 13, 96. [Google Scholar] [CrossRef]
  54. Liu, X.-T.; Yuan, Q.; Ni, J. Research advances in modelling plant species distribution in China. Chin. J. Plant Ecol. 2019, 43, 273. [Google Scholar] [CrossRef]
  55. Li, D.; Li, Z.; Liu, Z.; Yang, Y.; Khoso, A.G.; Wang, L.; Liu, D. Climate change simulations revealed potentially drastic shifts in insect community structure and crop yields in China’s farmland. J. Pest Sci. 2023, 96, 55–69. [Google Scholar] [CrossRef]
  56. Su, B.; Huang, J.; Mondal, S.K.; Zhai, J.; Wang, Y.; Wen, S.; Gao, M.; Lv, Y.; Jiang, S.; Jiang, T. Insight from CMIP6 SSP-RCP scenarios for future drought characteristics in China. Atmos. Res. 2021, 250, 105375. [Google Scholar] [CrossRef]
  57. Yang, L.; Jia, H.; Hua, Q. Predicting suitable habitats of parasitic desert species based on Biomod2 ensemble model: Cynomorium songaricum rupr and its host plants as an example. BMC Plant Biol. 2025, 25, 351. [Google Scholar] [CrossRef]
  58. Guo, Y.; Zhao, Z.; Zhu, F.; Gao, B. The impact of global warming on the potential suitable planting area of Pistacia chinensis is limited. Sci. Total Environ. 2023, 864, 161007. [Google Scholar] [CrossRef]
  59. Guisan, A.; Thuiller, W.; Zimmermann, N.E. Habitat Suitability and Distribution Models: With Applications in R; Cambridge University Press: Cambridge, UK, 2017. [Google Scholar]
  60. Dudik, M.; Phillips, S.J.; Schapire, R.E. Performance guarantees for regularized maximum entropy density estimation. In Proceedings of the International Conference on Computational Learning Theory, Banff, AB, Canada, 1–4 July 2004; pp. 472–486. [Google Scholar]
  61. Phillips, S.J.; Anderson, R.P.; Schapire, R.E. Maximum entropy modeling of species geographic distributions. Ecol. Model. 2006, 190, 231–259. [Google Scholar] [CrossRef]
  62. Cobos, M.E.; Peterson, A.T.; Barve, N.; Osorio-Olvera, L. kuenm: An R package for detailed development of ecological niche models using Maxent. PeerJ 2019, 7, e6281. [Google Scholar] [CrossRef]
  63. Alanís-Méndez, J.L.; Soto, V.; Limón-Salvador, F. Effects of Climate Change on the Distribution of Prosthechea mariae (Orchidaceae) and within Protected Areas in Mexico. Plants 2024, 13, 839. [Google Scholar] [CrossRef]
  64. Luo, M.; Yang, P.; Yang, L.; Zheng, Z.; Chen, Y.; Li, H.; Wu, M. Predicting potentially suitable Bletilla striata habitats in China under future climate change scenarios using the optimized MaxEnt model. Sci. Rep. 2025, 15, 21231. [Google Scholar] [CrossRef] [PubMed]
  65. Gao, K.; Wu, H.; Li, C.; Luo, G.; Zhao, T.; Chen, C.; Liu, Y.; Duan, M.; Wang, C. A Simulation of a Suitable Habitat for Acer yangbiense and Cinnamomum chago Under Climate Change. Forests 2025, 16, 621. [Google Scholar] [CrossRef]
  66. Zhao, Y.; Deng, X.; Xiang, W.; Chen, L.; Ouyang, S. Predicting potential suitable habitats of Chinese fir under current and future climatic scenarios based on Maxent model. Ecol. Inform. 2021, 64, 101393. [Google Scholar] [CrossRef]
  67. Zhao, J.; Wang, C.; Shi, X.; Bo, X.; Li, S.; Shang, M.; Chen, F.; Chu, Q. Modeling climatically suitable areas for soybean and their shifts across China. Agric. Syst. 2021, 192, 103205. [Google Scholar] [CrossRef]
  68. Yang, H.; Viña, A.; Tang, Y.; Zhang, J.; Wang, F.; Zhao, Z.; Liu, J. Range-wide evaluation of wildlife habitat change: A demonstration using Giant Pandas. Biol. Conserv. 2017, 213, 203–209. [Google Scholar] [CrossRef]
  69. Yang, W.; Sun, S.; Wang, N.; Fan, P.; You, C.; Wang, R.; Zheng, P.; Wang, H. Dynamics of the distribution of invasive alien plants (Asteraceae) in China under climate change. Sci. Total Environ. 2023, 903, 166260. [Google Scholar] [CrossRef] [PubMed]
  70. Junliang, X.; Jiayu, H.; Tong, W.; Lexin, Z.; Pengfei, L.; Miao, W.; Yiping, Z. Intra-annual growth and its response to climatic factors in four ring-porous wood species. J. Zhejiang AF Univ. 2024, 41, 1105–1113. [Google Scholar]
  71. Çoban, H.O.; Örücü, Ö.K.; Arslan, E.S. MaxEnt Modeling for Predicting the Current and Future Potential Geographical Distribution of Quercus libani Olivier. Sustainability 2020, 12, 2671. [Google Scholar] [CrossRef]
  72. Chen, Z.; Wang, W.; Fu, J. Vegetation response to precipitation anomalies under different climatic and biogeographical conditions in China. Sci. Rep. 2020, 10, 830. [Google Scholar] [CrossRef]
  73. Elith, J.; Graham, C.H. Do they? How do they? WHY do they differ? On finding reasons for differing performances of species distribution models. Ecography 2009, 32, 66–77. [Google Scholar] [CrossRef]
  74. Qin, A.; Liu, B.; Guo, Q.; Bussmann, R.W.; Ma, F.; Jian, Z.; Xu, G.; Pei, S. Maxent modeling for predicting impacts of climate change on the potential distribution of Thuja sutchuenensis Franch., an extremely endangered conifer from southwestern China. Glob. Ecol. Conserv. 2017, 10, 139–146. [Google Scholar] [CrossRef]
  75. Jiménez-Valverde, A.; Peterson, A.T.; Soberón, J.; Overton, J.; Aragón, P.; Lobo, J.M. Use of niche models in invasive species risk assessments. Biol. Invasions 2011, 13, 2785–2797. [Google Scholar] [CrossRef]
  76. Li, Y.; Li, M.; Li, C.; Liu, Z. Optimized maxent model predictions of climate change impacts on the suitable distribution of Cunninghamia lanceolata in China. Forests 2020, 11, 302. [Google Scholar] [CrossRef]
  77. Hijmans, R.J.; Phillips, S.; Leathwick, J.; Elith, J.; Hijmans, M.R.J. Package ‘dismo’. Circles 2017, 9, 1–68. [Google Scholar]
  78. Aidoo, O.F.; Souza, P.G.C.; da Silva, R.S.; Santana, P.A., Jr.; Picanço, M.C.; Kyerematen, R.; Sètamou, M.; Ekesi, S.; Borgemeister, C. Climate-induced range shifts of invasive species (Diaphorina citri Kuwayama). Pest Manag. Sci. 2022, 78, 2534–2549. [Google Scholar] [CrossRef]
  79. Brodribb, T.J.; Powers, J.; Cochard, H.; Choat, B. Hanging by a thread? Forests and drought. Science 2020, 368, 261–266. [Google Scholar] [CrossRef]
  80. Zhou, W.; Chen, F.; Meng, Y.; Chandrasekaran, U.; Luo, X.; Yang, W.; Shu, K. Plant waterlogging/flooding stress responses: From seed germination to maturation. Plant Physiol. Biochem. 2020, 148, 228–236. [Google Scholar] [CrossRef] [PubMed]
  81. Zhang, L.; Jing, Z.; Li, Z.; Liu, Y.; Fang, S. Predictive modeling of suitable habitats for Cinnamomum Camphora (L.) presl using maxent model under climate change in China. Int. J. Environ. Res. Public Health 2019, 16, 3185. [Google Scholar] [CrossRef]
  82. Li, T.; Zhang, J.; Zhang, H.; Niu, S.; Qian, J.; Chen, Z.; Ma, T.; Meng, Y.; Di, B. Identification of Catalpa bungei Aquaporin Gene Family Related to Low Temperature Stress. Forests 2024, 15, 1063. [Google Scholar] [CrossRef]
  83. Pederson, G.T.; Stahle, D.; McWethy, D.B.; Toohey, M.; Jungclaus, J.; Lee, C.; Martin, J.; Alt, M.; Kichas, N.; Chellman, N. Dynamic treeline and cryosphere response to pronounced mid-Holocene climatic variability in the US Rocky Mountains. Proc. Natl. Acad. Sci. USA 2025, 122, e2412162121. [Google Scholar] [CrossRef]
  84. Wu, J.; Su, Y.; Wang, J.; He, Q.; Qiu, Q.; Ma, J.; Li, J. Morphological and physiological acclimation of Catalpa bungei plantlets to different light conditions. Photosynthetica 2018, 56, 537–548. [Google Scholar] [CrossRef]
  85. Omann, I.; Stocker, A.; Jäger, J. Climate change as a threat to biodiversity: An application of the DPSIR approach. Ecol. Econ. 2009, 69, 24–31. [Google Scholar] [CrossRef]
  86. Yang, X.; Zhou, B.; Xu, Y.; Han, Z. CMIP6 evaluation and projection of temperature and precipitation over China. Adv. Atmos. Sci. 2021, 38, 817–830. [Google Scholar] [CrossRef]
  87. Zhang, C.; Xiao, C.; Li, S.; Ren, Y.; Zhang, S.; Cai, X.; Sangbu, Z. Analysis of the composite risk grade for multi extreme climate events in China in recent 60 years. Climate 2023, 11, 191. [Google Scholar] [CrossRef]
  88. Wang, Y.; Bai, X.; Lei, Y.; Ding, W.; Wu, S. The Projection of Extreme Heat and Precipitation Events in China Response to Global Warming Under the SSP1-2.6 and SSP5-8.5 Scenarios. Int. J. Climatol. 2025, 45, e8807. [Google Scholar] [CrossRef]
  89. Tang, C.Q.; Dong, Y.-F.; Herrando-Moraira, S.; Matsui, T.; Ohashi, H.; He, L.-Y.; Nakao, K.; Tanaka, N.; Tomita, M.; Li, X.-S. Potential effects of climate change on geographic distribution of the Tertiary relict tree species Davidia involucrata in China. Sci. Rep. 2017, 7, 43822. [Google Scholar] [CrossRef]
  90. Xiao, F.; She, Y.; She, J.; Zhang, J.; Zhang, X.; Luo, C. Assessing habitat suitability and selecting optimal habitats for relict tree Cathaya argyrophylla in Hunan, China: Integrating pollen size, environmental factors, and niche modeling for conservation. Ecol. Indic. 2022, 145, 109669. [Google Scholar] [CrossRef]
  91. Wang, L.; Liu, J.; Liu, J.; Wei, H.; Fang, Y.; Wang, D.; Chen, R.; Gu, W. Revealing the long-term trend of the global-scale Ginkgo biloba distribution and the impact of future climate change based on the ensemble modeling. Biodivers. Conserv. 2023, 32, 2077–2100. [Google Scholar] [CrossRef]
Figure 1. The framework of this study.
Forests 16 01150 g001
Figure 2. (a) Distribution of C. bungei occurrence points in China with elevation. (b) Field photograph of a sampling site (Imperial Garden, Beijing Forbidden City, 10 October 2024), showing typical morphological traits: average tree height (~10 m), crown width (8.2 m), and maximum diameter (133 cm).
Forests 16 01150 g002
Figure 3. Variable correlation heatmap and multicollinearity assessment (VIF values) during the environmental variable screening process. The green-marked variables were retained after pairwise correlation pruning (|r| > 0.8) and VIF filtering (VIF < 10), serving as inputs for the final MaxEnt model. This figure visualizes the methodological step of variable selection described in Section 2.3.
Forests 16 01150 g003
Figure 4. Results of the Principal Component Analysis (PCA) using the eight retained environmental variables. (a) The sampling points of C. bungei in the environmental space defined by the first two PCA axes. (b) A correlation circle of the selected variables as a function of the first two PCA axes.
Forests 16 01150 g004
Figure 5. Model optimization and evaluation results of MaxEnt models under different parameter combinations. (a) Training omission rate at the 5% threshold (OR5) and (b) Delta.AICc values from candidate models with varying Regularization Multiplier (RM) and Feature Combination (FC) settings. The FC abbreviations represent combinations of feature types: L = Linear, Q = Quadratic, P = Product, T = Threshold, and H = Hinge, with examples including LT (Linear + Threshold) and LQT (Linear + Quadratic + Threshold). Although 31 FCs were tested, seven representative configurations are shown for clarity, focusing on those relevant to the best-performing models. (c) Box plots of the three model evaluation metrics: AUC (Area Under the Curve), TSS (True Skill Statistic), and Kappa, for the two optimal models (RM = 2.0 with FC = LT and RM = 2.5 with FC = LQT) identified during model selection.
Forests 16 01150 g005
Figure 7. Response curves of C. bungei presence probability and environmental factors. (a) Max Temperature of Warmest Month (Bio5, °C); (b) Min Temperature of Coldest Month (Bio6, °C); (c) Annual Precipitation (Bio12, mm); (d) Elevation (m).
Forests 16 01150 g007
Figure 8. (a) The proportion and changing trend of each suitable habitat area. (b) Changes in the spatial pattern of potential suitable habitats.
Forests 16 01150 g008
Figure 9. (a) Centroids shifts in C. bungei in future climate scenarios. (b1) SSP126 scenario; (b2) SSP585 scenario.
Forests 16 01150 g009
Figure 10. The composite graph of the distribution of C. bungei sampling points, habitat suitability, and key environmental variable contour lines. (a) Max Temperature of Warmest Month (Bio5, °C); (b) Min Temperature of Coldest Month (Bio6, °C); (c) Annual Precipitation (Bio12, mm); (d) Contour Line (Elevation) composeite graph.
Forests 16 01150 g010
Figure 11. The proportion of area change in the suitable habitat of C. bungei. Red indicates an increase, blue indicates a decrease, and the darker the color, the more drastic the area change.
Forests 16 01150 g011
Table 1. The 22 candidate bioclimatic and topographic variables used in MaxEnt modeling.
CodeVariable DescriptionUnit
Bio1Annual Mean Temperature°C
Bio2Mean Diurnal Range°C
Bio3Isothermality
Bio4Temperature Seasonality
Bio5Max Temperature of Warmest Month°C
Bio6Min Temperature of Coldest Month°C
Bio7Annual Temperature Range°C
Bio8Mean Temperature of Wettest Quarter°C
Bio9Mean Temperature of Driest Quarter°C
Bio10Mean Temperature of Warmest Quarter°C
Bio11Mean Temperature of Coldest Quarter°C
Bio12Annual Precipitationmm
Bio13Precipitation of Wettest Monthmm
Bio14Precipitation of Driest Monthmm
Bio15Precipitation Seasonality
Bio16Precipitation of Wettest Quartermm
Bio17Precipitation of Driest Quartermm
Bio18Precipitation of Warmest Quartermm
Bio19Precipitation of Coldest Quartermm
EleElevationm
SlpSlope°
AspAspect
Table 2. Average parameter values of the eight environmental factors of C. bungei.
FactorPC (%)PI (%)RTGwRTGOTGWTGOAUCwAUCO
Bio31.880.691.210.141.310.260.900.72
Bio51.621.231.210.331.310.330.900.71
Bio679.8776.170.861.001.011.050.870.86
Bio126.287.121.170.481.260.570.890.77
Bio150.861.551.200.181.300.240.900.69
Slp4.295.171.150.011.210.030.890.53
Asp1.010.391.200.011.310.000.900.51
Ele4.187.681.200.321.280.310.900.70
PC, percent contribution; PI, permutation importance; RTGW, regularized training gain without this factor; RTGO, regularized training gain with only this factor; TGW, test gain without this factor; TGO, test gain with only this factor; AUCW, Area Under the Curve (AUC) without this factor; and AUCO, Area Under the Curve (AUC) with only this factor.
Table 3. Response range and mean value of key environmental factors at different suitability levels.
Suitability LevelBio5 (°C)Bio6 (°C)Bio12 (mm)Elevation (m)
RangeMeanRangeMeanRangeMeanRangeMean
Low16.2–23.620.816.1–9.9−3.0242–4583802040–36282081
Moderate23.6–39.932.112.1–4.8−3.5458–5423005889–20401427
Extreme28.1–33.6 or
33.9–47.0
37.6−9.8–3.1−3.51630–43341086−154–830339
Disclaimer/Publisher’s Note: The statements, opinions and data contained in all publications are solely those of the individual author(s) and contributor(s) and not of MDPI and/or the editor(s). MDPI and/or the editor(s) disclaim responsibility for any injury to people or property resulting from any ideas, methods, instructions or products referred to in the content.

