1. Introduction
Wood and especially log structures can be considered sustainable building materials given their renewability, low embodied energy, and carbon-sequestration benefits. Modern log-built homes reflect these advantages. Wood framing can store several times more carbon than a conventional frame house while requiring less process energy. Life-cycle studies underscore these benefits. One comparison of a typical log home vs. a conventional timber-frame house found approximately 40% lower greenhouse gas emissions and three to four times greater carbon storage in the log structure, even before crediting biomass [
1].
Log structures encompass a wide variety of construction based on used materials, like lumber or glue laminated timber, corner joint types, log shapes, and other criteria. Thanks to its thickness and the thermal properties of the wood, the log structure acts both as a loadbearing element and a thermal insulator, eliminating the need for additional thermal insulation [
2]. Due to the high demand for the insulating properties of structures, additional thermal insulation is necessary, thus creating sandwich structures.
The insulation layer in sustainable buildings is increasingly sourced from bio-based fibers rather than petrochemical foams. Natural fibers (cellulose, hemp, wool, straw, etc.) are renewable, low-density, and often locally available, avoiding the high embodied energy, like that of mineral wool or polystyrene [
3].
While Simões [
4] studied cork boards for facades, Nunes [
5] reviewed several bio-based insulations and their properties, namely flax, hemp, straw, bamboo and rattan, reed, wool, peat, grass, and several pith plants. Koh [
6] investigated the hygrothermal properties of and mold growth on bio-based composites of mycelium, hemp, grass, and cork. Mawardi [
7] investigated the thermal conductivity of oil palm trunks fibers reinforced with biopolymer hybrid composites. Badouard [
8] investigated hygric properties of wine byproducts: stalks, grape pomace, crushed stalks, and skins. Fedorik [
9] investigated insulation based on peat, moss, wood shavings, recycled paper, and feathers. Mesa [
10] investigated straw bale walls and their heat transfer coefficient in static borer conditions. Then, the researchers simulated hygrothermal behavior for 5 years under dynamic conditions.
Sheep wool has attracted attention due to its naturally hygroscopic fibers and ability to improve indoor air quality by adsorbing formaldehyde and other pollutants from the air [
3]. The use of sheep wool as insulation material in timber-based wall assemblies is increasingly gaining attention thanks to its positive thermal, hygroscopic, and acoustic performance. Although sheep wool has historically been used for thermal insulation, especially in rural buildings, its application in current wood-based structures remains relatively underexplored. Reviews and experiments indicate that while sheep wool is commercially available in forms such as mats and panels, its integration with timber structures is still a new, yet promising solution. This also leads to sustainable solutions in civil engineering [
11]. Sheep-wool mats have thermal conductivity comparable to glass wool of a similar density [
12]. Further investigations on thermal conductivity, tensile strength, water absorption, and flammability were performed by Vėjelis [
13], and the results showed the dependence of thermal conductivity on the thickness of insulation. These mats are comparable to insulations already marketed. They exhibit reduced flammability using specified flame-retardant amounts and safe use in structures even after short-term submersion in water. Zach [
14] investigated acoustic and thermal conductivity properties. The results show that the thermal properties of the researched sheep wool insulation match commercial insulations.
The aim of this research is to verify the hygrothermal performance of sheep wool insulation in situ and describe the impact of the vapor retarder on the moisture content of insulation and wood in a sandwich log structure assembly. Possible water vapor condensation in a critical place in the structure is verified. The impact of the vapor retarder is described statistically at a significance level of 5%. This research can add to knowledge in designing safe timber structures with bio-based insulations.
2. Materials and Methods
2.1. Materials
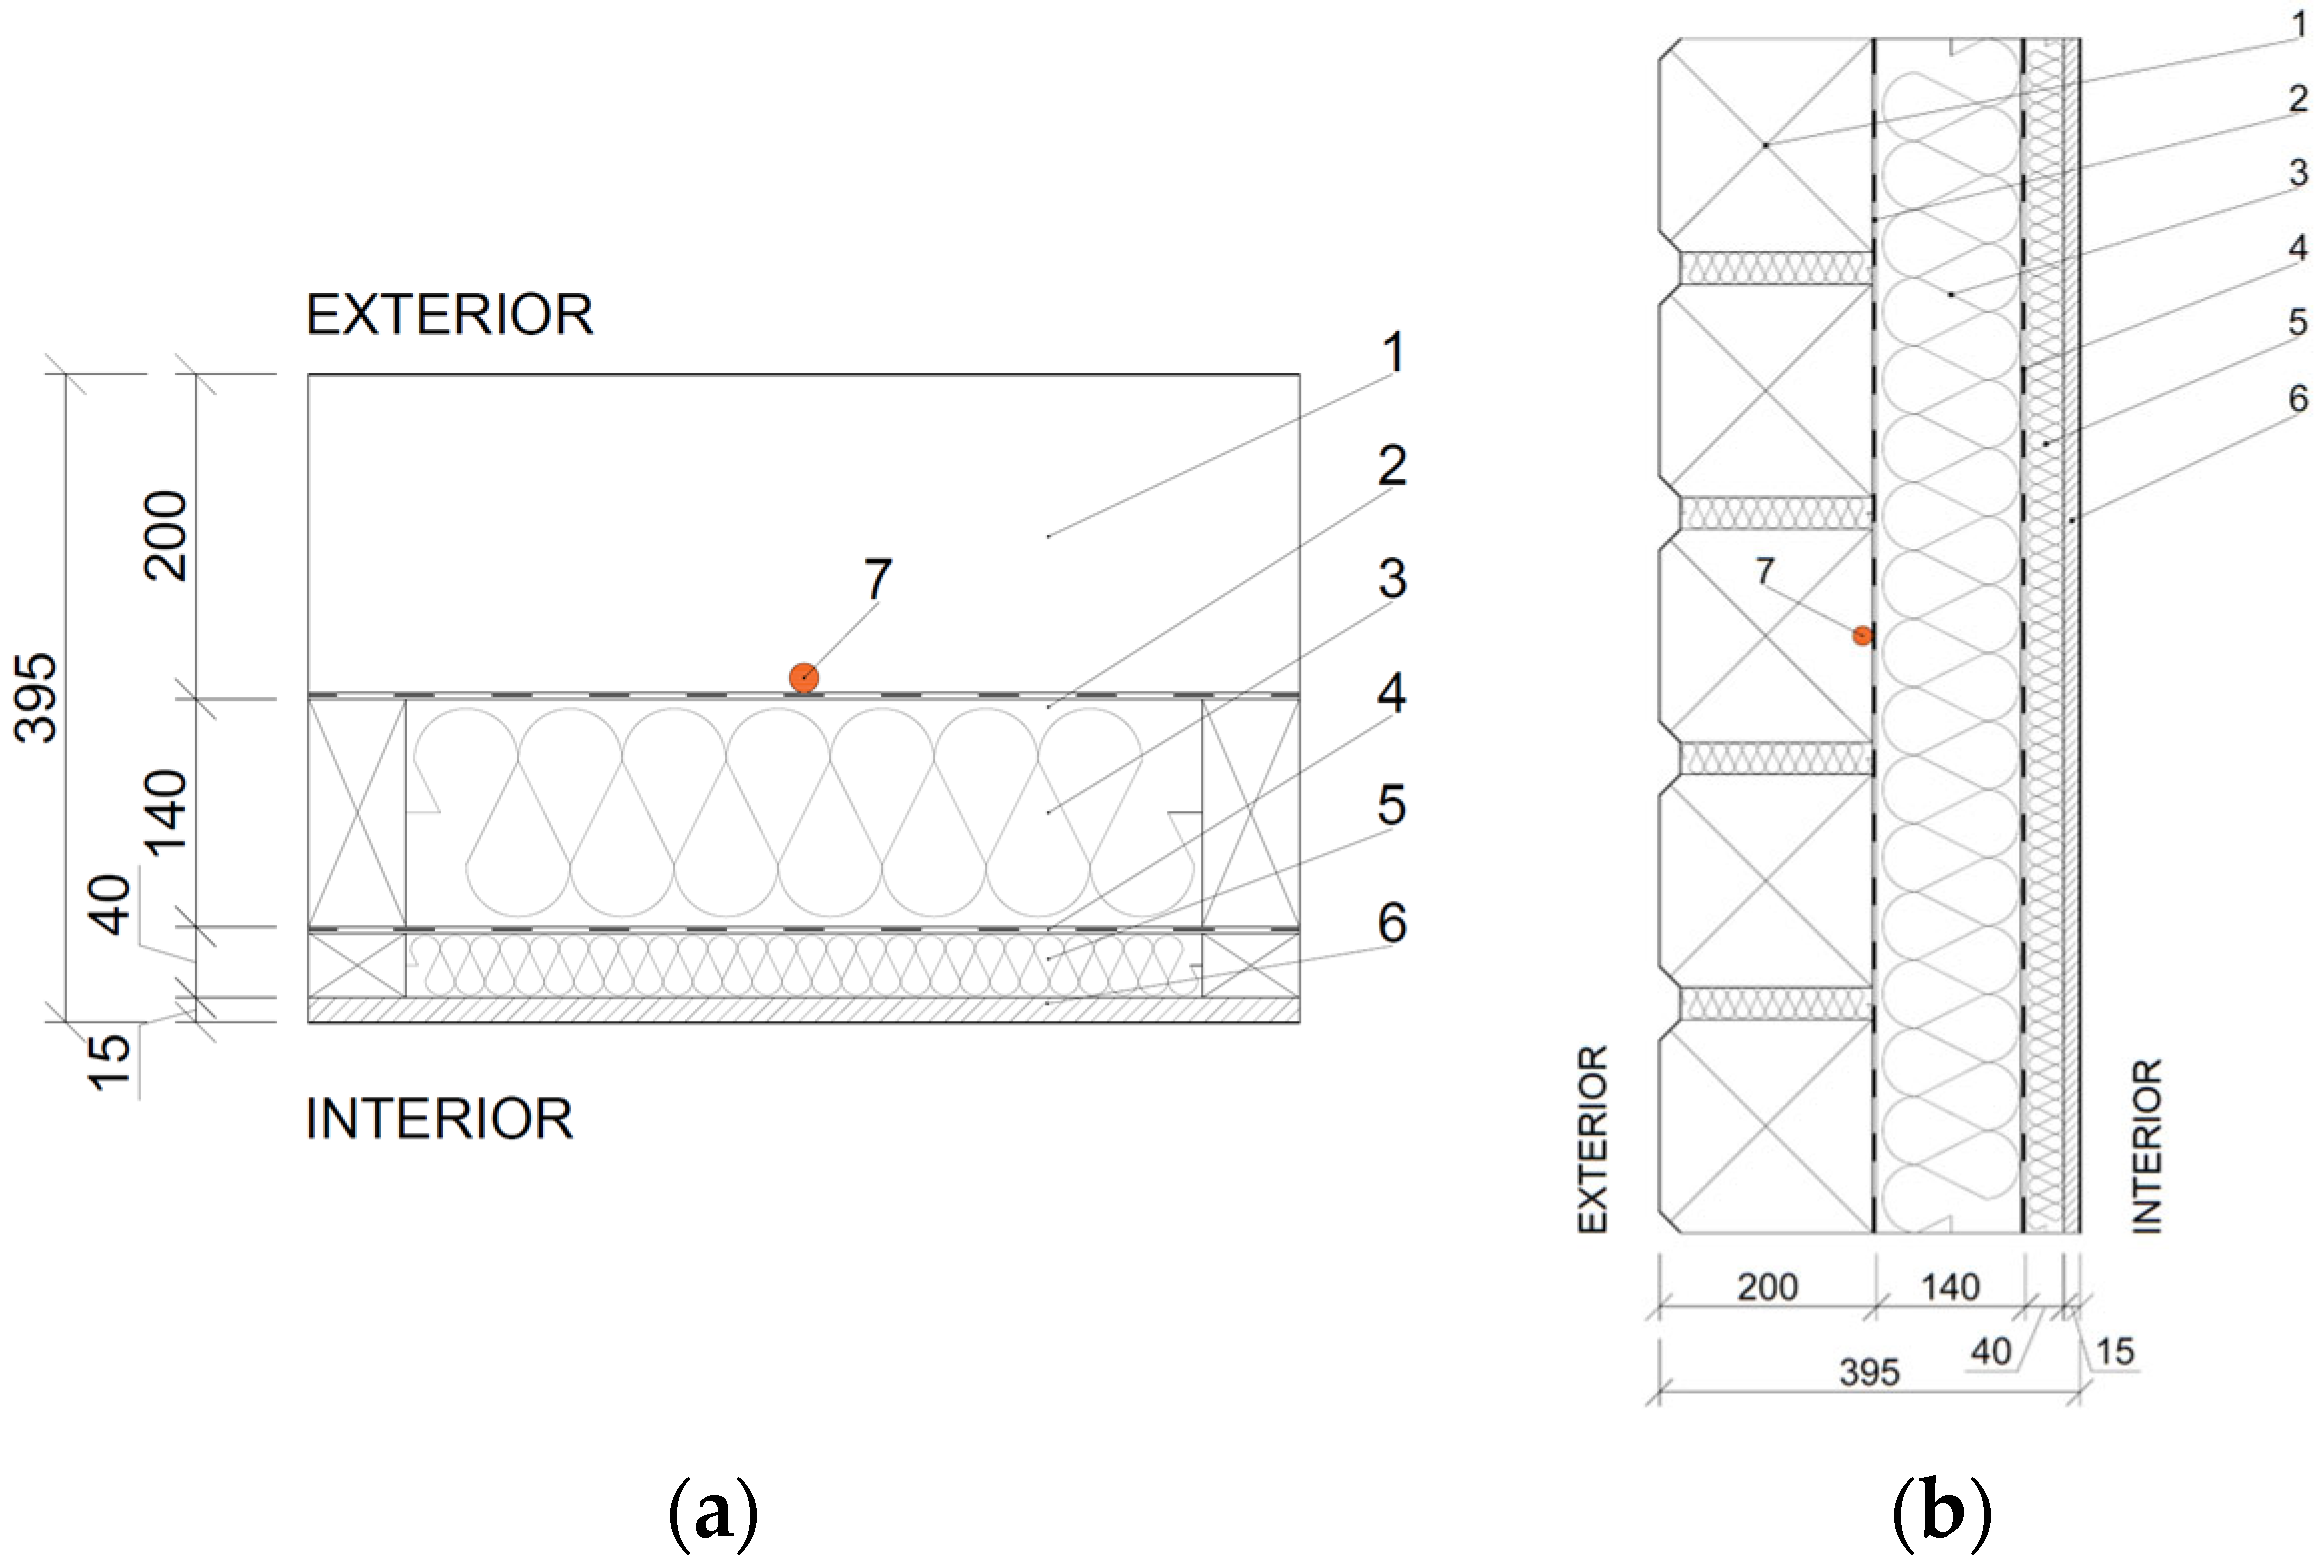
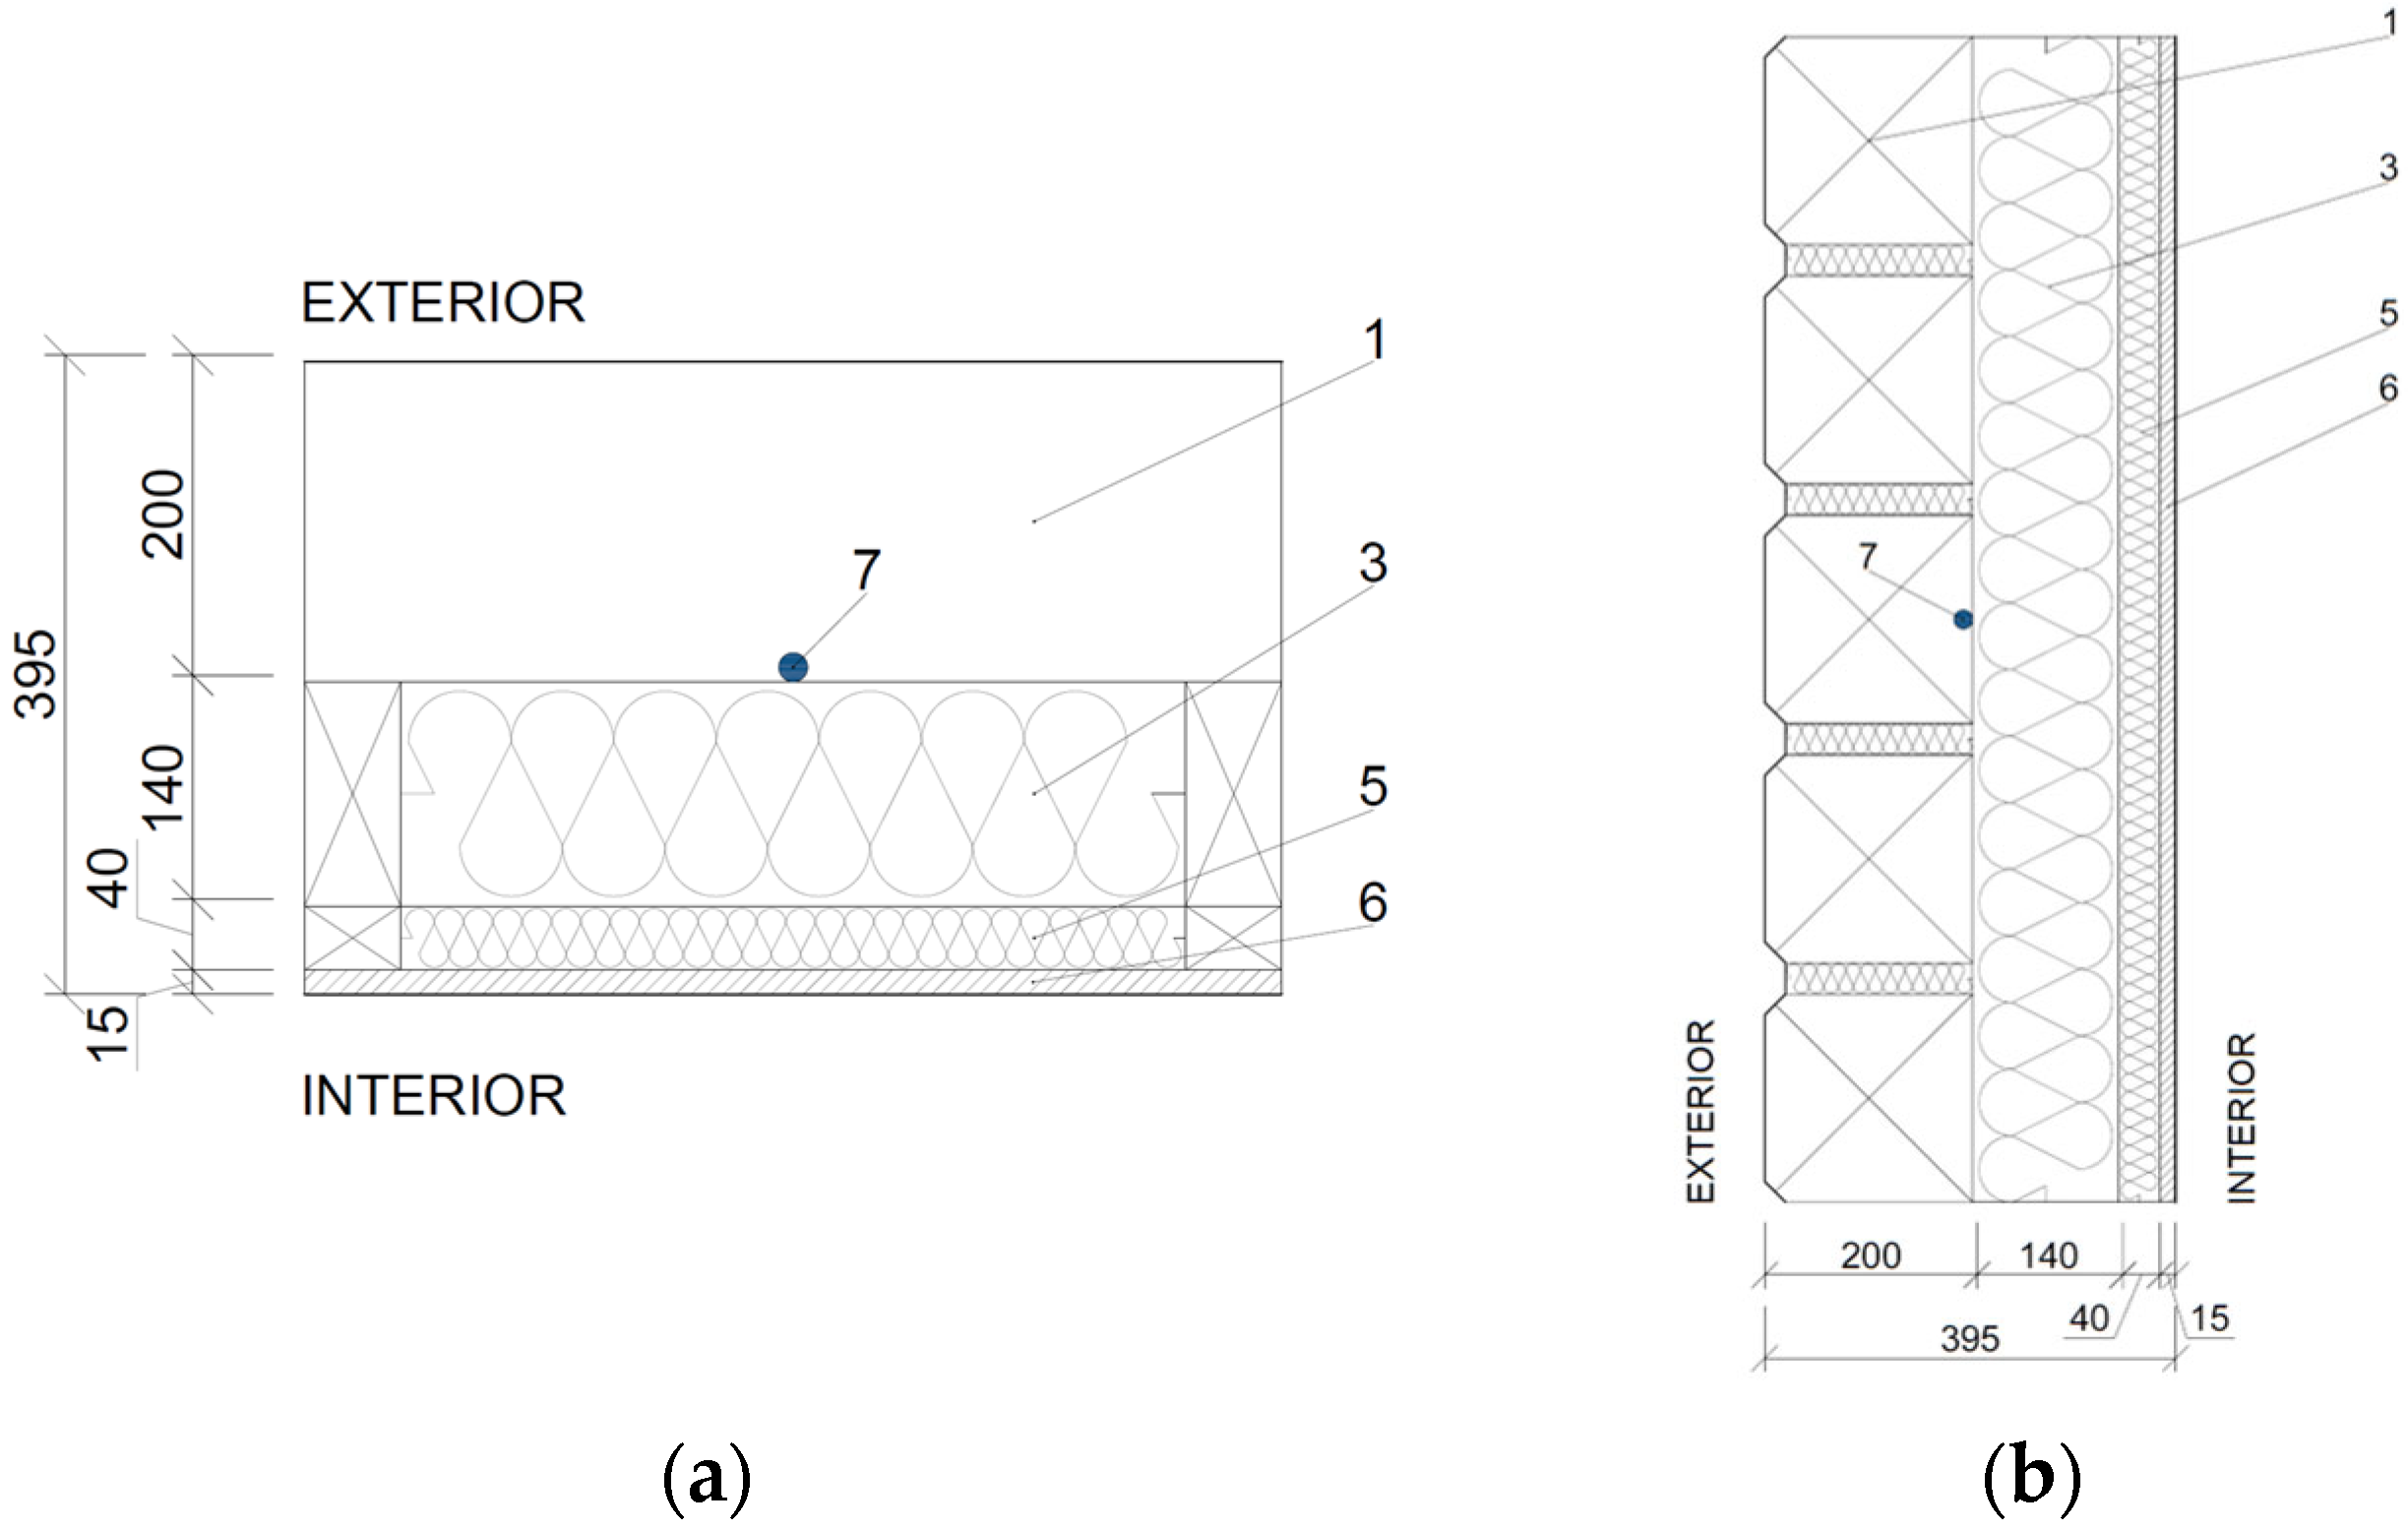
Two fragments of sandwich loadbearing peripheral log walls were designed for experimental in situ moisture content verification. The first log wall, labeled LW1, was designed with a fabric reinforced paper-based vapor retarder ISOCELL ÖKO Natur (Isocell, Zuzwill, Switzerland) and a diffusive underlay ISOCELL OMEGA 180 (Isocell, Zuzwill, Switzerland) installed directly on the insulation. The second log wall was designed without vapor retarder and underlay; it is labeled as LW2. Both walls were part of one wall assembly. The heat and mass flow between them was interrupted, so as to not affect measured data.
The loadbearing layer was designed as a log structure of a rectangular cross section made of air-dry spruce wood (Picea abies (L.) Karst).
Sheep wool, used as thermal insulation in service cavity and between studs, was the Gold isolation Silver product (Wool Style, Terchová, Slovakia).
The respective material properties are shown in
Table 1.
The floor plan and cross-section of both walls are shown in
Figure 1 and
Figure 2, exterior and interior of the in situ structures are shown in
Figure 3.
2.2. Thermal Performance
The thermal performance of the proposed structures was computed in accordance with the one-dimensional, steady-state method described in [
16]. Software ISOVER Fragment (Saint-Gobain, Bratislava, Slovakia) was used to evaluate heat transfer and vapor diffusion through the structure.
The boundary conditions for hygrothermal performance evaluation, as shown in
Table 2, were performed in accordance with the national standard [
16] for one-way heat transfer for the area of the city Zvolen, Slovakia.
2.3. In-Situ Conditions
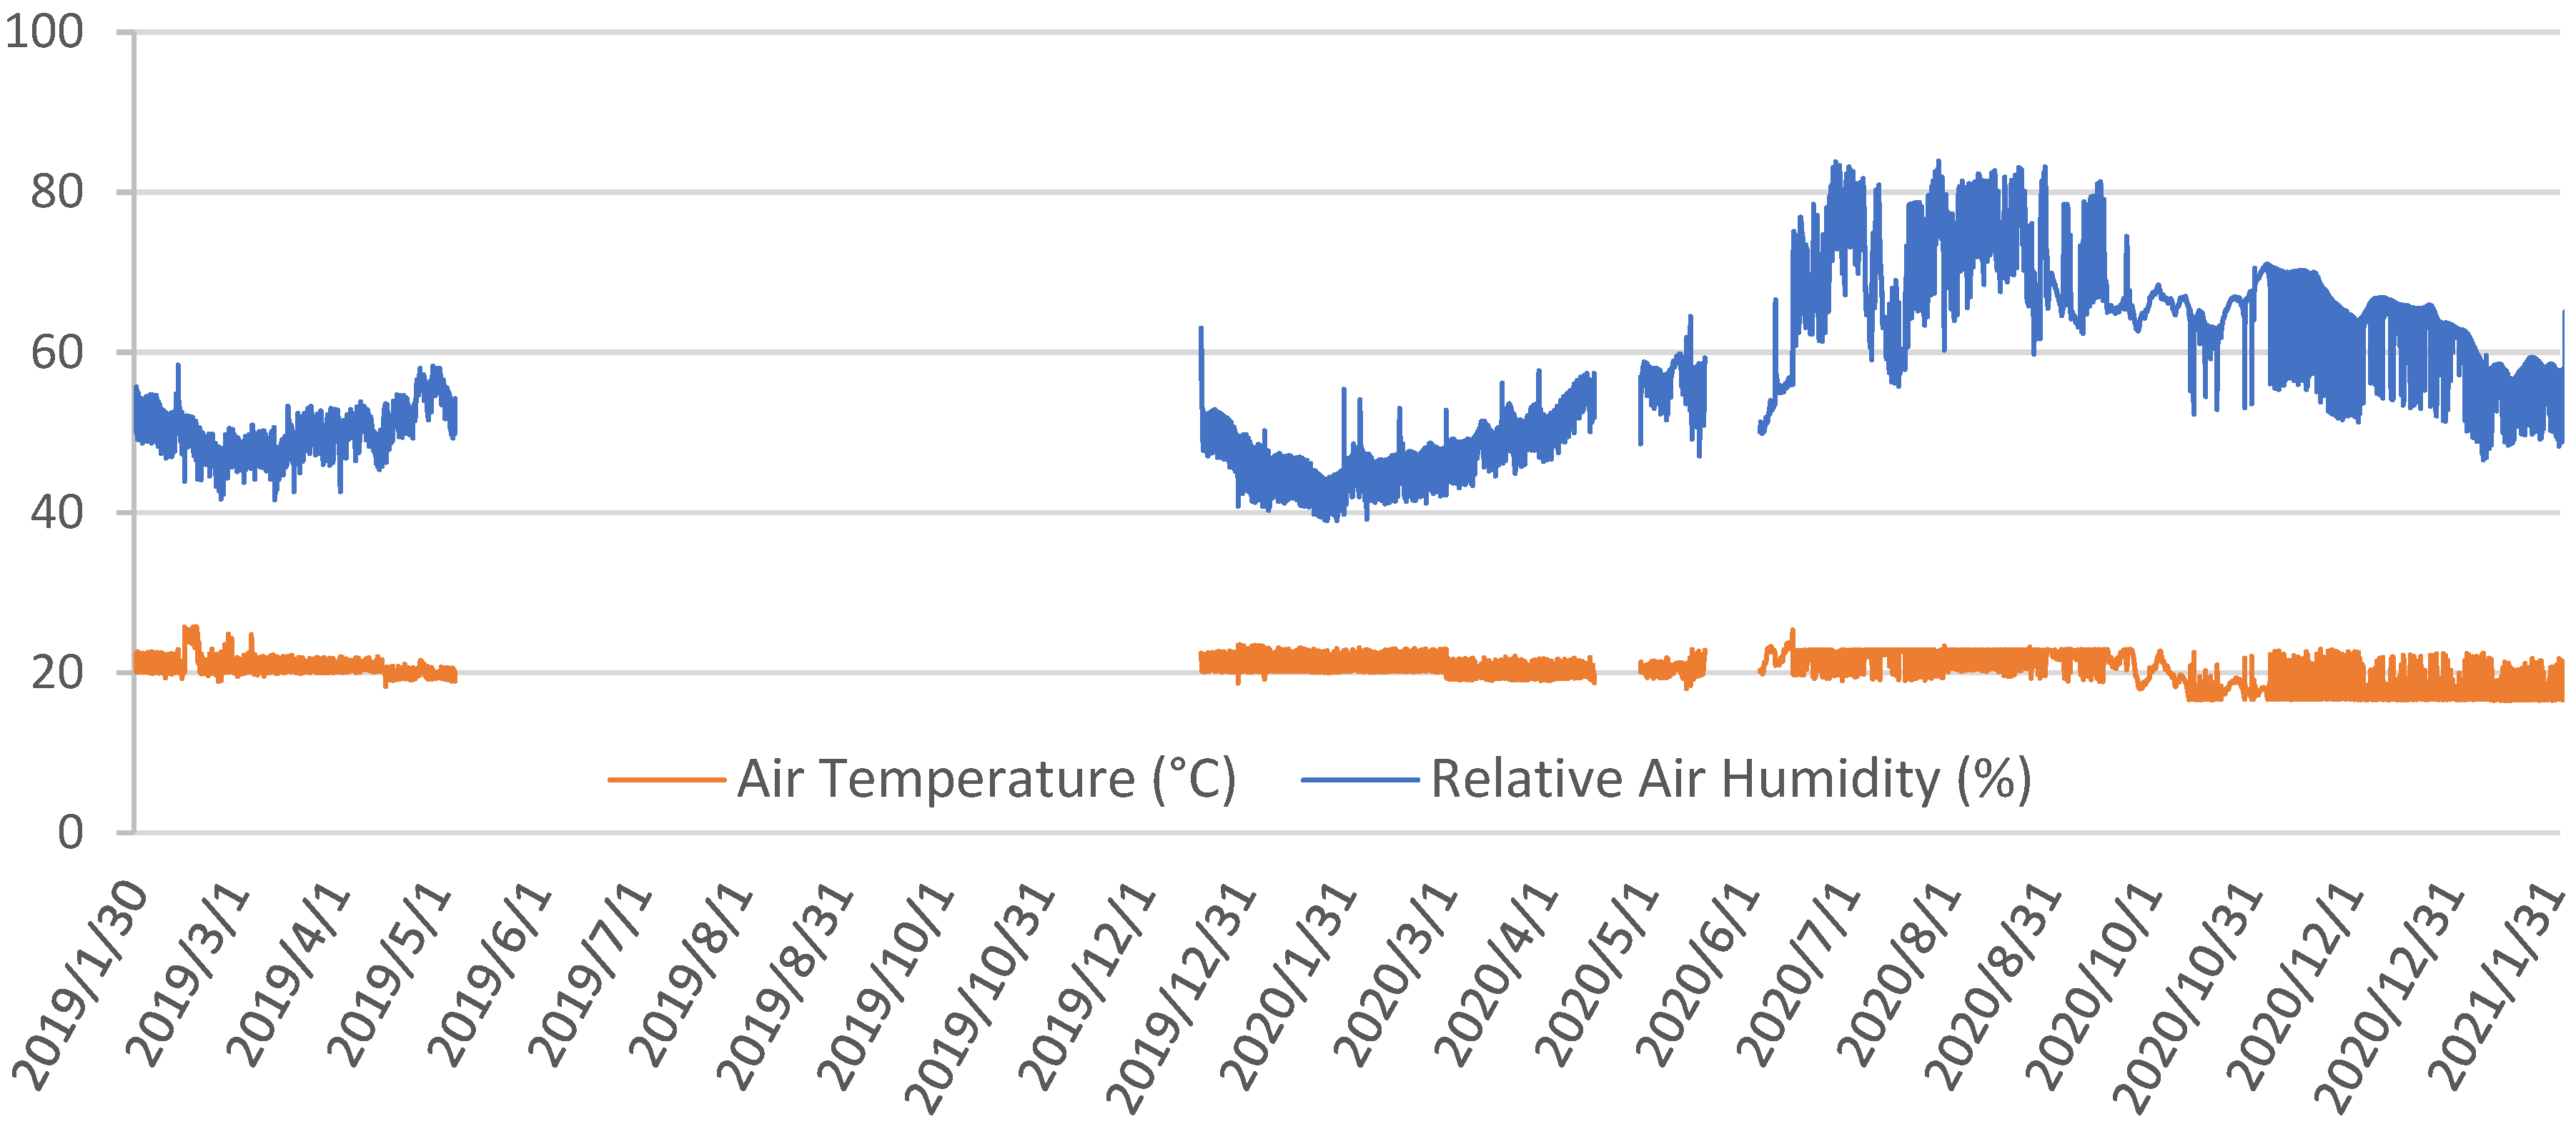
Both walls were installed in the research timber structure at the Technical University in Zvolen (48.571719 N; 19.118268 E; roughly 300 m above mean sea level), facing the north side. While log lumber was exposed to exterior weather conditions, which includes changes in air temperature and humidity, rain, wind and snow, the interior climate was maintained at an almost constant air temperature, as shown in
Table 3. During the heating season, the structure was heated. However, in non-heating season, it was cooled with a FUJITSU ASYG07LLCE air conditioner (Fujitsu General, Suenaga, Japan).
Air temperature, relative air humidity, and air pressure, measured by both indoors and outdoors, as well as in critical locations in the structures, as shown in
Figure 1 and
Figure 2, were recorded using AHLBORN FHAD46C2 sensors (AHLBORN, Holzkirchen, Germany) and stored using a AHLBORN ALMEMO 5690 data logger (AHLBORN, Holzkirchen, Germany) at 1-hour intervals. The verification period lasted from 30 January 2019 to 3 May 2021. The critical location was identified as the border of sheep wool insulation between the studs and log structure due to the increase in diffusion resistance between these materials. This increase might cause condensation of water vapor in the structure, resulting in the risk of the biodegradation of wood, mainly by wood-decaying fungi.
An unexpected power outage occurred, which caused data from 7 May 2019 to 12 December 2019 as well as 16–30 April and 19 May to 5 June 2019 to be deleted. Experimental verification continued, and recorded data are shown in
Section 3.
2.4. Measurement Methods
To verify the moisture content of the wool insulation, an oven-dry method was used [
17] on weights RADWAG WLC 2/A2 (RADWAG, Radom, Poland). Weighing intervals were from 2 to 4 weeks. Samples of sheep wool insulation in the service cavity and between the studs were weighed periodically. At the end of experiment, the samples were dried in an oven. Periodic weighing during drying was noted. After the difference between the two consecutive measurements were settled, the sheep wool insulation was considered dry. This weight was then compared to measurements during the observed period, and the moisture content of the insulation was determined.
To verify the moisture content of the log structure, a resistance multipurpose meter with wood temperature compensation HYDROMETTE HT 85T (GANN, Gerlingen, Germany) was used. Measurements were performed with electrode pins 30 mm long, effectively measuring the moisture content below the interior surface of the log structure.
2.5. Evaluation Methods
First, the categorical factors were defined. One factor was structure, with and without water vapor retarder, labeled LW1 and LW2, respectively, and the other was season, namely heating seasons of 2019–2021 and non-heating seasons of 2019–2020. The heating season was considered, on average, the colder period of the year, lasting from 1 November to 30 April, and the non-heating season was considered the warmer period of the year, lasting from 1 May to 30 October. The effect of the insulation and log structure on moisture content was then verified. To evaluate the results and determine whether the measurements are impacted by these factors, a two-way ANOVA (analysis of variance) method using software STATISTICA 12 (DataBon, Prague, Czech Republic) was employed. A two-way ANOVA was applied to assess the effects of wall configuration (with vs. without vapor retarder), heating season, and their interaction on insulation moisture content. A significance level of 5% was used. Two-way ANOVA determined p-value and partial eta squared values, and the latter describes the effect size. If the significance of each factor was proven, a post hoc Tukey HSD test (Tukey’s honestly significant difference test) was performed.
Then, Student’s t-tests were performed for every variable of the monitored season, while grouping measurements based on structure. The results would confirm or deny statistical significance of the difference in mean values of measurements, proving or disproving the impact of vapor retarder on the analyzed moisture content. The significance level was set at 5%.
Second, the risk of water vapor condensation was evaluated using dew point analysis. Subtracting the air temperature of a dew point from the measured air temperature in the critical place in the structure can determine whether conditions for condensation and the risk of biodegrading agents, such as mold, would be met. The equation for dew point analysis is as follows:
where T
dew is air temperature of a dew point, T is the measured air temperature, and T
dew,a is the dew point analysis temperature.
If the results of dew point analysis reaches 0 or lower, the air temperature within the structure has reached the dew point temperature, and conditions for condensation are met. Dew point analysis is compared to the measured moisture content of the log structure on the interior side to determine the response of wood.
3. Results
3.1. Simulated Thermal Performance
Results of one-dimensional, steady-state simulation of the thermal conduction coefficient are shown in
Table 4.
Results show both assemblies satisfy normalized heat transfer coefficient and thermal resistance values. Simulation suggests water vapor condensation in both assemblies during the year; however, the all-year balance of condensed and evaporated water in the structure is favorable, given the negative value. The superficial temperature remained well above the dew point; therefore, no condensation on the surface of the wall would occur. In summary, both LW1 and LW2 are safe for design from the point of view of required hygrothermal properties [
16].
3.2. In Situ Measurements
Exterior conditions, shown in
Figure 4, match the expected periodic increase and decrease in temperatures throughout the year, consistent with the local climate where the in situ measurements took place. According to the Köppen Climate Classification Map [
18], the location of Zvolen, Slovakia is categorized as Dfb—humid continental mild summer, wet all year.
Interior air temperature, shown in
Figure 5, was stably maintained to simulate normal use of living quarters. A power outage caused a reset in the measuring tools; thus, measurements between 7 May and 12 December 2019 were not recorded. Another power outage occurred on 16–30 April and 19 May to 5 June 2019, causing a reset in the measuring tool and air conditioning. This resulted in a loss of data and presumably an increase in the interior temperature, causing a notable decrease in the moisture content of the sheep wool insulation in the service cavity, as shown in
Figure 5.
Higher interior relative air humidity during the non-heating season of 2020 was caused by less frequent ventilation of the interior of the research building during warm days, where the heat flow was reversed from exterior to interior, thus air humidity accumulated in the structure.
The following subsections present the results in the order of increasing structural complexity—from insulation in the service cavity, through insulation between studs, to the interior side of the log wall. Each is accompanied by moisture content plots, descriptive statistics, followed by ANOVA and t-test outcomes to ensure clear analytical progression.
During the monitored period, the moisture content of the sheep wool insulation in the service cavity, between studs, and the log structure on the interior side was measured for both LW1 with vapor retarder and LW2 without vapor retarder, and the results are shown in following graphs. In addition, the results of the statistical evaluation are shown and described in the following graphs.
The initial hypothesis is that the use of a vapor retarder decreases the moisture content in the direction of the heat flow. That means that the water vapor would accumulate in layers before the vapor retarder, while restricting vapor flow and decreasing the moisture content of layers after the vapor retarder. The following figures present the measured moisture contents across seasons and wall types. This is followed by statistical comparisons to evaluate the influence of vapor retarder and seasonal cycling of exterior air temperature and relative humidity.
3.3. Sheep Wool Insulation in Service Cavity
The measured moisture content of sheep wool insulation in the service cavity over the whole observation period is shown in
Figure 6. This first analysis aims at the service cavity insulation, directly adjacent to the vapor retarder (in LW1). Moisture trends here are expected to best reflect the barrier’s influence on inward vapor flow during the heating season.
During the observed period, the mean moisture content in the sheep wool insulation in the service cavity was overall higher for the structure with a vapor retarder (LW1), than the structure without a vapor retarder (LW2), as shown in
Table 5.
Two-way ANOVA was used to determine whether the vapor retarder, the heating or non-heating season, and their interaction had significant impact on mean values of moisture content measurements. Results are shown in
Table 6 and
Figure 7. Text highlighted bold indicates statistically significant factors affecting the mean measurements, where
p < 0.05, along with their effect size as described by eta squared.
The results of two-way ANOVA confirmed null hypothesis for the season and interaction between structure and season. However, the null hypothesis was rejected, and an alternative hypothesis for the structure factor was confirmed. Specifically, there is significant difference in the mean moisture content between LW1 and LW2. Therefore, a significant impact of vapor retarder on the mean moisture content of the insulation during measured period was proven.
Vapor retarder is identified as the primary cause of the moisture differences in this part of the structure. The season alone had no significant influence, nor did the interaction of season and wall type.
Two-way ANOVA was followed by Student’s
t-test for independent groups, testing equality in means during the individual season. The results are shown in
Table 7.
Results of the
t-test confirmed the null hypothesis. The means of the two groups LW1 and LW2 have no significant differences during non-heating seasons of 2019 and 2020, and the null hypothesis is rejected during all heating seasons. These results indicate a significant impact of water vapor retarder on the moisture content of sheep wool insulation in the service cavity during heating seasons. Increased mean moisture content in LW1 during the heating seasons, as shown in
Table 5, can be explained by the accumulation of water vapor before vapor retarder.
The measured moisture content in the insulation remains below 16%, which, considering biodegrading agents, can be considered safe for the structure.
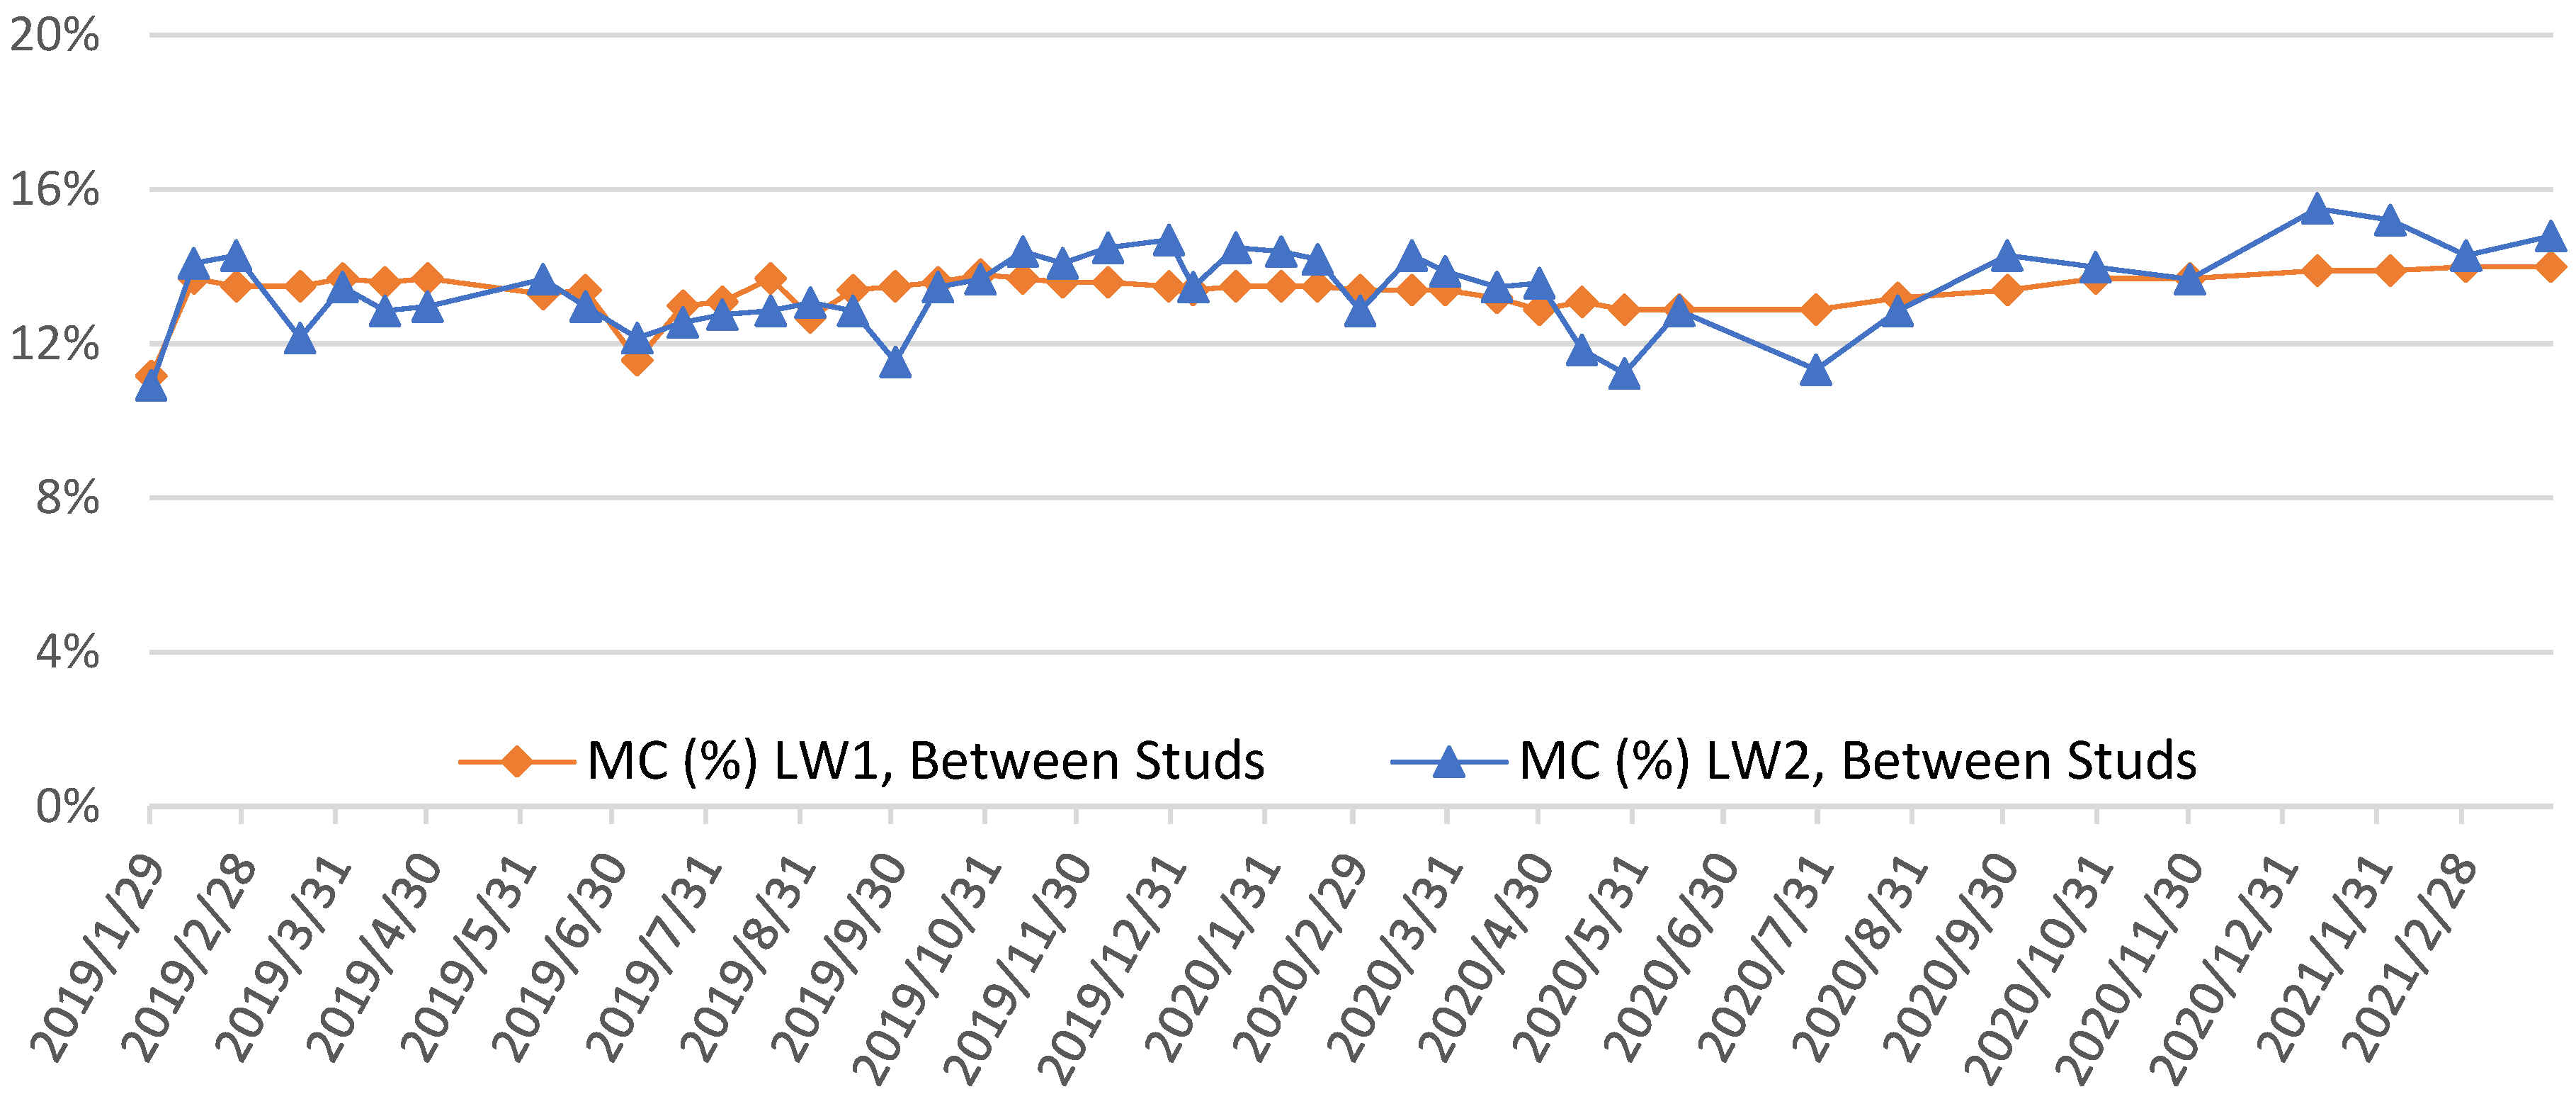
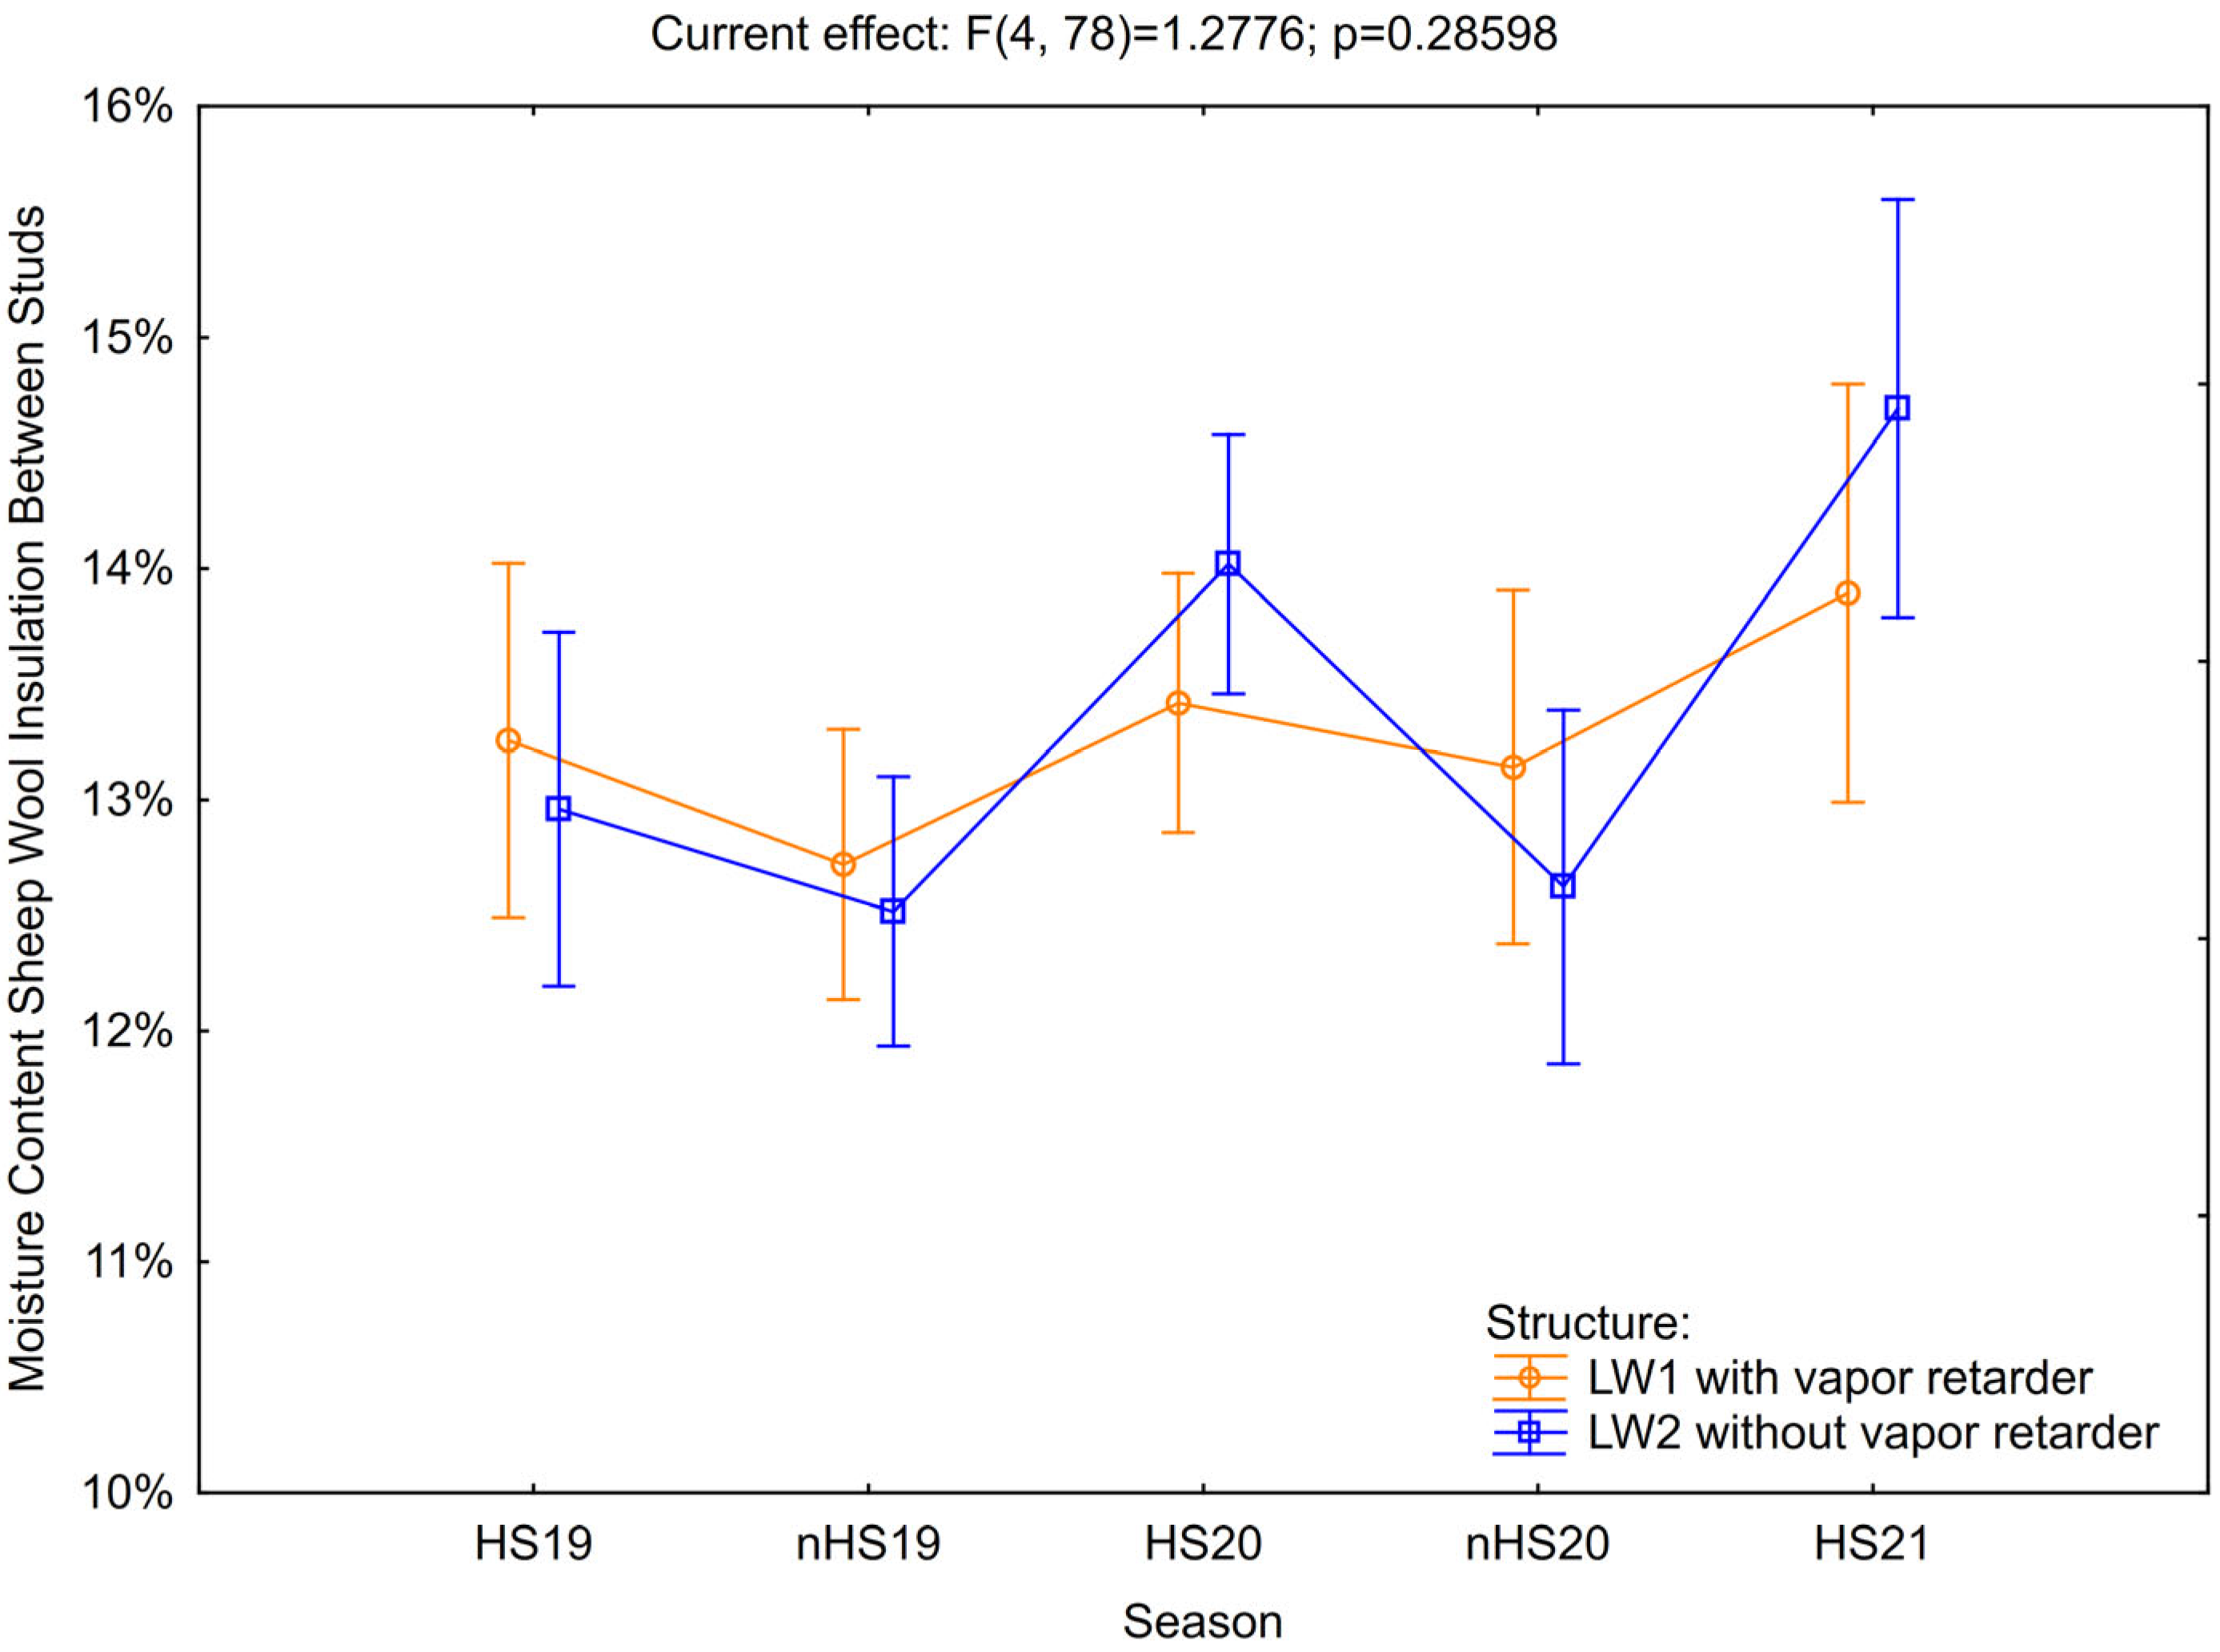
3.4. Sheep Wool Insulation Between Studs
This analysis aims at the insulation between studs, namely, the vapor retarder (in LW1) and interior side of log structure. This area is less exposed to interior vapor sources, and vapor diffusion is mainly lateral. The measured moisture content of sheep wool insulation is shown in
Figure 8.
During the observed period, the mean moisture content in the sheep wool insulation between studs was overall higher for the structure without a vapor retarder (LW2) than for the structure with a vapor retarder (LW1), as shown in
Table 8. The moisture content of LW2 shows higher variability.
Two-way ANOVA was used to determine whether the vapor retarder, the heating or non-heating season, and their interaction had significant impact on mean values of moisture content measurements. Results are shown in
Table 9 and
Figure 9. The text highlighted bold confirmed the significance of factors on mean measurements, where
p < 0.05, as well as the effect size, as described by eta squared.
Results of two-way ANOVA confirmed the null hypothesis for the structure and the interaction between structure and season. However, the null hypothesis was rejected, and an alternative hypothesis for season factor was confirmed. Specifically, there is a significant difference in mean moisture content between LW1 and LW2. Therefore, the significant impact of heating and non-heating season on the mean moisture content of the insulation during measured period was proven, in contrast to that noted for the service cavity. This suggests that the moisture content in the core insulation layer of the structure is more seasonally driven but still moderated by the wall configuration and presence or absence of vapor retarder.
Two-way ANOVA was followed by Student’s
t-test for independent groups, testing equality in means during individual seasons. The results are shown in
Table 10.
Results of the
t-test confirmed the null hypothesis. Thus, the means in the two groups LW1 and LW2 have no significant differences during heating season 2019 and non-heating seasons of 2019 and 2020. The null hypothesis is rejected during heating seasons 2020 and 2021. Values of mean moisture content, as shown in
Table 8, can be explained as follows:
HS19: The effects of initial assembly of the log sandwich wall and stabilization of moisture content in sheep wool insulation, with higher variation of measurements in LW2, are explained by the reduced airtightness of the assembly;
nHS19: The higher mean moisture content of insulation in LW1 is explained by reversed heat and mass flow through the structure during the warm period of the year, promoting the accumulation of water vapor before the vapor retarder (in insulation between studs). However, no significant difference in mean moisture content was proven;
HS20: Higher mean moisture content in LW2 compared to LW1 is explained by the vapor retarder’s effectiveness in partially stopping water vapor from entering the structure, confirming the significance of the vapor retarder’s impact.
nHS20: Similar to the non-heating season of 2019, the higher mean moisture content of insulation in LW1 compared to LW2 is explained by the reversed heat and mass flow through the structure during the warm period of the year. This promotes the accumulation of water vapor before the vapor retarder, and no significant difference in mean moisture content was proven by t-test;
HS21: Similar to the heating season of 2020, higher mean moisture content was noted in LW2 compared to LW1. This is explained by vapor retarder’s effectiveness in slowing the transfer of water vapor through the structure from the interior to exterior, confirming the significance of the vapor retarder’s impact.
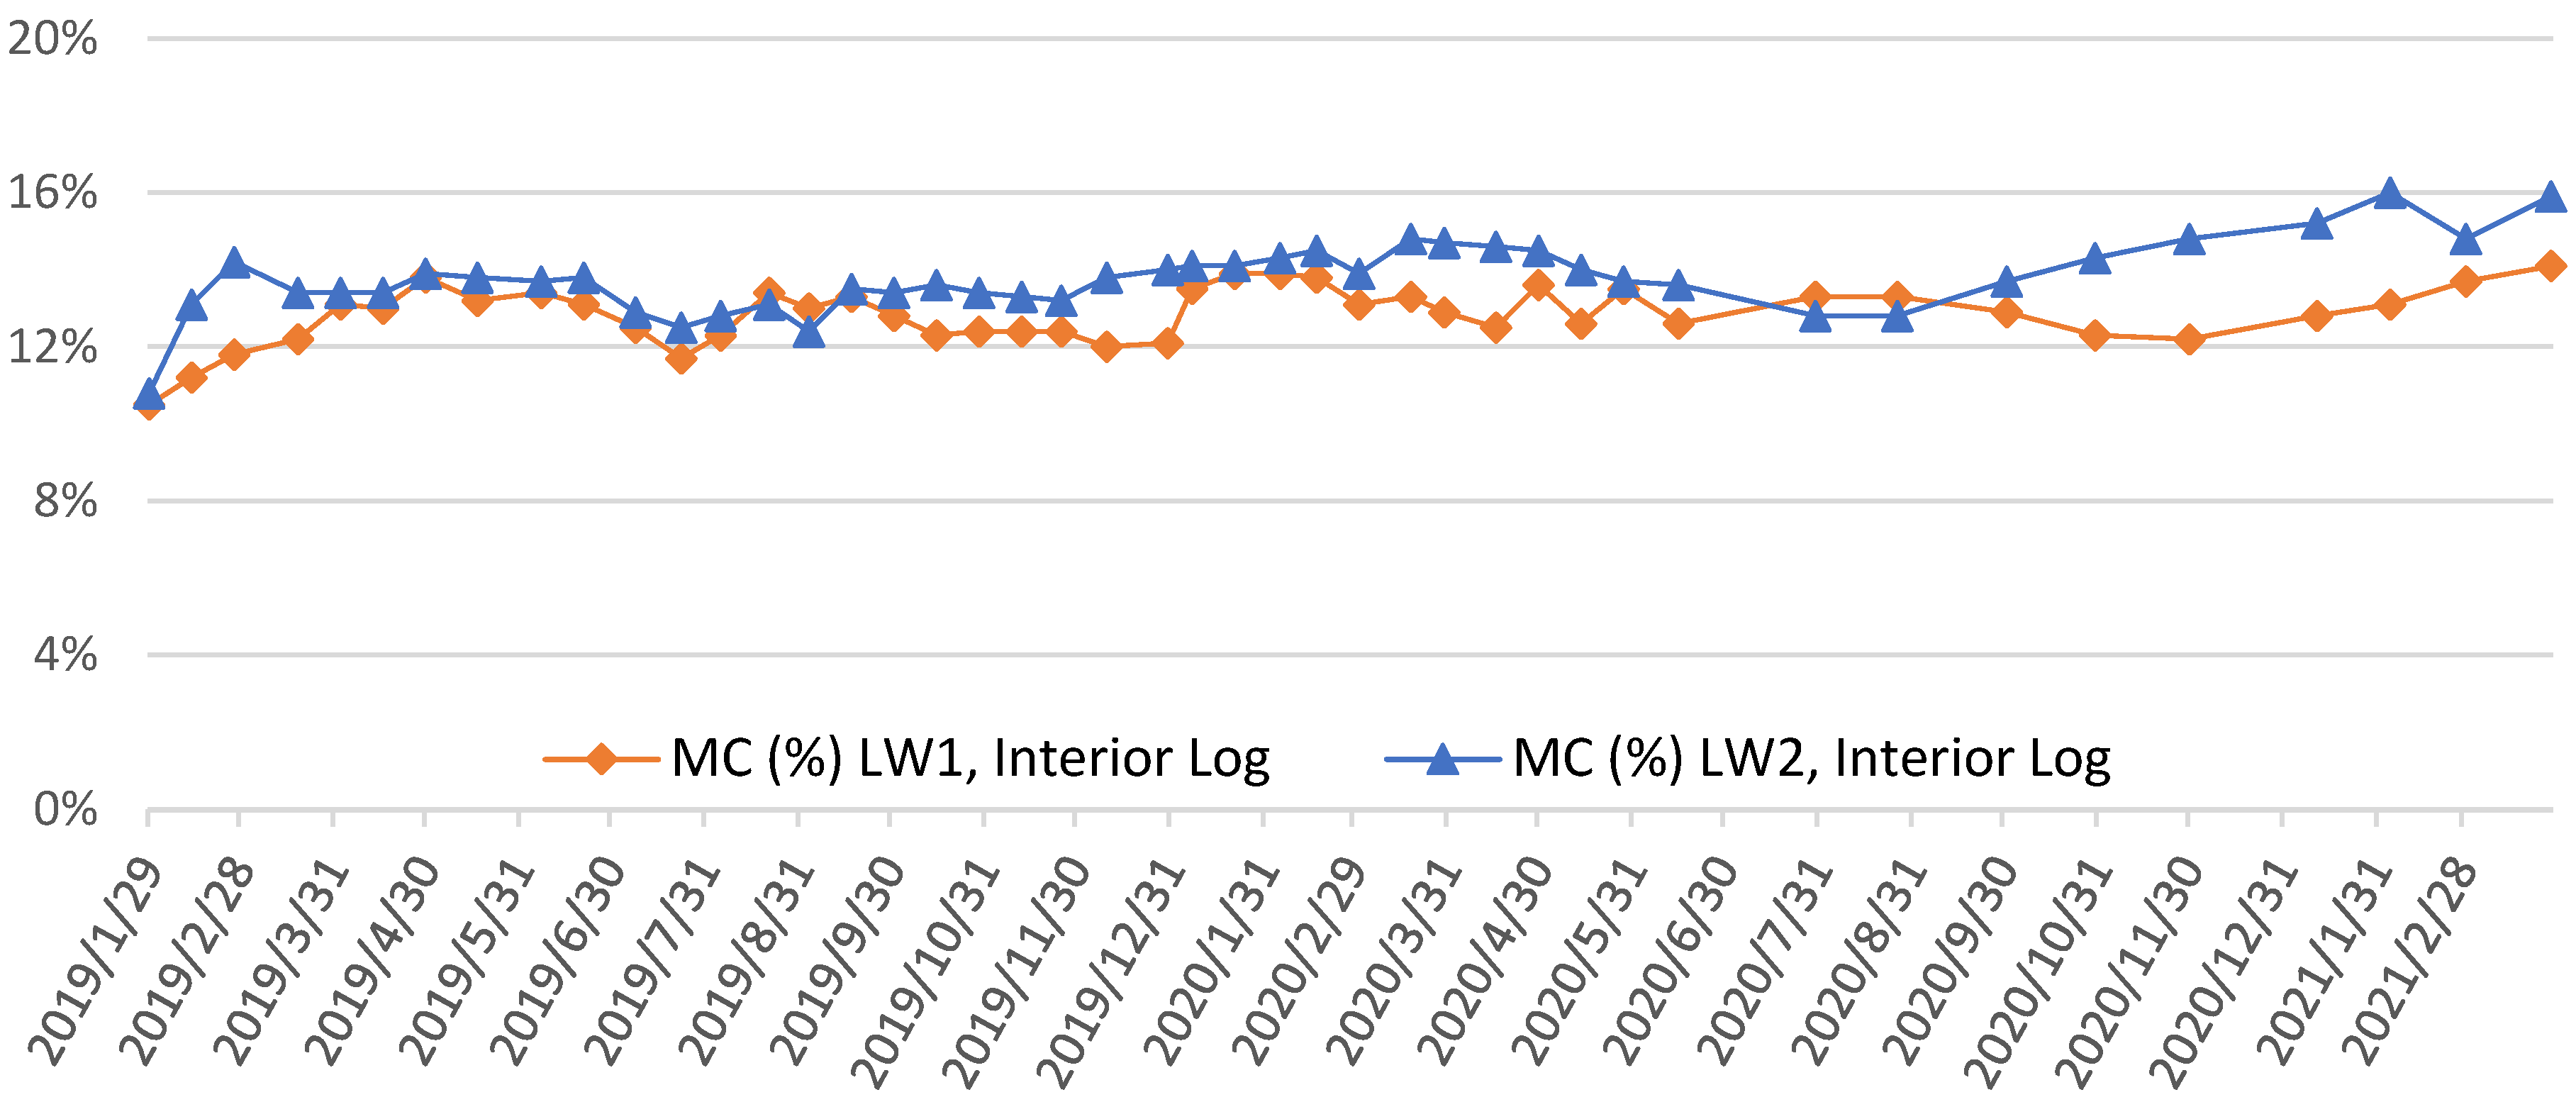
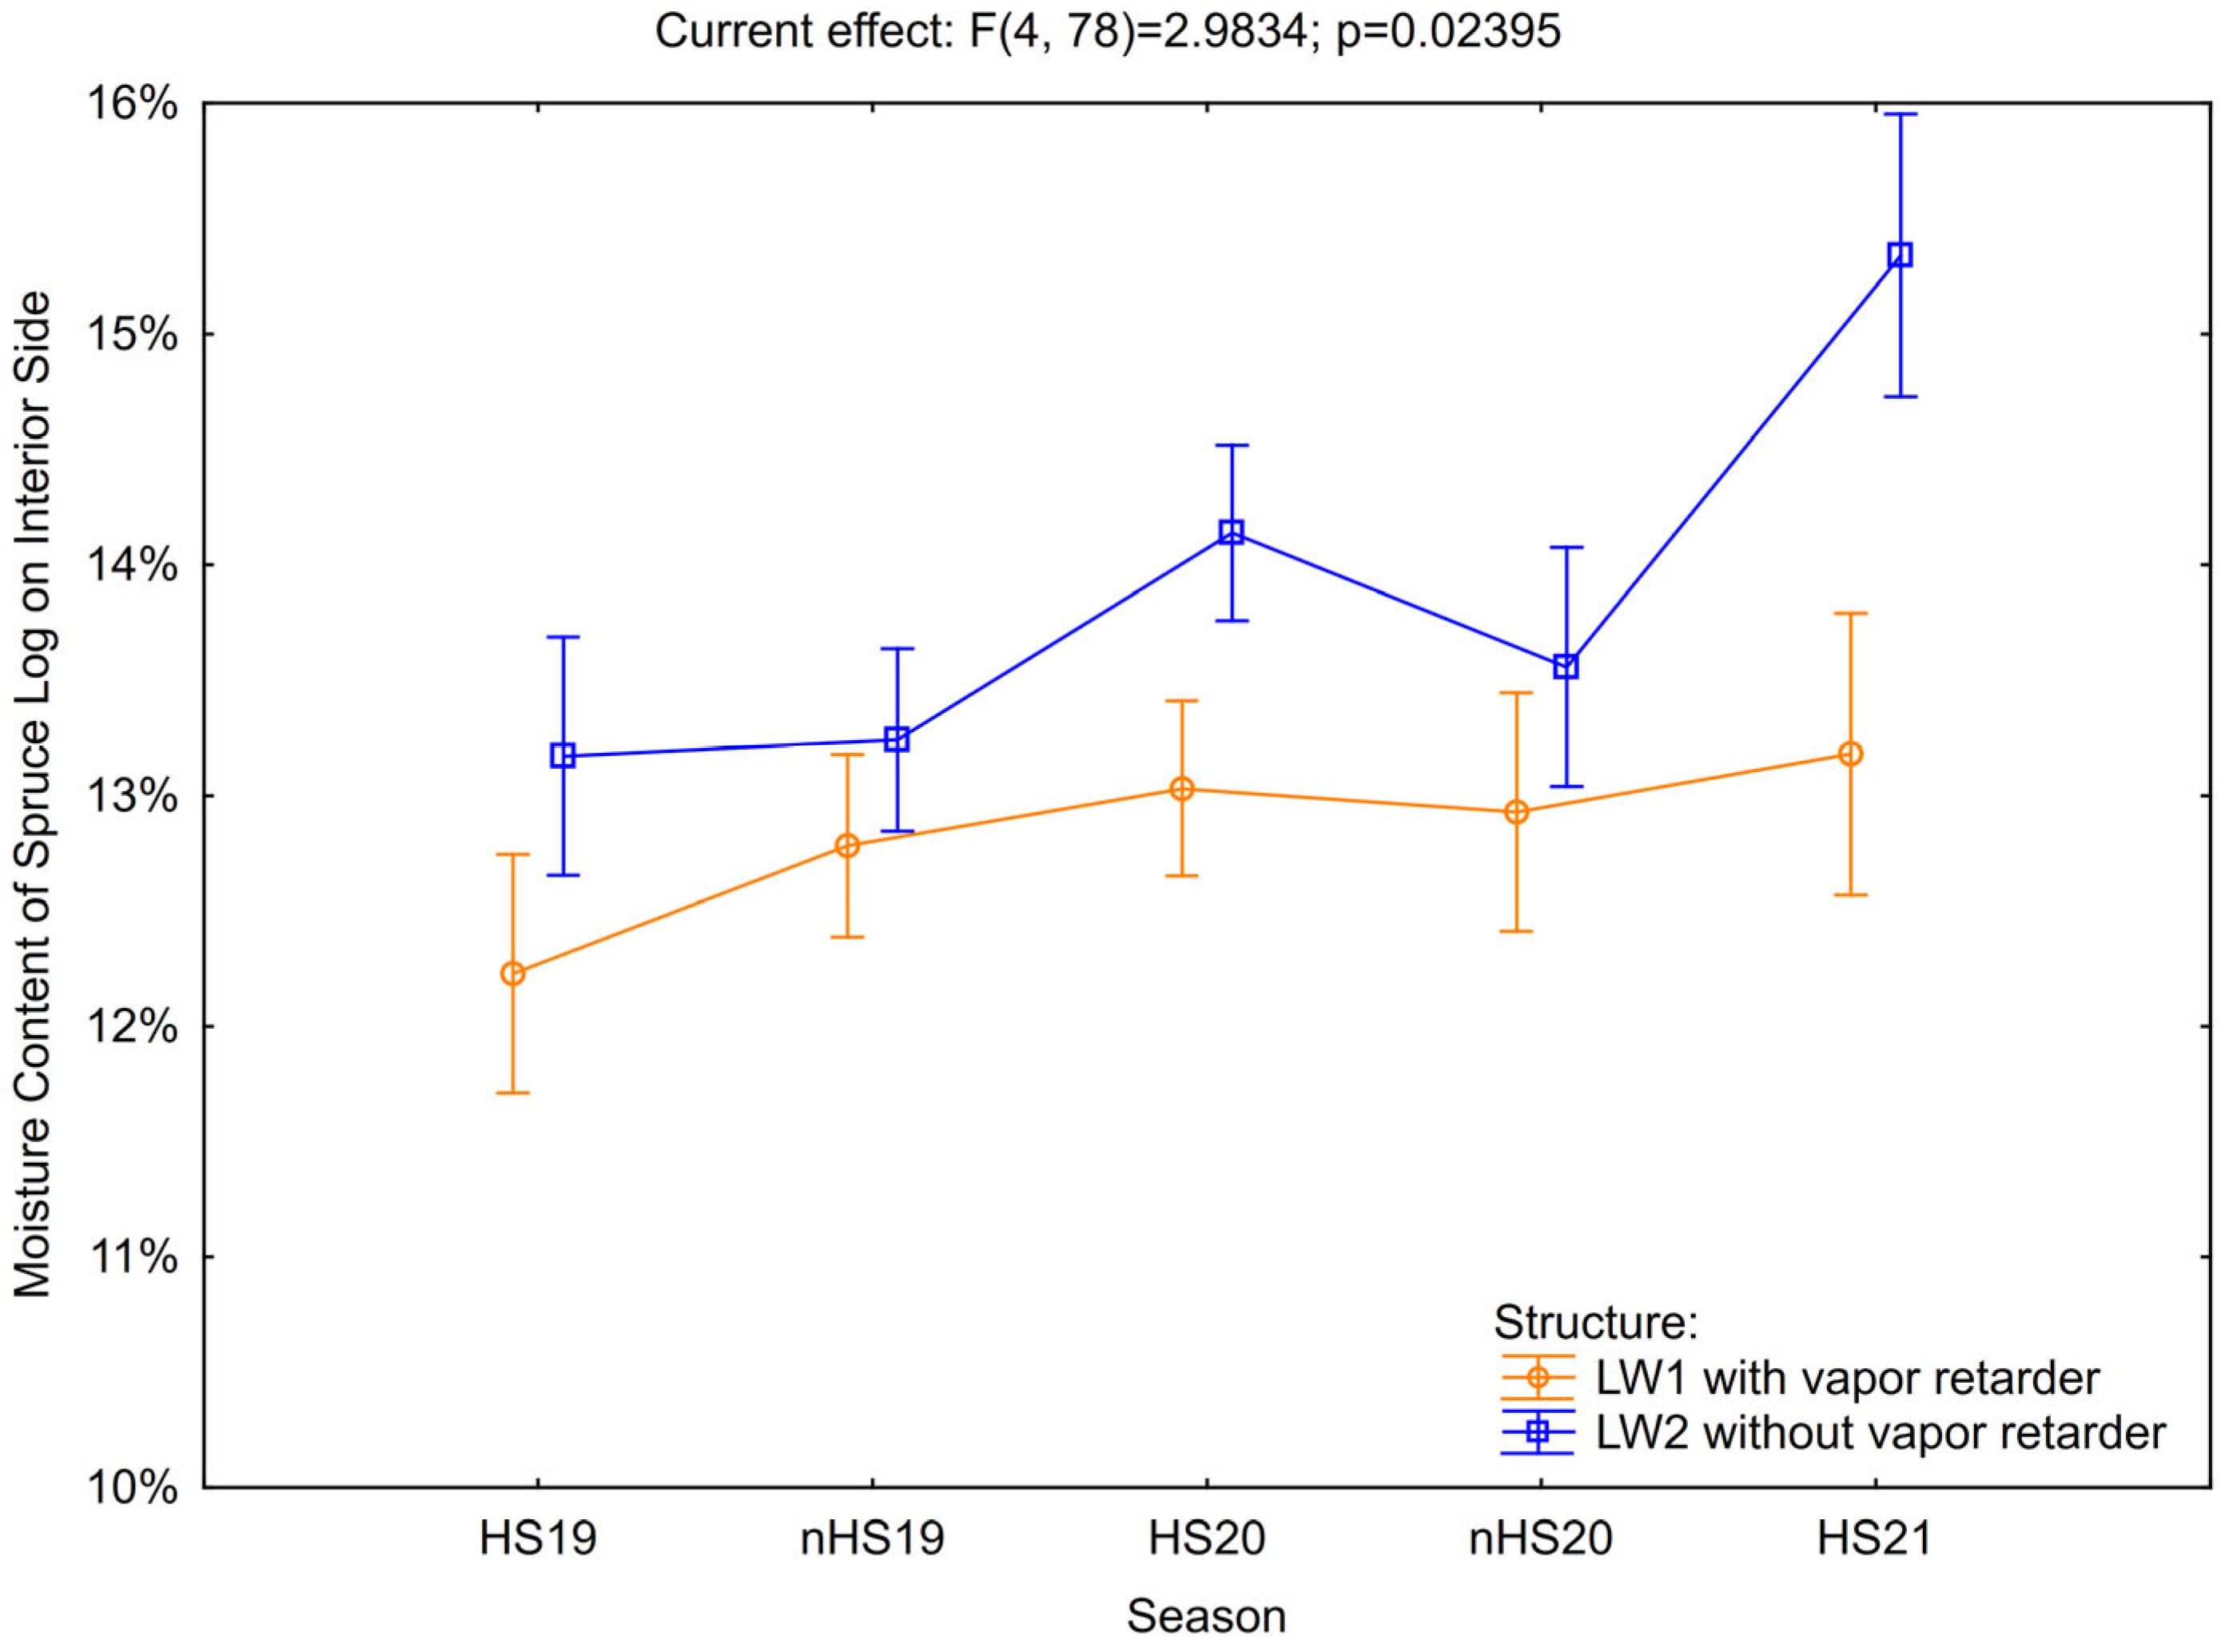
3.5. Interior Side of the Log Structure
Finally, this analysis aims at the interior log structure. The measured moisture content of the log structure is shown in
Figure 10.
During the observed period, the mean moisture content on the interior side of the log structure was overall higher for the structure without a vapor retarder LW2 than the structure with a vapor retarder LW1, as shown in
Table 11.
Two-way ANOVA was used to determine whether the vapor retarder, the heating or non-heating season, and their interaction had a significant impact on mean values of moisture content measurements. Results are shown in
Table 12 and
Figure 11. The text highlighted bold confirmed significance of factors on mean measurements, where
p < 0.05, as well as the effect size, as described by eta squared.
Results of two-way ANOVA rejected the null hypothesis and confirmed an alternative hypothesis for both factors and their interaction. Tukey HSD test was performed to determine the statistical significance of mean measurement differences, and the results are shown in
Table 13. In the table,
p-values comparing the statistical significance of means are presented.
Results of Tukey HSD show significant differences in the following parameters:
LW2 in HS20 from LW1 in HS19, nHS19, HS20, and nHS20, as well as LW2 nHS19 and HS21;
LW2 in nHS20 from LW1 in HS19;
LW2 in HS21 from every other structure and season.
Student’s
t-test for independent groups, testing equality in means during individual season, was further used, and the results are shown in
Table 14.
Results of the t-test confirmed the null hypothesis in heating season 2019. The means in the two groups LW1 and LW2 have no significant difference. The null hypothesis is rejected for the rest of the observation period.
These results indicate the significance of the difference and impact of the water vapor retarder on the moisture content of the log structure from the point of view of airtightness. Vapor retarder in LW1 prevented water vapor from entering the assembly during the heating seasons from the interior to exterior, resulting in lower moisture content during this season. During the non-heating season, it was preventing vapor transport from the exterior to interior. This caused the accumulation of vapor and the increased moisture content of the insulation and log structure on the interior side.
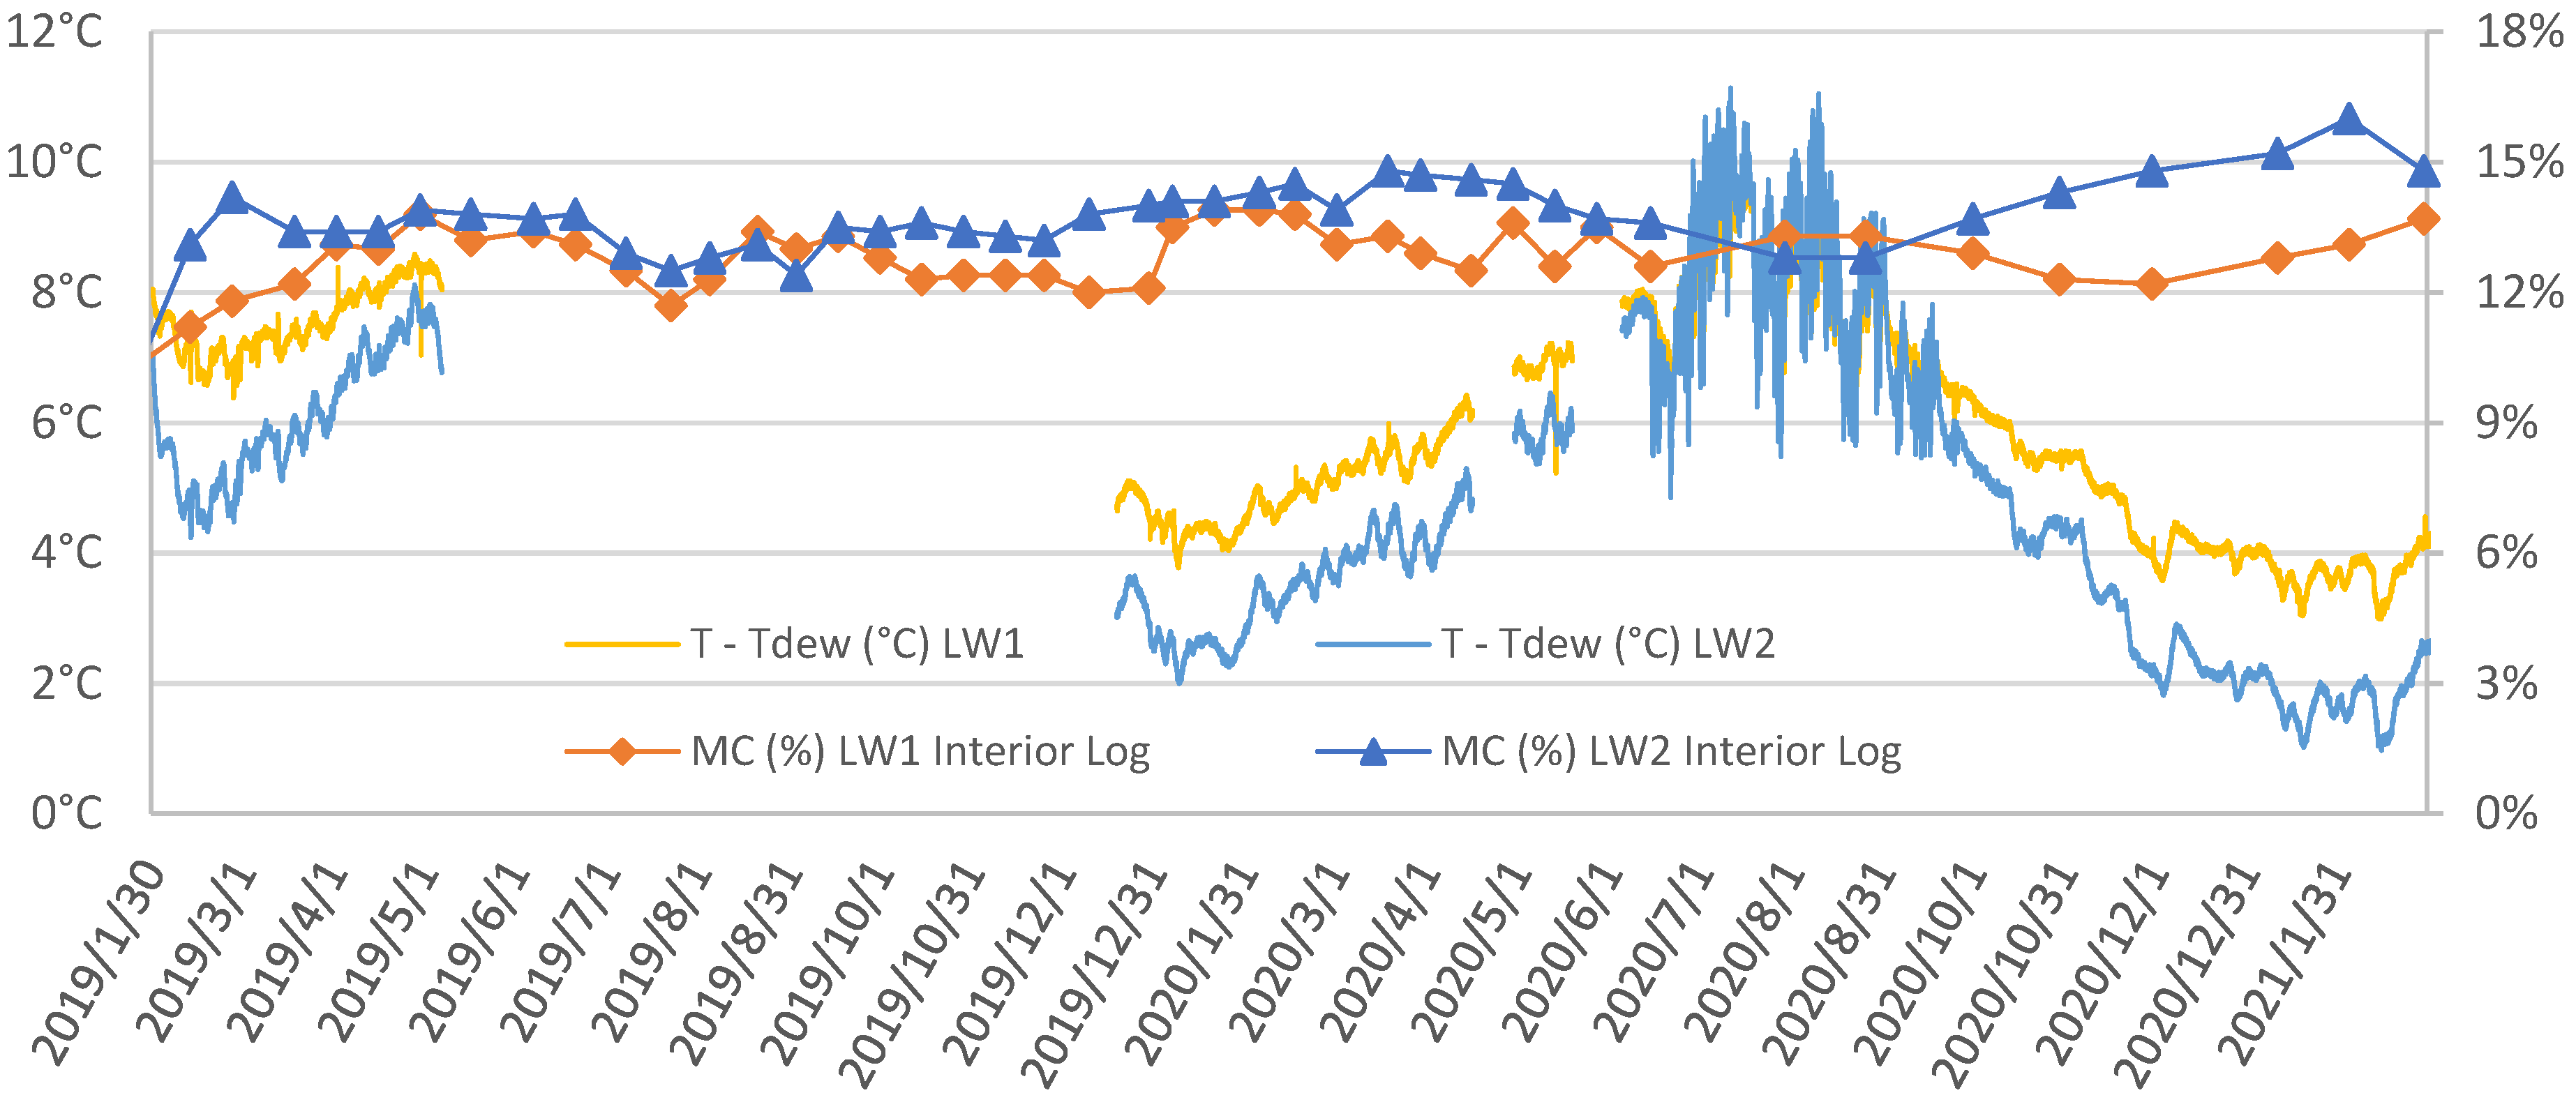
3.6. Risk of Water Vapor Condensation
Moreover, to analyze condensation in the structure, the measured moisture content of the log structure on the interior side was compared to the dew point temperature on the interior side of log structure. Results are shown in
Figure 12.
Dew point analysis was performed by subtracting the computed dew point temperature from the measured air temperature on the interior side of the log structure, as shown in Equation (1).
The condensation of water vapor in the structure occurs when the dew point analysis yields a value of zero. This would increase the moisture content of the log structure.
In general, minimal moisture content of wood for wood decay, caused by fungi, should be near the fiber saturation point. This occurs, on average, at 30% moisture content. Higher moisture content would mean free water in cavities of wood elements, further supporting fungal wood decay. Some wood-decaying fungi can propagate on wood, in which the moisture content is below the saturation point, for example 18%. These fungi however transport water from water sources around the structure and not from the wood itself [
19].
As shown in
Figure 12, condensation has not occurred during the monitored period, which is supported by moisture content of the log structures LW1 and LW2 staying below 16%. The structure is therefore safe for use from a biodegradation point of view.
4. Discussion
A summary of the findings are provided as follows:
The effect of vapor retarder on the moisture content of sheep wool insulation in the service cavity during heating seasons was demonstrated to be significant using t-tests; however, no significance was proven during the non-heating season.
This finding is explained by the high diffusion resistance of the vapor retarder, causing accumulation of water vapors in the layers before the retarder, namely, the sheep wool insulation in the service cavity, during heating season when heat flows from the interior to exterior due to the heat gradient.
The effect of vapor retarder on the moisture content of sheep wool insulation between studs was proven to be significant during heating seasons 2020 and 2021. However, no significance was proven during other seasons.
The effect of vapor retarder on the moisture content of the interior side log structure was not proven to be significant during the 2019 heating season. However, significance was then proven for all other seasons.
This finding is explained by the greater airtightness in the assembly with the vapor retarder. This prevents vapor transfer from the interior during the heating seasons and the accumulation of vapor in the structure during the non-heating seasons. In contrast, the structure without vapor retarder is more permeable to water vapor diffusion, increasing the moisture content during heating seasons and drying insulation and log structure during non-heating seasons.
Water vapor condensation was verified, and no condensation was confirmed in both structures.
This research was performed in parallel with research on the impact of vapor retarder on moisture content in wood fiber insulation published by the authors [
20]. During the same observation period of over 2 years, an experimental study was performed on a multi-layer log structure with wood-fiber insulation boards and mats. Moisture probes and gravimetric samples were taken from structures with and without a vapor retarder. The measured insulation moisture contents remained low and converged after initial bedding. Seasonal moisture fluctuations were mild, and no mold was observed.
Numerous studies have explored the hygrothermal performance of timber-framed wall assemblies insulated with bio-based materials such as sheep wool, wood fiber, hemp, straw, and recycled fibers. Long-term in situ and laboratory experiments consistently show that these materials, when properly installed with or without vapor retarders, maintain low moisture content, exhibit strong humidity buffering, and do not promote mold growth, even under conditions of elevated indoor humidity or minor defects such as air leakages. Comparative analyses between bio-based and conventional insulations (e.g., stone wool or glass wool) further highlight the positive moisture management of natural fibers. Sheep wool and cellulose have demonstrated excellent resilience against vapor-induced moisture accumulation, while wood fiber and hemp-based insulations provided stable performance in various climates. The research mentioned below, and others, confirm that correctly designed timber structures using natural insulation materials can achieve both energy efficiency and safe moisture behavior without exceeding critical relative humidity thresholds—supporting their use in diffuse open wall assemblies across a wide range of climates.
Latif [
21] investigated wood-hemp insulation in timber-frame panels with and without vapor retarder in situ for 16 days, comparing heat transfer properties, the likelihood of water vapor condensation in the panels, and resulting mold growth. Results supported insignificant differences in the average equivalent thermal transmittance values of both timber-frame panels, and no mold growth was visually detected after disassembly of the panels. A comparison of hygrothermal properties between hemp insulation and stone wool was performed [
22], and step changes in internal relative air humidity were used to explore effect of normal and high relative air humidity on the moisture content on wall panels. No significant differences between the thermal conductivities of the two samples was observed; however, the frequency and likelihood of the water vapor condensation was higher in the interface of the stone wool insulation and the oriented strand board.
Rahim [
23] researched the in situ hygrothermal performance of a timber-frame assembly with wood fiber insulation, oriented to the south, in a research cottage. Measurements include the interior and exterior air temperature and relative humidity, as well as air temperature and humidity in the assembly. Measurements lasted from January to August 2018. Although findings suggest high relative air humidity between cladding and oriented strand board may result in water vapor condensation, wood fiber insulation was not affected by this high humidity, and the risk of condensation was not confirmed.
Fischer [
24] investigated the hygrothermal performance of chopped straw, sheep’s wool, cellulose, and mineral wool insulation of timber-frame external wall assemblies, with defects like air leakage and high indoor relative humidity, over 18 months. The relative air humidity in the insulation was compared. Then, the measured and calculated U-values of the assemblies were compared. Their findings support that sheep wool and cellulose insulations tolerated faults, like air leaks and increased water vapor flux without excessive moisture levels or mold growth, with moisture content remaining below critical levels.
Korjenic [
25] investigated various renewable materials such as straw, sheep’s wool, cellulose, and hemp and tested thermal conductivity of these insulations. The results show excellent thermal conductivity as well as hygrothermal properties, with low moisture content maintained during use in the structure. Therefore, these materials are suitable for multi-story construction.
Georgescu [
26] studied experimental 175 mm timber-frame walls insulated with various bio-based materials, like sheep wool, wood fiber, recycled paper, reed, and wool. Thermal tests were performed in the laboratory, and short-term in situ measurements were obtained during winters. Water vapor flow was calculated based on partial water vapor pressure and saturation pressure, showing no risk of water vapor condensation in the walls.
Hietikko [
27] investigated five wall assemblies with wood shavings used for thermal insulation with and without clay coating and three reference wall assemblies using mineral wool. The results indicate that favorable conditions for mold growth were never met, even under the harsh conditions of the experiment.
Borodinecs [
28] investigated the hygrothermal performance of wood-frame walls under varying moisture loads in experimental climate chamber testing with simulations, comparing bio-based and conventional insulation materials to assess moisture risk mitigation, energy efficiency, and mold growth resistance. Results show wood fiber insulation to be more suitable for the climatic conditions of the experiment. Critical levels of relative air humidity were not reached during the observed period, advocating for the generation of diffusive open structures with this bio-based insulation.
Moujalled [
29] analyzed the hygrothermal behavior of a hemp-lime concrete house for 4 years. Measured data were compared with simulations. Hemp-lime concrete shows excellent temperature dampening abilities close to 12 h, as well as excellent moisture buffering.
Tlaiji [
30] assessed the hygrothermal performance of five different multi-layered straw-based wall assemblies with different boundary conditions under a continental, tropical, temperate, Mediterranean climate and a cold desert climate. Numerical models were validated based on experimental results obtained from the literature. The total water content, the drying rate, the condensation risk, the mold growth, the moisture quantity, the time lag, and the decrement factor were evaluated. Results show that straw walls with cement and wood covering can be used in tropical and temperate climates. In addition, coated straw walls with additional air layers can be used in dry climates, while insulated straw walls are best fitted in continental climates, where low water vapor condensation risks occur.
Geving [
31] measured relative air humidity in 15 test cells of a timber-frame assembly with different vapor retarders, bat and loose fill wood fiber insulation, and glass wool in between two climatic chambers, simulating interior and exterior climatic conditions of a Nordic climate. All the tested constructions stayed below the relative humidity of 85%, even for a winter period with very high indoor air humidity and the use of a vapor retarder with a low diffusion coefficient.
Given the findings of the forementioned authors, timber structures with bio-based insulations can be considered safe when correctly designed, mainly using vapor retarders/barriers and thickness of insulations.


 ,
, 


