Article

A System Dynamics Approach to Resilience Analysis in the Sino-Russian Timber Supply Chain

College of Civil Engineering and Transportation, Northeast Forestry University, Harbin 150040, China
*
Author to whom correspondence should be addressed.
Forests 2025, 16(7), 1106; https://doi.org/10.3390/f16071106
Submission received: 5 June 2025 / Revised: 27 June 2025 / Accepted: 2 July 2025 / Published: 4 July 2025
(This article belongs to the Section Forest Economics, Policy, and Social Science)

Abstract

In the context of global timber supply chains facing policy adjustments, resource fluctuations, and market uncertainties, this study focuses on the resilience of the Sino-Russian timber supply chain. A system dynamics (SD) model is developed to analyze the dynamic evolution of the key segments. By integrating the entropy weight–TOPSIS method, the research quantitatively assesses overall supply chain resilience by synthesizing data from four capability dimensions—Russian logistics and transportation capability, Russian primary wood processing capability, Sino-Russian timber import–export capability, and Heilongjiang furniture sales capability—over the 2017–2033 period. Results indicate a “first decline, then rise” trajectory for resilience, with a minimum normalized resilience index of 0.1549 recorded in 2021, followed by a gradual recovery and sustained strengthening thereafter. Among evaluated segments, Russian logistics demonstrates the strongest short-term shock resistance (36.2% reduction in minimum resilience), while Heilongjiang’s sales segment exhibits optimal long-term recoverability (the normalized resilience index increased by an average of 0.0363 units per year during the recovery phase). Based on these findings, a “short-term logistics enhancement–long-term demand-driven” strategy is proposed to improve resilience, providing actionable insights for the high-quality development of the Sino-Russian timber supply chain.

1. Introduction

Under the dual forces of globalization and evolving trade dynamics, the resilience of the Sino-Russian timber supply chain—a critical nexus bridging the world’s largest forest resource holder (Russia) and the timber consumer (China)—exerts profound influence on global timber market equilibrium and stability. Russia is the world’s biggest timber producer and export power, with the unique advantages of forest resources endowment [1]. Russia’s forest coverage rate is 46.4%, with a per capita forest area of 5.8 hectares; the timber stock is 79.46 billion cubic meters, ranking first in the world, and the per-capita timber stock is 180 cubic meters [2]. In 2023, Russia produced 193,390,582 m3 of roundwood (about 4.98% global share) and 37,530,000 m3 of sawnwood (about 8.44% global share) (data sources: Food and Agriculture Organization of the United Nations). From 2017–2021, China accounted for 30.6–41.3% of Russia’s timber exports, with 2021 exports to China reaching USD 3,595,504 thousand (30.6% share), surpassing other markets (e.g., Finland: 5.6%, Japan: 5%). Meanwhile, amid the Russia–Ukraine conflict, international wood industry news highlights that Russian timber exports faced transportation blockades, prompting a strategic shift toward Asian markets [3]. These figures confirm Russia’s prominence as a timber producer/exporter and China’s central role in its trade, directly supporting the study’s focus on Sino-Russian supply chain resilience.
China’s escalating demand for forestry products has positioned the Sino-Russian timber trade as a cornerstone of its timber imports, fostering a deeply integrated and complementary industrial collaboration system between the two nations. By the shortage of per-capita forest resources (per-capita forest area is less than 1/3 of the global average, and forest coverage rate of 22.96% is lower than the global average of 30.6%) [4] and the policy restrictions on commercial logging since 1998, China’s timber supply has long relied on imports to bridge the domestic gap [5]. Data from the *China Forestry and Grassland Statistical Yearbook show that the export value of China’s wood forest products increased from USD 1.224 billion in 1993 to USD 76.47 billion in 2020, a growth of over 60 times, which has driven the continuous rise in demand for timber raw materials. After peaking at 111.94 million cubic meters in 2019, the timber import volume stabilized at around 77.405 million cubic meters in 2023. As China’s largest source of timber imports, Russia accounted for 26.1% of China’s total timber imports in 2023, significantly higher than New Zealand (23.7%) and Europe (17.5%) [6]. This structural dependence stems from the “resource supply–market demand” complementarity between China and Russia: Russia’s abundant coniferous forest resources (such as Siberian pine and spruce) meet the raw material needs of China’s construction and furniture manufacturing industries. At the same time, China’s processing capabilities support the export of downstream products. From 1992 to 2020, the China–Russia timber trade volume grew from USD 28 million to USD 4.828 billion (with an average annual growth rate of 19.43%), among which logs (42.23%) and sawn timber (32.68%) were the main imported categories [7], further highlighting the strategic significance of this trade relationship in sustaining China’s forest product industry and deepening bilateral industrial collaboration. This bilateral synergy has catalyzed economic revitalization in Russia’s Siberia and Far Eastern Federal Districts through expanded exports of certified timber products to China, simultaneously driving national-level economic growth. Conversely, China’s reliance on imported forest products has not only reinforced its dominance as a global furniture manufacturing hub but also advanced domestic strategies for forest conservation and sustainable development [8].
Due to the immense scale of timber production and consumption in both economies and their intricately interlinked supply chains, even marginal disruptions could trigger cascading effects on global timber availability and pricing. Consequently, a rigorous scientific assessment of supply chain resilience and the formulation of evidence-based enhancement strategies emerge as urgent imperatives.
Qualitative resilience analysis relies on expert expertise and descriptive frameworks to characterize system resilience through conceptual classification, a foundational approach for defining its core connotations [9]. However, such methods are prone to subjective bias and lack standardized metrics, limiting their precision and comparability in practical applications. In contrast, quantitative approaches offer data-driven rigor by constructing mathematical models and indicator systems to numerically assess resilience, enabling objective and scalable evaluations. Common methodologies include: System Dynamics (SD), which simulates dynamic feedback mechanisms to analyze resilience trajectories under diverse scenarios [10,11,12,13,14,15,16]; Bayesian Networks (BN) evaluate resilience by constructing probabilistic graph models to analyze causal relationships and factor interactions, thereby quantifying the probability distribution of system resilience [17,18]; Consecutive Data Envelope Analysis (CDEA), an extended framework of data envelopment analysis, constructs industrial chain resilience indices by assessing efficiency across sequential time periods, enabling longitudinal performance evaluation [19]; Complex Network Analysis (CNA) assesses systemic resilience by modeling network topology and node centrality, identifying critical components and vulnerability points within interconnected systems [20]; the entropy-weighted TOPSIS method, a prominent multi-criteria technique, synthesizes multidimensional indicators to mitigate subjective bias, widely applied in urban resilience assessment [21], public health systems [22], Seismic and Fire Safety Resilience of Buildings [23,24], and supply networks [25], thereby enhancing the precision of resilience measurement through systematic indicator integration.
The choice of methodology must align with contextual complexity. For the Sino-Russian timber supply chain, SD offers a robust framework to model the temporal dynamics of shocks and recovery. Meanwhile, entropy weight–TOPSIS enables nuanced quantification of resilience by integrating multiple indicators, addressing the multi-faceted challenges of this cross-border system. By combining the two methods, this study aims to bridge the gap between conceptual understanding and empirical analysis, providing actionable insights for enhancing supply chain resilience amid evolving global trade landscapes.
As a complex network integrating forest resource extraction, processing, transformation, market circulation, and end-consumption, the timber supply chain’s structural characteristics and optimization pathways have attracted substantial academic interest. It is typically structured as a “resource supplier–processor–seller–end user” chain: commencing with forest management and logging, progressing through transportation to sawmills and processing facilities, and concluding with final products such as building materials and furniture [26], characterized by inherent complexity, dynamic interconnections, and multifaceted risks, including supply volatility, operational inefficiencies, and policy uncertainties [27]. The upstream resource sector, dominated by timber harvesting and primary processing, relies on production stability in core global nodes such as Russia and Southeast Asia, whose forest endowments significantly influence midstream and downstream activities [28]. Midstream operations encompass primary processing (e.g., sawn timber production) and value-added manufacturing (e.g., furniture), as exemplified by Heilongjiang Province’s timber processing clusters that utilize imported resources. Here, multi-objective decision-making models optimize supply chain structures to balance economic, environmental, and social objectives [29]. Downstream dynamics focus on market channel expansion and brand differentiation, illustrated by Guangxi’s strategic development of its wood-based panel industry and localized standards, which drive the high-end transformation of regional furniture supply chains [30].
In research on specific supply chain resilience capabilities, scholars categorize evaluation index systems into two dimensions based on evaluation objectives: supply chain structure and supply chain capability [31]. The structural perspective focuses on components within the supply chain framework. He et al. (2025) constructed a four-dimensional assessment system—“supply side–connecting side–demand side–guarantee side” [25]—which can provide a measure of the resilience of the timber supply chain reference. Zhu et al. (2020) integrated supply chain and resilience concepts into prefabricated construction to develop a six-dimensional index system spanning supply chain levels, design/supervision units, manufacturers, logistics enterprises, and contractors [32]. Rohit Kumar Singh (2019) proposed a four-dimensional evaluation framework for timber supply chain resilience while analyzing a soap manufacturing case to identify three core structural elements: product flexibility (supply side: multi-specification production capacity), demand management flexibility (demand side: dynamic pricing and service adjustment), and distribution flexibility (connectivity side: network optimization and third-party logistics synergy) [33]. The capability perspective emphasizes the system’s ability to predict, resist, and recover from external shocks. Liu et al. (2023) advanced a novel resilience evaluation framework for prefabricated building supply chains, forecasting, absorptive, adaptive, recovery, and growth capabilities—and validated through a case study on the Nanchang Yinwang Village project, revealing that absorptive capacity exerts the most profound impact on supply chain resilience [34]. Spiegler et al. (2012) identified readiness, responsiveness, and recovery as key performance criteria and employed the Integral of the Time Absolute Error (ITAE) to evaluate make-to-stock supply chain models [35].
Building on prior research, the Sino-Russian timber supply chain—a prototypical transnational resource-based system—adopts a “resource country–consumer country” binary structural framework, deconstructible into four core components: Russian logistics and transportation, timber supply and primary processing, Sino-Russian import/export, and China (with Heilongjiang Province as the core consumer market). This framework forms a holistic “resource acquisition–processing and transformation–cross-border circulation–terminal consumption” chain, further subdivided into five key nodes: Russian timber supply, Russian primary wood processing, Sino-Russian timber trade, Heilongjiang furniture manufacturing, and Heilongjiang furniture sales. Russian logistics and transportation capacity underpins upstream and midstream operations, ensuring efficient resource flow to consumer markets by integrating cross-border logistics networks and operational synergies. This structural configuration highlights the interdependence between resource extraction, processing, and market distribution, thereby providing a foundational framework for analyzing resilience dynamics across the supply chain continuum from raw material sourcing to end-user consumption. The overall research framework is illustrated in Figure 1. The research question centers on evaluating supply chain resilience, with a clear focus on the core research objectives. The methodology consists of five key steps: (1) developing an indicator system that encompasses critical dimensions, such as logistics, processing, import/export trade, and sales; (2) constructing a system dynamics model to simulate the interactions among nodes in the China–Russia timber supply chain; (3) quantifying the evaluation indicators from 2017 to 2033 using system dynamics; (4) determining indicator weights via the entropy weight method; and (5) calculating the resilience index using the TOPSIS method. The discussion and analysis are divided into two parts: (a) an overall trend analysis that tracks the evolution of resilience (e.g., identifying the resilience low point in 2021 and subsequent recovery trends); and (b) a scenario simulation analysis that evaluates resilience performance under different developmental conditions. Finally, conclusions and recommendations are drawn based on the analysis. This framework integrates methodological rigor (indicator design, modeling, quantification, weighting, and resilience calculation) with results-driven analysis, achieving a comprehensive assessment of the dynamic nature of supply chain resilience.

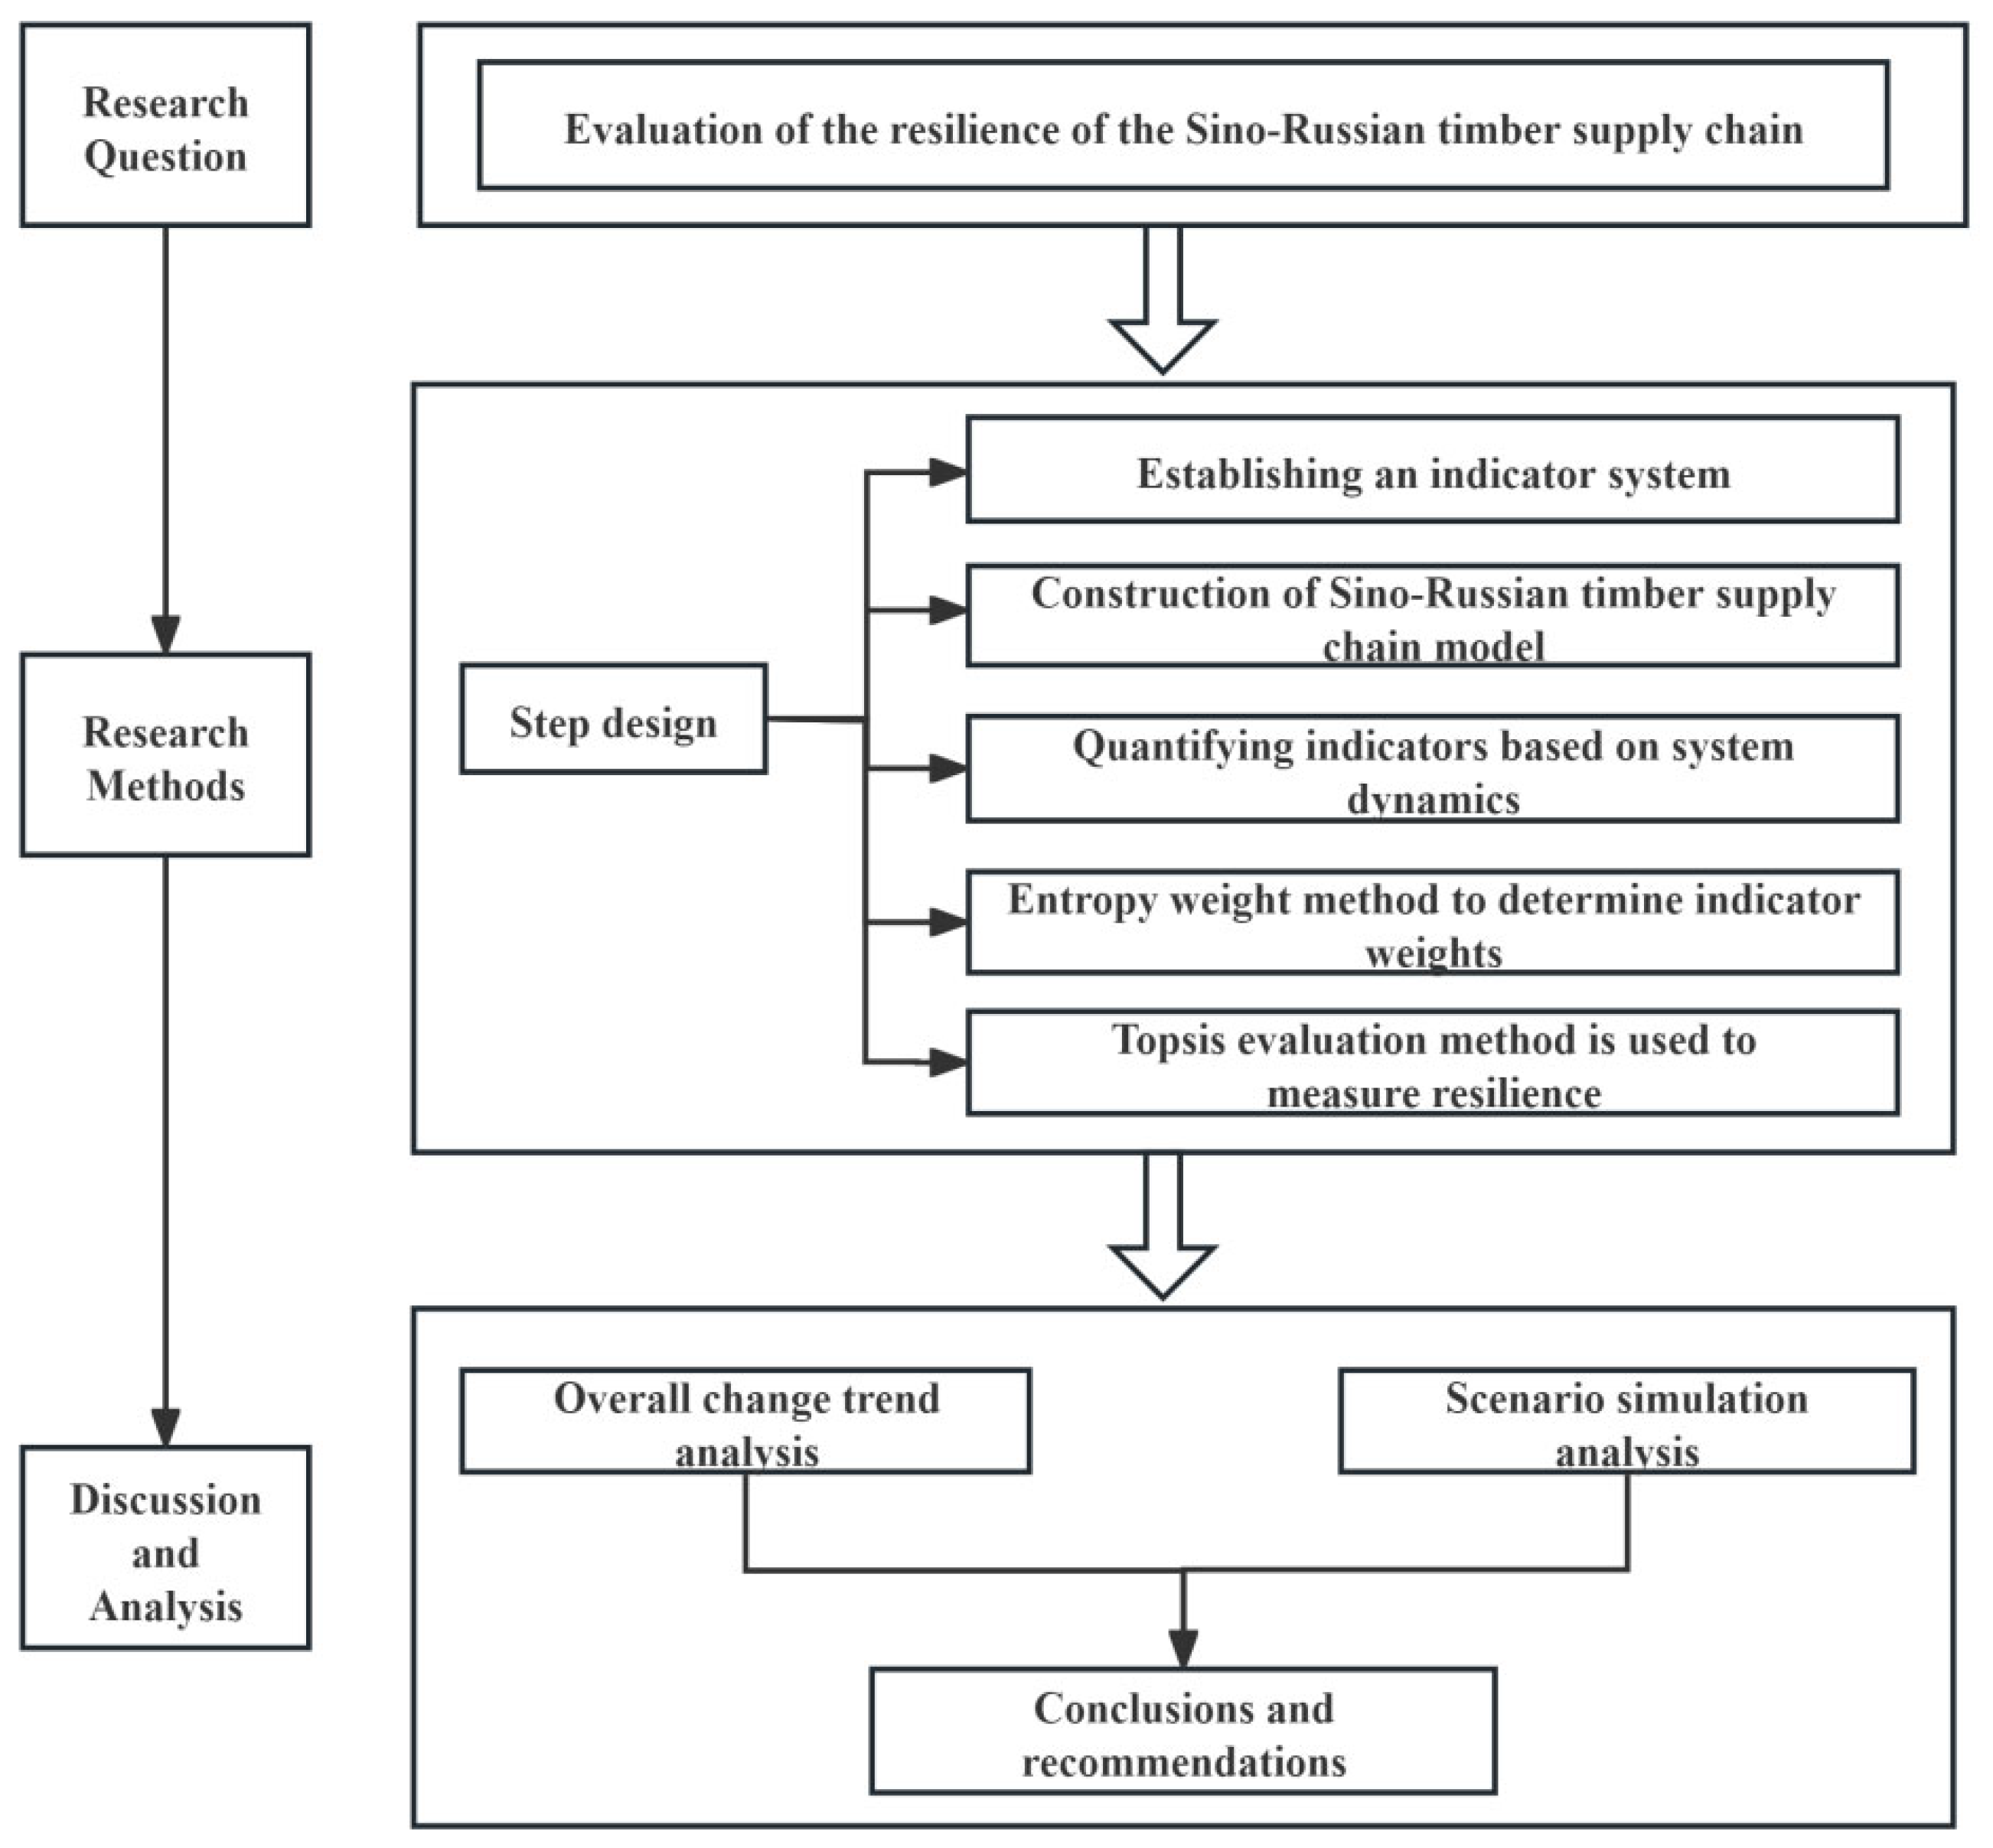
2. Materials and Methods

2.1. Study Area and Data Sources

This study focuses on the core regions of the Sino-Russian timber trade, namely Russia and China’s Heilongjiang Province. Their geographical proximity has fostered a closely integrated supply chain network. Heilongjiang Province has emerged as the central hub for China–Russia timber trade, with ports such as Suifenhe and Manzhouli accounting for over 60% of timber imports. Within the province, the Binxi Economic and Technological Development Zone and Harbin Furniture Industrial Park have established a comprehensive chain from “imported logs to deep processing and domestic sales”. This regional linkage—characterized by “Russian resource supply, Heilongjiang processing and transformation, and national market radiation”—serves as a typical example of a cross-border supply chain. Suifenhe Port, operational for 120 years, currently contributes 40% to the province’s trade with Russia, with timber being the largest commodity. The port handles an annual timber import of nearly 3.5 million cubic meters, representing over 50% of the national total. There are 267 timber processing enterprises, with broadleaf veneer production alone capturing 70% of the domestic market share, indicating the preliminary formation of a cross-border industrial cluster.
Data are sourced from the General Administration of Customs of China, the Russian Statistical Yearbook, the Russian Federal State Statistics Service, and the Heilongjiang Statistical Yearbook. Individual missing data points are completed using data interpolation methods to ensure dataset integrity, covering all links of the Sino-Russian timber supply chain from 2017 to 2022.

2.2. Constructing Evaluation Indicators for the Resilience of the Sino-Russian Timber Supply Chain

As outlined in Table 1, the four capability dimensions—Russian logistics and transportation, Russian primary wood processing, Sino-Russian import–export, and Heilongjiang furniture sales—collectively capture the core functionalities of the supply chain, spanning from resource transmission and processing to cross-border circulation and terminal value realization. Specifically, logistics and transportation capabilities ensure the stable supply of timber resources by sustaining cross-border freight efficiency, even amid disruptions. Primary processing capabilities enhance product value through technical conversion, ensuring consistent output of intermediate goods critical for downstream manufacturing. Import–export capabilities facilitate market expansion by adapting to policy dynamics and optimizing cross-border trade flows, while Heilongjiang’s sales capabilities translate production into end-market value by responding to consumer demands and market fluctuations (e.g., real estate cycles and consumption upgrades). Each capability dimension provides distinct yet interconnected support: logistics underpins supply stability, processing enhances resilience through value addition, trade ensures market accessibility, and sales solidify demand-side adaptability. Collectively, these capabilities form a logically rigorous support system for the Sino-Russian timber supply chain, enabling its resilience and driving high-quality development.

2.3. Construction of Dynamic Model of Sino-Russian Timber Supply Chain System

2.3.1. System Boundaries and Assumptions

System dynamics models complex systems’ dynamic interactions and feedback mechanisms, making it ideal for long-term strategic analysis [36]. As real-world elements are interdependent, all associated objects would overcomplicate the model, introducing noise and distorting results. Thus, we focus on modeling primary objects. Considering that the research system is time-sensitive, this paper initially defines the time unit as a year, and the system boundaries are forest resources, the number of employees, infrastructure investment, the number of enterprises, and so on.
Model assumptions:
(1)
Environmental changes external to the system (such as the global economic environment, political environment, etc.) do not intrinsically affect the internal operation of the system;
(2)
The model does not account for low-probability events such as black swan events.
(3)
The model focuses on the core sequence of “Russian production—transportation—exportation—Chinese sales”, not including all nodal firms.
(4)
Modeling targets the “Russian production–transportation–export–Chinese sales” sequence (partial nodal coverage).
(5)
Only the main causal relationships of the influencing factors within the system are considered.

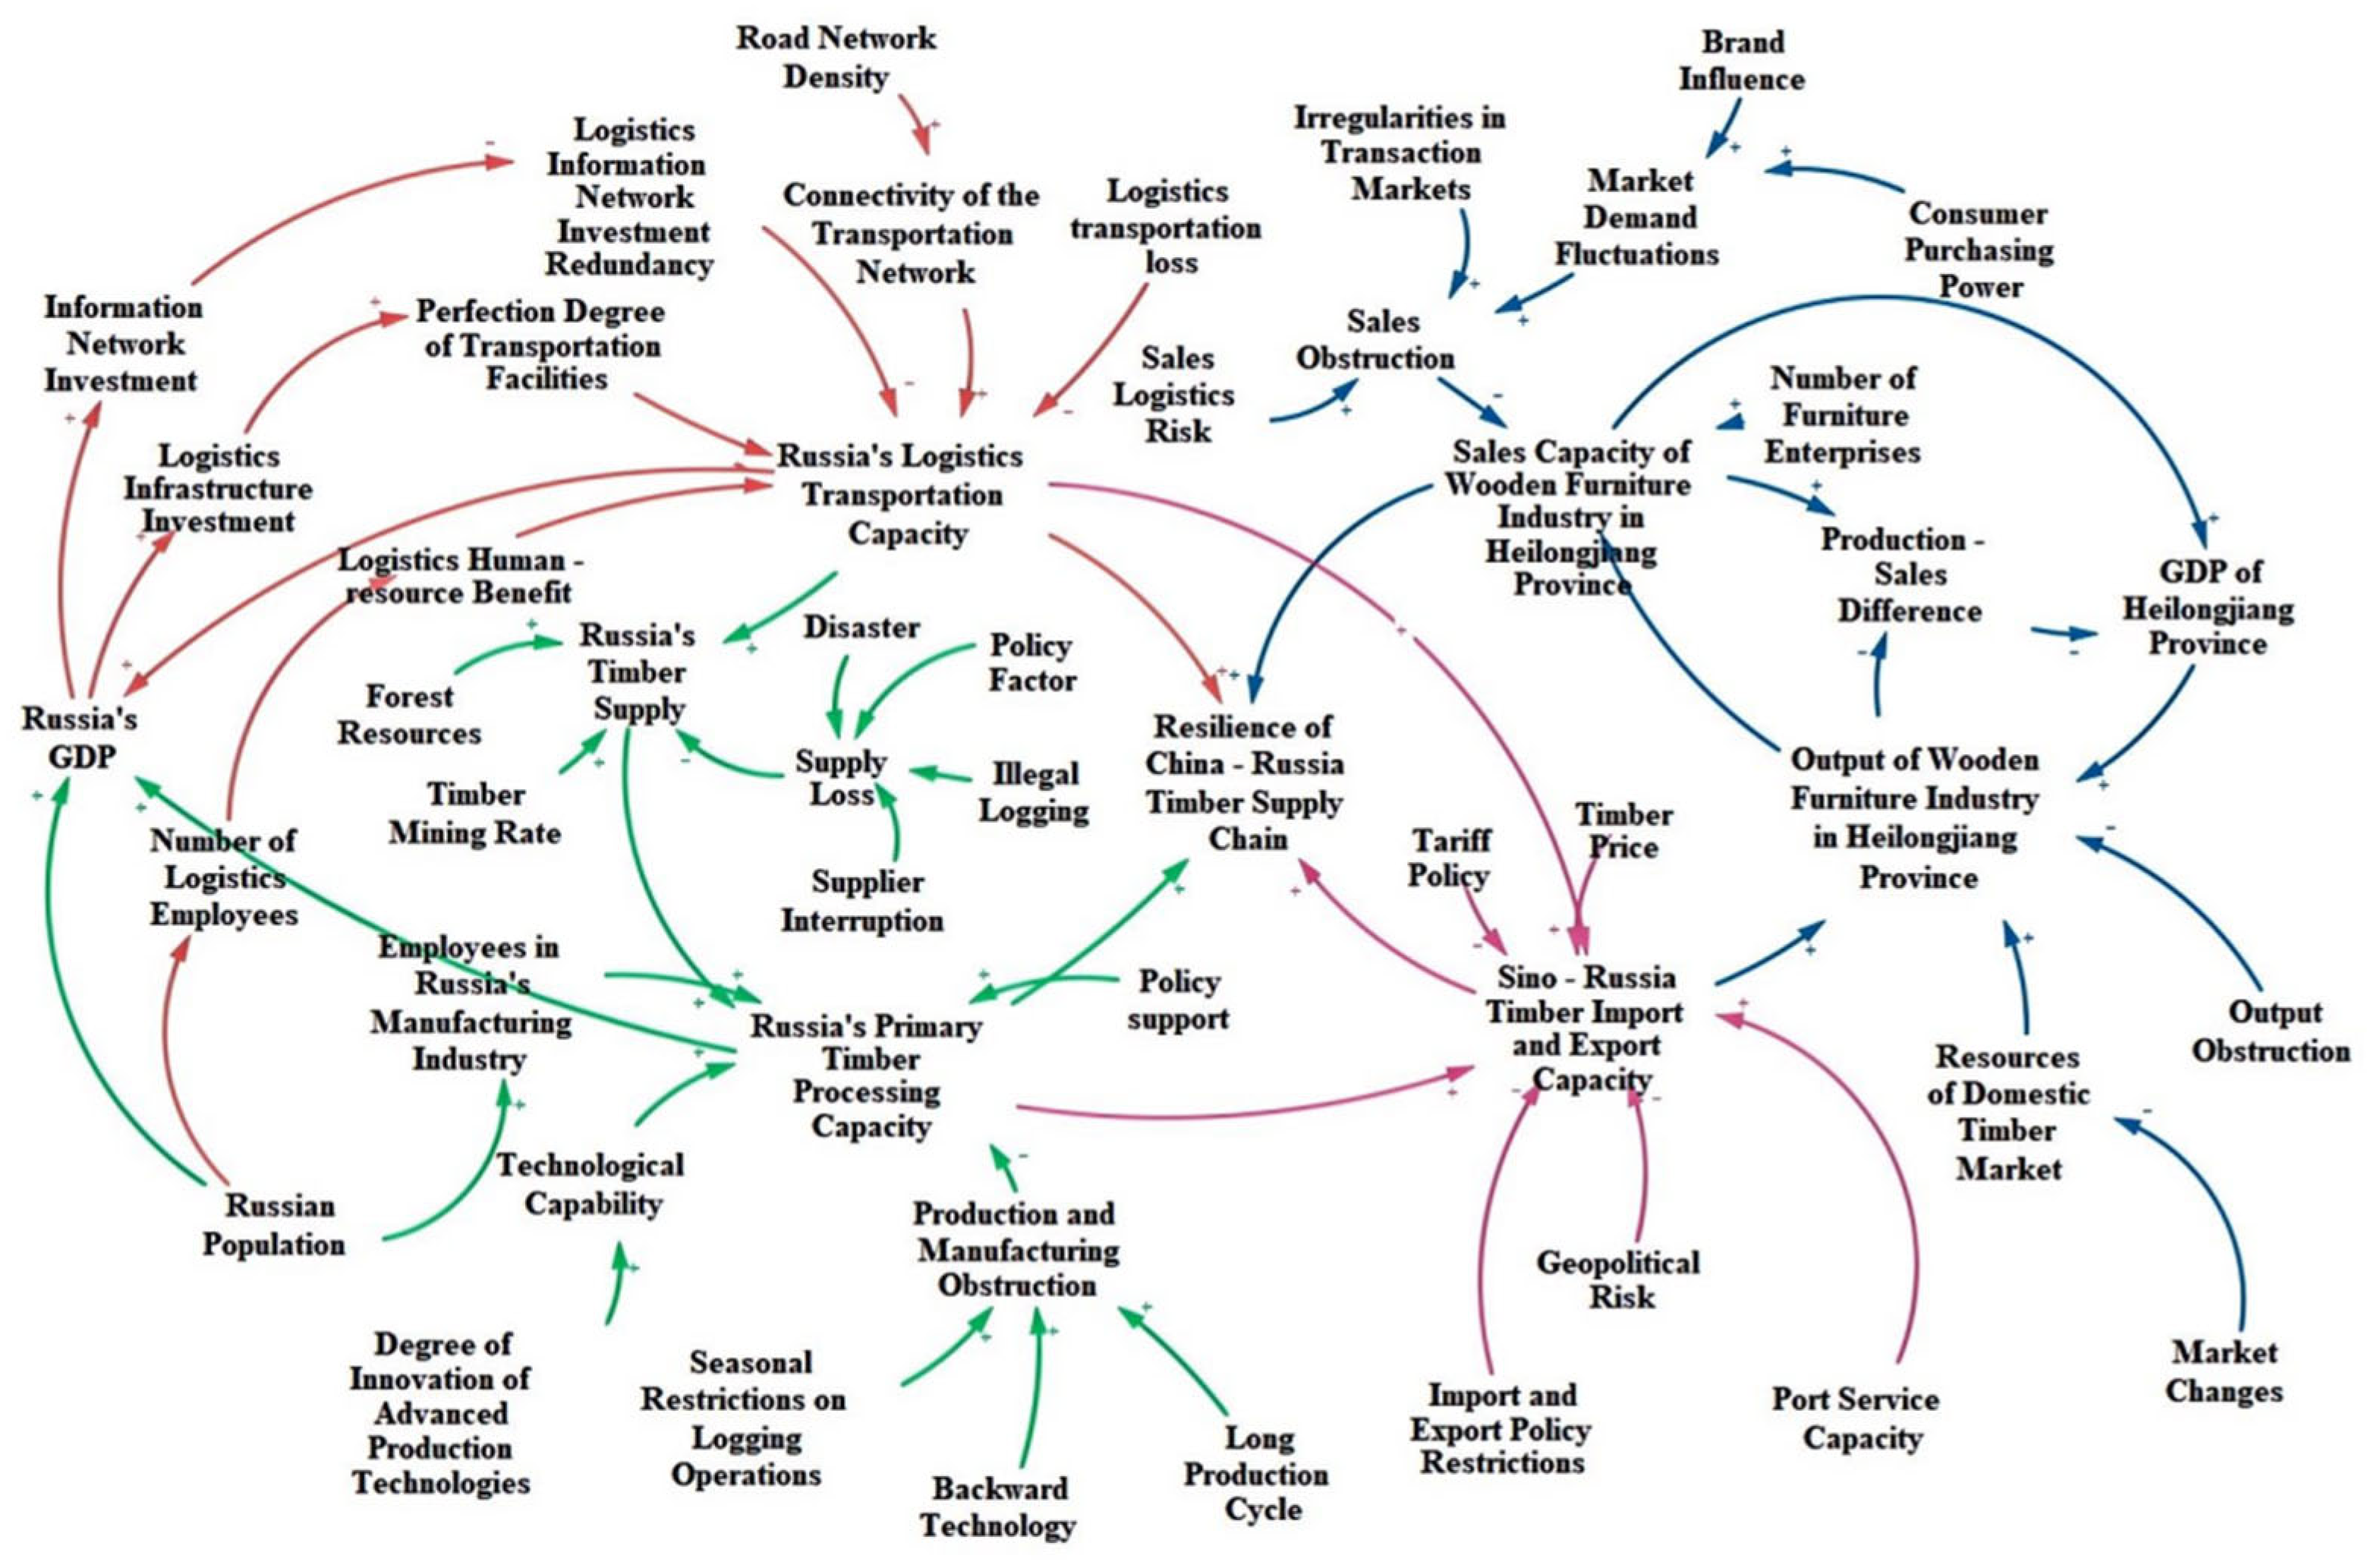
2.3.2. Construction of a Causal Diagram

This section analyzes the internal operation mechanism of the timber supply chain, explores the interaction relationships between the indicators, studies the path of their interaction, conducts a detailed analysis of the important literature in the same field, and constructs the causal-loop diagram of the timber supply chain resilience (Figure 2).
The causal diagram in Section 2.2 illustrates the complex interrelationships among factors influencing the resilience of the Sino-Russian timber supply chain, structured into four interconnected subsystems: Russian logistics and transportation, primary wood processing, Sino-Russian import/export, and Heilongjiang furniture sales. Each subsystem is color-coded for clarity (deep red for logistics, green for processing, light red for import and export, and blue for sales), with arrow types denoting positive or negative effects.
The growth of Russia’s gross domestic product (GDP) directly drives investments in logistics infrastructure, where road network density influences the spatial connectivity of transportation networks [37], thereby enhancing timber transportation efficiency. Concurrently, a larger population supports a larger workforce in the logistics sector, further improving operational capacity [38]. However, redundant information systems or excessive resource allocation reduce data processing efficiency and waste capital, while other factors and risks cause logistics losses [39], weakening overall transportation resilience. Forest resource endowment is the basis of timber supply, and the logging rate directly determines the amount of raw materials available [40]. An increase in population ensures an adequate labor force for manufacturing, while advanced production technologies significantly enhance primary wood processing efficiency and product quality [41]. Conversely, seasonal logging restrictions, long production cycles, and outdated machinery act as bottlenecks, reducing processing capacity [42]. Illegal logging and supplier disruptions lead to supply instability, causing fluctuations in raw material availability and further compromising processing consistency. These factors collectively shape the reliability of Russia’s export timber output. These upstream factors directly influence the import–export capacity of Sino-Russian timber: robust logistics and processing capabilities ensure the timeliness and efficiency of trade [43]; conversely, restrictive policies or geopolitical tensions increase costs and affect trade continuity [44]. Downstream, Heilongjiang’s furniture sales capacity is driven by GDP-induced consumer demand, forming a positive feedback loop among production, sales, and economic growth. However, factors such as market irregularities and sales logistics risks weaken sales performance [45].
These factors are intricately intertwined and mutually influential, forming a complex network of causal relationships that collectively shape the resilience of the Sino-Russian timber supply chain. Changes in any single component can propagate through causal pathways to impact the resilience of the entire supply chain, with disruptions transmitting layer-by-layer across interconnected nodes. This multi-factor synergy and transmission mechanism underscores that supply chain resilience is not determined by isolated variables but emerges from the dynamic interaction and equilibrium among economic indicators, supply chain nodes, market dynamics, and policy frameworks. Specifically, fluctuations in any of these elements can trigger cascading effects, ultimately affecting the supply chain’s stability and risk resistance. This framework provides a comprehensive analytical basis for enhancing supply chain resilience by identifying critical leverage points within the causal network.

2.3.3. System Flow Chart and Model Equation Construction

Based on the causal feedback diagram, a stock–flow diagram is developed. The main processes in the reference causal diagram are used to construct the system flow chart, but they are not completely copied. In order to simplify the model, certain variables are linked to real-time data through table functions. Guided by the capability dimensions and principle of parsimony, key factors are selected to partition the system into four subsystems: Russian logistics and transportation capacity, Russian primary wood processing capacity, Sino-Russian timber import-export capacity, and Heilongjiang furniture sales capacity. The model’s stock–flow structure is illustrated in Figure 3. Data for Russian logistics, primary processing, Sino-Russian trade, and Heilongjiang furniture sales are sourced from the General Administration of Customs of China, the Russian Statistical Yearbook, the Russian Federal State Statistics Service, and the Heilongjiang Statistical Yearbook. Individual missing data points are completed using data interpolation methods to ensure dataset integrity. The model was developed using AnyLogic 8.7 Version (Pleasanton, CA, USA), a widely adopted platform for complex system simulation, which enabled the visual representation of causal loops through its stock–flow diagramming capability and facilitated parameter calibration with built-in optimization tools. Additionally, the model incorporated customized equations, table functions, and conditional logic inspired by methodologies in the literature [46]. The primary equations underpinning the model are as follows:
(1)
Russian Logistics Transportation Capacity = 7075.328 + 0.15 × Logistics Transportation Capacity Improvement − Logistics Transportation Capacity Consumption − Previous Year’s Russian Logistics Transportation Capacity (Custom Equation Mode, Initial Value: 8072.6 MMT)
(2)
Russian Timber Supply = Timber Supply Improvement − Timber Supply Consumption − previous year’s Russian timber supply (Custom Equation Model, Initial Value: 82.8 billion cubic meters)
(3)
Russian Primary Processing Capacity = Production And Manufacturing Growth − Production And Manufacturing Obstruction − 0.84 × previous year’s Russian Primary Processing Capacity (Custom Equation Model, Initial Value: 252 thousand cubic meters)
(4)
Sino-Russia Timber Import And Export capacity = Timber Import And Export Growth − Timber Import And Export Hindrance (Classic Equation Model, Initial Value: 949.256 million RMB)
(5)
Heilongjiang Wooden Furniture Industry Output Capacity = Heilongjiang Wooden Furniture Industry Output Growth − Heilongjiang Wooden Furniture Industry Output Obstruction − previous year’s Heilongjiang Wooden Furniture Industry Output Capacity (Custom Equation Model, Initial Value: 595.5203 million RMB)
(6)
Heilongjiang Wooden Furniture Industry Sales Capacity = Heilongjiang Wooden Furniture Industry Sales Growth − Heilongjiang Wooden Furniture Industry Sales Obstruction × Heilongjiang Wooden Furniture Industry Sales Capacity − 0.85 × previous year’s Heilongjiang Wooden Furniture Industry Sales Capacity (Customized Equation Model, Initial Value: 455.7761 million yuan)
(7)
Production And Manufacturing Growth = 0.3 × Russian Timber Supply + 0.187 × Human Resources + 0.13 × Technological Capability + 0.105 × Policy Influence − 105
(8)
Production And Manufacturing Obstruction = Timber Production Efficiency Impediments × Russian Primary Processing Capacity
(9)
Timber import and export growth = 0.73 × Russian Primary Processing Capacity + Transportation Loading Factor × Russian Logistics Transportation Capacity
(10)
Timber Import And Export Hindrance = (Geopolitical Riskn + Policy Restriction) × Sino-Russia Timber Import And Export Capacity + 0.4 × Timber Price + 0.6 × Cargo Transportation Tariff
(11)
Heilongjiang Wooden Furniture Industry Output Growth = (0.489402 × Domestic timber market resources + 0.0626047 × GDP of Heilongjiang Province + 0.195484 × Sino-Russia Timber Import And Export Capacity) × Market Benefit Factor
(12)
Heilongjiang Wooden Furniture Industry Output Obstruction = Production Obstruction Factor × Heilongjiang Wooden Furniture Industry Output Capacity
(13)
Heilongjiang Wooden Furniture Industry Sales Growth = 0.35 × Heilongjiang Wooden Furniture Industry Output Capacity × Wooden Furniture Market Adaptability Coefficient + 0.78 × Furniture Enterprise Quantity + 0.1 × Math.log10 (Heilongjiang Wooden Furniture Industry Output Capacity) − 31.81
(14)
Heilongjiang Wooden Furniture Industry Sales Obstruction = Sales Obstruction
(15)
Growth = Growth Rate × Russian GDP
(16)
Hindrance = Hindrance Factor × Russian GDP
(17)
Economic Growth = Economic Growth Rate × GDP Of Heilongjiang Province
(18)
Economic Obstruction = Economic Obstruction Factor × GDP Of Heilongjiang Province
(19)
Timber Production Efficiency Impediments = Industrial Injury Accidents And Occupational Diseases + Seasonal Restrictions On Logging Operations + Long Production Cycle + Lagging Equipment And Production Technology
(20)
Sales Obstruction = Transaction Market Disorder + Sales Logistics Risk + Market Demand Fluctuation
(21)
Logistics Talent Benefits = Labor Force Conversion Coefficient × Workers
(22)
Connectivity Of The Transportation Network = Transportation Benefit Coefficient × Road Network Density
(23)
Logistics Information Network Investment Redundancy = Information-based Investment Conversion Coefficient × Information Network Investment
(24)
Benefits Of Logistics Infrastructure Construction = Infrastructure Investment And Construction × Infrastructure Investment
Figure 3. System flow chart (a) Russian logistics and transportation capacity subsystem. (b) Russian primary wood processing capacity subsystem. (c) Sino-Russian timber import-export capacity subsystem. (d) Heilongjiang (China) furniture sales capacity subsystem.
Forests 16 01106 g003
Leveraging AnyLogic’s built-in optimization tools and dynamic simulation capabilities, the parameters were calibrated and optimized through iterative debugging in AnyLogic to minimize discrepancies between simulated outputs and historical trends, with key indicators achieving a prediction error rate below 10%. The model is also tested for extremity, confirming its reliability in capturing real-world elastic dynamics. For details, see Section 2.3.4 below. Initial values directly correspond to annual statistical figures, ensuring the model’s empirical grounding and reliability.

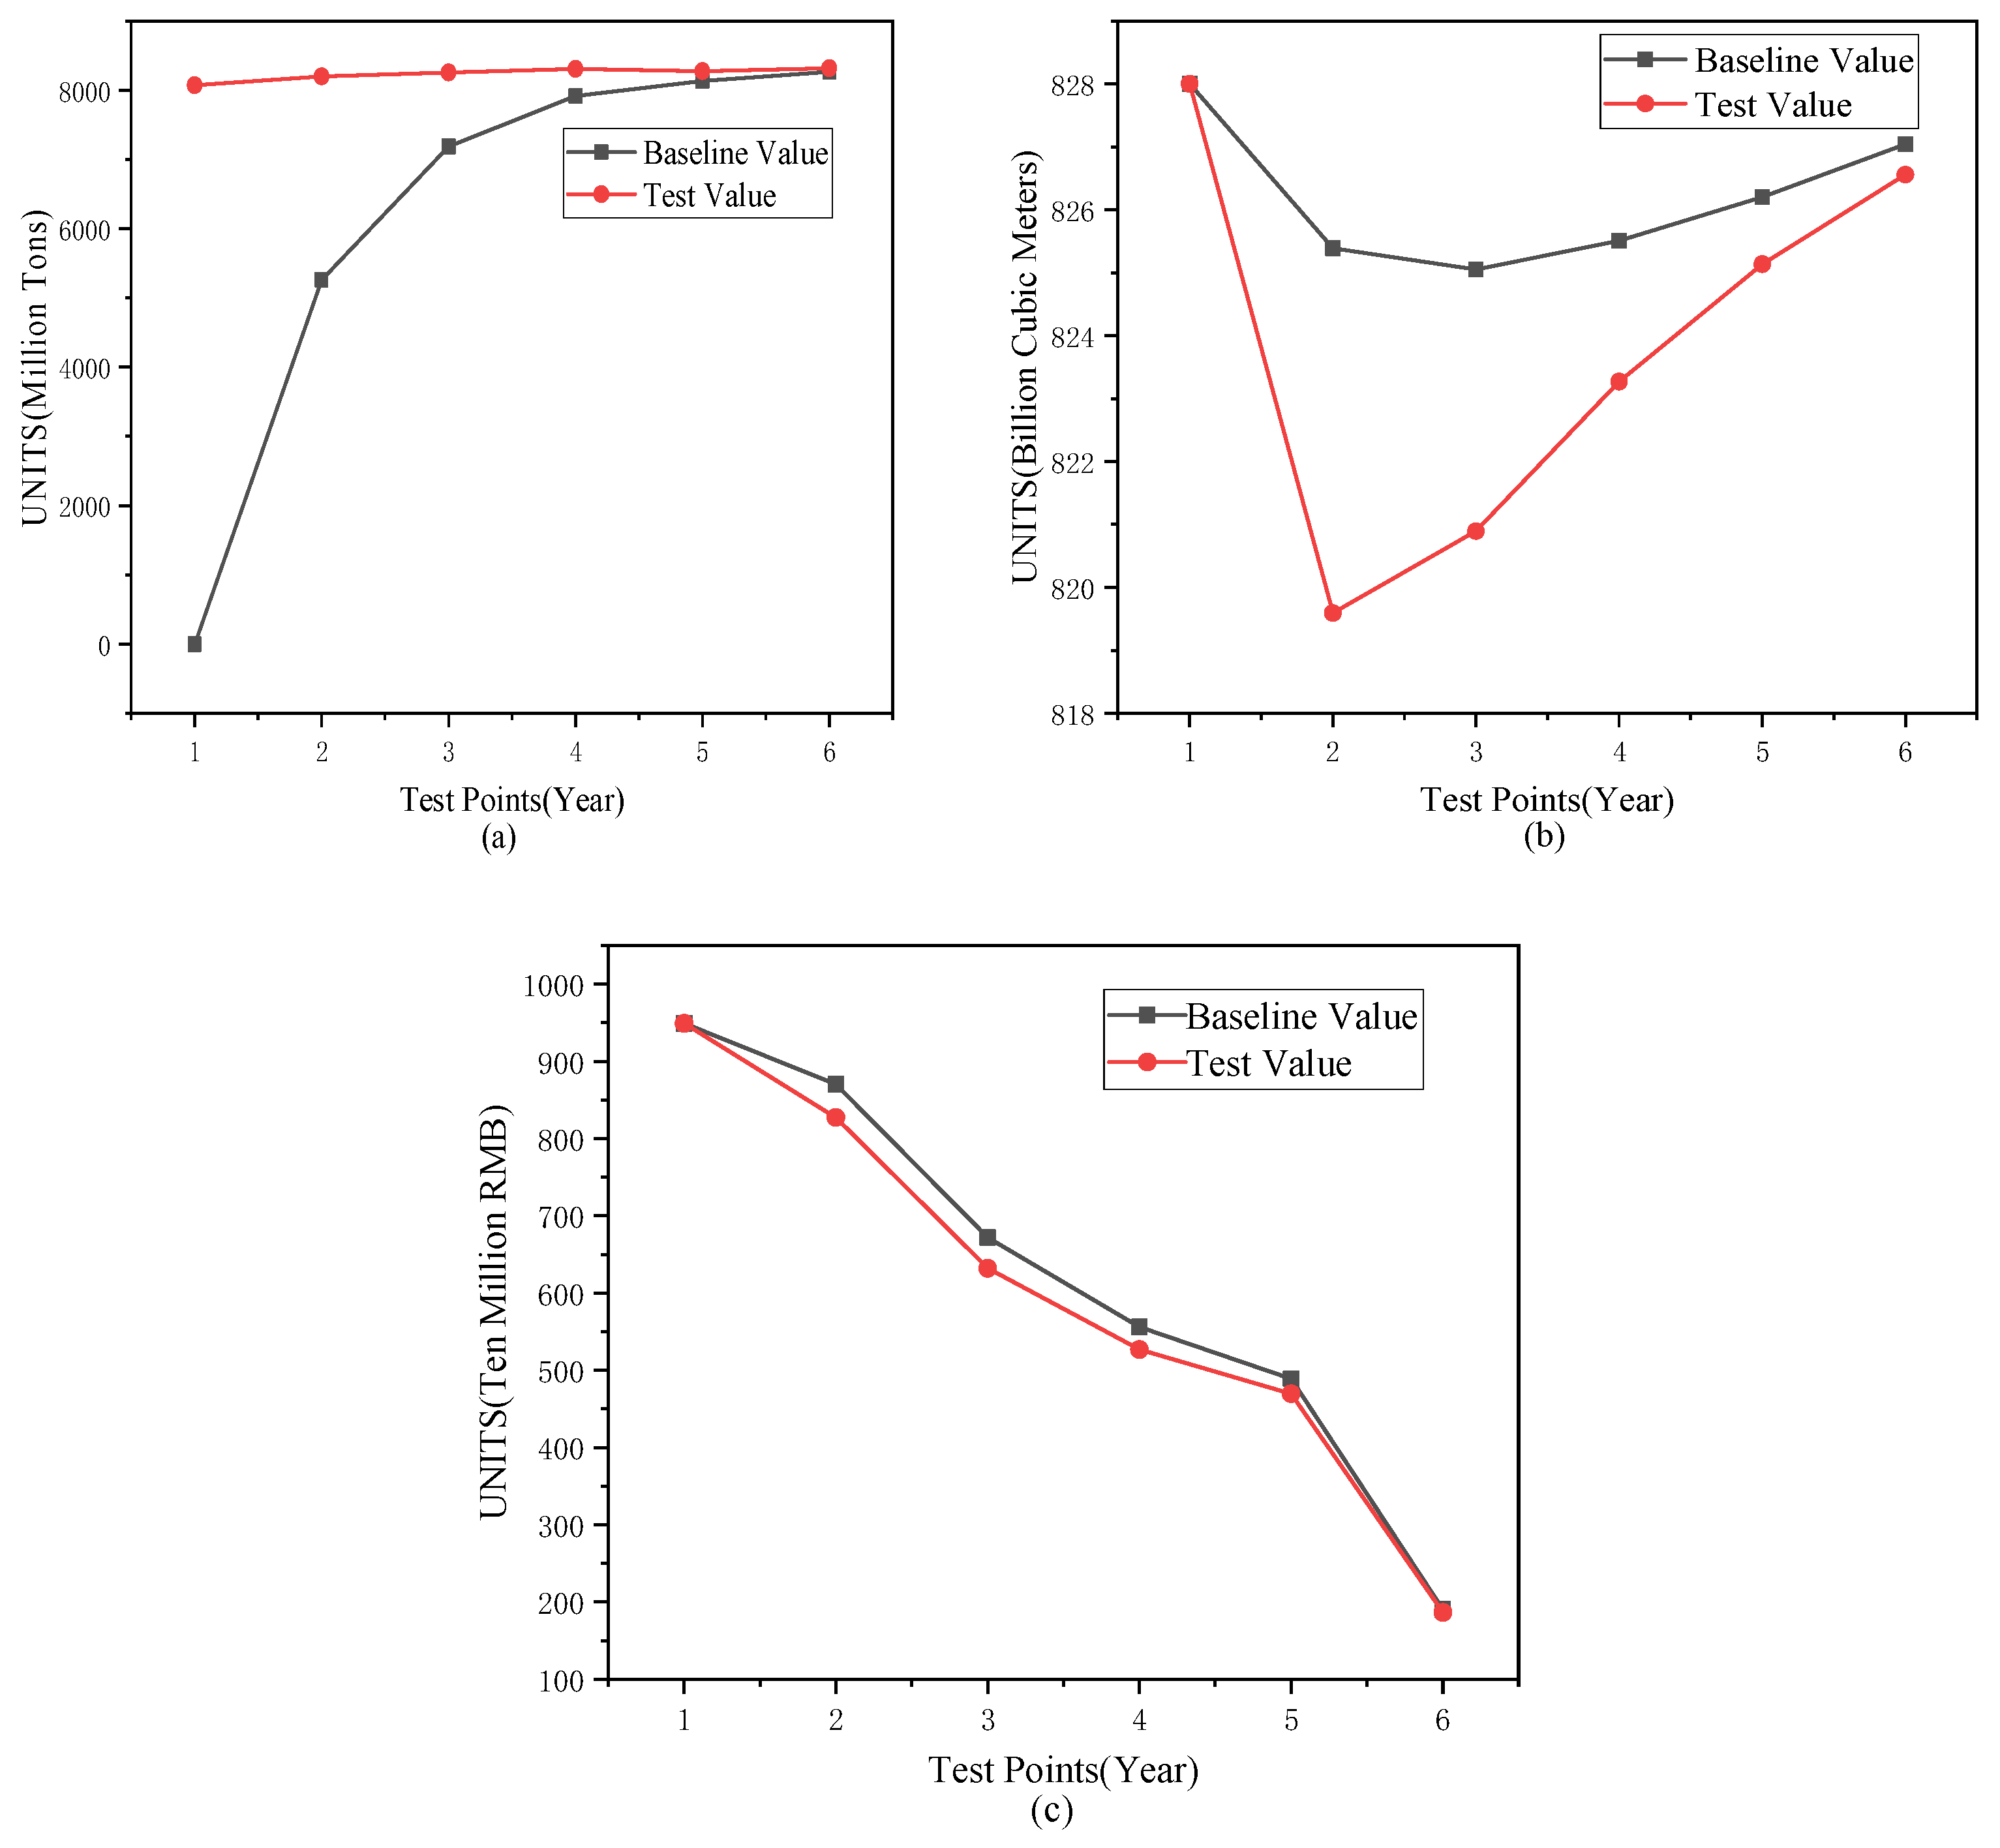
2.3.4. Model Testing

Historicity Test
Using historical data from 2017 to 2022, a fitting test of the system dynamics model was conducted. Results show that deviations between predicted and actual values for key indicators—including Russian logistics capacity, primary processing output, Sino-Russian trade volumes, and Heilongjiang furniture sales—are controlled within 10%, satisfying the historical test criteria for model validity. This level of accuracy confirms the model’s sufficient reliability, with error margins well within industry-standard acceptable ranges, thereby providing a robust methodological foundation for subsequent scenario analyses (Table 2).
Stability Test
The structural robustness and behavioral rationality of this system dynamics model are tested by setting extreme initial conditions (initial value of logistics and transportation capacity stock = 0). The tests are based on the following design principles:
(1)
Single-variable shocks: only extreme disturbances are applied to the logistics and transportation capacity (period 0 = 0), and the rest of the stock (e.g., GDP, etc.) changes normally according to the initial experimental value;
(2)
Response test: to verify the resilience of the shocked variable and the mechanism of its dynamic impact on the associated stock.
The test results are shown in Figure 4a. When the initial value of logistics and transportation capacity approaches zero. The causal diagram illustrates that the development of GDP promotes investment in logistics infrastructure, population promotes labor supply, etc., which improves logistics capacity, while flow charts use table functions to directly call the actual values for each year to reflect this change and recovery. By the 5th year, it was very close to the initial experimental value, with a difference in values of only 0.62%. Although the initial values of Russia’s timber supply capacity and timber import–export capacity were not directly interfered with, their indicators attenuated due to disruptions in logistics transportation (Figure 4b,c).
Meanwhile, timber supply and import–export activities may rely on their reserve mechanisms and other non-logistic factors to supplement timber supply. Following the initial shock, the import–export capacity exhibits a downward trend. Specifically, at test point 1, it decreases by 4.95%, and the maximum percentage drop is observed at test point 2 with a 5.94% reduction. Subsequently, the annual difference between the test values and the baseline values decreases on average by 1.63%, reflecting a “gradual recovery” pattern. Compared with the initial experimental values, these indicators show a downward trend but no drastic deviation, indicating that the decline in logistics capacity propagates to downstream stocks. As logistics and transportation capacity fluctuate, timber supply and import/export activities are directly affected.
Under extreme conditions, all variables exhibit no numerical spillover or non-logistic shock and satisfy boundary condition constraints (e.g., timber supply capacity always ≥ 0); key variables follow the basic pattern of “shock → decay → gradual recovery”.

2.4. Entropy Weight–TOPSIS Evaluation Framework

2.4.1. Entropy Weight Method for Weight Calculation

Information quantifies system order, while entropy measures disorder. For a specific indicator, its entropy value reflects data dispersion: a smaller entropy indicates greater dispersion, enhancing its weight in comprehensive evaluation. Conversely, an indicator with identical values contributes no weight, as it lacks discriminatory information. Thus, information entropy serves as a critical tool to calculate indicator weights, offering a data-driven basis for the comprehensive assessment of multiple indicators by linking the dispersion of indicator values to their informational significance, enhancing the objectivity and scientific rigor of multi-indicator evaluations. Here are the steps [47]:
  • Step 1: Construction of the Initial Decision Matrix
The initial decision matrix is constructed as follows:
X = x 11 x 12 x 1 n x 21 x 22 x 2 n x m 1 x m 2 x m n
where X is the initial decision matrix, m is the number of nodes for suitability evaluation, n is the number of factors, xij is the analysed values of each sample parameter, i = 0, 1, 2, …, m, and j = 0, 1, 2, …, n.
  • Step 2: Normalization of the Initial Decision Matrix
It is necessary to normalise the matrix since dimension and metric of the data are not uniform. The normalised decision matrix can be expressed as following:
Y = y 11 y 12 y 1 n y 21 y 22 y 2 n y m 1 y m 2 y m n
where Y is the normalised decision matrix. The normalisation process is conducted using the following equations:
y i j = X i j min X i max X i min X i   ( forward   pointer )
y i j = min X i X i j max X i min X i   ( Negative   indicators )
  • Step 3: Calculation of the Entropy
The entropy of each factor can be calculated as follows:
e j = 1 l n m i = 1 m p i j l n p i j
where ej is the entropy of each factor, and pij is calculated as:
p i j = y i j i = 1 m y i j
  • Step 4: Calculation of the Weight
The weight of each factor can be calculated as follows:
w j = 1 e j i = 1 n 1 e i
where wj is the weight of each factor.

2.4.2. Integrating Z-Score Normalization and TOPSIS for Overall Supply Chain Resilience Calculation

(1)
Z-Score Normalization Method: This method eliminates dimensional differences between indicators and transforms them into standard normal distribution data with a mean of 0 and a standard deviation of 1. The Z-score normalization process involves subtracting the mean from the data and dividing by the standard deviation. This is done for each value in the dataset. For each attribute, the Z-score of an entry is calculated by [48]:
z i = x i μ σ
where μ is the mean of the dataset and σ is the standard deviation of the dataset. Z-score normalization is useful when you want to compare and use variables with different scales and distributions. By normalizing the data, all variables have a comparable size and distribution, which facilitates comparison and analysis. With Z-score normalization, values above the mean will have a positive Z-score, while values below the mean will have a negative Z-score. This allows you to identify outliers because they tend to have a high or low Z-score compared to the rest of the data. Z-score normalisation does not transform the data within a particular range but rather adjusts it to have a zero mean and a standard deviation of 1. In addition, the technique assumes that the data follow a normal distribution and, therefore, works well for continuous variables.
(2)
TOPSIS Model Construction: This quantifies the supply chain resilience level by calculating the relative closeness of each evaluation object to positive and negative ideal solutions. Here are the steps [49]:
  • Step 1: Construction of the Weighted Normalized Matrix
The weighted normalized matrix is constructed as follows:
V = v i j n m , v i j = z i j w j
Here, z i j represents the elements in the normalized decision matrix. w j represents the weight of the indicator.
  • Step 2: Determination of the Positive and Negative Ideal Solutions
The positive ideal solution V + , representing the optimal state of each indicator, is defined as:
V + = m a x v 1 j , v 2 j , , v n j 1 m
The negative ideal solution V , representing the worst state of each indicator, is defined as:
V = m i n v 1 j , v 2 j , , v n j 1 m
  • Step 3: Calculation of Euclidean Distances
For the i-th year, the distances from the supply chain status to the positive and negative ideal solutions are calculated as follows:
D i + = j = 1 m v i j V j + 2
D i = j = 1 m v i j V j 2
Here, D i + denotes the distance from the i-th year’s supply chain status to the positive ideal solution, while D i denotes the distance to the negative ideal solution.
  • Step 4: Calculation of Relative Closeness (Resilience Value)
The relative closeness C i , reflecting the degree of proximity between the supply chain status in each year and the ideal solution, is calculated as:
C i = D i D i + + D i
The value of C i ranges from 0 to 1, with a larger value indicating stronger resilience.

2.5. Scenario Simulation Design

By designing distinct development strategy scenarios, this study explores how growth in each supply chain link impacts the resilience of the Sino-Russian timber supply chain. To ensure experimental rigor and comparison fairness, the total percentage increase across all factor enhancements in each scenario is fixed at 200%, maintaining consistent input variability for analytical accuracy. This setup allows for controlled evaluation of subsystem contributions, isolating the effects of targeted investments (e.g., in logistics, processing, trade, or sales capabilities) while balancing overall resource allocation. By standardizing the cumulative factor elevation, the simulation mitigates confounding variables, enabling precise identification of which capability improvements most effectively enhance supply chain resilience under different strategic priorities (Table 3).
Synergistic Development: All four capability growth factors—logistics, primary processing, import–export, and sales—have increased by 50%. This scenario emphasizes balanced development without prioritizing any single link, aiming to observe the impact of coordinated improvements across all supply chain segments on overall resilience. By adopting a comprehensive development strategy, it evaluates how synergistic enhancements in logistics efficiency, processing capacity, trade flows, and market sales collectively influence system stability and risk resistance.
Logistics-Focused Development: Logistics capacity enhancement has increased by 80%, while production, import–export, and sales capacities each grow by 40%. This scenario prioritizes strengthening the logistics link. Under the premise of maintaining a constant total factor change (200%), it significantly enhances logistics efficiency and scale to assess its driving effect on the supply chain. Other links receive moderate growth to support logistics improvements, isolating the role of transportation resilience as a core enabler of system stability.
Production-Focused Development (Primary Processing): Primary processing capacity growth has increased by 80%, with logistics, import–export, and sales capacities each growing by 40%. This scenario focuses on the upstream production link, aiming to stabilize the supply chain’s raw material processing through enhanced efficiency and capacity. By ensuring consistent total factor changes, it analyzes how strengthened primary processing—supported by moderate growth in other links—shapes supply chain resilience, particularly in mitigating upstream bottlenecks and resource supply risks.
Trade-Focused Development (Import–Export): Import–export capacity growth has increased by 80%, with logistics, production, and sales capacities each growing by 40%. This scenario targets improving cross-border resource allocation and market adaptability in the trade link. By maintaining fixed total factor changes, it explores how enhanced trade capabilities—supported by foundational growth in other segments—influence supply chain dynamics, especially in responding to international market fluctuations and policy changes.
Sales-Focused Development: Sales capacity growth has increased by 80%, with logistics, production, and import–export capacities each growing by 40%. This scenario centers on the downstream sales link, driving supply chain development through expanded sales capabilities. With the total factor change maintained at a consistent 200%, this approach allows for an analysis of how supply chain resilience changes under the leadership of sales growth.
By maintaining a consistent total percentage change in factors while adjusting the growth ratios of each supply chain link, this experimental design enables a precise assessment of how different strategic priorities impact supply chain resilience. This approach ensures that observed outcomes stem from variations in developmental focus—rather than differences in aggregate factor changes—thereby isolating the causal effects of prioritizing logistics, production, trade, or sales capabilities. The resulting insights offer targeted strategic guidance for optimizing the resilience of the Sino-Russian timber supply chain, identifying which capability enhancements yield the most effective improvements under controlled resource allocation scenarios.

3. Results

3.1. Trends of Supply Chain Resilience in Sino-Russian Timber Trade

3.1.1. Determination of Evaluation Index Weight

According to the entropy weight method calculation results, the weights of the four capability indicators—Russian logistics and transportation capability, Russian Far East primary processing capability, Sino-Russian timber import–export capability, and Heilongjiang furniture sales capability—are 23.195%, 14.178%, 15.613%, and 47.014%, respectively. Russian logistics and transportation capability holds a relatively higher weight in overall supply chain resilience, indicating a more pronounced impact on the supply chain system. Its information utility value of 0.197 (derived from an information entropy value of 0.803) signifies relatively low information concentration and a high degree of variability, which in turn underscores the critical role of logistics and transportation capabilities within the supply chain despite their inherent fluctuations. The Russian Far East primary processing capability indicator has a lower weight of 14.178%, exerting limited influence on overall resilience. With an information entropy value of 0.88, this indicator exhibits high information dispersion and poor stability, likely affected by multiple factors such as production capacity, forest resource endowments, and human resource availability. The Sino-Russian timber import–export capability, with a weight of 15.613%, is influenced by international market fluctuations and policy changes. Its information entropy value of 0.867 reflects moderate volatility in this capability dimension, positioning it as a moderately sensitive factor in cross-border supply chain dynamics. Notably, Heilongjiang furniture sales capability has the highest weight among the four indicators at 47.014%, paired with an information utility value of 0.399. This signifies a high degree of information concentration, indicating that terminal market sales exert the most substantial impact on the entire supply chain. The dominant weight of this indicator highlights the critical role of demand-side resilience in sustaining the Sino-Russian timber supply chain’s overall stability and value realization (Table 4).

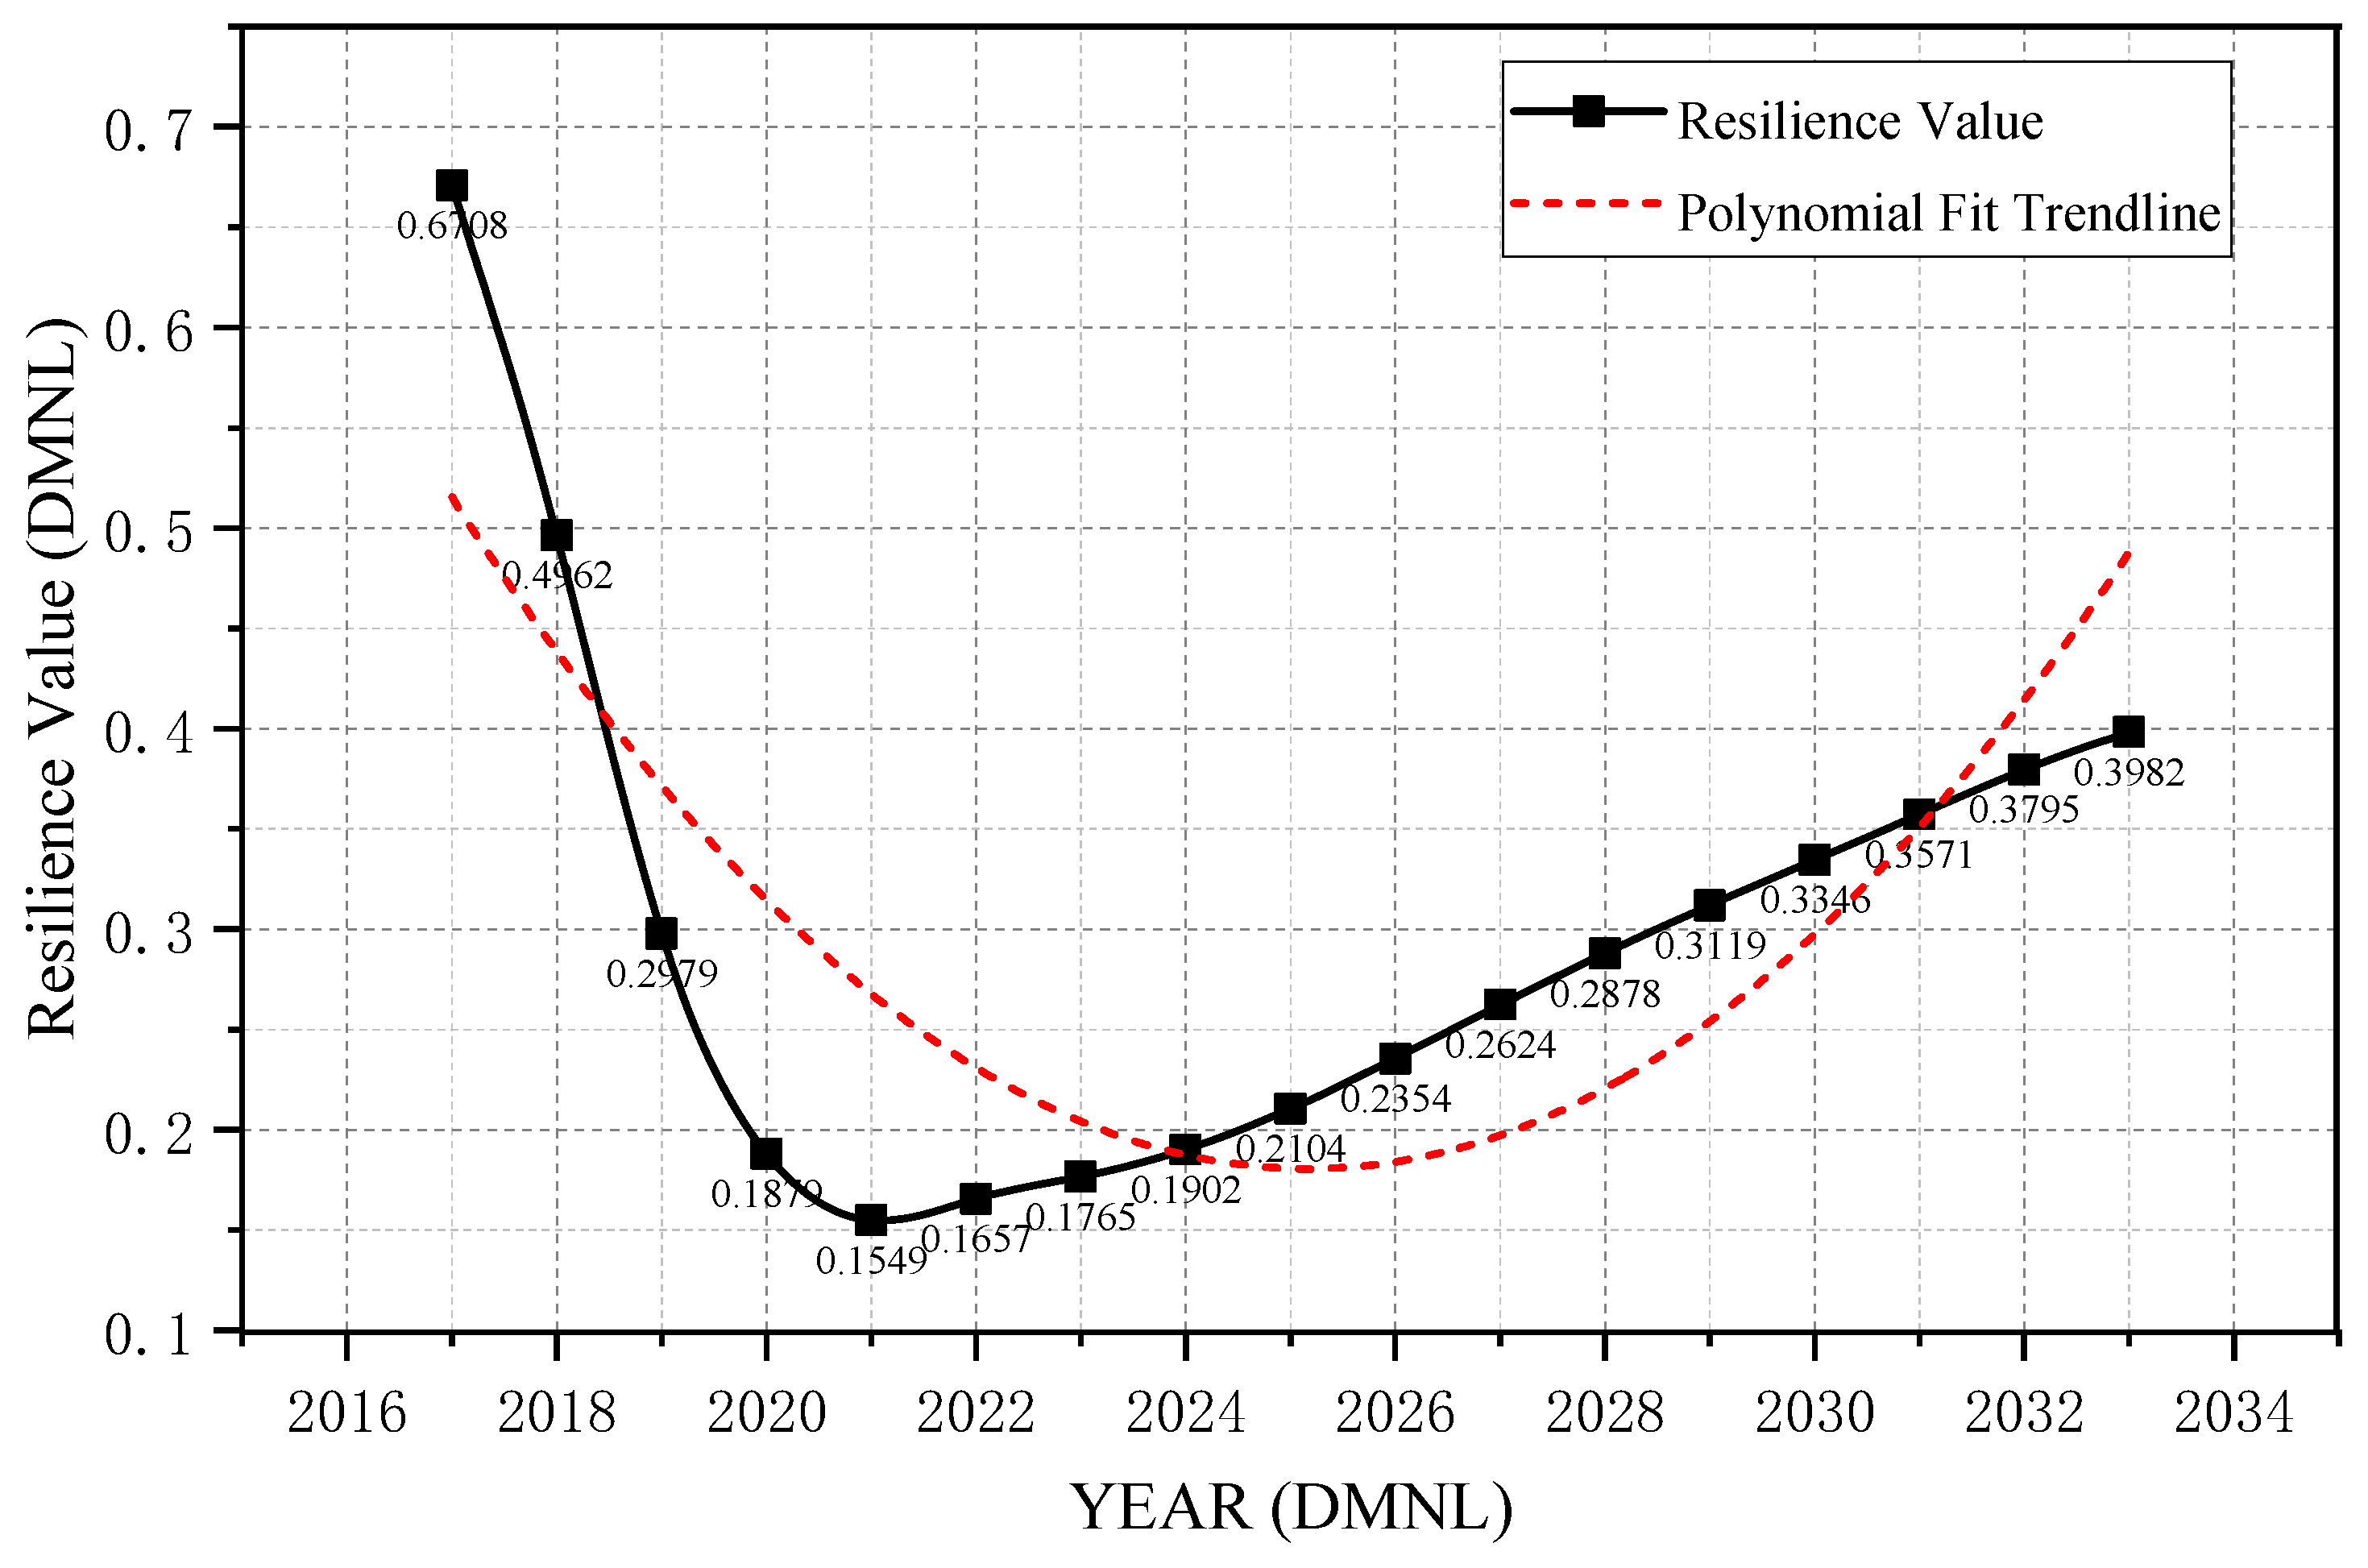
3.1.2. Supply Chain Resilience Trends Change

As shown in Figure 5, the graph illustrates the trend of Sino-Russian timber supply chain resilience from 2017 to 2033, with data derived from Table 5 (system dynamics model outputs) and processed via Z-score normalization and TOPSIS (as detailed in Section 2.4). The data labels represent annual resilience values, while the quadratic polynomial trend line captures dynamic evolution. This method provides a scientific quantitative framework for supply chain resilience assessment, suitable for dynamic evolution analysis of complex systems.
From 2017 to 2021, supply chain resilience showed a significant downward trend, decreasing from 0.6708 to 0.1549. The decline is primarily attributed to external environmental shocks during this period, including import–export policy adjustments, geopolitical impacts, and market fluctuations, which collectively led to a significant deterioration in import–export and sales capabilities. After 2021, the resilience value gradually rebounded, reaching 0.3982 in 2033, indicating that the supply chain has achieved steady development through long-term resource integration, logistics optimization, and improvements in collaborative mechanisms. The upward trajectory of the quadratic trend line predicts that the resilience of the Sino-Russian timber supply chain will continue to increase. This positive outlook stems from the strengthening of resource complementarity between the two sides—Russia’s rich forest resources paired with China’s stable and large market demand—and enhanced collaborative capabilities to adapt to changes in the international environment.

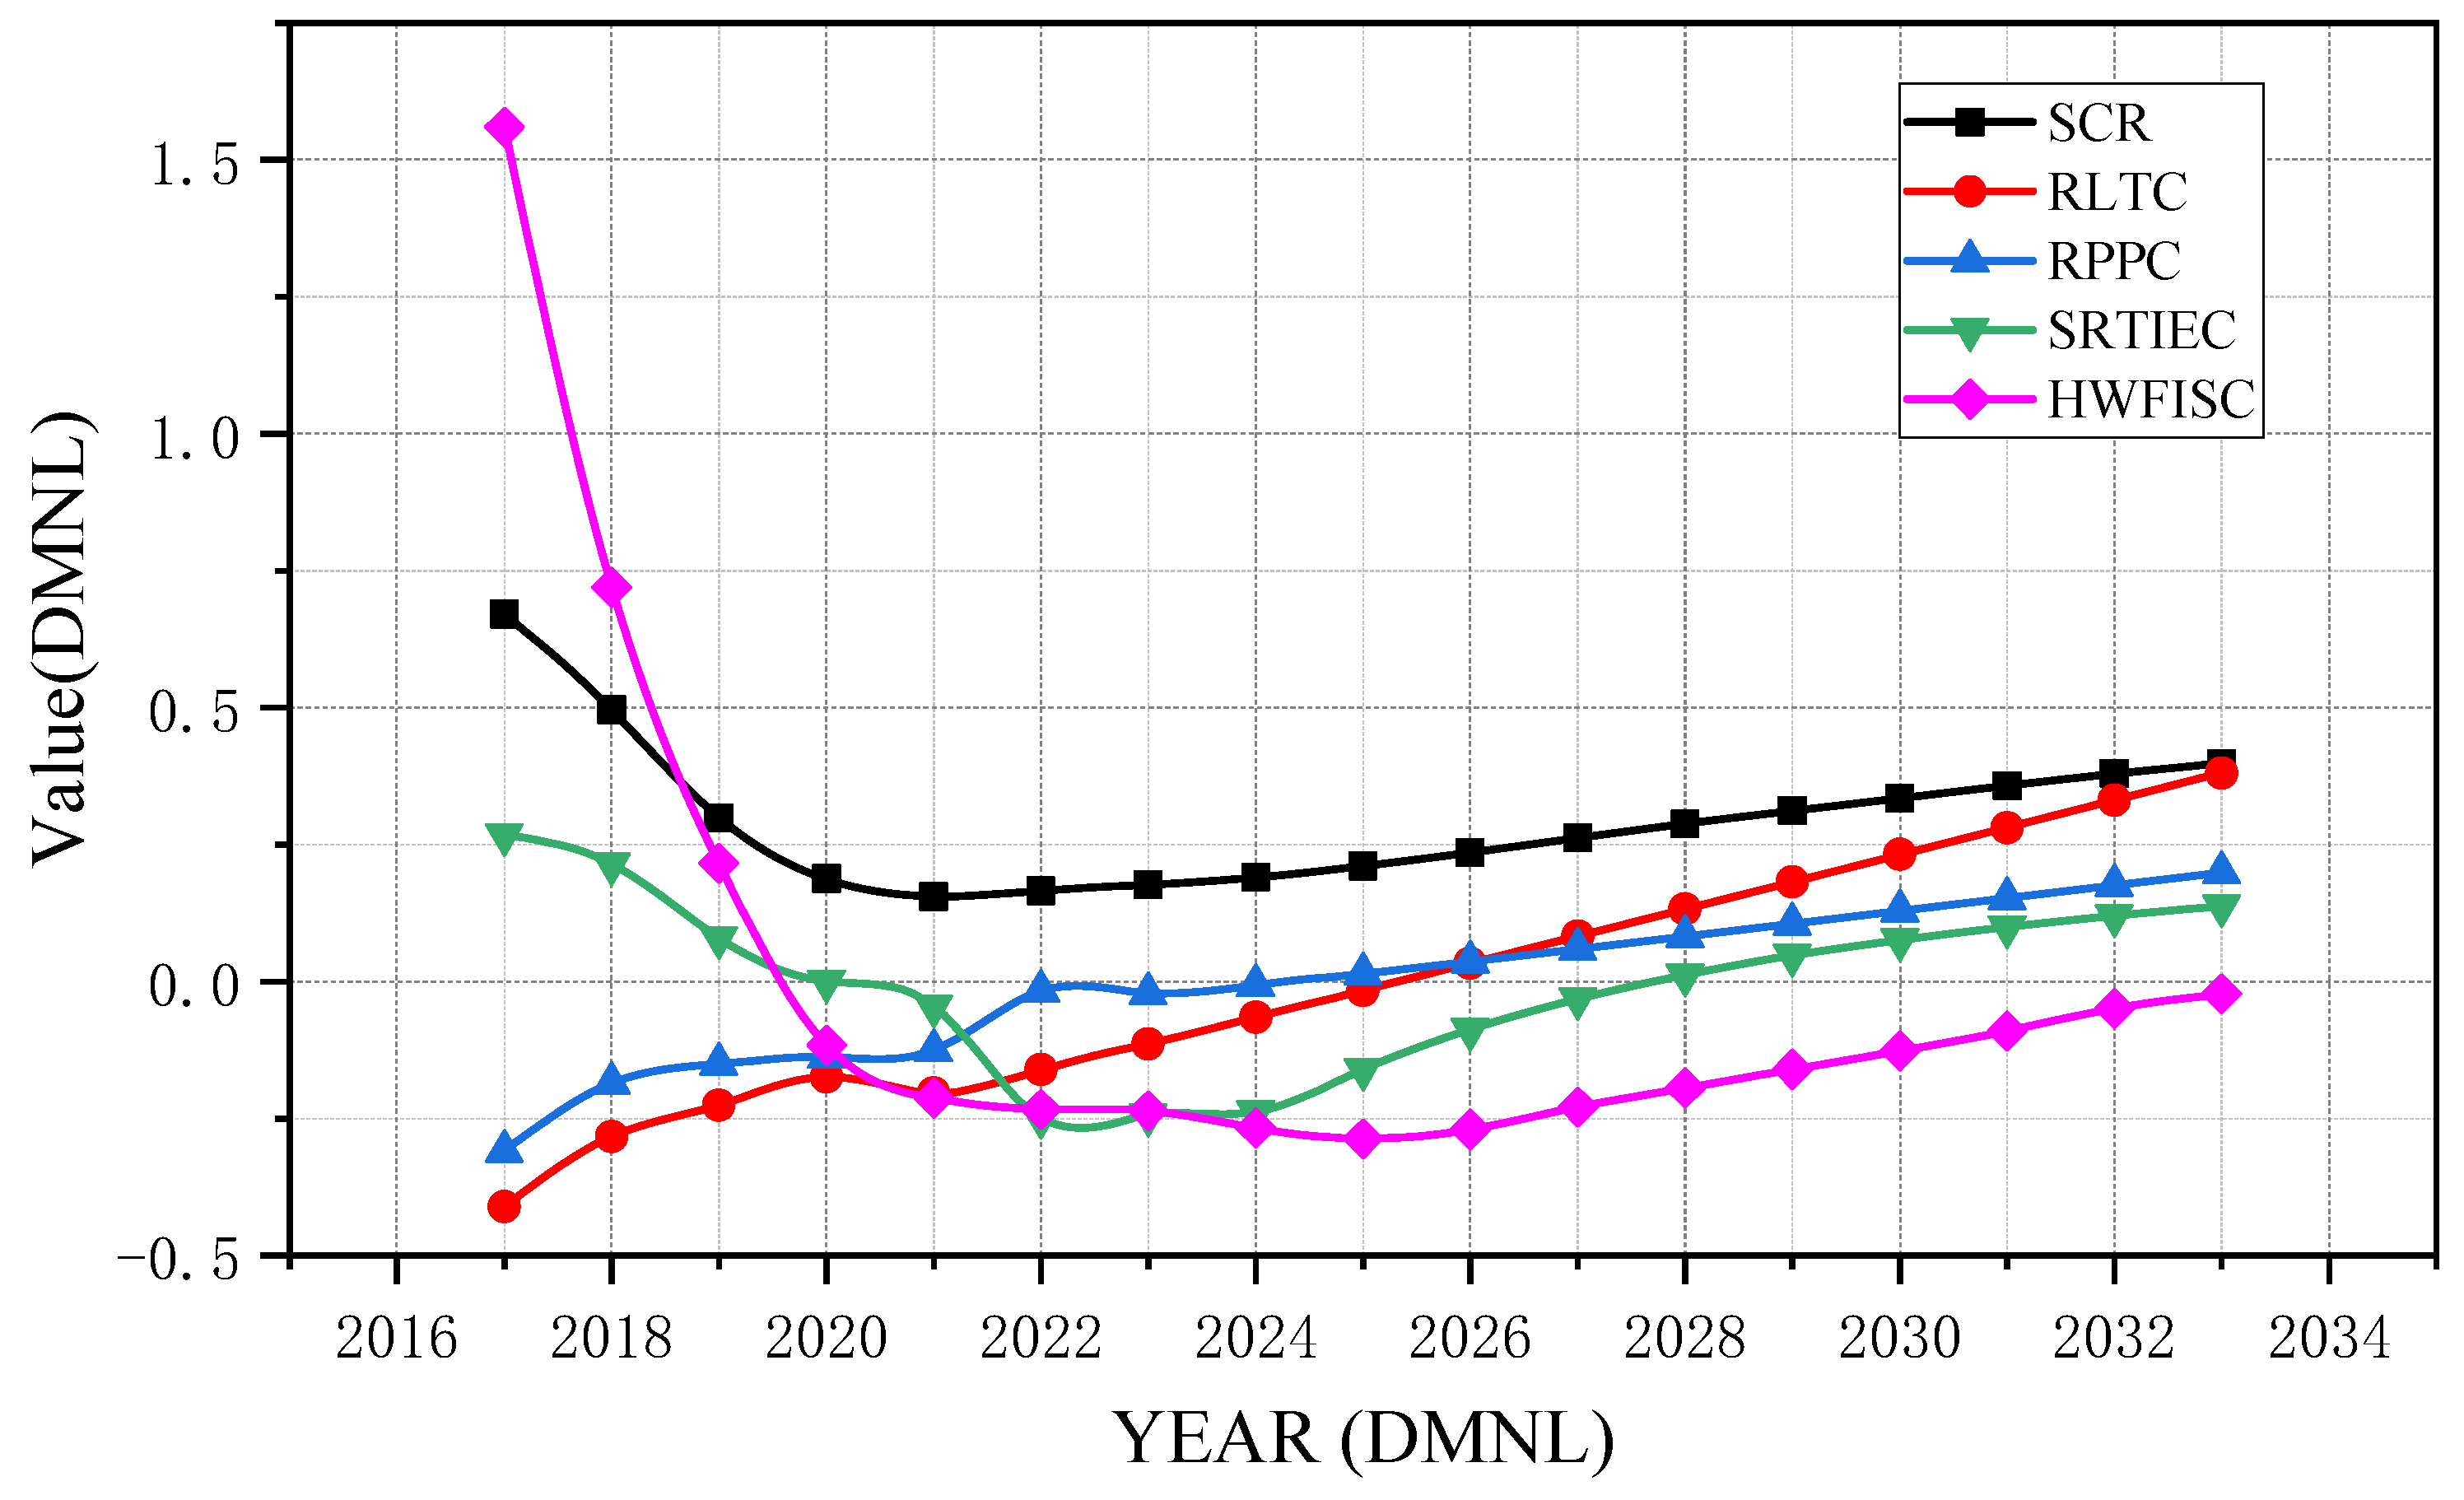
3.1.3. Subsystem Capability and Supply Chain Resilience Trends Change

The figure shows the trend of each subsystem indicator’s weighted normalized value against overall supply chain resilience (2017–2033). It highlights the close correlation between subsystem changes and overall resilience fluctuations, outlining the supply chain’s dynamic evolutionary pattern (Figure 6).
Russian logistics and transportation capacity (red line) shows a steady upward trend. In 2021, the fluctuation in logistics capacity coincided with the lowest point of overall resilience, indicating that instability in the transportation chain moderately pulled down overall resilience; its subsequent significant increase strongly aligns with the steady rise in overall resilience, highlighting logistics capacity as a critical support factor for system resilience. The Russian Far East primary processing capacity (green line) grows gradually, with its stable upward trend forming a synergistic effect with the later-stage stabilization of overall resilience, serving as an important internal driver supporting resilience. Import-export capacity (blue line) fluctuates in the early period due to external factors, showing a correlation with early fluctuations in overall resilience that reflects the impact of trade link uncertainties; its late-stage upward trend echoes the smooth development of overall resilience, demonstrating that post-adjustment resource allocation in trade links strengthens resilience. Heilongjiang furniture sales capacity (pink line) declined significantly, with its downward trend forming a unique correlation with the “first decline, then stabilization” pattern of overall resilience: the continuous sales decline after 2017 contrasts with the early downward fluctuation of overall resilience, while its trend roughly aligns with the later-stage stabilization of overall resilience.
The synergistic effects of the four subsystems contribute to the stabilization of overall resilience after early-stage fluctuation adaptation, collectively constructing a dynamic balance and risk-resistant system for the Sino-Russian timber supply chain. This profoundly embodies the principle of subsystem interaction and mutual influence in system dynamics, ultimately determining the fluctuating trend of overall system resilience. The figure provides a rich visual basis and logical support for an in-depth analysis of supply chain fluctuations and resilience mechanisms, underscoring the importance of holistic subsystem coordination in enhancing supply chain robustness.

3.2. Simulation and Specific Analysis of China–Russia Supply Chain Fluctuation Scenarios

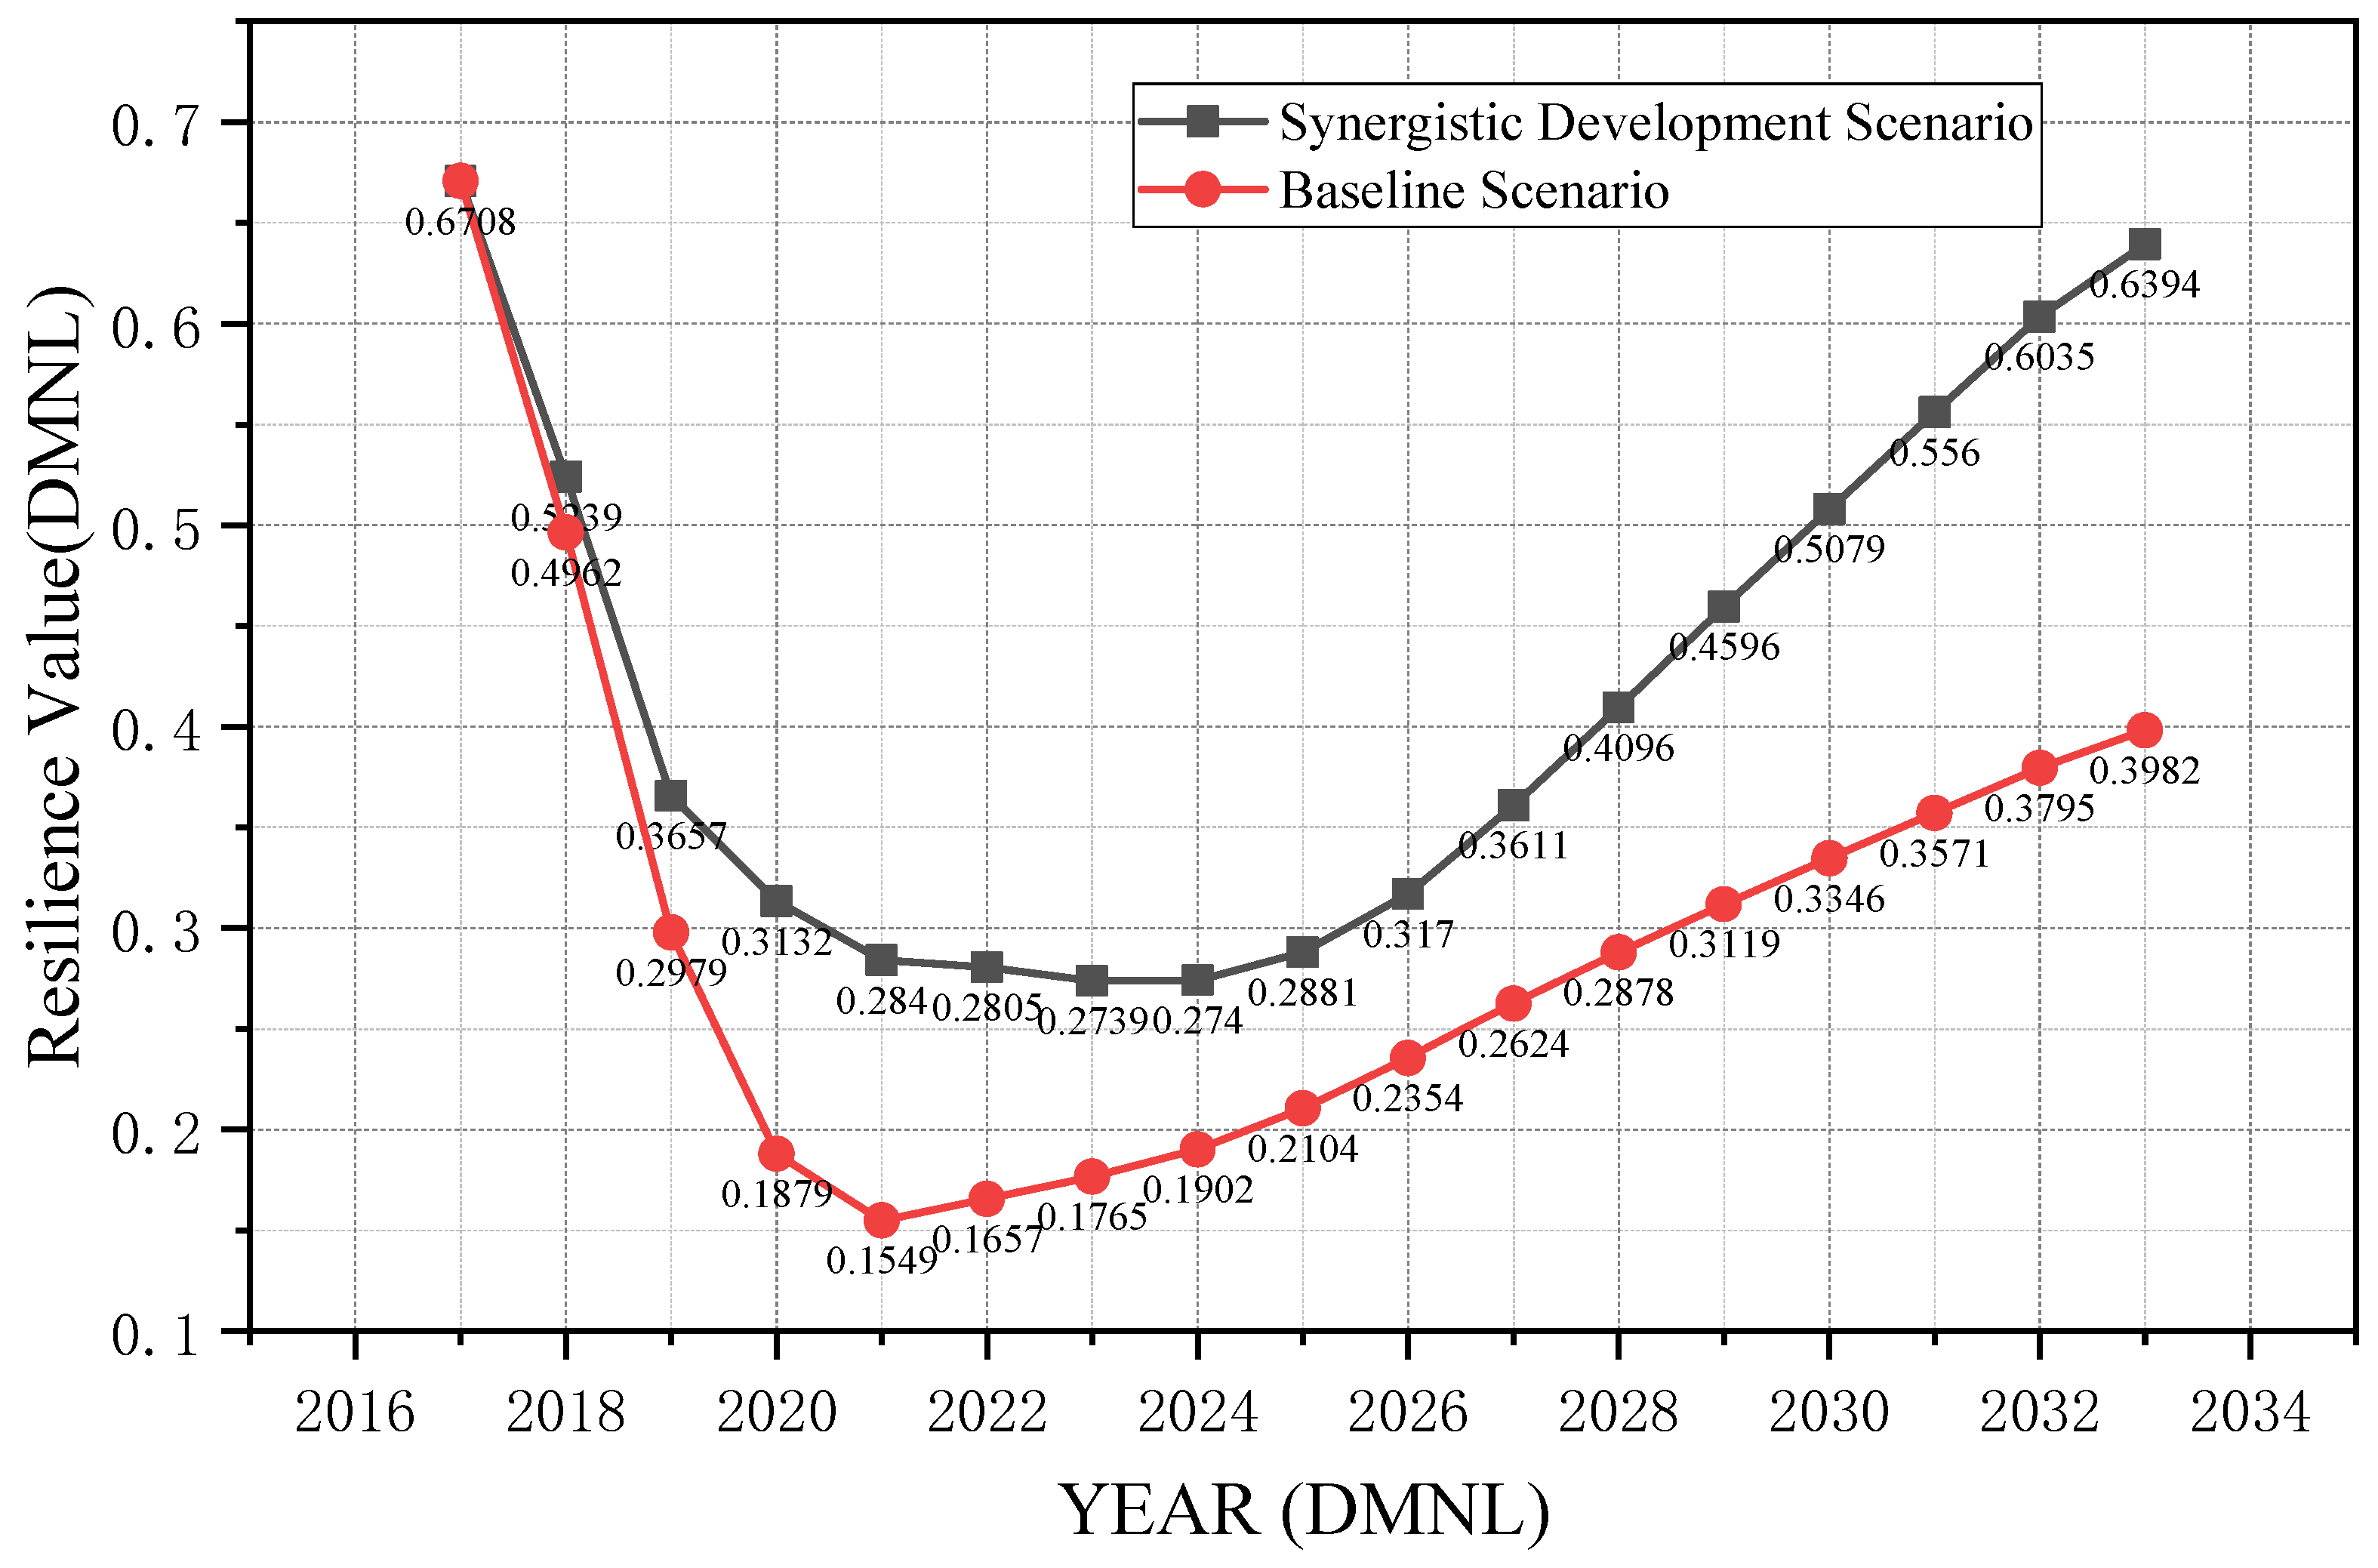
3.2.1. Resilience Analysis in the Context of Collaborative Development

As shown in the figure (Figure 7), during the early period (2017–2022), the baseline scenario (blue line) and the synergistic development scenario (red line) exhibit distinct resilience characteristics. Analyzed below from the dimensions of resistance and recovery capacity:
Resistance: In the early stage (2017–2022), the baseline scenario’s resilience value declines rapidly, demonstrating weaker resistance to external shocks or systemic changes—it struggles to maintain supply chain resilience effectively. In contrast, the synergistic development scenario experiences a gentler decline, exhibiting stronger resistance. Under the synergistic development model, collaboration and resource integration across supply chain segments enhance the system’s risk response capabilities, better buffer early-stage shocks, and maintain resilience stability. This moderate decline indicates that holistic capability improvements create a more robust shock-absorbing mechanism, reducing the amplitude of resilience degradation compared to the baseline.
Recovery Capacity: The baseline scenario recovers slowly after its early sharp decline, reflecting the limited ability to bounce back from shocks—its post-disruption adjustment process is inefficient, delaying the return to stable resilience levels. Conversely, the synergistic development scenario rises rapidly in the later stage after initial fluctuations, showcasing stronger recovery dynamics. This indicates that the synergistic model enables the supply chain to adjust and recover more swiftly following shocks: by leveraging the complementary strengths of interconnected links, the system accelerates resilience rebound, embodying superior adaptive capacity. The rapid upward trajectory signifies that collaborative improvements not only mitigate initial shocks but also foster a self-reinforcing recovery mechanism.
The synergistic development scenario outperforms the baseline in both resistance and recovery capacity, demonstrating better overall stability. This highlights that a strategy prioritizing cross-link collaboration and resource integration effectively enhances the supply chain’s ability to (1) withstand risks through distributed shock absorption, (2) sustain long-term development through balanced capability growth, and (3) recover swiftly via synergistic adjustments. These findings provide a robust basis for optimizing supply chain strategy, emphasizing that integrated development, rather than isolated improvements, is key to building a resilient Sino-Russian timber supply chain capable of navigating complex external uncertainties.

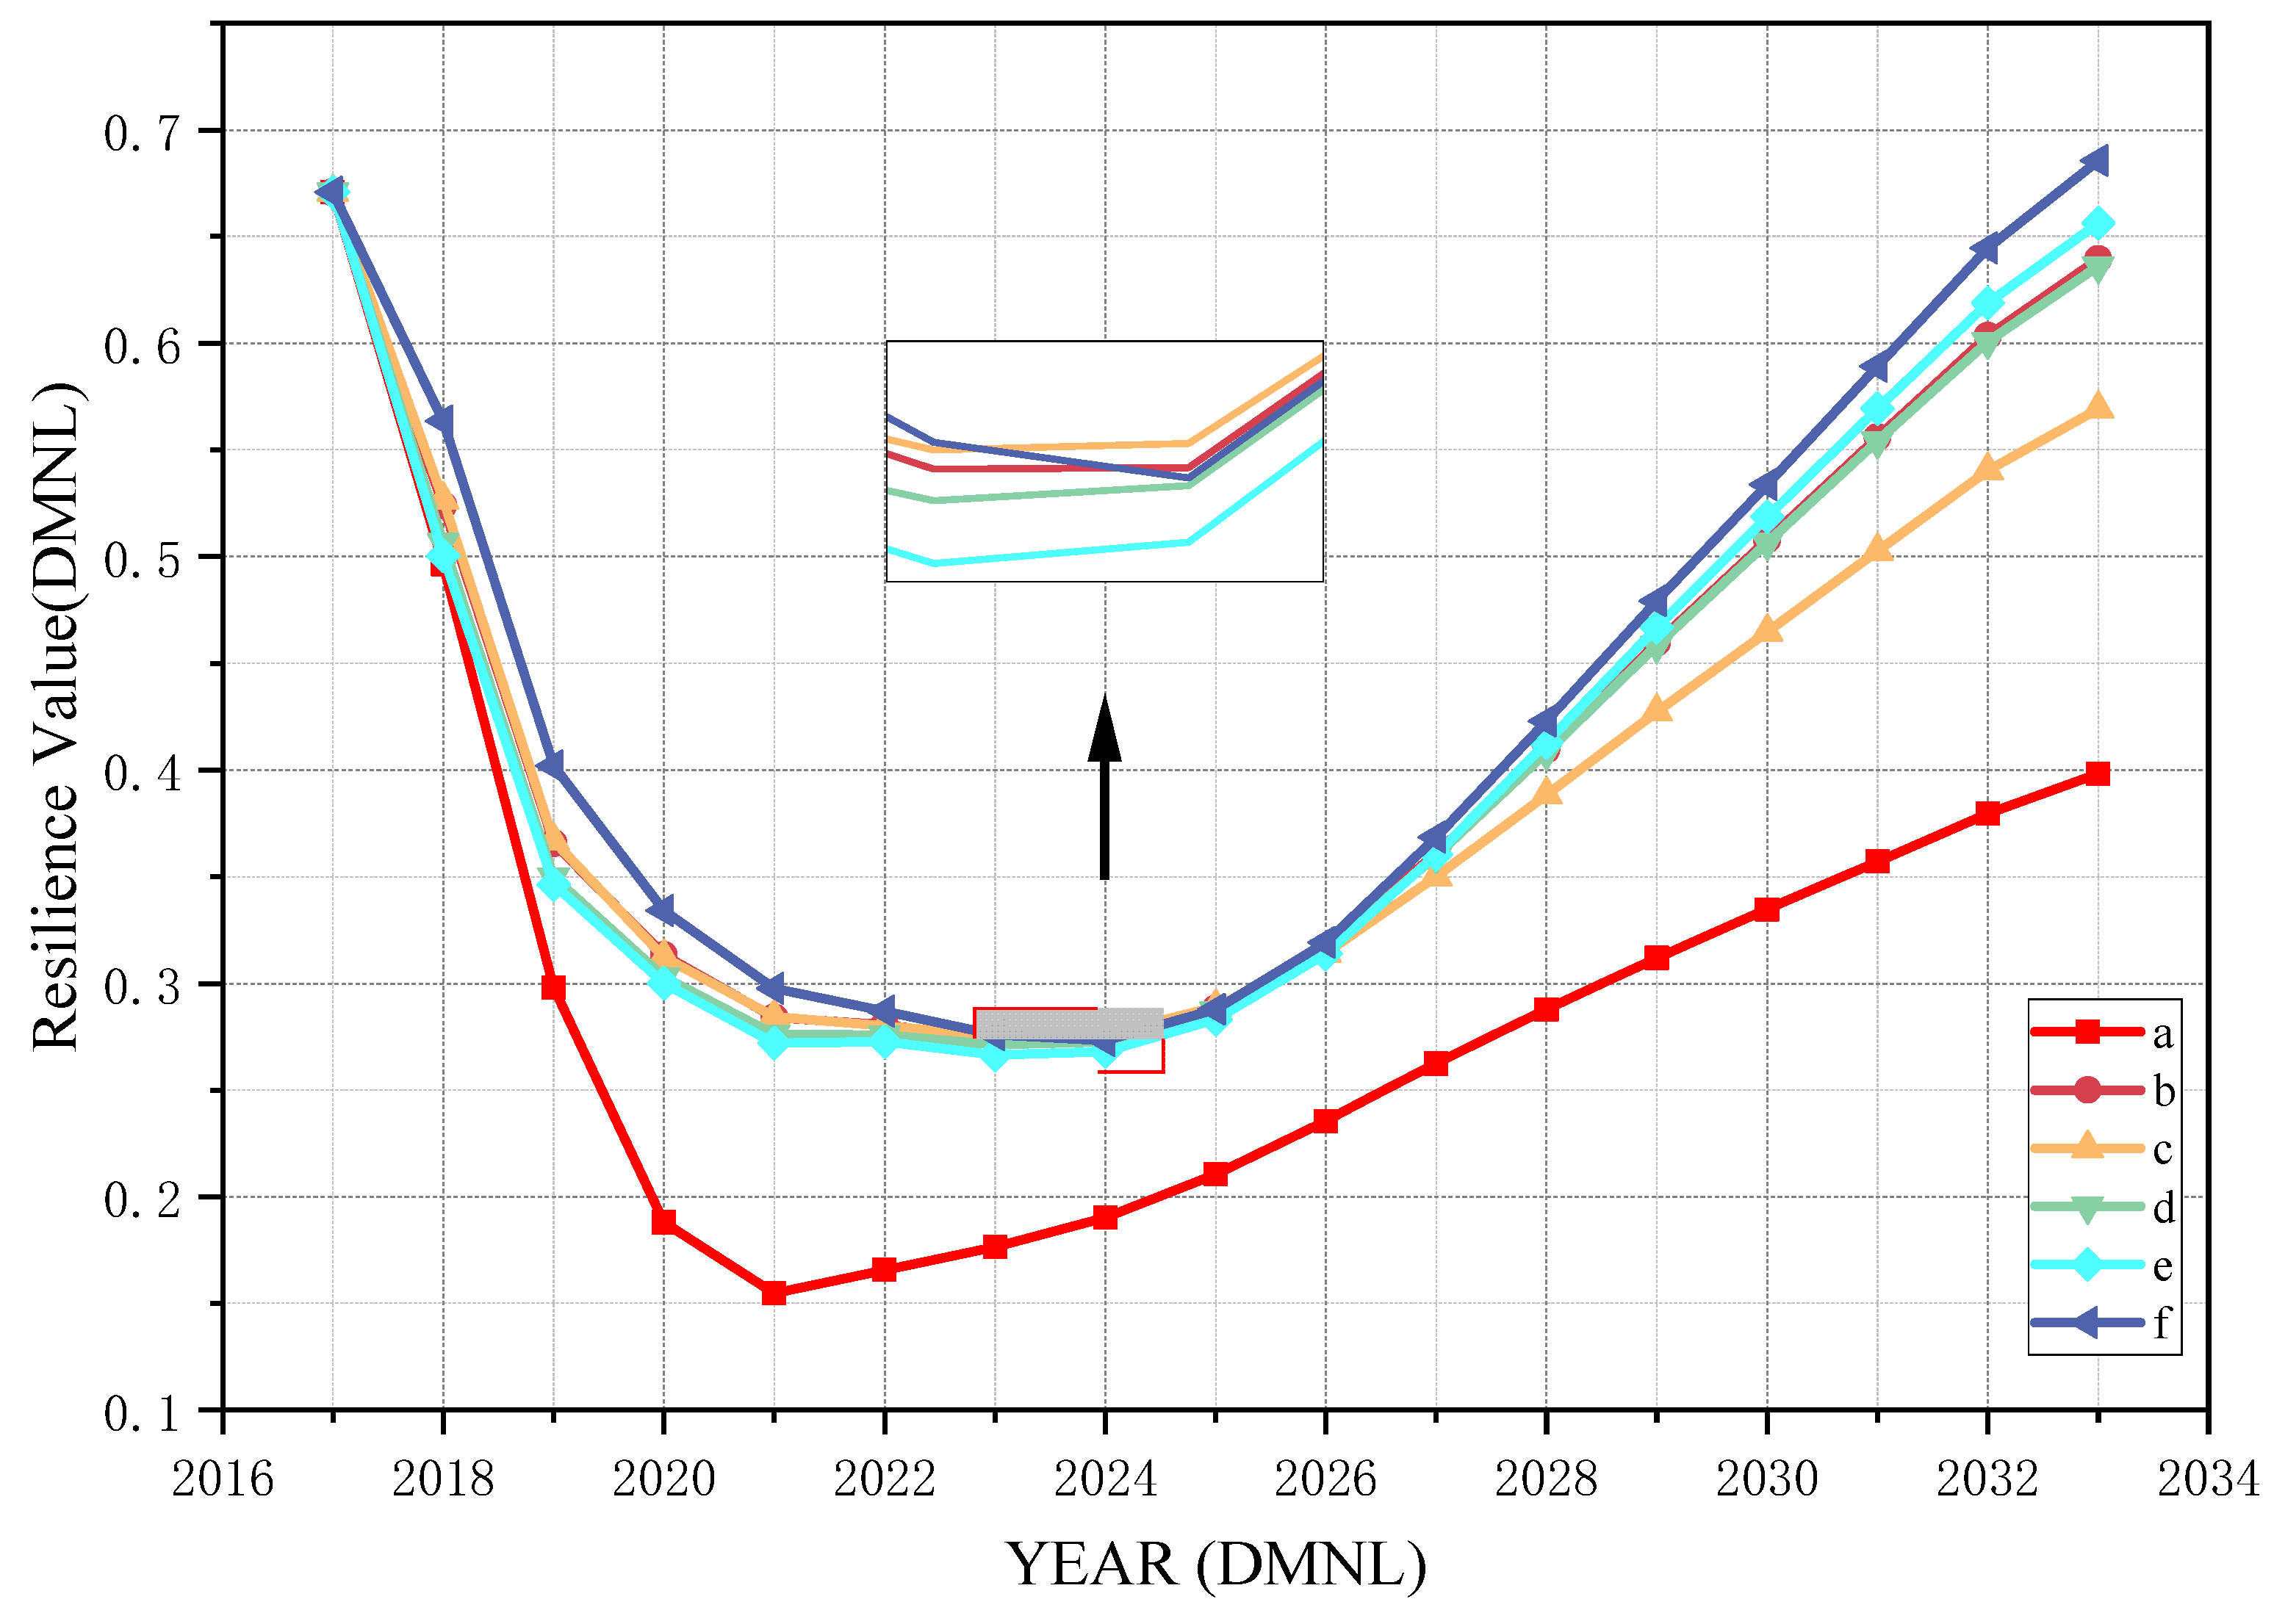
3.2.2. Resilience Change Analysis in All Scenarios

In the multi-scenario comparative analysis, supply chains under different development strategies exhibit notable disparities in resistance (shock absorption capacity) and recovery capacity (post-disruption rebound capability). These disparities offer critical insights into how each strategy influences supply chain resilience, facilitating the identification of targeted optimization directions. By quantifying these dimensional differences—such as minimum resilience values, decline rates, and recovery speeds across scenarios—this analysis highlights the strategic priorities that most effectively strengthen the dual capacities of withstanding external shocks and accelerating post-disturbance recovery, providing a data-driven foundation for resilience-oriented strategy formulation (Figure 8 and Table 6).
Resistance Analysis: In terms of resistance, the logistics-first scenario (minimum resilience value of 0.2754, decline rate of 58.9%) ranks highest, indicating that strengthening the logistics link effectively enhances the supply chain’s shock-absorption capacity and reduces the risk of drastic resilience fluctuations. The synergistic development scenario (minimum value 0.2739, decline 59.2%) and sales-priority scenario (minimum value 0.2732, decline 59.3%) follow closely, forming shock buffers through multi-link collaboration and demand-side optimization, respectively. The import/export-priority scenario (minimum value 0.2664, declining 60.3%) exhibits slightly weaker resistance due to its sensitivity to the international import/export environment. In stark contrast, the baseline scenario—with a minimum value of only 0.1549 and a steep decline of 76.9%—highlights the supply chain’s vulnerability under an unfocused strategy, underscoring the necessity of targeted capability enhancement to boost resilience.
Recovery Capacity Analysis: Regarding recovery capacity, the sales-priority scenario leads with an annual recovery rate of 0.0458, demonstrating the strongest post-shock rebound ability and indicating that demand-side strategies have the most pronounced long-term restorative effect on supply chain resilience. The import/export-priority scenario (0.0389) and production-priority scenario (0.0365) follow, suggesting that focusing on these segments accelerates supply chain recovery from disruptions. The logistics-priority (0.0294) and synergistic development (0.0332) scenarios exhibit moderately lower recovery rates by comparison. The baseline scenario has the lowest recovery rate at 0.0203, with the slowest rebound process, further highlighting the critical role of strategic focus in enhancing supply chain self-healing. These results indicate that strategies prioritizing sales, production, or import/export are more advantageous for improving resilience, while logistics and collaborative strategies offer relative stability but lack prominence in recovery capacity, and the baseline strategy lags significantly in both dimensions.
Overall, the sales-priority scenario is the most effective in driving resilience. Comparative analysis across scenarios reveals that logistics-focused strategies offer significant advantages in resistance, with the smallest decline in minimum resilience values, making them ideal for enhancing short-term shock resistance and coping with sudden disruption risks (Table 4). Sales- or import/export-focused strategies excel in recovery capacity, featuring higher annual recovery rates that facilitate rapid post-shock rebound and align with long-term sustainable development goals. Strategy selection should align with practical needs, balancing resistance and recovery objectives. For environments with high-frequency short-term shocks, prioritizing logistics network strengthening is advisable; for continuous resilience improvement, tilting toward demand-side or import/export-side capabilities can drive rapid post-disturbance recovery. By achieving a dynamic balance between resistance and recovery, these strategic choices enable systematic optimization of the Sino-Russian timber supply chain’s resilience, ensuring adaptability to both immediate disruptions and long-term evolutionary challenges.

4. Discussion and Limitations

The Sino-Russian timber supply chain is a complex system that spans multiple processes and involves a diverse array of stakeholders. It commences with timber harvesting and processing in Russia, followed by cross-border transportation, and concludes with furniture manufacturing and distribution in China. The resilience of this supply chain can be understood through several key dimensions, each closely tied to the specific capabilities of the nodes within the supply chain. Unlike previous studies that examined resilience from a theoretical standpoint, our research focuses on the practical aspects of supply chain nodes, including processing, transportation, import/export, and sales. This node-based perspective offers a more nuanced view of resilience, emphasizing both the resistance and recovery capabilities of each component.
Our findings can be interpreted through the lens of supply chain resilience theory, which underscores the importance of resistance and recovery capabilities. The strong short-term shock resistance of Russian logistics and the optimal long-term recoverability of the Heilongjiang sales division demonstrate the effectiveness of supply chain structure and operational design in enhancing resilience. This supports the theoretical framework proposed by He et al. (2025) and Zhu et al. (2020) [25,32], which highlights the interplay between supply chain structure and capabilities in determining resilience.
Our study addresses a gap in the existing literature by examining these dimensions of resilience from a supply chain node perspective. This enables a more precise identification of the strengths and weaknesses of each node and facilitates the development of targeted strategies to improve overall resilience. We employ system dynamics to model the interdependencies between nodes and develop a simulation framework to evaluate resilience under various scenarios. The system dynamics model allows us to simulate different scenarios and observe how changes in one node can affect others, helping to identify potential vulnerabilities and test the effectiveness of resilience-building strategies.
Despite the study’s contributions, several limitations should be acknowledged. First, the model primarily focuses on the core sequence of “production—transportation—importation—exportation—sales” and does not fully capture the decision-making behaviors of nodal firms. Second, while the model incorporates economic indicators (e.g., GDP, tariffs, market prices) to reflect routine systemic influences, it lacks dynamic simulations of extreme external economic policy shocks (e.g., global recession, abrupt price collapses). Third, the current model prioritizes the basic framework and core variables but does not explicitly simulate environmental stressors such as deforestation regulations and carbon emissions trading. Future research should incorporate indicators like forest carbon sequestration capacity and sustainable harvesting rates to comprehensively evaluate supply chain resilience under climate policies. Finally, while the model provides a robust framework for trend analysis, it cannot fully account for black swan events (e.g., unexpected geopolitical conflicts in the future, extreme weather) or rapid policy changes in the future; these events could quickly worsen the optimistic outlook. These limitations highlight the need for hybrid modeling approaches that integrate real-time data feeds and expert judgment to improve predictive accuracy for abrupt shocks.
It is clearly stated that our next long-term work is to conduct risk simulation analysis. In the future, relevant risks (e.g., resource depletion, labor shortage, trade policy shift, etc) will be simulated to simulate how they cascade in the supply chain nodes, and negative scenario simulation experiments will be conducted to analyze the changes in the supply chain under negative scenarios. Additionally, we will also integrate risk simulations of economic downturns, price volatility, and currency fluctuations. These enhancements will provide a more comprehensive assessment of how supply chain nodes, such as Russian logistics and Sino-Russian trade, interact under negative economic shocks. This approach complements our current focus on routine resilience dynamics and aligns with emerging trends in supply chain modeling. Moreover, future research could incorporate agent-based modeling (ABM) to simulate the strategic interactions and game behaviors of diverse stakeholders under shocks, enhancing the model’s micro-level explanatory power. Lastly, constructing a policy matrix to quantify the effects of different policy combinations on supply chain resilience would provide a more nuanced understanding of policy-mediated resilience optimization. These directions would help bridge the gaps identified in the current study and further advance the field of supply chain resilience research.

5. Conclusions

(1)
Dynamic Evolution of Supply Chain Resilience Characteristics
From 2017 to 2033, the resilience of the Sino-Russian timber supply chain exhibited a “first decline, then recovery” fluctuating trend: influenced by external shocks in 2021, resilience dropped to a low of 0.1549; after 2021, a gradual rebound occurred through resource integration and link optimization, reaching 0.3982 in 2033. The quadratic trend line indicates that long-term resilience continues to strengthen, reflecting the supply chain’s adaptive capacity to external disturbances and internal structural improvements.
(2)
Resilience Differences Across Multi-Scenario Strategies
Resistance: The Russian logistics-priority scenario demonstrated the best shock resistance, with the highest minimum resilience value (0.2754) and smallest decline rate (58.9%), leveraging the stability of logistics infrastructure to buffer external shocks. In contrast, the baseline scenario showed the weakest resistance (minimum value 0.1549, decline rate 76.9%), highlighting the vulnerability of non-targeted strategies to abrupt disruptions.
Recovery Capacity: The sales-priority scenario of Heilongjiang province (China) led with the highest annual recovery rate (0.0458), achieving rapid post-shock rebound through demand-side pull effects. The Sino-Russia import/export-priority (0.0389) and Russian primary processing production-priority (0.0365) scenarios followed, indicating that focusing on trade and production links accelerates recovery. The recovery scenario of logistics and coordinated development is moderate.
(3)
Strengthening Core Links for Differentiated Resilience Strategies
Short-Term Shock Resistance (Logistics Prioritization): Relying on China’s “14th Five-Year Plan for Port Development” and Russia’s “National Plan for the Development of the Far East and Arctic Regions”, enhancing Sino-Russian cross-border logistics infrastructure, expanding warehousing at the Suifenhe Port, and upgrading the Far East railway network [50]. Increase logistics workforce retention and capability by implementing improved welfare policies and training employees [51]. This will stabilize Russian freight volume, reduce Sino-Russian transportation disruption risks, and ensure robust short-term resilience against sudden shocks. Long-Term Sustainability (Sales/Import-Export Prioritization): Leveraging the opportunities of the “Belt and Road Digital Silk Road” initiative, boost the brand competitiveness of Heilongjiang’s wooden furniture industry by expanding China’s domestic markets through e-commerce platforms, reducing over-reliance on foreign import supply [52]. Simultaneously, in accordance with the Regional Comprehensive Economic Partnership (RCEP), promote the implementation of tariff preferences, customs facilitation policies, and establish long-term trade agreements with Russia to stabilize import/export policy expectations [53], enhancing the supply chain’s adaptability to international market fluctuations and supporting sustained resilience growth. Prioritizing logistics for short-term shock absorption and sales/import–export for long-term recovery, thereby achieving a dynamic balance between resistance and adaptive capacity in the Sino-Russian timber supply chain.

Author Contributions

Wood Supply Chain and Model Conceptualization, C.M. and C.L.; System Dynamics Modeling, C.M. and C.L.; Model Analysis, J.F.; Data Collation, J.F. and L.Z. Writing-Original Draft Preparation, C.M. and C.L.; Writing-Review and Editing, C.M. and C.L.; Visualization, L.Z.; Project Management, C.M.; Funding Acquisition, C.M. All authors have read and agreed to the published version of the manuscript.

Funding

Supported by the Natural Science Foundation of Heilongjiang Province (LH2023G002).

Data Availability Statement

The datasets used and analyzed during the current study are available from the corresponding author on reasonable request.

Conflicts of Interest

The authors declare no conflict of interest.

References

  1. Hui, C.; Yue, Z.; Gang, T. Study on Quality Measurement and Influencing Factors of Russian Wood Forest Products Imported from China under the Background of High—Quality Development. Sustainability 2023, 15, 2164. [Google Scholar]
  2. Qin, Y. Research on Forest Ecological Issues in Russia. Master’s Thesis, Heilongjiang University, Harbin, China, 2024. [Google Scholar]
  3. Chen, J. China May Be the Only Viable Market for Russian Timber. China For. Ind. 2022, 59. (In Chinese) [Google Scholar]
  4. Cui, H.; Liu, M. Research on Resource Dynamics in the Ninth National Forest Inventory of China. J. West China For. Sci. 2020, 49, 90–95. (In Chinese) [Google Scholar] [CrossRef]
  5. Ke, S.; Qiao, D.; Zhang, X.; Feng, Q. Changes of China’s Forestry and Forest Products Industry over the Past 40 Years and Challenges Lying Ahead. For. Policy Econ. 2021, 123, 102352. [Google Scholar] [CrossRef]
  6. Miao, H. Overview of China’s Timber Imports in 2023 and the Past Decade. Green China 2024, 54, 55. Available online: https://kns.cnki.net/kcms2/article/abstract?v=__pNPjlwk1pO-GMnZQ615DAOZ1H49G_L6-VvBntMM_jUTdjD332Ka-ySAkJQz9W7QlMG0OclNAGMUyoDDhhcBhGrubde-OLnV7uk2OnHw5hW-lNPODkoAVNRlsQTPZCMvsp6ZYDBx9TpkSy2wDAnVdbGDnBGHJXDkG9dMvyMkVTXL3TfxSOBweEtyZqKhwnHrWvpkenPGkk=&uniplatform=NZKPT (accessed on 1 July 2025). (In Chinese).
  7. Gao, Y. Study on the Trade Scale and Influencing Factors of China’s Import of Russian Wood Forest Products. Master’s Thesis, Northeast Forestry University, Harbin, China, 2022. [Google Scholar]
  8. Narins, T.P. Dynamics of the Russia–China Forest Products Trade. Growth Chang. 2015, 46, 688–703. [Google Scholar] [CrossRef]
  9. Bernard, M.S. The Concept of Resilience Revisited. Disasters 2006, 30, 433–450. [Google Scholar]
  10. Taylor, I.W.; Hossain, N.U.I. A System Dynamics Model of Organizational Resilience. INCOSE Int. Symp. 2024, 34, 1184–1195. [Google Scholar] [CrossRef]
  11. Yu, Z.; Li, Z.; Ma, L. Strategies for the Resilience of Power—Coal Supply Chains in Low—Carbon Energy Transition: A System Dynamics Model and Scenario Analysis of China up to 2060. Sustainability 2023, 15, 7154. [Google Scholar] [CrossRef]
  12. Mcalister, M.M.; Murali, P.S.; Zhang, Q.; Wells, E.C.; Mohebbi, S. Improving and Quantifying Organizational Resilience for Sustainable Management of Critical Infrastructures: A Multi—Level System Dynamics Approach. Int. J. Disaster Risk Reduct. 2024, 115, 105079. [Google Scholar] [CrossRef]
  13. Guo, N.; Wu, F.; Sun, D.; Shi, C.; Gao, X. Mechanisms of Resilience in Cities at Different Development Phases: A System Dynamics Approach. Urban Clim. 2024, 53, 101793. [Google Scholar] [CrossRef]
  14. Li, W.; Jiang, R.; Wu, H.; Xie, J.; Zhao, Y.; Song, Y.; Li, F. A System Dynamics Model of Urban Rainstorm and Flood Resilience to Achieve the Sustainable Development Goals. Sustain. Cities Soc. 2023, 96, 104265. [Google Scholar] [CrossRef]
  15. Zhang, J.; Wang, T. Urban Resilience under the COVID-19 Pandemic: A Quantitative Assessment Framework Based on System Dynamics. Cities 2023, 136, 104265. [Google Scholar] [CrossRef]
  16. Götz, P.; Auping, W.L.; Krapels, S.H. Contributing to Health System Resilience during Pandemics via Purchasing and Supply Strategies: An Exploratory System Dynamics Approach. BMC Health Serv. Res. 2024, 24, 130. [Google Scholar] [CrossRef] [PubMed]
  17. Caetano, H.O.; Desuó, L.; Fogliatto, M.S.; Maciel, C.D. Resilience assessment of critical infrastructures using dynamic Bayesian networks and evidence propagation. Reliab. Eng. Syst. Saf. 2024, 241, 109691. [Google Scholar] [CrossRef]
  18. Tang, J.; Heinimann, H.; Han, K.; Luo, H.; Zhong, B. Evaluating Resilience in Urban Transportation Systems for Sustainability: A Systems—Based Bayesian Network Model. Transp. Res. C Emerg. Technol. 2020, 121, 102840. [Google Scholar] [CrossRef]
  19. Jomthanachai, S.; Wong, W.; Lim, C. A Coherent Data Envelopment Analysis to Evaluate the Efficiency of Sustainable Supply Chains. IEEE Trans. Eng. Manag. 2023, 70, 294–311. [Google Scholar] [CrossRef]
  20. Wang, S.L.; Chen, C.; Zhang, J.H.; Luan, S.Y. Resilience Analysis of Interconnected Public Transportation Systems Based on Complex Networks. Complex Syst. Complex. Sci. 2022, 19, 47–54. (In Chinese) [Google Scholar] [CrossRef]
  21. Miao, C.; Na, M.; Chen, H.; Ding, M. Urban Resilience Evaluation Based on Entropy—TOPSIS Model: A Case Study of County—Level Cities in Ningxia, Northwest China. Int. J. Environ. Sci. Technol. 2024, 22, 4187–4202. [Google Scholar] [CrossRef]
  22. Wang, Y. Comprehensive Evaluation of Community Public—Health—Safety Resilience Based on Entropy—TOPSIS Method. MEDS Public Health Prev. Med. 2022, 2, 1–15. [Google Scholar]
  23. Wang, Y.; Peng, D.; Bo, T.; Zhao, X.; Bo, J. A Comprehensive Evaluation Method for Assessing the Seismic Resilience of Building Sites Based on the TOPSIS Model and the Entropy Method. Buildings 2024, 14, 3667. [Google Scholar] [CrossRef]
  24. Zhang, Y.; Tian, R.; Peng, L.; Yu, X.; Wang, Y. Fire Safety Resilience Assessment of Residential Self—Built Houses According to the TOPSIS Method. Sustainability 2023, 15, 12417. [Google Scholar] [CrossRef]
  25. He, Y.Q.; Ou, Y.; Meng, J.Q. Study on the Measurement of China’s Regional Supply Chain Resilience and Its Spatial—Temporal Differentiation Characteristics. Soft Sci. 2025, 1–17. (In Chinese) [Google Scholar]
  26. Lin, J.C.; Chan, W.H.; Wu, M.S. A bibliometric analysis of timber supply chain research. J. For. Res. 2025, 30, 11–21. [Google Scholar] [CrossRef]
  27. Veronika, A.; Peter, R. Wood Supply Chain Risks and Risk Mitigation Strategies: A Systematic Review Focusing on the Northern Hemisphere. Biomass Bioenergy 2021, 148, 106059. [Google Scholar]
  28. Mao, X.Y.; Chen, Y.; Qu, X.Y.; Liang, Y.Y. Research Progress on International Timber Source Tracing Technology. World For. Res. 2024, 37, 31–36. (In Chinese) [Google Scholar] [CrossRef]
  29. Han, Y.K.; Ma, C.L.; Li, C.P.; Shao, X.R. Study on the Optimization of Sustainable Supply Chain for Timber Processing Enterprises in Heilongjiang Province. For. Eng. 2021, 37, 137–144. (In Chinese) [Google Scholar] [CrossRef]
  30. Ming, Z.X. In—Depth Exploration of the Development Path of Guangxi Furniture Supply Chain. China For. Ind. 2022, 80–83. (In Chinese) [Google Scholar]
  31. Lin, Q.P.; Cai, Y.; Zhang, N. A Comparative Study of Supply Chain Resilience Research at Home and Abroad Based on CiteSpace. Logist. Res. 2025, 36–43. (In Chinese) [Google Scholar]
  32. Zhu, L.; Chen, J.Y.; Yuan, J.F. Study on Key Influencing Factors of Prefabricated Building Supply Chain Resilience Based on ISM. J. Civ. Eng. Manag. 2020, 37, 108–114. (In Chinese) [Google Scholar] [CrossRef]
  33. Singh, R.K.; Modgil, S.; Acharya, P. Assessment of Supply Chain Flexibility Using System Dynamics Modeling. Glob. J. Flex. Syst. Manag. 2019, 20, 39–63. [Google Scholar] [CrossRef]
  34. Liu, W.; Liu, Z. Simulation analysis of supply chain resilience of prefabricated building projects based on system dynamics. Buildings 2023, 13, 2629. [Google Scholar] [CrossRef]
  35. Spiegler, V.L.M.; Naim, M.M.; Wikner, J. A control engineering approach to the assessment of supply chain resilience. Int. J. Prod. Res. 2012, 50, 6162–6187. [Google Scholar] [CrossRef]
  36. Rebs, T.; Brandenburg, M.; Seuring, S. System Dynamics Modeling for Sustainable Supply Chain Management: A Literature Review and Systems Thinking Approach. J. Clean. Prod. 2019, 208, 1265–1280. [Google Scholar] [CrossRef]
  37. Kuse, H.; Endo, A.; Iwao, E. Logistics Facility, Road Network and District Planning: Establishing Comprehensive Planning for City Logistics. Procedia Soc. Behav. Sci. 2010, 2, 6251–6263. [Google Scholar] [CrossRef]
  38. Zhang, M.; Sun, M.; Bi, D.; Liu, T. Green Logistics Development Decision—Making: Factor Identification and Hierarchical Framework Construction. IEEE Access 2020, 8, 127897–127912. [Google Scholar] [CrossRef]
  39. Verschuur, J.; Koks, E.E.; Hall, J.W. Port disruptions due to natural disasters: Insights into port and logistics resilience. Transp. Res. D Transp. Environ. 2020, 85, 102393. [Google Scholar] [CrossRef]
  40. Styrman, M.; Wibe, S. Wood Resources and Availability as Determinants of the Supply of Timber. Can. J. For. Res. 1986, 16, 256–259. [Google Scholar] [CrossRef]
  41. Garrido-Vega, P.; Jimenez, C.H.O.; de Los Ríos, J.L.D.P.; Morita, M. Implementation of Technology and Production Strategy Practices: Relationship Levels in Different Industries. Int. J. Prod. Econ. 2015, 161, 201–216. [Google Scholar] [CrossRef]
  42. Simeone, J. Timber Export Taxes and Trade Between Russia and China: Development of the Forestry Sector in the Russian Far East. For. Chron. 2012, 88, 585–592. [Google Scholar] [CrossRef]
  43. Wei, H.; Dong, M. Import—Export Freight Organization and Optimization in the Dry—Port—Based Cross—Border Logistics Network under the Belt and Road Initiative. Comput. Ind. Eng. 2019, 130, 472–484. [Google Scholar] [CrossRef]
  44. Oliinyk, O.; Grytsyshen, D.; Romanchenko, Y.; Tokarchuk, O.; Sedliakivska, K. Financial Consequences of Geopolitical Turmoil and Trade Restrictions. Afr. J. Appl. Res. 2025, 11, 439–455. [Google Scholar] [CrossRef]
  45. Ma, C.; Zhang, L.; Gao, X.; Liu, C. Modelling and Evaluating Wood Supply Chain Resilience Factors Based on System Dynamics. Sci. Rep. 2025, 15, 16207. [Google Scholar] [CrossRef] [PubMed]
  46. Ding, Y.; Chen, S.; Zheng, Y.; Chai, S.; Nie, R. Resilience Assessment of China’s Natural Gas System Under Supply Shortages: A System Dynamics Approach. Energy 2022, 247, 123380. [Google Scholar] [CrossRef]
  47. Li, Z.; Luo, Z.; Wang, Y.; Fan, G.; Zhang, J. Suitability Evaluation System for the Shallow Geothermal Energy Implementation in Region by Entropy Weight Method and TOPSIS Method. Renew. Energy 2022, 184, 564–576. [Google Scholar] [CrossRef]
  48. Cabello-Solorzano, K.; Ortigosa de Araujo, I.; Peña, M.; Correia, L.; Tallón-Ballesteros, A.J. The Impact of Data Normalization on the Accuracy of Machine Learning Algorithms: A Comparative Analysis. In Proceedings of the 18th International Conference on Soft Computing Models in Industrial and Environmental Applications, Salamanca, Spain, 20–22 September 2023; pp. 344–353. [Google Scholar]
  49. Shirali, G.A.; Rashnoudi, P.; Salehi, V.; Ghanbari, S. A hierarchical assessment of resilience engineering indicators in petrochemical industries using AHP and TOPSIS. Hum. Factors Ergon. Manuf. Serv. Ind. 2023, 33, 3–26. [Google Scholar] [CrossRef]
  50. Yan, Y. The Transportation Cooperation Between Northeast China and the Russian Far East Under the Russia—Ukraine War. J. World Econ. 2024, 3, 64–73. [Google Scholar] [CrossRef]
  51. Ellinger, A.E.; Ketchen, D.J.; Hult, G.T.M.; Elmadağ, A.B.; Richey, R.G. Market Orientation, Employee Development Practices, and Performance in Logistics Service Provider Firms. Ind. Mark. Manag. 2007, 37, 353–366. [Google Scholar] [CrossRef]
  52. Wang, X.; Lu, Y. Optimization of Grain Import Market Layout in the Context of Food Security: A Study of Soybean in China. Front. Sustain. Food Syst. 2025, 9, 1549463. [Google Scholar] [CrossRef]
  53. Rodrik, D. What Do Trade Agreements Really Do? J. Econ. Perspect. 2018, 32, 73–90. [Google Scholar] [CrossRef]
Figure 1. Research framework.
Forests 16 01106 g001
Figure 2. Casual loop diagram. Deep red represents the Russian logistics subsystem, green represents the Russian wood initial processing subsystem, light red represents the Sino-Russian import-export trade subsystem, and blue represents the Heilongjiang sales subsystem. The arrows in this system denote positive and negative effects.
Forests 16 01106 g002
Figure 4. Stability test (a) Russian Logistics Transportation Capacity. (b) Russian Timber Supply. (c) Sino-Russian Timber Import–Export Capacity. Figure 4 is used to compare the changing trends of Baseline Value and Test Value over time (test points, unit: year). The test started in 2017, where “Test Point 1” corresponds to 2017 and “Test Point 6” corresponds to 2022.
Forests 16 01106 g004
Figure 5. Trends in the resilience of the timber supply chain in China and Russia.
Forests 16 01106 g005
Figure 6. Subsystem capability and supply chain resilience trends change (Legend: SCR: Sino-Russian Timber Supply; RLTC: Russian Logistics Transportation Capacity; RPPC: Russian Primary Timber Processing Capacity; SRTIEC: Sino-Russian Timber Import–Export Capacity; HWFISC: Heilongjiang Wooden Furniture Industry Sales Value).
Forests 16 01106 g006
Figure 7. Comparison of resilience in two scenarios.
Forests 16 01106 g007
Figure 8. Comparison of Resilience in Multi-Emotional Scenarios (Legend: a: Baseline Scenario; b: Production-Focused Development (Primary Processing) Scenario; c: Logistics-Focused Scenario; d: Synergistic Development Scenario; e: Trade-Focused Development (Import-Export) Scenario; f: Sales-Focused Development) Scenario.
Forests 16 01106 g008
Table 1. Supply chain resilience evaluation index system.
Capability DimensionDefinitionRepresentative IndicatorsData Description
Russian Logistics and Transportation CapabilityStability and efficiency of timber resource supply and cross-border transportation.Russian logistics freight volume (million tons)Freight volume reflects the carrying capacity of the logistics network and resource transportation efficiency; a stronger carrying capacity indicates greater logistics resilience.
Russian Primary Wood Processing CapabilityProduction capacity and technical level of Russian primary wood processing.Russian wood processing output (thousand cubic meters)Reflects the efficiency of raw material conversion and technical stability; stable output with high added value indicates strong risk resistance in the processing link, as it ensures a consistent supply of intermediate products despite external shocks.
Sino-Russian Timber Import-Export CapabilityPolicy adaptability and cross-border coordination efficiency in Sino-Russian timber trade.Sino-Russian timber import-export volume (ten million yuan)Import–export volume is significantly influenced by factors such as production volume, tariff policies, customs clearance efficiency, and bilateral trade agreements. Stable growth or low volatility in this indicator reflects strong resilience in the import–export link, indicating the system’s ability to maintain trade flows amid policy or market fluctuations.
Heilongjiang (China) Furniture Sales CapabilityTerminal market demand response and value realization capability.Heilongjiang furniture sales revenue (ten million yuan)Sales revenue reflects how furniture output responds to market fluctuations (e.g., real estate cycles, consumer upgrading) and supply chain changes. It captures the ability to balance production with consumer needs and maintain value realization in the supply chain’s terminal link.
Table 2. Error test diagram.
YearStatistical ClassificationRLTCRTSRPPCSRTIECHWFIOCHWFISC
2017Actual Value8072.60828.00252949.256595.52455.776
Predicted Value8072.60828.00252949.256595.5203455.7761
Error Rate0.00%0.00%0.00%0.00%0.00%0.00%
2018Actual Value8198.85825.39280.407870.435388.728277.866
Predicted Value8265.30828.00285851.163409.6494308.3466
Error Rate−0.80%−0.32%−1.61%2.26%−5.11%−9.89%
2019Actual Value8255.09825.05288.391671.999220.737171.288
Predicted Value8425.80826.00300624.662223.7785160.9171
Error Rate−2.03%−0.12%−3.87%7.58%−1.36%6.44%
2020Actual Value8306.71825.51291.32556.054209.929100.904
Predicted Value7959.60825.00293521.936226.214992.867
Error Rate4.36%0.06%−0.57%6.54%−7.20%8.65%
2021Actual Value8276.89826.20294.247488.968233.99380.528
Predicted Value8262.50824.00323534.697248.554877.166
Error Rate0.17%0.27%−8.90%−8.55%−5.86%4.36%
2022Actual Value8319.08827.04318.82190.581219.69576.108
Predicted Value8779.40825.00298181.406236.468383.018
Error Rate−5.24%0.25%6.99%5.06%−7.09%−8.32%
Notes: ① Variable Definitions: RLTC = Russian Logistics Transportation Capacity (million tons); RTS = Russian Timber Supply (billion cubic meters); RPPC = Russian Primary Timber Processing Capacity (thousand cubic meters); SRTIEC = Sino-Russian Timber Import–Export Capacity (CNY 10 million); HWFIOC = Heilongjiang Wooden Furniture Industry Output Value (CNY 10 million); HWFISC = Heilongjiang Wooden Furniture Industry Sales Value (CNY 10 million). ② Error Rate Calculation: Error Rate = (Predicted Value − Actual Value/Actual Value) × 100%, where negative values indicate underestimation and positive values indicate overestimation.
Table 3. Experimental simulation scenarios.
StrategySynergistic Development (%)Logistics—Focused Development (%)Production—Focused Development (%)Trade—Focused Development (%)Sales—Focused Development (%)
Russian Logistics Capacity Growth5080404040
Russian Timber Primary Processing Capacity Enhancement5040804040
Sino—Russian Timber Import—Expo Capacity Growth5040408040
Heilongjiang Furniture Sales Capacity Growth5040404080
Notes: Each percentage represents the prioritization weight assigned to different development strategies in the simulation.
Table 4. Weights of capability indicators for the Sino-Russian timber supply chain.
Capability DimensionInformation Entropy (e)Information Utility (d)Weight (%)
Russian logistics and transportation capability0.80.223.2
Russian Far East primary processing capability0.880.1214.18
Sino-Russian timber import-export capability0.870.1315.61
Heilongjiang furniture sales capability0.60.447.01
Notes: All weight values are rounded to two decimal places for readability. Original raw data (e.g., 23.195, 14.178, 15.613, 47.014, etc.) with higher precision for experimental calculations, ensuring consistency with the model’s numerical accuracy.
Table 5. Annual capacity indicators of the Sino-Russian timber supply chain (2017–2033).
YearLogistics Capacity
(Million Tons)
Primary Processing Capacity
(Thousand Cubic Meters)
Timber Import-Export Capacity
(CNY 10 Million)
Sales Capacity
(CNY 10 Million)
20178072.60252949.256455.776
20188198.85280.407870.435277.866
20198255.09288.391671.999171.288
20208306.71291.32556.054100.904
20218276.89294.247488.96880.528
20228319.08318.82190.58176.108
20238365.60317.844196.45675.573
20248413.66321.268205.89168.835
20258462.28325.993320.17464.852
20268511.05331.099426.31568.404
20278559.93336.331508.63477.009
20288608.85341.608573.35584.348
20298657.78346.909625.05991.585
20308706.66352.223667.12698.639
20318755.58357.558702.07106.51
20328804.51362.911731.75115.111
20338853.45368.282757.541120.795
Notes: ① Derived from system dynamics model simulation, providing initial quantitative input data for resilience assessment. ② Units are specified in column headers for clarity.
Table 6. Comparative analysis of scenarios.
Scenario TypeResistance
(Minimum Value, Decline Rate)
Recovery Capacity
(Annual Rate)
Baseline Scenario0.1549 (76.9%)0.0203
Synergistic Development0.2739 (59.2%)0.0332
Logistics-Focused Development0.2754 (58.9%)0.0294
Production-Focused Development0.2714 (59.5%)0.0365
Import/Export-Focused0.2664 (60.3%)0.0389
Sales-Focused Development0.2732 (59.3%)0.0458
Note: Resistance and recovery capacity are dimensionless indices ranging from 0 to 1, where a lower resistance value indicates higher vulnerability to external shocks, and a higher recovery capacity value reflects faster post-shock system recovery.
Disclaimer/Publisher’s Note: The statements, opinions and data contained in all publications are solely those of the individual author(s) and contributor(s) and not of MDPI and/or the editor(s). MDPI and/or the editor(s) disclaim responsibility for any injury to people or property resulting from any ideas, methods, instructions or products referred to in the content.

