
City-Scale Revegetation Strategies Impact on the Temperature-Related Long-Term Mortality: A Quantitative Assessment in Three Cities in Southern Europe

 ,
,  ,
,  ,
,  , ,
, ,  ,
,  ,
,  and
and 
Abstract
1. Introduction
2. Methodology
2.1. Modelling System, Setup and Performance Evaluation
2.2. Vegetation Scenarios
- Baseline (SVR): intended to represent the current situation (year 2015) (see [56] for further details);
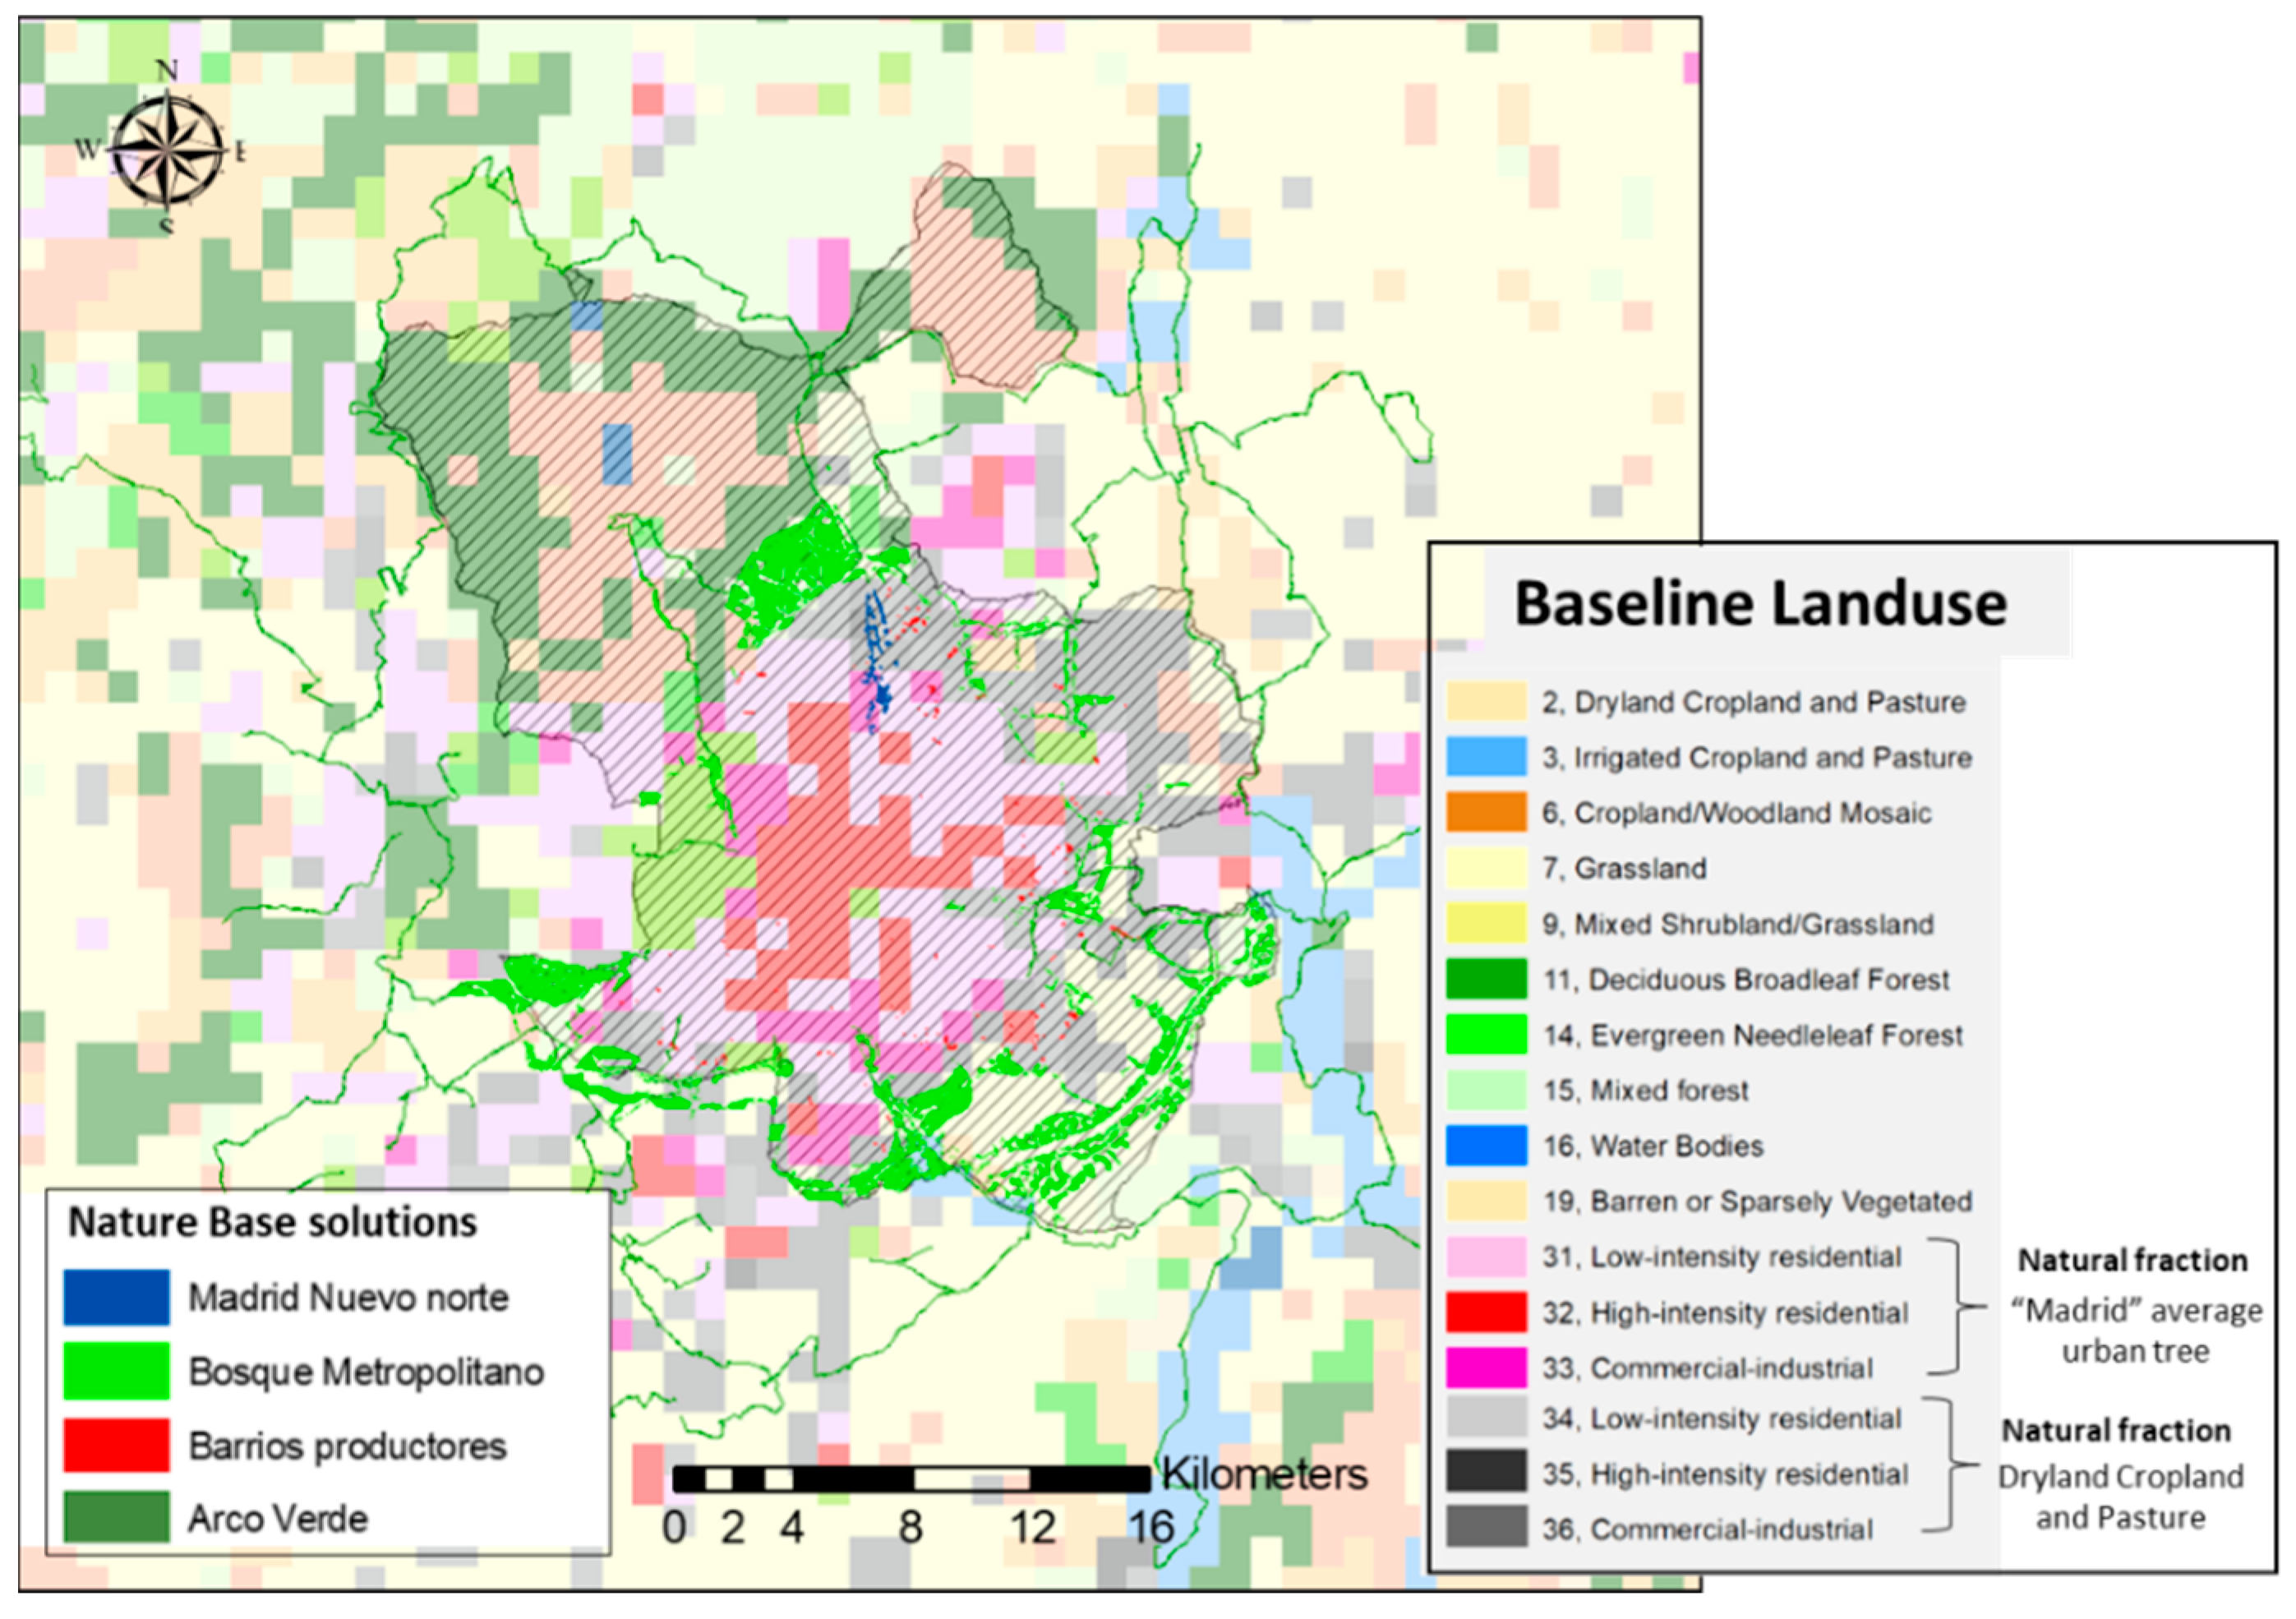
2.2.1. Madrid
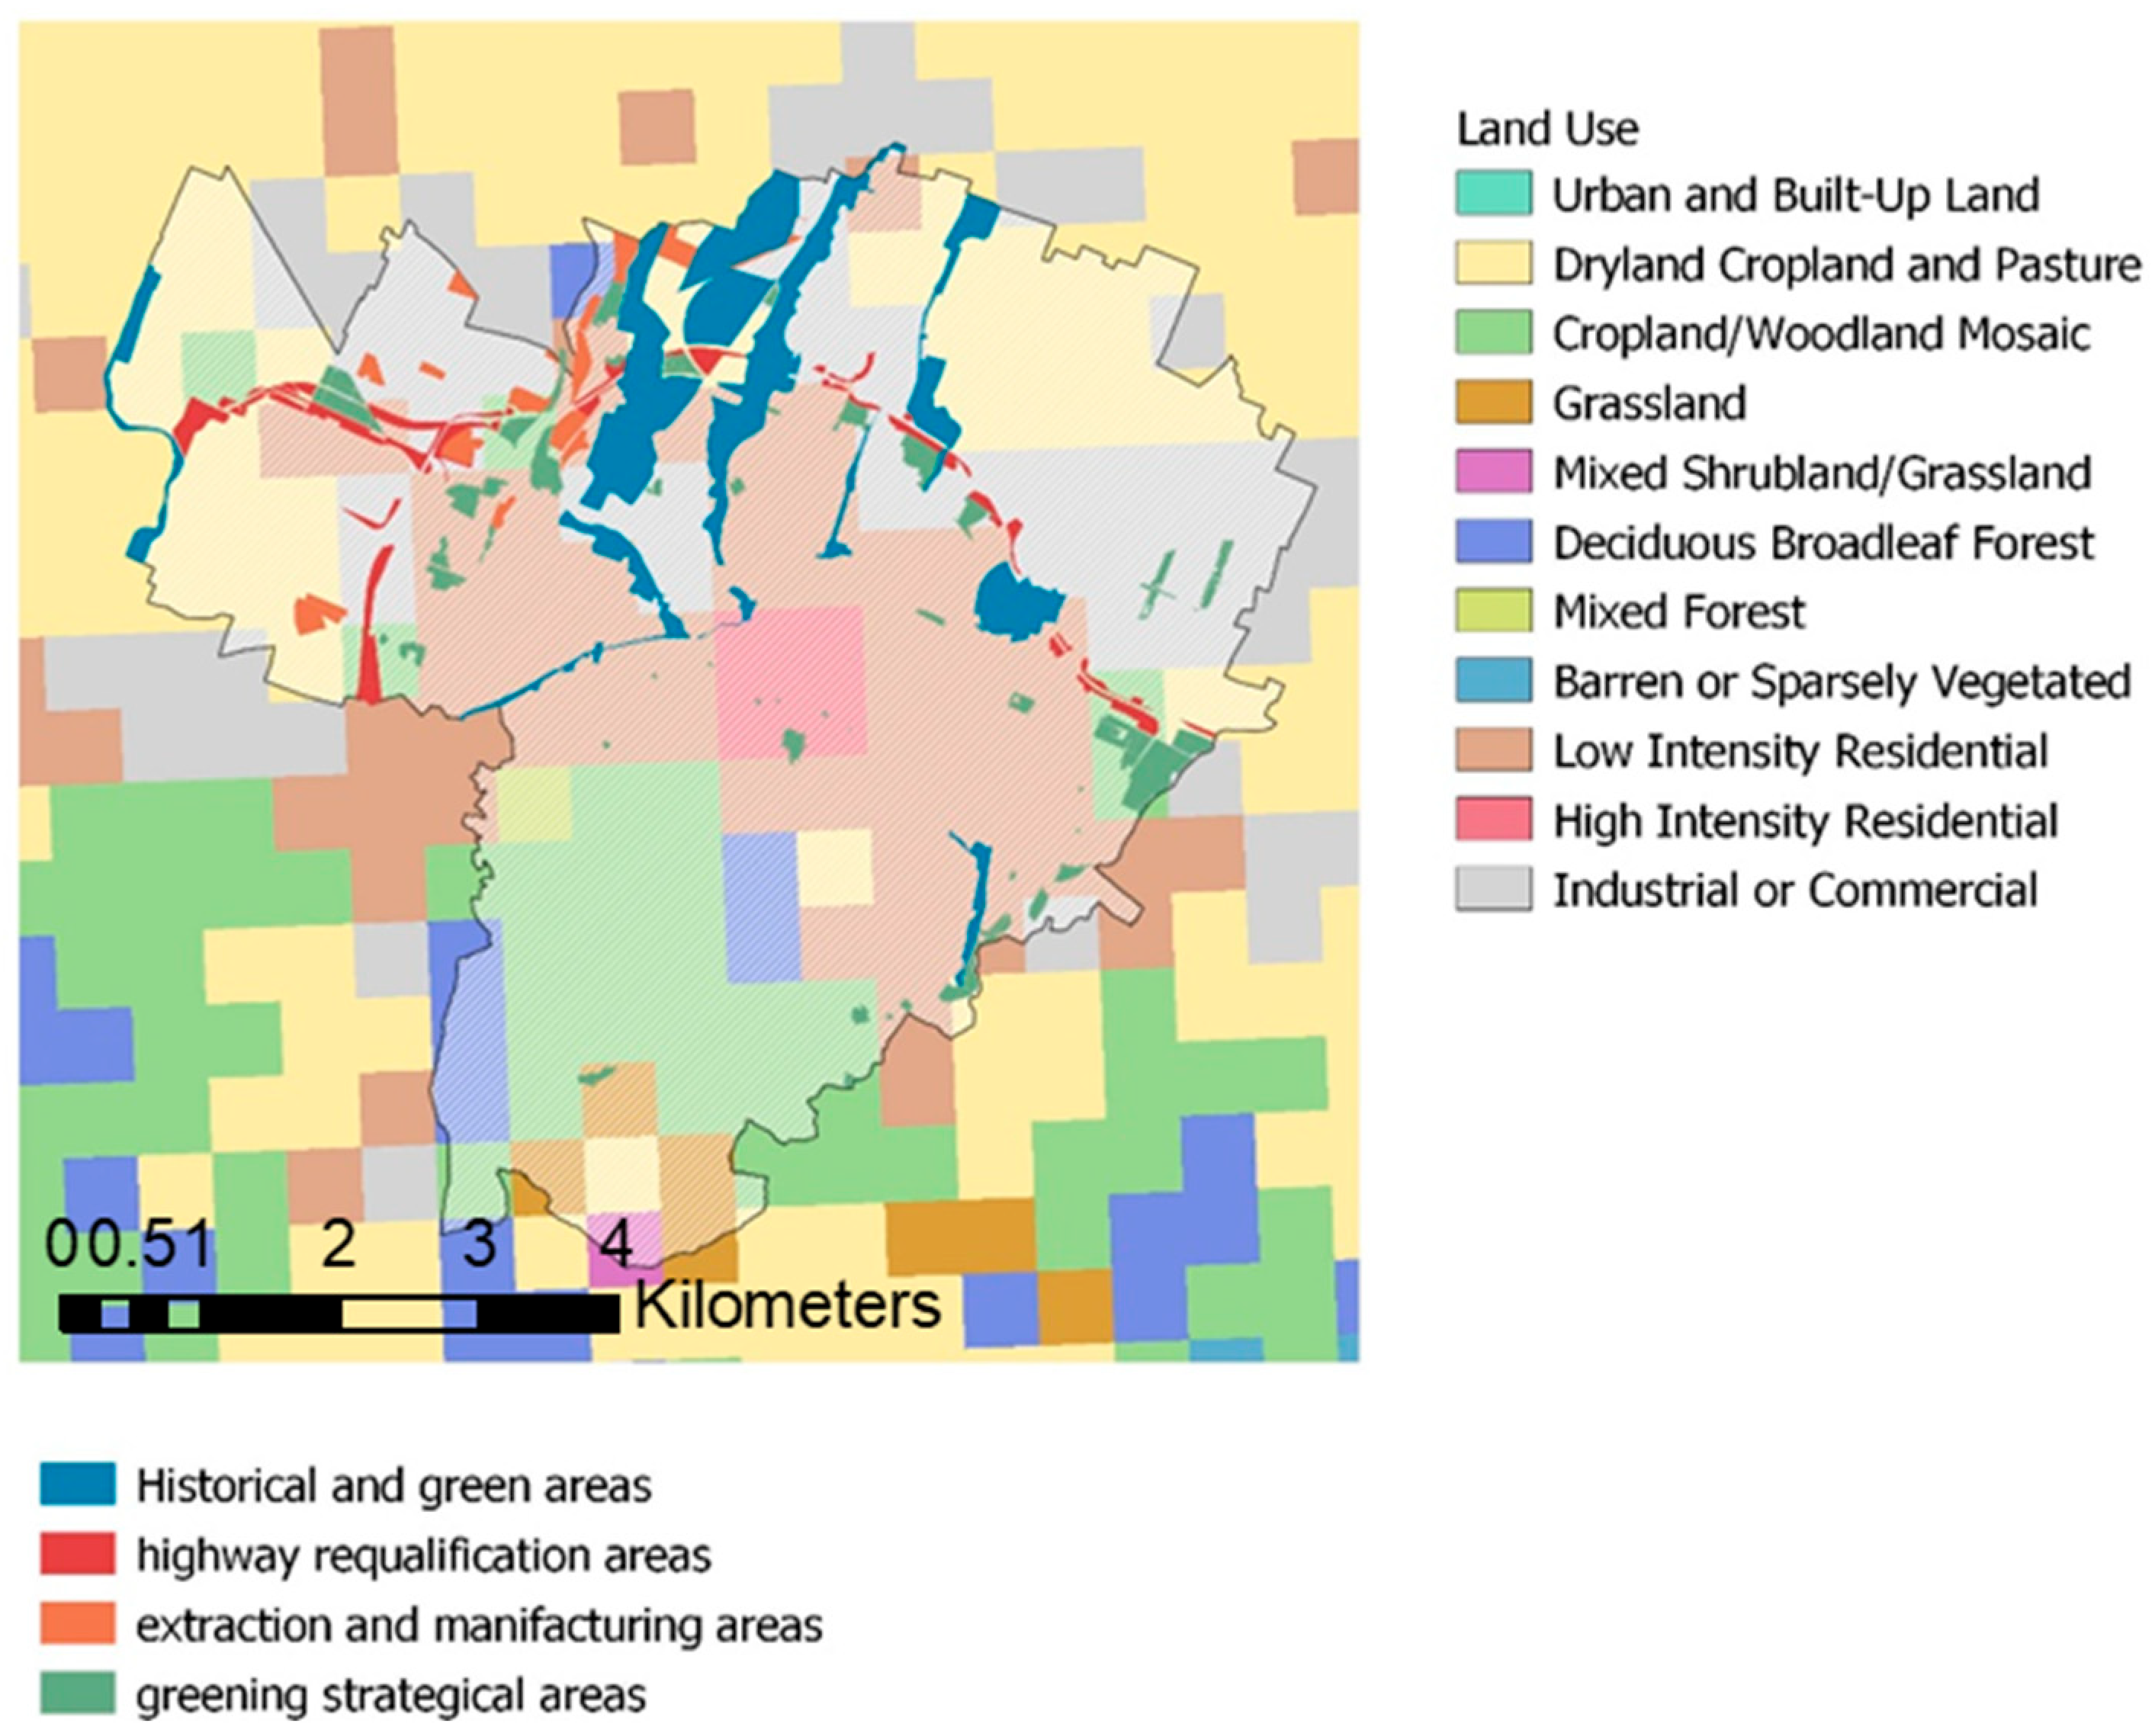
2.2.2. Milano
2.2.3. Bologna
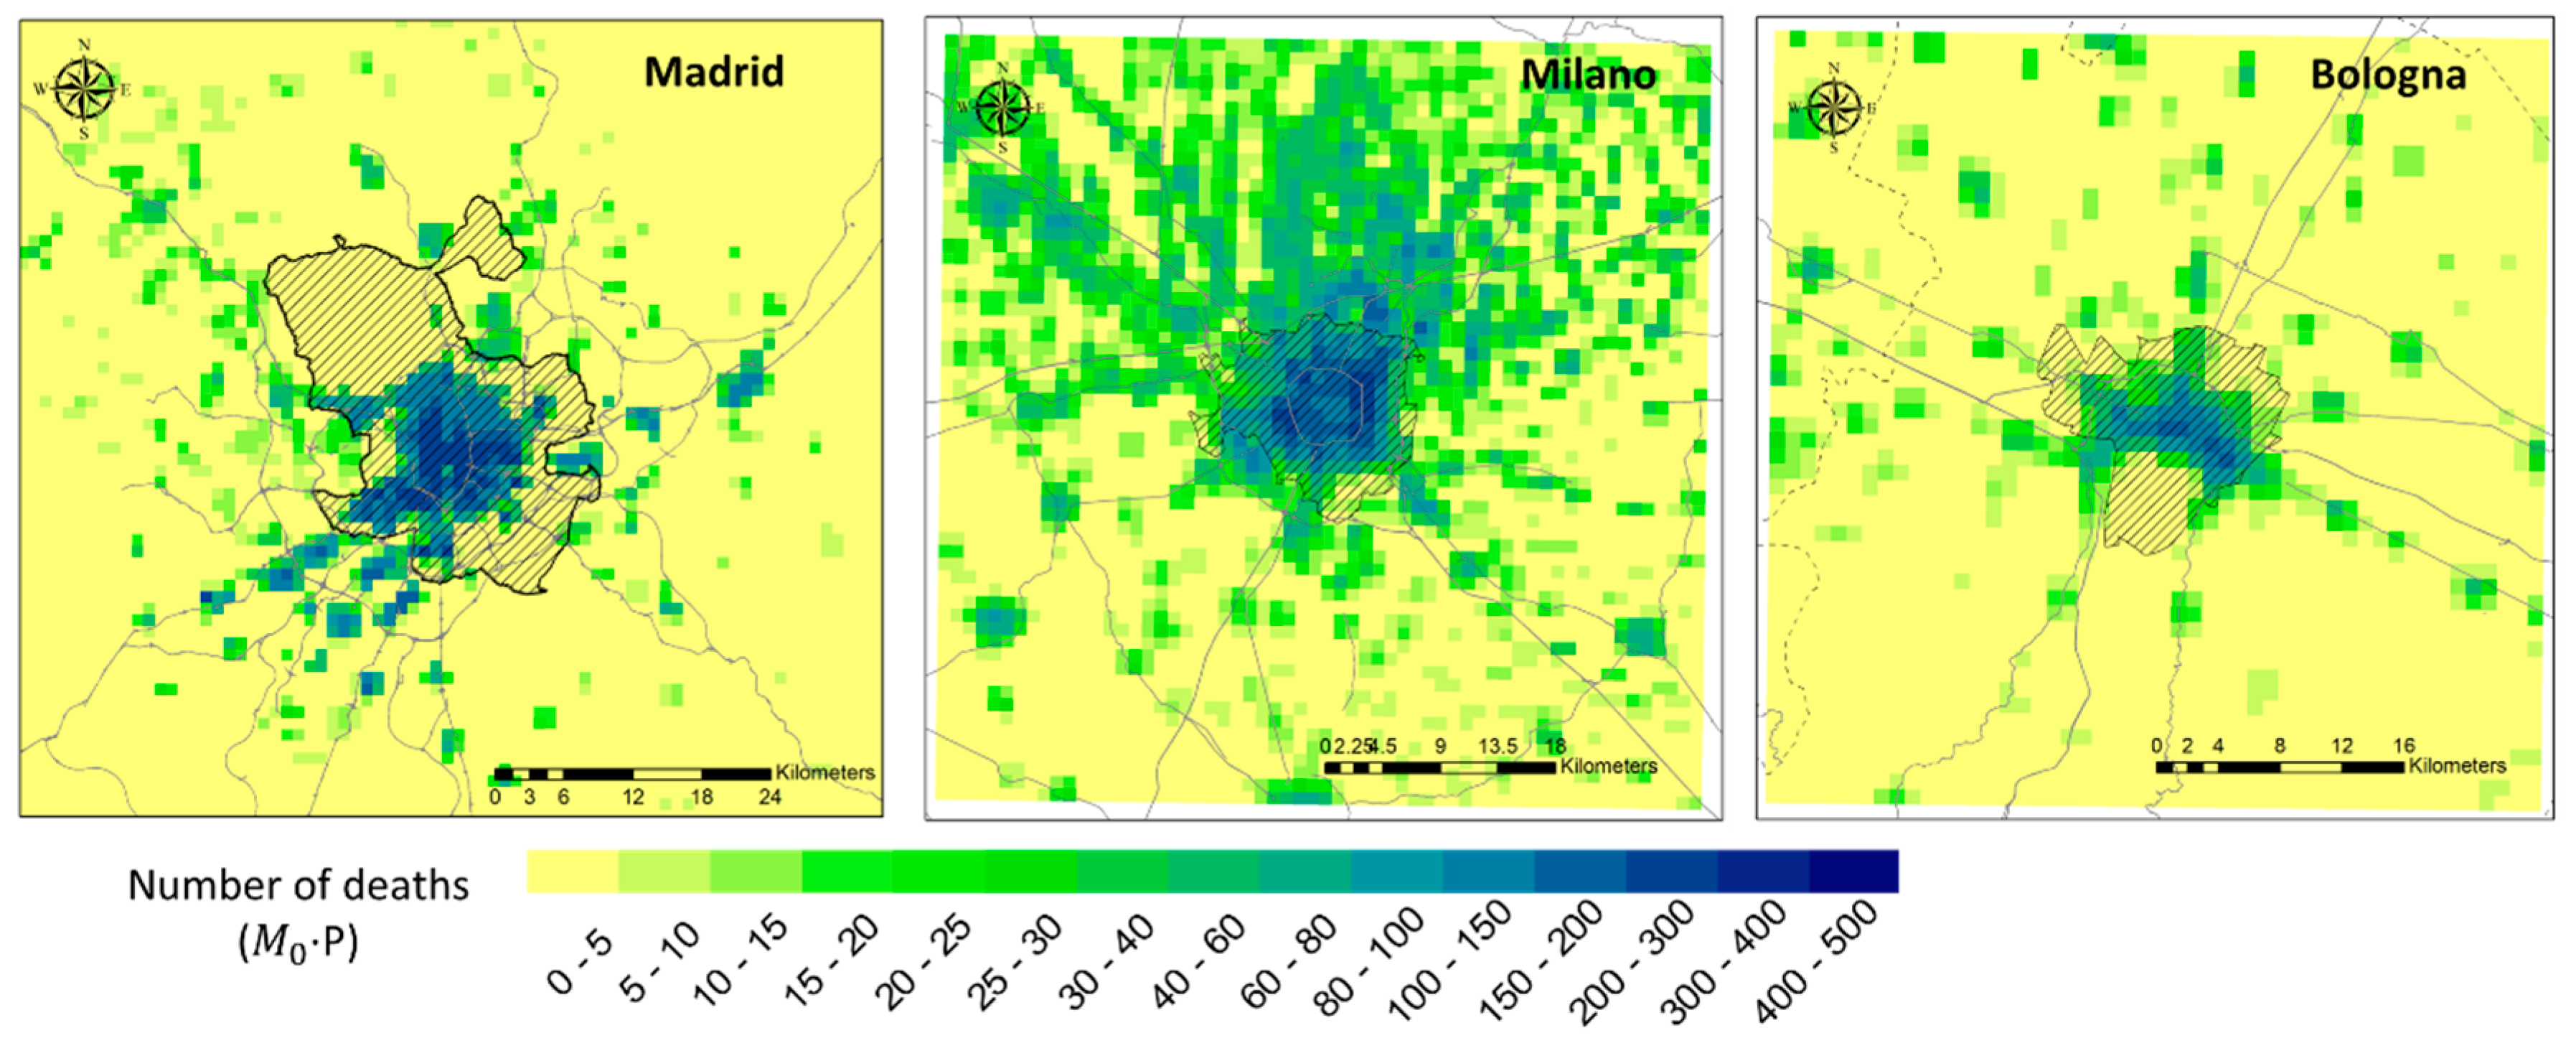
2.3. Health Impact Assessment
3. Results
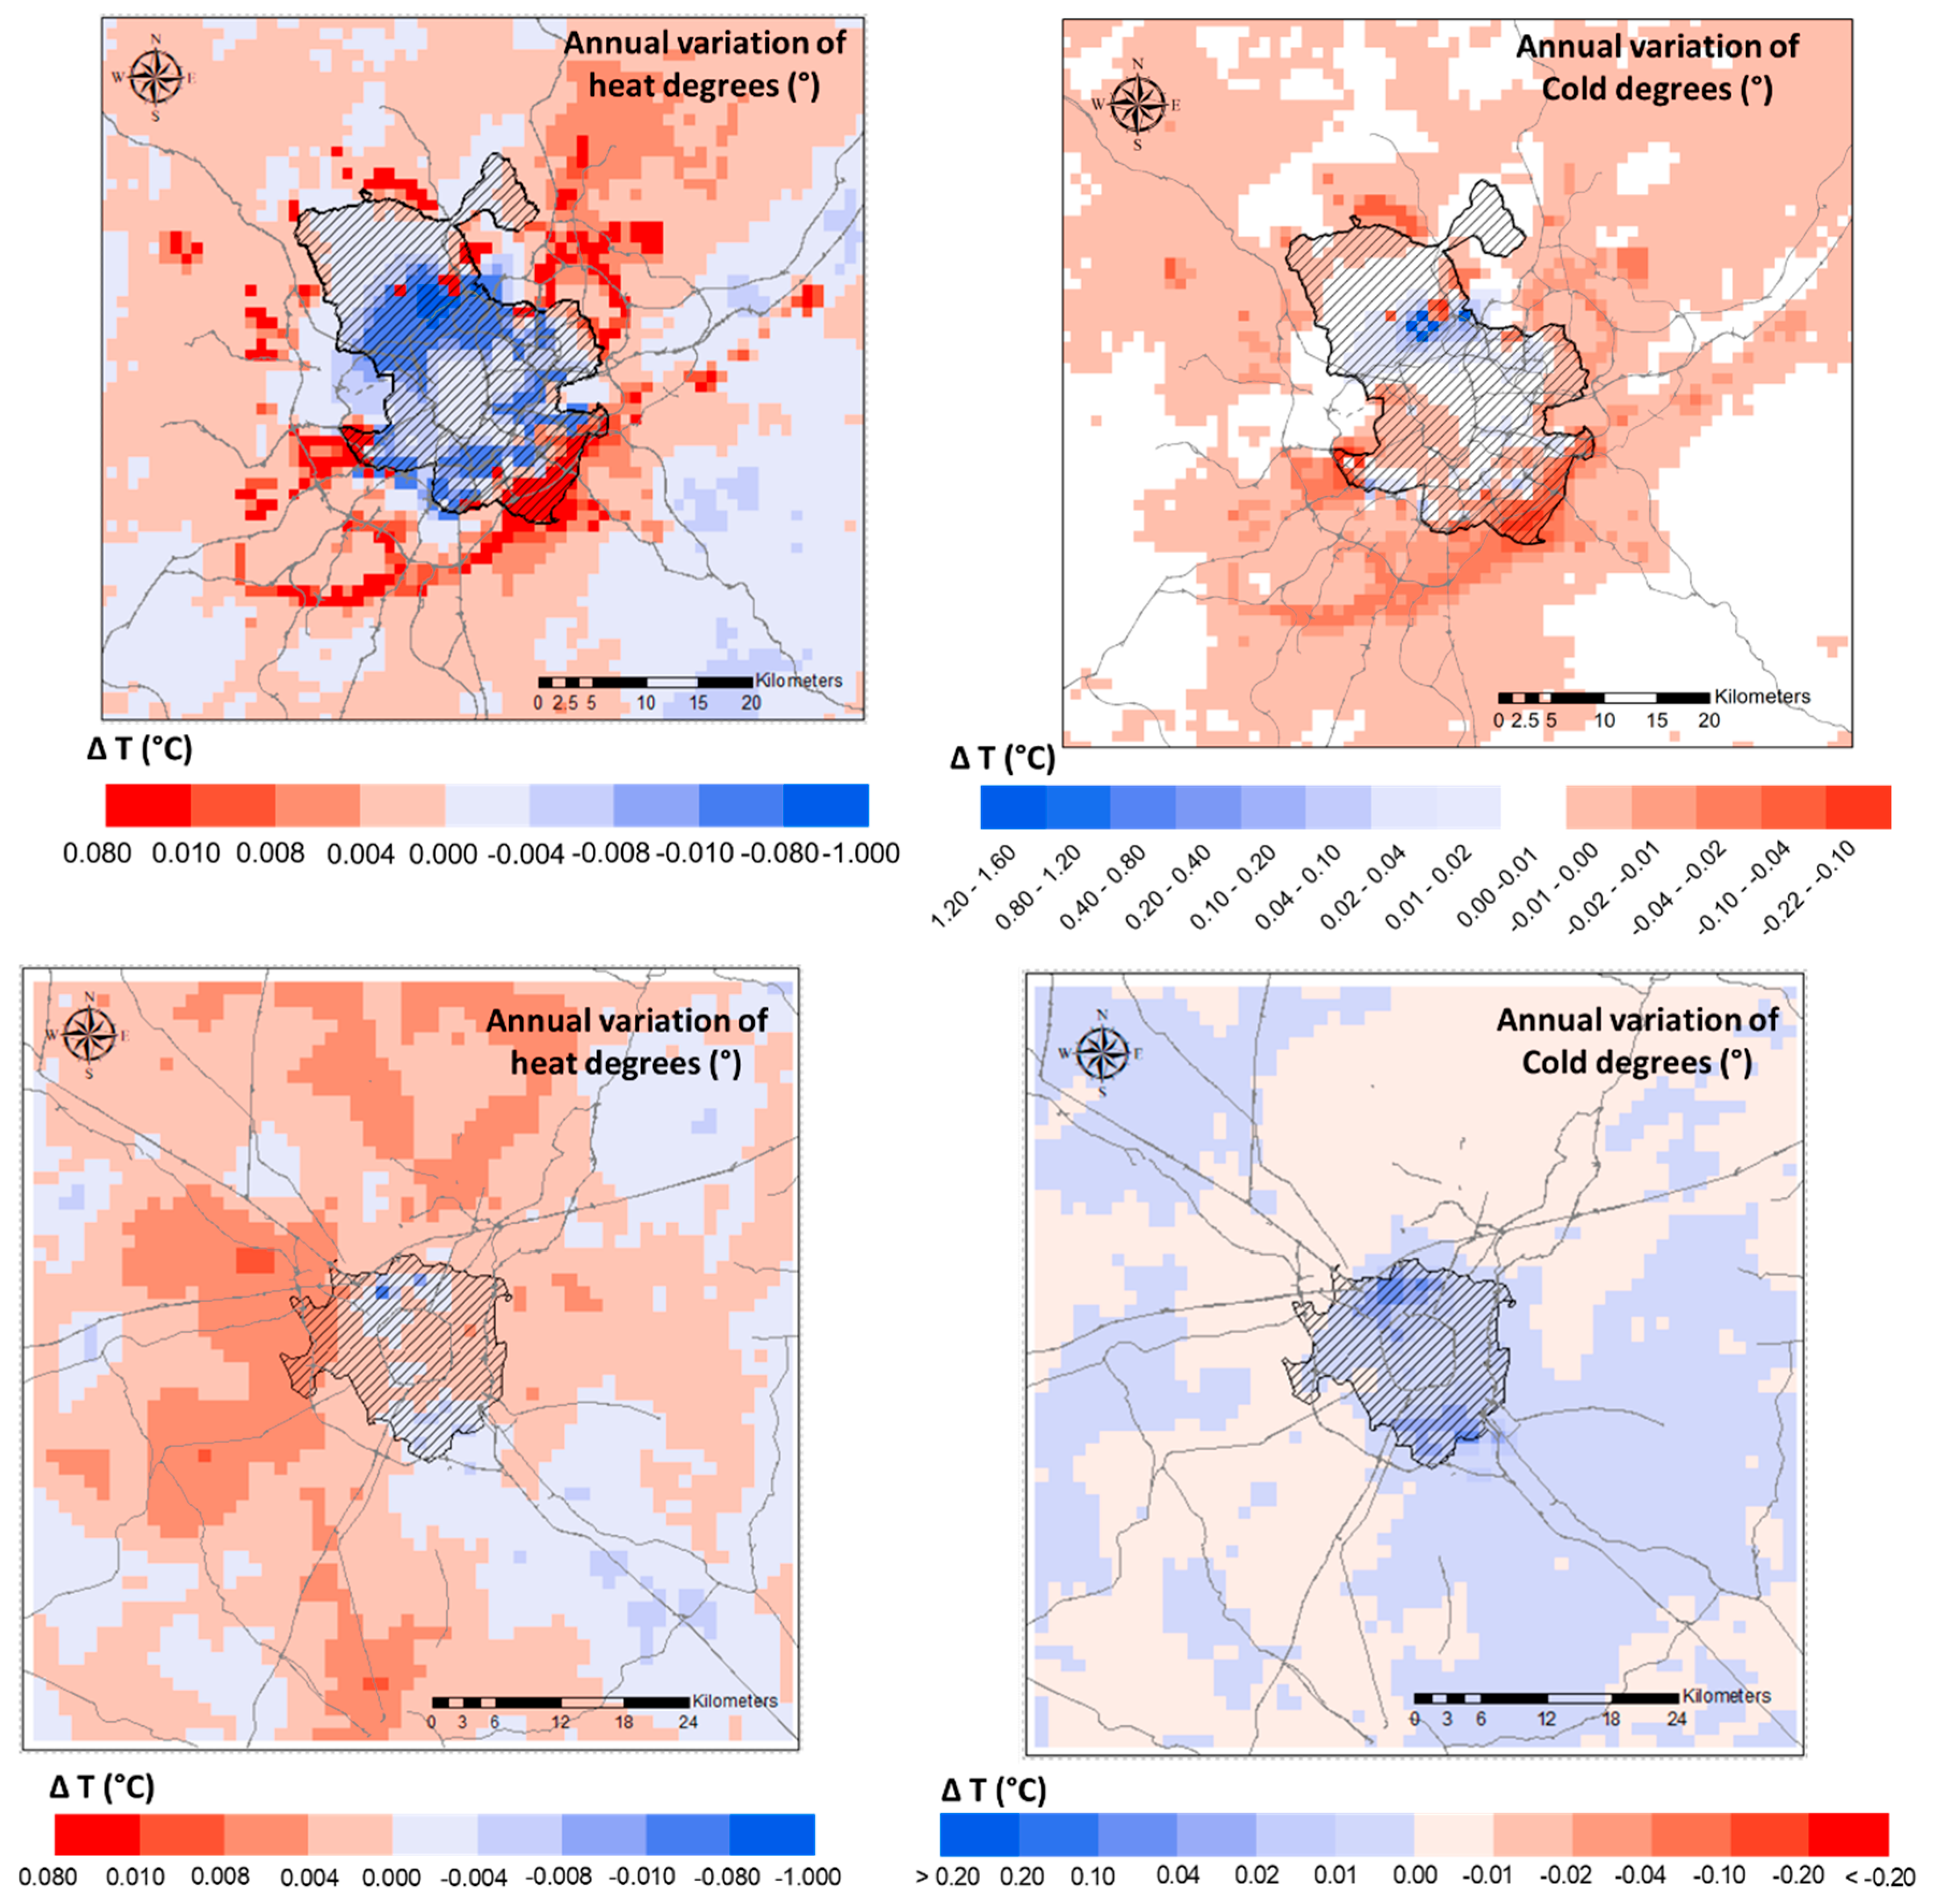
3.1. Impact of Vegetation on Temperature
3.2. Impacts on Temperature-Related Mortality
4. Discussion
4.1. Health Impacts
4.2. Policy Implications
5. Limitations
6. Conclusions
Author Contributions
Funding
Data Availability Statement
Conflicts of Interest
Appendix A. Modelling System Setup

| Model Feature | Madrid | Bologna and Milano |
|---|---|---|
| Version | WRFv4.1.2 | WRFv3.9.1.1 |
| Nested domains (spatial resolution in km) | 4 (27, 9, 3, 1) | 3 (12, 4, 1) |
| Vertical layers (layers within the first km) | 38 (17) | 39 (12) |
| Initialization | ERA5 (Copernicus Climate Change Service) | ERA5 (Copernicus Climate Change Service) |
| Microphysics | WSM6 [106] | WSM6 [106] |
| Cumulus Parametrization | Off | Off |
| PBL Scheme | Bougeault-Lacarrère PBL [107] | Mellor Yamada Jancic (MYJ) [108] |
| Urban Physics | BEP [55] | BEP [55] |
| Land Surface | Noah LSM [109] | Noah LSM [109] |
| Longwave Radiation | GFDL [110] | RRTMG [111] |
| Shortwave Radiation | MM5 [112] | RRTMG [111] |
Appendix B. Baseline Mortality
References
- United Nations, Department of Economic and Social Affairs, Population Division. World Urbanization Prospects: The 2018 Revision (ST/ESA/SER.A/420); United Nations: New York, NY, USA, 2019; ISBN 978-92-1-004314-4. [Google Scholar]
- Intergovernmental Panel on Climate Change (IPCC). Summary for Policymakers. In Climate Change 2022—Impacts, Adaptation and Vulnerability: Working Group II Contribution to the Sixth Assessment Report of the Intergovernmental Panel on Climate Change; Cambridge University Press: Cambridge, UK, 2023; pp. 3–34. [Google Scholar]
- Johnson, B.A.; Kumar, P.; Okano, N.; Dasgupta, R.; Shivakoti, B.R. Nature-based solutions for climate change adaptation: A systematic review of systematic reviews. Nat. Based Solut. 2022, 2, 100042. [Google Scholar] [CrossRef]
- Kabisch, N.; Frantzeskaki, N.; Pauleit, S.; Naumann, S.; Davis, M.; Artmann, M.; Haase, D.; Knapp, S.; Korn, H.; Stadler, J.; et al. Nature-based solutions to climate change mitigation and adaptation in urban areas: Perspectives on indicators, knowledge gaps, barriers, and opportunities for action. Ecol. Soc. 2016, 21, 2. [Google Scholar] [CrossRef]
- Xie, L.; Bulkeley, H.; Tozer, L. Mainstreaming sustainable innovation: Unlocking the potential of nature-based solutions for climate change and biodiversity. Environ. Sci. Policy 2022, 132, 119–130. [Google Scholar] [CrossRef]
- Somarakis, G.; Stagakis, S.; Chrysoulakis, N. ThinkNature Nature-Based Solutions Handbook; EU Horizon 2020 Research and Innovation: Luxembourg, 2019. [Google Scholar] [CrossRef]
- Dumitru, A.; Frantzeskaki, N.; Collier, M. Identifying principles for the design of robust impact evaluation frameworks for nature-based solutions in cities. Environ. Sci. Policy 2020, 112, 107–116. [Google Scholar] [CrossRef]
- Oral, H.V.; Carvalho, P.; Gajewska, M.; Ursino, N.; Masi, F.; van Hullebusch, E.D.; Kazak, J.K.; Exposito, A.; Cipolletta, G.; Andersen, T.R.; et al. A review of nature-based solutions for urban water management in European circular cities: A critical assessment based on case studies and literature. Blue Green. Syst. 2020, 2, 112–136. [Google Scholar] [CrossRef]
- Davies, C.; Wang, B.; Brack, D.; Qin, Q. Nature-Based Solutions: Lessons from European and Chinese Cases, September 2024, EU–China Cooperation on Environment and Green Economy Project; European Union Service Contract No. 2017/390-904; EU–China Cooperation on Environment and Green Economy Project: Beijing, China, 2024. [Google Scholar]
- Dorst, H.; van der Jagt, A.; Raven, R.; Runhaar, H. Urban greening through nature-based solutions—Key characteristics of an emerging concept. Sust. Cities Soc. 2019, 49, 101620. [Google Scholar] [CrossRef]
- Raimondi, A.; Marrazzo, G.; Sanfilippo, U.; Becciu, G. A probabilistic approach to stormwater runoff control through permeable pavements beneath urban trees. Sci. Total Environ. 2023, 905, 167196. [Google Scholar] [CrossRef]
- Jeong, J.; Park, C.-R. Urban forest indicator assessment for nature-based solutions to connect biodiversity and people. Ecol. Indic. 2024, 169, 112843. [Google Scholar] [CrossRef]
- Zhang, M.; He, J.; Liu, D.; Huang, J.; Yue, Q.; Li, Y. Urban green corridor construction considering daily life circles: A case study of Wuhan city. China. Ecol. Eng. 2022, 184, 106786. [Google Scholar] [CrossRef]
- Kalantari, F.; Mohd Tahir, O.; Mahmoudi Lahijani, A.; Kalantari, S. A Review of Vertical Farming Technology: A Guide for Implementation of Building Integrated Agriculture in Cities. Adv. Eng. Forum 2017, 24, 76–91. [Google Scholar] [CrossRef]
- Vera, S.; Pinto, C.; Tabares-Velasco, P.C.; Bustamante, W. A critical review of heat and mass transfer in vegetative roof models used in building energy and urban environment simulation tools. Appl. Energy 2018, 232, 752–764. [Google Scholar] [CrossRef]
- De Cristo, E.; Evangelisti, L.; Barbaro, L.; De Lieto Vollaro, R.; Asdrubali, F. A Systematic Review of Green Roofs’ Thermal and Energy Performance in the Mediterranean Region. Energies 2025, 18, 2517. [Google Scholar] [CrossRef]
- Cohen-Shacham, E.; Walters, G.; Janzen, C.; Maginnis, S. Nature-Based Solutions to Address Global SOCIETAL Challenges; IUCN International Union for Conservation of Nature: Gland, Switzerland, 2016. [Google Scholar] [CrossRef]
- Manes, S.; Vale, M.M.; Malecha, A.; Pires, A.P.F. Nature-based solutions promote climate change adaptation safeguarding ecosystem services. Ecosyst. Serv. 2022, 55, 101439. [Google Scholar] [CrossRef]
- Le Coent, P.; Graveline, N.; Altamirano, M.A.; Arfaoui, N.; Benitez-Avila, C.; Biffin, T.; Calatrava, J.; Dartee, K.; Douai, A.; Gnonlonfin, A.; et al. Is-it worth investing in NBS aiming at reducing water risks? Insights from the economic assessment of three European case studies. Nat. Based Solut. 2021, 1, 100002. [Google Scholar] [CrossRef]
- Epelde, L.; Mendizabal, M.; Gutiérrez, L.; Artetxe, A.; Garbisu, C.; Feliu, E. Quantification of the environmental effectiveness of nature-based solutions for increasing the resilience of cities under climate change. Urban. For. Urban. Green. 2022, 67, 127433. [Google Scholar] [CrossRef]
- Biswal, B.K.; Bolan, N.; Zhu, Y.G.; Balasubramanian, R. Nature-based Systems (NbS) for mitigation of stormwater and air pollution in urban areas: A review. Resour. Conserv. Recycl. 2022, 186, 106578. [Google Scholar] [CrossRef]
- Chen, H.S.; Lin, Y.C.; Chiueh, P.T. Nexus of ecosystem service-human health-natural resources: The nature-based solutions for urban PM2.5 pollution. Sust. Cities Soc. 2023, 91, 104441. [Google Scholar] [CrossRef]
- Gómez-Baggethun, E.; Barton, D.N. Classifying and valuing ecosystem services for urban planning. Ecol. Econ. 2023, 86, 235–245. [Google Scholar] [CrossRef]
- Noe, E.E.; Stolte, O. Dwelling in the city: A qualitative exploration of the human-nature relationship in three types of urban greenspace. Landsc. Urban. Plann. 2023, 230, 104633. [Google Scholar] [CrossRef]
- Coventry, P.A.; Brown, J.V.E.; Pervin, J.; Brabyn, S.; Pateman, R.; Breedvelt, J.; Gilbody, S.; Stancliffe, R.; McEachan, R.; White, P.C.L. Nature-based outdoor activities for mental and physical health: Systematic review and meta-analysis. SSM Popul. Health 2021, 16, 100934. [Google Scholar] [CrossRef]
- Frank, L.D.; Hong, A.; Ngo, V.D. Causal evaluation of urban greenway retrofit: A longitudinal study on physical activity and sedentary behavior. Prev. Med. 2019, 123, 109–116. [Google Scholar] [CrossRef]
- Panter, J.; Guell, C.; Humphreys, D.; Ogilvie, D. Title: Can changing the physical environment promote walking and cycling? A systematic review of what works and how. Health Place 2019, 58, 102161. [Google Scholar] [CrossRef]
- Barron, S.; Rugel, E.J. Tolerant greenspaces: Designing urban nature-based solutions that foster social ties and support mental health among young adults. Environ. Sci. Policy 2023, 139, 1–10. [Google Scholar] [CrossRef]
- Nawrath, M.; Elsey, H.; Dallimer, M. Why cultural ecosystem services matter most: Exploring the pathways linking greenspaces and mental health in a low-income country. Sci. Total Environ. 2022, 806, 150551. [Google Scholar] [CrossRef]
- Subiza-Pérez, M.; Vozmediano, L.; San Juan, C. Green and blue settings as providers of mental health ecosystem services: Comparing urban beaches and parks and building a predictive model of psychological restoration. Landsc. Urban. Plann. 2020, 204, 103926. [Google Scholar] [CrossRef]
- Enssle, F.; Kabisch, N. Urban green spaces for the social interaction, health and well-being of older people—An integrated view of urban ecosystem services and socio-environmental justice. Environ. Sci. Policy 2020, 109, 36–44. [Google Scholar] [CrossRef]
- Lin, D.; Sun, Y.; Yang, Y.; Han, Y.; Xu, C. Urban park use and self-reported physical, mental, and social health during the COVID-19 pandemic: An on-site survey in Beijing, China. Urban. For. Urban. Green. 2023, 79, 127804. [Google Scholar] [CrossRef] [PubMed]
- Zhang, Y.; Zhan, Y.; Yu, T.; Ren, X. Urban green effects on land surface temperature caused by surface characteristics: A case study of summer Beijing metropolitan region. Infrared Phys. Technol. 2017, 86, 35–43. [Google Scholar] [CrossRef]
- Chakraborty, T.; Biswas, T.; Campbell, L.S.; Franklin, B.; Parker, S.S.; Tukman, M. Feasibility of afforestation as an equitable nature-based solution in urban areas. Sust. Cities Soc. 2022, 81, 103826. [Google Scholar] [CrossRef]
- Meerow, S.; Newell, J.P. Spatial planning for multifunctional green infrastructure: Growing resilience in Detroit. Landsc. Urban. Plann. 2017, 159, 62–75. [Google Scholar] [CrossRef]
- McMichael, A.J.; Wilkinson, P.; Kovats, R.S.; Pattenden, S.; Hajat, S.; Armstrong, B.; Vajanapoom, N.; Niciu, E.M.; Mahomed, H.; Kingkeow, C.; et al. International study of temperature, heat and urban mortality: The “ISOTHURM” project. Int. J. Epidemiol. 2008, 37, 1121–1131. [Google Scholar] [CrossRef] [PubMed]
- Yan, M.; Chen, L.; Leng, S.; Sun, R. Effects of local background climate on urban vegetation cooling and humidification: Variations and thresholds. Urban. For. Urban. Green. 2023, 80, 127840. [Google Scholar] [CrossRef]
- Augusto, B.; Roebeling, P.; Rafael, S.; Ferreira, J.; Ascenso, A.; Bodilis, C. Short and medium- to long-term impacts of nature-based solutions on urban heat. Sust. Cities Soc. 2020, 57, 102122. [Google Scholar] [CrossRef]
- de la Paz, D.; de Andrés, J.M.; Narros, A.; Silibello, C.; Finardi, S.; Fares, S.; Tejero, L.; Borge, R.; Mircea, M. Assessment of Air Quality and Meteorological Changes Induced by Future Vegetation in Madrid. Forests 2022, 13, 690. [Google Scholar] [CrossRef]
- Zafeiratou, S.; Stafoggia, M.; Gasparrini, A.; Rao, S.; de Donato, F.; Masselot, P.; Vazquez Fernandez, L.; Diz-Lois Palomares, A.; Aunan, K.; Katsouyanni, K.; et al. Independent effects of long and short-term exposures to non-optimal increased temperature on mortality. Environ. Pollut. 2025, 366, 125428. [Google Scholar] [CrossRef] [PubMed]
- Hu, J.; Zhou, M.; Qin, M.; Tong, S.; Hou, Z.; Xu, Y.; Zhou, C.; Xiao, Y.; Yu, M.; Huang, B.; et al. Long-term exposure to ambient temperature and mortality risk in China: A nationwide study using the difference-in-differences design. Environ. Pollut. 2022, 292, 118392. [Google Scholar] [CrossRef]
- Li, T.; Horton, R.M.; Bader, D.A.; Liu, F.; Sun, Q.; Kinney, P.L. Long-term projections of temperature-related mortality risks for ischemic stroke, hemorrhagic stroke, and acute ischemic heart disease under changing climate in Beijing, China. Environ. Int. 2018, 112, 1–9. [Google Scholar] [CrossRef]
- Zafeiratou, S.; Samoli, E.; Dimakopoulou, K.; Rodopoulou, S.; Analitis, A.; Gasparrini, A.; Stafoggia, M.; De’ Donato, F.; Rao, S.; Monteiro, A.; et al. A systematic review on the association between total and cardiopulmonary mortality/morbidity or cardiovascular risk factors with long-term exposure to increased or decreased ambient temperature. Sci. Total Environ. 2021, 772, 145383. [Google Scholar] [CrossRef]
- Yang, C.; Meng, X.; Chen, R.; Cai, J.; Zhao, Z.; Wan, Y.; Kan, H. Long-term variations in the association between ambient temperature and daily cardiovascular mortality in Shanghai, China. Sci. Total Environ. 2015, 538, 524–530. [Google Scholar] [CrossRef]
- Psistaki, K.; Kouis, P.; Michanikou, A.; Yiallouros, P.K.; Papatheodorou, S.I.; Paschalidou, A.K. Temporal trends in temperature-related mortality and evidence for maladaptation to heat and cold in the Eastern Mediterranean region. Sci. Total Environ. 2024, 943, 173899. [Google Scholar] [CrossRef]
- Zanobetti, A.; O’Neill, M.S. Longer-Term Outdoor Temperatures and Health Effects: A Review. Curr. Epidemiol. Rep. 2018, 5, 125–139. [Google Scholar] [CrossRef] [PubMed]
- Palmeiro-Silva, Y.; Chandler, R.E.; Kelman, I. Estimating the effects of temperature on mortality and hospitalisations under RCP2.6 and RCP8.5 scenarios in the short- and long-term by region in Chile: A population-based, modelling study. Lancet Reg. Health Am. 2025, 48, 101151. [Google Scholar] [CrossRef]
- Borge, R.; Santiago, J.L.; de la Paz, D.; Martín, F.; Domingo, J.; Valdés, C.; Sánchez, B.; Rivas, E.; Rozas, M.T.; Lázaro, S.; et al. Application of a short term air quality action plan in Madrid (Spain) under a high-pollution episode—Part II: Assessment from multi-scale modelling. Sci. Total Environ. 2018, 635, 1574–1584. [Google Scholar] [CrossRef]
- D’Isidoro, M.; D’Elia, I.; Vitali, L.; Briganti, G.; Cappelletti, A.; Piersanti, A.; Finardi, S.; Calori, G.; Pepe, N.; Di Giosa, A.; et al. Lessons learnt for air pollution mitigation policies from the COVID-19 pandemic: The Italian perspective. Atmos. Pollut. Res. 2022, 13, 101620. [Google Scholar] [CrossRef]
- D’Elia, I.; Briganti, G.; Vitali, L.; Piersanti, A.; Righini, G.; D’Isidoro, M.; Cappelletti, A.; Mircea, M.; Adani, M.; Zanini, G.; et al. Measured and modelled air quality trends in Italy over the period 2003–2010. Atmos. Chem. Phys. 2021, 21, 10825–10849. [Google Scholar] [CrossRef]
- Piersanti, A.; D’Elia, I.; Gualtieri, M.; Briganti, G.; Cappelletti, A.; Zanini, G.; Ciancarella, L. The Italian national air pollution control programme: Air quality, health impact and cost assessment. Atmosphere 2021, 12, 196. [Google Scholar] [CrossRef]
- Mircea, M.; Borge, R.; Finardi, S.; Briganti, G.; Russo, F.; de la Paz, D.; D’Isidoro, M.; Cremona, G.; Villani, M.G.; Cappelletti, A.; et al. The Role of Vegetation on Urban Atmosphere of Three European Cities. Part 2: Evaluation of Vegetation Impact on Air Pollutant Concentrations and Depositions. Forests 2023, 14, 1255. [Google Scholar] [CrossRef]
- Skamarock, W.C.; Klemp, J.B. A time-split nonhydrostatic atmospheric model for weather research and forecasting applications. J. Comput. Phys. 2008, 227, 3465–3485. [Google Scholar] [CrossRef]
- Liu, Y.; Chen, F.; Warner, T.; Basara, J. Verification of a Mesoscale Data-Assimilation and Forecasting System for the Oklahoma City Area during the Joint Urban 2003 Field Project. J. Appl. Meteorol. Climatol. 2006, 45, 912–929. [Google Scholar] [CrossRef]
- Martilli, A.; Clappier, A.; Rotach, M.W. An Urban Surface Exchange Parameterisation for Mesoscale Models. Bound. Layer. Meteorol. 2002, 104, 261–304. [Google Scholar] [CrossRef]
- D’Isidoro, M.; Mircea, M.; Borge, R.; Finardi, S.; de la Paz, D.; Briganti, G.; Russo, F.; Cremona, G.; Villani, M.G.; Adani, M.; et al. The Role of Vegetation on Urban Atmosphere of Three European Cities—Part 1: Evaluation of Vegetation Impact on Meteorological Conditions. Forests 2023, 14, 1235. [Google Scholar] [CrossRef]
- Adani, M.; Piersanti, A.; Ciancarella, L.; D’Isidoro, M.; Villani, M.G.; Vitali, L. Preliminary tests on the sensitivity of the FORAIR_IT air quality forecasting system to different meteorological drivers. Atmosphere 2020, 11, 574. [Google Scholar] [CrossRef]
- Borge, R.; Alexandrov, V.; del Vas, J.J.; Lumbreras, J.; Rodríguez, E. A comprehensive sensitivity analysis of the WRF model for air quality applications over the Iberian Peninsula. Atmos. Environ. 2008, 42, 8560–8574. [Google Scholar] [CrossRef]
- de la Paz, D.; Borge, R.; Martilli, A. Assessment of a high resolution annual WRF-BEP/CMAQ simulation for the urban area of Madrid (Spain). Atmos. Environ. 2016, 144, 282–296. [Google Scholar] [CrossRef]
- Emery, C.; Tai, E.; Yarwood, G. Enhanced Meteorological Modeling and Performance Evaluation for Two Texas Ozone Episodes, Final Report to the Texas Natural Resource Conservation Commission under TNRCC Umbrella Contract No. 582-0-31984; Environ International Corporation: Novato, CA, USA, 2001. [Google Scholar]
- Mircea, M.; Briganti, G.; Russo, F.; Finardi, S.; Silibello, C.; Prandi, R.; Carlino, G.; D’Isidoro, M.; Cappelletti, A.; Cremona, G. Vegetation Effects on Air Pollution: A Comprehensive Assessment for Two Italian Cities. Atmosphere 2024, 15, 1511. [Google Scholar] [CrossRef]
- Beck, H.; Zimmermann, N.; McVicar, T.; Vergopolan, N.; Berg, A.; Wood, E.F. Present and future Köppen-Geiger climate classification maps at 1-km resolution. Sci. Data 2018, 5, 180214. [Google Scholar] [CrossRef] [PubMed]
- Puche, M.; Vavassori, A.; Brovelli, M.A. Insights into the Effect of Urban Morphology and Land Cover on Land Surface and Air Temperatures in the Metropolitan City of Milan (Italy) Using Satellite Imagery and In Situ Measurements. Remote Sens. 2023, 15, 733. [Google Scholar] [CrossRef]
- Nardino, M.; Cremonini, L.; Georgiadis, T.; Mandanici, E.; Bitelli, G. Microclimate Classification of Bologna (Italy) as a Support Tool for Urban Services and Regeneration. Int. J. Environ. Res. Public Health 2021, 18, 4898. [Google Scholar] [CrossRef]
- Vardoulakis, S.; Dear, K.; Hajat, S.; Heaviside, C.; Eggen, B.; McMichael, A.J. Comparative assessment of the effects of climate change on heat- and cold-related mortality in the United Kingdom and Australia. Environ. Health Perspect. 2014, 122, 1285–1292. [Google Scholar] [CrossRef]
- Jannis Frasch, L.; König, H.-H.; Konnopka, C. Effects of extreme temperature on morbidity, mortality, and case severity in German emergency care. Environ. Res. 2025, 270, 121021. [Google Scholar] [CrossRef]
- Lee, W.; Bell, M.L.; Gasparrini, A.; Armstrong, B.G.; Sera, F.; Hwang, S.; Lavigne, E.; Zanobetti, A.; Coelho, M.S.Z.S.; Saldiva, P.H.N.; et al. Mortality burden of diurnal temperature range and its temporal changes: A multi-country study. Environ. Int. 2018, 110, 123–130. [Google Scholar] [CrossRef]
- Gasparrini, A.; Guo, Y.; Hashizume, M.; Lavigne, E.; Zanobetti, A.; Schwartz, J.; Tobias, A.; Tong, S.; Rocklöv, J.; Forsberg, B.; et al. Mortality risk attributable to high and low ambient temperature: A multicountry observational study. Lancet 2015, 386, 369–375. [Google Scholar] [CrossRef] [PubMed]
- Carmona, R.; Díaz, J.; Mirón, I.J.; Ortiz, C.; Luna, M.Y.; Linares, C. Mortality attributable to extreme temperatures in Spain: A comparative analysis by city. Environ. Int. 2016, 91, 22–28. [Google Scholar] [CrossRef] [PubMed]
- Mistry, M.N.; Schneider, R.; Masselot, P.; Royé, D.; Armstrong, B.; Kyselý, J.; Orru, H.; Sera, F.; Tong, S.; Lavigne, E.; et al. Comparison of weather station and climate reanalysis data for modelling temperature-related mortality. Sci. Rep. 2022, 12, 5178. [Google Scholar] [CrossRef]
- Royé, D.; Iñiguez, C.; Tobías, A. Comparison of temperature–mortality associations using observed weather station and reanalysis data in 52 Spanish cities. Environ. Res. 2020, 183, 109237. [Google Scholar] [CrossRef]
- Armstrong, B.; Bell, M.L.; Coelho, M.d.S.Z.S.; Guo, Y.L.L.; Guo, Y.; Goodman, P.; Hashizume, M.; Honda, Y.; Kim, H.; Lavigne, E.; et al. Longer-term impact of high and low temperature on mortality: An international study to clarify length of mortality displacement. Environ. Health Perspect. 2017, 125, 107009. [Google Scholar] [CrossRef]
- U.S. EPA. Environmental Benefits Mapping and Analysis Program: Community Edition (BenMAP-CE) User Manual and Appendices; U.S. EPA: Research Triangle Park, NC, USA, 2018. Available online: https://www.epa.gov/sites/production/files/2015-04/documents/benmap-ce_user_manual_march_2015.pdf (accessed on 25 June 2025).
- WHO. AirQ+: Software Tool for Health Risk Assessment of Air Pollution. 2018. Available online: https://www.who.int/europe/tools-and-toolkits/airq---software-tool-for-health-risk-assessment-of-air-pollution (accessed on 25 June 2025).
- Leone, M.; D’Ippoliti, D.; De Sario, M.; Analitis, A.; Menne, B.; Katsouyanni, K.; de’ Donato, F.K.; Basagana, X.; Ben Salah, A.; Casimiro, E.; et al. A time series study on the effects of heat on mortality and evaluation of heterogeneity into European and Eastern-Southern Mediterranean cities: Results of EU CIRCE project. Environ. Health 2013, 12, 55. [Google Scholar] [CrossRef]
- Vázquez Fernández, L.; Diz-Lois Palomares, A.; Vicedo-Cabrera, A.M.; Gasparrini, A.; Freiesleben de Blasio, B.; Di Ruscio, F.; Masselot, P.; Wisløff, T.; Rao-Skirbekk, S. Municipality assessment of temperature-related mortality risks in Norway. Environ. Res. 2025, 266, 120614. [Google Scholar] [CrossRef]
- Gasparrini, A.; Guo, Y.; Hashizume, M. Mortalité attribuable au froid et à la chaleur: Analyse multi-pays. Environ. Risques Sante 2015, 14, 464–465. Available online: https://www.yearbook-ers.jle.com/download/ers-307077-31675-mortalite_attribuable_au_froid_et_a_la_chaleur_analyse_multi_pays-a.pdf (accessed on 25 June 2025).
- Gallego Pinilla, F.J. Population density grid of the European Union. Popul. Environ. 2010, 31, 460–473. [Google Scholar] [CrossRef]
- Heaviside, C.; Macintyre, H.; Vardoulakis, S. The Urban Heat Island: Implications for health in a changing environment. Curr. Environ. Health Rep. 2017, 4, 296–305. [Google Scholar] [CrossRef] [PubMed]
- Román-Cascón, C.; Lothon, M.; Lohou, F.; Ojha, N.; Merlin, O.; Aragonés, D.; González-Dugo, M.P.; Andreu, A.; Pellarin, T.; Brut, A.; et al. Can We Use Satellite-Based Soil-Moisture Products at High Resolution to Investigate Land-Use Differences and Land–Atmosphere Interactions? A Case Study in the Savanna. Remote Sens. 2020, 12, 1701. [Google Scholar] [CrossRef]
- Lüthi, S.; Fairless, C.; Fischer, E.M.; Scovronick, N.; Armstrong, B.; Coelho, M.D.S.Z.S.; Guo, Y.L.; Guo, Y.; Honda, Y.; Huber, V.; et al. Rapid increase in the risk of heat-related mortality. Nat. Commun. 2023, 14, 4894. [Google Scholar] [CrossRef]
- Gallo, E.; Quijal-Zamorano, M.; Méndez Turrubiates, R.F.; Tonne, C.; Basagaña, X.; Achebak, H.; Ballester, J. Heat-related mortality in Europe during 2023 and the role of adaptation in protecting health. Nat. Med. 2024, 30, 3101–3105. [Google Scholar] [CrossRef]
- Krummenauer, L.; Costa, L.; Prahl, B.F.; Kropp, J.P. Future heat adaptation and exposure among urban populations and why a prospering economy alone won’t save us. Sci. Rep. 2021, 11, 20309. [Google Scholar] [CrossRef]
- Karimi, A.; Mohammad, P.; García-Martínez, A.; Moreno-Rangel, D.; Gachkar, D.; Gachkar, S. New developments and future challenges in reducing and controlling heat island effect in urban areas. Environ. Dev. Sustain. 2023, 25, 10485–10531. [Google Scholar] [CrossRef]
- Yin, Z.; Liu, Z.; Liu, X.; Zheng, W.; Yin, L. Urban heat islands and their effects on thermal comfort in the US: New York and New Jersey. Ecol. Indic. 2023, 154, 110765. [Google Scholar] [CrossRef]
- Wang, C.; Ren, Z.; Dong, Y.; Zhang, P.; Guo, Y.; Wang, W.; Bao, G. Efficient cooling of cities at global scale using urban green space to mitigate urban heat island effects in different climatic regions. Urban. For. Urban. Green. 2022, 74, 127635. [Google Scholar] [CrossRef]
- Pinto, L.V.; Inácio, M.; Ferreira, C.S.S.; Ferreira, A.D.; Pereira, P. Ecosystem services and well-being dimensions related to urban green spaces—A systematic review. Sust. Cities Soc. 2022, 85, 104072. [Google Scholar] [CrossRef]
- Reyes-Riveros, R.; Altamirano, A.; De La Barrera, F.; Rozas-Vásquez, D.; Vieli, L.; Meli, P. Linking public urban green spaces and human well-being: A systematic review. Urban. For. Urban. Green. 2021, 61, 127105. [Google Scholar] [CrossRef]
- Iungman, T.; Ventura Caballé, S.; Segura-Barrero, R.; Cirach, M.; Mueller, N.; Daher, C.; Villalba, G.; Pereira Barboza, E.; Nieuwenhuijsen, M. Co-benefits of nature-based solutions: A health impact assessment of the Barcelona Green Corridor (Eixos Verds) plan. Environ. Int. 2025, 196, 109313. [Google Scholar] [CrossRef] [PubMed]
- Iungman, T.; Cirach, M.; Marando, F.; Pereira Barboza, E.; Khomenko, S.; Masselot, P.; Quijal-Zamorano, M.; Mueller, N.; Gasparrini, A.; Urquiza, J.; et al. Cooling cities through urban green infrastructure: A health impact assessment of European cities. Lancet 2023, 401, 577–589. [Google Scholar] [CrossRef]
- García-León, D.; Masselot, P.; Mistry, M.N.; Gasparrini, A.; Motta, C.; Feyen, L.; Ciscar, J.C. Temperature-related mortality burden and projected change in 1368 European regions: A modelling study. Lancet Public. Health 2024, 9, 644–653. [Google Scholar] [CrossRef] [PubMed]
- Borge, R.; Requia, W.J.; Yagüe, C.; Jhun, I.; Koutrakis, P. Impact of weather changes on air quality and related mortality in Spain over a 25 year period [1993–2017]. Environ. Int. 2019, 133 Part B, 105272. [Google Scholar] [CrossRef]
- WHO Europe. Heat and Health in the WHO European Region: Updated Evidence for Effective Prevention; World Health Organization Regional Office for Europe: Copenhagen, Denmark, 2021; Available online: https://www.who.int/europe/publications/i/item/9789289055406 (accessed on 25 June 2025).
- Picornell, M.; Ruiz, T.; Borge, R.; García-Albertos, P.; de la Paz, D.; Lumbreras, J. Population dynamics based on mobile phone data to improve air pollution exposure assessments. J. Expo. Sci. Environ. Epidemiol. 2019, 29, 278–291. [Google Scholar] [CrossRef]
- Xi, J.Y.; Liang, B.H.; Zhang, W.J.; Yan, B.; Dong, H.; Chen, Y.-Y.; Lin, X.; Gu, J.; Hao, Y.-T. Effects of population aging on quality of life and disease burden: A population-based study. Glob. Health. Res. Policy 2025, 10, 2. [Google Scholar] [CrossRef]
- Chairat, S.; Gheewala, S.H. The conceptual quantitative assessment framework for Nature-based Solutions (NbS). Nat. Based Solut. 2024, 6, 100152. [Google Scholar] [CrossRef]
- Salamanca, F.; Krpo, A.; Martilli, A.; Clappier, A. A new building energy model coupled with an urban canopy parameterization for urban climate simulations—Part I. formulation, verification, and sensitivity analysis of the model. Theor. Appl. Climatol. 2010, 99, 331–344. [Google Scholar] [CrossRef]
- Martilli, A.; Nazarian, N.; Krayenhoff, E.S.; Lachapelle, J.; Lu, J.; Rivas, E.; Rodriguez-Sanchez, A.; Sanchez, B.; Santiago, J.L. WRF-Comfort: Simulating microscale variability in outdoor heat stress at the city scale with a mesoscale model. Geosci. Model Dev. 2024, 17, 5023–5039. [Google Scholar] [CrossRef]
- Lopez-Gomez, I.; Wan, Z.Y.; Zepeda-Núñez, L.; Schneider, T.; Anderson, J.; Sha, F. Dynamical-generative downscaling of climate model ensembles. Proc. Natl. Acad. Sci. USA 2025, 122, e2420288122. [Google Scholar] [CrossRef]
- Su, S.; Zhang, Q.; Pi, J.; Wan, C.; Weng, M. Public health in linkage to land use: Theoretical framework, empirical evidence, and critical implications for reconnecting health promotion to land use policy. Land. Use Policy 2016, 57, 605–618. [Google Scholar] [CrossRef]
- Oosterbroek, B.; de Kraker, J.; Huynen, M.-M.T.E.; Martens, P.; Verhoeven, K. Assessment of green space benefits and burdens for urban health with spatial modeling. Urban. For. Urban. Green. 2023, 86, 128023. [Google Scholar] [CrossRef]
- Qiu, Y.; Wu, Z.; Man, R.; Zong, T.; Liu, Y.; Meng, X.; Chen, J.; Chen, S.; Yang, S.; Yuan, B.; et al. Secondary aerosol formation drives atmospheric particulate matter pollution over megacities (Beijing and Seoul) in East Asia. Atmos. Environ. 2023, 301, 119702. [Google Scholar] [CrossRef]
- Sato, K.; Ikemori, F.; Ramasamy, S.; Iijima, A.; Kumagai, K.; Fushimi, A.; Fujitani, Y.; Chatani, S.; Tanabe, K.; Takami, A.; et al. Formation of secondary organic aerosol tracers from anthropogenic and biogenic volatile organic compounds under varied NOx and oxidant conditions. Atmos. Environ. X 2022, 14, 100169. [Google Scholar] [CrossRef]
- Ren, Y.; Qu, Z.; Du, Y.; Xu, R.; Ma, D.; Yang, G.; Shi, Y.; Fan, X.; Tani, A.; Guo, P.; et al. Air quality and health effects of biogenic volatile organic compounds emissions from urban green spaces and the mitigation strategies. Environ. Pollut. 2017, 230, 849–861. [Google Scholar] [CrossRef] [PubMed]
- Morakinyo, T.E.; Lam, Y.F. Study of traffic-related pollutant removal from street canyon with trees: Dispersion and deposition perspective. Environ. Sci. Pollut. Res. 2016, 23, 21652–21668. [Google Scholar] [CrossRef]
- Hong, S.-Y.; Lim, J.-O.J. WRF Single-Moment 6-Class Microphysics Scheme (WSM6). J. Korean Meteor. Soc. 2006, 42, 129–151. [Google Scholar]
- Bougeault, P.; Lacarrere, P. Parameterization of Orography-Induced Turbulence in a Mesobeta--Scale Model. Mon. Weath. Rev. 1989, 117, 1872–1890. [Google Scholar] [CrossRef]
- Janjić, Z.I. The step-mountain eta coordinate model: Further developments of the convection, viscous sublayer, and turbulence closure schemes. Mon. Weath. Rev. 1994, 122, 927–945. [Google Scholar] [CrossRef]
- Chen, F.; Dudhia, J. Coupling an advanced land surface-hydrology model with the Penn State-NCAR MM5 modeling system. Part I: Model implementation and sensitivity. Mon. Weath. Rev. 2001, 129, 569–585. [Google Scholar] [CrossRef]
- Schwarzkopf, M.D.; and Fels, S.B. The simplified exchange method revisited: An accurate, rapid method for computation of infrared cooling rates and fluxes. J. Geophys. Res. Atmos. 1991, 96, D5. [Google Scholar] [CrossRef]
- Iacono, M.J.; Delamere, J.S.; Mlawer, E.J.; Shephard, M.W.; Clough, S.A.; Collins, W.D. Radiative forcing by long-lived greenhouse gases: Calculations with the AER radiative transfer models. J. Geophys. Res. Atmos. 2008, 113, D13103. [Google Scholar] [CrossRef]
- Dudhia, J. Numerical study of convection observed during the winter monsoon experiment using a mesoscale two-dimensional model. J. Atmos. Sci. 1989, 46, 3077–3107. [Google Scholar] [CrossRef]


| City | MMT (°C) | Heat ERR% (95% Confidence Interval) | Cold ERR% (95% Confidence Interval) |
|---|---|---|---|
| Madrid | 21.4 | 3.2 (0.6, 5.8) | 2.7 (1.5, 3.9) |
| Milano and Bologna | 21.8 | 8.3 (2.5, 14.4) | −1.1 (−5.2, 3.3) |
| City | T (°C) | (95% Confidence Interval in Brackets) | |||
|---|---|---|---|---|---|
| Heat | Cold | Heat Deaths | Cold Deaths | Net Change in Temperature-Related Mortality | |
| Madrid | −7.7 | 6.5 | −7.4 (−1.4, −13.4) | 3.2 (1.8, 4.7) | −4.1 (−11.6, 3.3) |
| Milano | 0.1 | 2.4 | 0.9 (0.3, 1.6) | −2.1 (−10.0, 6.3) | −1.2 (−9.7, 8.0) |
| Bologna | −0.7 | 2.0 | −0.4 (−0.1, −0.6) | −3.0 (−14.1, 8.9) | −3.4 (−14.3, 8.8) |
Disclaimer/Publisher’s Note: The statements, opinions and data contained in all publications are solely those of the individual author(s) and contributor(s) and not of MDPI and/or the editor(s). MDPI and/or the editor(s) disclaim responsibility for any injury to people or property resulting from any ideas, methods, instructions or products referred to in the content. |
© 2025 by the authors. Licensee MDPI, Basel, Switzerland. This article is an open access article distributed under the terms and conditions of the Creative Commons Attribution (CC BY) license (https://creativecommons.org/licenses/by/4.0/).
Share and Cite
de Andrés, J.M.; D’Elia, I.; de la Paz, D.; D’Isidoro, M.; Russo, F.; Mircea, M.; Gualtieri, M.; Vardoulakis, S.; Borge, R. City-Scale Revegetation Strategies Impact on the Temperature-Related Long-Term Mortality: A Quantitative Assessment in Three Cities in Southern Europe. Forests 2025, 16, 1089. https://doi.org/10.3390/f16071089
de Andrés JM, D’Elia I, de la Paz D, D’Isidoro M, Russo F, Mircea M, Gualtieri M, Vardoulakis S, Borge R. City-Scale Revegetation Strategies Impact on the Temperature-Related Long-Term Mortality: A Quantitative Assessment in Three Cities in Southern Europe. Forests. 2025; 16(7):1089. https://doi.org/10.3390/f16071089
Chicago/Turabian Stylede Andrés, Juan Manuel, Ilaria D’Elia, David de la Paz, Massimo D’Isidoro, Felicita Russo, Mihaela Mircea, Maurizio Gualtieri, Sotiris Vardoulakis, and Rafael Borge. 2025. "City-Scale Revegetation Strategies Impact on the Temperature-Related Long-Term Mortality: A Quantitative Assessment in Three Cities in Southern Europe" Forests 16, no. 7: 1089. https://doi.org/10.3390/f16071089
APA Stylede Andrés, J. M., D’Elia, I., de la Paz, D., D’Isidoro, M., Russo, F., Mircea, M., Gualtieri, M., Vardoulakis, S., & Borge, R. (2025). City-Scale Revegetation Strategies Impact on the Temperature-Related Long-Term Mortality: A Quantitative Assessment in Three Cities in Southern Europe. Forests, 16(7), 1089. https://doi.org/10.3390/f16071089