Abstract
To address the issue of low recognition accuracy caused by the high morphological similarity of mangrove plant leaves, this study proposes a rapid identification method for mangrove leaves based on the YOLOv10 model, with corresponding improvements made to the baseline model. First, the open-source tool LabelImg was employed to annotate leaf images and construct a mangrove leaf species dataset. Subsequently, a PSA attention mechanism was introduced to enhance the extraction of leaf detail features, while the SCDown downsampling method was adopted to preserve key characteristics. Furthermore, a BiFPN architecture incorporating SE modules was implemented to dynamically adjust channel weights for multi-scale feature fusion. Finally, the classification and regression tasks are decoupled by separating the detection head, and the final model is named YOLOv10-MSDet. Experimental results demonstrate that the improved model achieves rapid and accurate identification of various mangrove leaf species, with an average recognition accuracy of 92.4%—a 2.84 percentage point improvement over the baseline model, significantly enhancing the precision of mangrove leaf detection.
1. Introduction
Mangrove forests, unique forest communities found in tropical and subtropical coastal zones, play a vital role in ecosystems. However, over recent decades, due to population pressures and economic development, global mangrove coverage has continued to decline. According to a 2021 report by the Global Mangrove Alliance, the net loss of mangroves over the 20 years prior to 2016 was approximately 4.3%. Therefore, the protection of mangrove species is urgent. To conserve mangroves, accurate identification is essential. Globally, there are 86 species of mangrove plants, belonging to 30 genera across 24 families. Given the similarities and complexity of the mangrove world, it is particularly important to automatically, non-destructively, and efficiently extract leaf information from leaf images and accurately identify mangrove species.
In recent years, researchers have employed classical machine learning algorithms and deep learning models to identify various plant species from different plant datasets. Machine learning-based plant classification methods typically use Support Vector Machines (SVMs), Artificial Neural Networks (ANNs), Random Forests (RFs), and k-Nearest Neighbors (kNN). Shao Xinqing et al. [1] explored plant identification techniques based on leaf images, including traditional methods such as shape features (Fourier descriptors) and texture features (Gray-Level Co-occurrence Matrix) combined with classifiers (e.g., kNN, SVM). They noted that traditional methods achieve limited recognition rates (around 70%–85%) under single-feature conditions and require multi-feature fusion to improve performance. Zhang Xueqin et al. [2] optimized the P-AlexNet model by enhancing convolutional structures (e.g., Inception modules) and contrastive loss functions to improve the extraction of fine plant features. On a 206-class plant dataset (Oxford102 + Ecust104), their model achieved a validation accuracy of 86.7% and was deployed in a cross-platform recognition application with an average detection time of 1.282 s. Wu Yuqiang et al. [3] compared six models (AlexNet, VGG16, ResNet50, and variants of ViT) for classifying eight edible wild vegetables and introduced attention mechanisms (CBAM, CA) to optimize ResNet50. Their proposed CA-ResNet50 achieved the highest accuracy (98.34%), significantly outperforming ViT models, demonstrating the superiority of CNNs on small datasets. Zhang Shuai et al. [4] designed an eight-layer Convolutional Neural Network (CNN) combined with SVM/Softmax classifiers to process leaf images with both simple and complex backgrounds. On the Pl@antNet dataset and a self-built dataset, their model achieved recognition rates of 91.11% for simple-background images and 83.24% for complex-background images. Chen Xiaomeng et al. [5] integrated wavelet transforms and Variable Local Edge Patterns (VLEPs) to extract multi-resolution texture features from leaves, proposing a method that outperformed traditional texture-based approaches on specific datasets.
The process of feature extraction for classification in machine learning is challenging, and the effectiveness of feature extraction significantly impacts classification results. Unlike traditional machine learning methods, deep learning eliminates the need for manual feature extraction, offering stronger adaptability and generalization capabilities. It can efficiently handle large-scale data and perform highly complex tasks. Deep learning-based plant classification methods typically employ Convolutional Neural Networks (CNNs) and Residual Networks (ResNets) along with their variants. Sladojevic et al. [6] used a CNN to classify 13 different plant diseases, achieving an average accuracy of 96.3%. Mohanty et al. [7] applied CNN models such as AlexNet and GoogLeNet for plant disease classification, reaching an accuracy of 99.35%. Geetharamani et al. [8] trained a nine-layer CNN architecture on the PlantVillage dataset with varying epochs, batch sizes, and dropout rates, comparing its performance with popular transfer learning methods. Their model achieved a classification accuracy of 96.46% on the test dataset. Ferentinos et al. [9] classified 58 different diseases across 25 plant species using 87,848 images and architectures such as AlexNet, AlexNetOWTBn, GoogLeNet, Overfeat, and VGG. The VGG architecture yielded the highest accuracy at 99.53%. Atila et al. [10] proposed the EfficientNet deep learning architecture for plant leaf disease classification, achieving accuracies of 99.91% and 99.97% on the original and augmented datasets, respectively, with precision rates of 98.42% and 99.39%. Although the convolution neural network has been deeply studied in the field of forestry and agriculture on the identification of leaf disease images, the traditional convolution neural network still has the following defects: CNN is sensitive to the size and aspect ratio of the input image, and cannot handle images of different sizes and proportions well. CNN usually uses a convolution kernel and pooling layer to extract image features, which is not flexible enough. In CNN, the receptive field of the convolution kernel is usually small, and it can only learn the local features of the image, and cannot process the global information well. Improving the recognition accuracy of high-similarity blade samples is still a problem that needs to be solved urgently in the current target detection field.
Deep learning-based object detection algorithms can be categorized into one-stage and two-stage approaches. The two-stage algorithms, represented by the R-CNN series, first employ CNNs to generate region proposals from images, then refine these proposals through secondary screening to select high-confidence bounding boxes. This dual-stage process enables higher detection accuracy and lower computational requirements, albeit at the cost of slower processing speed [11]. To address these limitations, single-stage detectors like the YOLO series process images through a unified network that simultaneously extracts features and predicts bounding boxes in a single pass. This architecture demonstrates superior efficiency and accuracy in real-time detection tasks, making it particularly suitable for intelligent monitoring of mangrove leaf conditions—the primary objective of this study.
Recent research has proved the effectiveness of YOLO series models in vegetation classification and forest fire prevention warning. For instance, Chen and Zhou et al. integrated hyperspectral data with YOLO for real-time classification of tropical tree species, achieving promising results [12,13,14]. Wang et al. improved the YOLOv5 model and applied it to UAV images to effectively monitor individual trees in artificial forests, while Li et al. used YOLO algorithm to detect and locate objects in complex forest terrain [15,16]. These works highlight the potential of YOLO architecture in handling complex vegetation scenarios with real-time requirements.
However, these methods have limitations in distinguishing objects with high morphological similarity, which prompted researchers to propose an improvement combining an attention mechanism and multi-scale fusion. To address issues such as insufficient feature extraction capability and reduced detection speed after processing prediction boxes, Li et al. proposed an anchor-free lightweight detection algorithm based on multi-scale feature fusion [17]. For the problem of low defect detection accuracy in complex scenarios with existing object detection algorithms, Zhao et al. introduced a defect detection method based on a scale-invariant feature pyramid [18]. However, the above methods only involve algorithmic improvements tailored to specific scenarios. In the forestry sector, Zhou et al. proposed a deep learning-based small-target detection method for disaster-affected trees to tackle challenges such as small tree scales, dense growth, and irregular distribution in UAV forest images [19]. Yao et al. presented a multi-resolution feature fusion-based object detection method for remote sensing images [20]. The YOLO object detection model has undergone several iterations, successively addressing issues across multiple dimensions, including multi-object detection, small-target detection, missed detection correction, and multi-scale prediction. Meanwhile, the YOLO series models possess a strong global receptive field [21,22,23,24]. By employing grid division, anchor box matching, and multi-semantic fusion detection mechanisms, they effectively mitigate limitations in the receptive field during detection, thereby achieving rapid target detection. As far as we know, there is no research on the advantages of using a YOLO model to classify mangrove leaves. Leveraging the advantages of object detection—such as automatic feature learning, high speed, and efficiency—the primary objective of this study is to better apply this method to individual mangrove tree detection, enabling intelligent monitoring of mangrove forest conditions.
In this study, our objectives are (1) to overcome the sub-90% accuracy limitation of current YOLO models in fine-grained mangrove leaf recognition within natural environments; (2) to reduce model complexity for deployability in resource-constrained field settings; and (3) to achieve simultaneous high recognition accuracy and real-time processing speed for practical applications. Our research employs a lightweight improved YOLOv10 architecture, integrating the PSA (Pyramid Spatial Attention) mechanism to enhance fine leaf detail capture and SCDown (Strided Convolution Downsampling) to preserve critical features during resolution reduction. Through these optimizations, we aim to advance performance in complex mangrove leaf recognition tasks while maintaining operational efficiency.
2. Dataset and Preprocessing
2.1. Experimental Dataset
Two datasets of mangrove family plant leaves were used: one collected in a controlled experimental environment and the other in a real-world setting. The experimental dataset consists of leaf images independently photographed and compiled by our laboratory for deep learning purposes, using a Canon 5D Mark IV camera. It includes leaves from eight mangrove species: Sonneratia apetala, Kandelia candel, Excoecaria agallocha, Clerodendrum inerme, Hibiscus tiliaceus, Rhizophora stylosa, Scaevola taccada, and Pongamia pinnata (as shown in Figure 1). The dataset contains a total of 4000 images, with approximately 500 samples per species. These images are divided into a training set (2400 images), a validation set (800 images), and a test set (800 images), all resized to a uniform resolution of 224 × 224 pixels.
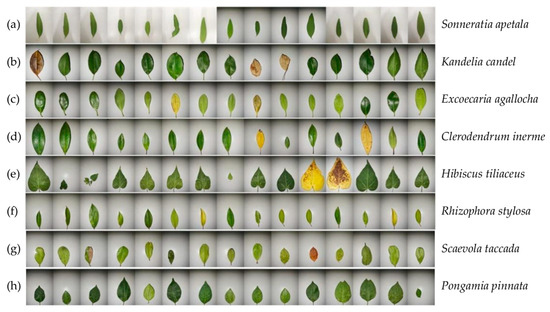
Figure 1.
Sample images from the experimental leaf dataset.
2.2. Unconstrained Real-World Leaf Dataset
Datasets collected in controlled experimental environments typically feature clean and uniform backgrounds. While many studies have achieved excellent classification performance on such datasets, their results often degrade significantly when applied to real-world datasets. However, identifying leaves against natural backgrounds is an essential research direction—both from the practical perspective of “photo-based recognition” and to minimize environmental disturbance during data collection. Therefore, this study selected the Jinsha Bay Mangrove Ecological Park within the Zhanjiang Mangrove National Nature Reserve in Guangdong, China, as the research site. In November 2024, we photographed the same eight mangrove species as in the experimental dataset (shown in Figure 2), capturing approximately 400 images per species (4000 images total). The dataset was split into 3200 training images and 800 test images. During photography, we ensured that the target leaves occupied most of the frame and used focus techniques to keep the leaves sharp while blurring the background. The original images had a resolution of 2532 × 1170 pixels but were manually resized to the model’s required input size of 224 × 224. Unlike the experimental dataset, leaves of the same species in real-world conditions exhibit variations in shape and color. Additionally, the background includes complex elements such as ground surfaces, buildings, shrubs, grass, pedestrians, and other vegetation. Occlusion between leaves also creates shadows, as illustrated in Figure 2.
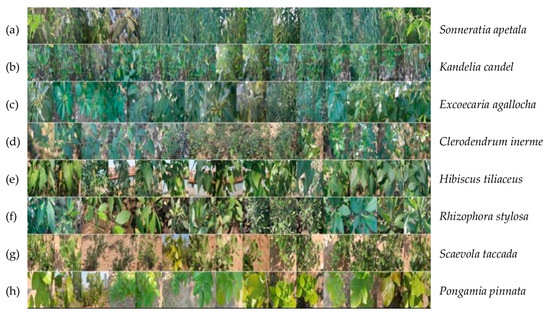
Figure 2.
Real-world leaf dataset samples.
3. Principle of the YOLOv10 Object Detection Algorithm
3.1. YOLOv10 Model Architecture
YOLOv10 is one of the iterative versions in this series of models. It inherits the advantages of previous YOLO models while introducing several novel improvements to further enhance object detection performance. The post-upgrade performance analysis is shown in Figure 3, and the detailed network architecture is illustrated in Figure 4 [25].
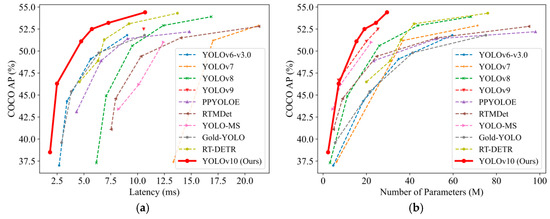
Figure 3.
YOLOv10 compared to nine alternative trained models [25]: (a) training latency graph; (b) parameter comparison graph.
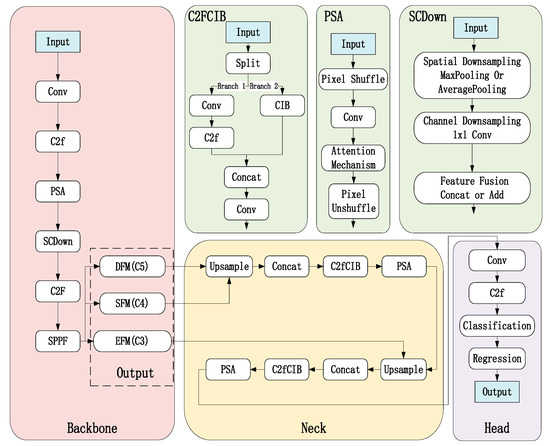
Figure 4.
Structural diagram of YOLOv10 network.
YOLOv10 proposes a consistent dual-assignment strategy, eliminating the training dependency on non-maximum suppression (NMS) in the YOLO series [25]. It adopts a holistic efficiency- and accuracy-driven model design strategy, significantly improving both performance and efficiency. The architecture of YOLOv10 consists of three main components: the backbone, the feature fusion module (neck), and the detection head. In the backbone network, YOLOv10 retains the C2f and SPPF structures from YOLOv8 while introducing three new modules: SCDown, C2fUIB, and a PSA) mechanism [26]. SCDown achieves spatial and channel-separated downsampling by sequentially combining pointwise convolutions with depthwise convolutions. C2fCIB, as the core building block of YOLOv10, employs a compact inverted block structure [27]. It utilizes efficient depthwise convolutions for spatial information mixing and low-cost pointwise convolutions for cross-channel fusion. Additionally, YOLOv10 introduces an efficient PSA mechanism to address the high computational complexity of traditional self-attention approaches [28]. For feature fusion, YOLOv10 adopts a Path Aggregation Network (PANet) layer to effectively integrate multi-scale features, thereby enhancing detection performance for objects of varying sizes. In the detection head, YOLOv10 utilizes two lightweight heads: a one-to-one head and a one-to-many head, further optimizing both training efficiency and detection accuracy.
3.2. Model Improvement and Optimization
To further optimize YOLOv10’s comprehensive performance in distinguishing mangrove species leaves and address practical application challenges, this study proposes improvements to YOLOv10n based on the following characteristics of mangrove leaf recognition tasks:
- Similar leaf morphology: Leaves from different species may exhibit highly similar shapes, textures, and colors;
- Multi-scale targets: Varying leaf sizes may appear in the same image at different scales;
- Complex backgrounds: Mangrove environments contain interfering elements like branches, water surfaces, and mud;
- Limited data: Mangrove leaf datasets are typically small with significant class imbalance issues.
The proposed enhancements focus on three key components: the backbone network, feature fusion network, and detection head. The improved YOLOv10 model is named YOLOv10-MSDet, as shown in Figure 5 below.
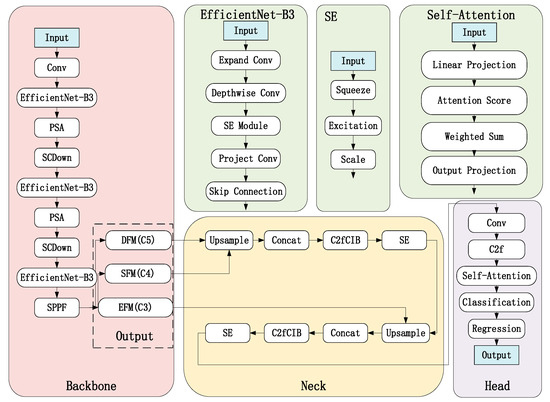
Figure 5.
Structural diagram of the modified YOLOv10 network.
3.2.1. Backbone
The original CSPDarknet53 was replaced with EfficientNet-B3 to enhance feature extraction efficiency. As shown in Figure 6, compound scaling is employed to balance depth, width, and resolution, enabling richer feature extraction under limited computational resources—particularly suitable for capturing subtle variations in leaf texture and color. A PSA module was added after each stage to strengthen attention to leaf textures and shapes. Through pixel shuffling and attention mechanisms, it enhances focus on local leaf details (e.g., veins, edges), improving discrimination between similar leaves. The SCDown module was incorporated to reduce resolution while preserving leaf detail information. These modifications collectively enhance feature extraction capability while maintaining detailed information, making the network particularly effective for handling similar leaf morphology and recognition in complex backgrounds.
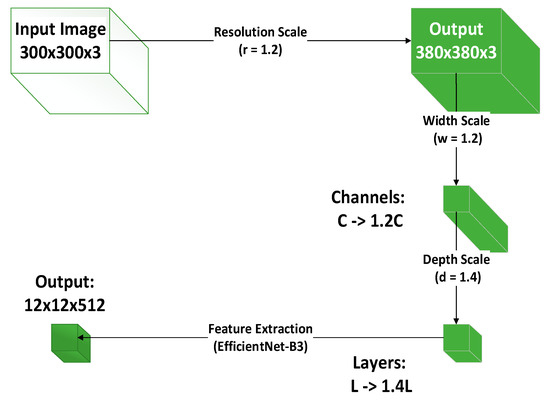
Figure 6.
EfficientNet-B3 compound scaling implementation diagram.
The compound scaling in EfficientNet-B3 follows this formula:
α, β, γ are the base coefficients determined through Neural Architecture Search (NAS). ϕ is a user-defined scaling factor used to control the computational load of the model. d is the depth scaling factor, which increases the number of network layers to enhance the model’s expressive capability; w is the width scaling factor, which increases the number of channels per layer to improve feature extraction ability; r is the resolution scaling factor, which increases the input image resolution to enhance the model’s ability to capture fine details.
The PSA module transforms a feature map of size into a feature map of size by converting channel dimension information into spatial dimension information through a pixel shuffle operation. Subsequently, a 3 × 3 convolution operation is applied to the shuffled feature map to extract features, followed by the application of an attention mechanism to the convolved feature map to generate attention weights. These attention weights are then multiplied with the feature map to enhance the features of important regions. Finally, the feature map is restored to its original resolution .
The SCDown module employs strided convolution or pooling operations to reduce spatial resolution, outputting a feature map of size . A 1 × 1 convolution is then used to decrease the number of channels, producing a feature map of size . Ultimately, the results of spatial downsampling and channel downsampling are fused, yielding an output feature map of size .
3.2.2. Neck
The original FPN is replaced with BiFPN (Bidirectional Feature Pyramid Network with Weighted Features) to achieve more efficient multi-scale feature fusion. By leveraging weighted bidirectional feature fusion, it can more effectively integrate multi-scale features, making it suitable for processing leaves of varying sizes. An SE (Squeeze-and-Excitation) module is added after each node in the BiFPN to dynamically adjust channel weights, enhancing focus on leaf details. Additionally, the C2fCIB (C2f with Cross Interaction Block) module is introduced to strengthen feature interaction capabilities. Through a channel attention mechanism, it dynamically adjusts the weights of feature channels, enhancing attention to critical features. After these enhancements, the model exhibits stronger multi-scale feature fusion capabilities, making it better suited for detecting multi-scale leaf targets. The channel attention mechanism and feature interaction module further improve focus on key leaf features.
As shown in Figure 7, the BiFPN fuses multi-scale features as follows:
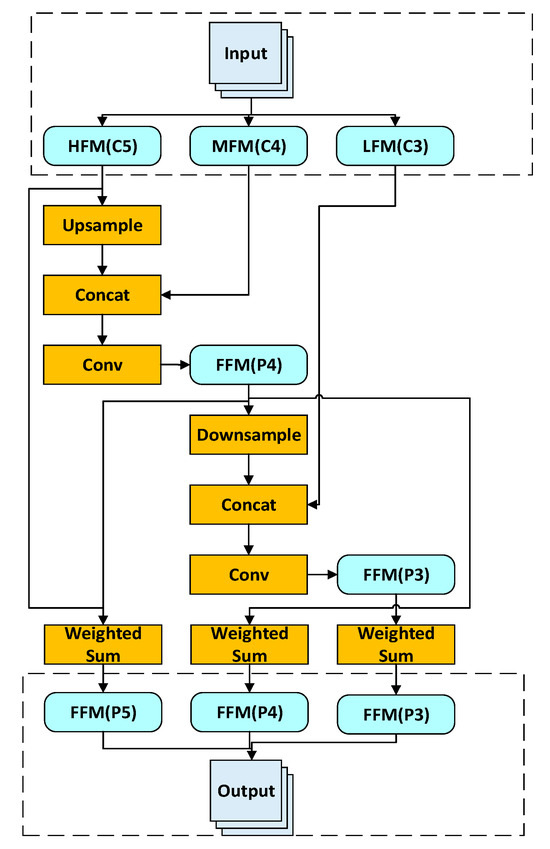
Figure 7.
BiFPN multi-scale feature fusion workflow.
- Top-down path: High-level features (C5) are upsampled and concatenated with mid-level features (C4). The concatenated feature map undergoes a convolution operation to generate the fused feature map (P4);
- Bottom-up path: Mid-level features (P4) are downsampled and concatenated with low-level features (C3). The concatenated feature map is then convolved to produce the fused feature map (P3);
- Finally, the fused feature maps undergo weighted summation to generate the final multi-scale feature maps (P3, P4, P5).
The SE module employs Global Average Pooling (GAP) to compress spatial dimensions, generating a channel descriptor of size . Two fully connected (FC) layers are then applied: the first FC layer reduces channel dimensionality (e.g., ), followed by a ReLU activation; the second FC layer restores channel count (e.g., ); a Sigmoid activation is then used to produce channel-wise weights, which are multiplied with the input feature map in a channel-wise manner, yielding a weighted output feature map of size .
The C2fCIB module splits the input feature map into two parallel branches: a main branch for feature extraction using the C2f module, outputting feature maps of size ; and an interaction branch employing Cross Interaction Block (CIB) for feature interaction, yielding feature maps of size . The outputs from both branches are then concatenated, followed by a convolutional operation to further fuse the features. The final output feature maps have dimensions .
3.2.3. Head
We employ a decoupled detection head to independently optimize classification and regression tasks, effectively separating these two objectives to mitigate task interference and improve classification accuracy. Within the classification branch, we integrate Focal Loss to address class imbalance issues and CIoU Loss to optimize bounding box regression performance. Furthermore, we incorporate a Self-Attention module that enhances focus on key leaf regions through its attention mechanism, significantly boosting the model’s ability to distinguish between visually similar leaf specimens. This comprehensive approach ensures task-specific optimization while preventing cross-task conflicts, provides robust handling of imbalanced class distributions, and delivers enhanced feature representation for fine-grained leaf recognition tasks.
To tackle the challenge of imbalanced class distribution in the mangrove species leaf dataset (where some categories have significantly fewer samples than others, leading to insufficient learning of minority classes), this study adopts Focal Loss. This modified loss function directs greater attention to hard-to-classify samples. Focal Loss improves upon the standard Cross-Entropy Loss, with its formulation as follows:
In the formulation, represents the predicted probability, denotes the class weight for balancing positive/negative samples, and is the modulating factor that reduces weights for easy-to-classify samples.
By employing to diminish the loss contribution from easily classified samples, the model focuses more on hard-to-classify cases, thereby enhancing recognition capability for minority classes. To address the gradient vanishing and alignment issues of traditional IoU Loss in bounding box regression, CIoU Loss is adopted, which comprehensively considers three geometric factors: IoU value, center-point distance, and aspect ratio. This integrated approach significantly improves bounding box localization accuracy. The CIoU Loss is formulated as:
In the formulation, represents Intersection over Union (IoU); denotes the Euclidean distance between predicted and ground truth box centers; c indicates the diagonal length of the minimum enclosing rectangle; measures aspect ratio consistency; is the weighting coefficient.
The Self-Attention module enhances focus on key leaf regions by dynamically adjusting feature weights through calculating spatial relationships within the feature map. Specifically, the input features are first projected into Query (Q), Key (K), and Value (V) representations using 1 × 1 convolutions, where Q and K are used to compute attention weights via dot product operations, followed by Softmax normalization to obtain the final attention distribution. These attention weights are then applied to V through weighted summation to generate context-aware features. Finally, another 1 × 1 convolution projects these weighted features to restore the original channel dimensions, producing the output feature map with enhanced discriminative power for leaf analysis (as illustrated in Figure 8). This attention mechanism enables the model to adaptively emphasize morphologically significant regions while suppressing irrelevant background information.
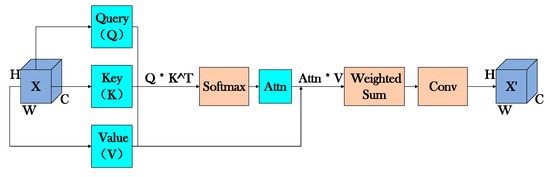
Figure 8.
Self-Attention module operational flowchart.
4. Experimental Results
4.1. Experimental Environment and Configuration
All model training and experimental hardware configurations in this study are detailed in Table 1.

Table 1.
Experimental environment.
In this experiment, the stochastic gradient descent (SGD) optimizer was employed with a momentum factor of 0.9 and weight decay ratio of 5 × 10⁻⁴. The learning rate was initialized at 0.001 and dynamically adjusted using the torch.optim.lr_scheduler module in the PyTorch framework. The entire training process was terminated at the 100th epoch. All experiments were conducted using default parameters.
4.2. Evaluation Metrics
To quantitatively evaluate the performance of the classification algorithm, we employ Recall and Precision along with their composite metric F1-score as evaluation indicators. The formula for Recall is defined as follows:
TP (True Positives) represents the quantity of actual positive instances correctly detected by the model, while FN (False Negatives) denotes the number of genuine positives that the model failed to identify. Recall quantitatively measures the model’s effectiveness in recognizing true positives among all existing positives—a higher recall value directly correlates with enhanced detection capability of actual targets, demonstrating superior model recognition performance.
The precision metric for object detection is formally defined by the following equation:
TP (True Positives) refers to the number of samples correctly predicted as positive (i.e., true targets), while FP (False Positives) represents samples incorrectly predicted as positive (actual negatives). Precision is defined as the proportion of true positives among all samples predicted as positive (target present). Higher precision indicates a greater ratio of genuine positives in the model’s positive predictions, reflecting more reliable results. In object detection, models with high precision significantly reduce false alarms (misclassifying background as targets), which is particularly crucial for high-reliability applications. Finally, F1-score represents the harmonic mean of precision and recall, as shown in Equation (8):
4.3. Results Analysis
4.3.1. Experimental Results of the Standard YOLOv10 Model
First, the standard YOLOv10 algorithm was trained and tested. The experimental results are shown in Figure 9, and the test results are displayed in Figure 10. Through a comprehensive analysis of the loss function and performance metrics, as presented in Table 2, the following conclusions are drawn.
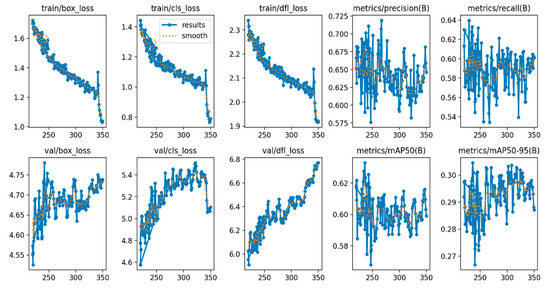
Figure 9.
Training results of the standard YOLOv10 algorithm.
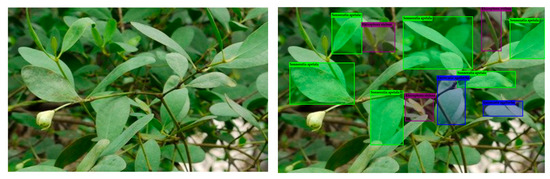
Figure 10.
The test results of the standard YOLOv10 algorithm.
Table 2.
Performance metrics analysis of standard YOLOv10 algorithm.
As evidenced in Table 2, the traditional YOLOv10 model demonstrates good convergence during the training process. Although the training loss gradually decreases, the improvements in precision and recall are limited, fluctuating around a maximum of 0.7, which is insufficient to meet the recognition requirements for mangrove species leaf classification. Additionally, there is some fluctuation in the validation loss.
4.3.2. Experimental Results of the Improved YOLOv10 Model
First, the improved YOLOv10 algorithm was trained and tested, with the experimental results shown in Figure 11; the test results are presented in Figure 12. Through a comprehensive analysis of the loss function and performance metrics (as shown in Table 3), the following conclusions were drawn.
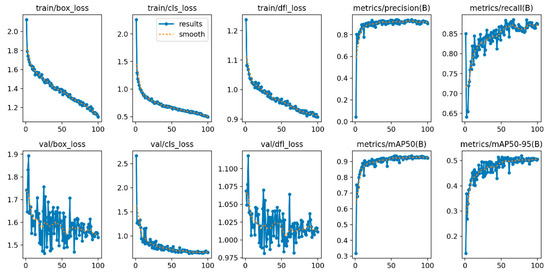
Figure 11.
Training results of the improved YOLOv10 algorithm.
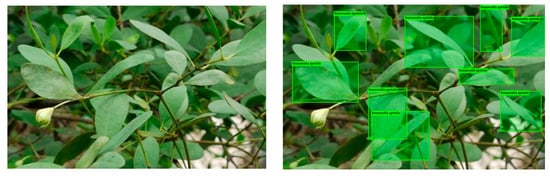
Figure 12.
The test results of the improved YOLOv10 algorithm.
Table 3.
Performance metrics analysis of improved YOLOv10 algorithm.
As evidenced in Table 3, the YOLOv10-MSDet model exhibits favorable convergence characteristics during training, demonstrating a consistent decline in training loss alongside sustained improvements in both precision and recall rates while maintaining high recognition accuracy. Furthermore, the mAP metrics on the validation set reveal robust performance stability across varying IoU thresholds. In summary, the YOLOv10-MSDet model achieves superior recognition accuracy and enhanced generalization capability, delivering more optimal performance compared to the YOLOv10 model for mangrove leaf species identification tasks.
4.3.3. Comparative Analysis of Various Algorithms
To validate the generalization capability of theYOLOv10-MSDet algorithm, this study conducted comparative experiments with YOLOv5s, YOLOX, YOLOv7-tiny, YOLOv8n, and the original YOLOv10 on a self-annotated dataset. The experiments focused on leaf images of eight mangrove species: Sonneratia apetala, Kandelia candel, Excoecaria agallocha, Clerodendrum inerme, Hibiscus tiliaceus, Rhizophora stylosa, Scaevola taccada, and Pongamia pinnata. As shown in Table 4, the YOLOv10-MSDet achieved the highest detection accuracy across all eight plant categories, with a mean average precision (mAP) of 92.4%; this represents a 2.84% improvement over the baseline YOLOv10 model. Notably, the recall rate for minority categories (e.g., Pongamia pinnata) shows a significant 8.5% enhancement, substantially outperforming other comparative algorithms. Furthermore, we also conducted comparative analyses in terms of parameter count, processing speed, and training time. As shown in Table 5, YOLOv10-MSDet achieves the most significant mAP improvement (+2.8%) with the smallest parameter increment (+9.7% vs YOLOv10n). Its computational cost (8.3 GFLOPs) is 49.7% lower than YOLOv5s while achieving 4.8 percentage points higher accuracy, demonstrating the efficiency of our improvement strategy. Notably, the model exhibits excellent energy efficiency (29.1W), consuming only 6.6% more power than YOLOv10n while being significantly more efficient than YOLOX-s (42.7W). These findings indicate that YOLOv10-MSDet delivers superior performance on our self-annotated dataset, confirming its strong applicability for mangrove species leaf identification and classification tasks.
Table 4.
The experimental results of mangrove leaf species across different network models.
Table 5.
The experimental results of FPS and other metrics across different network models.
In our opinion, quantitative degradation of dataset images, such as low resolution, will reduce the details of leaves, increase the difficulty of feature extraction, and lead to model misjudgment of scale or confusion of noise; qualitative degradation, such as complex background and overlapping of multiple leaves, introduces occlusion, background interference and domain offset, and destroys the false correlation learned by the model in the experimental data. Both of them reduce the classification accuracy and generalization ability of the model. To alleviate this problem, we need to constantly improve and optimize excellent models like YOLO to enhance their robustness in real-world scenarios.
5. Conclusions
The proposed YOLOv10-MSDet model significantly enhances mangrove leaf recognition accuracy (92.4% mAP) through PSA attention, SCDown downsampling, and BiFPN fusion, outperforming YOLOv10 by 2.84 percentage points. The model’s ability to distinguish morphologically similar species in complex backgrounds represents a notable advancement for field botany applications. While demonstrating strong performance, the current implementation requires approximately 18 GB GPU memory during training, suggesting the need for model compression techniques when deploying to edge devices in coastal monitoring stations. Future iterations could incorporate real-time adaptive sampling strategies to handle leaf occlusion scenarios commonly encountered in dense mangrove forests. The integration of temporal analysis modules may further enable tracking of phenological changes in mangrove leaves across seasons. This work establishes an important benchmark for computer vision applications in wetland ecosystems, with immediate potential for integration with existing mangrove conservation platforms like the Global Mangrove Watch. The developed techniques may also be adapted for other challenging plant identification tasks in tropical rainforests and coastal wetlands. Ultimately, this research provides both a practical tool for ecological monitoring and a flexible framework for future enhancements in vegetation analysis.
Author Contributions
Conceptualization, H.S.; methodology, H.S., Z.L., and X.S.; software, Z.L. and Y.Z.; validation, H.S., Z.L., and S.W.; formal analysis, H.S., Z.L., and X.S.; investigation, H.S. and Z.L.; resources, H.S., Z.L., and S.W.; data curation, H.S., Z.L., and Y.Z.; writing—original draft preparation, H.S., Z.L., and X.S.; writing—review and editing, H.S.; visualization, Z.L. and X.S.; supervision, H.S.; project administration, H.S.; funding acquisition, H.S. All authors have read and agreed to the published version of the manuscript.
Funding
This research was funded by the Program of Science and Technology of Shenzhen (NO. KCXFZ20230731094059009) and the National Natural Science Foundation of China (NO. 50742201361); 2023 Provincial Science and Technology Innovation Strategy Special Fund Competitive Allocation Project (2023A01025, 2023A01021); 2023 Guangdong Provincial Department of Education General University Research Project (No. 2023KTSCX070); 2023 and 2024 Guangdong Province Scientific and Technological Innovation Strategy Special Fund (College Student Science and Technology Innovation Cultivation) Project (pdjh2024a237, pdjh2023b0322); LINGNAN Normal University Mangrove Intelligent Monitoring Innovation Team Project (LT2406).
Data Availability Statement
Data is contained within the article.
Acknowledgments
The authors sincerely appreciate the contributions of everyone involved in the field survey.
Conflicts of Interest
The authors declare no conflicts of interest.
References
- Shao, X.; Feng, Q.; Shao, S.; Wang, J.; Wang, Y. Research progress in plant identification technology based on leaf images. J. Gansu Agric. Univ. 2010, 45, 156–160. [Google Scholar]
- Zhang, X.; Chen, J.; Zhuge, J.; Yu, L. Fast plant image recognition based on deep learning. J. East China Univ. Sci. Technol. 2018, 44, 887–895. [Google Scholar]
- Wu, Y.; Sun, X.; Ji, C.M.; Hu, N.J. Recognition of edible wild vegetable species based on deep learning. China Cucurbits Veg. 2024, 37, 57–66. [Google Scholar]
- Zhang, S.; Huai, Y. Plant leaf recognition using hierarchical convolutional deep learning system. J. Beijing For. Univ. 2016, 38, 108–115. [Google Scholar]
- Chen, X.; Wang, Y.; Xing, S.X. Plant Species Recognition Based on Wavelet and Variable Local Edge Patterns. Comput. Appl. Softw. 2018, 35, 230–235. [Google Scholar]
- Sladojevic, S.; Arsenovic, M.; Anderla, A.; Culibrk, D.; Stefanovic, D. Deep Neural Networks Based Recognition of Plant Diseases by Leaf Image Classification. Comput. Intell. Neurosci. 2016, 2016, 3289801. [Google Scholar] [CrossRef]
- Mohanty, S.P.; Hughes, D.P.; Salathe, M. Using deep learning for image-based plant disease detection. Front. Plant Sci. 2016, 7, 215232. [Google Scholar] [CrossRef]
- Geetharamani, G.; Pandian, A.J. Identification of plant leaf diseases using a nine-layer deep convolutional neural network. Comput. Electr. Eng. 2019, 76, 323–338. [Google Scholar] [CrossRef]
- Konstantinos, P. Ferentinos, Deep learning models for plant disease detection and diagnosis. Comput. Electron. Agric. 2018, 145, 311–318. [Google Scholar] [CrossRef]
- Atila, Ü.; Uçar, M.; Akyol, K.; Uçar, E. Plant leaf disease classification using EfficientNet deep learning model. Ecol. Inform. 2021, 61, 101182. [Google Scholar] [CrossRef]
- Brahimi, M.; Boukhalfa, K.; Moussaoui, A. Deep Learning for Tomato Diseases: Classification and Symptoms Visualization. Appl. Artif. Intell. 2017, 31, 299–315. [Google Scholar] [CrossRef]
- Chen, Z.; Chen, B.; Huang, Y.; Zhou, Z. GE-YOLO for Weed Detection in Rice Paddy Fields. Appl. Sci. 2025, 15, 2823. [Google Scholar] [CrossRef]
- Zhou, Q.; Li, H.; Cai, Z.; Zhong, Y.; Zhong, F.; Lin, X.; Wang, L. YOLO-ACE: Enhancing YOLO with Augmented Contextual Efficiency for Precision Cotton Weed Detection. Sensors 2025, 25, 1635. [Google Scholar] [CrossRef] [PubMed]
- Han, Y.; Duan, B.; Guan, R.; Yang, G.; Zhen, Z. LUFFD-YOLO: A Lightweight Model for UAV Remote Sensing Forest Fire Detection Based on Attention Mechanism and Multi-Level Feature Fusion. Remote Sens. 2024, 16, 2177. [Google Scholar] [CrossRef]
- Wang, J.; Zhang, H.; Liu, Y.; Zhang, H.; Zheng, D. Tree-Level Chinese Fir Detection Using UAV RGB Imagery and YOLO-DCAM. Remote Sens. 2024, 16, 22. [Google Scholar] [CrossRef]
- Li, S.; Lideskog, H. Implementation of a System for Real-Time Detection and Localization of Terrain Objects on Harvested Forest Land. Forests 2021, 12, 1142. [Google Scholar] [CrossRef]
- Li, N.; Wu, Y.Y.; Liu, Y. Pedestrian attribute recognition algorithm based on multi-scale attention network. Laser Optoelectron. Prog. 2021, 58, 0410025. [Google Scholar]
- Zhao, J.L.; Zhang, X.Z.; Dong, H.Y. Defect detection in transmission line based on scale-invariant feature pyramid networks. Comput. Eng. Appl. 2022, 58, 289–296. [Google Scholar]
- Zhou, Y.; Liu, W.P.; Luo, Y.Q.; Zong, S.X. Small object detection for infected trees based on the deep learning method. Sci. Silvae Sin. 2021, 57, 98–107. [Google Scholar]
- Yao, Y.Q.; Cheng, G.; Xie, X.X.; Han, J.W. Optical remote sensing image object detection based on multi-resolution feature fusion. Natl. Remote Sens. Bull. 2021, 25, 1124–1137. [Google Scholar] [CrossRef]
- Wang, X.; Zhao, Q.; Jiang, P.; Zheng, Y.; Yuan, L.; Yuan, P. LDS-YOLO: A lightweight small object detection method for dead trees from shelter forest. Comput. Electron. Agric. 2022, 198, 107035. [Google Scholar] [CrossRef]
- Yuan, Q.; Zou, S.; Wang, H.; Luo, W.; Zheng, X.; Liu, L.; Meng, Z. A Lightweight Pine Wilt Disease Detection Method Based on Vision Transformer-Enhanced YOLO. Forests 2024, 15, 1050. [Google Scholar] [CrossRef]
- Zhao, J.; Zhang, X.; Yan, J.; Qiu, X.; Yao, X.; Tian, Y.; Zhu, Y.; Cao, W. A Wheat Spike Detection Method in UAV Images Based on Improved YOLOv5. Remote Sens. 2021, 13, 3095. [Google Scholar] [CrossRef]
- Ma, Y.; Liu, H.; Ling, C.; Zhao, F.; Jiang, Y.; Zhang, Y. Object Detection of Individual Mangrove Based on Improved YOLOv5. Laser Optoelectron. Optoelectron. Progress. 2022, 59, 1828003. [Google Scholar]
- Wang, A.; Chen, H.; Liu, L.; Chen, K.; Lin, Z.; Han, J. Yolov10: Realtime end-to-end object detection. arXiv 2024, arXiv:2405.14458. [Google Scholar]
- Vaswani, A.; Shazeer, N.; Parmar, N.; Uszkoreit, J.; Jones, L.; Gomez, A.N.; Kaiser, Ł.; Polosukhin, I.; Sutskever, I.; Bengio, S.; et al. Attention is all you need. In Proceedings of the 31st Conference on Neural Information Pmcessing Systems (NlPS 2017), Long Beach, CA, USA, 31 December 2017. [Google Scholar]
- He, K.M.; Zhang, X.Y.; Ren, S.Q.; Sun, J. Deep residual learning for image recognition. In Proceedings of the 2016 EEE Conference on Computer Vision and Pattern Recognition (CVPR), Las Vegas, NV, USA, 26 June–1 July 2016; IEEE: Piscataway, NJ, USA, 2016; pp. 770–778. [Google Scholar] [CrossRef]
- Liu, S.; Lu, Q.; He, C.C.; Tian, Z.M.; Li, J.; Yan, J.C.; Deng, L.; Wang, Y.F.; Hu, X.W.; Chen, G.; et al. Path aggregation network for instance segmentation. In Proceedings of the IEEE Conference on Computer Vision and Pattern Recognition, Salt Lake City, UT, USA, 18–22 June 2018; pp. 8759–8768. [Google Scholar] [CrossRef]
Disclaimer/Publisher’s Note: The statements, opinions and data contained in all publications are solely those of the individual author(s) and contributor(s) and not of MDPI and/or the editor(s). MDPI and/or the editor(s) disclaim responsibility for any injury to people or property resulting from any ideas, methods, instructions or products referred to in the content. |
© 2025 by the authors. Licensee MDPI, Basel, Switzerland. This article is an open access article distributed under the terms and conditions of the Creative Commons Attribution (CC BY) license (https://creativecommons.org/licenses/by/4.0/).