Article

Automatic Detection of Ceroxylon Palms by Deep Learning in a Protected Area in Amazonas (NW Peru)

by
José A. Sánchez-Vega
1,
Jhonsy O. Silva-López
2,
Rolando Salas Lopez
1,
Angel J. Medina-Medina
1,
Katerin M. Tuesta-Trauco
1,
Abner S. Rivera-Fernandez
1,
Teodoro B. Silva-Melendez
1,
Manuel Oliva-Cruz
1,
Elgar Barboza
1,*,
Carlos Antonio da Silva Junior
3,
Jenner Sánchez-Vega
4 and
Jhon A. Zabaleta-Santisteban
1
1
Centro de Investigación en Geomática Ambiental (CIGA), Instituto de Investigación para el Desarrollo Sustentable de Ceja de Selva (INDES-CES), Universidad Nacional Toribio Rodríguez de Mendoza de Amazonas, Chachapoyas 01001, Peru
2
Área de Cartografía y Teledetección, Laboratorio de Agrostologia, Instituto de Investigación en Ganadería y Biotecnología, Facultad de Ingeniería Zootecnista, Agronegocios y Biotecnología, Universidad Nacional Toribio Rodríguez de Mendoza de Amazonas, Chachapoyas 01001, Peru
3
Department of Geography, State University of Mato Grosso (UNEMAT), Sinop 78550-000, MT, Brazil
4
Facultad de Ingenieria Civil y Arquitectura (FICIAR), Universidad Nacional Toribio Rodríguez de Mendoza de Amazonas, Chachapoyas 01001, Peru
*
Author to whom correspondence should be addressed.
Forests 2025, 16(7), 1061; https://doi.org/10.3390/f16071061
Submission received: 31 May 2025 / Revised: 21 June 2025 / Accepted: 23 June 2025 / Published: 26 June 2025
(This article belongs to the Special Issue Application of Machine-Learning Techniques in Forestry)

Abstract

Habitat fragmentation and loss seriously threaten Ceroxylon palms, a key and vulnerable species in Andean forests. Given the need for efficient tools for their monitoring and conservation, this study aimed to evaluate the effectiveness of deep learning YOLO models for the automatic detection of Ceroxylon individuals in high-resolution UAV images. Three versions of YOLO (v8, v10, and v11) were analyzed, each in nano (“n”), medium (“m”), and extra-high (“x”) configurations, considering both processing time and detection accuracy. Difficulties in orthomosaic reconstruction were addressed by specific adjustments to the photogrammetric software parameters. The nine resulting models were tested in seven study plots, with the YOLOv8-m configuration standing out as the one that best balanced processing speed and accuracy, achieving the following outstanding metrics: F1 = 0.91; mAP50 = 0.98; and mAP50-95 = 0.62. These results demonstrate the practical value of YOLO model automatic detection for the informed management and effective conservation of Ceroxylon in mountain ecosystems.

1. Introduction

Covering about 30% of the Earth’s surface, forests play a crucial role in ecology and society by providing industrial resources, absorbing carbon dioxide (CO2) and regulating the climate [1,2]. These ecosystems are home to 80% of amphibian species, 75% of birds, and 68% of mammals, underscoring their importance for global biodiversity [1,3]. In addition to driving economic development, sustainable forest management also contributes significantly to ecosystem conservation and climate change mitigation [4,5]. However, forests face anthropogenic threats, such as deforestation [6], mainly due to agricultural expansion and urbanization, which have caused losses of up to 420 million hectares worldwide since 1990 [7,8,9,10].
Faced with this accelerated loss of vegetation cover, the field monitoring of these forest resources becomes even more crucial [11]. However, obtaining this information in the field is often costly and laborious, which limits its large-scale application [11,12]. Given these limitations, remote sensing has emerged as a key tool for forest monitoring, which is evolving from manual visual interpretations to automatic visual interpretations that integrate remote sensing, machine learning (ML), and deep learning (DL) [11,13]. Computing and remote sensing advances have optimized forest data collection [14]. The generation of orthomosaics using UAVs allows the collection of key information with high spatial and georeferenced precision [15]. Unlike images obtained by traditional sensors, which are often subject to interferences, UAVs offer more detailed and reliable data, facilitating small and medium scale forest monitoring [16,17,18]. Because of this, UAV applications in forestry studies have great potential in the sustainable management of natural resources [19].
In this technological advancement, the integration of computer vision with remote sensing techniques has shown remarkable potential in individual tree detection (ITD) using RGB images captured by UAVs [20]. Various approaches have been utilized for this purpose, including local maxima algorithms [21], watershed segmentation [22], region growing, and support vector machines (SVMs) [23]. However, traditional methods have limitations due to their limited ability to exploit depth features, the need for specific manual adjustments, and the computational complexity of image processing [24]. In contrast, DL has emerged as a promising solution, enabling the automatic extraction of complex features, significantly improving accuracy and adaptability to diverse data and scenes [25,26]. Convolutional neural networks (CNN) were widely used in ITD, initially applied using multi-scale sliding windows on full images [27]. Subsequently, more efficient models such as region-based R-CNN were developed [28], the Fast R-CNN [29] and the Faster R-CNN [30], which optimized object detection by reducing processing times and increasing accuracy. Recently, the You Only Look Once (YOLO) object detector was introduced [31,32], which has proven to be faster and more efficient than Faster R-CNN, consolidating itself as a key tool with great potential for forest monitoring [32].
The YOLO object detector uses a regression-based approach to generate detection frames directly [31,33] and has emerged as a key tool in forest monitoring due to its high efficiency and processing speed [34]. YOLO has evolved significantly since its introduction in 2015, implementing a regression-based approach for direct object detection, optimizing speed without compromising accuracy. In automatic object detection, performance metrics play a fundamental role in evaluating the accuracy and efficiency of models. Among the most relevant metrics are the following: the F1 score (average that combines precision and recall) into a single harmonic value; the mAP50 metric (model’s ability to correctly detect 50% overlap); and finally, the mAP50-95 (more rigorous evaluation considering averages) [35]. The YOLO series has advanced from its initial version to YOLOv8, improving both speed and accuracy [31,36,37,38,39], achieving successful applications in object detection. Lou et al. [40] used YOLOv3 to identify loblolly pines with an accuracy of over 93%. Chen et al. [41] used YOLOv4 to detect laurel trees with more than 95% accuracy. On the other hand, Jintasuttisak et al. [35] demonstrated that YOLOv5 outperforms other versions in date palm detection, and Dong et al. [42] optimized YOLOv7, incorporating SimAM and SIoU attention modules, achieving 90.34% (mAP@0.5) in the detection of Metasequoia glyptostroboides crowns. Despite these advances in the detection of forest objects using modern techniques, studies focused on the identification of individual species remain scarce and represent an area of research under development [11]. To date, YOLOv1-v7 has been used extensively for tasks such as the detection of individual trees [25], forest fires [43], and pest control [44], showing consistent performance. The YOLOv8 version was released in March 2023, further research is still needed to evaluate performance up to YOLOv11 and later versions.
In Peru, where 57.4% of the country’s territory is covered by forests, deforestation is driven primarily by agricultural, livestock, and illegal mining activities [45]. Between 2001 and 2023, the Peruvian Amazon lost 30,533.54 km2 of forest cover, with the regions of San Martin (5153.64 km2), Loreto (5567.49 km2), and Ucayali (5710.16 km2) being the most affected [46] due to agricultural expansion [47]. This sustained loss of forest leads to a drastic reduction in biodiversity and seriously affects the functionality of ecosystems [19]. Therefore, in response to the loss of biodiversity, Peru has established 131 Area de Conservación Privada (ACP), which represent 0.30% of the national territory, and is complemented the Sistema Nacional de Areas Naturales Protegidas (SINANPE) [48]. These areas play a fundamental role in the conservation of biodiversity and the protection of forest ecosystems, particularly in the diverse tropical mountain forests that are home to significant biodiversity [49,50].
Among the key species of these ecosystems, the Ceroxylon palm is a tree species of strategic importance in the southern Amazon region of Peru. It has great socio-economic value due to its high production and quality of wood, as well as ecological relevance in the dynamics and structure of the forest [51], biomass production, and as a food source for insects, birds, and mammals [52,53]. Due to sustained anthropogenic pressure, palms of the genus Ceroxylon have experienced a notable decline in their populations, leading to their classification as a vulnerable species [52], although there are no exact data on total abundance prior to human intervention, the literature indicates that habitat fragmentation and agricultural land use have decreased both the diversity and abundance of species [53]. Faced with this problem, it is essential to establish effective monitoring plans for the proper management of the Ceroxylon palm. To achieve this, it is essential to have accurate information on its location, which has traditionally been obtained through manual inventory, a process that is often costly and limited to a small scale. Despite this, to date, there has been no extensive research using object detection models to identify individual palm trees in RGB images captured by UAVs, leaving their potential largely unexplored. In addition, reported tree detection research focuses on homogenous, regular plantation environments, without addressing the complexity of multi-scene plantations.
The improved versions of the YOLO models (v8, v10, and v11) were applied to address the computational and metric challenges, to identify the best model and accurately detect individual Ceroxylon palms in complex, high-density forest environments, since no similar study exists on the species. The main objectives of this study were as follows: (i) generate orthomosaics for the accurate reconstruction of Ceroxylon palms in their natural environment; (ii) create a robust dataset that included scenarios with overlapping canopies and heterogeneous backgrounds, ensuring data adaptability—these data guarantee the robustness and adaptability of the model to be trained in different environmental scenarios; and (iii) train and evaluate YOLO configurations (v8, v10, and v11) in detecting Ceroxylon palms in various environments.
This study proposes an innovative approach to evaluate the effectiveness of YOLO models (v8, v10, and v11) in the automatic detection of individual trees of the vulnerable palm species Ceroxylon, in its two main environment scenarios: forest and grassland. The research was carried out within the “Taulia Molinopampa Palm Forest” conservation area using an adaptable UAV platform equipped with RGB sensors to capture high-resolution images. This approach seeks to achieve accurate, cost-effective, and scalable individual detection (IDT) techniques, constituting a key step toward the systematic and sustainable monitoring of this species. The results obtained provide a solid scientific basis for the ongoing monitoring and conservation of Ceroxylon palm populations, supporting conservation strategies by facilitating informed decision-making and contributing to smart forest management that helps preserve these unique ecosystems and mitigate environmental impacts in the Amazon region.

2. Materials and Methods

2.1. Study Area

The study was carried out in the conservation area of the Bosque de Palmeras Taulia Molinopampa, located in Amazonas, northwestern Perú, with an area of about 333.86 km2 (Figure 1). This area is bordered to the north by the districts of Quinjalca and Granada, to the southeast by the province of Rodriguez de Mendoza, to the southwest by the district of Cheto, and to the west by the district of San Francisco de Daguas and Sonche [54].
The palm forest is characterized by high and steep mountains of calcareous origin, which often suffer landslides and falling blocks. Within this environment, the Ventilla, Ocol, and Huamanpata rivers originate, along with streams that overflow during the rainy season, adapting certain species to these conditions [55,56]. This area harbors extensive primary forests with various native forest species, which act as seed sources for natural regeneration. In this context, seven plots of the palm genus Ceroxylon were studied, located in the Andean tropical cloud forest, at altitudes between 2000 and 3500 m above sea level [1].
Palm trees of the genus Ceroxylon have been subjected to intense anthropogenic pressure over time, leading to their classification as a vulnerable species by the Ministry of Environment and Sustainable Development [57]. Religious activities have promoted the extensive extraction of their branches on certain dates, while the expansion of livestock farming has caused the significant deforestation of the forests where this species lives. Furthermore, the need for accessible fuel sources for local populations has weakened. Likewise, the ecological, cultural, and symbolic importance of Ceroxylon is worth highlighting, even though it is recognized as the national tree of Colombia. In this context, this study seeks to integrate into the efforts to identify targeted actions for assessing and mitigating the impacts of shifting cultivation, adopting a holistic approach. For the training of palms of the genus Ceroxylon, the plots were defined according to two predominant characteristics, (i) palms in pasture environments and (ii) in wooded environments. These plots, chosen for the presence of Ceroxylon, vary between 1 and 4.5 hectares (Table 1).

2.2. Data Processing and Orthomosaic Generation

A Phantom 4 RTK manufactured by Shenzhen DJI Technology Co., Ltd., Shenzhen, China, a UAV equipped with a high-resolution RGB camera and GNSS receivers in RTK kinematic mode, was used to ensure centimeter-level accuracy [58]. Flight planning and execution were carried out using the DJI Pilot V2.0.10 application. It was determined that the orthomosaics should have a ground sampling distance (GSD) of less than 5 cm to ensure the accurate characterization of the palm canopy. To achieve this, the flight parameters were set at an altitude of 100 m, a camera angle of 90 degrees, and lateral and frontal overlaps of 85% and 80%, respectively [59,60].
The processing of the orthomosaics was carried out using Agisoft Metashape Pro 2.1.2 photogrammetry software, which made it possible to compile and align the aerial images obtained in georeferenced orthomosaics [61]. Tests were conducted on a single orthomosaic to establish the standard for processing parameters.
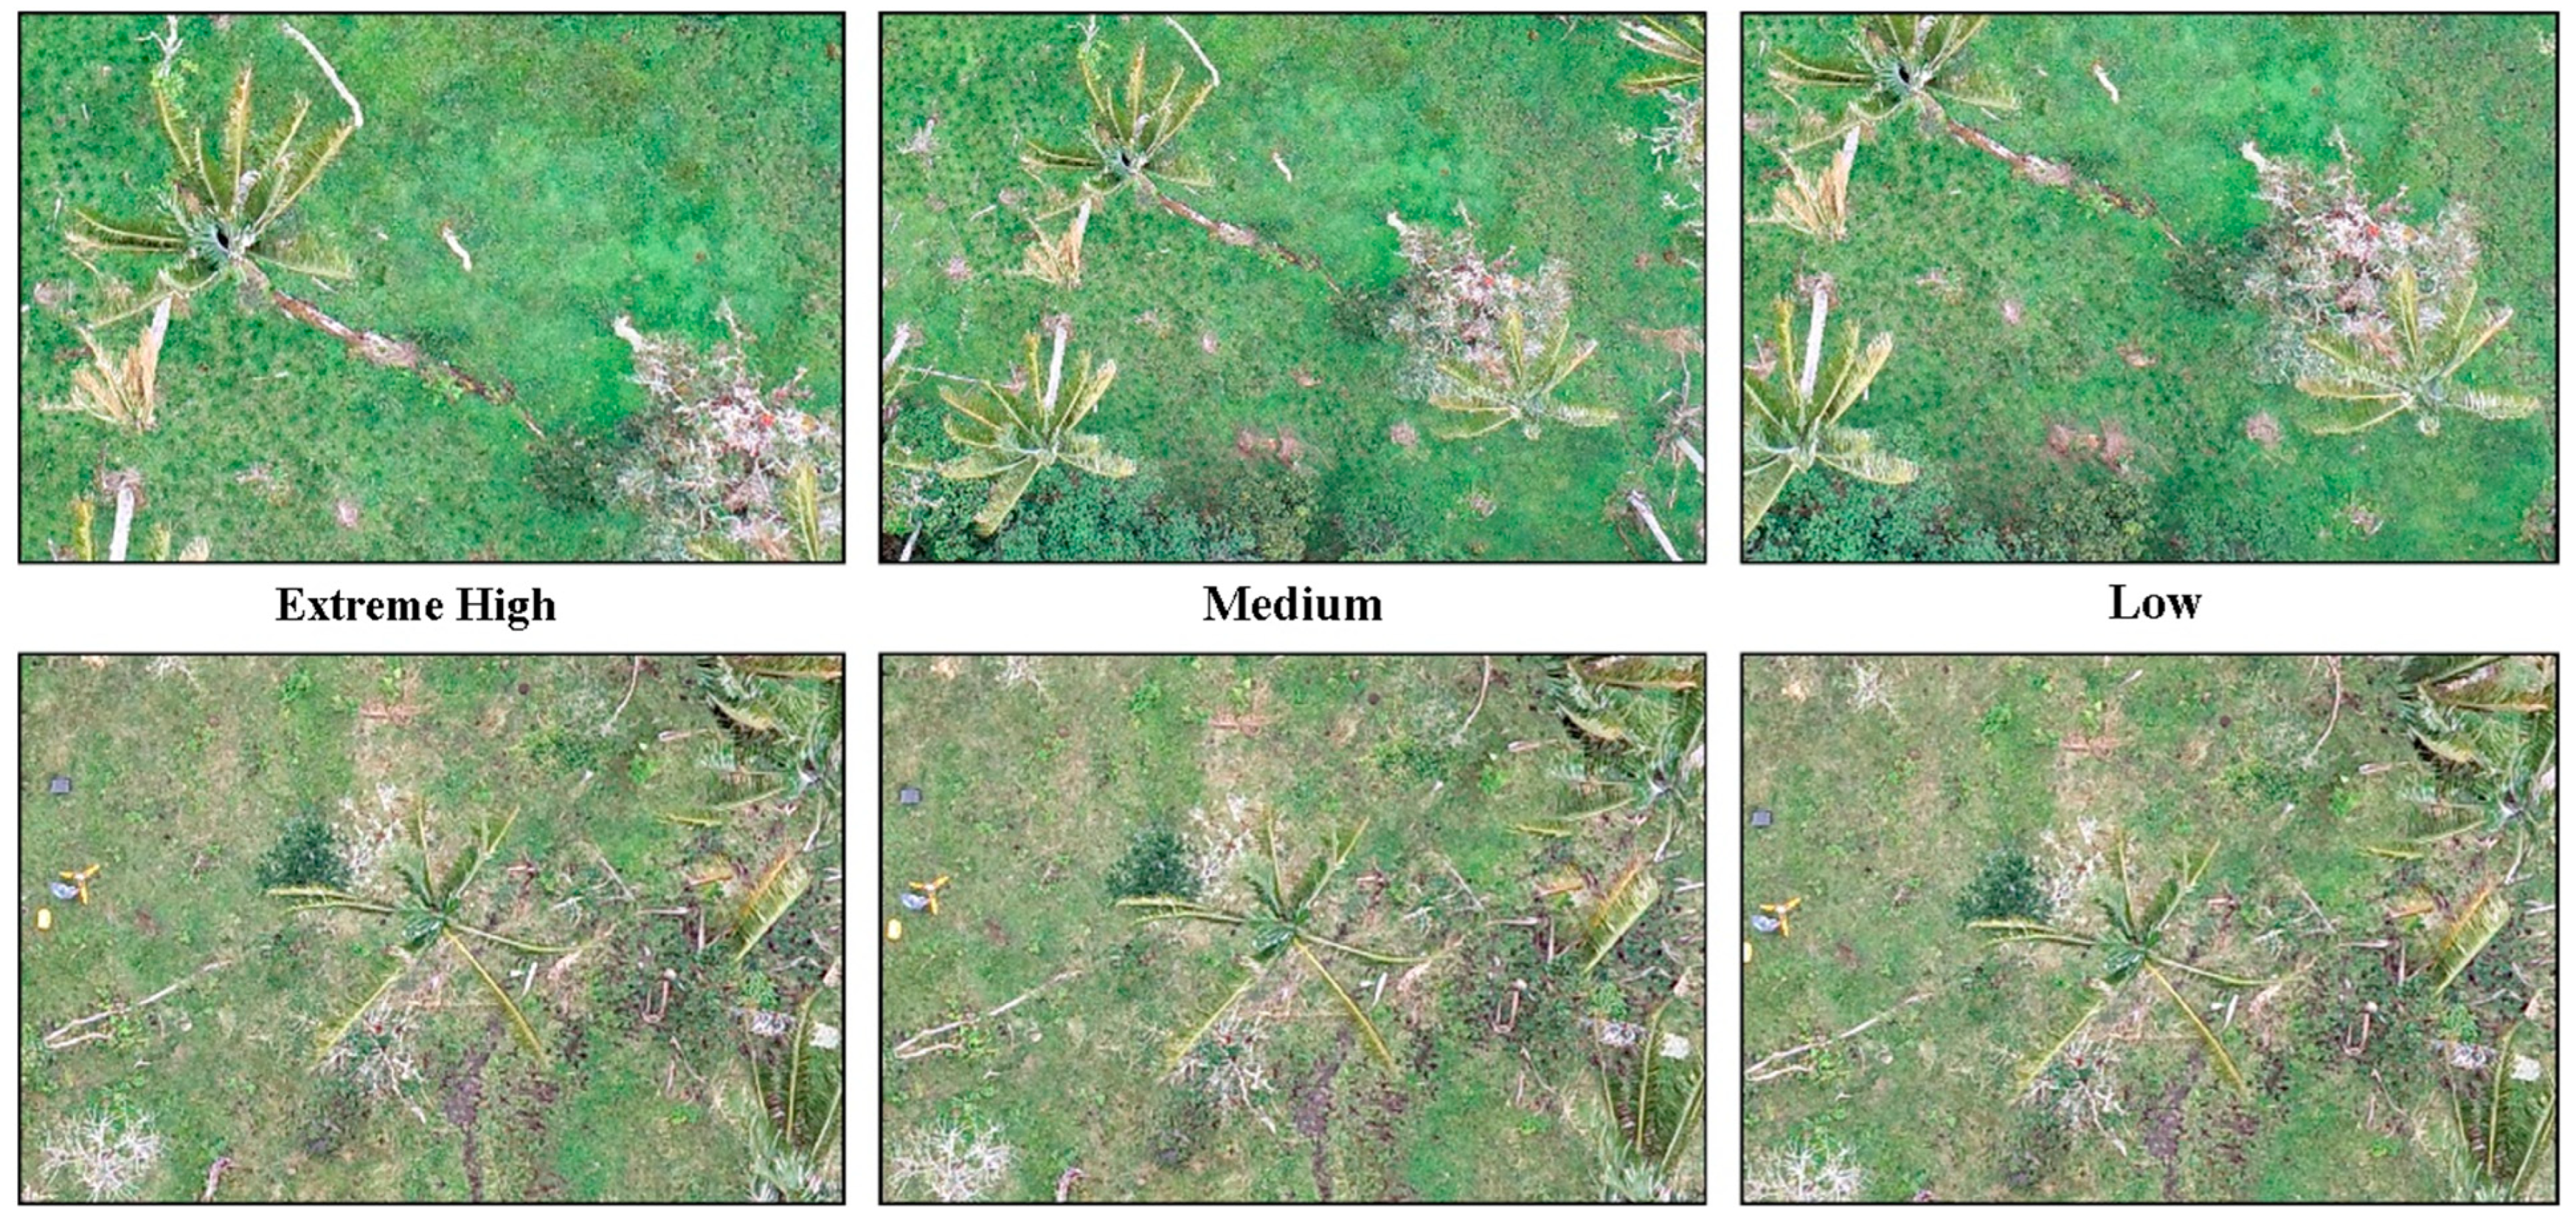
On this context, it was observed that “high” and “low” configurations resulted in the loss of relevant information and generated greater aberrations in the reconstruction of Ceroxylon palms. On the other hand, the processing parameters in the “medium” configuration achieved the best balance in the two-dimensional reconstruction of the palms.
Consequently, the image processing in the software was carried out with the following parameters detailed in Table 2:

2.3. Palms Tree Detection by Methods (YOLOv8, YOLOv10, and YOLOv11)

2.3.1. Preparation of Pre-Training Data

To improve the YOLO processing of orthomosaics, the data are broken into smaller, non-overlapping mosaics [62,63]. The size of these divisions was determined after an initial evaluation in a pilot plot, where object detection was carried out using the YOLOv8-s model at px/px sizes of 640, 800, 960, 1280, and 1600. This model was selected due to its recognized computational efficiency [63], and the base size of 640 × 640 was set based on the default settings of the YOLO models [64]. In a set of 105 random images captured by a UAV, palm crowns were manually labeled with bounding circles using the “labelme” tool [65]. These tags provide the locations of the bounding boxes of objects in text documents [66]. The image dataset was divided into three subsets: 70% for training (73 images), 20% for validation (21 images), and 20% for validation (21 images) [67] and 10% for testing (11 images) [63].

2.3.2. Data Augmentation

To improve the generalization of the model and address the limited availability of training data, the “Albumentations” library was used to enhance the variability and diversity of the input images [68]. The parameter selection for each transformation was geared toward simulating realistic environmental variations in the mountainous and cloudy environments where the palm tree inhabits. Augmentation techniques were applied with a probability (p) between 0 and 1, resulting in a quadrupling of the number of images available for model training, significantly increasing the diversity of the dataset:
  • A.HorizontalFlip (p = 0.6): Horizontal data inversion with probability 0.6.
  • A.Rotate (limit = 20, border_mode = 0, p = 0.6): Image rotation up to 20 degrees in any direction for slightly tilted positions.
  • A.RandomScale (scale_limit = 0.5, p = 0.6): Random scale with a limit of 50% in both magnification and reduction for the recognition of palm trees at different distances.
  • A.RandomBrightnessContrast (brightness_limit = 0.2, contrast_limit = 0.2, p = 0.6): Randomly adjusting the brightness and contrast of images by up to 20% improving the model’s ability to work in different lighting conditions.
  • A.Sharpen (alpha = (0.1, 0.3), p = 0.6): Adds a focus effect to images to improve edge detection of palm fronds.
  • A.HueSaturationValue (hue_shift_limit = 10, sat_shift_limit = 20, val_shift_limit = 10, p = 0.6): Adjusts 0.2 saturation, 0.1 hue and 0.1 brightness of images to simulate different environmental conditions.
  • A.RandomFog (fog_coef_lower = 0.1, fog_coef_upper = 0.3, p = 0.6): Adds a fog effect by varying its density by up to 60% to increase the identification of palm trees in low visibility.
  • A.MotionBlur (blur_limit = 5, p = 0.6): Simulates camera movement by adding blur.

2.3.3. Model Selection and Implementation of YOLO

Since its introduction in 2015, the open-source YOLO model has gained significant recognition in the field of object detection, positioning itself against other traditional approaches such as CNN, R-CNN, Faster R-CNN, and Mask R-CNN [69]. This recognition is due to the continuous improvements and updates made by the community, which have increased its performance, versatility, and computational efficiency [70]. Unlike conventional CNNs that are primarily oriented towards classification tasks and require additional procedures (such as the use of sliding windows or proposal regions) to localize objects, YOLO performs multiple object detection in a single instance, allowing for much faster and more efficient processing [62]. According to a comparative analysis conducted by ubiAI [71], YOLO outperforms CNN-based approaches by achieving real-time processing. This contrasts with R-CNN-derived methods, which require considerably long inference times, ranging from 0.2 to 2 s per image.
In the present study, the YOLO algorithm was selected due to its demonstrated performance in previous research against models such as CNN and SSD [62], as well as its potential to be applied in real-time detection [69] and its efficiency in handling large datasets [63]. Studies, such as the paper by Sharma et al. [72], have compared YOLOv8/9/10/11 with F-RCNN, highlighting YOLOv11 for its higher mAP50 (0.921 vs. 0.865) and inference time (13.5 vs. 63.8); Vilcapoma et al. [73] showed that YOLOv2 outperformed F-CNN and SDD with an accuracy of 0.99 and the lowest inference time of 0.071 s; Ayturan et al. [74] showed that YOLOv8-m achieved a higher accuracy of 97.26% versus 92.86% for CNN and operating in real time. These results consistently support the choice of YOLO over CNNs, given its proven superiority in performance and efficiency.
In this research, three different versions of the model were evaluated, namely YOLOv8, which was previously used for the detection of oil palm trees [69]), and the recent versions YOLOv10 and YOLOv11, using the following variants: nano “n”, medium “m”, and extra-large “x”. The variants differ mainly in their size and computational capacity, the “n” version is designed for devices with limited resources offering greater speed at the cost of losses in its metrics, while the “x” version demands more time and processing to provide the highest possible metrics. The YOLOv9 version was excluded from the analysis because it introduces a new architecture called the Generalized Efficient Layer Aggregation Network (GELAN, https://docs.ultralytics.com/es/models/yolov9/ (accessed on 22 June 2025) and a model nomenclature that differs from the analyzed versions. Next, the parameters were defined according to the computational resources and resource optimization:
  • Batch size: two images per batch (to optimize computational efficiency);
  • Learning rate: 0.0005;
  • Epochs: 500;
  • Early stopping: 30 epochs (Helps to find the optimal point of the model [75]);
  • Optimizer: Adam.
The training process was conducted using an NVIDIA RTX 4060 GPU with 6 GB of VRAM and 32 GB of RAM, which ensured that the computational requirements for running YOLO were met [62]. All training codes used in the research can be found at the following link: https://github.com/Anderson281/Ceroxylon_Palms_YOLO (accessed on 22 June 2025).

2.3.4. Model Evaluation Metrics

The evaluation of detection performance was based on results obtained from standard validation metrics such as accuracy, recall, and F1-score [62,63,76]. In order to ensure a robust evaluation, the average mean accuracy thresholds (mAP) at the intersection over the junction (IoU) of 0.5 (mAP@0.5) and from 0.5 to 0.95 (mAP@0.5:0.95) were used [77].
  • Accuracy: This metric evaluates how many of the positive predictions, or true positives, are actually correct.
    P r e c i s i o n = T P T P + F P ,
  • Recall: Measures of the model’s ability to detect all positive cases.
    R e c a l l = T P T P + F N ,
  • F1-Score: Represents the harmonic meaning between recall and precision and is useful to identify the balance between both metrics.
    F 1 S c o r e = 2 × R e c a l l   ×   P r e c i s i o n R e c a l l + P r e c i s i o n
To understand these metrics, one must consider the terms: true positive (TP), false positive (FP), true negative (TN), and false negative (FN). Each metric’s optimal performance is based on its proximity to the unit value, which is the ideal indicator for detection and classification.

3. Results

3.1. Generation of Orthomosaics

During the initial processing of the orthomosaic using Agisoft Metashape Pro 2.1.2, an unexpected error was identified that probably originated in the data capture parameters, affecting the reconstruction of palms of the genus Ceroxylon (see Figure 2). To address these distortions, tests were conducted by varying the “quality” parameter between the extremely high, medium, and minimum options. The results of these tests indicated that the “medium” quality option provided the best reconstruction of the palms.
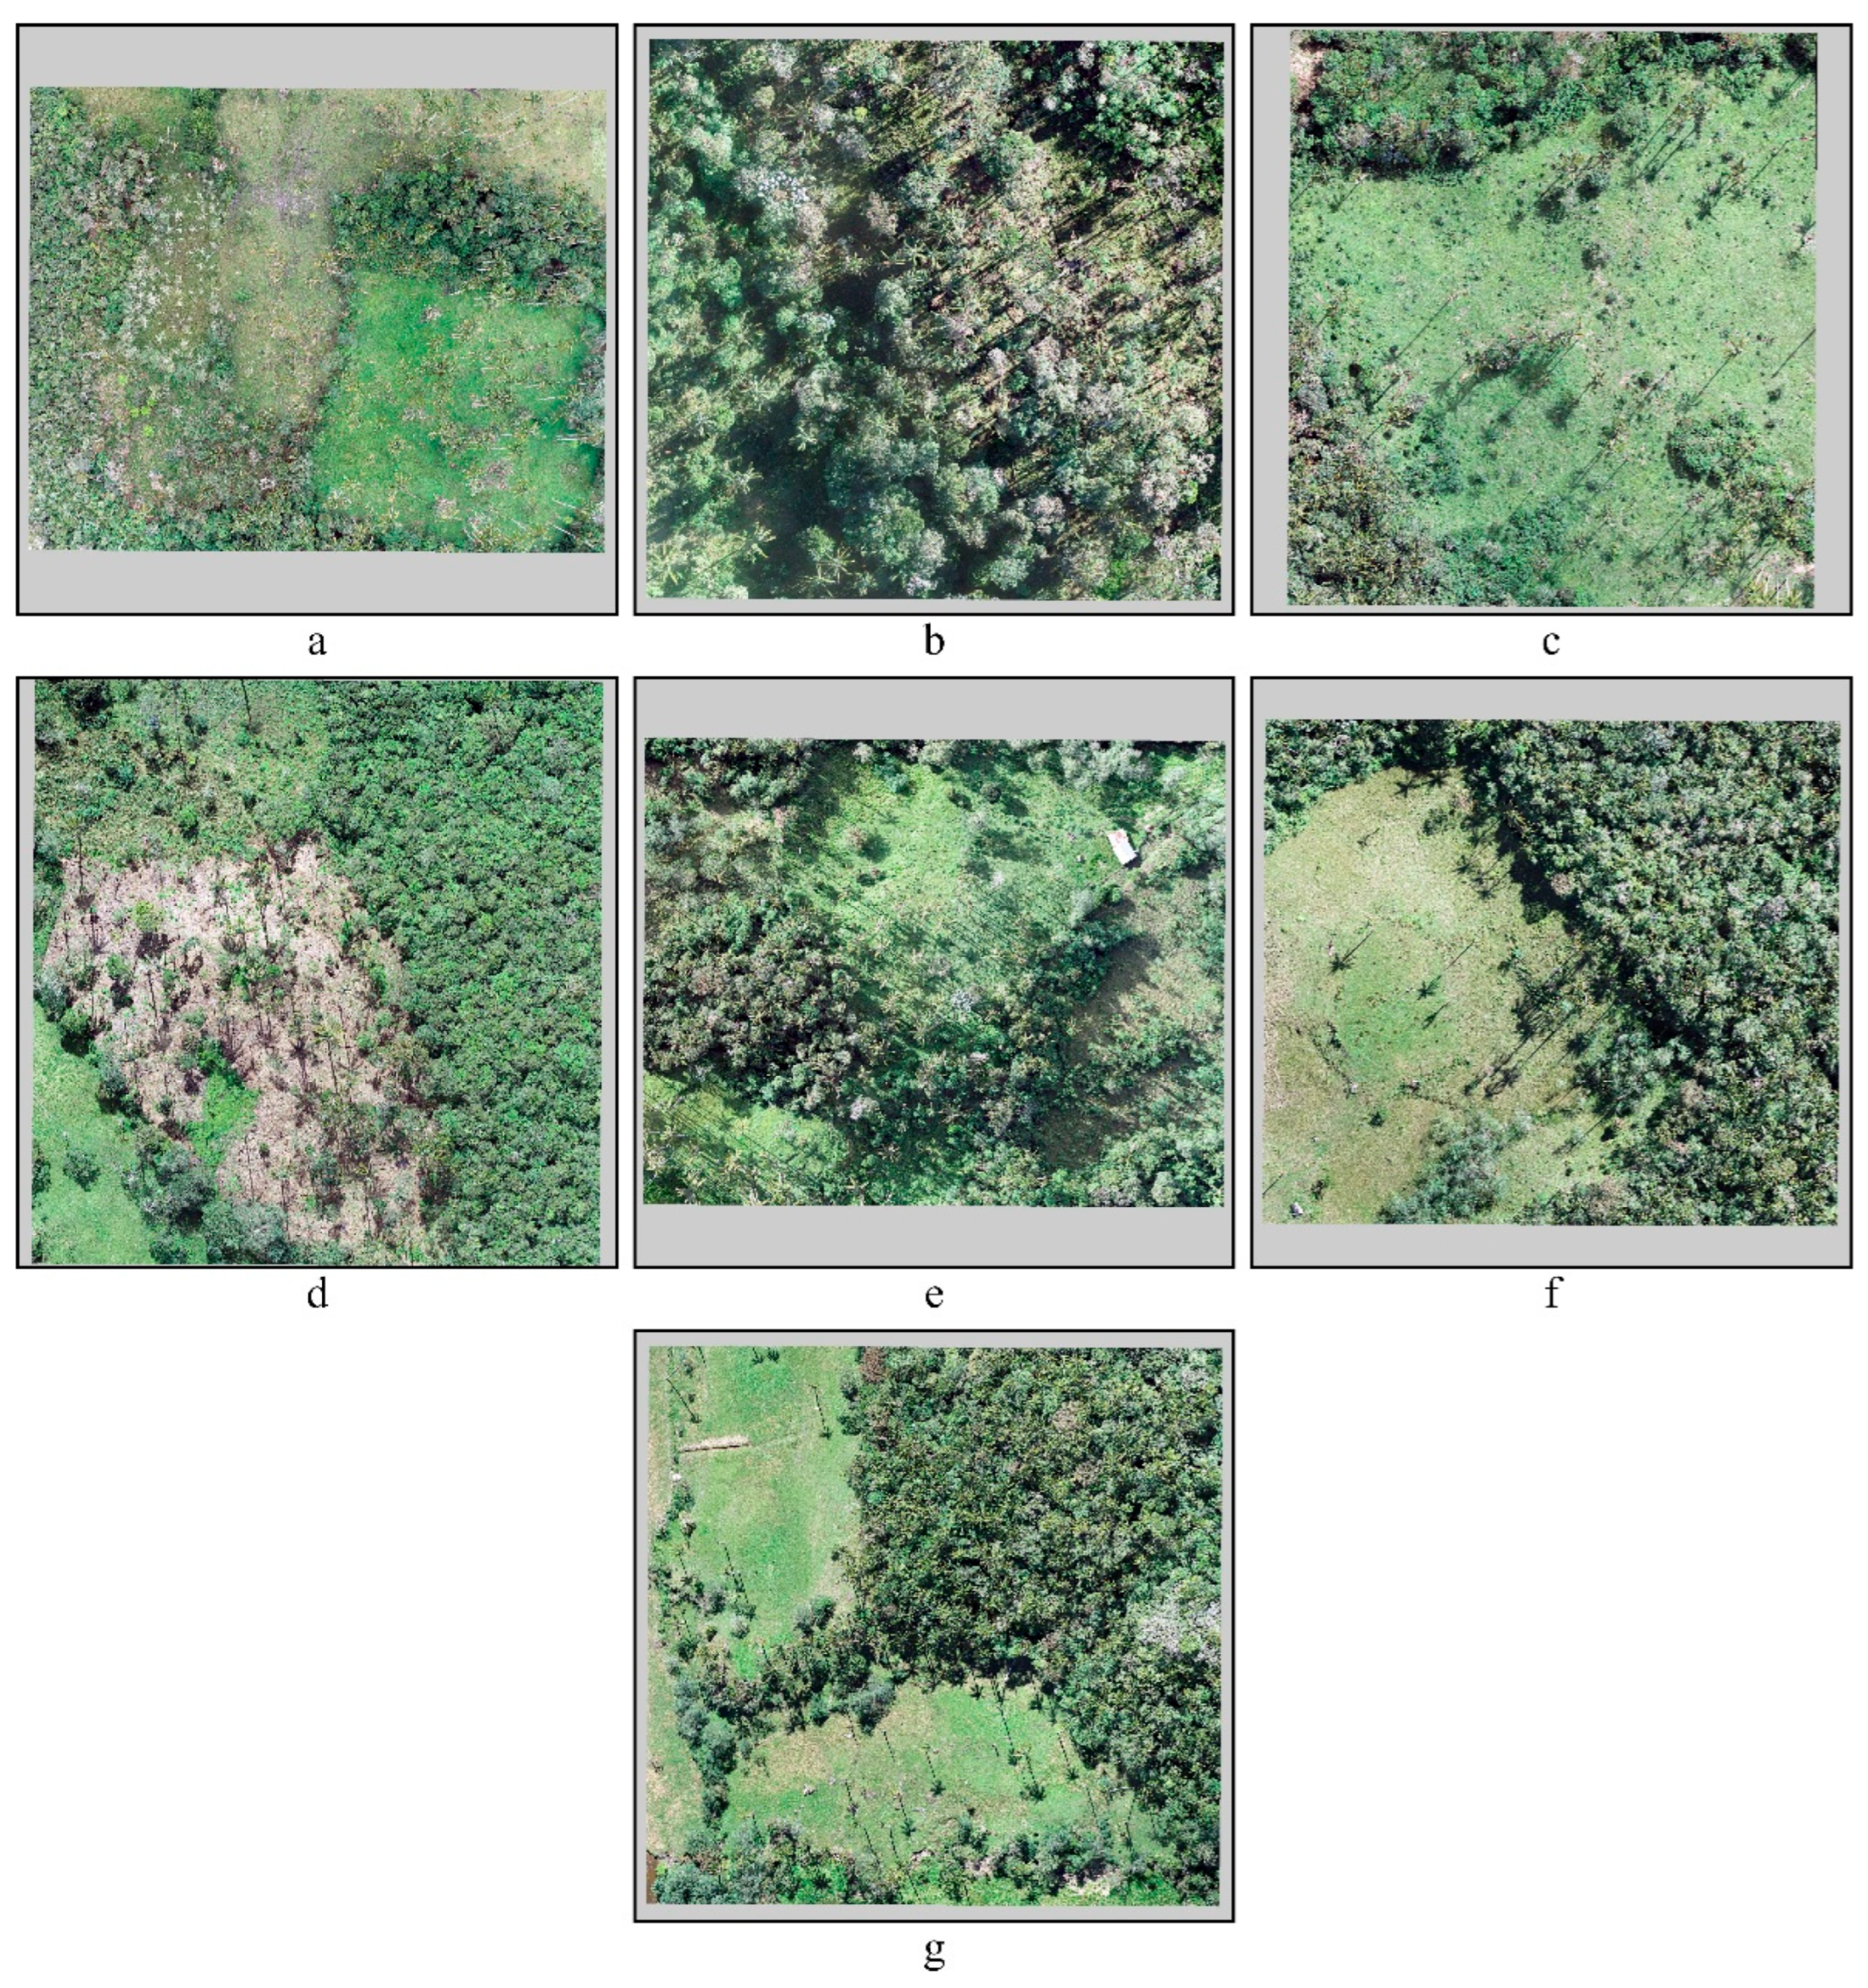
Despite having adjusted the parameters, certain distortions were maintained in the reconstruction of the palms in the seven final orthomosaics (Figure 3), although these were less significant.

3.2. Evaluation of the Mosaic Clipping Size Parameter

The use of high-resolution images such as those from UAVs can cause the loss of important details, which is why it was determined that crop sizes larger than the default ones should be used for YOLO models to improve detection metrics [78]. Table 3 shows the analysis of the optimal size for mosaic clipping, in which the following results were found: the initial size of 640 × 640 did not stand out either for its speed or for obtaining the best mAP50 in the set of tests carried out. In contrast, the 960 × 960 size showed an improvement, being 7 min faster and achieving a higher mAP50 by 0.036By increasing the size to 1280 × 1280, a significant increase in processing time was observed, which was more than three times compared to previous tests, but with a noticeable improvement in the mAP50, reaching a value of 0.928. Finally, the 1600 × 1600 size resulted in a training time of close to 6 h, achieving only a marginal improvement in mAP50 of 0.001 over the previous test. Therefore, to optimize time without compromising the quality of the mAP50, it was decided that future processing will be performed at a size of 1280 × 1280.

3.3. Training of the Nine Configurations at YOLO

The training process of the YOLOv8, YOLOv10, and YOLOv11 models, in their n, m, and x variants, for the identification of palms of the genus Ceroxylon, required approximately 52 h in total. For the validation phase, 44 images were used, representing 10% of the total set of images used in the training, in addition to 3697 instances, which consists of images with high object densities. The results obtained were promising, as detailed in Table 4.
As the model configuration expands, the time required for training increases significantly. When comparing the configurations from “n” to “m”, the training time approximately doubles, while from “m” to “x”, the increase is more than 20 times. In the case of YOLOv8, the “m” configuration achieved the best balance between training time and F1 score and mAP50 metrics, reaching values of 0.89 and 0.94, respectively. On the other hand, in YOLOv10, configuration “x” showed superior performance in the mAP50-95 metric with a value of 0.5, although this entailed very long training times, up to 35 h. In YOLOv11, the “x” configuration stood out for its detection accuracy, with a value of 0.89, but like the previous model, the processing time increased to 8 h. In summary, the n, m, and x models of YOLOv8 achieved an optimal balance between training time and their metrics. It was observed that YOLOv8 optimizes speed in each workout without compromising consistency, obtaining high results in all metrics, especially F1 score and mAP50. In comparison, the main advantage of the YOLOv10 and YOLOv11 models is their performance in the mAP50-95 metric, up to 0.5, which is crucial for more complex tasks.

3.4. Application of Tests on Orthomosaics

After completing the process of labeling the palms in the 105 original images, we proceeded to implement a data augmentation technique. As a result of this process, a total of 420 images were generated. Subsequently, they were divided into three subsets of data distributed as follows: 70% for training (292 images), 20% for validation (84 images), and the remaining 10% for testing (44 images). Next, training was carried out in each plot using different configurations of the YOLO models to automatically detect the palms and obtain the results shown in Figure 4 and Figure 5.
The best automatic detection models were selected considering the training times (Table 4), and the analysis of the metrics is presented in Figure 4 and Figure 5. In these figures, the models are ordered from left to right according to the increase in the average of their three main metrics, from the lowest to the highest values. To evaluate the performance of the models, box plots of the main metrics (F1 Score, mAP50, and mAP5) are shown; the evaluated models are presented on the horizontal axis, while the vertical axis represents the accuracy of the metrics with values ranging from 0 to 1.
The F1 and mAP50 metrics, shown in shades of blue, present more stable and higher distributions compared to the mAP50-95 (green), which indicates consistently lower values and with greater dispersion.
In Figure 4, we can observe that in terms of accuracy (F1, mAP50, and mAP50-95), the highest configuration model’s “x” tends to achieve the highest and most consistent values in detection metrics within their same version. However, it is noteworthy that the YOLOv8 series achieves the best performance in terms of processing time, outperforming all other models evaluated. Furthermore, YOLOv8 is not only one of the most efficient in terms of speed but also presents competitive F1 and mAP50 metrics, ranking among the highest of the set, making it the best option for applications that require a balance between accuracy and computational efficiency. In summary, although all the extra-large “x” models offer slightly higher accuracies, alternatives that present balanced metrics should be evaluated.
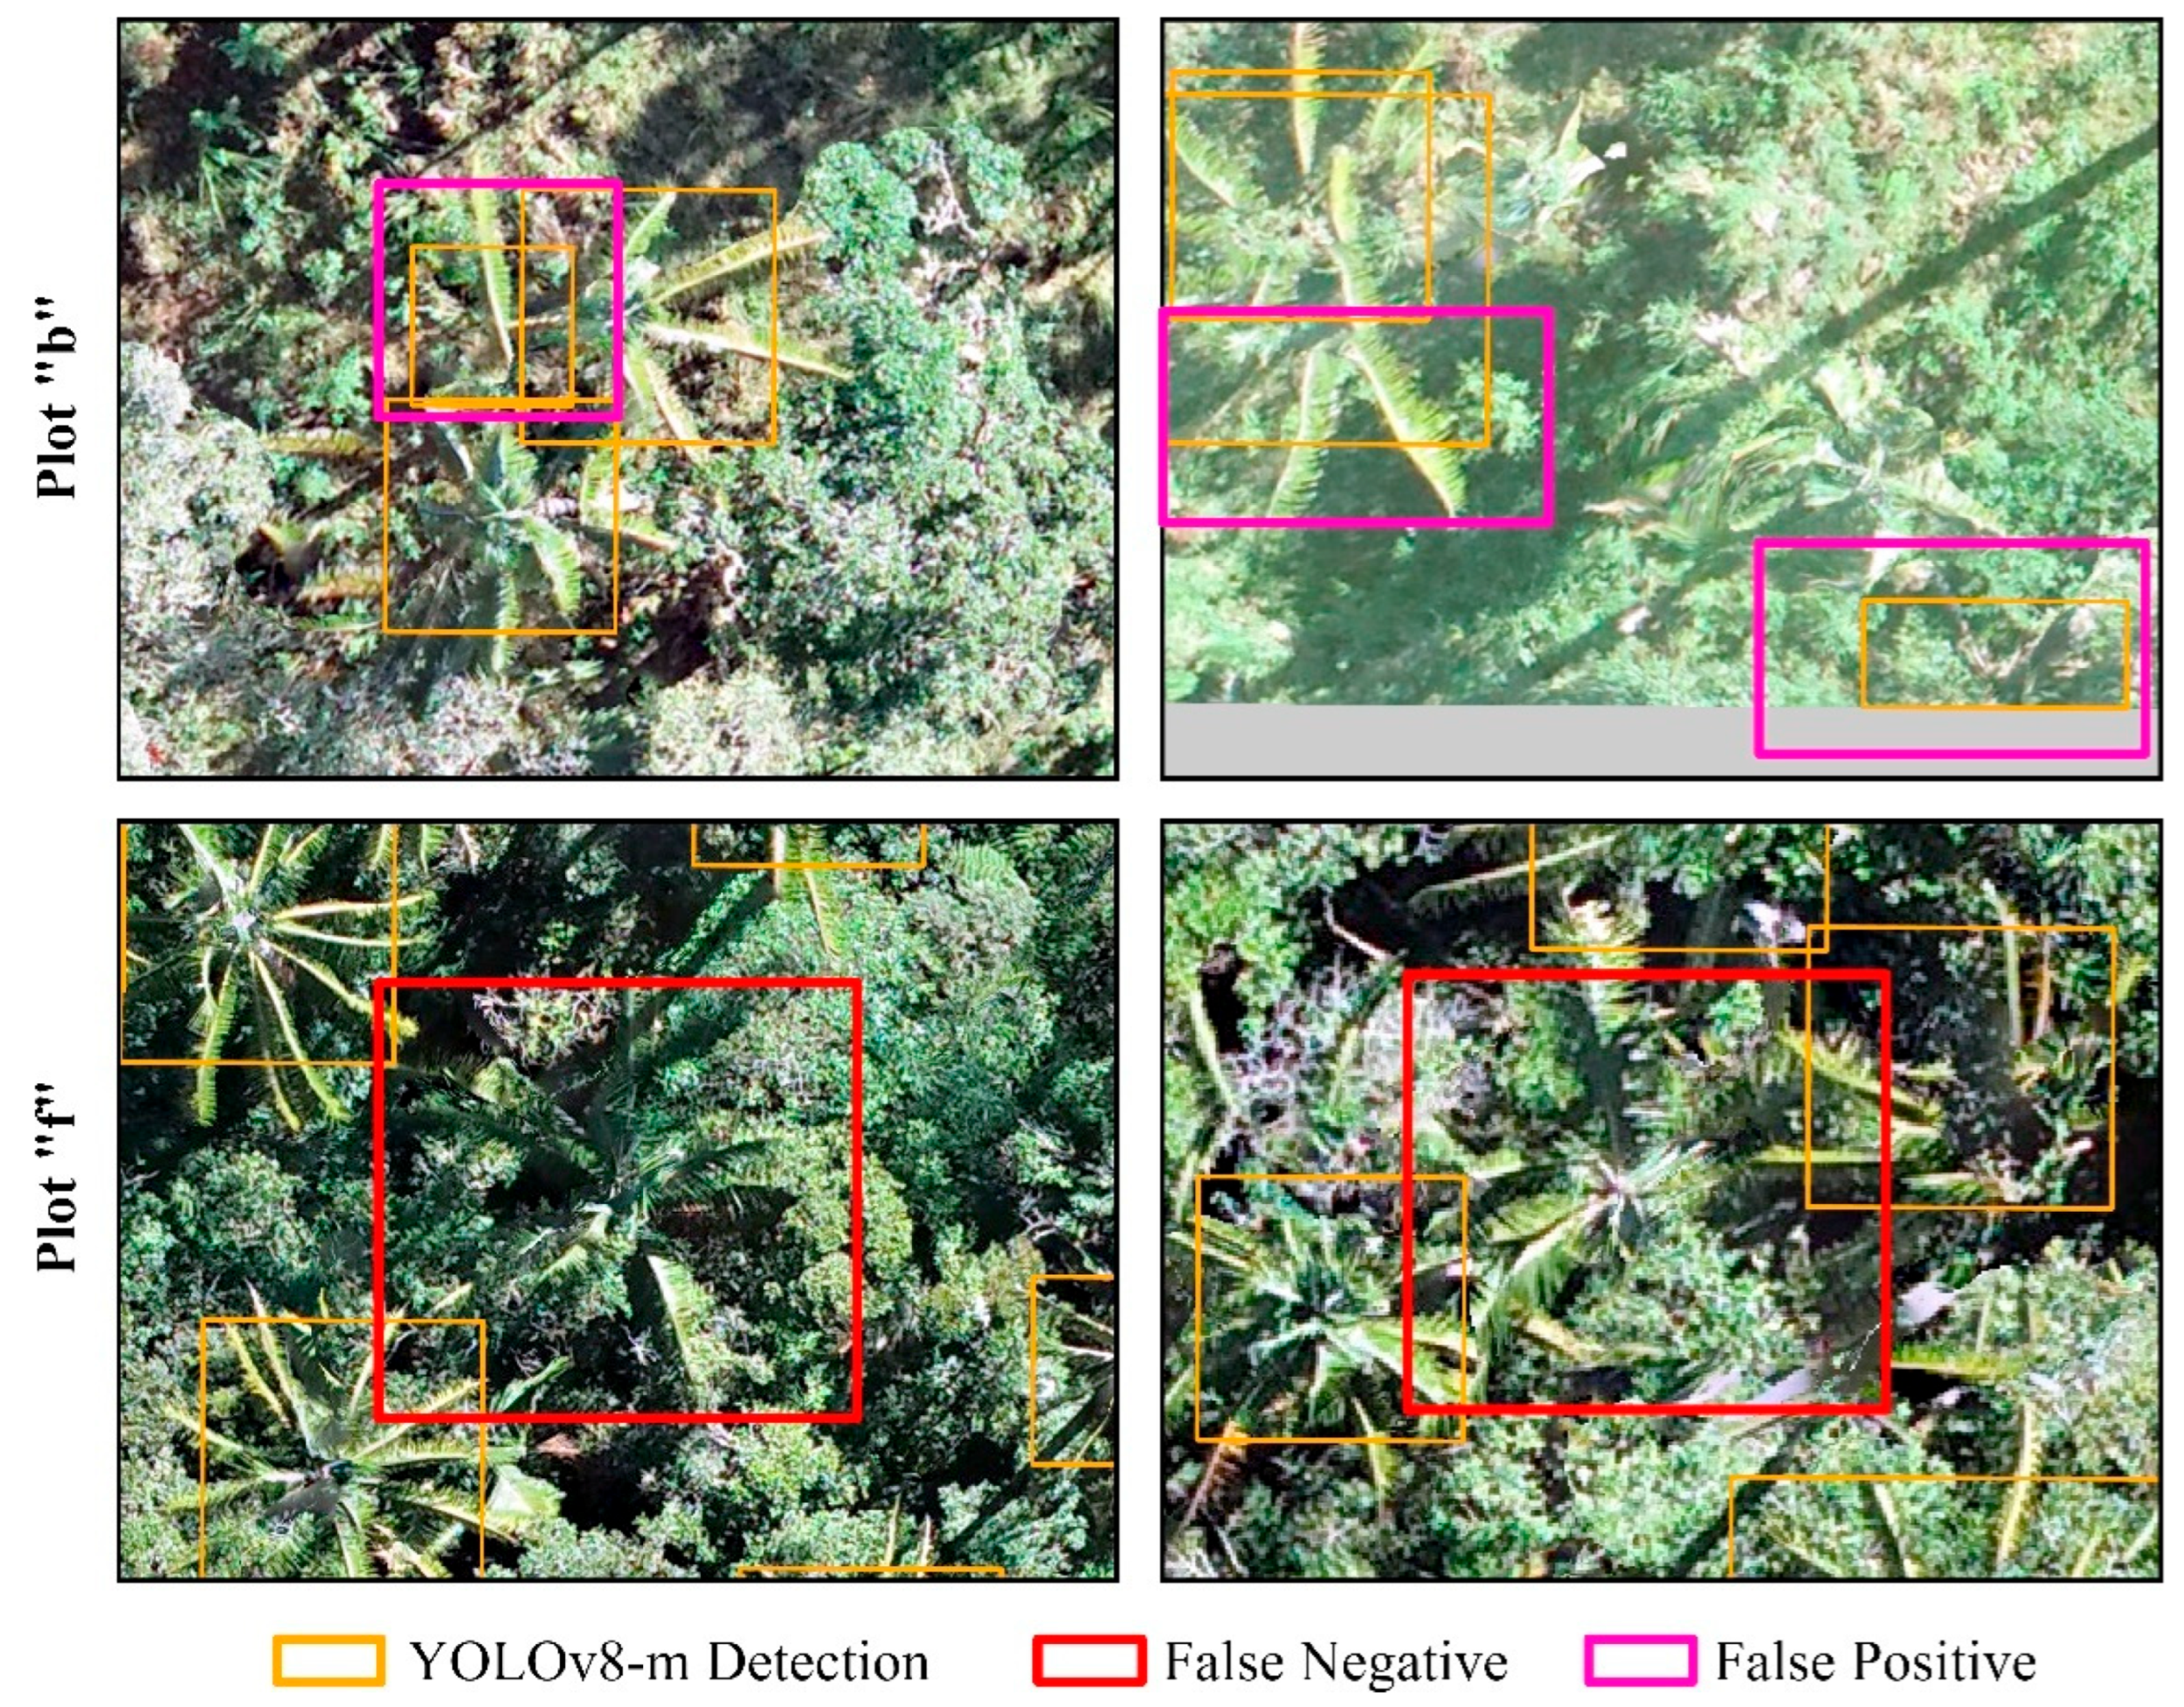
In Figure 5, we observe significant differences in detection performance between the different plots evaluated, where the grassland plot “a” clearly stands out with the best performance, with average values of 0.89 in F1, 0.94 in mAP50, and 0.58 in mAP50-95, and less variability, followed by plot “c”, which also shows good results in the same environment. In contrast, forested plots “b” and “f” present the lowest performances, with averages of up to 0.77 in F1, 0.75 in mAP50, and 0.42 in mAP50-95. The results demonstrate the difficulty of maintaining high values in detection metrics when working in complex forest environments as can be seen in detail in Table S1 and Figures S1–S3. In these environments, problems of shading and light variation, high structural and textural complexity, noise and distortion in the orthomosaics, and confusing elements and species with similar visual patterns that increase the rate of false positives and false negatives are often present, requiring the development of new methodologies to increase detection accuracy (Figure 6).

3.5. Detection of Palms of the Genus Ceroxylon—YOLOv8m

YOLOv8-m stands out for its optimized architecture to maximize the relationship between accuracy and computational efficiency, making it an outstanding choice for the study application. According to official Ultralytics data, YOLOv8-m with its 26.2 million parameters and 80.6 GFLOPs of processing power achieves a particularly outstanding balance in the detection of Ceroxylon palms, offering clear advantages over its counterparts YOLOv10-m, with 15.4 million parameters and 59.1 GFLOPs, and YOLOv11-m, with 20.1 million parameters and 68.0 GFLOPs, which sacrifice accuracy in fine details due to their lesser depth and architectural complexity. For this reason, below are the graphs illustrating various aspects related to the detection of Ceroxylon palms of the best resulting model in the present study.
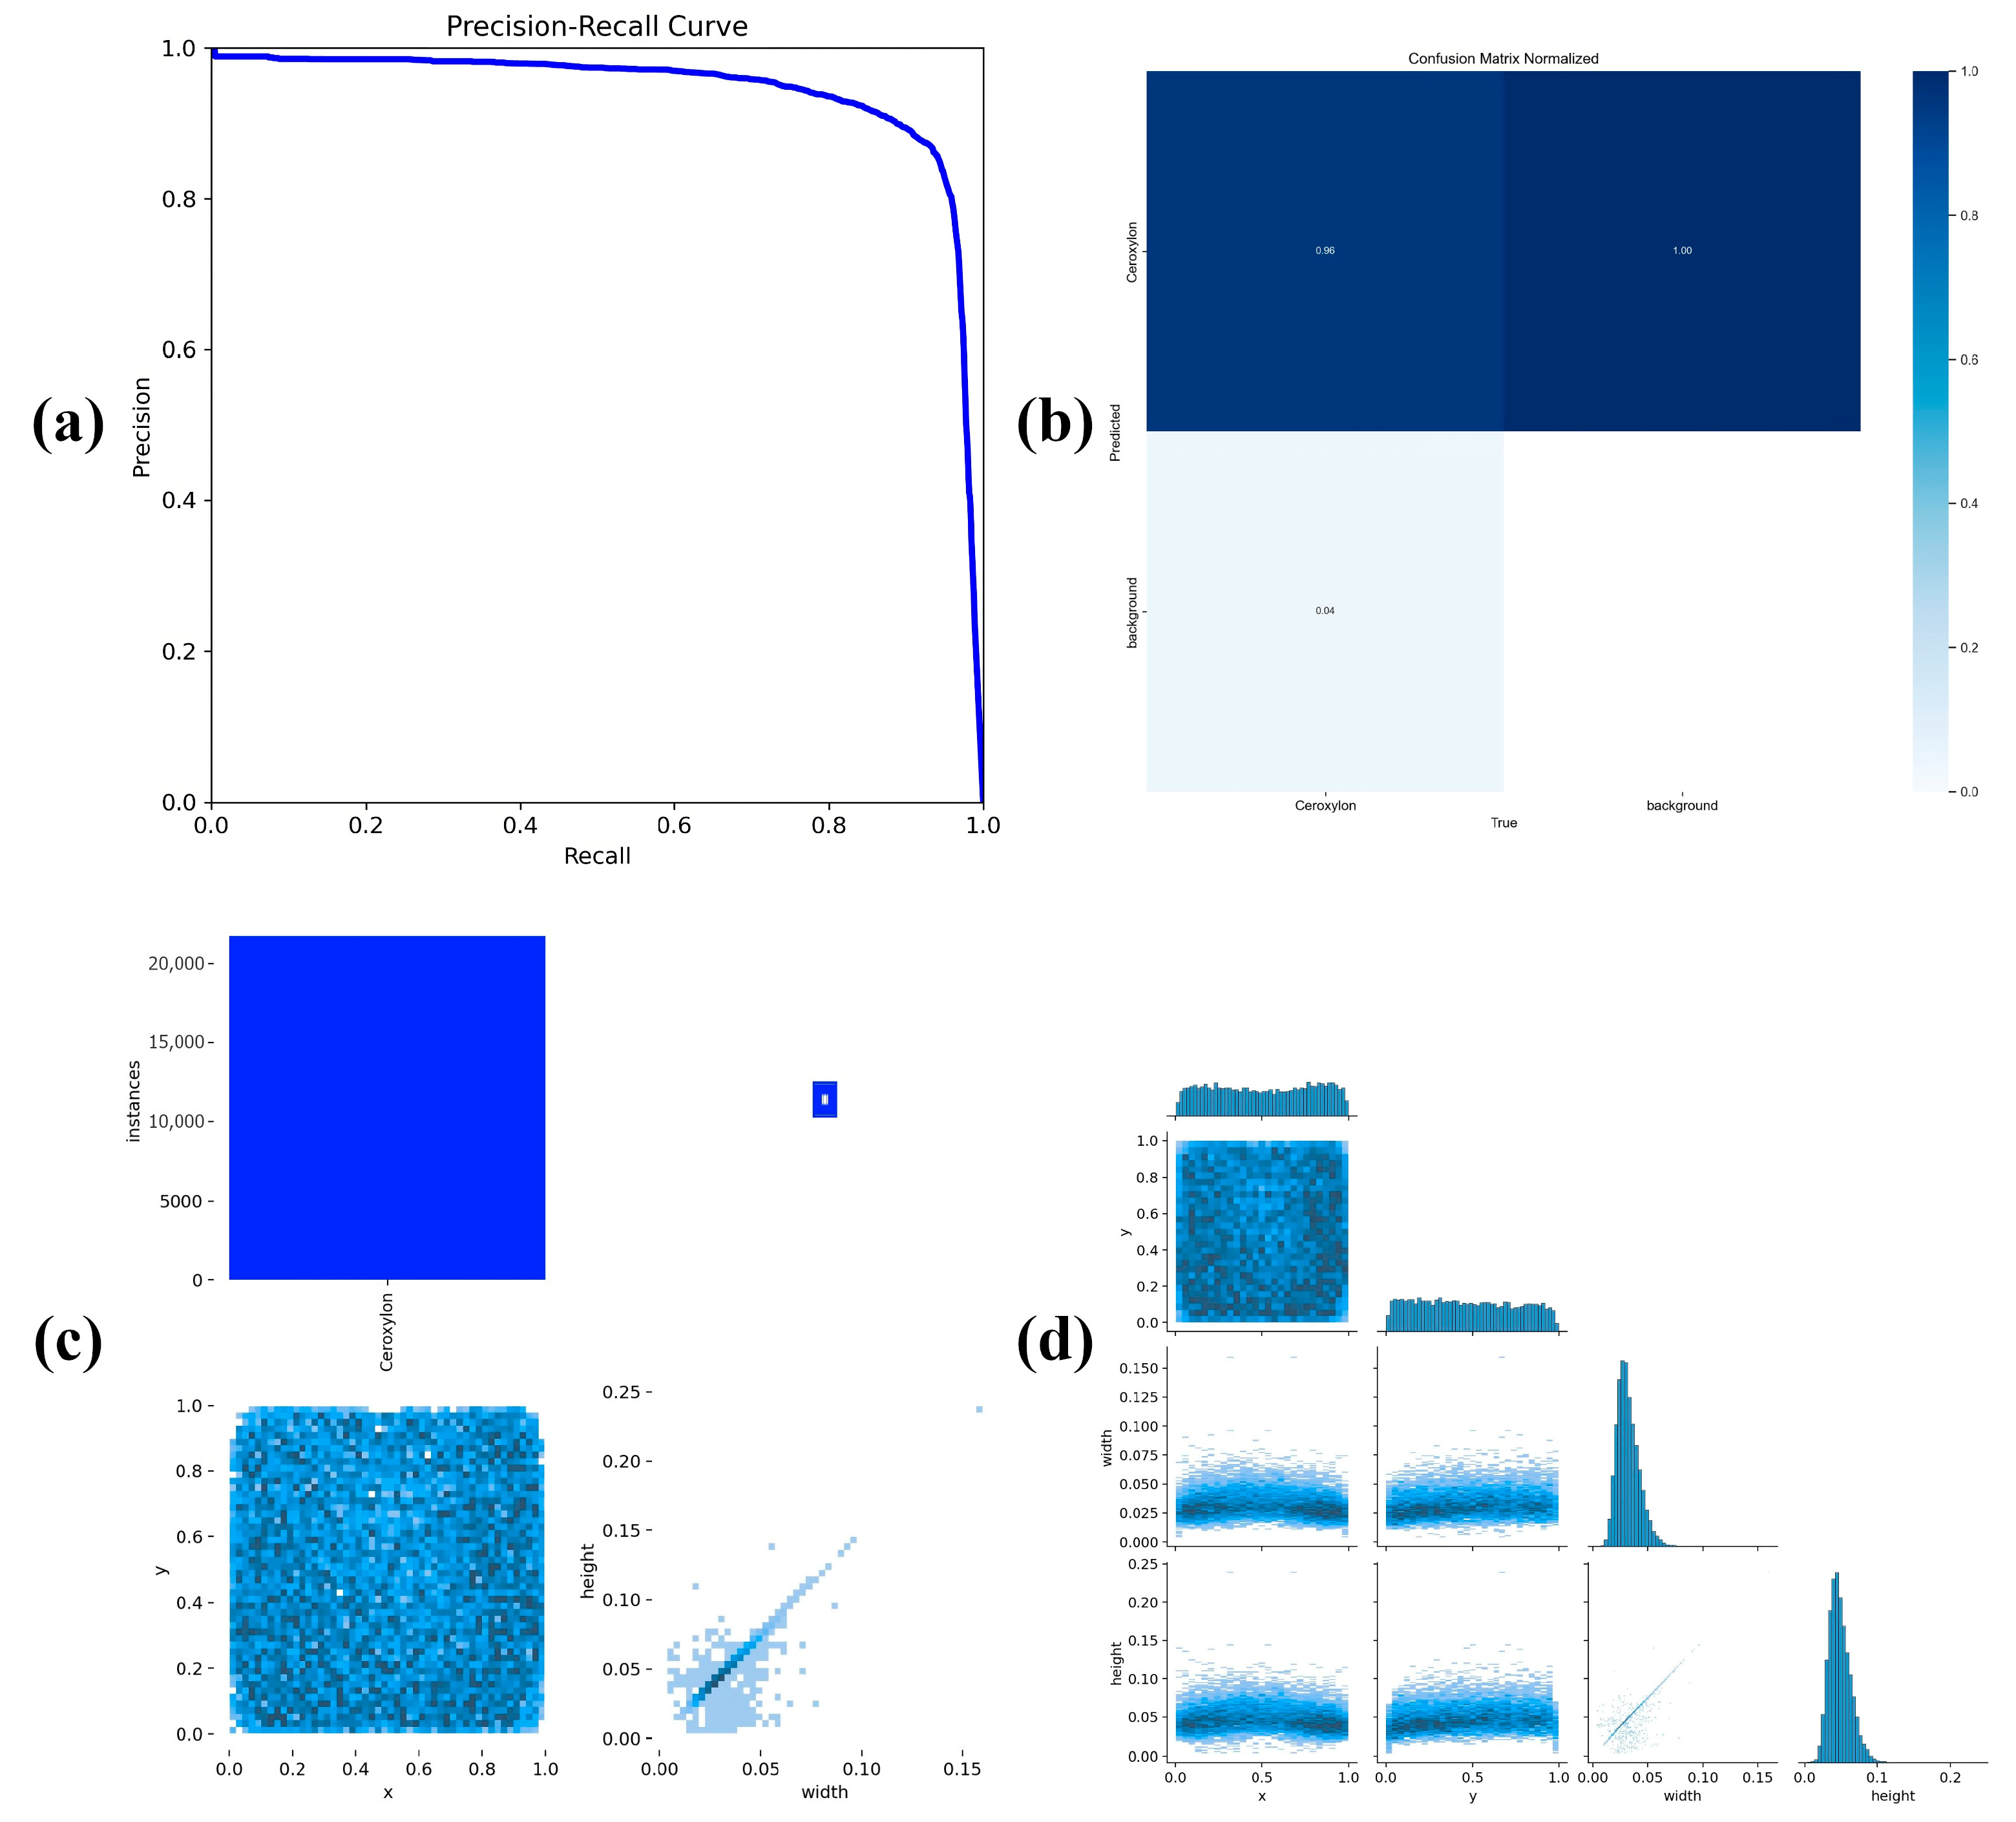
  • Model Performance (Precision–Recall Curve, Figure 7a): The precision–recall curve analysis demonstrates outstanding model performance, with an mAP50 of 0.929. The curve remains at a precision close to 1.0, decreasing significantly only when the maximum recall is reached, indicating robust detection capability with minimal false positives. This curve shape is characteristic of a well-calibrated model with high discriminative power.
  • Confusion Matrix (Figure 7b): The normalized confusion matrix reveals high accuracy (0.941) in detecting Ceroxylon, impeccable background classification with an accuracy of 1.00, and a low level of false positives and false negatives.
  • Distribution of Detections (Figure 7c): A significant concentration of samples is observed (deep blue region), the scatter plot shows correlations between model parameters, and the distribution graph suggests a substantial accumulation of features relevant for correct identification. The metrics suggest a uniform distribution of detections and a consistent correlation between the variables analyzed.
  • Detection Characteristics (Figure 7d): The graphs show how different features extracted during the detection process interact, that is, they indicate a uniform spatial distribution with positive correlations in the detections. The consistency of the model is validated through the well-defined concentration peaks in the histograms. This is a statistical analysis of annotated Ceroxylon palms, including scatter plots between the variable pairs (x, y), (x, width), (x, height), (y, width), (y, height), and (width, height). In these plots, darker shades indicate a higher concentration of data at those positions. Additionally, individual histograms are shown for the variables x, y, width, and height. The variables x and y correspond to the normalized coordinates of the center of the bounding box within the image, with values between 0 and 1. Width and height represent the proportion of the box size to the total image, also ranging from 0 to 1 [20].
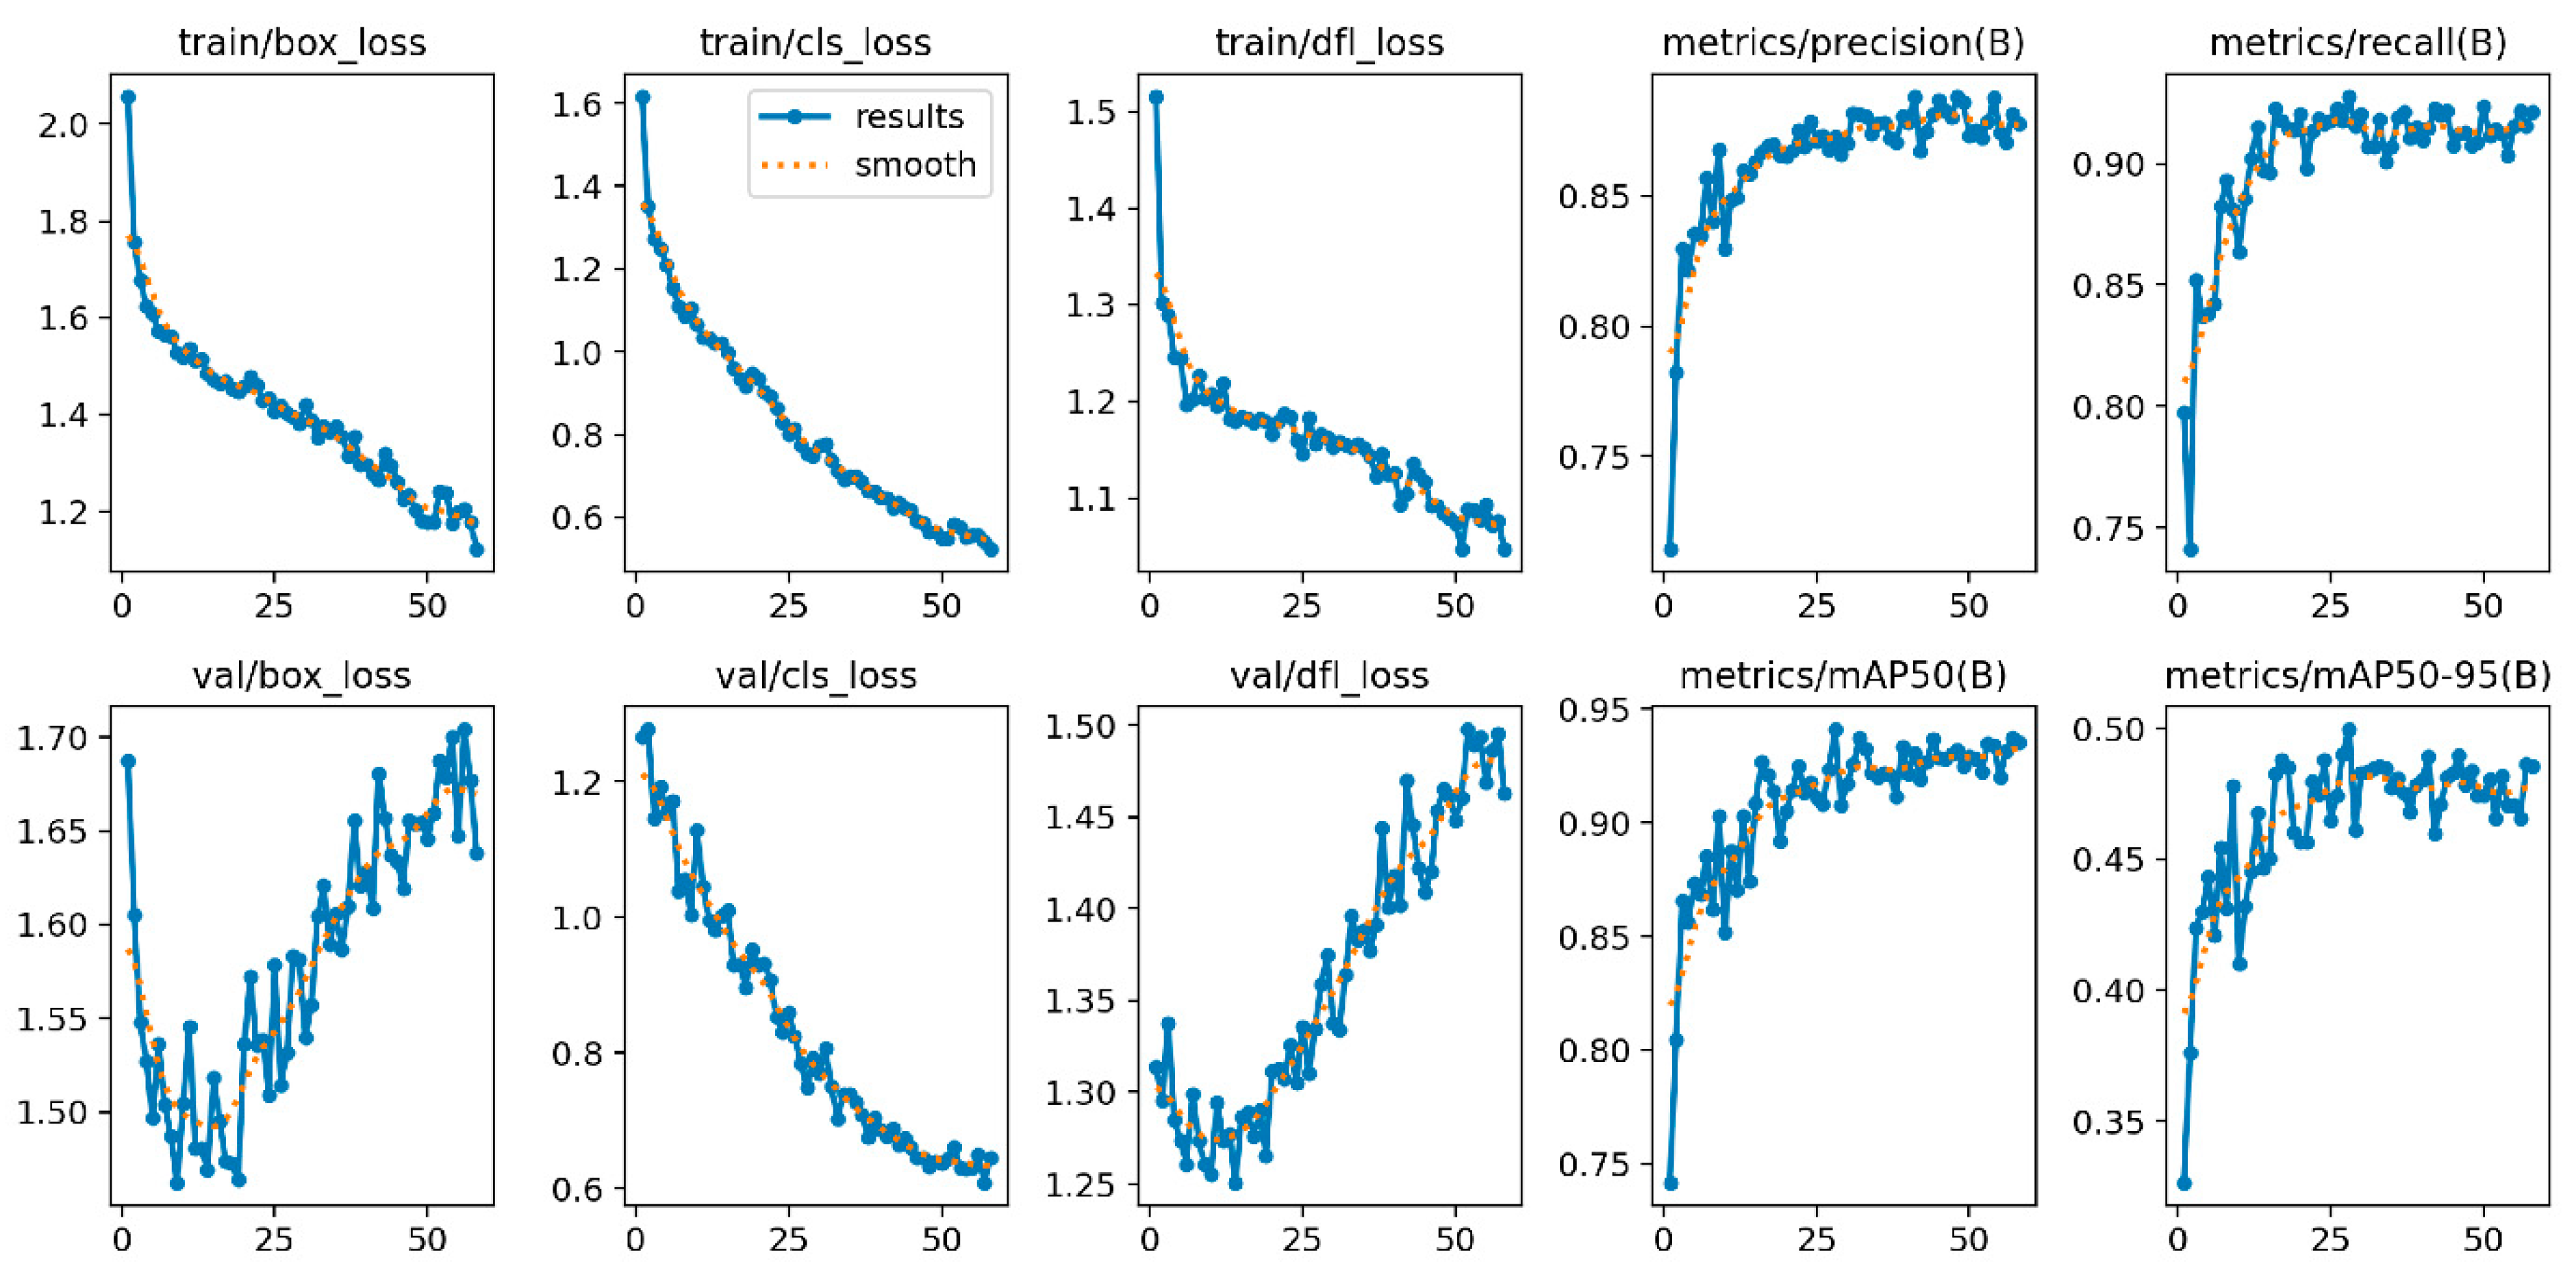
  • Training and Validation Metrics (Figure 8): The figure shows nine graphs that represent the data obtained in the training of the model:
    -
    The downward trend in all three losses (train/box_loss, train/cls_loss, train/dfl_loss) indicates that the model is learning efficiently and showed no signs of overfitting in training.
    -
    Validation losses (val/box_loss, val/cls_loss, val/dfl_loss) follow a similar pattern with some controlled fluctuations.
    -
    Training precision and recall metrics (metrics/precision(B), metrics/recall(B)) consistently improve during training, stabilizing at high values up to ~0.9, which is indicative of a robust model with low risk of false positives and negatives.
    -
    Similarly, the validation precision and recall metrics (metrics/mAP50(B)) have a progressive increase up to ~0.9, but in the most rigorous metric (metrics/mAP50-95(B)), its stabilization remains at ~0.45, which is typical in objects that are difficult to segment or with morphological variability (failures in the reconstruction of orthomosaics).
These plots suggest a robust and well-trained model with consistent performance in detecting Ceroxylon.

4. Discussion

The application of deep learning models based on the YOLO architecture to identify Ceroxylon palms in high-altitude Andean forests reveals both the potential and limitations of automated palm detection in structurally complex forest environments. Our findings not only demonstrate the performance of different YOLO variants but also allow us to critically assess their adaptability and accuracy in heterogeneous landscapes, providing valuable input for their optimized application in Ceroxylon monitoring and conservation tasks.
The findings of this study represent a significant methodological advance in the integration of UAV remote sensing technologies with automatic detection algorithms in tree species of high ecological value, such as those of the genus Ceroxylon. During the initial phase, technical challenges were identified in the generation of seven orthomosaics; the photogrammetric reconstruction of the palm crowns presented geometric and textural inconsistencies. These irregularities represented a significant limitation, contributing to the appearance of false positives as indicated in Figure 6. To optimize this process, it is recommended to exhaustively evaluate the different parameters in data collection by UAV since the present study is the first to evaluate Ceroxylon palms in their natural environment; the only comparable references come from research focused on oil palms, another type of palm tree that is found in less complex environments and that has different structural characteristics [35,60,63,66,67,69,79,80]. It was determined that an altitude of 100 m was adequate to obtain orthomosaics with good resolution (<4 cm/pix) based on the aforementioned literature, where orthomosaics were obtained from UAV images at different altitudes, such as 36 m (36 ft) and 40 m (100 ft) [63], 100 m [60], 122 m [35], 200 m [69], and 250 m [66], as well as satellite images with spatial resolutions of 0.3 m (0.2 ft) and 0.3 m (0.3 ft) [67], 0.6 m [79], and up to 1 m [80]. These studies determined that an altitude of 100 m was adequate for obtaining orthomosaics with good resolution (<4 cm/pix). For these reasons, in the present study, the structural differences between the palm species evaluated become key to largely explaining the difficulties encountered in photogrammetric reconstruction. These errors could be due to structural differences between the two palm species; while oil palms reach a height of up to 30 m, with a cylindrical stem up to 75 cm [81] and a crown of up to 10 m [82], palms of the genus Ceroxylon have stem diameters between 6 and 60 cm, a lower density of leaves, but can grow up to 60 m in height [83]. These characteristics are decisive, since Ceroxylon palms are more exposed to wind disturbances, due to their relatively thin stem and the changing weather conditions of the cloud forests where they are located [83,84]. Due to these challenges, it was necessary to perform multiple tests and adjustments in the photogrammetric processing parameters to optimize the two-dimensional reconstruction of the canopies and establish uniform parameters in all the generated orthomosaics. However, it is essential to explore different data acquisition strategies such as data collection from flights at different heights or the incorporation of alternative sensors such as multispectral, thermal, or LiDAR cameras [85], which can highlight additional structural and physiological characteristics of the palms.
The mosaic clipping parameter was evaluated due to the diversity of criteria reported in the literature [35,60,63,66], which highlighted the need to identify an optimal size for this study. Following the approach proposed by Shaikh et al. [63], crop sizes ranging from 640 × 640 px to 1600 × 1600 px were tested. The results indicated that the 1280 × 1280 px crop offered the best balance between spatial resolution and efficiency and was therefore selected as the standard for training the nine model configurations that were chosen.
The excellent performance of YOLOv8m, both in processing efficiency and detection accuracy, is consistent with the recent findings of Shen et al. [62], who highlighted the advantages of more advanced YOLO architectures in forest species identification. The ability of the model to achieve high mAP50 scores (0.98) under optimal conditions, especially in grassland areas, indicates that UAS-based detection systems can effectively monitor Ceroxylon populations in open landscapes. This ability is relevant, given the essential role of these palms in high-altitude Andean ecosystems [86,87].
However, the notable decrease in detection accuracy in forested environments, particularly reflected in reduced F1 scores for forested plots (dropping to 0.56 in some cases), highlights the continuing challenges in detecting understory vegetation in complex forest structures. This limitation mirrors the findings of Putra and Wijayanto [67], who identified similar challenges in dense forest environments. The variation in detection accuracy between open and forested environments suggests that habitat structure significantly influences the reliability of automated detection systems. This aspect should be considered when implementing these technologies for conservation monitoring.
The application of data augmentation techniques, especially the inclusion of atmospheric effects such as fog simulation and brightness adjustments, has been instrumental in increasing the robustness of the model. This method faces the specific challenges of high-altitude Andean environments, where atmospheric conditions can considerably impact image quality, as pointed out by Culqui et al. [1]. The success of these augmentation strategies indicates that tailoring preprocessing techniques to particular ecological contexts can greatly improve detection accuracy.
The results of processing time and computational requirements in the various versions of YOLO provide valuable information for practical implementation. The considerable increase in processing time from nano to extra-large models, especially during the 35 h training of YOLOv10x, suggests that marginal improvements in accuracy (a 0.07 increase in mAP50-95) may not offset the additional computational costs in many applications. This trade-off analysis is particularly relevant for conservation organizations with limited computational resources, as embodied by Shaikh et al. [63].
The study also has important implications for Ceroxylon conservation efforts. The ability to accurately detect and monitor their populations using UAV technology, especially in open areas, represents a strategic tool for assessing population dynamics and habitat changes over time. This capability is relevant given the threatened status of Ceroxylon species and their importance in Andean forest ecosystems [84,88].
The difficulties in detecting palms in dense forests underscore the importance of implementing integrated monitoring approaches. Although detection using UAVs has shown promising results in open areas and at forest edges, traditional ground survey methods may still be necessary to obtain complete assessments of populations in dense forests. This finding indicates that the most effective monitoring strategies may involve a combination of automated UAV detection and conventional field techniques, especially in complex forest environments.
The difficulties encountered in detecting palm trees in dense forests underscore the need for integrated monitoring approaches. While the use of UAVs has proven effective in open areas and at forest edges, traditional ground-based sampling methods remain essential for achieving comprehensive assessments in complex forest environments. This suggests that the most effective monitoring strategies could involve a combination of automated UAV detection and field techniques. Future research could focus on optimizing image acquisition parameters specifically for Ceroxylon detection, as well as developing and modifying advanced DL architectures that consider the structural complexity of forest ecosystems. Furthermore, the incorporation of different types of sensors, such as LiDAR or multispectral imaging, could also contribute to overcoming current limitations in these environments, as suggested by Li et al. [89]. These advances would not only improve the accuracy of species detection but would also allow for the assessment of ecosystem conservation status and the quantification of key ecosystem services, such as carbon storage. Thus, this type of technology has the potential to be integrated into long-term conservation and environmental monitoring programs, providing valuable information for the sustainable management of threatened species and the formulation of climate change mitigation policies.

5. Conclusions

Among the various automatic species detection models, YOLO models are some of the most representative. This study demonstrated the great potential to facilitate the detection and counting of Ceroxylon palms through the generation of orthomosaics with RGB images using UAVs.
Among the evaluated variants, the YOLOv8 model significantly outperformed newer versions, such as YOLOv10 and YOLOv11, in efficiency and accuracy. Its metrics (F1: 0.91; mAP50: 0.98; and mAP50: 0.62) validate its capacity for automated counting, especially in open and less structurally complex areas. Although all models exhibited a decrease in performance in complex forest environments, YOLOv8 maintained a consistent advantage, reinforcing its operational viability.
However, to advance toward robust monitoring systems that are transferable to other ecological contexts or species, key limitations need to be addressed. It is recommended to improve data acquisition protocols by exploring different altitudes, timings, and atmospheric conditions, as well as integrating multispectral imagery or using LiDAR technology. Furthermore, expanding and diversifying the dataset through data augmentation techniques and training in different scenarios would improve the training of new models in diverse regions with the ability to differentiate species in the future.
Therefore, this research not only provides a solid methodological basis for the detection of Ceroxylon but also opens opportunities for applications in conservation strategies based on optical imaging on low-altitude platforms with the potential for upscaling to larger areas. Therefore, the study seeks to actively contribute to the care, monitoring, and preservation of Ceroxylon, a species vulnerable to anthropogenic activities. These technological tools facilitate decision-making in biodiversity management and conservation programs. This approach can be extrapolated to the monitoring of other threatened plant species and to the estimation of ecosystem services such as carbon storage, thus contributing to efficient, reproducible, and scientifically supported environmental management.

Supplementary Materials

The following supporting information can be downloaded at: https://www.mdpi.com/article/10.3390/f16071061/s1, Table S1: Total training metrics per model and plot; Figure S1: Study plots trained with YOLO V8 in “n”, “m” and “x” configurations; Figure S2: Study plots trained with YOLO V10 in “n”, “m” and “x” configurations; Figure S3: Study plots trained with YOLOv11 in “n”, “m” and “x” configurations.

Author Contributions

Conceptualization, J.A.S.-V., J.O.S.-L., R.S.L., K.M.T.-T., T.B.S.-M., C.A.d.S.J. and J.A.Z.-S.; Methodology, J.A.S.-V., J.O.S.-L., A.J.M.-M., K.M.T.-T. and E.B.; Software, J.A.S.-V., A.S.R.-F., C.A.d.S.J. and J.S.-V.; Validation, J.A.S.-V.; Formal analysis, A.J.M.-M.; Investigation, J.A.S.-V., K.M.T.-T., T.B.S.-M., M.O.-C. and J.A.Z.-S.; Resources, J.O.S.-L., A.J.M.-M., A.S.R.-F., T.B.S.-M. and M.O.-C.; Data curation, J.S.-V.; Writing—original draft, J.A.S.-V., R.S.L. and J.A.Z.-S.; Writing—review & editing, C.A.d.S.J. and J.A.Z.-S.; Visualization, A.S.R.-F., C.A.d.S.J. and J.S.-V.; Supervision, R.S.L., K.M.T.-T. and E.B.; Project administration, J.O.S.-L., R.S.L., M.O.-C. and E.B.; Funding acquisition, R.S.L., M.O.-C. and E.B. All authors have read and agreed to the published version of the manuscript.

Funding

This research was funded by the Public Investment Project “Creation of a Geomatics and Remote Sensing Laboratory of the National University Toribio Rodríguez of Mendoza of Amazonas” GEOMATICA (CUI N° 2255626). The APC was funded by the Vice-Rectorate for Research of the Universidad Nacional Toribio Rodríguez de Mendoza de Amazonas.

Data Availability Statement

The data used to support the findings of this study are available from the corresponding author upon request. Processing code available at the following link: https://github.com/Anderson281/Ceroxylon_Palms_YOLO (accessed on 12 June 2025).

Acknowledgments

The authors gratefully acknowledge the support of the Instituto de Investigación para el Desarrollo Sustentable de Ceja de Selva (INDES-CES) of the National University Toribio Rodríguez de Mendoza of Amazonas (UNTRM). We extend our sincere thanks to Cecibel Portocarrero Díaz for her valuable logistical and administrative assistance during the implementation of the Geomatics Project. Our appreciation also goes to Daniel Iliquín Trigoso, Darwin Gómez Fernández, Nilton B. Rojas Briceño, Renzo E. Terrones Murga, and Jorge Soto Pulser for their active collaboration and participation in the field data collection. We are particularly grateful to the residents of the Taulía–Molinopampa community for granting access to the palm plots and for their generous and committed support throughout the development of this study. Finally, we express our sincere gratitude to Aqil Tariq for his insightful corrections and suggestions, which significantly enhanced the clarity and quality of the manuscript.

Conflicts of Interest

The authors declare no conflicts of interest.

References

  1. Culqui, L.; Leiva-Tafur, D.; Haro, N.; Juarez-Contreras, L.; Vigo, C.N.; Maicelo Quintana, J.L.; Oliva-Cruz, M. Native Species Diversity Associated with Bosque Palmeras de Ocol in the Amazonas Region, Peru. Trees For. People 2024, 16, 100580. [Google Scholar] [CrossRef]
  2. Prajapati, V.; Modi, K.; Mehta, Y.; Malhotra, S. Assessment of Drug Marketing Literature Systematically Using the WHO Criteria. Natl. J. Physiol. Pharm. Pharmacol. 2023, 13, 2100–2104. [Google Scholar] [CrossRef]
  3. Kalogiannidis, S.; Kalfas, D.; Loizou, E.; Chatzitheodoridis, F. Forestry Bioeconomy Contribution on Socioeconomic Development: Evidence from Greece. Land 2022, 11, 2139. [Google Scholar] [CrossRef]
  4. Ge, Y.; Hu, S.; Ren, Z.; Jia, Y.; Wang, J.; Liu, M.; Zhang, D.; Zhao, W.; Luo, Y.; Fu, Y.; et al. Mapping Annual Land Use Changes in China’s Poverty-Stricken Areas from 2013 to 2018. Remote Sens. Environ. 2019, 232, 111285. [Google Scholar] [CrossRef]
  5. Leberger, R.; Rosa, I.M.D.; Guerra, C.A.; Wolf, F.; Pereira, H.M. Global Patterns of Forest Loss across IUCN Categories of Protected Areas. Biol. Conserv. 2020, 241, 108299. [Google Scholar] [CrossRef]
  6. Kupec, P.; Marková, J.; Pelikán, P.; Brychtová, M.; Autratová, S.; Fialová, J. Urban Parks Hydrological Regime in the Context of Climate Change—A Case Study of Štěpánka Forest Park (Mladá Boleslav, Czech Republic). Land 2022, 11, 412. [Google Scholar] [CrossRef]
  7. Aguirre-Forero, S.E.; Piraneque-Gambasica, N.V.; Abaunza-Suárez, C.F. Especies Con Potencial Para Sistemas Agroforestales En El Departamento Del Magdalena, Colombia. Inf. Tecnol. 2021, 32, 13–28. [Google Scholar] [CrossRef]
  8. Leite-Júnior, D.P.; de Oliveira-Dantas, E.S.; de Sousa, R.; de Sousa, M.; Durigon, L.; Sehn, M.; Siqueira, V. Burning Season: Challenges to Conserve Biodiversity and the Critical Points of a Planet Threatened by the Danger Called Global Warming. Int. J. Environ. Clim. Change 2021, 11, 60–90. [Google Scholar] [CrossRef]
  9. Rivers, M.; Newton, A.C.; Oldfield, S. Scientists’ Warning to Humanity on Tree Extinctions. Plants People Planet 2023, 5, 466–482. [Google Scholar] [CrossRef]
  10. Medina Medina, A.J.; Salas López, R.; Zabaleta Santisteban, J.A.; Tuesta Trauco, K.M.; Turpo Cayo, E.Y.; Huaman Haro, N.; Oliva Cruz, M.; Gómez Fernández, D. An Analysis of the Rice-Cultivation Dynamics in the Lower Utcubamba River Basin Using SAR and Optical Imagery in Google Earth Engine (GEE). Agronomy 2024, 14, 557. [Google Scholar] [CrossRef]
  11. Zhong, H.; Zhang, Z.; Liu, H.; Wu, J.; Lin, W. Individual Tree Species Identification for Complex Coniferous and Broad-Leaved Mixed Forests Based on Deep Learning Combined with UAV LiDAR Data and RGB Images. Forests 2024, 15, 293. [Google Scholar] [CrossRef]
  12. Budei, B.C.; St-Onge, B.; Hopkinson, C.; Audet, F.A. Identifying the Genus or Species of Individual Trees Using a Three-Wavelength Airborne Lidar System. Remote Sens. Environ. 2018, 204, 632–647. [Google Scholar] [CrossRef]
  13. Fassnacht, F.E.; Latifi, H.; Stereńczak, K.; Modzelewska, A.; Lefsky, M.; Waser, L.T.; Straub, C.; Ghosh, A. Review of Studies on Tree Species Classification from Remotely Sensed Data. Remote Sens. Environ. 2016, 186, 64–87. [Google Scholar] [CrossRef]
  14. Braga, J.R.G.; Peripato, V.; Dalagnol, R.; Ferreira, M.P.; Tarabalka, Y.; Aragão, L.E.O.C.; de Campos Velho, H.F.; Shiguemori, E.H.; Wagner, F.H. Tree Crown Delineation Algorithm Based on a Convolutional Neural Network. Remote Sens. 2020, 12, 1288. [Google Scholar] [CrossRef]
  15. Kentsch, S.; Caceres, M.L.L.; Serrano, D.; Roure, F.; Diez, Y. Computer Vision and Deep Learning Techniques for the Analysis of Drone-Acquired Forest Images, a Transfer Learning Study. Remote Sens. 2020, 12, 1287. [Google Scholar] [CrossRef]
  16. Zhang, Z.; Han, C.; Wang, X.; Li, H.; Li, J.; Zeng, J.; Sun, S.; Wu, W. Large Field-of-View Pine Wilt Disease Tree Detection Based on Improved YOLO v4 Model with UAV Images. Front. Plant Sci. 2024, 15, 1381367. [Google Scholar] [CrossRef]
  17. Almeida, D.R.A.D.; Broadbent, E.N.; Ferreira, M.P.; Meli, P.; Zambrano, A.M.A.; Gorgens, E.B.; Resende, A.F.; de Almeida, C.T.; do Amaral, C.H.; Corte, A.P.D.; et al. Monitoring Restored Tropical Forest Diversity and Structure through UAV-Borne Hyperspectral and Lidar Fusion. Remote Sens. Environ. 2021, 264, 112582. [Google Scholar] [CrossRef]
  18. Terryn, L.; Calders, K.; Bartholomeus, H.; Bartolo, R.E.; Brede, B.; D’hont, B.; Disney, M.; Herold, M.; Lau, A.; Shenkin, A.; et al. Quantifying Tropical Forest Structure through Terrestrial and UAV Laser Scanning Fusion in Australian Rainforests. Remote Sens. Environ. 2022, 271, 112912. [Google Scholar] [CrossRef]
  19. Botterill-James, T.; Yates, L.A.; Buettel, J.C.; Aandahl, Z.; Brook, B.W. Southeast Asian Biodiversity Is a Fifth Lower in Deforested versus Intact Forests. Environ. Res. Lett. 2024, 19, 113007. [Google Scholar] [CrossRef]
  20. Wang, J.; Zhang, H.; Liu, Y.; Zhang, H.; Zheng, D. Tree-Level Chinese Fir Detection Using UAV RGB Imagery and YOLO-DCAM. Remote Sens. 2024, 16, 335. [Google Scholar] [CrossRef]
  21. Xu, X.; Zhou, Z.; Tang, Y.; Qu, Y. Individual Tree Crown Detection from High Spatial Resolution Imagery Using a Revised Local Maximum Filtering. Remote Sens. Environ. 2021, 258, 112397. [Google Scholar] [CrossRef]
  22. Qin, H.; Zhou, W.; Yao, Y.; Wang, W. Individual Tree Segmentation and Tree Species Classification in Subtropical Broadleaf Forests Using UAV-Based LiDAR, Hyperspectral, and Ultrahigh-Resolution RGB Data. Remote Sens. Environ. 2022, 280, 113143. [Google Scholar] [CrossRef]
  23. Wang, Y.; Zhu, X.; Wu, B. Automatic Detection of Individual Oil Palm Trees from UAV Images Using HOG Features and an SVM Classifier. Int. J. Remote Sens. 2018, 40, 7356–7370. [Google Scholar] [CrossRef]
  24. Diez, Y.; Kentsch, S.; Lopez Caceres, M.L.; Nguyen, H.T.; Serrano, D.; Roure, F. Comparison of Algorithms for Tree-Top Detection in Drone Image Mosaics of Japanese Mixed Forests. In Proceedings of the 9th International Conference on Pattern Recognition Applications and Methods ICPRAM, Valletta, Malta, 22–24 February 2020; Volume 1, pp. 75–87. [Google Scholar] [CrossRef]
  25. Puliti, S.; Astrup, R. Automatic Detection of Snow Breakage at Single Tree Level Using YOLOv5 Applied to UAV Imagery. Int. J. Appl. Earth Obs. Geoinf. 2022, 112, 102946. [Google Scholar] [CrossRef]
  26. Yu, K.; Hao, Z.; Post, C.J.; Mikhailova, E.A.; Lin, L.; Zhao, G.; Tian, S.; Liu, J. Comparison of Classical Methods and Mask R-CNN for Automatic Tree Detection and Mapping Using UAV Imagery. Remote Sens. 2022, 14, 295. [Google Scholar] [CrossRef]
  27. Liu, S.; Xue, J.; Zhang, T.; Lv, P. Research Progress and Prospect of Key Technologies of Fruit Target Recognition for Robotic Fruit Picking. Front. Plant Sci. 2024, 15, 1423338. [Google Scholar] [CrossRef] [PubMed]
  28. Girshick, R.; Donahue, J.; Darrell, T.; Malik, J. Rich Feature Hierarchies for Accurate Object Detection and Semantic Segmentation. In Proceedings of the IEEE Conference on Computer Vision and Pattern Recognition, Columbus, OH, USA, 23–28 June 2014; pp. 580–587. [Google Scholar] [CrossRef]
  29. Girshick, R. Fast R-CNN. In Proceedings of the IEEE International Conference on Computer Vision (ICCV), Santiago, Chile, 7–13 December 2015; pp. 1440–1448. [Google Scholar] [CrossRef]
  30. Ren, S.; He, K.; Girshick, R.; Sun, J. Faster R-CNN: Towards Real-Time Object Detection with Region Proposal Networks. IEEE Trans. Pattern Anal. Mach. Intell. 2016, 39, 1137–1149. [Google Scholar] [CrossRef]
  31. Redmon, J.; Divvala, S.; Girshick, R.; Parhadi, A. You Only Look Once: Unified, Real-Time Object Detection. In Proceedings of the 2016 Conference on Computer Vision and Pattern Recognition (CVPR), Las Vegas, NV, USA, 27–30 June 2016. [Google Scholar]
  32. Qiu, Q.; Lau, D. Assessment of Trees’ Structural Defects via Hybrid Deep Learning Methods Used in Unmanned Aerial Vehicle (UAV) Observations. Forests 2024, 15, 1374. [Google Scholar] [CrossRef]
  33. Shen, Y.; Liu, D.; Chen, J.; Wang, Z.; Wang, Z.; Zhang, Q. On-Board Multi-Class Geospatial Object Detection Based on Convolutional Neural Network for High Resolution Remote Sensing Images. Remote Sens. 2023, 15, 3963. [Google Scholar] [CrossRef]
  34. Jiang, P.; Ergu, D.; Liu, F.; Cai, Y.; Ma, B. A Review of Yolo Algorithm Developments. Procedia Comput. Sci. 2021, 199, 1066–1073. [Google Scholar] [CrossRef]
  35. Jintasuttisak, T.; Edirisinghe, E.; Elbattay, A. Deep Neural Network Based Date Palm Tree Detection in Drone Imagery. Comput. Electron. Agric. 2022, 192, 106560. [Google Scholar] [CrossRef]
  36. Redmon, J.; Farhadi, A. YOLOv3: An Incremental Improvement. arXiv 2018, arXiv:1804.02767. [Google Scholar]
  37. Bochkovskiy, A.; Wang, C.-Y.; Liao, H.-Y.M. YOLOv4: Optimal Speed and Accuracy of Object Detection. arXiv 2020, arXiv:2004.10934. [Google Scholar]
  38. Li, C.; Li, L.; Jiang, H.; Weng, K.; Geng, Y.; Li, L.; Ke, Z.; Li, Q.; Cheng, M.; Nie, W.; et al. YOLOv6: A Single-Stage Object Detection Framework for Industrial Applications. arXiv 2022, arXiv:2209.02976. [Google Scholar]
  39. Wang, C.-Y.; Bochkovskiy, A.; Liao, H.-Y.M. YOLOv7: Trainable Bag-of-Freebies Sets New State-of-the-Art for Real-Time Object Detectors. In Proceedings of the IEEE/CVF Conference on Computer Vision and Pattern Recognition (CVPR), Vancouver, BC, Canada, 17–24 June 2023; pp. 7464–7475. [Google Scholar] [CrossRef]
  40. Lou, X.; Huang, Y.; Fang, L.; Huang, S.; Gao, H.; Yang, L.; Weng, Y.; Hung, I.K. Measuring Loblolly Pine Crowns with Drone Imagery through Deep Learning. J. For. Res. 2022, 33, 227–238. [Google Scholar] [CrossRef]
  41. Chen, Y.; Xu, H.; Zhang, X.; Gao, P.; Xu, Z.; Huang, X. An Object Detection Method for Bayberry Trees Based on an Improved YOLO Algorithm. Int. J. Digit. Earth 2023, 16, 781–805. [Google Scholar] [CrossRef]
  42. Dong, C.; Cai, C.; Chen, S.; Xu, H.; Yang, L.; Ji, J.; Huang, S.; Hung, I.K.; Weng, Y.; Lou, X. Crown Width Extraction of Metasequoia Glyptostroboides Using Improved YOLOv7 Based on UAV Images. Drones 2023, 7, 336. [Google Scholar] [CrossRef]
  43. Xue, Z.; Lin, H.; Wang, F. A Small Target Forest Fire Detection Model Based on YOLOv5 Improvement. Forests 2022, 13, 1332. [Google Scholar] [CrossRef]
  44. Qin, B.; Sun, F.; Shen, W.; Dong, B.; Ma, S.; Huo, X.; Lan, P. Deep Learning-Based Pine Nematode Trees’ Identification Using Multispectral and Visible UAV Imagery. Drones 2023, 7, 183. [Google Scholar] [CrossRef]
  45. Cruz, M.; Pradel, W.; Juarez, H.; Hualla, V.; Suarez, V. Deforestation Dynamics in Peru. A Comprehensive Review of Land Use, Food Systems, and Socio-Economic Drivers; International Potato Center: Lima, Peru, 2023; 43p. [Google Scholar] [CrossRef]
  46. MINAM. GEOBOSQUES: Bosque y Pérdida de Bosque. Available online: https://geobosques.minam.gob.pe/geobosque/view/perdida.php (accessed on 22 June 2025).
  47. De Sy, V.; Herol, M.; Achard, F.; Beauchle, R.; Clevers, J.; Lindquist, E.; Verchot, L. Land Use Patterns and Related Carbon Losses Following Deforestation in South America. Environ. Res. Lett. 2015, 10, 124004. [Google Scholar]
  48. Meza-Mori, G.; Rojas-Briceño, N.B.; Cotrina Sánchez, A.; Oliva-Cruz, M.; Olivera Tarifeño, C.M.; Hoyos Cerna, M.Y.; Ramos Sandoval, J.D.; Torres Guzmán, C. Potential Current and Future Distribution of the Long-Whiskered Owlet (Xenoglaux loweryi) in Amazonas and San Martin, NW Peru. Animals 2022, 12, 1794. [Google Scholar] [CrossRef] [PubMed]
  49. Galán-De-mera, A.; Campos-De-la-cruz, J.; Linares-Perea, E.; Montoya-Quino, J.; Torres-Marquina, I.; Vicente-Orellana, J.A. A Phytosociological Study on Andean Rainforests of Peru, and a Comparison with the Surrounding Countries. Plants 2020, 9, 1654. [Google Scholar] [CrossRef]
  50. Linares-Palomino, R.; Cardona, V.; Hennig, E.I.; Hensen, I.; Hoffmann, D.; Lendzion, J.; Soto, D.; Herzog, S.K.; Kessler, M. Non-Woody Life-Form Contribution to Vascular Plant Species Richness in a Tropical American Forest. Plant Ecol. 2009, 201, 87–99. [Google Scholar] [CrossRef]
  51. Maicelo-Quintana, J.L. Sutainability Indicators in Soil Funtion and Carbon Sequestration in the Biomass of Ceroxylon peruvianum Galeano, Sanin and Mejía from the Middle Utcubamba River Basin, Amaoznas Peru. Ecol. Apl. 2012, 11, 33. [Google Scholar] [CrossRef]
  52. Rimachi, Y.; Oliva, M. Evaluación de La Regeneración Natural de Palmeras Ceroxylon parvifrons En El Bosque Andino Amazónico de Molinopampa, Amazonas. Rev. Investig. Agroproducción Sustentable 2018, 2, 42. [Google Scholar] [CrossRef]
  53. García-Pérez, A.; Rubio Rojas, K.B.; Meléndez Mori, J.B.; Corroto, F.; Rascón, J.; Oliva, M. Estudio Ecológico de Los Bosques Homogéneos En El Distrito de Molinopampa, Región Amazonas. Rev. Investig. Agroproducción Sustentable 2018, 2, 73. [Google Scholar] [CrossRef]
  54. Oliva, M.; Rimachi, Y. Selección Fenotípica de Árboles plus de Tres Especies Forestales Maderables En Poblaciones Naturales En El Distrito de Molinopampa (Amazonas). Rev. Investig. Agroproducción Sustentable 2017, 1, 36. [Google Scholar] [CrossRef]
  55. Oliva, M.; Pérez, D.; Vela, S. Priorización de Especies Forestales Nativas Como Fuentes Semilleros Del Proyecto PD 622/11 En Molinopampa, Amazonas, Perú; IIAP: Loreto, Peru, 2011. [Google Scholar]
  56. Zabaleta-Santisteban, J.A.; López, R.S.; Rojas-Briceño, N.B.; Fernández, D.G.; Medina Medina, A.J.; Tuesta Trauco, K.M.; Rivera Fernandez, A.S.; Crisóstomo, J.L.; Oliva-Cruz, M.; Silva-López, J.O. Optimizing Landfill Site Selection Using Fuzzy-AHP and GIS for Sustainable Urban Planning. Civ. Eng. J. 2024, 10, 1698–1719. [Google Scholar] [CrossRef]
  57. Bernal, R.; Sanín, M.J.; Galeano, G. Plan de Conservación, Manejo y Uso Sostenible de la Palma de Cera del Quindío (Ceroxylon quindiuense), Árbol Nacional de Colombia; Ministerio del Ambiente y Desarrollo Sostenible: Bogota, Colombia, 2015; ISBN 9789588901039.
  58. Taddia, Y.; Stecchi, F.; Pellegrinelli, A. Using Dji Phantom 4 Rtk Drone for Topographic Mapping of Coastal Areas. Int. Arch. Photogramm. Remote Sens. Spat. Inf. Sci. ISPRS Arch. 2019, 42, 625–630. [Google Scholar] [CrossRef]
  59. Gibril, M.B.A.; Shafri, H.Z.M.; Al-Ruzouq, R.; Shanableh, A.; Nahas, F.; Al Mansoori, S. Large-Scale Date Palm Tree Segmentation from Multiscale UAV-Based and Aerial Images Using Deep Vision Transformers. Drones 2023, 7, 93. [Google Scholar] [CrossRef]
  60. Ariyadi, M.R.N.; Pribadi, M.R.; Widiyanto, E.P. Unmanned Aerial Vehicle for Remote Sensing Detection of Oil Palm Trees Using You Only Look Once and Convolutional Neural Network. In Proceedings of the 10th International Conference on Electrical Engineering, Computer Science and Informatics (EECSI), Palembang, Indonesia, 20–21 September 2023; pp. 226–230. [Google Scholar] [CrossRef]
  61. Tinkham, W.T.; Swayze, N.C. Influence of Agisoft Metashape Parameters on Uas Structure from Motion Individual Tree Detection from Canopy Height Models. Forests 2021, 12, 250. [Google Scholar] [CrossRef]
  62. Shen, L.; Lang, B.; Song, Z. DS-YOLOv8-Based Object Detection Method for Remote Sensing Images. IEEE Access 2023, 11, 125122–125137. [Google Scholar] [CrossRef]
  63. Shaikh, I.M.; Akhtar, M.N.; Aabid, A.; Ahmed, O.S. Enhancing Sustainability in the Production of Palm Oil: Creative Monitoring Methods Using YOLOv7 and YOLOv8 for Effective Plantation Management. Biotechnol. Rep. 2024, 44, e00853. [Google Scholar] [CrossRef]
  64. YOLOv8—Ultralytics YOLO Documentos. Available online: https://docs.ultralytics.com/es/models/yolov8/#overview (accessed on 18 December 2024).
  65. Wada, K. Labelme: Image Polygonal Annotation with Python. Available online: https://github.com/wkentaro/labelme (accessed on 18 December 2024).
  66. Wardana, D.P.T.; Sianturi, R.S.; Fatwa, R. Detection of Oil Palm Trees Using Deep Learning Method with High-Resolution Aerial Image Data. In Proceedings of the 8th International Conference on Sustainable Information Engineering and Technology (SIET ‘23), Bali, Indonesia, 24–25 October 2023; Association for Computing Machinery: New York, NY, USA; pp. 90–98. [Google Scholar] [CrossRef]
  67. Putra, Y.C.; Wijayanto, A.W. Automatic Detection and Counting of Oil Palm Trees Using Remote Sensing and Object-Based Deep Learning. Remote Sens. Appl. Soc. Environ. 2023, 29, 100914. [Google Scholar] [CrossRef]
  68. Bounding Boxes Augmentation for Object Detection—Albumentations Documentation. Available online: https://albumentations.ai/docs/examples/example-bboxes/ (accessed on 22 June 2025).
  69. Zhorif, N.N.; Anandyto, R.K.; Rusyadi, A.U.; Irwansyah, E. Implementation of Slicing Aided Hyper Inference (SAHI) in YOLOv8 to Counting Oil Palm Trees Using High-Resolution Aerial Imagery Data. Int. J. Adv. Comput. Sci. Appl. 2024, 15, 869–874. [Google Scholar] [CrossRef]
  70. Inicio—Ultralytics YOLO Docs. Available online: https://docs.ultralytics.com/es#yolo-a-brief-history (accessed on 18 December 2024).
  71. UbiAI. Why YOLO v7 Is Better than CNNs. Available online: https://ubiai.tools/why-yolov7-is-better-than-cnns/ (accessed on 13 June 2025).
  72. Sharma, A.; Kumar, V.; Longchamps, L. Comparative Performance of YOLOv8, YOLOv9, YOLOv10, YOLOv11 and Faster R-CNN Models for Detection of Multiple Weed Species. Smart Agric. Technol. 2024, 9, 100648. [Google Scholar] [CrossRef]
  73. Vilcapoma, P.; Meléndez, D.P.; Fernández, A.; Vásconez, I.N.; Hillmann, N.C.; Gatica, G.; Vásconez, J.P. Angle Detection in Dental Panoramic X-Rays. Sensors 2024, 24, 6053. [Google Scholar] [CrossRef]
  74. Ayturan, K.; Sarıkamış, B.; Akşahin, M.F.; Kutbay, U. SPHERE: Benchmarking YOLO vs. CNN on a Novel Dataset for High-Accuracy Solar Panel Defect Detection in Renewable Energy Systems. Appl. Sci. 2025, 15, 4880. [Google Scholar] [CrossRef]
  75. Wang, X.; Zhang, C.; Qiang, Z.; Liu, C.; Wei, X.; Cheng, F. A Coffee Plant Counting Method Based on Dual-Channel NMS and YOLOv9 Leveraging UAV Multispectral Imaging. Remote Sens. 2024, 16, 3810. [Google Scholar] [CrossRef]
  76. Wu, J.; Xu, W.; He, J.; Lan, M. YOLO for Penguin Detection and Counting Based on Remote Sensing Images. Remote Sens. 2023, 15, 2598. [Google Scholar] [CrossRef]
  77. Yu, C.; Yin, H.; Rong, C.; Zhao, J.; Liang, X.; Li, R.; Mo, X. YOLO-MRS: An Efficient Deep Learning-Based Maritime Object Detection Method for Unmanned Surface Vehicles. Appl. Ocean Res. 2024, 153, 104240. [Google Scholar] [CrossRef]
  78. Chen, Z.; Cao, L.; Wang, Q. YOLOv5-Based Vehicle Detection Method for High-Resolution UAV Images. Mob. Inf. Syst. 2022, 2022, 11. [Google Scholar] [CrossRef]
  79. Nurhabib, I.; Seminar, K.B. Sudradjat Recognition and Counting of Oil Palm Tree with Deep Learning Using Satellite Image. IOP Conf. Ser. Earth Environ. Sci. 2022, 974, 012058. [Google Scholar] [CrossRef]
  80. Al-Saad, M.; Aburaed, N.; Mansoori, S.A.; Ahmad, H.A. Autonomous Palm Tree Detection from Remote Sensing Images-UAE Dataset. In Proceedings of the 2022 IEEE International Geoscience and Remote Sensing Symposium, Kuala Lumpur, Malaysia, 17–22 July 2022; pp. 2191–2194. [Google Scholar] [CrossRef]
  81. Bakewell-stone, P. Elaeis Guineensis (African Oil Palm). In PlantwisePlus Knowledge Bank; CABI International: Wallingford, UK, 2022. [Google Scholar] [CrossRef]
  82. Kurihara, J.; Koo, V.C.; Guey, C.W.; Lee, Y.P.; Abidin, H. Early Detection of Basal Stem Rot Disease in Oil Palm Tree Using Unmanned Aerial Vehicle-Based Hyperspectral Imaging. Remote Sens. 2022, 14, 799. [Google Scholar] [CrossRef]
  83. Sanín, M.J.; Galeano, G. A Revision of the Andean Wax Palms, Ceroxylon (Arecaceae). In Phytotaxa; Magnolia Press: Aukland, New Zealand, 2011; Volume 34, ISBN 9781869778194. [Google Scholar]
  84. Martínez, B.; López Camacho, R.; Castillo, L.S.; Bernal, R. Phenology of the Endangered Palm Ceroxylon quindiuense (Arecaceae) along an Altitudinal Gradient in Colombia. Rev. Biol. Trop. 2021, 69, 649–664. [Google Scholar] [CrossRef]
  85. Yandouzi, M.; Berrahal, M.; Grari, M.; Boukabous, M.; Moussaoui, O.; Azizi, M.; Ghoumid, K.; Elmiad, A.K. Semantic Segmentation and Thermal Imaging for Forest Fires Detection and Monitoring by Drones. Bull. Electr. Eng. Inform. 2024, 13, 2784–2796. [Google Scholar] [CrossRef]
  86. Sanín, M.J.; Kissling, W.D.; Bacon, C.D.; Borchsenius, F.; Galeano, G.; Svenning, J.C.; Olivera, J.; Ramírez, R.; Trénel, P.; Pintaud, J.C. The Neogene Rise of the Tropical Andes Facilitated Diversification of Wax Palms (Ceroxylon: Arecaceae) through Geographical Colonization and Climatic Niche Separation. Bot. J. Linn. Soc. 2016, 182, 303–317. [Google Scholar] [CrossRef]
  87. Chacón-Vargas, K.; García-Merchán, V.H.; Sanín, M.J. From Keystone Species to Conservation: Conservation Genetics of Wax Palm Ceroxylon quindiuense in the Largest Wild Populations of Colombia and Selected Neighboring Ex Situ Plant Collections. Biodivers. Conserv. 2019, 29, 283–302. [Google Scholar] [CrossRef]
  88. Moreira, S.L.S.; dos Santos, R.A.F.; Paes, É.d.C.; Bahia, M.L.; Cerqueira, A.E.S.; Parreira, D.S.; Imbuzeiro, H.M.A.; Fernandes, R.B.A. Carbon Accumulation in the Soil and Biomass of Macauba Palm Commercial Plantations. Biomass Bioenergy 2024, 190, 107384. [Google Scholar] [CrossRef]
  89. Li, G.; Li, C.; Jia, G.; Han, Z.; Huang, Y.; Hu, W. Estimating the Vertical Distribution of Biomass in Subtropical Tree Species Using an Integrated Random Forest and Least Squares Machine Learning Mode. Forests 2024, 15, 992. [Google Scholar] [CrossRef]
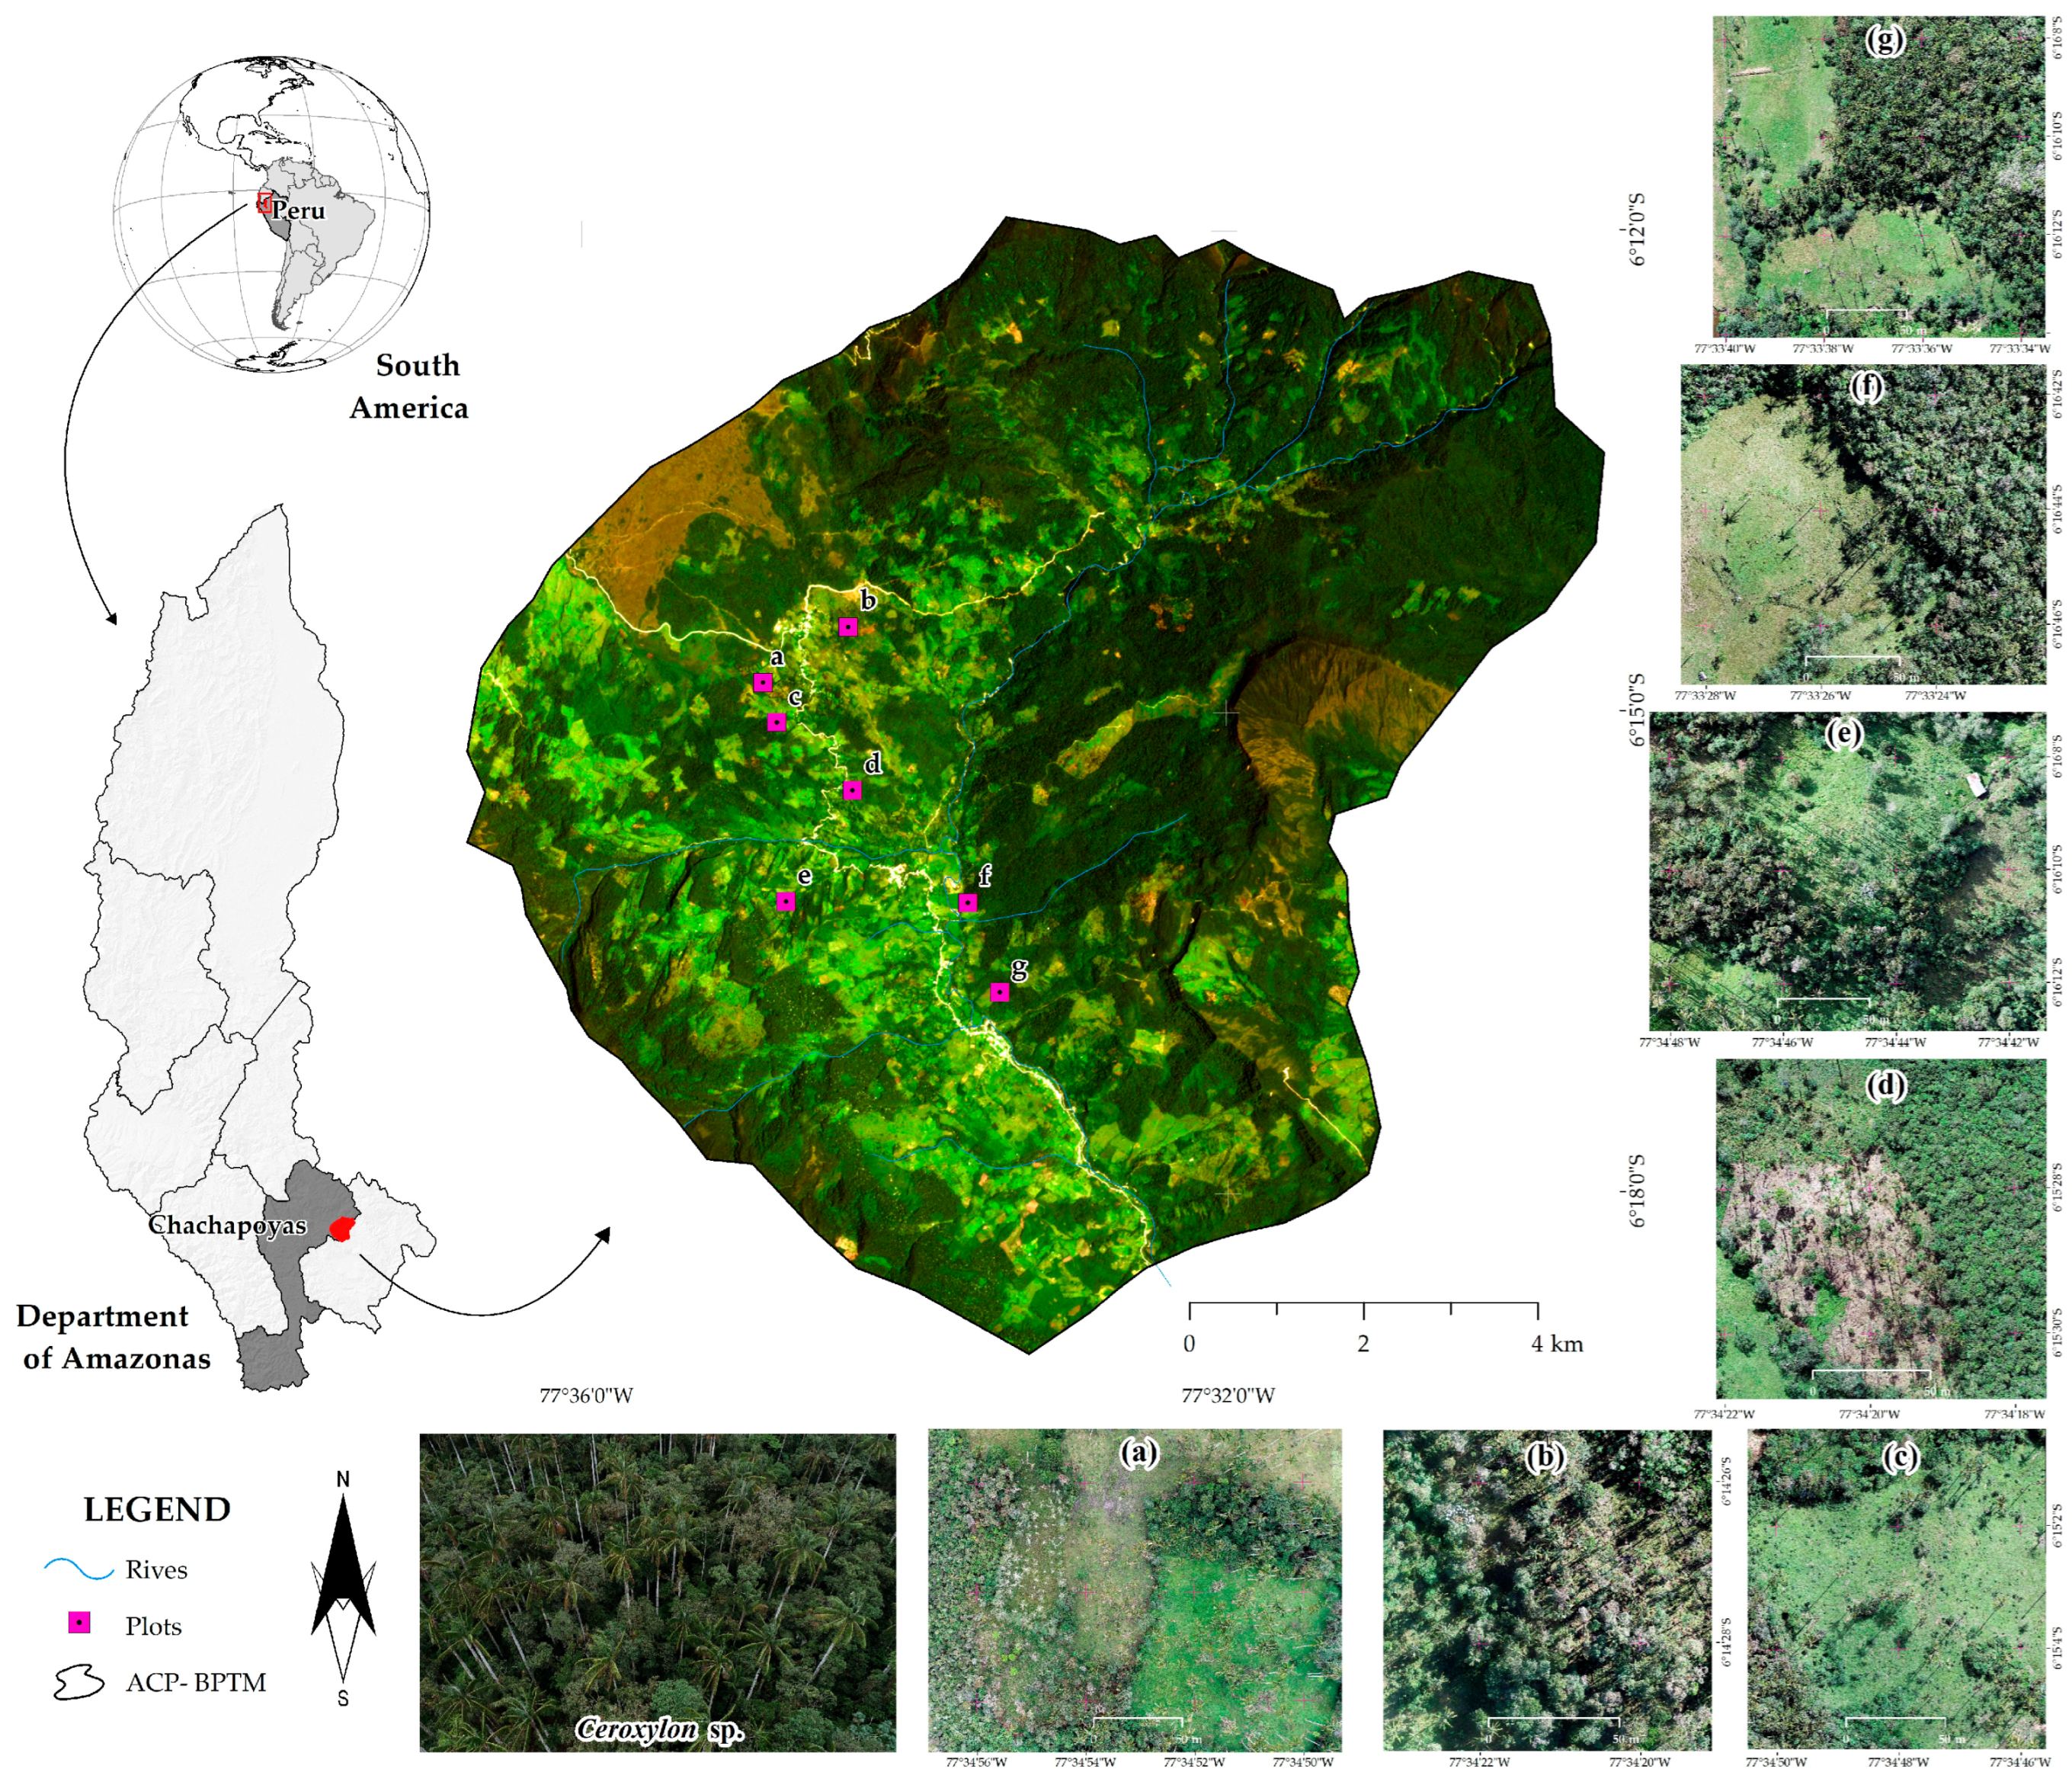
Figure 1. (ag) Location of the study plots and the ACP-Bosque de Palmeras de la Comunidad Campesina Taulia Molinopampa (ACP-BPTM) in the Amazonas region, Peru.
Forests 16 01061 g001
Figure 2. Comparison of orthomosaic reconstruction in different qualities.
Forests 16 01061 g002
Figure 3. Final orthomosaics of the seven study plots (ag) of Ceroxylon palms.
Forests 16 01061 g003
Figure 4. Distribution of F1, mAP50, and mAP50-95 by model.
Forests 16 01061 g004
Figure 5. Distribution of F1, mAP50, and mAP50-95 by plots “a” to “g”.
Forests 16 01061 g005
Figure 6. Errors in automatic detection in the lowest yielding plots “b” and “f”.
Forests 16 01061 g006
Figure 7. Precision features of the YOLOv8 m model.
Forests 16 01061 g007
Figure 8. Training and validation metrics.
Forests 16 01061 g008
Table 1. Description of the seven plots of palms of the genus Ceroxylon.
PlotArea
(ha)
CharacteristicsGeographic Coordinates WGS84
Longitude (W)Latitude (S)
a4.39Pastures77°34′52.857″6°14′47.948″
b1.54Wooded77°34′20.977″6°14′27.352″
c2.45Pastures77°34′47.814″6°15′2.952″
d2.01Pastures77°34′19.681″6°15′28.578″
e3.76Wooded77°34′44.634″6°16′10.013″
f3.34Wooded77°33′25.055″6°16′44.255″
g4.16Wooded77°33′36.697″6°16′10.842″
Table 2. Parameters of the creation of orthomosaics in Agisoft Metashape.
Photo OrientationAccuracyHigh
Reference preselectionOrigin
Key points per photo40,000
Passing points per photo4500
Model creationData origin (Mesh)Depth maps
QualityMedium
InterpolationEnabled (Default)
Depth filteringModerate
Orthomosaic creationSurfaceMesh
Mixing ModeMosaic (Default)
Table 3. Test results of orthomosaic clipping sizes.
Model/SizeTraining Time (Hours/Minutes/Seconds)Best EpochmAP50
YOLO v8-s6400 h 37 m 19 s860.881
9600 h 30 m 7 s280.917
12801 h 56 m 56 s350.928
16005 h 50 m 49 s320.929
Table 4. Training time and validation of YOLOv8, YOLOv10, and YOLOv11 models.
ModelTraining Time (Hours/Minutes/Seconds)Validation
PRF1 ScoremAP50 mAP50-95
Yolo v8n0 h 18 m 33 s0.860.850.850.890.43
m0 h 32 m 37 s0.860.920.890.940.48
x3 h 55 m 34 s0.860.910.880.930.48
Yolo v10n0 h 36 m 4 s0.830.830.830.890.45
m1 h 18 m 10 s0.880.900.890.920.48
x35 h 18 m 19 s0.870.900.890.930.50
Yolo v11n0 h 33 m 45 s0.880.870.870.910.47
m0 h 43 m 52 s0.870.910.890.930.49
x8 h 28 m 16 s0.890.900.890.930.48
Disclaimer/Publisher’s Note: The statements, opinions and data contained in all publications are solely those of the individual author(s) and contributor(s) and not of MDPI and/or the editor(s). MDPI and/or the editor(s) disclaim responsibility for any injury to people or property resulting from any ideas, methods, instructions or products referred to in the content.