Article

Is It Possible to Preserve the Full Diversity of Birds in Managed Oak–Lime–Hornbeam Forests?

by
Karolina Stąpór
1,
Małgorzata Bujoczek
1,* and
Leszek Bujoczek
2
1
Department of Forest Biodiversity, Faculty of Forestry, University of Agriculture in Krakow, Al. 29 Listopada 46, 31-425 Krakow, Poland
2
Department of Forest Resources Management, Faculty of Forestry, University of Agriculture in Krakow, Al. 29 Listopada 46, 31-425 Krakow, Poland
*
Author to whom correspondence should be addressed.
Forests 2025, 16(7), 1060; https://doi.org/10.3390/f16071060
Submission received: 27 April 2025 / Revised: 10 June 2025 / Accepted: 23 June 2025 / Published: 26 June 2025
(This article belongs to the Section Forest Ecology and Management)

Abstract

Oak–lime–hornbeam forests are among the most biodiverse temperate forests. This study compared older managed stands with a strictly protected old-growth forest in terms of their features. Managed forests at various stages of silvicultural operations were selected: a mature stand where regeneration cuts had not yet begun, as well as stands where such treatments were in the initial or advanced stages. Stand features that may affect the diversity and density of avifauna were analyzed on the basis of 151 sample plots. In four successive breeding seasons, birds in these stands were surveyed. The stands differed significantly in volume, the density of large trees, regeneration, the vertical structure, and the amount of deadwood. The number of bird species was the highest in the initial and advanced gap-cut stands. Group-selection cutting in those stands led to a succession of non-forest bird species and, hence, a greater number of birds building nests on or close to ground as compared to the old-growth forest. The old-growth forest was the most similar to the mature managed stand in terms of bird species composition (Jaccard index = 0.76). The old-growth forest was characterized by the highest bird density (91 pairs per 10 ha), with more than half of the breeding pairs being cavity nesters. In the managed forest, the bird density was from 63 to 72 pairs per 10 ha. Based on the present study, it can be concluded that effective conservation of bird assemblages is possible in managed forests, provided that certain concessions are made. Drawing on the characteristics of old-growth forests, several guidelines can be proposed for forest management. First and foremost, it is essential to maintain a mosaic forest structure. Secondly, it is necessary to retain an adequate number of large, old trees within the stand and to ensure a sufficient volume and diversity of deadwood. Additionally, it is absolutely critical to shift timber harvesting activities outside of the bird breeding season.

1. Introduction

Oak–lime–hornbeam forests are widespread natural habitats in Europe. They occur mainly between 45° N and 55° N [1], primarily in lowlands but also at higher altitudes [2]. They are among the most biodiverse temperate forests, as evidenced by the occurrence of primeval forest species [3], as well as a diverse dimensional distribution of trees, a multilayer structure, and a rich species composition [4,5]. They are characterized by a high diversity of plant species [6], and, in particular, geophytes such as thimbleweed Anemone nemorosa L., yellow star-of-Bethlehem Gagea lutea (L.) Ker Gawl., and hollow root Corydalis cava (L.) Schweigg. & Körte [7], as well as fungi [8], birds [9,10], and invertebrates [11,12,13]. Originally, oak–lime–hornbeam forests covered a much larger area than today. It is estimated that in Central Europe, they may have occurred on an area of about 240 thousand km2 [14]. Many of them were cut down, with the cleared areas transformed into arable fields or pastures [11]. Some of those lands have been afforested in recent years but, due to soil impoverishment after years of agricultural cultivation, mainly with pine Pinus sylvestris L. or other species with low trophic requirements [15,16]. Another factor that has a negative impact on oak–lime–hornbeam forests is climate change, including frequent droughts adversely affecting both groundcover plants [17] and mature trees. Stand regeneration after a drought takes a long time or may be entirely impossible [18].
Being good bioindicators, birds can reveal many changes that occur in their environment. Both individual species, especially those highly specialized or with specific habitat requirements, and entire bird assemblages have been studied to determine the condition of ecosystems (e.g., [19,20,21,22]). Numerous studies have addressed bird assemblages inhabiting forests (e.g., [23]), including oak–lime–hornbeam stands (e.g., [10,24]). Research indicates that older stands play an important role for many species and, in particular, cavity nesters [25]. In managed forests, the occurrence of very large trees is prevented by rotation age, which is often about 100 years or slightly more [26]. Different management methods are used depending on the current and target species composition of the stand. In deciduous forests, the prevailing cutting systems used are shelterwood cutting, group cutting, and stepwise cutting [26]. Although complex cutting systems extend the time that a mature stand remains in a given area by approx. a decade to several decades, many bird species, and especially those associated with tree cavities, occur more frequently in old-growth forests (e.g., [27,28,29]).
The main aim of this study was to examine the diversity of the avifauna inhabiting oak–lime–hornbeam forests. A strictly protected old-growth forest was compared with managed forests that were highly similar to it in terms of their age and generational changes. A very detailed description was made of all forest elements that could affect the number and composition of bird species. The main objective of the study was to answer the following questions: (1) What forest features distinguish old-growth forests from mature managed forests? (2) What proportions of bird species occupy different breeding niches and have different food preferences? (3) Does the composition and density of avifauna change with generational changes in the tree layer in managed forests? (4) How do the number and composition of bird species change in subsequent breeding seasons in stands with different features? (5) What changes can be introduced in managed forests to increase the availability of ecological niches for birds?

2. Materials and Methods

2.1. Study Area

The study was conducted in four oak–lime–hornbeam Tilio-Carpinetum forests in Poland, Central Europe (Figure 1). The selected forests belong to the Special Bird Protection Area Puszcza Niepołomicka no. PLB120002, which was established due to the presence of the Collared Flycatcher Ficedula albicollis Temminck, the Ural Owl Strix uralensis Pallas, the Black Woodpecker Dryocopus martius L., and the Middle Spotted Woodpecker Dendrocoptes medius L. The stands are also part of two Special Habitat Protection Areas, PLH120008 and PLH120010 [30]. The studied area is not diverse in terms of topography, with the highest hills being just over 200 m a.s.l. [30]. The average annual rainfall is 820 mm, and the average annual temperature is 9.8 °C [31]. The four selected stands included in the study differed in terms of forest management and the advancement of regeneration cuts; they were an old-growth forest, the Lipówka Nature Reserve (area = 24.95 ha, strictly protected; no treatments had been carried out since at least the 1950s); a mature stand (area = 32.04 ha, a mature managed forest in which regeneration cuttings have not yet begun); initial gap-cut stand (area = 35.56 ha, a mature stand harvested with the shelterwood system, with the gaps covering about 20% of the area); and an advanced gap-cut stand (area = 25.47 ha, a mature stand harvested with the shelterwood systems, with regeneration gaps covering about 40% of the area, half of which was younger regeneration and the other half older). In all four forests the main tree stand was dominated by the oaks Quercus sp., hornbeams Carpinus betulus L., lime trees Tilia cordata Mill., and alders Alnus glutinosa (L.) Gaertn. [31]. The studied forest stands were not adjacent to one another, with the distances between their nearest corners ranging from 250 to 1000 m. However, each stand bordered managed forests with a species composition very similar to that of the studied sites, dominated primarily by oak and less frequently by lime, alder, or hornbeam. Nonetheless, all adjacent stands contained these species in varying proportions. The age of the dominant tree species in the surrounding stands was as follows: in the old-growth forest (Lipówka Nature Reserve), 49–189 years; in the stands surrounding the mature stand, 49–179 years; those surrounding the initial gap-cut stand, 20–159 years; and those surrounding the advanced gap-cut stand, 34–124 years. Within each stand, the tree age structure was heterogeneous.

2.2. Stand Measurements and Bird Counts

The selected stand measures were selected to reflect the forest features that are most relevant for breeding birds. The study involved the basic characteristics describing tree and regeneration layers as well as the presence of deadwood. The tree thickness distribution and the vertical structure of stands were characterized. A grid of sample areas was charted on the map of each stand. Sample areas of 0.04 ha were established at the nodes of an 80 × 80 m grid. In total, measurements were made for 151 sample plots. On each sample plot, the diameter at breast height (DBH) of living trees and their height were measured (when DBH ≥ 7 cm). The total canopy cover was estimated visually. Visual estimation of the canopy cover is a widely used method and provides reliable results when performed with appropriate experience [32,33,34]. Additionally, canopy space filling was evaluated for different heights: for the upper part of the stand (at approx. 30 m), at approx. 2/3 of stand height (20 m), and 1/3 of stand height (10 m). Using a hypsometer, we measured the height above ground and, in an analogous way to the canopy cover assessment, estimated the space filling at that height. The percentage of space filled by the seedling layer (height < 0.5 m) and sapling layer (height from 0.5 m to DBH < 7 cm) was also determined. The assessment was performed visually, based on methodologies commonly used in phytosociological studies [35,36]. Lying deadwood with a diameter of at least 7 cm and standing deadwood with a DBH ≥ 7 cm were measured. In the case of lying deadwood and snags (standing snapped trees), diameters were measured at both ends. In the case of entire standing dead trees, the DBH was measured.
Bird counts were conducted in four (cavity nester species, 2020–2023) or three (all species, 2021–2023) consecutive breeding seasons, from March to June. In the advanced gap-cut stand, birds were counted only in the 2022 and 2023 seasons. Field inventories were performed in the morning at least three times per season for each stand. The inventories were conducted in accordance with the cartographic method [37]. Each of the selected stands was thoroughly explored, and all birds seen and heard were recorded. If they were seen, nests and tree hollows were also recorded. Each observation was recorded on maps, and then, based on subsequent field controls and repeated observations, the number of breeding territories was determined.

2.3. Data Analysis

The volume of trees was estimated with the use of tariff tables. Tariff tables are species-specific volume functions developed for tree species occurring in this geographical region. They provide estimates of tree volume based on two input variables: the DBH and tree height [38]. The volume of stumps, lying deadwood, and snags was calculated according to Smalian’s formula. The mean values of stand features and basic statistics were calculated to characterize variability among the four studied stands and also to determine statistical differences between them. The basic statistical unit was a sample plot. The tree diameter was estimated on the basis of DBH classes with the ranges being 7–14.9 cm, 15–24.9 cm, 25–34.9 cm … 95–104.9 cm, and ≥105 cm. Based on the relative abundances of these classes, the Shannon index was calculated using a binary logarithm. Additionally, the Gini index (GI) was calculated to describe the thickness diversity of the stand. The GI takes values in the range of 0–1, with low values indicating that trees are characterized by a thickness close to average (low variability of the studied feature), while larger GI values indicate greater variability of the analyzed feature. Analysis of variance and the Kruskal–Wallis test were used to determine the significance of differences. Statistical analyses were conducted using STATISTICA 13 software.
The number of pairs was counted for each bird species. The population density was expressed as the number of pairs per 10 ha. Similarity and diversity indices were calculated for each bird assemblage in each of the four stands. Species diversity was described using the Shannon diversity index H, which takes into account the number of species and their relative abundance in the bird assemblage in a given area (the formula uses a binary logarithm) [39]. The Shannon index increases with the number of species and with a more equal shares of species. The Jaccard index (IJ) was used as an indicator of similarity of bird assemblages between the studied stands [40].
Bird assemblages in all the stands were characterized in terms of their ecological requirements. To assess what nesting niches were occupied/available in the stands, bird species were classified into cavity, canopy, and forest floor nesters (nesting on or near the ground) based on breeding ecology [41], and the relative proportions of these groups in the overall bird assemblage were determined. Birds were also divided into four groups according to their food preferences—carnivores, omnivores, insectivores, and finches—and their proportions in the stands were evaluated. The Shannon and Jaccard indices were calculated separately for each group.
The statistical analysis of bird assemblages used the study stands as comparison sites. Bird species were compared in each site using a statistical sign test to determine in which site a given species has higher densities. The sign test is a non-parametric method for consistent differences between pairs of observations. In this study, bird species served as the statistical units. For each species, its density (expressed as breeding pairs per 10 ha) was estimated in the compared stands. Species with equal densities in both stands were excluded from the analysis. The test evaluates whether the number of species with higher densities in one stand significantly differs from what would be expected by chance under the null hypothesis of no difference between stands. This allowed us to assess whether the observed differences in bird densities reflect a consistent shift potentially caused by differences in the availability of nesting niches between the stands. These tests were performed separately for each ecological group—cavity nesters, canopy nesters, and forest floor nesters—and for the whole bird assemblage (all bird species), with a significance level set at α = 0.05. The statistical test was based on mean values for individual bird species, calculated as arithmetic means derived from data collected over all years of the inventory. Z-statistics and p-values were provided. Statistical analyses were conducted using STATISTICA 13 software.

3. Results

3.1. Stand Characteristics

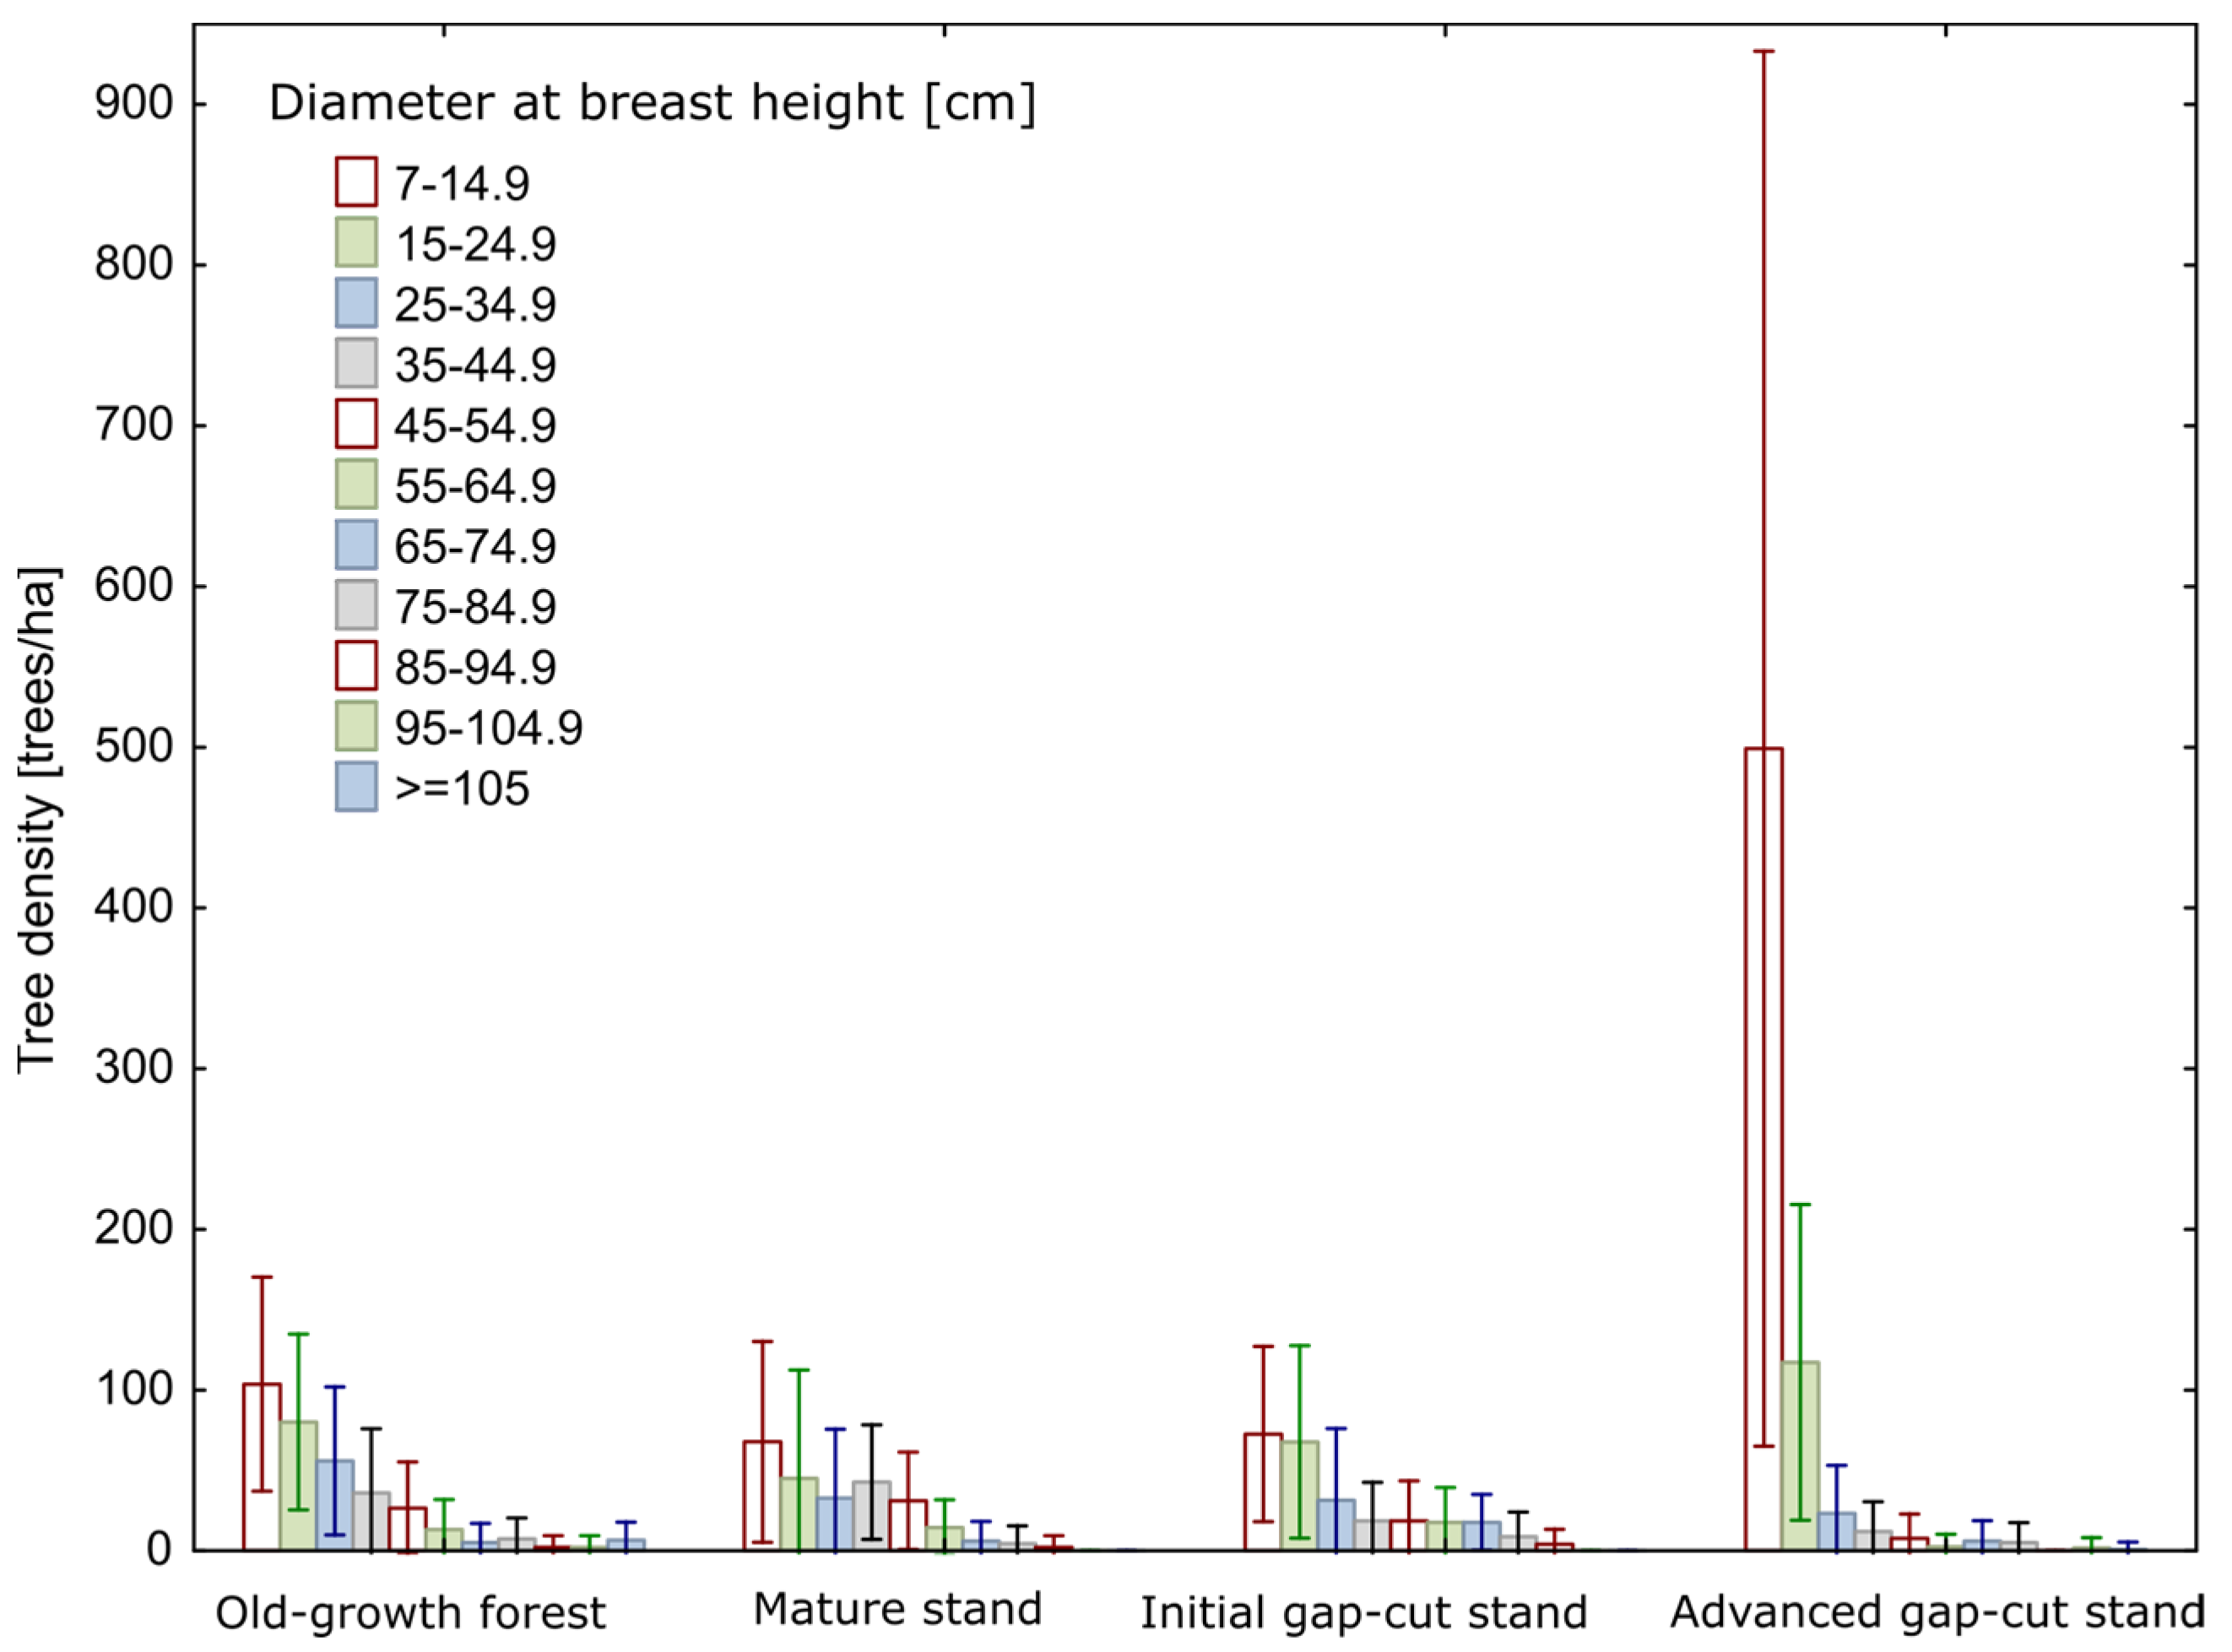
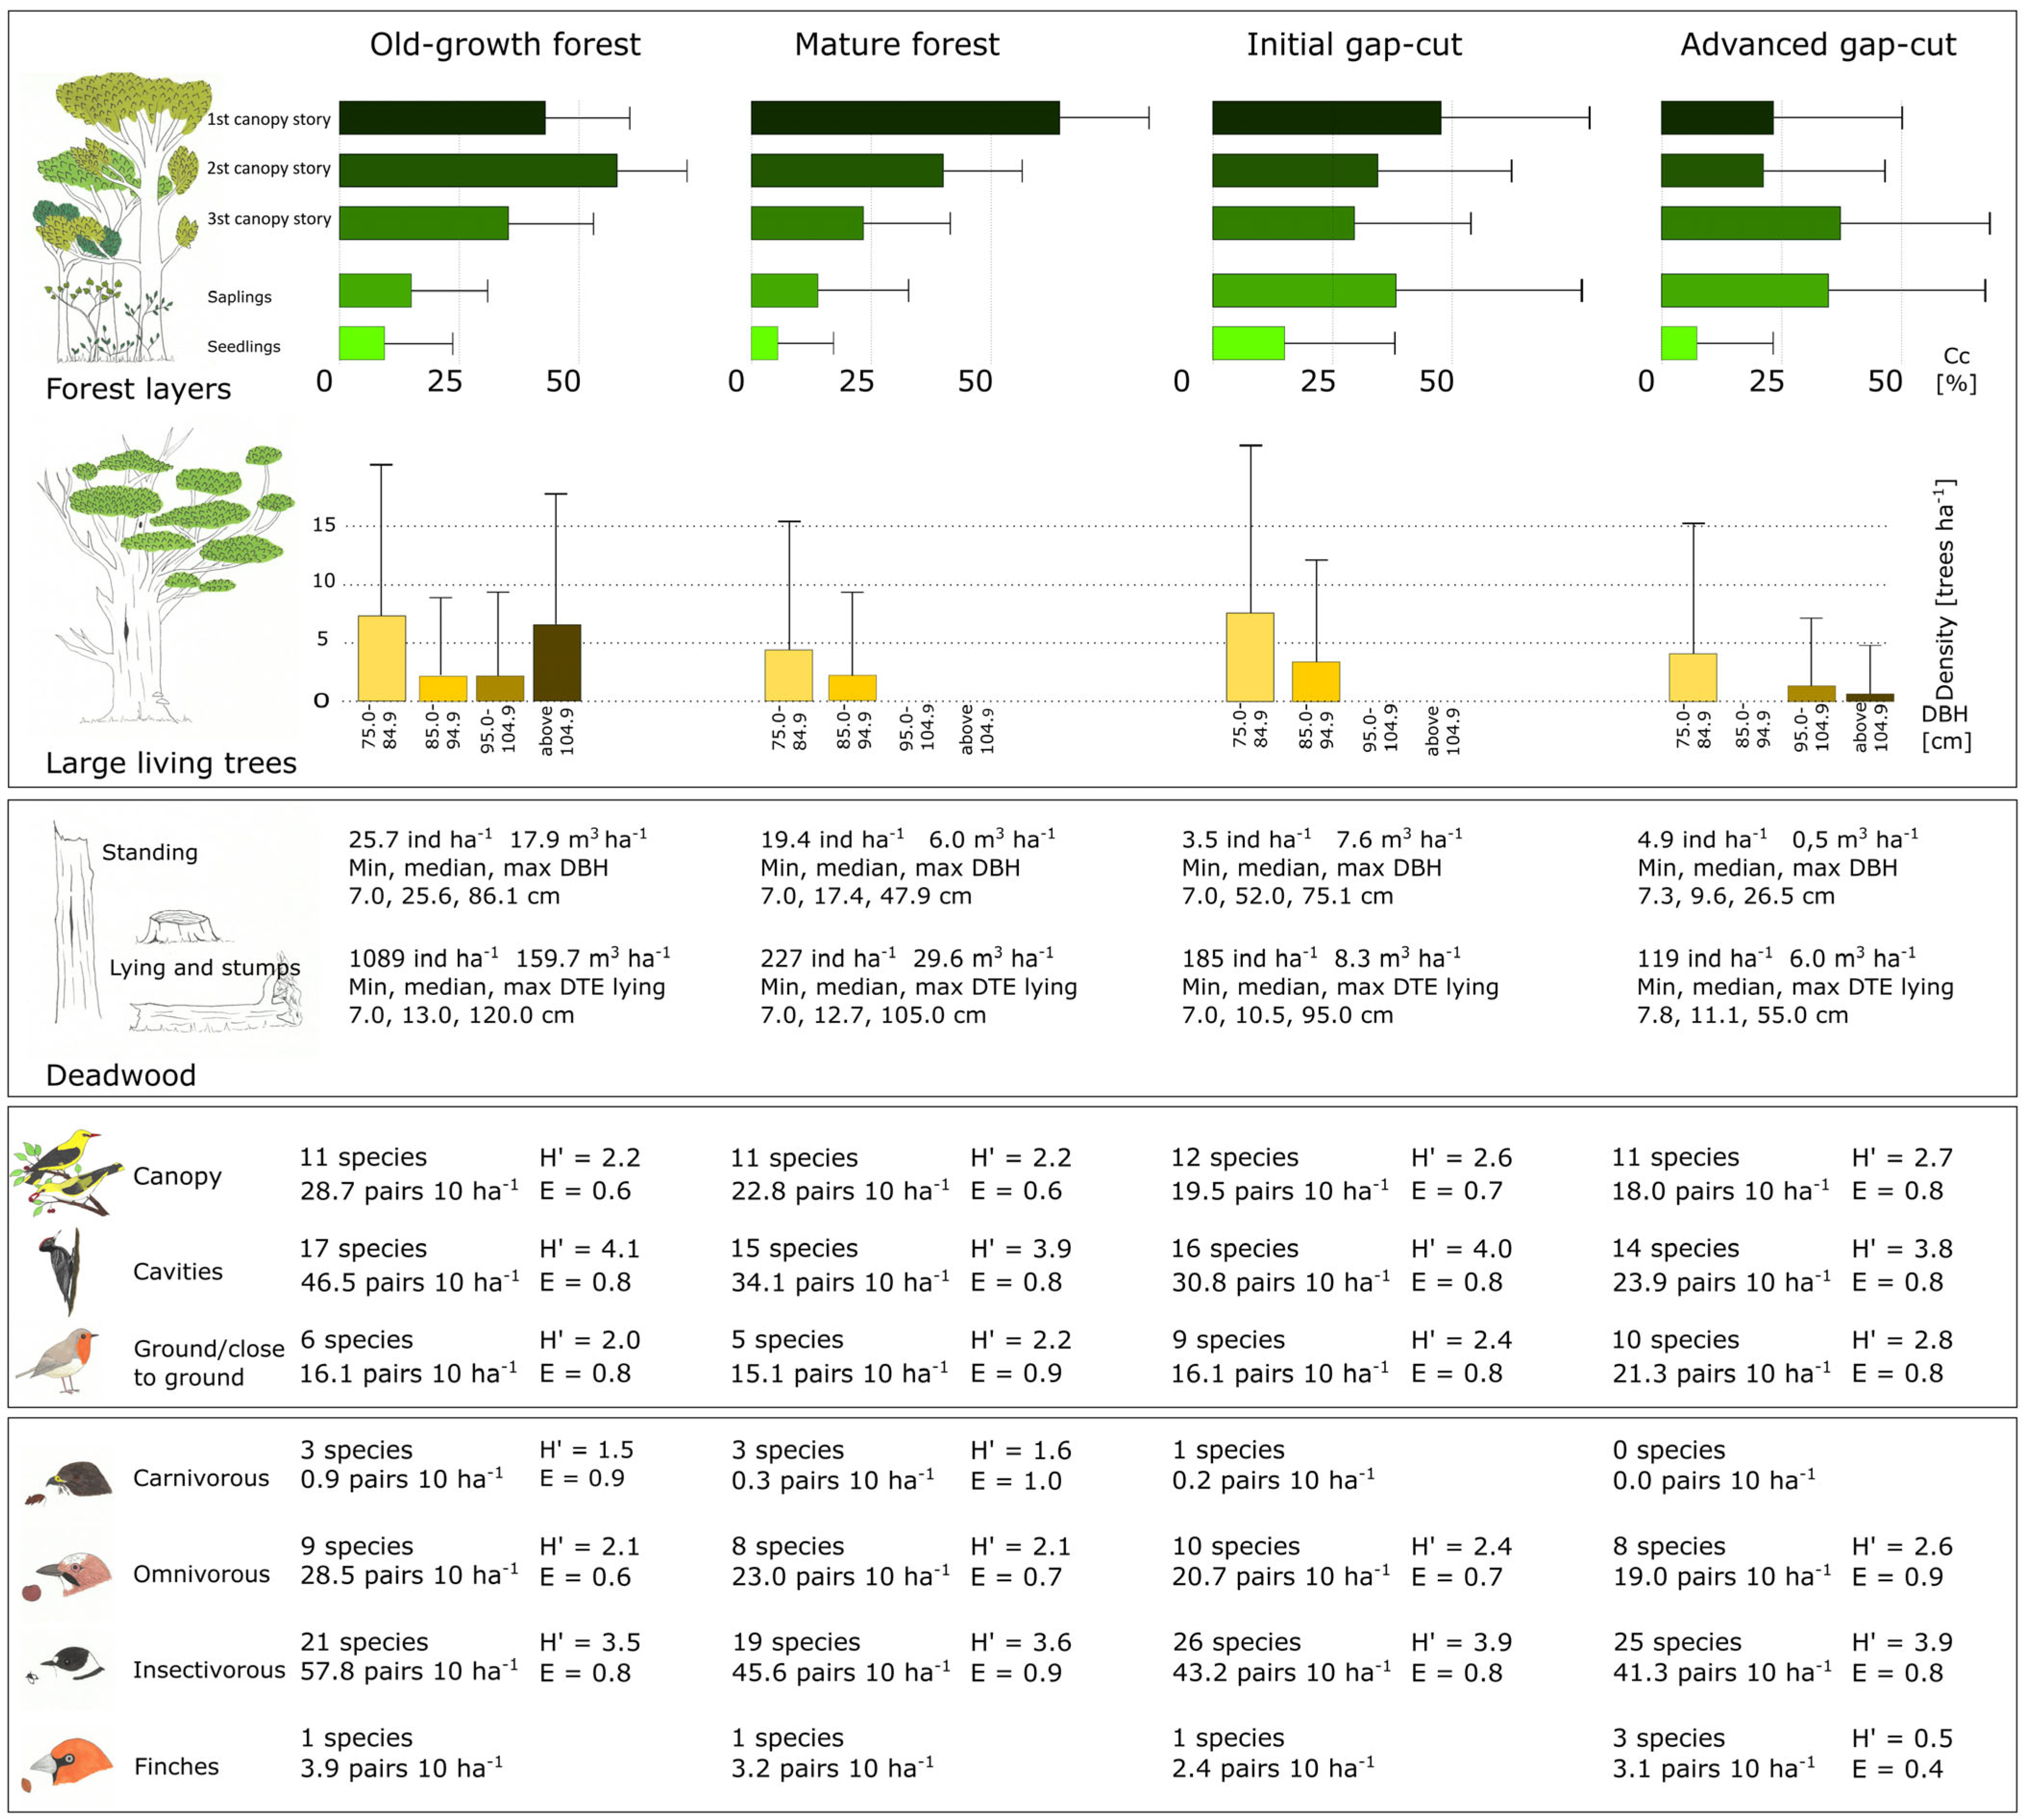
The old-growth forest differed in many respects from the managed stands. However, due to the large variability across sample plots, statistical differences were not always significant (Table 1). The stand volume for the old-growth forest was 482 m3 ha−1 (Figure 2), while silvicultural treatments reduced the volume of the managed stands to 169–341 m3 ha−1. An important component differentiating the forests was the density of large trees (Figure 3; Appendix A, Figure A1), with the differences increasing with the DBH. In the managed stands, there were more trees up to a DBH of approx. 65 cm. As a result of the adopted rotation age and regeneration cuts that had been ongoing for several decades, in the advanced gap-cut stand, there are only approx. 1–2 thick (DBH ≥ 85 cm) trees ha−1. In the old-growth forest, there were 11 trees with a DBH above 85 cm, of which 7 had a DBH above 105 cm (max. 124 cm).
Another feature that strongly differentiated the stands was the quantity and quality of deadwood, which decreased with the progress of cutting from 178 m3 ha−1 in the reserve to 35 m3 ha−1 in the mature stand to 6 m3 ha−1 in the advanced gap-cut stand (Kruskal–Wallis H = 69.7; p < 0.001). The amount of lying deadwood was higher than that of standing deadwood. In the reserve, the latter accounted for only 10% of the total volume. The volume of standing deadwood was higher in the mature stand (17% of the total), while in the initial gap-cut stand, it was almost the same as the volume of lying deadwood (48%).
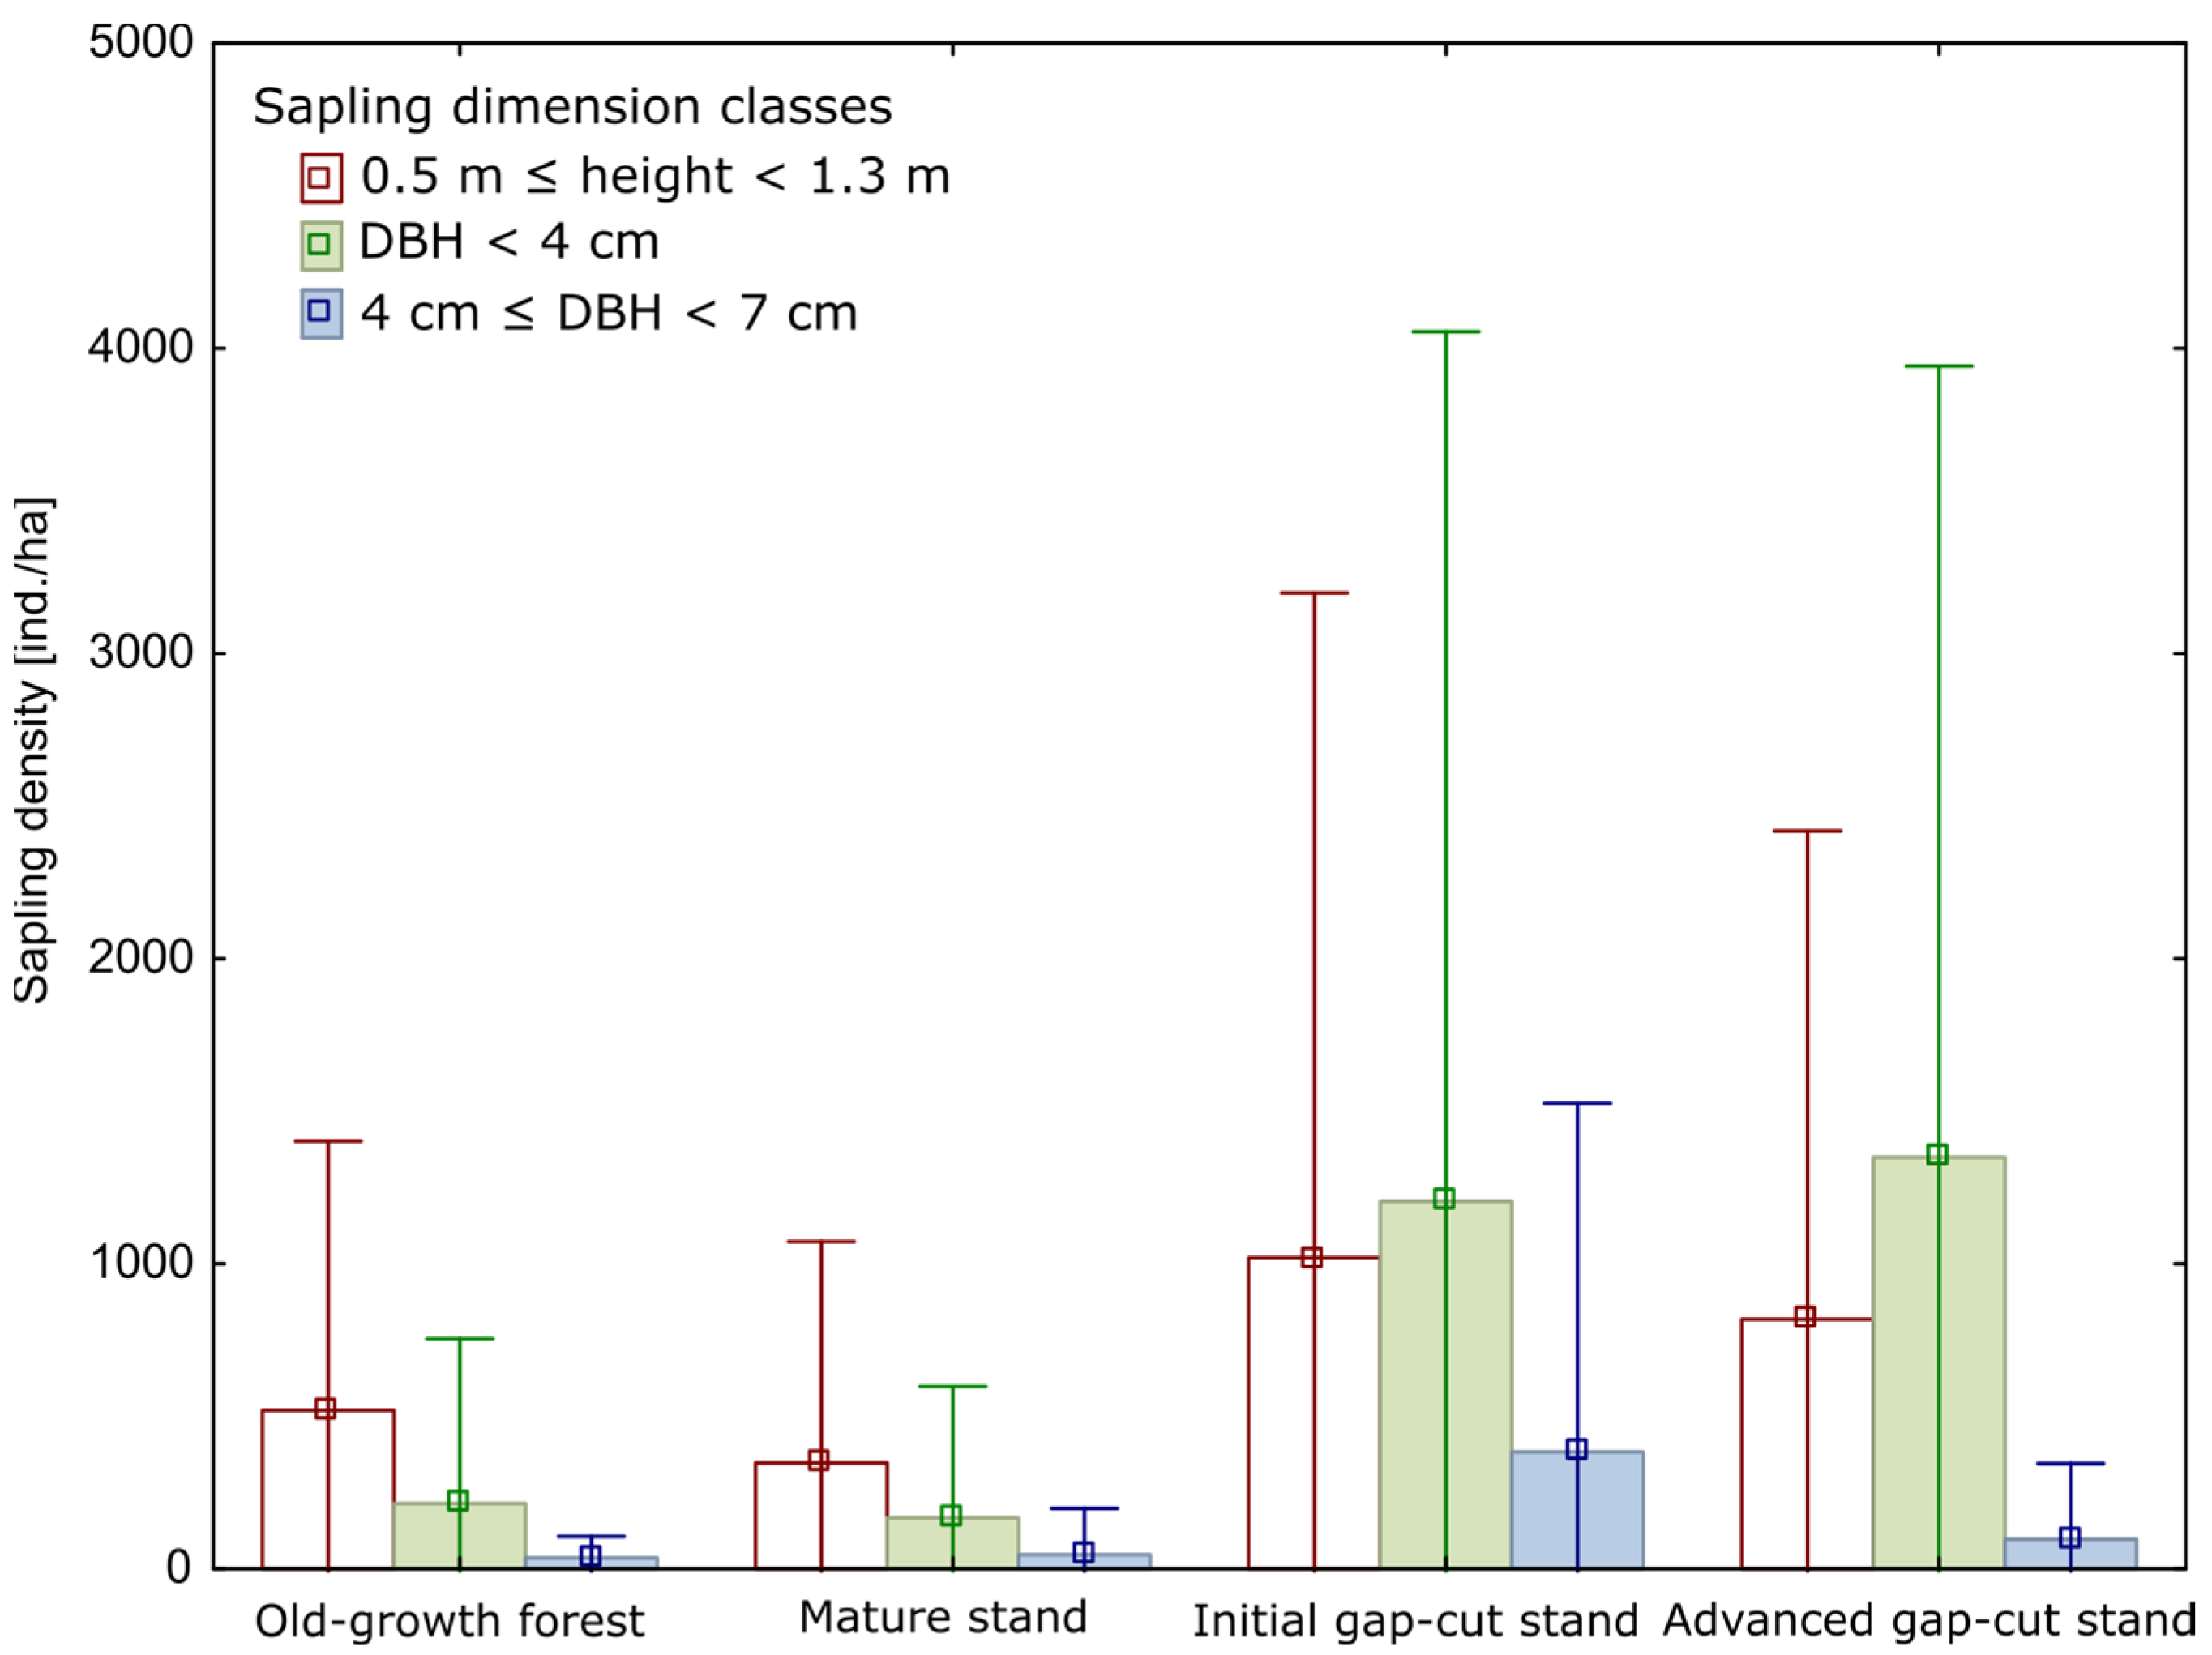
Sylvicultural treatments led to a mosaic of light conditions and changes in the vertical structure of stands. The mean total canopy cover was the highest in the reserve (78%) and in the mature stand 74%, while in both gap-cut stands, it was approx. 60% (Figure 3). However, there were also differences between individual forest layers (Figure 3). In the reserve, large, tall trees towered over others. Consequently, in that stand, space filling was greater at a lower height, i.e., at the level of the second story. In the mature forest, the upper canopy of tree crowns was more even and, therefore, denser. In the two remaining stands, the cuts caused the third story and the sapling layer to be more densely filled (Figure 3). The sapling layer was diverse in terms of dimensions. In the initial and advanced gap-cut stands, there were a lot of older saplings with a DBH of several centimeters (Appendix A, Figure A2).
The Shannon index calculated for the share of trees in individual thickness classes was the lowest in the advanced gap-cut stand (1.3), where trees up to a DBH of 24.9 cm constituted 91% of the total. In the remaining stands, thickness classes were distributed more evenly, with an index value of approx. 2.7. The Gini index was less diverse and ranged from 0.54 in the mature forest to 0.65 in the old-growth forest (Figure 3).

3.2. Characteristics of Birds Assemblages

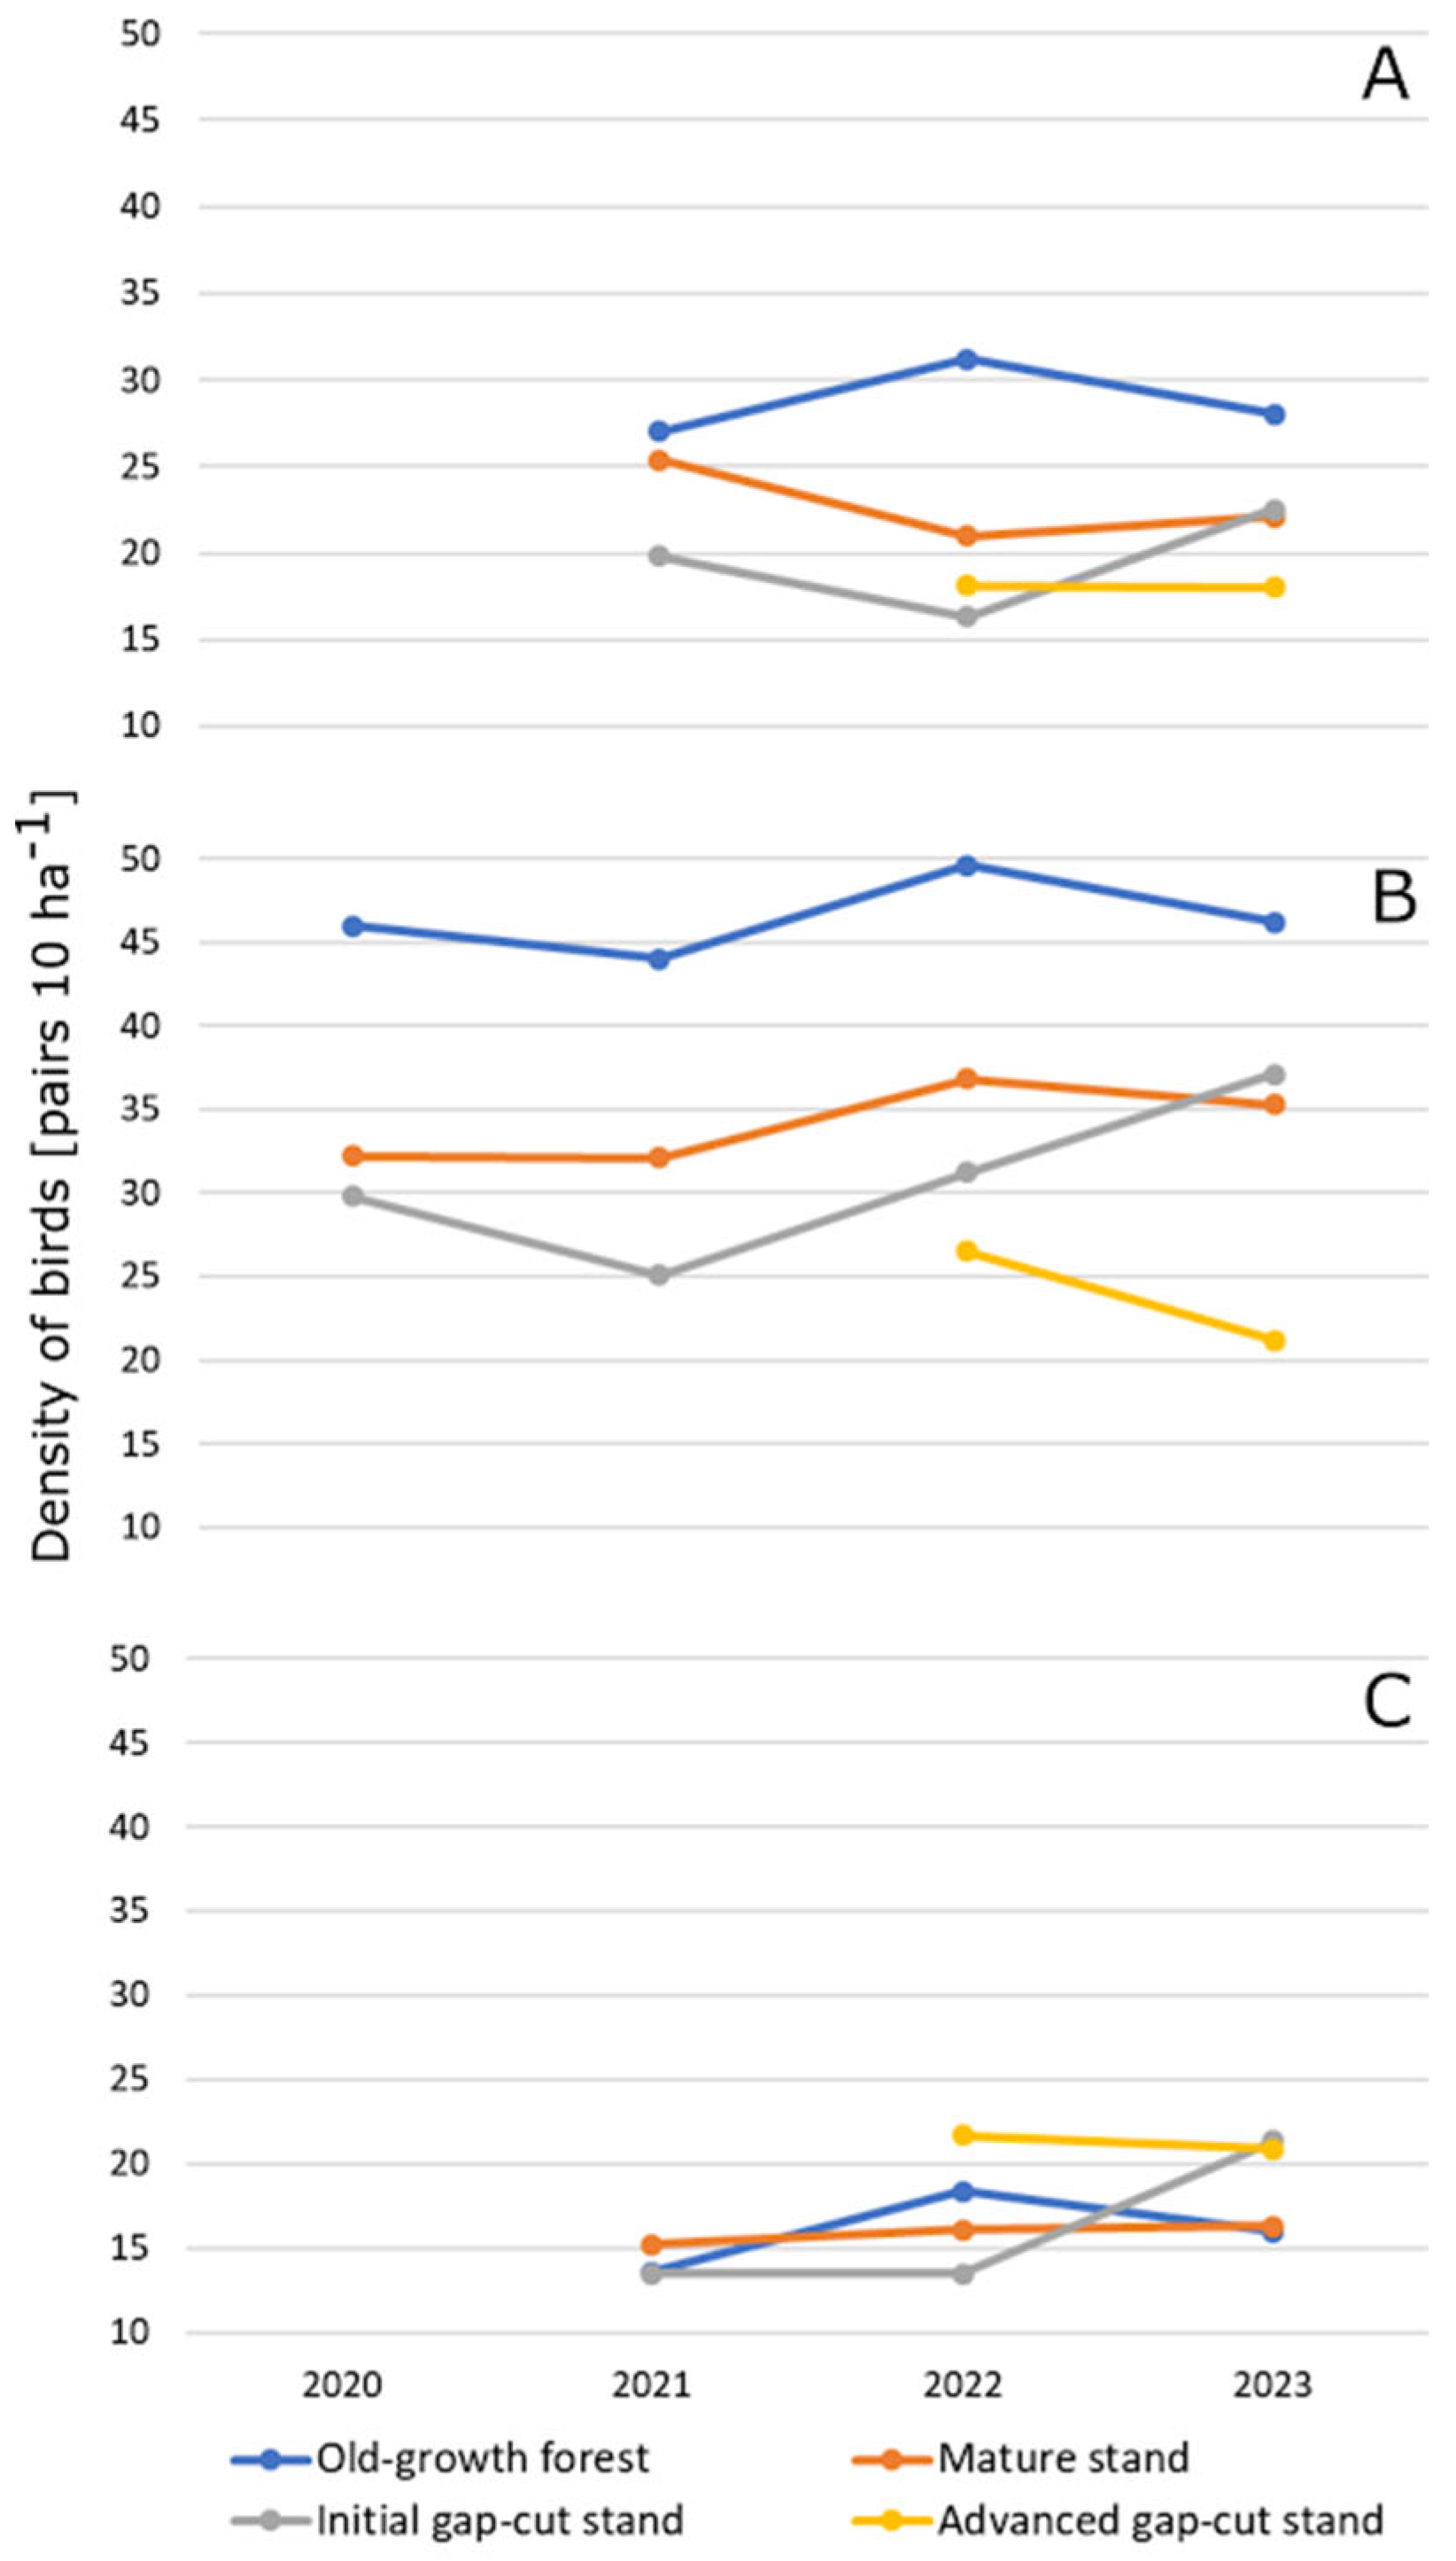
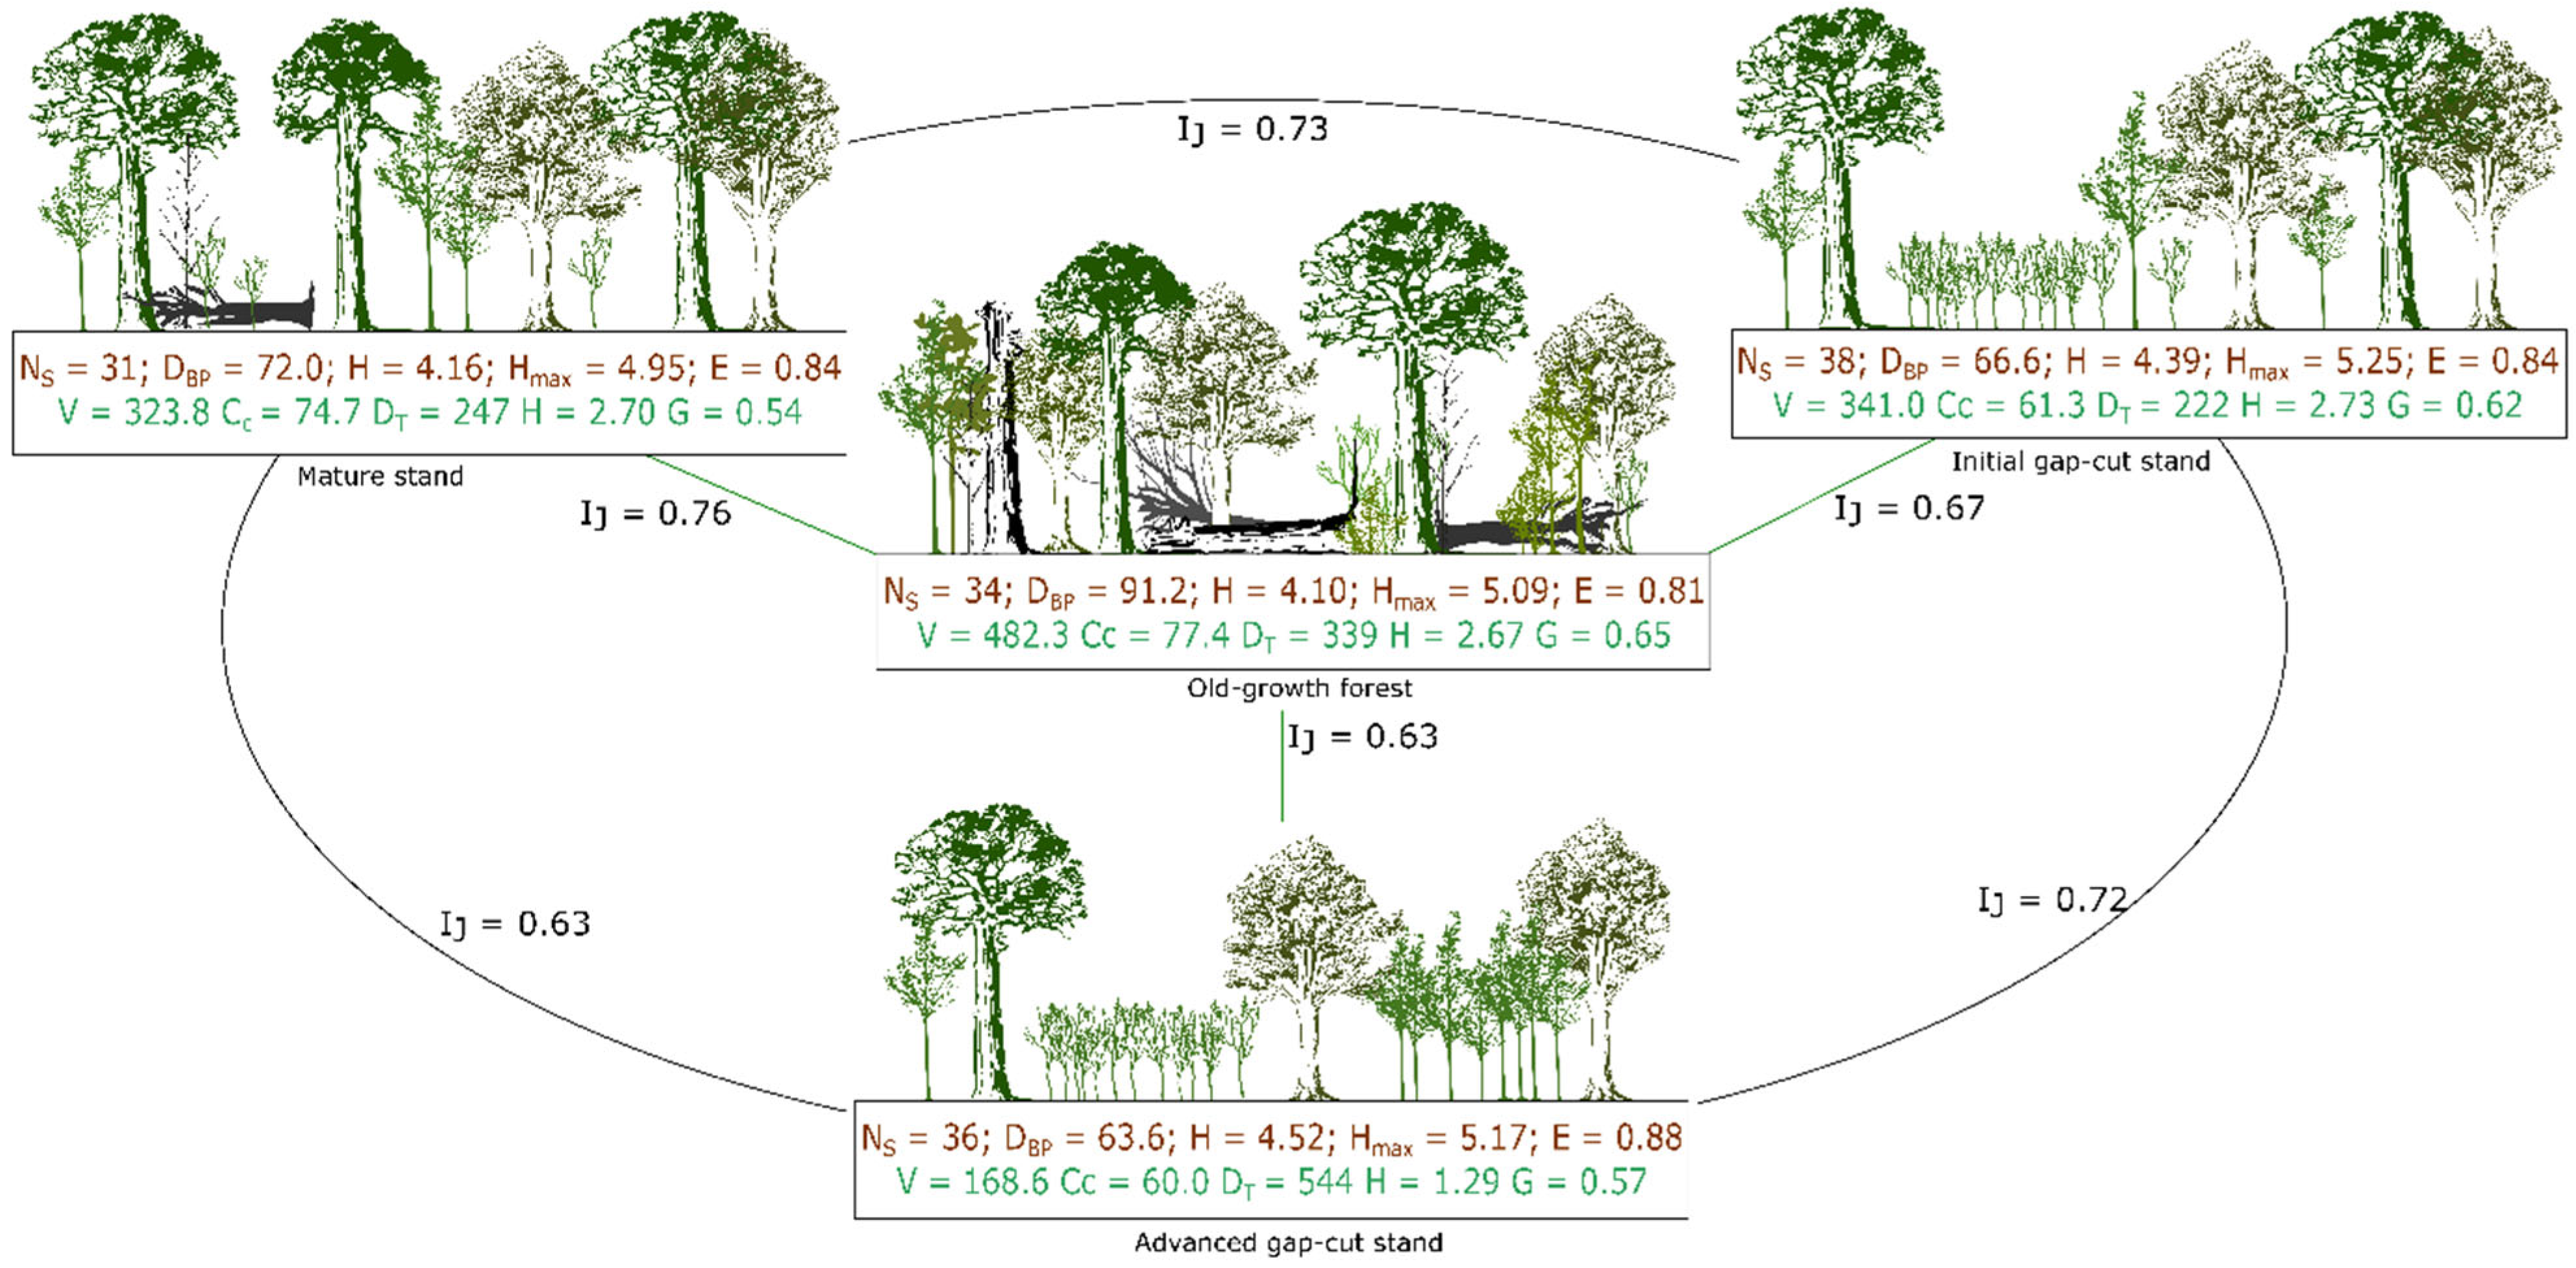
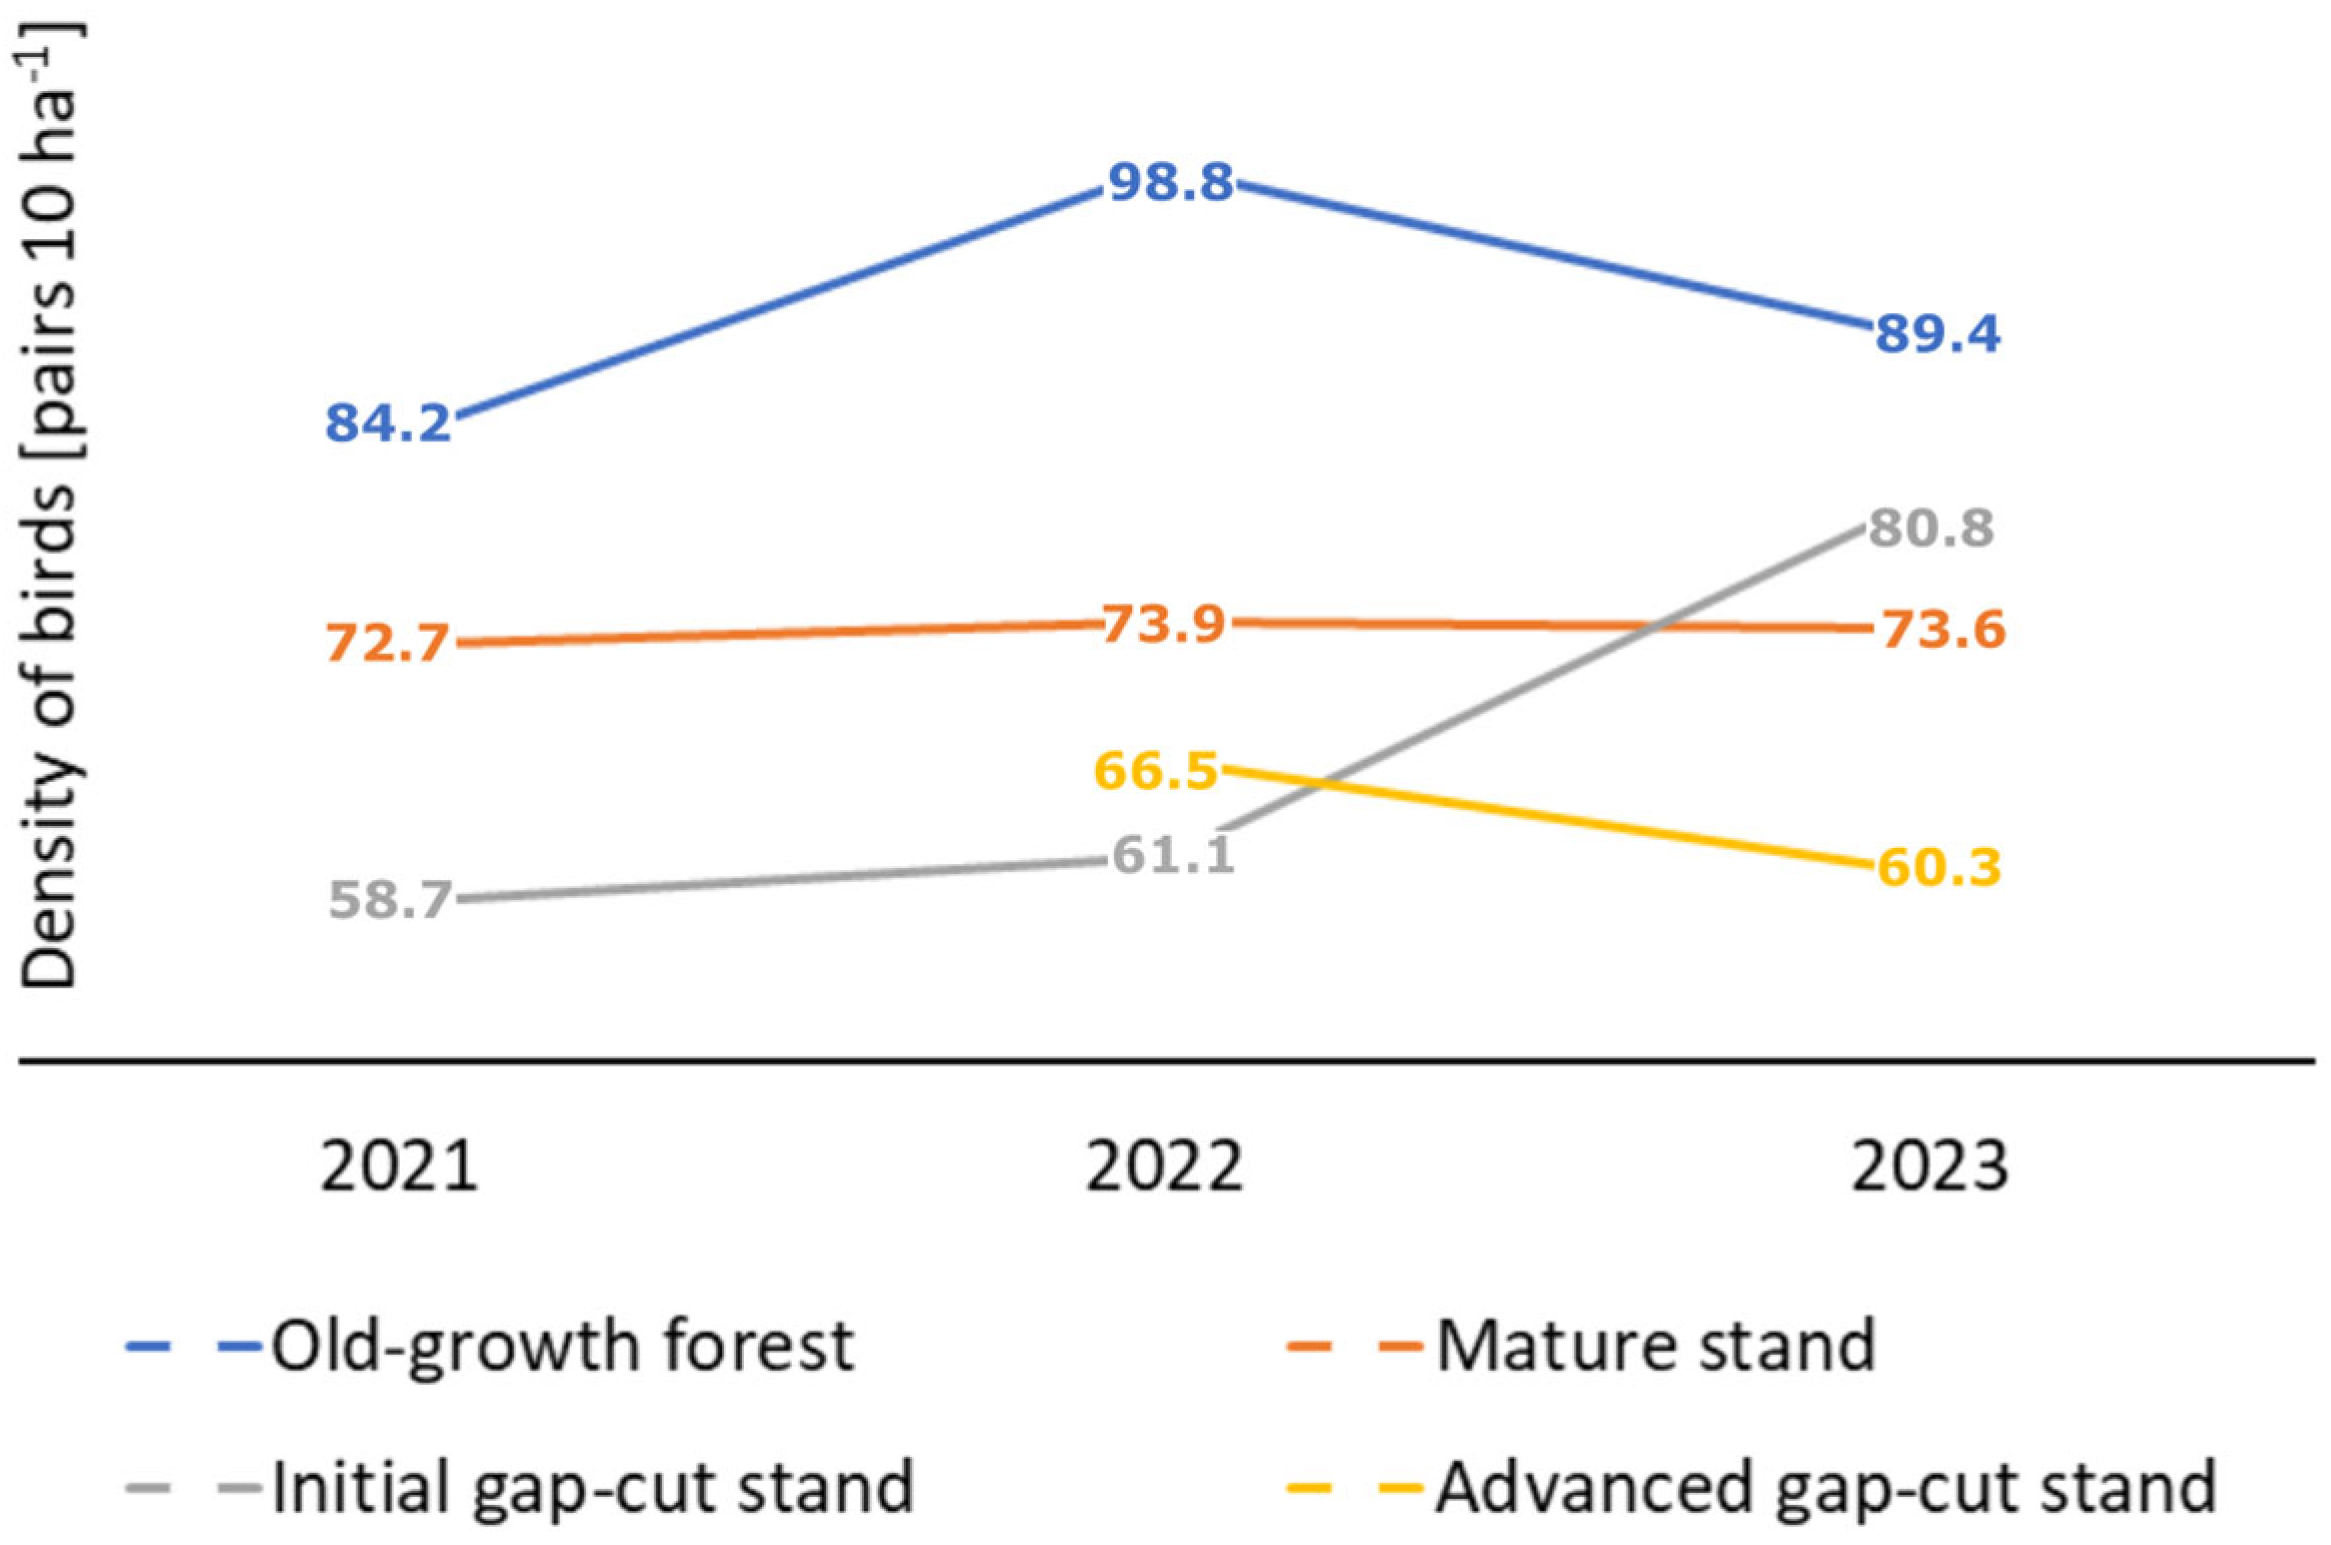
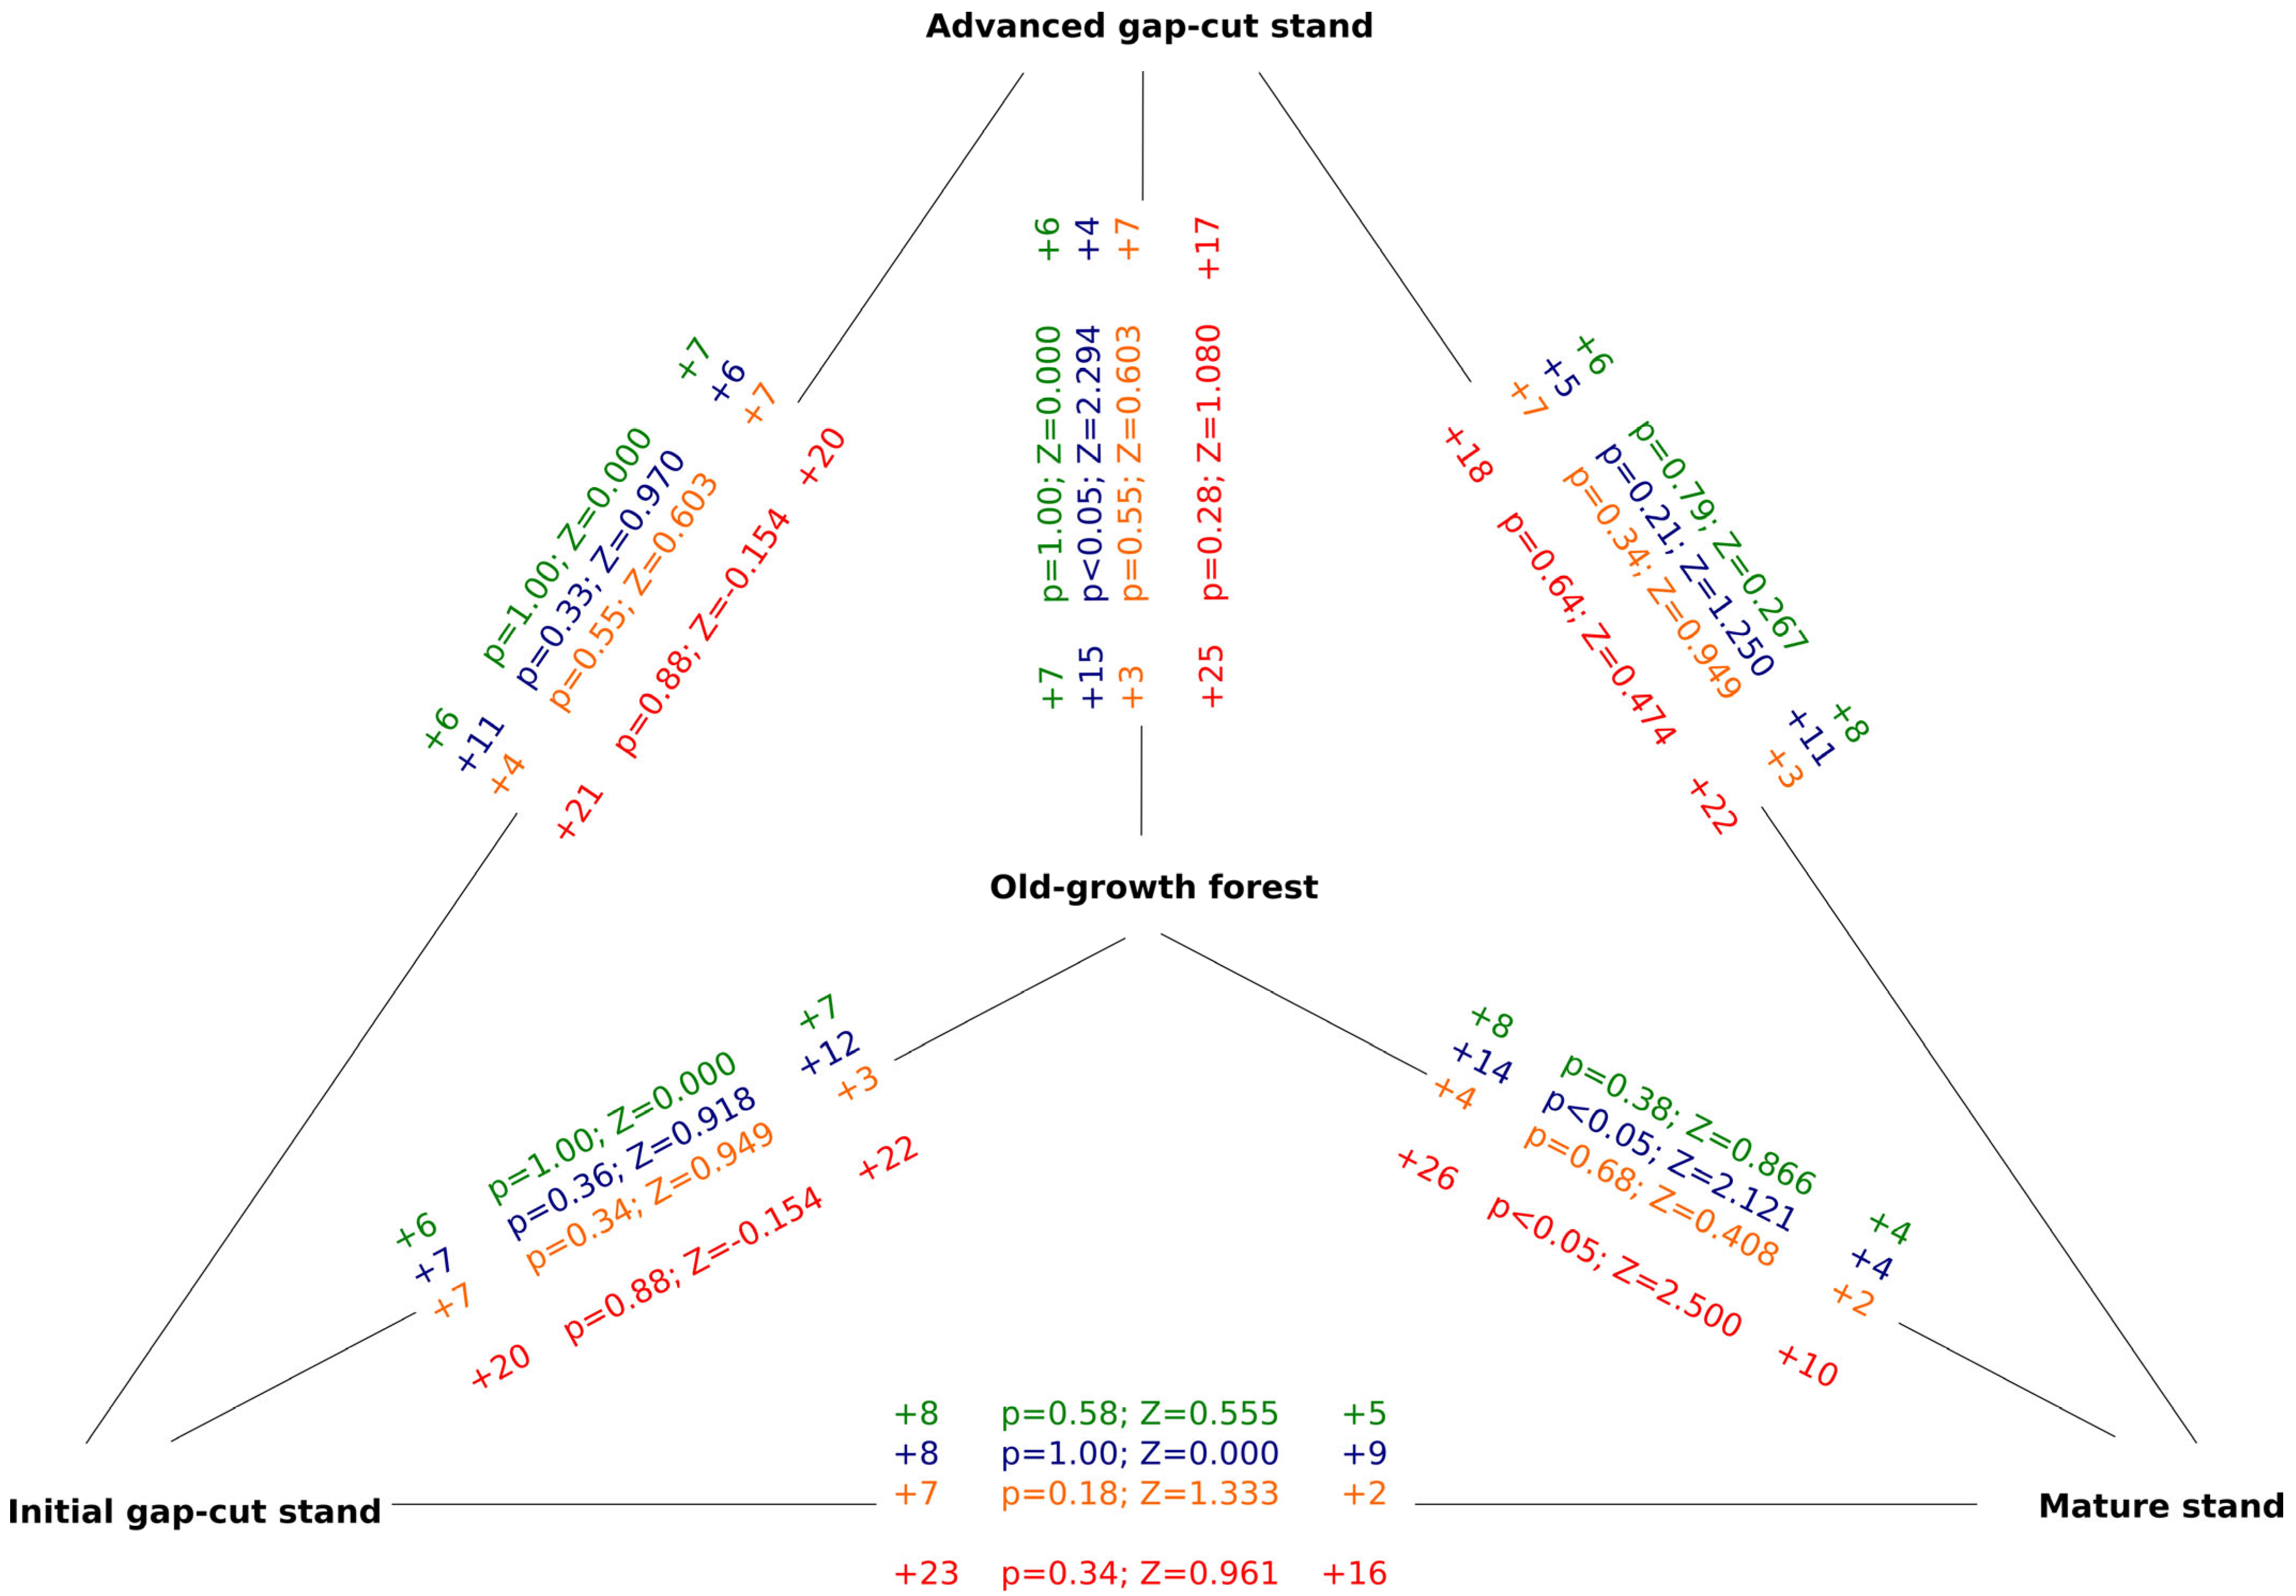
A total of forty-eight species of breeding birds were found in the analyzed oak–lime–hornbeam forests throughout the study period (34 species in 2021 and 40 species in 2022 and 2023). Twenty-five species were found in all forests, while 11 occurred in only one of them (Appendix A, Table A1). On average, for the entire study area and period, the most abundant species were the Eurasian Chaffinch Fringilla coelebs L., the Great Tit Parus major L., and the Collared Flycatcher. The average density of breeding birds was 73.4 pairs 10 ha−1. This value was subject to only minor fluctuations over the years, from 72 pairs 10 ha−1 in 2021 to 76 pairs 10 ha−1 in 2023. Throughout the study period, the highest bird density was found for the old-growth forest: on average, 91.2 pairs 10 ha−1, with a maximum of 98.8 pairs 10 ha−1 in 2022 (Figure 4). In the mature stand, the density of breeding birds remained at a very similar level throughout the years, at around 72 pairs 10 ha−1. Large fluctuations, from 58.7 to 80.8 pairs 10 ha−1, were observed in the initial gap-cut stand (Figure 4). The Shannon index for bird assemblages ranged from 4.10 for the old-growth forest to 4.52 for the advanced gap-cut stand (Figure 3). The high index value in the advanced gap-cut stand is associated with the presence of non-forest species that found suitable conditions in the gaps created by group-selection cutting. The Jaccard index ranged from 0.63 to 0.76. Its value was the highest when comparing bird species compositions for the initial and advanced gap-cut stands. The lowest Jaccard index was recorded between the old-growth forest and the advanced gap-cut stand. In terms of the composition of bird assemblages, the old-growth forest was the most similar to the mature stand (IJ = 0.76). The largest number of cavity nesting species (17) was identified in the old-growth forest and initial gap-cut stand, but in the former, their density was higher (46.5 pairs 10 ha−1) as compared to the latter (30.8 pairs 10 ha−1, Figure 3). All of the studied forests exhibited a similar number of canopy nesting species (11–12). However, there were large differences in terms of species nesting on or close to the ground: 5 in the mature stand vs. 10 in the advanced gap-cut stand. Despite differences in the density of breeding pairs, the proportions between carnivores, omnivores, insectivores, and finches were almost the same in all forests and amounted to approx. 1%, 31%, 64%, and 4%, respectively. Statistical sign tests confirmed some of the results described above (Figure 5). The group with the most significant changes was the cavity nesters. Significant differences were found between the old-growth forest and mature stand, as well as the advanced gap-cut stand (p < 0.05). Changes in the density of the respective groups—canopy nesters, cavity nesters, and birds nesting on or near the ground—during the respective study years are shown in Appendix A, Figure A3.

4. Discussion

Due to their multispecies composition, multilayer structure, and occurrence on fertile soils, oak–lime–hornbeam forests are important for the protection of many species (e.g., [3]). The present analysis focused on older forest stands, where the tree diameter distribution and vertical stand structure were shaped by natural processes or regeneration fellings carried out over extended periods. The retention or loss of key components of biological diversity is determined by the objectives embedded in the silvicultural framework. Although silvicultural management is often intended to emulate natural disturbance regimes, it can nevertheless result in a substantial reduction in structural and compositional elements critical to biodiversity, depending on specific management goals [42]. In this manuscript, we compare four different forest stand types, each represented by a single site. Due to the lack of replication, the results do not reflect the full variability that may occur in bird assemblages within these forest types. However, owing to the high accuracy of both forest structure and bird data, the study provides a well-grounded illustration of the complex set of factors underlying habitat–animal relationships. Therefore, despite certain limitations, this approach is commonly used [43,44,45], and the limited area of the sample plots is consistent with the principles of the mapping method for breeding bird territories [46]. Our detailed assessment of forest structural features revealed the presence of a wide range of breeding niches, including in managed stands. This was confirmed by the presence of bird species representing a wide range of ecological requirements. The Shannon diversity index and the number of bird species were similar for all stands. However, the analysis of bird species and their densities indicates that the studied stands differed substantially in terms of the conditions they offered to breeding birds. This is indicated by differences in the density of canopy, cavity, and forest floor nesters. Differences in the composition of bird assemblages are evidenced by low Jaccard index values, which ranged from 0.63 to 0.76. The lowest similarity of bird assemblages was found between the old-growth forest and the advanced gap-cut stand. This is mainly attributable to different densities of large living trees, the presence of deadwood, different degrees of filling of the lower forest layers, and the size of gaps in the tree stands.
The old-growth forest was characterized by a high density of cavity nesters. Owls, woodpeckers, stock doves Columba oenas L., as well as a high density of collared flycatchers were recorded. This is related to the presence of large old trees, which are important not only for birds (e.g., [5,47,48,49]). Holes may be excavated both in trunks and in dying thick branches [50,51]. Crevices and thick, porous bark also provide shelter as well as breeding and feeding opportunities. The lowest density of cavity nesters was recorded in the advanced gap-cut stand, which is associated with the lowest share of old trees in relation to the total area and a significantly smaller number of trees suitable for excavating holes. Other studies also confirm lower densities of cavity nesters in managed forests [28,29]. An insufficient availability of cavities can be partially compensated by nesting boxes, although, considering their disadvantages [52], the best way to improve the abundance of cavity nesters is to increase the stand rotation age or at least retain a larger number of old trees.
In oak–lime–hornbeam forests, the rotation age is generally high [42], and so they tend to feature a relatively high proportion of trees with a DBH above 60–70 cm but with practically no very thick trees (DBH > 1 m), which were found mainly in the strictly protected old-growth forest. The presence of several such trees per 1 ha in the old-growth forest affected the layering and spatial mosaic of the stand. Kebrle et al. [48] reported that in spruce forests, even five trees with a DBH above 70 cm are sufficient to considerably increase biodiversity. The rotation age of stands is governed by regulations and management objectives. However, it is often determined on the basis of the dominant species only [53]. Therefore, stands that are very similar to each other, growing on the same sites, may be felled at completely different stages. If there is even a slight dominance of oak over other species in the stand, the rotation age is adopted at 180 years. However, if, e.g., the hornbeam slightly prevails, the rotation age for such a stand will be reduced to only 100 years [54]. In the studied stands, such a situation occurred in the initial gap-cut stand, although differences in species composition between it and the other stands were small. Therefore, there is a need for a more flexible approach that would take into account other stand features, especially in areas of high natural value, covered by the Natura 2000 network. However, changes in the method of rotation age determination are currently being discussed as an approach, and taking into account more factors has been proposed.
Canopy bird assemblages differed the least. In all stands, the number of their species was 11 or 12, and bird abundance decreased with the overall canopy cover. However, this parameter does not accurately reflect differences in the vertical structure of the stand. The overall canopy cover is important in forest management for assessing light conditions for the seedling and sapling layers. Its value is not as important, however, for organisms occupying different layers of the forest in terms of its vertical structure. While the overall canopy cover was the highest in the old-growth forest and mature stand, substantial differences in the density at different heights could be seen. In the old-growth forest, the vertical structure was characterized by individual tall, large trees towering over others. In the managed forest, space filling variation in the forest’s interior arises mainly from cuts. In the case of old-growth, clearings are located randomly and are smaller as compared to the regularly distributed gaps made by group cuts in managed stands. Regeneration in initial and advanced gap-cut stands is denser in such areas. Large gaps offer good conditions for birds that prefer open areas and build nests on the ground or close to the ground, which are not found deep in the forest, such as the Common Whitethroat Curruca communis Latham or the Marsh Warbler Acrocephalus palustris Bechstein. It is easier for them to find suitable nesting sites in low vegetation, where grasses and blackberries are usually abundant. These are also species that often feed in the sapling layer, which was the most developed in the initial and advanced gap-cut stands. This layer is also the natural habitat of some ecotone species associated with the edges of the forest ecosystem and open spaces. This pattern was also observed by Czeszczewik and Walankiewicz [10] in the Białowieża Forest. Therefore, it was the sapling layer where the bird assemblage was the most diverse. Both gap-cut stands revealed a higher bird abundance and diversity than the mature stand or the old-growth forest. It should also be noted that the old-growth forest did not feature any larger clearings. Usually, in extensive strictly protected areas, there is a substantial spatial mosaic of conditions, and larger gaps also occur as a result of, e.g., windthrows. Then, the diversity of bird assemblages is increased by species that prefer more open ecosystems.
The amount of deadwood is often an indicator of forest naturalness and management intensity. In addition to old, thick living trees, the presence of nesting niches for cavity nesters in the old-growth forest was also increased by dead standing trees. It should be noted, however, that the share of standing deadwood was relatively small. In the studied oak–lime–hornbeam forests, lying deadwood was definitely dominant. Generally, lying deadwood does not have a direct bearing on bird assemblages, although for some species, such as the Eurasian Wren Troglodytes troglodytes L., its presence improves nest building conditions. The European Robin Erithacus rubecula L. was also abundant. Both species reached higher densities in the old-growth forest than in the managed stands. In addition, lying deadwood is important for amphibians, reptiles, and invertebrates, which are a staple for many birds [28].

5. Conclusions

The density of breeding pairs in all the studied forests can be deemed high. The species composition was also rich and diverse due to the variety of habitat conditions prevailing in individual stands. Oak–lime–hornbeam forests are composed of many tree species, which is beneficial in terms of the abundance of niches for birds [55]. For instance, some tree species are much more readily used by woodpeckers for excavating holes or are more susceptible to the formation of holes of another origin. The first group includes, among others, oak, hornbeam, and alder, while the second group primarily consists of hornbeam [56,57]. Managed forests constitute the majority of forests in Europe, and so their role in the protection of bird species as well as other organisms cannot be overestimated. Is it possible, then, to maintain the full diversity of birds in managed forests? With certain concessions, it is indeed possible to continue forest management while sustaining stable populations of species associated with various stand types. A key to success appears to be maintaining habitat heterogeneity. A mosaic of different stand development phases supports the availability and continuity of ecological niches for a wide range of species. It is also necessary to safeguard the forest features that are particularly reduced as a result of management activities, such as large, old trees and an adequate volume and diversity of dead wood. These features are especially important for supporting the occurrence of the most sensitive species. A sound strategy is to designate and retain parts of stands that will remain unharvested. Finally, the timing of harvesting operations is also critical. To reduce direct losses to animal populations, silvicultural procedures in such areas should be conducted entirely outside the breeding season.

Author Contributions

Conceptualization, M.B., L.B. and K.S.; Methodology, M.B., L.B. and K.S.; Field research, K.S., L.B. and M.B.; Data analysis, L.B., K.S. and M.B.; Writing—original draft Preparation, K.S., M.B. and L.B.; Visualization, K.S. and M.B. All authors have read and agreed to the published version of the manuscript.

Funding

This study was financed by the Ministry of Science and Higher Education of the Republic of Poland.

Data Availability Statement

The raw data supporting the conclusions of this article will be made available by the authors on request.

Acknowledgments

The financial support mentioned in the Funding part is gratefully acknowledged.

Conflicts of Interest

The authors declare no conflicts of interest.

Appendix A

Figure A1. Density of living trees. DBH—diameter at breast height [cm]. The bar represents the mean, and whiskers indicate the standard error.
Forests 16 01060 g0a1
Figure A2. Sapling density according to dimension classes. The bar represents the mean, and whiskers indicate the standard error.
Forests 16 01060 g0a2
Figure A3. Density of canopy nesters (A), cavity nesters (B), and birds nesting on or near the ground (C) in the respective study years.
Forests 16 01060 g0a3
Table A1. The breeding bird assemblage of the oak–lime–hornbeam forests.
SpeciesOld-Growth Forest
(Reserve Lipówka)
Mature StandInitial
Gap-Cut Stand
Advanced
Gap-Cut Stand
Mean Density Throughout the Study Period [Pairs per 10 ha]
Columba oenas L.0.1
Strix aluco L.0.40.1
Strix uralensis Pallas0.4
Jynx torquilla L. 0.1
Picus canus J. F. Gmelin0.1 0.3
Picus viridis L. 0.10.20.1
Dryocopus martius L.0.20.10.0
Dendrocoptes medius L.2.82.12.31.3
Dryobates minor L.0.10.20.30.4
Dendrocopos major L.5.23.62.72.4
Poecile palustris L.0.20.60.51.0
Cyanistes caeruleus L.4.94.93.43.5
Parus major L.10.57.36.35.1
Sitta europaea L.3.93.22.91.4
Certhia familiaris L.1.90.70.90.4
Certhia brachydactyla C. L. Brehm1.51.01.50.4
Sturnus vulgaris L.4.33.94.53.0
Muscicapa striata Pallas0.50.30.20.4
Ficedula hypoleuca Pallas. 0.2
Ficedula albicollis Temminck 9.66.25.14.3
Columba palumbus L.2.41.82.11.6
Cuculus canorus L. 0.10.4
Pernis apivorus L. 0.1
Buteo buteo L. 0.10.2
Accipiter nisus L.0.1
Oriolus oriolus L.0.50.10.40.4
Garrulus glandarius L.0.40.60.91.2
Corvus corax L. 0.1
Hippolais icterina Vieillot0.1 0.20.4
Acrocephalus palustris Bechstein 0.4
Phylloscopus sibilatrix Bechstein1.41.52.11.0
Phylloscopus trochilus L.0.1 0.4
Phylloscopus collybita Vieillot0.11.73.73.4
Aegithalos caudatus L.0.40.40.70.7
Sylvia atricapilla L.4.34.25.37.0
Sylvia borin Boddaert 0.50.6
Curruca communis Latham 0.32.5
Troglodytes troglodytes L.5.13.30.30.4
Erithacus rubecula L.5.14.43.43.2
Turdus philomelos C. L. Brehm1.51.81.11.7
Turdus merula L.3.73.12.72.1
Anthus trivialis L. 0.6
Fringilla coelebs L.15.511.58.66.9
Coccothraustes coccothraustes L.3.93.22.42.8
Pyrrhyla pyrrhula L. 0.2
Chloris chloris L. 0.2
Carduelis carduelis L.0.10.10.2
Emberiza citrinella L. 0.22.3

References

  1. Novák, P.; Willner, W.; Biurrun, I.; Gholizadeh, H.; Heinken, T.; Jandt, U.; Kollar, J.; Kozhevnikova, M.; Naqinezhad, A.; Onyshchenko, V.; et al. Classification of European oak–hornbeam forests and related vegetation types. Appl. Veg. Sci. 2023, 26, e12712. [Google Scholar] [CrossRef]
  2. Novák, P.; Willner, W.; Zukal, D.; Kollár, J.; Roleček, J.; Świerkosz, K.; Ewald, J.; Wohlgemuth, T.; Csiky, J.; Onyshchenko, V.; et al. Oak-hornbeam forests of Central Europe: A formalized classification and syntaxonomic revision. Preslia 2020, 92, 1–34. [Google Scholar] [CrossRef]
  3. Stefańska-Krzaczek, E.; Kącki, Z.; Szypuła, B. Coexistence of ancient forest species as an indicator of high species richness. For. Ecol. Manag. 2016, 365, 12–21. [Google Scholar] [CrossRef]
  4. Stański, T.; Czeszczewik, D.; Stańska, M.; Walankiewicz, W. Anvils of the Great Spotted Woodpecker (Dendrocopos major) in primeval oak-lime-hornbeam stands of the Białowieża National Park. Eur. Zool. J. 2021, 88, 1–8. [Google Scholar] [CrossRef]
  5. Stański, T.; Stańska, M.; Goławski, A.; Czeszczewik, D. Foraging Site Selection of the Middle Spotted Woodpecker (Leiopicus medius L.) in Primeval Oak-Lime-Hornbeam Forest of the Białowieża National Park: Comparison of Breeding and Non-Breeding Seasons. Forests 2021, 12, 837. [Google Scholar] [CrossRef]
  6. Jelinčić, A.; Vukelić, J.; Papković, D. Phytosociological research into the Illyrian oak-hornbeam forest on the limestone cliffs of Kupa river canyon (Kamanje, West-Central Croatia). Šumarski List 2024, 1–2, 7–18. [Google Scholar] [CrossRef]
  7. Fornal-Pieniak, B.; Ollik, M. Diversity of Flora in the Undergrowth of Park Afforestations, Rural Plantings and Oak-Hornbeam Forests. Folia For. Pol. Ser. A 2013, 55, 132–136. [Google Scholar] [CrossRef]
  8. Ławrynowicz, M. Higher macroscopic fungi in the oak-hornbeam forests of the central Poland. Acta Mycol. 1973, 9, 133–264. [Google Scholar] [CrossRef]
  9. Pugacewicz, E. Ptaki Lęgowe Puszczy Białowieskiej; Północnopodlaskie Towarzystwo Ochrony Ptaków: Białowieża, Poland, 1997. [Google Scholar]
  10. Czeszczewik, D.; Walankiewicz, W. Ecology and biology of birds in the Białowieża Forest: A 40-year perspective. For. Res. Pap. 2016, 77, 332–340. [Google Scholar] [CrossRef]
  11. Cmoluch, Z.; Cmoluchowa, A.; Lechowski, L.; Łętowski, J.; Minda-Lechowska, A.; Stączek, Z. Insect fauna of a linden-oak-hornbeam association (Tilio-Carpinetum) in the Bachus reserve (The Lubelska Upland). Fragm. Faunist. 1990, 33, 337–347. [Google Scholar] [CrossRef]
  12. Holecová, M.; Krumpál, M.; Országh, I.; Krumpálová, Z.; Fedor, P. Biodiversity of selected invertebrate groups in oak-hornbeam forest ecosystem in SW Slovakia. Ekol. Bratisl. 2005, 24, 205–222. [Google Scholar]
  13. Holecová, M.; Christophoryová, J.; Mrva, M.; Roháčová, M.; Stašiov, S.; Štrichelová, J.; Šustek, Z.; Tirjaková, E.; Tuf, I.H.; Vďačný, P. Faunal richness of selected invertebrate groups in epigeon of oak-hornbeam forests on the territory of Bratislava. In Bio-Diversity of Soil Micro- and Macrofauna in Oak-Hornbeam Forest Ecosystem on the Territory of Bratislava; Comenius University in Bratislava: Bratislava, Slovakia, 2012; pp. 129–137. [Google Scholar]
  14. Bohn, U.; Neuhausl, R.; Gollub, G.; Hettwer, C.; Neuhauslova, Z.; Raus, T.; Schluter, H.; Weber, H. Map of the Natural Vegetation of Europe. Scale: 1:2.500.000; Landwirtschaftsverlag: Munster, Germany, 2003. [Google Scholar]
  15. Zerbe, S. Restoration of natural broad-leaved woodland in Central Europe on sites with coniferous forest plantations. For. Ecol. Manag. 2002, 167, 27–42. [Google Scholar] [CrossRef]
  16. Łaska, G. Ecological consequences of deforestation and afforestation on a post-arable land: Changes in the composition and structure of plant communities and transformations of oak-hornbeam habitats and soil. Ecol. Quest. 2014, 20, 9–21. [Google Scholar] [CrossRef]
  17. Eliáš, P. Water deficit of plants in an oak-hornbeam forest. Preslia 1978, 50, 173–188. [Google Scholar]
  18. Beloiu, M. Forest Response to Climate Warming and Drought in Europe, Bayreuth. Ph.D. Thesis, University of Bayreuth, Faculty of Biology, Chemistry and Earth Sciences, Bayreuth, Germany, 2022. [Google Scholar]
  19. Padoa-Schioppa, E.; Baietto, M.; Massa, R.; Bottoni, L. Bird communities as bioindicators: The focal species concept in agricultural landscapes. Ecol. Ind. 2006, 6, 83–93. [Google Scholar] [CrossRef]
  20. Wesołowski, T.; Mitrus, C.; Czeszczewik, D.; Rowiński, P. Breeding bird dynamics in a primeval temperate forest over thirty-five years: Variation and stability in the changing world. Acta Ornit. 2010, 45, 209–232. [Google Scholar] [CrossRef]
  21. Mekonen, S. Birds as Biodiversity and Environmental Indicator. J. Nat. Sci. Res. 2017, 7, 28–34. [Google Scholar]
  22. Chowfin, S.M.; Leslie, A.J. Using birds as biodindicators of forest restoration progress: A preliminary study. Trees For. People 2021, 3, 100048. [Google Scholar] [CrossRef]
  23. Bergner, A.; Avcı, M.; Eryiğit, H.; Jansson, N.; Niklasson, M.; Westerberg, L.; Milberg, P. Influences of forest type and habitat structure on bird assemblages of oak (Quercus spp.) and pine (Pinus spp.) stands in southwestern Turkey. For. Ecol. Manag. 2015, 336, 137–147. [Google Scholar] [CrossRef]
  24. Domokos, E.; Domokos, J. Bird communities of different woody vegetation types from the Niraj valley, Romania. Turk. J. Zool. 2016, 40, 734–742. [Google Scholar] [CrossRef]
  25. Głowaciński, Z. Secondary Succession of Birds in Maturing Forest Ecosystem (Synthesis); PWN: Warszawa, Kraków, 1981. [Google Scholar]
  26. ZHL. Zasady Hodowli Lasu; Państwowe Gospodarstwo Leśne Lasy Państwowe: Warszawa, Poland, 2023.
  27. Virkkala, R.; Rajasärkkä, A.; Väisänen, R.; Vickholm, M.; Virolainen, E. Conservation value of nature reserves: Do hole-nesting birds prefer protected forests in southern Finland? Ann. Zool. Fenn. 1994, 31, 173–186. [Google Scholar]
  28. Walankiewicz, W.; Czeszczewik, D.; Tumiel, T.; Stański, T. Woodpeckers abundance in the Białowieża Forest—A comparison between deciduous, strictly protected and managed stands. Ornis Pol. 2011, 52, 161–168. [Google Scholar]
  29. Lešo, P.; Kropil, R.; Kajtoch, Ł. Effects of forest management on bird assemblages in oak-dominated stands of the Western Carpathians—Refuges for rare species. For. Ecol. Manag. 2019, 453, 117620. [Google Scholar] [CrossRef]
  30. Godzik, B.; Piechnik, Ł. Puszcza Niepołomicka—Zrównoważona gospodarka leśna a ochrona bogactwa przyrodniczego. Zjazd PTB Przew. Ses. Teren. 2019, 58, 185–213. [Google Scholar]
  31. PUL. Plan Urządzenia Lasu Sporządzony na Lata od 2022 do 2031 dla Nadleśnictwa Niepołomice; KRAMEKO sp. z o. o.: Krakow, Poland, 2022. [Google Scholar]
  32. Paletto, A.; Tosi, V. Forest canopy cover and canopy closure: Comparison of assessment techniques. Eur. J. For. Res. 2009, 128, 265–272. [Google Scholar] [CrossRef]
  33. NFI. The National Forest Inventory; State Forests National Forest Holding: Stary Sękocin, Poland, 2015.
  34. Chmura, D.; Salachna, A.; Sierka, E. Porównanie oceny zwarcia drzewostanu za pomocą metody wizualnej i zwarciomerza. Sylwan 2016, 160, 475–481. [Google Scholar]
  35. Braun-Blanquet, J. Plant Sociology. The Study of Plant Communities; McGraw-Hill Book Co., Inc.: New York, NY, USA; London, UK, 1932. [Google Scholar]
  36. Wikum, D.A.; Shanholtzer, G.F. Application of the Braun-Blanquet cover-abundance scale for vegetation analysis in land development studies. Environ. Manag. 1978, 2, 323–329. [Google Scholar] [CrossRef]
  37. Tomiałojć, L. The combined version of the mapping method. In Bird Census Work and Nature Conservation, Proc. VI Intern. Conf. Bird Census and Atlas Work, Göttingen; Oelke, H., Ed.; DDA: Göttingen, Germany, 1980; pp. 92–106. [Google Scholar]
  38. Czuraj, M. Tablice Miąższości Kłód Odziomkowych i Drzew Stojących; PWRiL: Warszawa, Poland, 1990. [Google Scholar]
  39. Magurran, A.E. Measuring Biological Diversity; Blackwell: Oxford, UK, 2004. [Google Scholar]
  40. Chao, A.; Chazdon, R.L.; Colwell, R.K.; Shen, T.J. Abundance-based similarity indices and their estimation when there are unseen species in samples. Biometrics 2006, 62, 361–371. [Google Scholar] [CrossRef]
  41. Snow, D.W.; Perrins, C.M. The Birds of the Western Palearctic; Oxford University Press: Oxford, UK, 1998. [Google Scholar]
  42. Bobiec, A.; van der Burgt, H.; Meijer, K.; Zuyderduyn, C.; Haga, J.; Vlaanderen, B. Rich deciduous forests in Białowieża as a dynamic mosaic of developmental phases: Premises for nature conservation and restoration management. For. Ecol. Manag. 2000, 130, 159–175. [Google Scholar] [CrossRef]
  43. Baláž, M.; Balážová, M. Diversity and abundance of bird communities in three mountain forest stands: Effect of the habitat heterogeneity. Pol. J. Ecol. 2012, 60, 629–634. [Google Scholar]
  44. Lin, C.W.; Hsu, F.H.; Ding, T.S. Applying a territory mapping method to census the breeding bird community composition in a montane forest of Taiwan. J. f For. Sci. 2011, 26, 267–285. [Google Scholar]
  45. Thompson, F., III; Fritzell, E.K. Bird Densities and Diversity in Clearcut and Mature Oak-Hickory Forest; Research Paper NC-293; U.S. Dept. of Agriculture, Forest Service, North Central Forest Experiment Station: St. Paul, MN, USA, 1990.
  46. Sutherland, W.J. (Ed.) Ecological Census Techniques: A Handbook; Cambridge University Press: Cambridge, UK, 2006. [Google Scholar]
  47. Koch Widerberg, M.; Ranius, T.; Drobyshev, L.; Lindbladh, M. Oaks retained in production spruce forests help maintain saproxylic beetle diversity in southern Scandinavian landscapes. For. Ecol. Manag. 2018, 417, 257–264. [Google Scholar] [CrossRef]
  48. Kebrle, D.; Zasadil, P.; Hošek, J.; Barták, V.; Šťastný, K. Large trees as a key factor for bird diversity in spruce-dominated production forests: Implications for conservation management. For. Ecol. Manag. 2021, 496, 119460. [Google Scholar] [CrossRef]
  49. Komlós, M.; Botta-Dukát, Z.; Bölöni, J.; Aszalós, R.; Veres, K.; Winkler, D.; Ónodi, G. Tall, large-diameter trees and dense shrub layer as key determinants of the abundance and composition of bird communities in oak-dominated forests. J. For. Res. 2024, 35, 62. [Google Scholar] [CrossRef]
  50. Hebda, G.; Wesołowski, T.; Rowiński, P. Nest sites of a strong excavator, the Great Spotted Woodpecker Dendrocopos major, in a primeval forest. Ardea 2017, 105, 61–71. [Google Scholar] [CrossRef]
  51. Charman, E.C.; Smith, K.W.; Dodd, S.; Gruar, D.J.; Dillon, I.A. Pre-breeding foraging and nest site habitat selection by Lesser Spotted Woodpeckers Dendrocopos minor in mature woodland blocks in England. Ornis Fenn. 2012, 89, 182–196. [Google Scholar] [CrossRef]
  52. Hebda, G.; Wesołowski, T. Low flea loads in birds’ nests in tree cavites. Ornis Fenn. 2012, 89, 139–144. [Google Scholar] [CrossRef]
  53. IUL. Instrukcja Urządzania Lasu; Część I; Centrum Informacyjne Lasów Państwowych: Warszawa, Poland, 2012.
  54. ZHL. Zasady Hodowli Lasu; Państwowe Gospodarstwo Leśne Lasy Państwowe: Warszawa, Poland, 2012.
  55. Renner, S.C.; Gossner, M.M.; Ayasse, M.; Böhm, S.; Teuscher, M.; Weisser, W.W.; Jung, K. Forest structure, plants, arthropods, scale, or birds’ functional groups: What key factor are forest birds responding to? PLoS ONE 2024, 19, e0304421. [Google Scholar] [CrossRef]
  56. Walankiewicz, W.; Czeszczewik, D. Importance of Carpinus betulus for hole-nesting birds in the Białowieża National Park. Chrońmy Przyr. Ojczystą 2006, 62, 50–57. [Google Scholar]
  57. Piechnik, Ł. Carpinus betulus and occurrence of natural tree hollows in managed forests. Fragm. Florist. Geobot. Pol. 2020, 7, 33–43. [Google Scholar] [CrossRef]
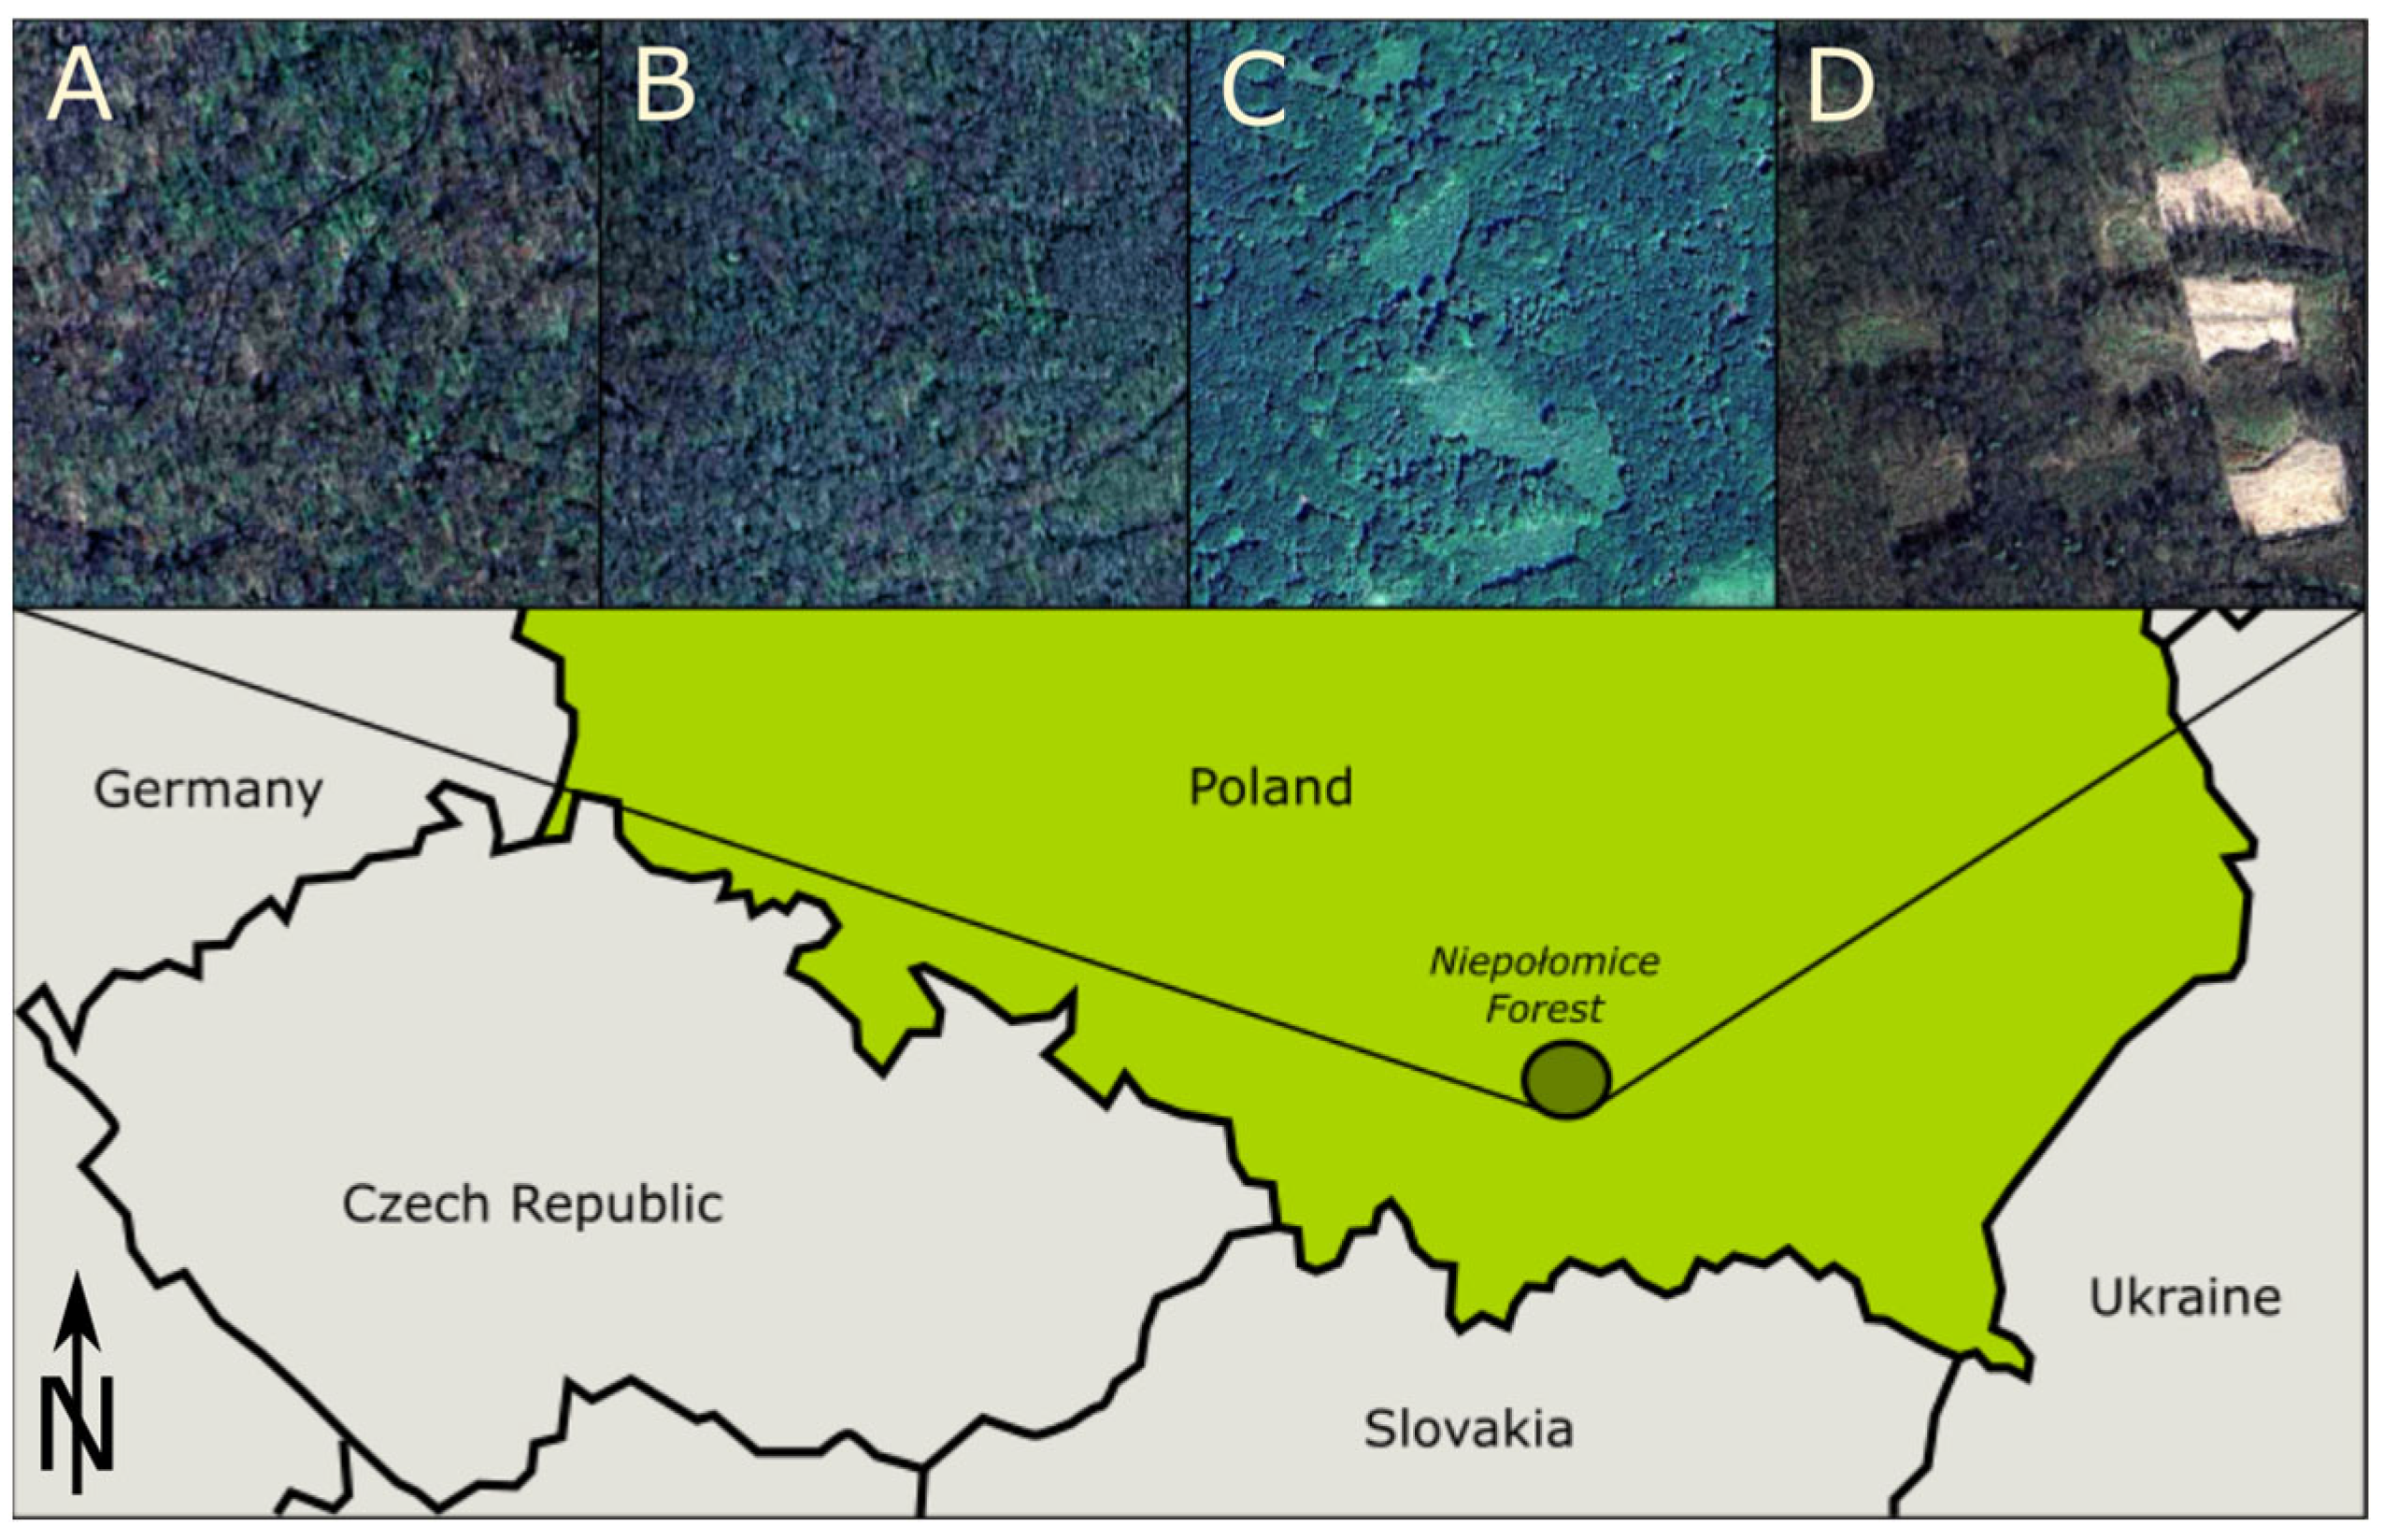
Figure 1. Study area with the four selected forests: (A) old-growth forest; (B) mature stand; (C) initial gap-cut stand; and (D) advanced gap-cut stand.
Forests 16 01060 g001
Figure 2. Comparison of bird assemblages and stand features. Birds (brown): Ns—number of species; DBP—mean density of breeding pairs for the entire study period [pairs 10 ha−1]; H—Shannon index; HMAX—maximum Shannon index; E—evenness index; IJ—Jaccard index. Forest (green): V—stand volume [m3 ha−1]; Cc—total canopy cover [%]; DT—tree density [trees ha−1]; H—Shannon index; G—Gini index.
Forests 16 01060 g002
Figure 3. Occurrence of birds with different nesting and food preferences. Forest space filling in five forest layers: 1st, 2nd, and 3rd canopy stories; sapling layer; and seedling layer. Density of large living trees and characteristics of standing and lying deadwood. DBH—diameter at breast height; DTE lying—diameter at the thicker end of lying deadwood; H’—Shannon index; E—evenness index.
Forests 16 01060 g003
Figure 4. Density of all bird species in 2021–2023.
Forests 16 01060 g004
Figure 5. Statistical comparison (sign test) of the density of all bird species and separately of canopy nesters, cavity nesters, and birds nesting on or near the ground between the four study stands. Numbers +2, +5, etc., indicate how many bird species had higher densities in a given stand relative to the comparison stand. Canopy nesters (green colour), cavities (blue), ground/close to the ground nesters (orange), all bird species (red).
Forests 16 01060 g005
Table 1. The main characteristics of the studied stands.
VariableOld-Growth Forest (Reserve Lipówka)Mature StandInitial Gap-Cut StandAdvanced Gap-Cut StandTest
Mean (Variation Coefficient) (Min–Max)
Volume of living trees [m3 ha−1]482.3 (56) a
(85.5–1092.5)
323.8 (43) a
(41.3–670.5)
341.0 (75) a
(0.0–851.5)
168.6 (118) b
(0.0–838.5)
H = 32.0
p < 0.001
Density of living trees [trees ha−1]339.0 (29) a
(150.0–550.0)
246.7 (49) b
(75.0–725.0)
221.5 (64) c
(0.0–500.0)
544.4 (86) abc
(0.0–1600.0)
H = 20.8
p < 0.001
Volume of lying deadwood [m3 ha−1]159.7 (81) a
(12.1–506.5)
29.6 (162) b
(0.0–215.9)
8.3 (224) c
(0.0–90.3)
6.0 (168) bc
(0.0–60.7)
H = 73.8
p < 0.001
Volume of standing deadwood [m3 ha−1]17.9 (209) a
(0.0–195.6)
6.0 (186) ab
(0.0–41.5)
7.6 (405) b
(0.0–146.5)
0.5 (443) b
(0.0–12.0)
H = 20.8
p < 0.001
Total volume of deadwood [m3 ha−1]177.6 (81) a
(12.1–569.3)
35.7 (149) b
(0.0–224.3)
15.9 (222) c
(0.0–149.9)
6.5 (159) bc
(0.0–60.7)
H = 69.7
p < 0.001
Sapling density [saplings ha−1]1247.1 (168) ab
(0.0–10100.0)
900.0 (162) a
(0.0–8300.0)
4852.8 (136) bc
(0.0–26000.0)
4466.7 (133) c
(0.0–26000.0)
H = 20.7
p < 0.001
Seedling cover [%]9.5 (151) a
(1.0–70.0)
5.6 (207) a
(0.0–60.0)
15.1 (153) a
(0.0–80.0)
7.5 (213)a
(0.0–80.0)
F = 2.4
p = 0.07
Total canopy cover [%]77.9 (22) a
(20.0–95.0)
74.7 (25) a
(15.0–100.0)
61.3 (61) a
(0.0–100.0)
60.0 (60) a
(0.0–100.0)
H = 3.0
p > 0.5
1st-floor canopy cover [%]43.1 (44) ac
(15.0–80.0)
64.5 (29) b
(8.0–100.0)
47.8 (65) ab
(0.0–85.0)
23.5 (115) c
(0.0–90.0)
H = 41.3
p < 0.001
2st-floor canopy cover [%]58.1 (25) a
(20.0–85.0)
40.2 (41) b
(10.0–75.0)
34.6 (81) bc
(0.0–100.0)
21.4 (119) c
(0.0–80.0)
H = 39.9
p < 0.001
3st-floor canopy cover [%]35.4 (50) a
(5.0–75.0)
23.5 (77) a
(0.0–80.0)
29.7 (82) a
(0.0–90.0)
37.5 (84) a
(0.0–100.0)
H = 7.8
p = 0.05
Density of living trees with DBH ≥ 65 cm [trees ha−1]23.5 (94) a
(0.0–75.0)
12.8 (136) a
(0.0–50.0)
26.4 (113) a
(0.0–100.0)
11.1 (174) a
(0.0–75.0)
H = 11.3
p = 0.01
Density of living trees with DBH ≥ 75 cm [trees ha−1]18.4 (117) a
(0.0–75.0)
6.7 (186) a
(0.0–50.0)
11.1 (165) a
(0.0–75.0)
6.3 (260) a
(0.0–75.0)
H = 11.3
p = 0.01
Density of living trees with DBH ≥ 85 cm [trees ha−1]11.0 (150) a
(0.0–50.0)
2.2 (324) a
(0.0–25.0)
3.5 (253) a
(0.0–25.0)
2.1 (336) a
(0.0–25.0)
H = 13.6
p = 0.004
H—values marked with different letters (a, b, c) differ significantly at p < 0.05, as evaluated by the nonparametric Kruskal–Wallis test, corrected with a post hoc test for multiple comparisons; F—values evaluated by the one-way ANOVA test.
Disclaimer/Publisher’s Note: The statements, opinions and data contained in all publications are solely those of the individual author(s) and contributor(s) and not of MDPI and/or the editor(s). MDPI and/or the editor(s) disclaim responsibility for any injury to people or property resulting from any ideas, methods, instructions or products referred to in the content.