Article

Long-Term Nitrogen Addition Regulates Plant-Soil 15N–13C Coupling Through Species Traits and Temporal-Spatial Dynamics in a Temperate Forest

1
Heilongjiang Institute of Construction Technology, Harbin 150001, China
2
Institute of Geographic Sciences and Natural Resources Research, Chinese Academy of Sciences, Beijing 100101, China
*
Author to whom correspondence should be addressed.
Forests 2025, 16(7), 1046; https://doi.org/10.3390/f16071046
Submission received: 17 May 2025 / Revised: 20 June 2025 / Accepted: 20 June 2025 / Published: 22 June 2025
(This article belongs to the Section Forest Soil)

Abstract

Nitrogen deposition is a critical driver of plant-soil interactions in forest ecosystems. However, the species-specific coordination of nitrogen uptake and carbon assimilation—traced using 15N- and 13C-labeled compounds—under varying nitrogen forms, depths, and time points remains poorly understood. We conducted a dual-isotope (15NH4Cl, K15NO3, and Na213CO3) labeling experiment in a temperate secondary forest to investigate nutrient uptake and carbon assimilation in three understory species—Carex siderosticta, Maianthemum bifolium, and Oxalis acetosella—across three nitrogen treatments (control, low N, and high N), two soil depths (0–5 cm and 5–15 cm), and two post-labeling time points (24 h and 72 h). We quantified 15N uptake and 13C assimilation in above- and belowground plant tissues, as well as 15N and 13C retention in soils. C. siderosticta exhibited the highest total 15N uptake (2.2–6.9 μg N m−2 aboveground; 1.4–4.1 μg N m−2 belowground) and 13C assimilation (58.4–111.2 mg C m−2 aboveground; 17.6–39.2 mg C m−2 belowground) under high ammonium at 72 h. High nitrogen input significantly enhanced the coupling between plant biomass and nutrient assimilation (R2 > 0.9), and increased 15N-TN and 13C-SOC retention in the surface soil layer (13,200–17,400 μg N kg−1; 30,000–44,000 μg C kg−1). Multifactorial analysis revealed significant interactions among nitrogen treatment, form, depth, and time. These findings demonstrate that ammonium-based enrichment promotes nutrient acquisition and carbon assimilation in responsive species and enhances surface soil C—N retention, highlighting the integrative effects of nitrogen form, species traits, and spatial–temporal dynamics on forest biogeochemistry.

1. Introduction

Nitrogen (N) deposition has become a critical global issue influencing ecosystem structure and function, particularly in temperate forest ecosystems [1]. Excessive nitrogen input from atmospheric deposition significantly modifies soil nutrient dynamics, microbial communities, and plant growth patterns, consequently altering ecosystem processes such as carbon (C) sequestration and nutrient cycling [2]. Recent research indicates that elevated nitrogen availability can substantially enhance soil nutrient concentrations and alter soil physicochemical properties, including increased soil organic carbon (SOC) and microbial biomass, coupled with reductions in soil pH [3]. These alterations are critical, as they disproportionately influence species with contrasting resource acquisition strategies, leading to shifts in plant community composition and ecosystem functioning [4].
Species-specific responses to nitrogen enrichment, particularly related to differential nutrient uptake capacities and biomass accumulation strategies, have been increasingly recognized. Resource-responsive species typically exhibit superior adaptability to enriched nutrient conditions by enhancing nitrogen uptake efficiency and carbon assimilation processes [5,6]. However, the underlying mechanisms driving these differential responses, especially regarding nitrogen form (NH4+ versus NO3), remain incompletely understood. Ammonium (NH4+), due to its reduced energetic cost for uptake and direct assimilation pathway, generally promotes greater nutrient uptake compared to nitrate (NO3) [7,8], yet how these preferences translate to biomass accumulation and carbon assimilation remains uncertain.
Additionally, plant biomass production is tightly coupled with nutrient assimilation and carbon fixation processes, especially under nutrient-enriched conditions [9]. This coupling mechanism could intensify over time, influencing ecosystem carbon-nitrogen dynamics profoundly [10,11]. Despite growing recognition of these interactions, gaps remain in our understanding of how nitrogen forms, soil depth profiles, and temporal dynamics collectively influence soil carbon and nitrogen retention and distribution, ultimately driving integrated plant–soil–microbial carbon-nitrogen feedback loops.
Addressing these knowledge gaps, this study aims to elucidate how elevated nitrogen inputs modulate plant biomass accumulation and nutrient uptake, as well as soil carbon–nitrogen retention and transformation dynamics across different plant species, nitrogen forms, and temporal scales. Specifically, we hypothesize:
Hypothesis 1 (H1). 
High nitrogen input promotes biomass accumulation in responsive plant species by altering soil properties, with effects varying among species.
Hypothesis 2 (H2). 
Plant nitrogen and carbon assimilation are shaped by nitrogen level, nitrogen form, species identity, and sampling time, with greater 13C assimilation under high ammonium at later stages.
Hypothesis 3 (H3). 
Nitrogen addition enhances the coordination between plant biomass and nutrient/carbon assimilation, especially under high nitrogen and prolonged exposure, suggesting a synergistic C–N feedback.
Hypothesis 4 (H4). 
Soil 15N retention and distribution are jointly influenced by nitrogen level, form, time, and depth, driving plant–soil–microbial C–N linkages.
This study aims to elucidate how nitrogen form, application rate, and timing jointly affect biomass accumulation, nutrient uptake, and soil carbon–nitrogen retention across different species and soil profiles under long-term nitrogen addition (initiated in 2006). By integrating 15N–13C dual labeling with depth- and time-resolved sampling, we provide novel insights into the coupled plant–soil–microbial dynamics under nitrogen deposition.

2. Materials and Methods
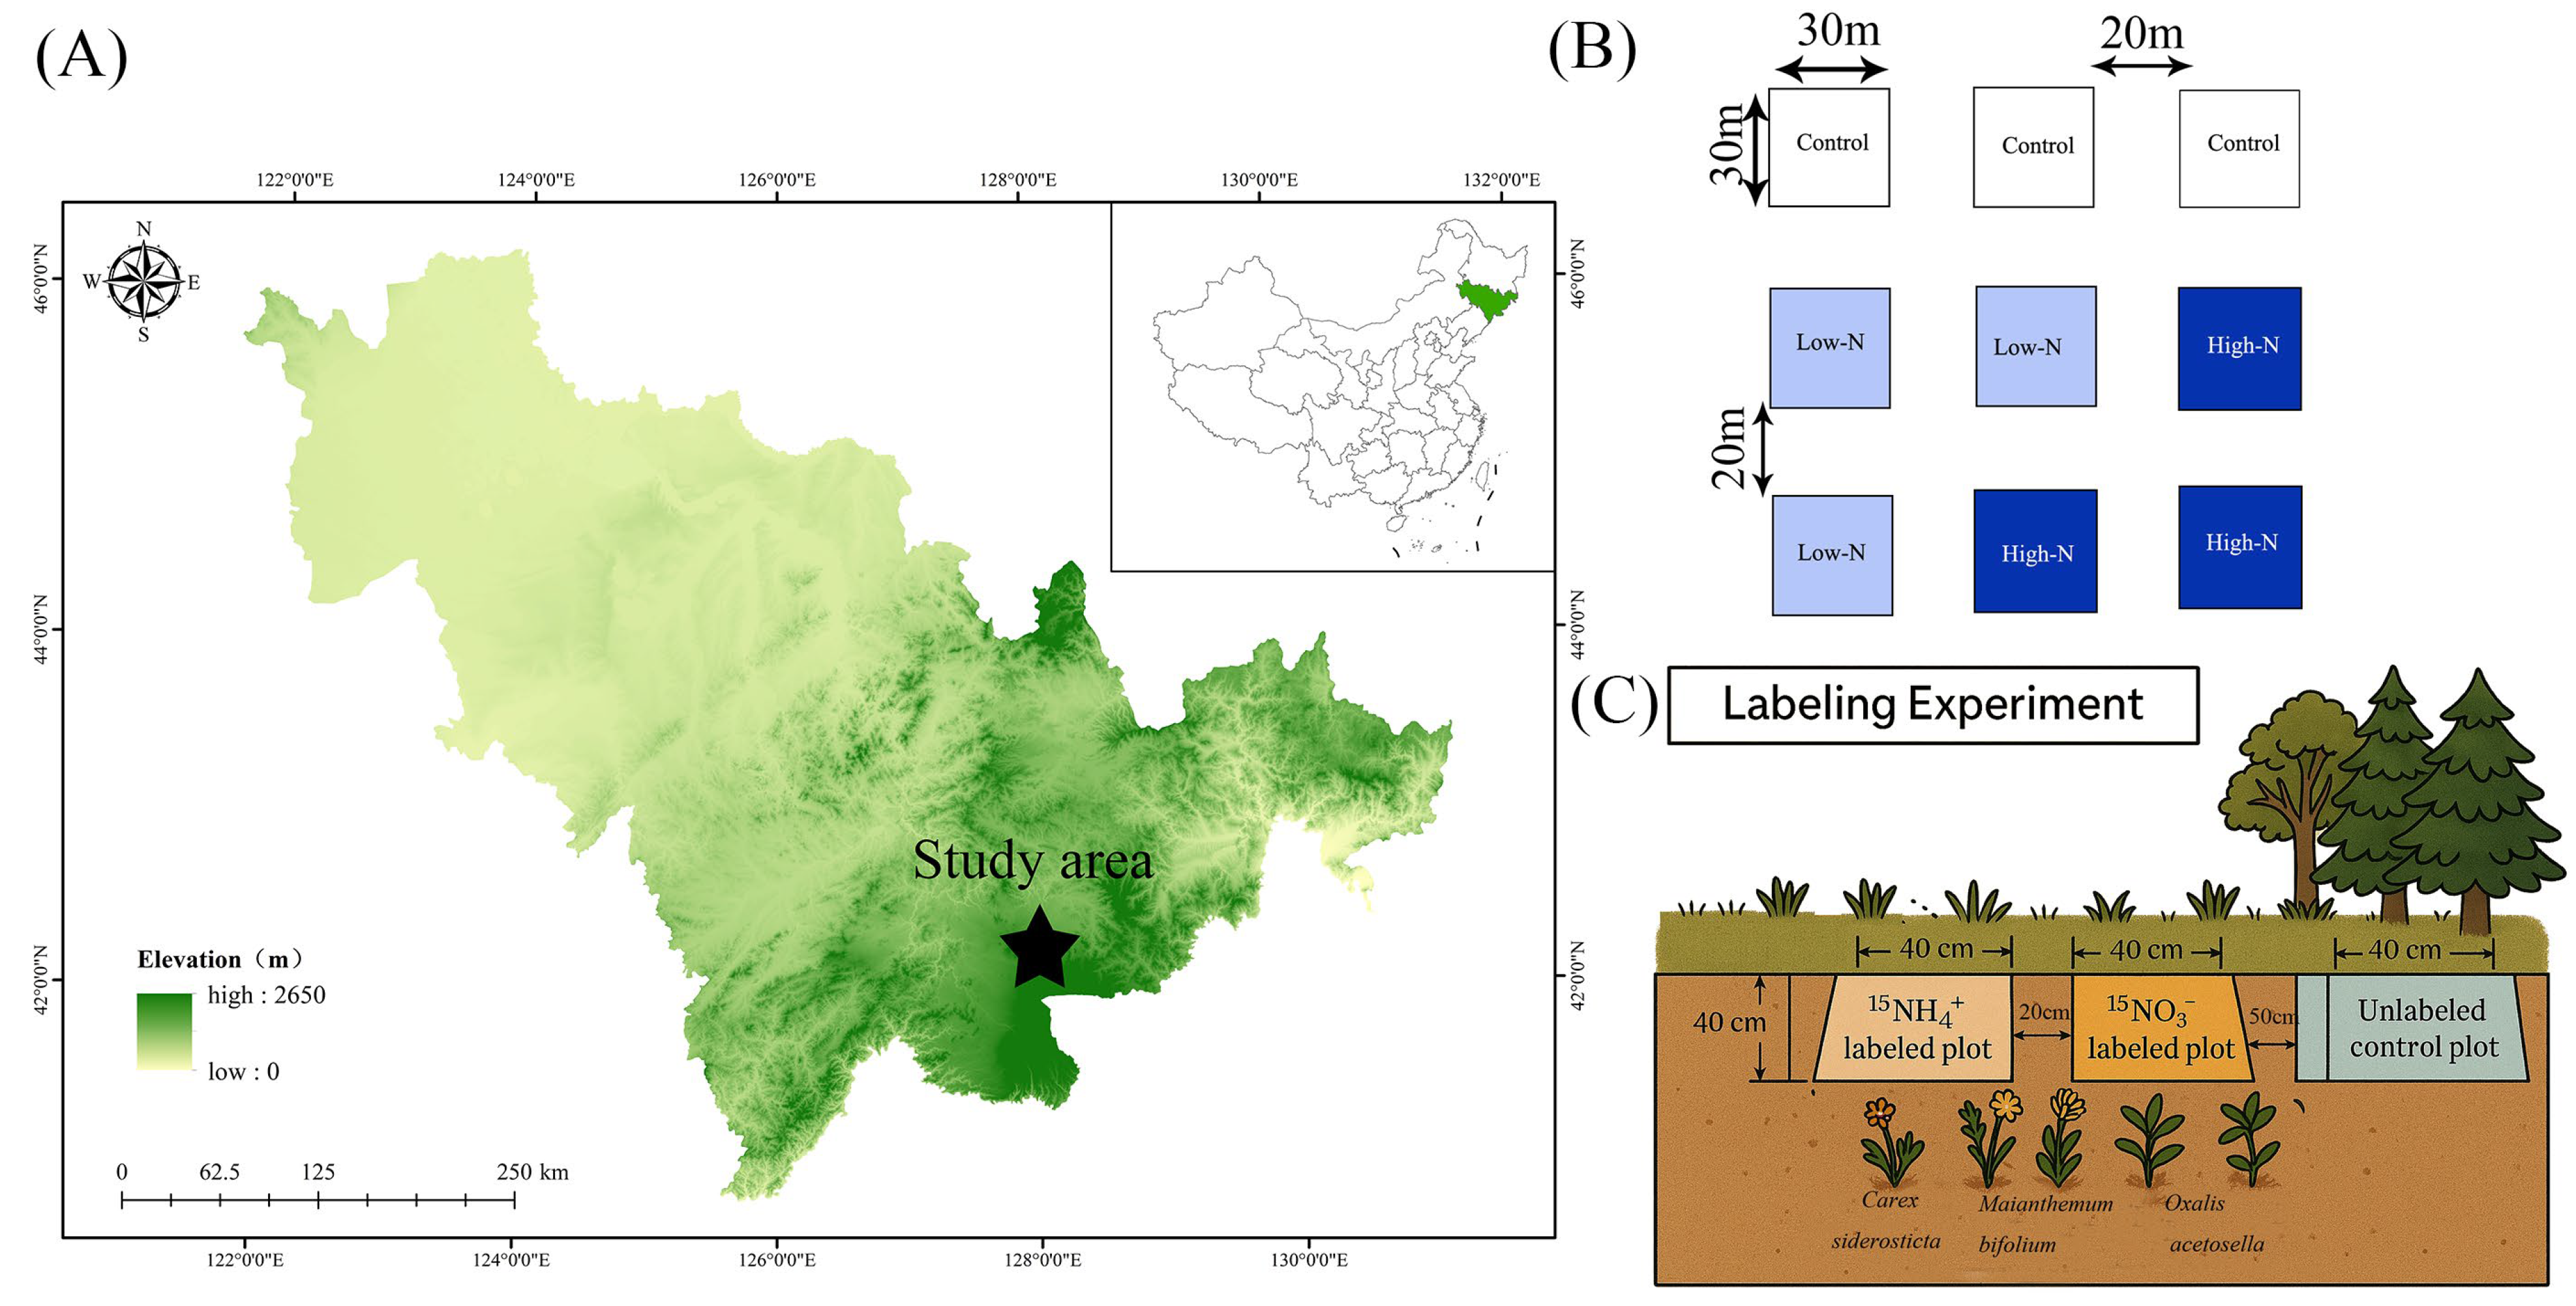
2.1. Study Sites

The field experiment was conducted in a temperate secondary forest located in the Lushuihe Forestry Bureau, Jilin Province, in northeastern China (42°24′9″ N, 128°5′45″ E) (Figure 1A). The study area is situated at an elevation of approximately 920 m with a gentle slope of less than 5°. The region experiences a typical monsoon climate, characterized by cold, dry winters and warm, and humid summers [12]. The mean annual temperature is 2.7 °C, and the average annual precipitation is 871.6 mm. The soil is classified as a Haplic Cambisol (FAO/WRB system) with a loamy texture (sand:silt:clay = 52:32:16) and an average soil organic matter (SOM) content of 6.8 ± 1.2% in the top 10 cm. According to long-term monitoring data from a nearby forest observation station, the average atmospheric nitrogen deposition in this area is 2.45 g N m−2 yr−1, with approximately 75% derived from wet deposition, which was consistent across all treatments and served as the background nitrogen input [13]. The study site was originally clear-cut in the early 1970s and has since naturally regenerated into a secondary mixed forest. The overstory is primarily composed of broad-leaved trees such as Betula platyphylla and Populus davidiana, as well as coniferous species including Larix gmelinii, with an average stand age of approximately 45 years. The understory is dominated by a diverse herbaceous layer, among which Carex siderosticta (C. siderosticta), Maianthemum bifolium (M. bifolium), and Oxalis acetosella (O. acetosella) are the most abundant and ecologically significant species. These three species were selected due to their contrasting functional traits: C. siderosticta exhibits high nitrogen use efficiency, M. bifolium (a shade-tolerant rhizomatous herb) represents clonal resource integration, and O. acetosella (an acidophilic forb) is sensitive to soil nitrogen availability (Table S1).

2.2. Experiment Design

A nitrogen addition experiment was established in May 2006 in the secondary mixed forest described above. Nine experimental plots (30 m × 30 m each) were laid out in a randomized block design, with a 20 m buffer zone between adjacent plots to minimize edge effects and cross-treatment contamination. Three nitrogen addition treatments were applied: control (CK, no nitrogen added), low nitrogen (LN, 2.5 g N m−2 yr−1), and high nitrogen (HN, 5.0 g N m−2 yr−1), each with three replicates (n = 3) (Figure 1B) which represented approximately 1× and 2× the regional mean nitrogen deposition rate (2.45 g N m−2 yr−1) over the past three decades, based on long-term monitoring data. Nitrogen was applied monthly during the growing season (May to October) each year. For the LN and HN treatments, the required amount of NH4NO3 was dissolved in 40 L of deionized water and evenly sprayed over the entire plot using a backpack sprayer. Control plots received the same volume (40 L) of deionized water to ensure that all plots experienced comparable moisture inputs, isolating the effects of nitrogen addition.
A dual stable isotope labeling experiment using 15N and 13C was conducted in July 2024 to trace nitrogen uptake and carbon assimilation in understory herbaceous plants under varying nitrogen addition treatments. To trace N and C assimilation, a dual-isotope labeling experiment was conducted using 15NH4Cl (10 atom%), K15NO3 (10 atom%), and Na213CO3 (99 atom%) as labeled compounds. To simulate carbon assimilation via photosynthesis, 13C was supplied in the form of 13CO2 gas. The labeling experiment was performed in all nine experimental plots representing three nitrogen treatments: control (CK, 0 g N m−2 yr−1), low nitrogen (LN, 2.5 g N m−2 yr−1), and high nitrogen (HN, 5.0 g N m−2 yr−1). Within each plot, one 40 cm × 100 cm rectangular subplot was randomly established to serve as the labeling area. Two 40 cm × 40 cm microplots were positioned side by side within this subplot, separated by a 40 cm × 20 cm buffer strip to prevent cross-contamination between treatments (Figure 1C). One microplot received a 15N-labeled ammonium treatment (15NH4+), and the other received a 15N-labeled nitrate treatment (15NO3). Each microplot was marked at its corners with disposable wooden sticks for accurate relocation, and a 40 cm-long bamboo stick was inserted vertically at the center of the main subplot to assist with spatial orientation. In addition, a third 40 cm × 40 cm microplot was randomly selected near the labeling subplot within the same plot and served as a control for isotope application. This control plot did not receive any 15N or 13C labeling but was treated with an equivalent volume of deionized water to account for potential moisture effects and ensure consistency in handling across treatments [14].
To assess the structural comparability of understory vegetation prior to isotope labeling, a baseline community survey was conducted in July 2024 across all nine experimental plots. Within each 30 m × 30 m plot, a 2 m × 2 m quadrat was randomly selected and surveyed for total plant cover (%), species richness (number of vascular plant species), and Shannon–Wiener diversity index. These metrics were used to evaluate whether initial vegetation characteristics varied among nitrogen addition treatments. One-way ANOVA indicated no significant differences in total cover, richness, or diversity index among CK, LN, and HN treatments (p > 0.05), confirming that the understory community was structurally homogeneous before treatment implementation and suitable for experimental comparison. To quantitatively verify this structural similarity, one-way ANOVA was conducted on three community metrics: total plant cover, species richness, and Shannon–Wiener diversity index. Results indicated no statistically significant differences across treatments for any of the measured variables (F = 2.51, p = 0.161 for cover; F = 0.20, p = 0.824 for richness; F = 1.72, p = 0.256 for diversity; see Table S3). This statistical confirmation supports the assumption of baseline comparability across plots. Summary values are provided in Table S2.

2.3. 15N and 13C Labeling Experiment

The dual isotope labeling experiment was conducted over two consecutive days in July 2024. The objective was to simultaneously trace soil nitrogen assimilation and plant carbon fixation dynamics in response to different nitrogen addition regimes. During labeling, ambient temperature and light intensity were monitored using a portable weather station (HOBO MX2301, Onset Computer Corporation, Bourne, MA, USA), with mean values of 22.3 ± 1.5 °C and 850 ± 120 μmol photons m−2 s−1, respectively.

2.3.1. 15N Labeling

On the first day, each 40 cm × 40 cm microplot designated for 15N treatment received either 15NH4Cl or K15NO3. Specifically, 0.6113 g of 15NH4Cl or 1.1554 g of K15NO3 (equivalent to 1.0 g N m−2, with a 15N atom abundance of 10.16%) was weighed and dissolved in deionized water to a total volume of 500 mL per plot. The solution was evenly applied to the soil surface of the designated microplots using a hand-held sprayer, ensuring uniform distribution across the plot area. To eliminate potential water effects, the adjacent 40 cm × 40 cm control microplots received 500 mL of deionized water without any isotopic label.

2.3.2. 13C Labeling

On the following day, 13C labeling was carried out using a closed chamber method. For each labeling event, 0.6 g of sodium bicarbonate enriched with 13C (Na213CO3, 99 atom % 13C) was dissolved in 10 mL of distilled water, followed by the addition of 20 mL of 1.0 mol L−1 sulfuric acid (H2SO4). This reaction (Na213CO3 + H2SO4 → Na2SO4 + H2O + 13CO2) rapidly released 13CO2 gas, which served as the carbon tracer. Immediately after initiating the reaction, each labeling plot was sealed with a transparent plastic chamber to trap the released 13CO2. The chamber edges were carefully embedded into the soil to ensure airtightness. Portable cooling panels were placed inside each chamber to moderate internal temperature and prevent heat stress to the plants during labeling. After a 3-h labeling period under ambient light conditions, the chambers were removed. To standardize photosynthetic conditions, labeling was conducted between 09:00 and 12:00 local time under saturating light (>1000 μmol photons m−2 s−1).

2.4. Sampling Strategy

To evaluate the temporal dynamics of 15N and 13C assimilation and allocation within plant–soil systems, samples were collected at two time points after the completion of 13C labeling: 24 h (TP1) and 72 h (TP2) following the 13CO2 application. These intervals were selected to capture both the rapid uptake and the short-term redistribution of isotopic tracers. Specifically, the 24-h time point reflects peak photosynthetic incorporation of 13CO2 and the initial assimilation of 15N, while the 72-h time point enables assessment of subsequent translocation, metabolic turnover, and rhizosphere interactions. These time points are widely adopted in pulse-labeling experiments and represent physiologically relevant windows for tracing fast and delayed responses of carbon and nitrogen dynamics [14].

2.4.1. Plant Sampling

For each time point, individuals of the three target herbaceous species (Carex siderosticta, Maianthemum bifolium, and Oxalis acetosella) were carefully excavated from within each labeled 40 cm × 40 cm microplot. Healthy individuals were defined as those showing no visible signs of herbivory, disease, or senescence, with ≥90% leaf area intact and uniform height (±10% of plot mean). Plant materials were separated into aboveground (leaves and stems) and belowground (fine roots) compartments in the field. To avoid edge effects and sampling bias, only individuals located at least 5 cm inward from the plot boundary were selected. For each species and plot, composite samples were obtained by pooling tissues from at least three healthy individuals of comparable size and developmental stage. All plant tissues were cleaned of adhering soil, placed into pre-labeled paper bags, and transported on ice to the laboratory. Samples were then oven-dried at 65 °C to constant weight and finely ground for isotopic analysis.

2.4.2. Soil Sampling

Soil samples were collected from the same microplots using a hand auger. Two depths were sampled: 0–5 cm (surface layer) and 5–15 cm (subsurface layer), corresponding to zones of active nutrient uptake and microbial activity. Soil cores were extracted using a stainless-steel auger (2.5 cm diameter) pre-cleaned with 70% ethanol between samples to prevent cross-contamination. At each depth and time point, five soil cores were randomly extracted from the interior of each microplot and composited into a single sample per depth. In the laboratory, all soil samples were sieved through a 2-mm mesh to remove visible roots and debris. Subsamples were stored at −20 °C for 13C and 15N isotopic analysis and at 4 °C for determination of microbial and physicochemical properties.

2.5. Measurement of Biomass, Nutrient Status, and Isotopic Abundances

Dried plant tissues were weighed to determine aboveground (leaves and stems) and belowground (roots) biomass (g m−2), scaled to per-square-meter values based on the sampling area. Total nitrogen (TN), 15N natural abundance (atom%), and 13C natural abundance (atom%) were measured in finely ground plant samples (2–3 mg) using an elemental analyzer–isotope ratio mass spectrometer (EA-IRMS; DELTA V Advantage, Thermo Fisher Scientific, Munich, Germany). Isotopic values were reported as δ15N and δ13C (‰), relative to AIR and VPDB standards, respectively [15].
Air-dried soil samples were sieved to 0.15 mm prior to analysis. Soil total nitrogen (TN), 15N abundance, and 13C abundance were determined using the same EA-IRMS system. Soil organic carbon (SOC) was quantified by dry combustion using a Vario EL III elemental analyzer (Elementar Analysensysteme GmbH, Langenselbold, Germany) following acid treatment with 1 mol L−1 HCl to remove inorganic carbon.

2.6. Soil Physicochemical and Microbial Properties Analysis

Soil pH was measured in a 1:2.5 (w/v) soil-to-deionized water suspension using a glass electrode pH meter (FE28, Mettler-Toledo, Greifensee, Switzerland). Gravimetric soil moisture content (%) was determined by drying fresh soil at 105 °C for 24 h. Soil extractable ammonium (NH4+-N) and nitrate (NO3-N) were extracted with 2 mol L−1 KCl at a 1:5 soil-to-solution ratio, shaken for 1 h, and filtered through 0.45 μm membranes. Concentrations of NH4+-N and NO3-N were determined using a continuous flow analyzer (SAN++, Skalar Analytical B.V., Breda, The Netherlands).
Microbial biomass carbon (MBC) and microbial biomass nitrogen (MBN) were determined by the chloroform fumigation–extraction method [16]. Fresh soil subsamples (10 g dry weight equivalent) were fumigated with ethanol-free chloroform for 24 h in a vacuum desiccator. Both fumigated and non-fumigated samples were extracted with 0.5 mol L−1 K2SO4 (soil:solution = 1:4) and filtered. Total organic C and N in the extracts were analyzed using a TOC/TN analyzer (multi N/C 3100, Analytik Jena AG, Jena, Germany). Microbial biomass was calculated as the difference between fumigated and non-fumigated samples, with conversion factors of kC = 0.45 and kN = 0.54 [17].

2.7. Calculations and Statistical Analysis

Equation (1) was used to calculate the atom percent excess (APE), which quantifies the isotopic enrichment of 15N or 13C relative to the natural abundance background. APE serves as the foundational metric for estimating tracer-derived nitrogen or carbon assimilation in plant and soil samples (Equation (1)):
APE (%) = Atom%labeled − Atom%unlabeled
where APE (%) represents the atom percent excess of the target isotope in the labeled sample. Atom%labeled is the measured isotopic abundance in the labeled sample, and Atom%unlabeled refers to the background isotopic abundance in the corresponding unlabeled control.
Equation (2) was used to quantify plant 15N uptake (μg N m−2) by integrating tissue nitrogen concentration, isotopic enrichment, and biomass.
Plant   N 15   uptake   ( µ g   N   m 2 ) = N content   ( µ m o l g )   ×   APE plant ×   15 ( g m o l )   ×   Biomass   ( g m 2 )
where 15N uptake was calculated as the product of nitrogen content (μmol g−1), atom percent excess in plant tissue (APEplant), the molar mass of 15N (15 g mol−1), and plant biomass (g m−2).
Equation (3) was used to calculate total plant nitrogen uptake (μg N m−2) by scaling tracer-derived 15N uptake according to the atom fraction of 15N in the applied label.
Plant   N   uptake   ( µ g   N   m 2 ) = M n 15 N a d d e d × N 15   uptake
The calculation accounts for the total nitrogen added (Mn) and the enrichment level (15Nadded), enabling accurate estimation of overall nitrogen assimilation from labeled inputs.
Equation (4) was used to quantify plant 13C assimilation (μg C m−2) based on tissue carbon concentration, isotopic enrichment, and biomass.
Plant   C 13   assimilation   ( µ g   C   m 2 ) = C content   ( µ m o l g )   ×   APE plant ×   13 ( g m o l )   ×   Biomass   ( g m 2 )
where 13C assimilation was calculated as the product of carbon content (μmol g−1), atom percent excess in plant tissue (APEplant), the molar mass of 13C (13 g mol−1), and plant biomass (g m−2).
Equation (5) was used to calculate soil 15N-TN (μg N m−2) by integrating nitrogen concentration, isotopic enrichment, bulk density, and sampling depth.
Soil   N 15 - TN   ( µ g   N   m 2 ) = N content   ( µ m o l g )   ×   APE soil ×   15 ( g m o l )   ×   BD   ( g m 3 ) × SD ( m )
where the value was derived as the product of soil nitrogen content (μmol g−1), atom percent excess in soil (APEsoil), the molar mass of 15N (15 g mol−1), bulk density (g cm−3), and the depth of the sampled layer (m).
Equation (6) was used to quantify soil 13C-SOC (μg C m−2), representing the amount of tracer-derived carbon incorporated into the soil.
Soil   C 13 - SOC   ( µ g   C   m 2 ) = C content   ( µ m o l g )   ×   APE soil   ×   13 ( g m o l )   ×   BD   ( g m 3 ) × SD ( m )
The calculation was based on the product of soil carbon content (μmol g−1), atom percent excess in soil (APEsoil), the molar mass of 13C (13 g mol−1), bulk density (g cm−3), and sampling depth (m).
Data were analyzed using one-way analysis of variance (ANOVA) to assess the effects of nitrogen treatments (Control, Low-N, High-N), nitrogen forms (15NH4+ and 15NO3), and time points (TP1 and TP2) on plant biomass, nitrogen uptake, carbon assimilation, and soil physicochemical properties. Post-hoc comparisons were performed using Tukey’s HSD test to identify significant differences among treatments, nitrogen forms, and species, with significance set at p < 0.05. Multifactorial ANOVA was conducted to examine interactions among species, nitrogen treatments, nitrogen forms, soil depth, and time points on nitrogen retention and 13C assimilation in soil. Linear regression analysis was used to assess the relationships between plant biomass and nitrogen uptake, as well as 13C assimilation, with R2 and p-values reported for each model. Principal component analysis (PCA) was applied to explore the relationships among soil variables (NH4+-N, NO3-N, MBC, MBN, soil pH, and total N) across treatments and soil depths. Pearson’s correlation and Mantel’s tests were used to examine relationships between plant and soil variables. Statistical significance was determined at p < 0.05, and results were visualized in network diagrams with line width and color, indicating the strength and significance of correlations. All statistical analyses were performed using R version 4.2.1 (R Core Team, 2018) and SPSS 26.0 (IBM Corp., Armonk, NY, USA).

3. Results

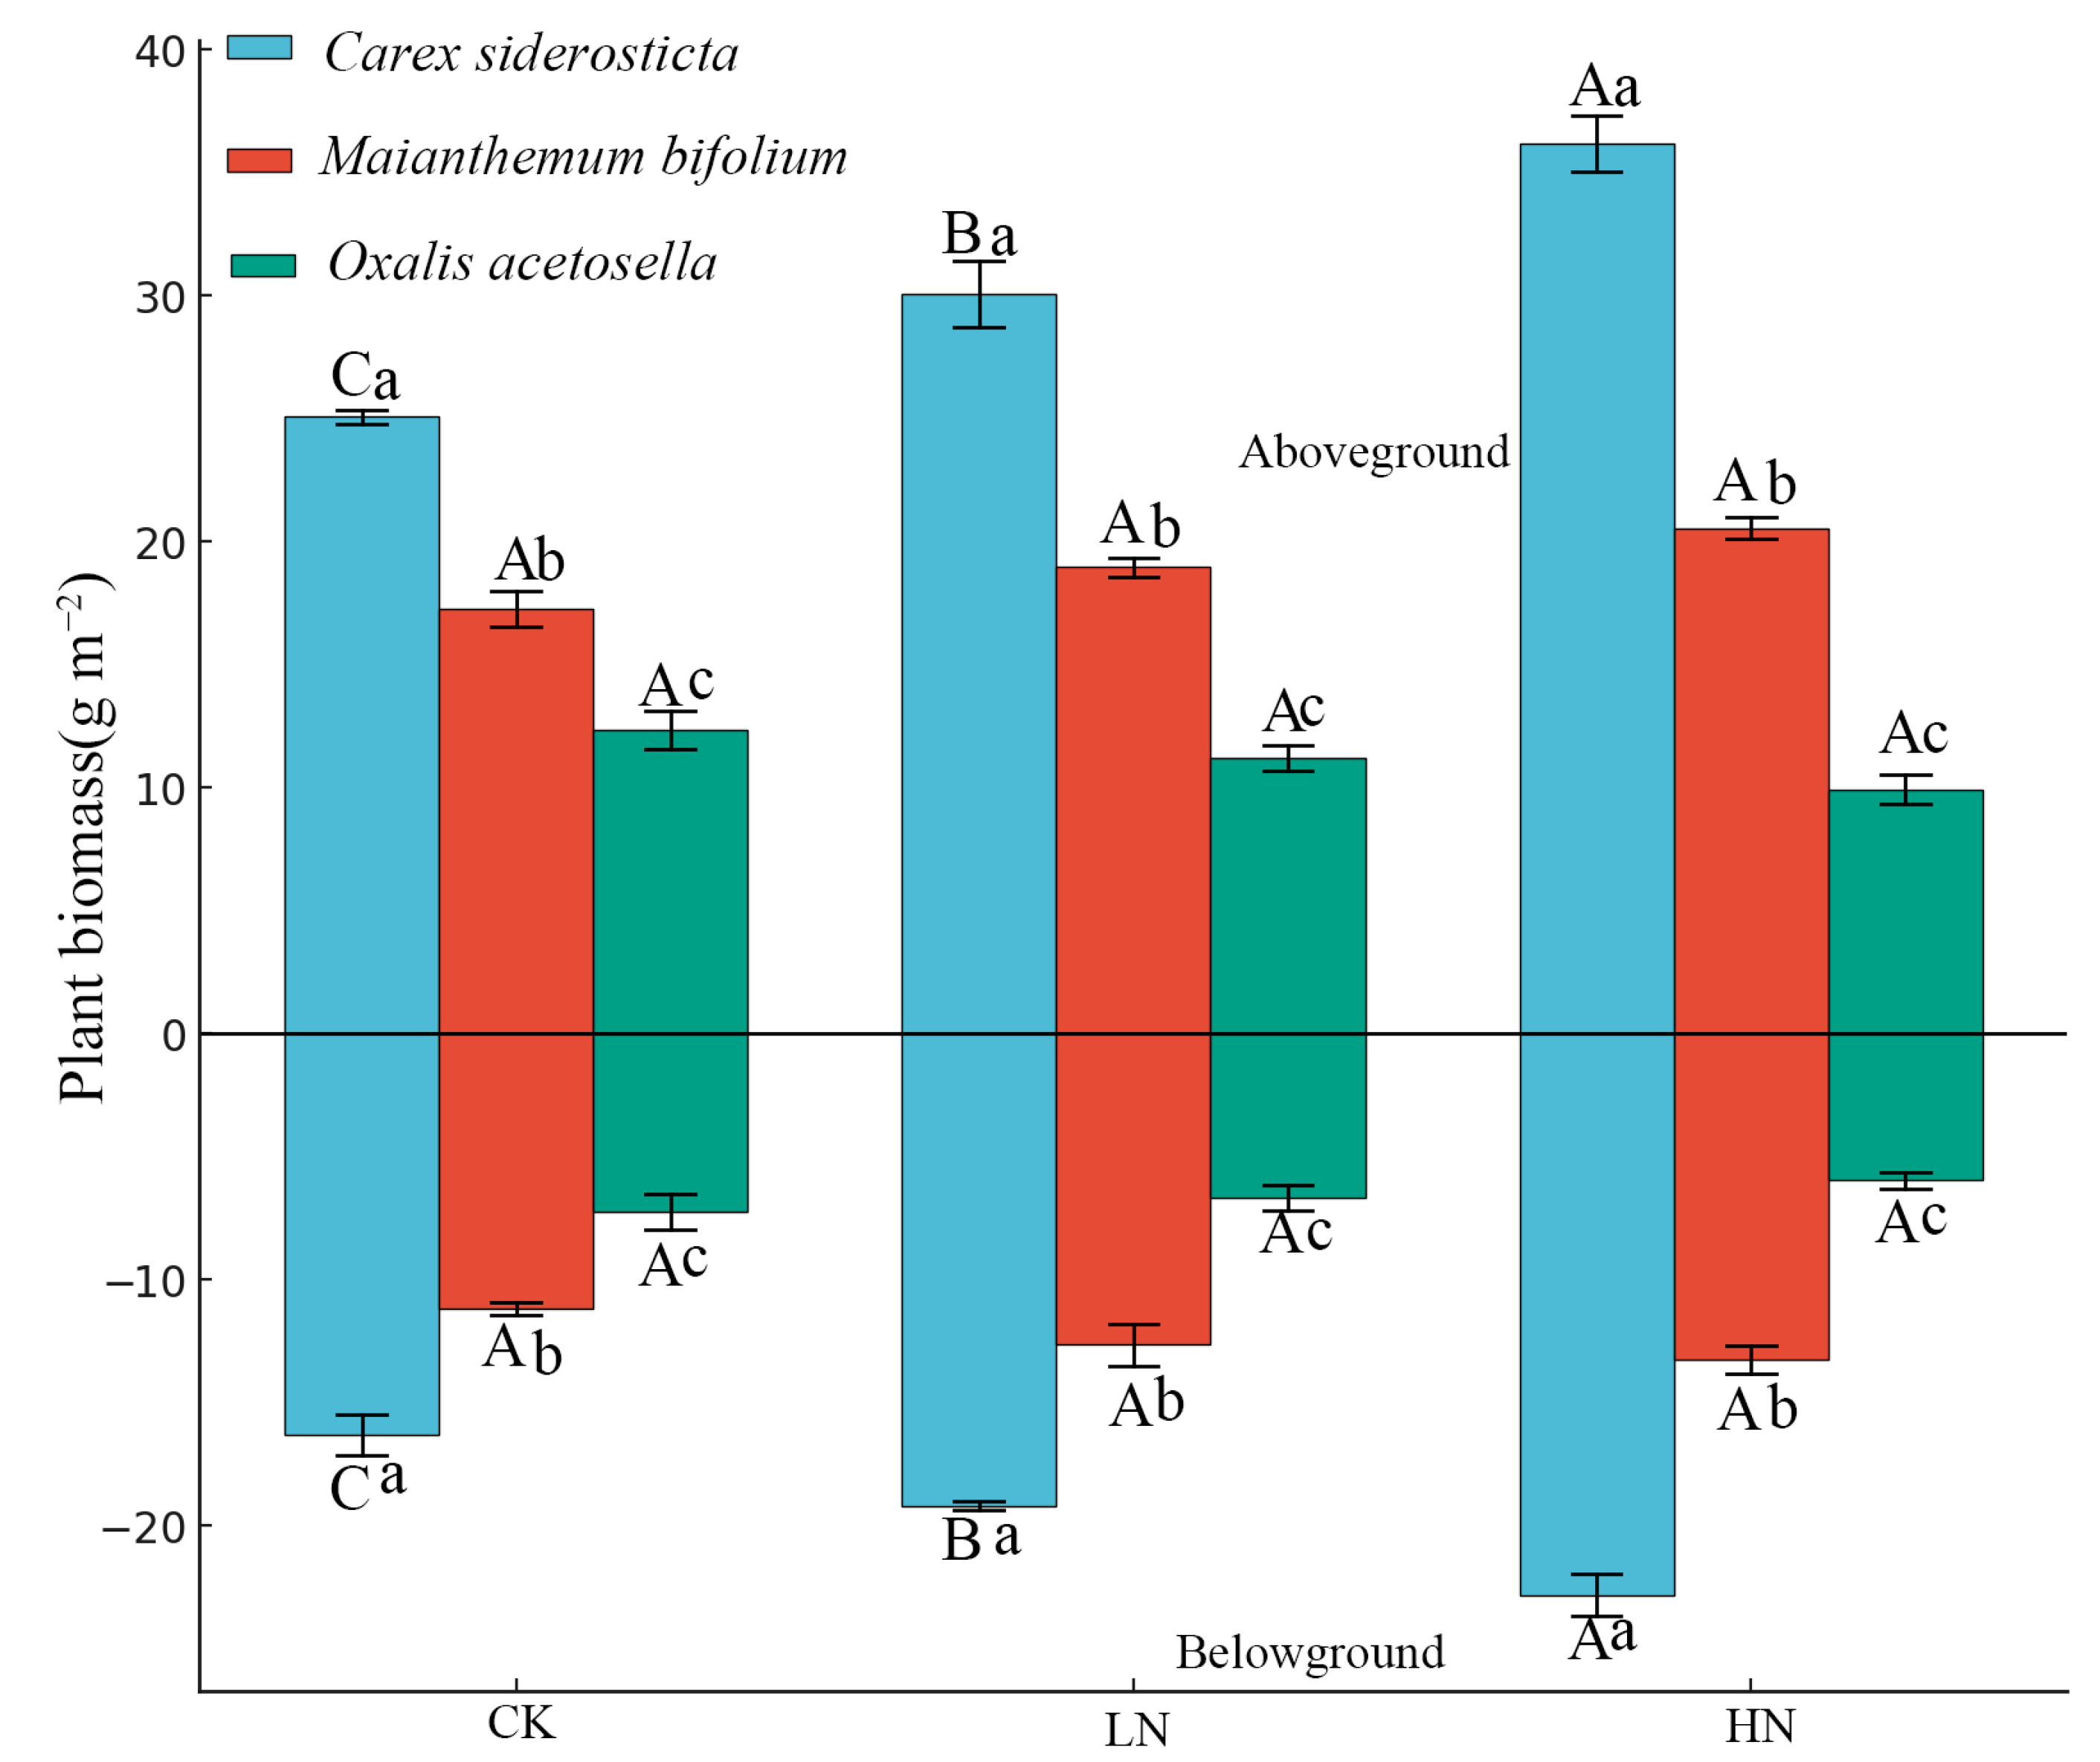
3.1. Effects of Nitrogen Addition on Plant Biomass and Soil Physicochemical Properties

Under different nitrogen treatments, significant differences in plant biomass and soil physicochemical properties were observed. C. siderosticta exhibited significantly higher aboveground and belowground biomass under the HN treatment compared to the LN and CK treatments (Figure 2). In contrast, M. bifolium and O. acetosella showed no significant differences in biomass across treatments. Soil moisture was significantly higher in the 0–5 cm depth than in the 5–15 cm depth across all treatments (Table 1). Additionally, soil pH was significantly lower in the HN treatment compared to CK and LN at both depths (Table 1). NH4+-N and NO3-N concentrations, as well as soil organic carbon (SOC) and microbial biomass carbon (MBC), were significantly higher in the HN treatment across both depths (Table 1). These results underscore the pronounced effects of nitrogen treatment, particularly high nitrogen, on both plant and soil conditions.

3.2. Nitrogen Uptake and 13C Assimilation

Nitrogen uptake and 13C assimilation were significantly affected by nitrogen treatment, time point, and species, with notable interactions observed between these factors. Nitrogen uptake was significantly higher for C. siderosticta compared to M. bifolium and O. acetosella, particularly under the HN treatment at both time points (TP1 and TP2) (Figure 3a–f). This species also exhibited significantly greater nitrogen uptake at TP2 compared to TP1 across all nitrogen treatments, with NH4+-N showing higher uptake than NO3-N in most cases (Figure 3a–f). In contrast, M. bifolium and O. acetosella showed no significant differences in nitrogen uptake between the two nitrogen forms (15NH4+ and 15NO3) at both time points (Figure 3a–f).
In terms of 13C assimilation, C. siderosticta also showed significantly higher assimilation compared to the other two species across all treatments at both TP1 and TP2 (Figure 3g–l). The highest 13C assimilation was observed under the HN treatment, particularly at TP2, where both C. siderosticta and M. bifolium displayed higher assimilation of 13C compared to O. acetosella (Figure 3g–l). No significant differences in 13C assimilation were found between nitrogen forms for M. bifolium and O. acetosella (Figure 3g–l)
Multifactorial ANOVA (Table 2) revealed that species (S), treatment (T), nitrogen form (N), time point (TP), and their interactions significantly affected nitrogen uptake and 13C assimilation. The effects of species and nitrogen treatment were the most prominent, with significant interactions between species and nitrogen treatment, as well as species and time point, particularly for nitrogen uptake and 13C assimilation in both aboveground and belowground plant parts (Table 2). Time point and nitrogen form also showed significant effects, especially for nitrogen uptake in the aboveground parts, with NH4+-N being significantly higher than NO3-N in all treatments (Table 2). These results highlight the importance of both treatment intensity and species-specific traits in regulating plant nitrogen and carbon dynamics (Table 2).

3.3. Correlation Between Plant Biomass and Nitrogen or 13CO2 Assimilation

At TP2, significant positive correlations were observed between plant biomass (both aboveground and belowground) and both nitrogen uptake and 13CO2 assimilation under all nitrogen treatments (Figure 4). Aboveground biomass showed a significant positive correlation with nitrogen uptake (p < 0.01) and 13CO2 assimilation (p < 0.01), and similar patterns were observed for belowground biomass. These correlations were consistent under all treatments, with the strongest relationships observed under HN compared to LN and CK (Figure 4).

3.4. Soil 15N-TN and 13C-SOC Content

Significant differences in soil 15N-TN and 13C-SOC content were observed across depths (0–5 cm and 5–15 cm), nitrogen treatments (CK, LN, HN), and nitrogen forms (15NH4+ and 15NO3) at both TP1 and TP2 (Figure 5). Soil 15N-TN content was consistently higher in the 0–5 cm layer, with the highest levels under HN treatment (Figure 5a–d). Additionally, 15NH4+-N showed significantly higher 15N retention than 15NO3-N across both depths and time points, particularly under the HN treatment (Figure 5a–d). At TP2, the 15N-TN content was significantly higher than at TP1 for all treatments and nitrogen forms at both depths (Figure 5a–d).
For 13C-SOC content, significantly higher values were observed in the 0–5 cm depth compared to the 5–15 cm depth, with the HN treatment showing the highest 13C-SOC content at both time points (Figure 5e–h). 13C-SOC content was significantly higher under the HN treatment than under CK and LN, particularly at TP2 (Figure 5e–h). These patterns were consistent across nitrogen forms and depths (Figure 5e–h).
Multifactorial ANOVA (Table 3) indicated significant effects of nitrogen treatment (T), nitrogen form (N), time point (TP), and soil depth (D) on soil 15N retention and 13C assimilation. The interactions between treatment and nitrogen form (T × N), treatment and time point (T × TP), and treatment and soil depth (T × D) were all significant for soil 15N retention (Table 3). Nitrogen form, treatment, and their interactions also had significant effects on soil 13C assimilation, with significant interactions between treatment, nitrogen form, and time point (T × N × TP) affecting 13C-SOC content (Table 3). These findings confirm the strong impact of nitrogen addition, especially at high levels, on soil carbon and nitrogen dynamics, modulated by both time and depth.

3.5. PCA and Pearson’s Correlation of Soil and Plant Variables

Principal component analysis (PCA) revealed that soil variables (NH4+-N, NO3-N, MBN, MBC, soil moisture, soil pH, total N, 15N-TN, and 13C-SOC) exhibited clear clustering based on nitrogen treatment, soil depth, and time point (Figure 6). The HN treatment showed distinct clustering, particularly for 0–5 cm depth, with a strong positive contribution from MBN, NO3-N, and 15N-TN. The LN and CK treatments had more overlap, but the HN treatment distinctly separated across both depths (0–5 cm and 5–15 cm) and time points (TP1 and TP2). These patterns highlight that nitrogen treatment, especially high nitrogen, has a significant influence on soil properties across time points and soil depths.
The Pearson’s correlation matrix revealed strong positive correlations between soil 15N retention and plant nitrogen uptake under HN (r = 0.95), and between 13C-SOC and soil moisture (r = 0.87) (Figure 7). Negative correlations were observed between soil pH and 13C-SOC across treatments, with significant values under CK (r = −0.69) and LN (r = −0.56) (Figure 7). These results suggest that nitrogen enrichment intensifies the coupling between soil and plant processes, particularly under high nitrogen input.

4. Discussion

4.1. Species-Specific Biomass Responses Mediated by Nitrogen-Induced Soil Property Shifts

The results indicated that nitrogen addition significantly enhanced both aboveground and belowground biomass of C. siderosticta under HN treatments, whereas no significant biomass response was detected in M. bifolium and O. acetosella (Figure 2). Simultaneously, high nitrogen input notably increased soil NH4+-N, NO3-N, soil organic carbon (SOC), and microbial biomass carbon (MBC), while significantly reducing soil pH (Table 1).
These findings suggest nitrogen enrichment disproportionately promotes biomass accumulation in species with higher resource responsiveness, specifically C. siderosticta, by altering soil chemical conditions and resource availability. This indicates a clear species-specific response to soil nutrient modification caused by nitrogen addition.
The observed differential response among species aligns with previous studies that documented similar selective enhancement of resource-acquisitive species under elevated nitrogen conditions [18,19]. The underlying cause of this phenomenon is likely attributed to C. siderosticta’s higher physiological adaptability to enriched nitrogen environments, allowing effective nitrogen uptake and efficient carbon assimilation [20]. In contrast, the negligible biomass response of M. bifolium and O. acetosella is likely due to their sensitivity to soil acidification and possibly lower adaptability to altered nutrient availability, restricting their growth under high nitrogen scenarios [21,22]. Additionally, increased microbial activity indicated by higher SOC and MBC may further facilitate nutrient cycling and availability, favoring rapid-growth species such as C. siderosticta [23,24]. Reduced soil pH might exacerbate aluminum toxicity and impair nutrient uptake in acid-sensitive plants [25,26].
These outcomes strongly support hypothesis (H1), confirming that elevated nitrogen inputs significantly improve biomass production in responsive species by modifying soil physicochemical properties. The primary mechanism driving this result is enhanced nutrient availability and microbial activity, promoting resource acquisition in highly adaptive species, coupled with adverse soil conditions such as acidification, which disproportionately impact species with lower environmental adaptability [27,28]. This differential species response reflects distinct ecological strategies and functional divergence under increased nitrogen deposition, illustrating potential shifts in plant community composition under persistent nitrogen enrichment [29].

4.2. Interactive Effects of Nitrogen Form, Timing, and Species Identity on Plant Nitrogen and Carbon Assimilation

Our results revealed significantly higher nitrogen uptake and 13C assimilation in C. siderosticta compared to M. bifolium and O. acetosella, particularly under HN conditions, with NH4+ showing superior absorption than NO3, notably at TP2 (Figure 3a–l, Table 2).
These findings suggest that nitrogen treatments, especially involving NH4+ under high nitrogen conditions, distinctly enhance nitrogen uptake and carbon assimilation in species-specific manners, highlighting C. siderosticta’s adaptive advantage.
Consistent with previous studies, our observations align with findings that NH4+ generally promotes greater plant nitrogen absorption due to more effective root uptake mechanisms compared to NO3 [30]. The primary driver of enhanced NH4+ uptake is its direct assimilation pathway and lower energetic cost, facilitating higher nutrient acquisition [31,32]. Furthermore, C. siderosticta’s superior 13C assimilation can be explained by its greater nitrogen-use efficiency and enhanced photosynthetic capacity under enriched nutrient environments [33]. Conversely, the negligible response observed in M. bifolium and O. acetosella may stem from lower physiological adaptability to increased nitrogen availability and soil acidification sensitivity, limiting nutrient uptake and assimilation efficiency [34,35].
Interestingly, although M. bifolium exhibited elevated 13C assimilation under high nitrogen conditions, this did not translate into a significant increase in biomass. This discrepancy suggests a potential decoupling between carbon assimilation and biomass allocation, which may be attributed to its shade-tolerant and clonal growth strategy that prioritizes belowground storage and resource integration over immediate aboveground expansion [36]. Similar patterns have been observed in other rhizomatous species where carbon is preferentially allocated to reserve formation or clonal spread, limiting its short-term impact on biomass accumulation [37,38]. This underscores the importance of considering species-specific allocation strategies when interpreting isotopic assimilation data.
The findings support hypothesis (H2), confirming that C. siderosticta exhibits enhanced nitrogen and carbon assimilation under NH4+ and high nitrogen conditions, particularly at later stages (TP2). The underlying ecological mechanism involves superior high-affinity ammonium transport systems and beneficial rhizosphere microbial interactions, driving persistent nutrient accumulation over time [39,40]. Understanding this species-specific nutrient response provides insights into predicting vegetation shifts and managing forest nutrient cycling under future nitrogen deposition scenarios [41].

4.3. Enhanced Coupling Between Biomass Accumulation and Nutrient Assimilation Under High Nitrogen Conditions

Our results demonstrated significant positive correlations between plant biomass (both aboveground and belowground) and nitrogen uptake or 13CO2 assimilation at TP2 under all nitrogen treatments, with stronger correlations observed under HN conditions (Figure 4, Table 2).
These findings indicate an enhanced coupling mechanism between biomass production and nutrient assimilation, particularly intensified under elevated nitrogen conditions and advanced sampling time.
This result aligns closely with previous studies highlighting stronger biomass-nutrient assimilation correlations under elevated nutrient availability scenarios [42,43]. Enhanced nitrogen availability typically promotes photosynthetic enzyme activities, thereby increasing carbon assimilation and facilitating greater biomass accumulation [44,45]. The stronger correlation under HN likely results from increased nutrient-use efficiency and carbon allocation to growth tissues in response to abundant nutrient supplies [46,47]. Moreover, higher correlations at the later stage (TP2) reflect continued nutrient assimilation and cumulative biomass growth, driven by sustained metabolic and physiological responses to nutrient enrichment [48,49]. Conversely, weaker correlations under lower nitrogen treatments could result from limited nutrient supply constraining plant metabolic potential and growth rates, thus diminishing biomass-nutrient feedback loops [50].
Our findings strongly support hypothesis H3, confirming the enhanced coupling between plant biomass and nutrient assimilation under high nitrogen and advanced sampling time conditions. The underlying ecological mechanism involves improved carbon-nitrogen utilization synergy, representing an adaptive response to nutrient enrichment, where resource availability directly drives metabolic pathways, favoring biomass accumulation [51]. These insights facilitate improved predictions regarding ecosystem responses to sustained nitrogen deposition and provide valuable guidance for managing forest productivity and carbon sequestration under changing nitrogen conditions [52].

4.4. Integrated Regulation of Soil Nitrogen and Carbon Retention by Nitrogen Form, Depth, and Temporal Dynamics

Our findings indicated significant variations in soil 15N-TN and 13C-SOC content influenced by nitrogen treatments, nitrogen forms, soil depths, and sampling times, with higher retention in surface soil (0–5 cm), particularly under HN and NH4+ conditions at TP2 (Figure 5, Table 3). PCA analysis further illustrated distinct clustering of soil variables influenced by nitrogen treatments, depth, and time, with enhanced correlations under HN conditions (Figure 6 and Figure 7).
These outcomes imply that nitrogen addition, particularly in the NH4+ form and at high levels, significantly modulates soil carbon and nitrogen dynamics, exhibiting clear depth-dependent and temporal patterns.
Our results align well with prior studies indicating surface soil’s superior nutrient retention capacity under elevated nitrogen inputs [53,54]. The mechanisms driving higher nutrient retention at the soil surface involve enhanced microbial biomass and activity, which facilitate nutrient immobilization and organic matter turnover [55]. The superior retention of NH4+ compared to NO3 occurs due to NH4+ ’s greater affinity for cation exchange sites and microbial assimilation [56]. Moreover, increased soil carbon accumulation under high nitrogen conditions can be attributed to augmented microbial growth and enzymatic activity, enhancing organic carbon stabilization [57,58]. Negative correlations between soil pH and 13C-SOC reflect intensified microbial processes and subsequent soil acidification under elevated nitrogen conditions [59].
The observed patterns strongly corroborate hypothesis (H4), confirming that nitrogen form, treatment intensity, soil depth, and sampling time interactively regulate soil nutrient retention and distribution. The underlying ecological mechanism is the integrated modulation of soil microbial activity, pH alterations, moisture dynamics, and nutrient cycling processes, thereby driving the spatial-temporal coupling of carbon and nitrogen fluxes between soil, plants, and microbes [60]. These insights are crucial for predicting ecosystem responses and managing soil nutrient dynamics under ongoing nitrogen deposition scenarios [61].

5. Conclusions

This study provides compelling evidence that nitrogen enrichment selectively enhances biomass production in resource-responsive species, particularly C. siderosticta, by significantly altering soil nutrient availability and physicochemical conditions. Furthermore, nitrogen uptake and 13C assimilation were markedly higher in C. siderosticta under high nitrogen and ammonium conditions, indicating a species-specific nutrient acquisition advantage. The coupling between plant biomass and nutrient assimilation was significantly strengthened by nitrogen addition, particularly at later stages of assimilation, highlighting a synergistic carbon–nitrogen feedback. Additionally, 15N and 13C retention in soils displayed clear spatial (0–5 cm vs. 5–15 cm) and temporal patterns, modulated by nitrogen form, treatment intensity, and soil depth. These findings collectively support all four hypotheses (H1–H4), emphasizing the integrated and dynamic responses of plant–soil systems to nitrogen enrichment.
These findings underscore the need to consider species-specific physiological strategies when evaluating ecosystem responses to nitrogen deposition. The pronounced advantage of ammonium preference and temporal accumulation in C. siderosticta suggests that nitrogen-induced shifts in plant composition may favor nutrient-acquisitive species, potentially altering competitive hierarchies and long-term biodiversity trajectories. Moreover, the depth-dependent retention of 15N and 13C highlights the need to consider vertical stratification of nutrient cycling in soil management and modeling. These insights are essential for informing forest management, carbon sequestration strategies, and policy development under ongoing anthropogenic nitrogen enrichment.
Future research should focus on disentangling species-specific carbon allocation strategies and microbial assimilation pathways under varying nitrogen regimes. In particular, elucidating the microbial mediation of 15N and 13C fluxes across rhizosphere gradients and their interactions with functional plant traits will be critical. Incorporating such mechanistic insights into ecosystem models will refine projections of nutrient–carbon feedback under accelerating nitrogen deposition and climate change.

Supplementary Materials

The following supporting information can be downloaded at: https://www.mdpi.com/article/10.3390/f16071046/s1, Table S1: Ecological characteristics of the three dominant herbaceous species selected for stable isotope labeling in the Changbai Mountain mixed forest. Table S2: Summary of baseline vegetation structure prior to isotope labeling across different nitrogen addition treatments. Shown are total plant cover, species richness, and Shannon–Wiener index for each experimental plot. Table S3: Summary of one-way ANOVA results for baseline vegetation structure across nitrogen addition treatments.

Author Contributions

M.Z. designed the study, and Y.L. got grants from the foundation, supervised data collection, and edited the manuscript. M.Z. and Y.L. contributed to the whole manuscript preparation and design and wrote the main manuscript text. All authors have read and agreed to the published version of the manuscript.

Funding

This research was supported by grants from the Researchers Supporting Project New Era Longjiang Excellent Master’s or Doctoral Dissertation Grant Program (LJYXL2023-060).

Data Availability Statement

The original contributions presented in this study are included in the article/Supplementary Material. Further inquiries can be directed to the corresponding author.

Acknowledgments

The authors gratefully appreciate the Chinese Academy of Sciences for the great cooperation in the experiment.

Conflicts of Interest

The authors declare that they have no conflicts of interest.

References

  1. Gilliam, F.S. Response of temperate forest ecosystems under decreased nitrogen deposition: Research challenges and opportunities. Forests 2021, 12, 509. [Google Scholar] [CrossRef]
  2. Lu, X.; Vitousek, P.M.; Mao, Q.; Gilliam, F.S.; Luo, Y.; Turner, B.L.; Zhou, G.; Mo, J. Nitrogen deposition accelerates soil carbon sequestration in tropical forests. Proc. Natl. Acad. Sci. USA 2021, 118, e2020790118. [Google Scholar] [CrossRef] [PubMed]
  3. Tang, B.; Rocci, K.S.; Lehmann, A.; Rillig, M.C. Nitrogen increases soil organic carbon accrual and alters its functionality. Glob. Change Biol. 2023, 29, 1971–1983. [Google Scholar] [CrossRef]
  4. Franklin, J.; Serra-Diaz, J.M.; Syphard, A.D.; Regan, H.M. Global change and terrestrial plant community dynamics. Proc. Natl. Acad. Sci. USA 2016, 113, 3725–3734. [Google Scholar] [CrossRef]
  5. Sandhu, N.; Kumar, A. Bridging the rice yield gaps under drought: QTLs, genes, and their use in breeding programs. Agronomy 2017, 7, 27. [Google Scholar] [CrossRef]
  6. Naoura, G.; Emendack, Y.; Sawadogo, N.; Djirabaye, N.; Tabo, R.; Laza, H.; Atchozou, E.A. Assessment of photoperiod sensitivity and the effect of sowing date on dry-season sorghum cultivars in southern Chad. Agronomy 2023, 13, 932. [Google Scholar] [CrossRef]
  7. Mdutyana, M.; Thomalla, S.J.; Philibert, R.; Ward, B.B.; Fawcett, S.E. The seasonal cycle of nitrogen uptake and nitrification in the Atlantic sector of the Southern Ocean. Glob. Biogeochem. Cycles 2020, 34, e2019GB006363. [Google Scholar] [CrossRef]
  8. Zakem, E.J.; Bayer, B.; Qin, W.; Santoro, A.E.; Zhang, Y.; Levine, N.M. Controls on the relative abundances and rates of nitrifying microorganisms in the ocean. Biogeosciences 2022, 19, 5401–5418. [Google Scholar] [CrossRef]
  9. Lü, X.T.; Reed, S.C.; Yu, Q.; Han, X.G. Nutrient resorption helps drive intra-specific coupling of foliar nitrogen and phosphorus under nutrient-enriched conditions. Plant Soil 2016, 398, 111–120. [Google Scholar] [CrossRef]
  10. Zou, Y.; Tang, X.; Cui, L.; Li, H.; Lei, Y.; Zhao, X.; Zhai, X.; Li, J.; Wang, J.; Wang, R.; et al. Analysis of coupled wetland soil–plant ecological stoichiometric characteristics of carbon, nitrogen, and phosphorus under different disturbance intensities. Plant Soil 2024, in press. [Google Scholar] [CrossRef]
  11. Gerber, S.; Hedin, L.O.; Oppenheimer, M.; Pacala, S.W.; Shevliakova, E. Nitrogen cycling and feedbacks in a global dynamic land model. Glob. Biogeochem. Cycles 2010, 24, GB1001. [Google Scholar] [CrossRef]
  12. Wang, W.; Li, C.; Shu, J.; Chen, W. Changes of vegetation in southern China. Sci. China Earth Sci. 2019, 62, 1316–1328. [Google Scholar] [CrossRef]
  13. Schwede, D.B.; Simpson, D.; Tan, J.; Fu, J.S.; Dentener, F.; Du, E.; deVries, W. Spatial variation of modelled total, dry and wet nitrogen deposition to forests at global scale. Environ. Pollut. 2018, 243, 1287–1301. [Google Scholar] [CrossRef] [PubMed]
  14. Zhou, J.; Ding, Y.; Tian, Y.; Xu, X.; Gunina, A. Exploring grazing intensity effects: Nitrogen uptake in grassland species and soil carbon allocation. Plant Soil 2024, 504, 833–846. [Google Scholar] [CrossRef]
  15. Xie, L.; Zhao, Y.; Wang, C.; Xu, S.; Fan, R.; Gao, H.; Xu, J.; Zhu, S.; Lei, W.; Han, S. Simultaneous determination of nitrogen content and 15N isotope abundance in plants using peak-height intensities at m/z 28 and 29. Talanta 2024, 275, 126078. [Google Scholar] [CrossRef]
  16. Mori, T.; Wang, S.; Wang, C.; Mo, J.; Zhang, W. Is microbial biomass measurement by the chloroform-fumigation extraction method biased by experimental addition of N and P? iForest Biogeosciences For. 2021, 14, 408. [Google Scholar] [CrossRef]
  17. Shibahara, F.; Inubushi, K. Measurements of microbial biomass C and N in paddy soils by the fumigation-extraction method. Soil Sci. Plant Nutr. 1995, 41, 681–689. [Google Scholar] [CrossRef]
  18. Zhang, X.; Li, B.; Peñuelas, J.; Sardans, J.; Cheng, D.; Yu, H.; Zhong, Q. Resource-acquisitive species have greater plasticity in leaf functional traits than resource-conservative species in response to nitrogen addition in subtropical China. Sci. Total Environ. 2023, 903, 166177. [Google Scholar] [CrossRef]
  19. Chen, X.; Zhang, J.; Xia, W.; Shao, Y.; Liu, Z.; Guo, J.; Qin, W.; Wan, L.; Liu, J.; Liu, Y. Influence of cover-crop root functional traits on sweet-potato yield and soil microbial communities. Microorganisms 2025, 13, 471. [Google Scholar] [CrossRef]
  20. Zhao, L.; Cui, J.; Fu, Y.; Liu, H. Specific rhizobacterial assembly enhances physiological adaptation of soil-cultivated wheat to simulated microgravity. Acta Astronaut. 2024, 223, 723–733. [Google Scholar] [CrossRef]
  21. Viancelli, A.; Michelon, W. Climate change and nitrogen dynamics: Challenges and strategies for a sustainable future. Nitrogen 2024, 5, 688–701. [Google Scholar] [CrossRef]
  22. Liu, Q.; Wan, W.; Chen, W.; Zhang, C.; Gao, H.; Zhang, J.; Sun, Z.; Li, H. Adaptation strategies of three legumes to soil phosphorus availability in steppes of Inner Mongolia. Plant Soil 2025, in press. [Google Scholar] [CrossRef]
  23. Ni, H.; Su, W.; Fan, S.; Chu, S. Intensive management practices affect rhizosphere soil properties, root growth, and nutrient uptake in Moso bamboo plantations. For. Ecol. Manag. 2021, 493, 119083. [Google Scholar] [CrossRef]
  24. Cao, D.; Wang, X.; Miao, Y.; Wu, C.; Zhang, H.; Wang, S.; Wang, F.; Chen, L.; Liang, C.; Kuzyakov, Y.; et al. Microbial strategies regulate organic-carbon accumulation in saline paddy soils: A millennium chronosequence. CATENA 2025, 252, 108869. [Google Scholar] [CrossRef]
  25. Sharma, U.C.; Datta, M.; Sharma, V. Toxicity and Tolerance. In Soil Acidity: Management Options for Higher Crop Productivity; Springer Nature: Cham, Switzerland, 2025; pp. 323–425. [Google Scholar] [CrossRef]
  26. Gemada, A.R. Soil acidity challenges to crop production in Ethiopian Highlands and management strategies for mitigation. Agric. For. Fish. 2021, 10, 245–261. [Google Scholar] [CrossRef]
  27. Revillini, D.; Gehring, C.A.; Johnson, N.C. Locally adapted mycorrhizas and rhizobacteria in plant-soil feedback systems. Funct. Ecol. 2016, 30, 1086–1098. [Google Scholar] [CrossRef]
  28. Malik, A.A.; Martiny, J.B.; Brodie, E.L.; Martiny, A.C.; Treseder, K.K.; Allison, S.D. Defining trait-based microbial strategies and their consequences for soil carbon cycling under climate change. ISME J. 2020, 14, 1–9. [Google Scholar] [CrossRef]
  29. Qiao, J.; Zuo, X.; Yue, P.; Wang, S.; Hu, Y.; Guo, X.; Li, X.; Lv, P.; Guo, A.; Sun, S. High nitrogen addition induces functional-trait divergence of plant community in a temperate desert steppe. Plant Soil 2023, 487, 133–156. [Google Scholar] [CrossRef]
  30. Peng, W.; Wang, C.D.; Wang, X.L.; Wu, Y.H.; Zhang, Y.; Sun, Y.G.; Shi, Y.; Mi, G.H. Mixed NO3− and NH4+ supply promotes growth of maize seedlings via enhanced nitrogen absorption and assimilation. J. Integr. Agric. 2023, 22, 1896–1908. [Google Scholar] [CrossRef]
  31. Hu, J.; Zheng, Q.; Neuhäuser, B.; Dong, C.; Tian, Z.; Dai, T. Superior glucose metabolism supports NH4+ assimilation in wheat to improve ammonium tolerance. Front. Plant Sci. 2024, 15, 1339105. [Google Scholar] [CrossRef]
  32. Long, D.; Lin, G.; Yan, P.; Yang, H.; Deng, K.; Guo, J. Energy distribution for N, P and C sequestration by Microcystis aeruginosa under blue and orange light. J. Environ. Chem. Eng. 2024, 12, 112054. [Google Scholar] [CrossRef]
  33. Zhang, L.; Feng, Y.; Zhao, Z.; Baoyin, B.; Cui, Z.; Wang, H.; Li, Q.; Cui, J. Macrogenomics-based analysis of intercropped soybean photosynthetic characteristics and nitrogen-assimilating enzyme activities under different nitrogen levels. Microorganisms 2024, 12, 1220. [Google Scholar] [CrossRef]
  34. Tausz-Posch, S.; Tausz, M.; Bourgault, M. Elevated [CO2] effects on crops: Advances in understanding acclimation, nitrogen dynamics and interactions with drought and other organisms. Plant Biol. 2020, 22, 38–51. [Google Scholar] [CrossRef] [PubMed]
  35. De Frenne, P.; Brunet, J.; Cougnon, M.; Decocq, G.; Graae, B.J.; Hagenblad, J.; Hermy, M.; Kolb, A.; Lemke, I.H.; Ma, S.; et al. Biological flora of the British Isles: Milium effusum. J. Ecol. 2017, 105, 839–858. [Google Scholar] [CrossRef]
  36. Goudiaby, V.; Schneider, R.; Brais, S.; Raulier, F.; Berninger, F. Competition and shade tolerance effects on carbon allocation: Insights from a carbon-balance model. Forests 2022, 13, 572. [Google Scholar] [CrossRef]
  37. Vermaat, J.E. Linking clonal growth patterns and ecophysiology to predict meadow-scale dynamics of seagrass beds. Perspect. Plant Ecol. Evol. Syst. 2009, 11, 137–155. [Google Scholar] [CrossRef]
  38. Klimešová, J.; Martínková, J. Clonal Growth, Resprouting, and Vegetative Propagation of Weeds. In Persistence Strategies of Weeds; Wiley-Blackwell: Hoboken, NJ, USA, 2022; pp. 200–218. [Google Scholar] [CrossRef]
  39. Duan, S.; Feng, G.; Limpens, E.; Bonfante, P.; Xie, X.; Zhang, L. Cross-kingdom nutrient exchange in the plant–arbuscular mycorrhizal fungus–bacterium continuum. Nat. Rev. Microbiol. 2024, 22, 773–790. [Google Scholar] [CrossRef]
  40. Moreau, D.; Bardgett, R.D.; Finlay, R.D.; Jones, D.L.; Philippot, L. A plant perspective on nitrogen cycling in the rhizosphere. Funct. Ecol. 2019, 33, 540–552. [Google Scholar] [CrossRef]
  41. González de Andrés, E. Climate–nutrient cycle interactions governing forest responses to global change: The role of mixed forests. Forests 2019, 10, 609. [Google Scholar] [CrossRef]
  42. Chandrasekaran, M. Arbuscular mycorrhizal fungi enhance biomass, root morphological traits and nutrient uptake under drought stress: A meta-analysis. J. Fungi 2022, 8, 660. [Google Scholar] [CrossRef]
  43. Paré, D.; Thiffault, E. Nutrient budgets in forests under increased biomass-harvesting scenarios. Curr. For. Rep. 2016, 2, 81–91. [Google Scholar] [CrossRef]
  44. Iqbal, A.; Dong, Q.; Wang, X.; Gui, H.; Zhang, H.; Zhang, X.; Song, M. High nitrogen enhances drought tolerance in cotton via antioxidant enzymes, nitrogen metabolism and osmotic adjustment. Plants 2020, 9, 178. [Google Scholar] [CrossRef] [PubMed]
  45. Foyer, C.H.; Noctor, G.; Hodges, M. Respiration and nitrogen assimilation: Targeting mitochondria-associated metabolism to enhance nitrogen-use efficiency. J. Exp. Bot. 2011, 62, 1467–1482. [Google Scholar] [CrossRef]
  46. Zhang, L.; Zhou, X.; Li, G.; Liu, F. Elevated CO2 modulates carbon assimilation and leaf water-use efficiency of Nicotiana tabacum under patchy soil-nutrient deficiency. Ind. Crops Prod. 2021, 166, 113500. [Google Scholar] [CrossRef]
  47. Dalling, J.W.; Flores, M.R.; Heineman, K.D. Wood nutrients: Under-explored traits with functional and biogeochemical consequences. New Phytol. 2024, 244, 1694–1708. [Google Scholar] [CrossRef]
  48. Ding, D.; Liu, M.; Arif, M.; Yuan, Z.; Li, J.; Hu, X.; Zheng, J.; Li, C. Ecological stoichiometry (C:N:P) responses to periodic submergence in mega-reservoirs: Growth of Taxodium distichum and Taxodium ascendens. Plants 2021, 10, 2040. [Google Scholar] [CrossRef]
  49. Wipf, H.M.L.; Xu, L.; Gao, C.; Spinner, H.B.; Taylor, J.; Lemaux, P.; Mitchell, J.; Coleman-Derr, D. Agricultural soil management practices differentially shape bacterial and fungal microbiomes of Sorghum bicolor. Appl. Environ. Microbiol. 2021, 87, e02345-20. [Google Scholar] [CrossRef]
  50. Broadbent, E.N.; Almeyda Zambrano, A.M.; Asner, G.P.; Soriano, M.; Field, C.B.; de Souza, H.R.; Peña-Claros, M.; Adams, R.I.; Dirzo, R.; Giles, L. Foliar nutrient dynamics during forest succession following slash-and-burn agriculture in the Bolivian Amazon. PLoS ONE 2014, 9, e86042. [Google Scholar] [CrossRef]
  51. Yu, F.; Zhang, W.; Hou, X.; Li, Y.; Tong, J. Nutrient loads influence microbial-derived carbon accumulation in wetlands: Insights from microbial metabolic-investment strategies. Environ. Res. 2023, 217, 114981. [Google Scholar] [CrossRef]
  52. Schulte-Uebbing, L.; de Vries, W. Global-scale impacts of nitrogen deposition on tree carbon sequestration in tropical, temperate and boreal forests: A meta-analysis. Glob. Change Biol. 2018, 24, e416–e431. [Google Scholar] [CrossRef]
  53. Zheng, H.; Wang, Z.; Deng, X.; Herbert, S.; Xing, B. Biochar addition enhances nitrogen retention and bioavailability in agricultural soil. Geoderma 2013, 206, 32–39. [Google Scholar] [CrossRef]
  54. Yadav, M.R.; Kumar, R.; Parihar, C.M.; Yadav, R.K.; Jat, S.L.; Ram, H.; Meena, R.K.; Singh, M.; Verma, A.P.; Kumar, U.J.A.R.; et al. Strategies for improving nitrogen-use efficiency: A review. Agric. Rev. 2017, 38, 29–40. [Google Scholar] [CrossRef]
  55. Li, Z.; Zeng, Z.; Song, Z.; Wang, F.; Tian, D.; Mi, W.; Huang, X.; Wang, J.; Song, L.; Yang, Z.; et al. Vital roles of soil microbes in driving terrestrial nitrogen immobilization. Glob. Change Biol. 2021, 27, 1848–1858. [Google Scholar] [CrossRef] [PubMed]
  56. Huang, F.; Graham, N.J.D.; Su, Z.; Xu, L.; Yu, W. Decomposition of natural organic matter by biofiltration: Capabilities of microbial consortia from disparate matrices. Water Res. 2024, 262, 122047. [Google Scholar] [CrossRef]
  57. Meng, D.; Cheng, H.; Shao, Y.; Luo, M.; Xu, D.; Liu, Z.; Ma, L. Effects of nitrogen on transformation of soil organic carbon: Progress and perspectives. Processes 2022, 10, 2425. [Google Scholar] [CrossRef]
  58. Ye, R.; Parajuli, B.; Sigua, G. Subsurface clay-soil application improves aggregate stability, nitrogen availability and organic-carbon preservation in degraded ultisols with cover-crop mixtures. Soil Sci. Soc. Am. J. 2019, 83, 597–604. [Google Scholar] [CrossRef]
  59. Long, C.; Liu, Z.; Liu, R.; Yin, L.; Tan, F.; Wang, Y.; He, G. Disparities in soil microbial CO2-fixation rates under different vegetation at an acidic red-soil experimental station in China. Front. Microbiol. 2024, 15, 1480484. [Google Scholar] [CrossRef]
  60. Xing, Y.; Zhang, X.; Wang, X. Water-fertilizer coupling technology enhances soil health and crop yields. Front. Sustain. Food Syst. 2024, 8, 1494819. [Google Scholar] [CrossRef]
  61. Tipping, E.; Davies, J.A.C.; Henrys, P.A.; Kirk, G.J.; Lilly, A.; Dragosits, U.; Carnell, E.J.; Dore, A.J.; Sutton, M.A.; Tomlinson, S.J. Long-term increases in soil carbon driven by ecosystem fertilization from atmospheric nitrogen deposition: Evidence from modelling and observations. Sci. Rep. 2017, 7, 1890. [Google Scholar] [CrossRef]
Figure 1. Experimental design for nitrogen addition and labeling in temperate forest. (A) Study site; (B) Plot setup; (C) Labeling experiment design.
Forests 16 01046 g001
Figure 2. Plant biomass of three species under different nitrogen treatments. CK represents the control treatment, LN represents the Low-N (2.5 g N m−2 yr−1), and HN represents the High-N (5.0 g N m−2 yr−1). Different capital letters indicate significant differences among different treatments for the same species, while different lowercase letters denote statistically significant differences among different species under the same treatment. A significant difference is indicated when p < 0.05.
Forests 16 01046 g002
Figure 3. Nitrogen uptake (af) and 13C assimilation (gl) in Carex siderosticta, Maianthemum bifolium, and Oxalis acetosella under three nitrogen treatments (CK, LN, HN) and two nitrogen forms (15NH4+ and 15NO3) at two time points (TP1 and TP2). CK represents the control treatment, LN represents the Low-N (2.5 g N m−2 yr−1), HN represents the High-N (5.0 g N m−2 yr−1). Different capital letters indicate significant differences among different treatments for the same N form, while different lowercase letters denote statistically significant differences between different N forms under the same treatment. A significant difference is indicated when p < 0.05.
Forests 16 01046 g003
Figure 4. Correlation between above- and belowground plant biomass and uptake of N (a,b) or 13CO2 assimilation (c,d) by plants of three nitrogen treatments at TP2. CK represents the control treatment, LN represents the Low-N (2.5 g N m−2 yr−1), and HN represents the High-N (5.0 g N m−2 yr−1).
Forests 16 01046 g004
Figure 5. Soil 15N-TN (ad) and 13C-SOC (eh) content at different soil depths (0–5 cm, 5–15 cm) and time points (TP1 and TP2) under three nitrogen treatments (CK, LN, HN) and two nitrogen forms (15NH4+ and 15NO3). CK represents the control treatment, LN represents the Low-N (2.5 g N m−2 yr−1), and HN represents the High-N (5.0 g N m−2 yr−1). Different capital letters indicate significant differences among nitrogen treatments for the same soil depth, while different lowercase letters denote significant differences between nitrogen forms within the same treatment. A significant difference is indicated when p < 0.05.
Forests 16 01046 g005
Figure 6. Principal component analysis (PCA) of a set of soil variables (NH4+-N, NO3-N, MBN, MBC, soil moisture, soil pH, total N, 15N-TN, and 13C-SOC) at two soil depths (0–5 and 5–15 cm) and time points (TP1 and TP2) under three nitrogen treatments. CK represents the control treatment, LN represents the Low-N (2.5 g N m−2 yr−1), and HN represents the High-N (5.0 g N m−2 yr−1).
Forests 16 01046 g006
Figure 7. Correlation matrix showing Pearson’s r values for various soil and plant variables under three nitrogen treatments. Mantel’s r and p-values are also shown, with thicker orange lines indicating significant correlations (p < 0.01). Positive correlations are shown in blue and negative correlations in red, with the intensity of the color representing the strength of the correlation. Significant correlations between variables are indicated when Mantel’s p < 0.05. CK represents the control treatment, LN represents the Low-N (2.5 g N m−2 yr−1), and HN represents the High-N (5.0 g N m−2 yr−1).
Forests 16 01046 g007
Table 1. The physicochemical properties of the soil at depths of 0–5 cm and 5–15 cm under different treatments.
IndexCKLNHN
0–5 cm5–15 cm0–5 cm5–15 cm0–5 cm5–15 cm
Soil Moisture (%)31.46 ± 0.62 Ab35.27 ± 0.67 Aa29.68 ± 0.59 Bb33.59 ± 0.65 Ba27.92 ± 0.56 Cb31.72 ± 0.62 Ca
Soil pH5.81 ± 0.04 Ab6.01 ± 0.05 Aa5.51 ± 0.04 Bb5.71 ± 0.04 Ba5.38 ± 0.04 Ba5.51 ± 0.04 Ca
NH4+-N (µg Ng−1 Soil)10.23 ± 0.38 Ca8.69 ± 0.33 Cb14.76 ± 0.55 Ba12.48 ± 0.47 Bb18.99 ± 0.71 Aa16.11 ± 0.61 Ab
NO3-N (µg Ng−1 Soil)4.12 ± 0.15 Ca3.29 ± 0.12 Cb6.53 ± 0.25 Ba5.18 ± 0.19 Bb9.44 ± 0.36 Aa7.54 ± 0.29 Ab
Total N (µmol N g−1)477.75 ± 18.11 Ba401.51 ± 15.24 Bb603.01 ± 22.82 Aa506.11 ± 19.18 Ab630.08 ± 23.89 Aa531.00 ± 20.01 Ab
SOC (µmol C g−1)9303.01 ± 279.11 Ba8373.03 ± 251.35 Bb10103.10 ± 302.99 Aa9067.05 ± 272.24 Ab10496.23 ± 314.86 Aa9446.12 ± 283.63 Ab
MBN (µg N g−1 Soil)216.11 ± 8.43 Ca176.01 ± 6.84 Cb258.21 ± 10.09 Ba205.06 ± 8.02 Bb288.06 ± 11.23 Aa228.07 ± 8.87 Ab
MBC (µg C g−1 Soil)1315.21 ± 52.61 Ba1189.02 ± 47.56 Cb1512.01 ± 60.48 Aa1369.11 ± 54.68 Bb1673.22 ± 66.99 Aa1534.01 ± 61.55 Ab
Notes: CK represents the control, LN represents the low nitrogen (2.5 g N m−2 yr−1), and HN represents the high nitrogen (5.0 g N m−2 yr−1). Capital letters show significant differences between three different treatments at p < 0.05 levels. Lowercase letters indicate significant differences between soil depths at p < 0.05 levels.
Table 2. Multifactor analysis of variance on the effects of species, treatment, nitrogen labeling forms, time point, and their interactions on plant above- and belowground N uptake and 13C assimilation.
Source of VariationDfAboveground Plant N UptakeBelowground Plant N UptakeAboveground Plant 13C AssimilationBelowground Plant 13C Assimilation
S2<0.001 ***<0.001 ***<0.001 ***<0.001 ***
T2<0.001 ***<0.001 ***<0.001 ***<0.001 ***
N1<0.001 ***<0.001 ***<0.001 ***<0.001 ***
TP1<0.001 ***<0.01 **<0.001 ***<0.001 ***
S × T4<0.001 ***<0.001 ***<0.001 ***<0.001 ***
S × N2<0.001 ***<0.001 ***<0.001 ***<0.05 *
S × TP2<0.05 *NS<0.001 ***<0.001 ***
T × N2<0.001 ***<0.001 ***<0.01 **NS
T × TP2NSNS<0.001 ***<0.001 ***
N × TP1NSNS<0.001 ***<0.001 ***
S × T × N4<0.001 ***NS<0.05 *<0.05 *
S × T × TP4NS<0.001 ***<0.001 ***<0.001 ***
S × N × TP2NSNSNSNS
T × N × TP2NSNSNSNS
S × T × N × TP4NSNSNSNS
Notes: * p < 0.05, ** p < 0.01, *** p < 0.001, NS represents not significant. Shown are degrees of freedom (df) and the p-value of the respective variables and the model itself. S represents the species (Carex siderosticta, Maianthemum bifolium, and Oxalis acetosella); T represents the treatments (CK represents the control, LN represents the N addition with 2.5 g N m−2 yr−1, HN represents the N addition with 5.0 g N m−2 yr−1); N represents the nitrogen labeling forms (15NH4Cl and K15NO3); TP represents the post-labeling time points (24 h after post-labeling and 72 h after post-labeling).
Table 3. Multifactor analysis of variance on the effects of treatment, nitrogen labeling forms, time point, soil depth, and their interactions on soil 15N retention and 13C assimilation.
Source of VariationDfSoil 15N RetentionSoil 13C Assimilation
T2<0.001 ***<0.05 *
N1<0.05 *NS
TP1<0.001 ***NS
D1NS<0.001 ***
T × N2<0.001 ***NS
T × TP2<0.001 ***NS
T × D2<0.001 ***<0.001 ***
N × TP1<0.001 ***NS
N × D1NSNS
TP × D1<0.05 *<0.001 ***
T × N × TP2NSNS
T × N × D2NSNS
T × TP × D2NSNS
N × TP × D1NSNS
T × N × TP × D2NSNS
Notes: * p < 0.05, *** p < 0.001, NS represents not significant. Shown are degrees of freedom (df) and the p value of the respective variables and the model itself. T represents the treatments (CK represents the control, LN represents the N addition with 2.5 g N m−2 yr−1, HN represents the N addition with 5.0 g N m−2 yr−1); N represents the nitrogen labeling forms (15NH4Cl and K15NO3); TP represents the post-labeling time points (24 h after post-labeling and 72 h after post-labeling); D represents the soil depth (0–5 cm and 5–15 cm).
Disclaimer/Publisher’s Note: The statements, opinions and data contained in all publications are solely those of the individual author(s) and contributor(s) and not of MDPI and/or the editor(s). MDPI and/or the editor(s) disclaim responsibility for any injury to people or property resulting from any ideas, methods, instructions or products referred to in the content.

