Article

Assessing the Sustainability of Timber Production Under Policy-Driven Logging: A Spatial Analysis from Southwestern Japan

1
Department of Forest Management, Forestry and Forest Products Research Institute, 1 Matsunosato, Tsukuba 305-8687, Japan
2
Department of Forest Policy and Economics, Forestry and Forest Products Research Institute, 1 Matsunosato, Tsukuba 305-8687, Japan
3
Shikoku Research Center, Forestry and Forest Products Research Institute, 2-915 Asakuranishi, Kochi 780-8077, Japan
4
Department of Disaster Prevention, Meteorology and Hydrology, Forestry and Forest Products Research Institute, 1 Matsunosato, Tsukuba 305-8687, Japan
*
Author to whom correspondence should be addressed.
Forests 2025, 16(6), 989; https://doi.org/10.3390/f16060989
Submission received: 15 May 2025 / Revised: 6 June 2025 / Accepted: 10 June 2025 / Published: 11 June 2025
(This article belongs to the Topic Nature-Based Solutions-2nd Edition)

Abstract

:
Promoting nature-positive forestry requires sustainable timber production that aligns with ecosystem service (ES) conservation. However, Japan’s recently implemented top-down timber production policy may undermine sustainability in local forest landscapes. We assessed the spatial sustainability of plantation forestry by comparing actual logged areas (2000–2019) with allowable logging areas. Logged areas were identified using satellite imagery analysis, while allowable logging areas were estimated by excluding forests at high risk of landslides or with unclear ownership and dividing the remaining area by the standard logged age. While total logged area remained below the experience-based sustainable threshold, logging in profitable forests exceeded allowable levels in recent years. Forests with higher profitability experienced concentrated logging after 2015, indicating the strong influence of the national policy. This spatial imbalance threatens long-term sustainability by depleting productive forest patches while ignoring underutilized unprofitable forests. Our findings demonstrate the risks of uniform, production-oriented policies and highlight the need for adaptive, locally responsive forest governance. By integrating ecological and social constraints into spatial analysis, this study proposes a new sustainability measurement in line with nature-based solutions. Future forest policy must incorporate local knowledge and participatory decision-making to sustain forest ESs and timber supply under changing social and environmental conditions.

1. Introduction

In recent years, there has been a notable increase in the focus on nature-based solutions (NbS), which are seen as a means of addressing environmental issues while simultaneously promoting biodiversity and human well-being [1,2]. The necessity of establishing clear pathways for the successful implementation and scaling of NbS is required broadly [3]. Since forests are major providers of ecosystem services (ESs) [4,5], appropriate forest management plays a crucial role in balancing biodiversity conservation and social benefits, which are essential for realizing NbS [6]. Among forest ESs, timber production is particularly significant, not only as a key provisioning service but also for its broader ecological and economic implications [7]. The regulation of timber harvesting, therefore, has a profound impact on both the availability of timber and the maintenance of forest ecosystems, influencing the long-term sustainability of forest NbS [8,9,10].
The Japanese government has been promoting timber production in the abundant coniferous forests that were intensively planted in the 1960s. To revitalize the forestry industry, it has introduced high-performance forestry machinery, encouraged the establishment of an efficient supply chain for the harvested wood products, and invested in human resource development [11]. This policy is aimed at establishing a cyclical forestry system that involves planting, thinning, and clear-cutting, particularly in low-slope areas and in areas near roads where high-performance machinery can be used efficiently. As a result, the total logged area and national timber supply have increased, and the rate of lumber self-sufficiency has reached the highest level in decades [12].
In response to the rapid increase in timber production, concerns have been raised about the sustainability of timber supplies. Central government policies, which often overlook local conditions, may lead to excessive logging and consequent resource shortages in local forests [13,14]. Although these concerns spurred initiatives to promote reforestation after logging, forests require a long maturation period before they can be harvested. With the government’s recommendation of a harvesting age of 40 years [11], any imbalance between the pace of logging and the rate of forest maturation could disrupt the stability of timber supply. Such disruptions threaten the viability of forestry enterprises and lumber companies, ultimately weakening the local forestry industry [15]. Therefore, if central policies harm local sustainability, scientific validation and timely warnings are essential.
When assessing the sustainability of timber production, we must consider the effect on other ESs [16,17]. Although logging may have positive effects on forest ecosystems in certain contexts [18], it often causes harms by altering forest structures. For instance, logging can reduce the retention strength of the root systems that help prevent shallow landslides on steep slopes [19]. Such economic activities that lack social responsibility and fail to contribute to a nature-positive society should be discouraged [20]. To ensure the continuous provision of various forest ESs, trade-offs among these services must be carefully managed [21]. Consequently, sustainability assessments should be conducted under the assumption that areas critical for sustaining other ESs are excluded from timber production.
A critical question is which forest types have been logged? Previous studies have shown that forests with higher profitability are more likely to be logged [22,23]. Selective logging of these highly profitable areas may result in a landscape dominated by remaining mature forests with lower profitability. Consequently, the economic benefits derived from timber production could be diminished, ultimately undermining the long-term sustainability of the forestry sector. Yamada and Fukumoto [24] analyzed logging trends in Japan using satellite imagery and revealed that logging occurs predominantly in forests with gentle slopes and in areas adjacent to roads. Furthermore, the spatial bias in logging varies significantly among regions [24]. Thus, incorporating local spatial logging patterns into sustainability assessment is imperative, as it enables a more comprehensive evaluation of the economic viability of timber production. This study focuses on the municipal scale where spatial logging tendencies are generally homogeneous [25].
Evaluating the sustainability of timber production requires a simultaneous consideration of both the spatial distribution of logging—an indicator of economic efficiency—and the risk of losing critical ESs. Owing to the rapid increase in timber production brought about by the policy, there is an urgent need to properly assess the sustainability of the ES supply. Here, the objective of this study is to reveal the impacts of the timber production promotion policy by the central government on local ES sustainability. We examined the local sustainability of timber production by comparing actual logging areas with the estimated annual allowable logging area that accounts for forestry profitability and ES preservation. We estimated this allowable area—the maximum area that can be logged annually without impairing the provision of ecosystem services—and then compared it with actual logged areas. Forest land was categorized into groups based on profitability, and the sustainability of each group was verified. Through these analyses, we quantified the impact of top-down policies aimed at increasing timber production and the associated risk of depleting local forest resources.
First, we identified the locations of logged forests through satellite image analysis and created a logging sites dataset for each 5-year period from 2000 to 2019 to visualize the impact of increased timber production. Next, we developed a profitability map of the study area and classified forest lands by their economic viability. For each classified group, we calculated the area of forests with a high risk of shallow landslides and other reasons that hinder harvest, considering these unsuitable for timber production. The annual allowable logging area was then estimated by dividing the timber production area by a standard harvest period, which was based on the time required for forests to mature or reach the typical logged age in the study area. Finally, the actual logged area was compared with the estimated allowable logging area. If the actual logged area exceeds the allowable area, local sustainability is likely to be in jeopardy.

2. Materials and Methods

2.1. Study Area

This study focuses on the municipality level because spatial logging patterns have been shown to differ by region [25]. The study area comprises plantation forests owned by small-scaled forest owners in Saiki municipality, Oita Prefecture, in southwestern Japan (Figure 1). Covering a total area of 90,314 ha, of which 78,757 ha is forested, this region is predominantly mountainous, where forested areas have a mean slope of 23.9°. With the exception of urban and agricultural areas, nearly the entire study area is mountainous. The region is dominated by plantations of Japanese cedar (Cryptomeria japonica), Japanese cypress (Chamaecyparis obtusa), and red pine (Pinus densiflora), along with patches of deciduous broad-leaved forests, such as those dominated by sawtooth oak (Quercus acutissima). Within this region, 82% of the forested area is privately owned; notably, 60% of forest owners have <1 ha each. Forestry is a major industry in the region. Government policy and subsidies have led to a significant increase in high-performance forestry machinery, such as harvesters and forwarders, resulting in a rise in clear-cut timber production in recent years. There are no strong governmental regulations on logging in the study area, particularly for privately owned forest.
The locations of the study area were identified from a forest GIS map maintained by the local government. A digital elevation model was generated from aerial laser scanning data provided by Oita prefecture. The data were reprojected and resampled at a resolution of 30 m × 30 m, matching the resolution of the Landsat satellite imagery used to extract the logging sites.

2.2. Logging Locations

Forests logged between 2000 and 2019 were identified by using country-wide harvest mapping data published by Shimizu and Saito [26], which detects forest changes by analyzing time-series trends in spectral responses with a random forest model applied to annual Landsat image composites in Google Earth Engine platform [27,28]. On the basis of this logging location dataset, the study area was classified into areas logged in 2000–2004, 2005–2009, 2010–2014, 2015–2019 or never.

2.3. Profitability Analysis

The profitability of each forest cell was estimated from net income, incorporating the hypothetical benefits and costs associated with forestry operations from replantation to harvest. We assumed a sequential operational scheme, as outlined in Table A1, which was based on interviews with local forestry companies. These operations were defined solely to evaluate the relative profitability of each forest parcel; consequently, the logging age used in this analysis does not correspond to the standard logging age defined later.
Tree height was estimated as a function of forest age [29] as:
Tree height = 27.47 × (1 − exp(−0.03 × Age)),
To estimate both diameter at breast height (DBH) and tree volume, we used a stand density control diagram—a set of calculation formulas that derive tree dimensions from tree height and stand density [30]. The parameters used in Equation (1) were derived from statistical analyses of survey data on even-aged plantation forests in the Kyushu region, which includes our study area. Thus, the equation is appropriate for assessing forest growth under local conditions; however, its applicability may be limited in areas with different forest types or management practices [29,30]. To simplify the calculation, we ignored the spatial distribution of the forest biomass productivity.
The cost of each operation was estimated from tree dimensions and spatial variables using published equations and parameters [31]. The costs, which cover labor, machinery, and materials, tend to be higher in forests located further from roads (Table A1). Furthermore, the study area was classified into six groups based on annual net income: (1) <0 JPY, (2) 0–10,000 JPY, (3) 10,000–20,000 JPY, (4) 20,000–30,000 JPY, and (5) >30,000 JPY.

2.4. Landslide Risk Analysis

Forest root systems enhance the frictional forces with the soil, thereby helping to prevent shallow landslides [19,32]. This service is especially critical in areas with steep slopes or complex terrain, where landslides are more likely to occur [33]. We evaluated the landslide risk of each forest cell against an assessment chart published by the Japan Forestry Agency [34]. This chart, which evaluates hazard risk on the basis of geology, topography, soil depth, and forest age, was created with expert knowledge and Hayashi’s Quantification Method-II. Each forest cell was scored according to its spatial features (Table A2) and classified as a high-risk area when the score was >125. We excluded high-risk areas from our sustainability calculations because logging should be avoided in such areas [32,35].

2.5. Other Areas to Be Excluded

Even within plantation forests, some areas are no longer managed for timber production owing to changes in social factors or the owners’ intentions [36,37]. Such areas should also be excluded from the sustainability calculation. However, it is nearly impossible to identify the locations of abandoned plantation forests, because no comprehensive data exist. Therefore, we estimated the area where clear ownership is not established. Unclear ownerships often result from omissions during the registration process at the time of inheritance, for example, and represent an important social issue in Japan [38]. The Ministry of Land, Infrastructure, Transport and Tourism of Japan has reported the area ratio of forests with unclear ownership as 28.2% [39], so we used this value in our calculations.

2.6. Sustainability Analysis

We analyzed the sustainability of timber production in the study area excluding areas with landslide risk and unidentified ownership as:
R = (1L) × (1O)/A
where R is the annual allowable logging area ratio, L is the ratio of forest area with a high risk of shallow landslide, O is the ratio of forest area with unclear ownership, and A is the standard logging age. R was calculated by excluding the ratios of forests with high landslide risk (L) and unclear ownership (O) from the total forest area, representing the proportion of land suitable for sustainable timber production. We assessed the sustainability of timber production by comparing the actual logged area with the estimated annual allowable logging area (Equation (2)). Cyclical forestry was assumed as the baseline concept to define sustainable harvesting. The annual allowable logging area was thus calculated as the area of forest available for timber production—excluding zones with landslide risk or with unclear ownership—divided by the standard logging age.
We used two types of standard logging age. The first was defined by the local forest owners’ association as 50 years, based on their experience and general tree growth rates. The allowable logging area estimated under this value is referred to as the Annual Allowable Logging Area based on Experience (AAE).
The second type was determined by analyzing changes in the forest age–class distribution between 2015 and 2020. The decreasing area of forests over >40 years old during this period could be considered as logged area. The weighted average of the logged age was taken as the typical logged age, and the corresponding allowable area was referred to as Annual Allowable Logging Area based on Logged Age Distribution (AAL).

3. Results

3.1. Logged Locations

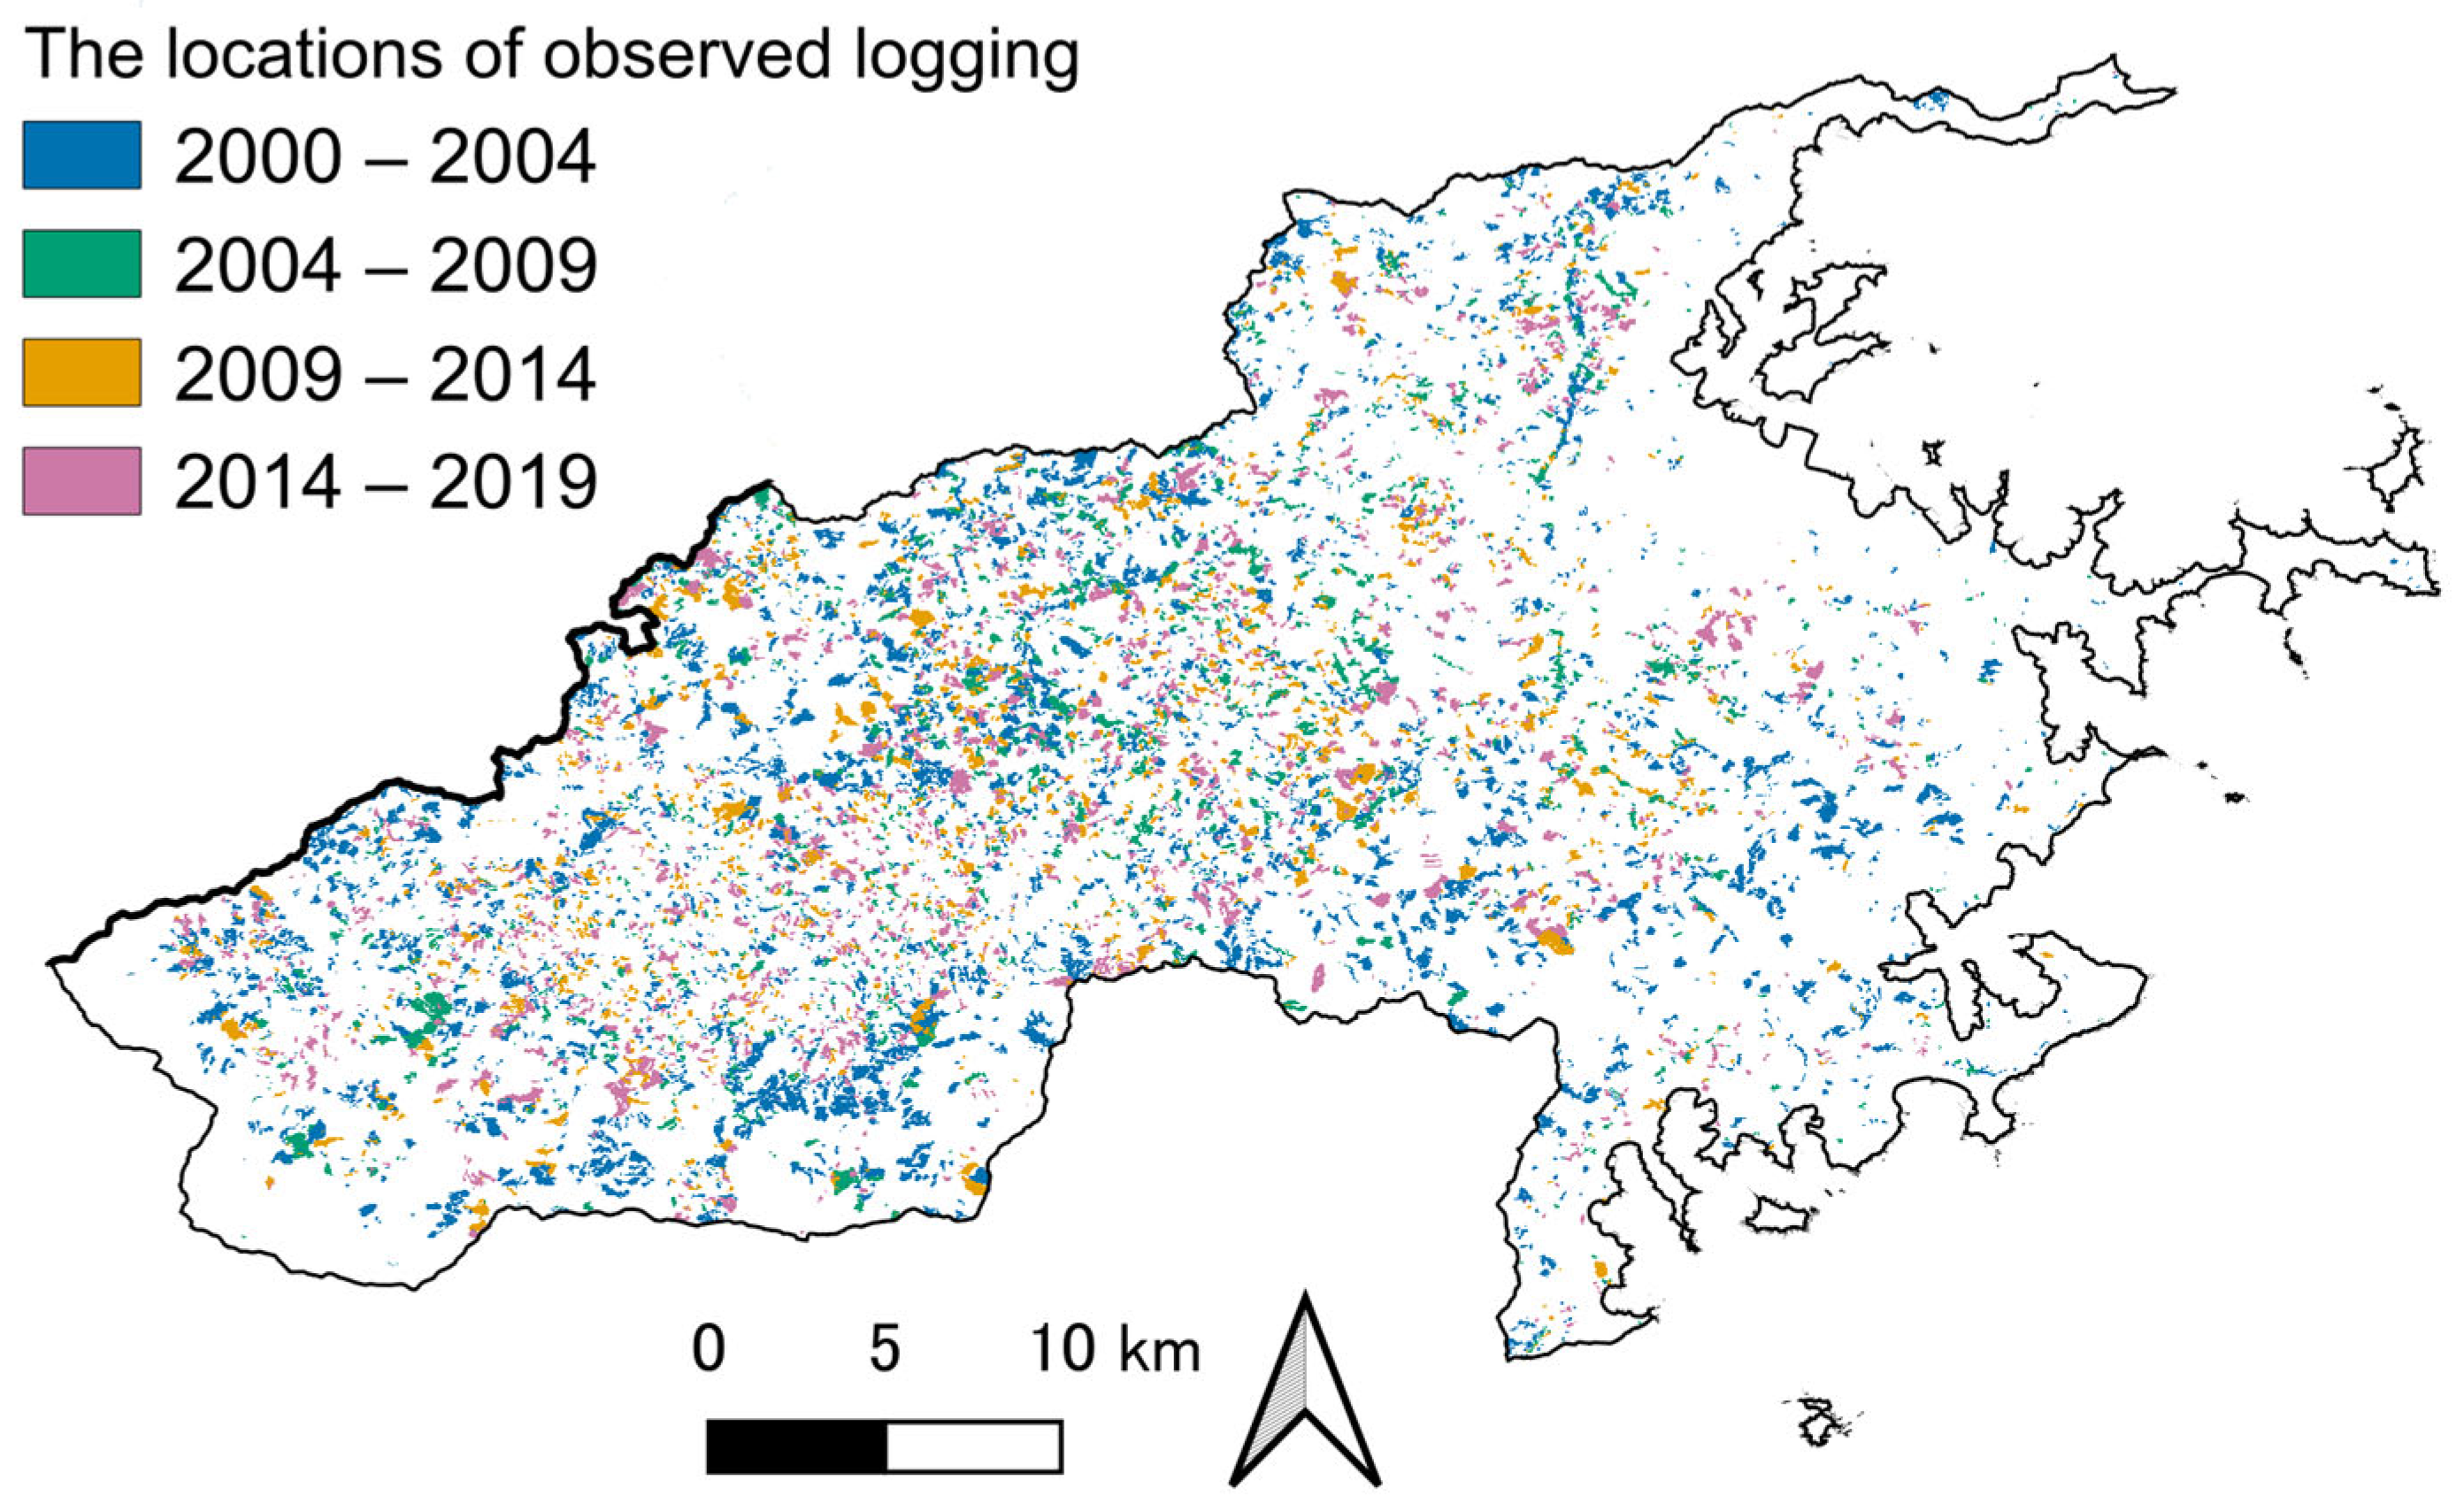
We identified the spatial distribution of logged forests in the study area (Figure A1), revealing a gradual increase in logged area over time. The logged area increased from approximately 1070 ha in 2000–2004, to 1550 ha in 2005–2009, 1710 ha in 2010–2014, and peaked at 2470 ha in 2015–2019. Overall, this represents a 130% increase in logged area over the two-decade span. The most pronounced rise occurred between 2010 and 2014 and 2015 and 2019, with an increase of about 44% during this final period. This trend suggests an acceleration in logging activities in recent years, likely influenced by national policies aimed at promoting timber production and increased harvesting in economically viable forest areas.

3.2. Profitability Analysis

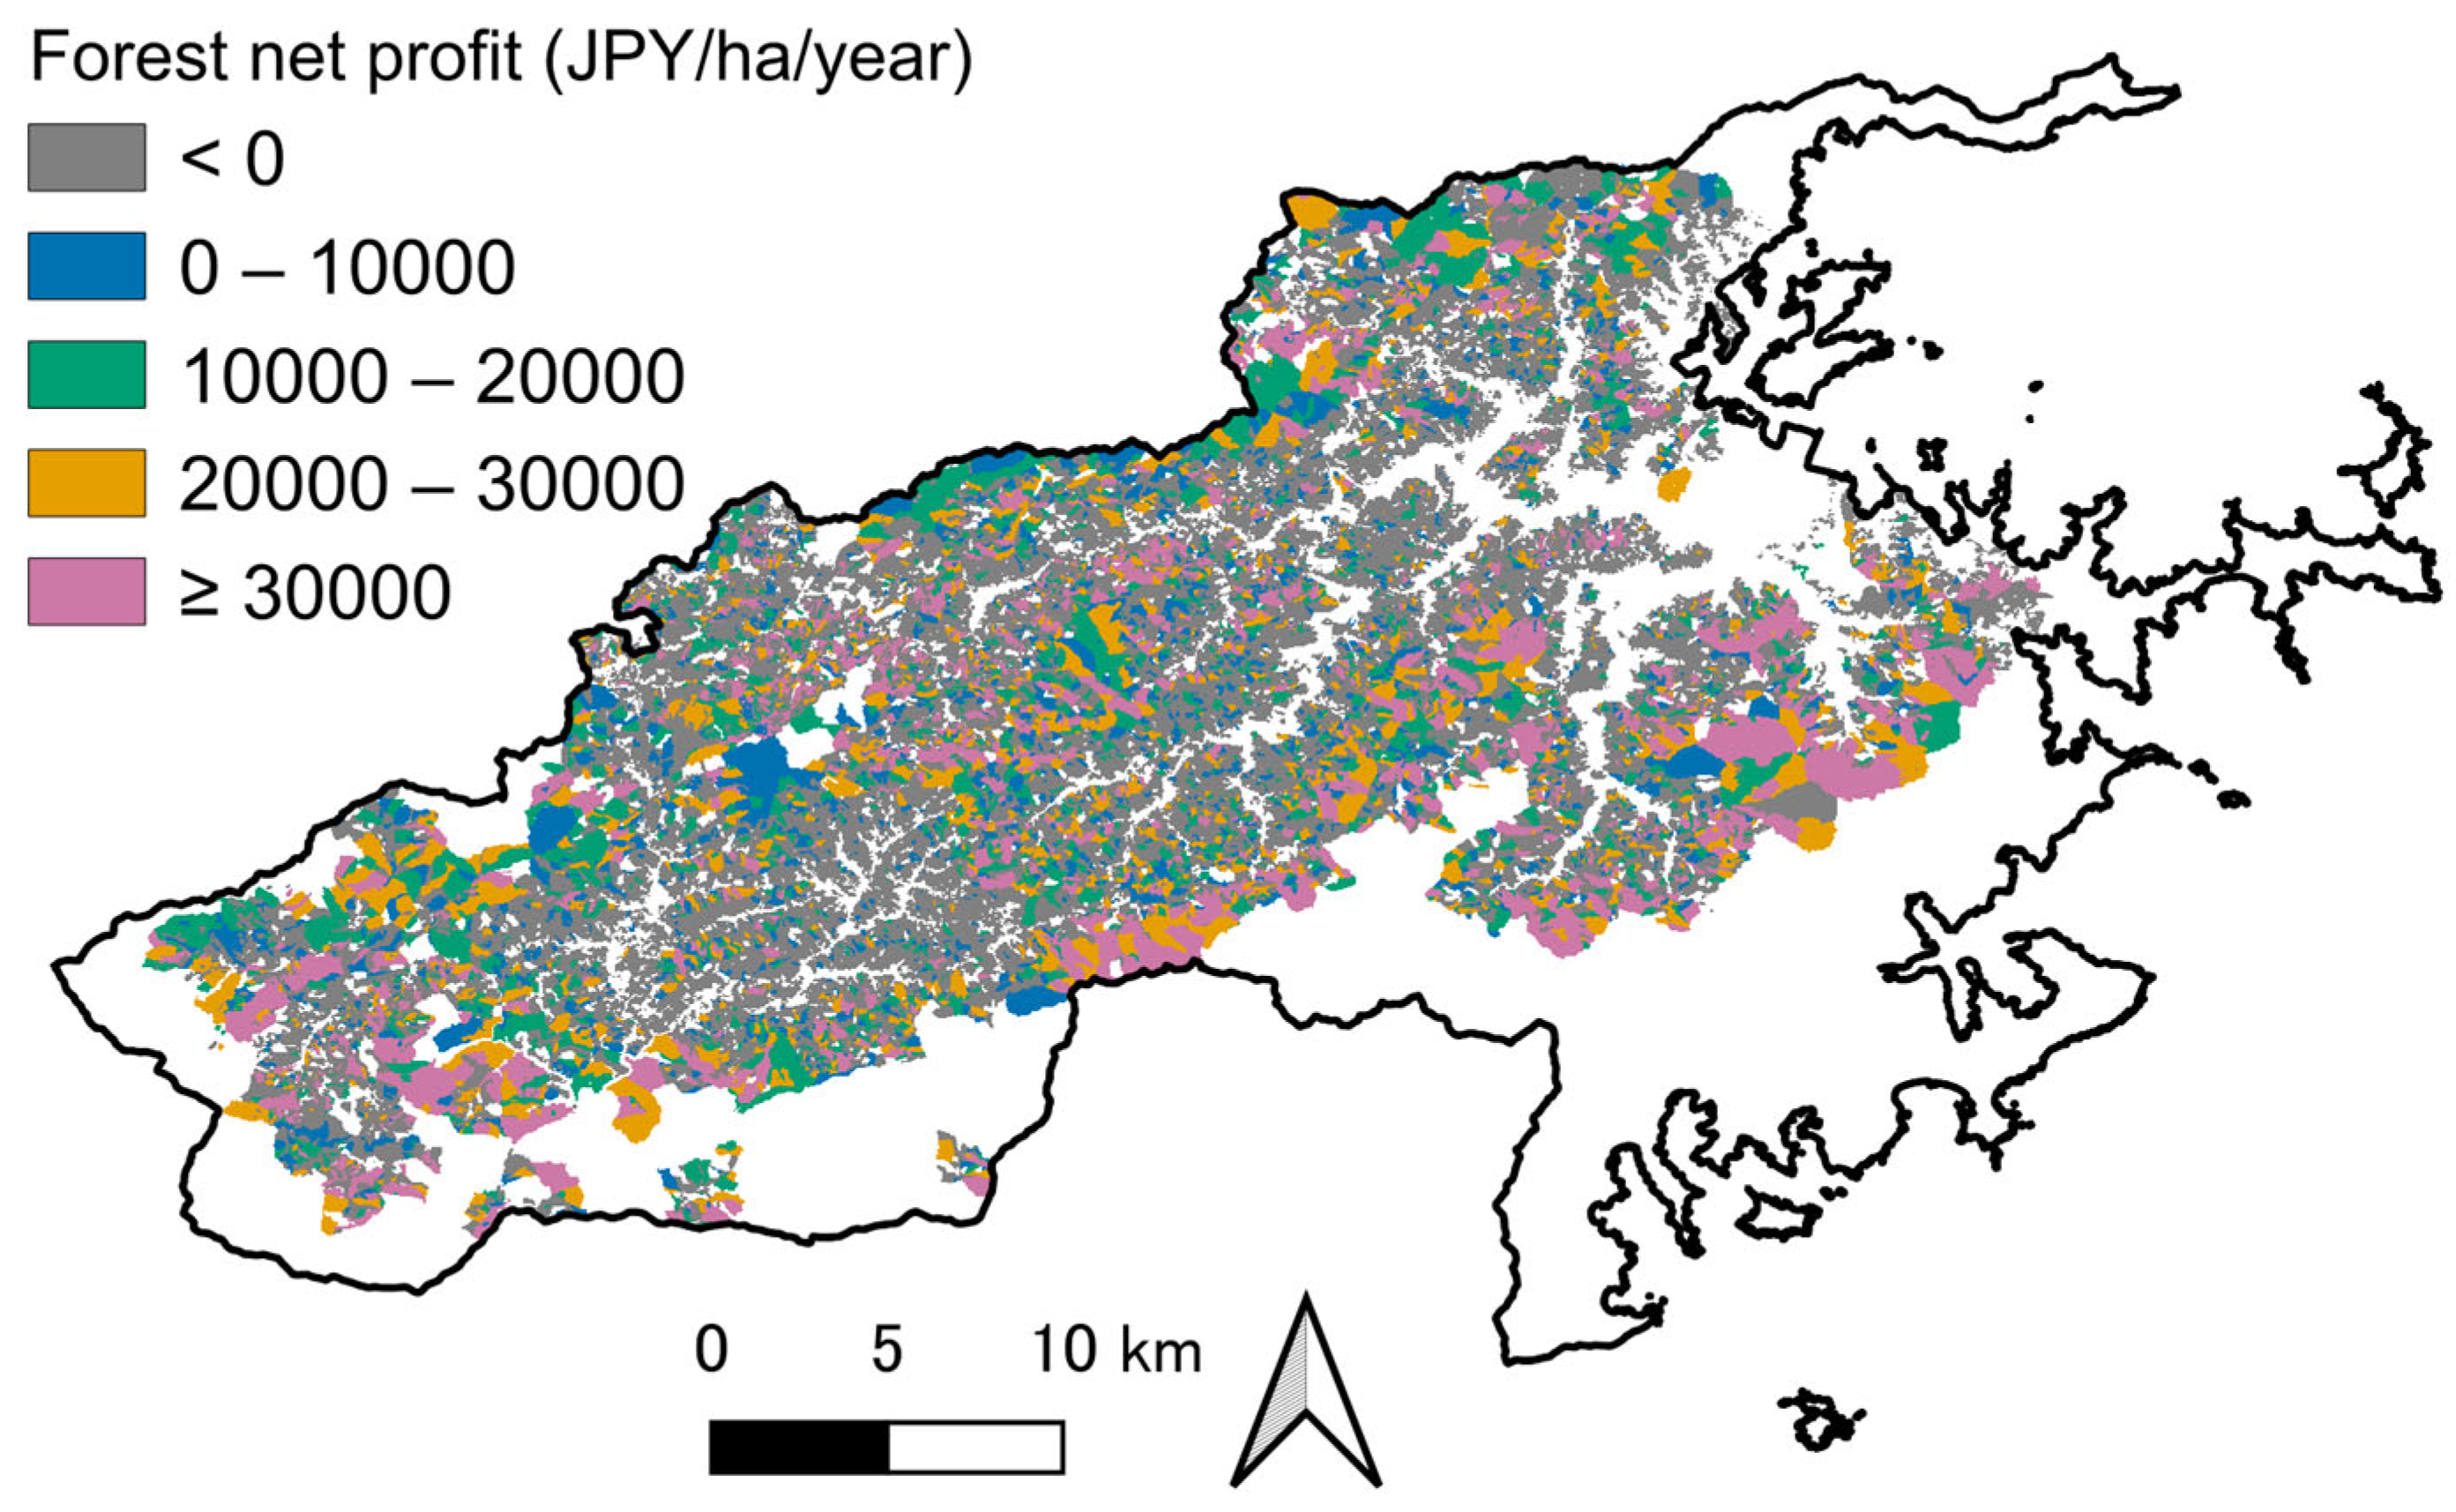
Forest net income in the study area was estimated by using a forest growth model and an operational cost model (Figure A2). Net income was negative in 52.1% of the study area (Figure 2). No significant differences were found in the area distributions among the other profitability groups: 9.7% in the 0–10,000 JPY group, 12.6% in the 10,000–20,000 JPY group, 11.5% in the 20,000–30,000 JPY group, and 14.1% in the >30,000 JPY group.

3.3. Areas Excluded from Sustainability Analysis

Areas with a high risk of shallow landslide, areas lacking subsequent reforestation following logging, and areas with unidentified ownership were excluded from the sustainability analysis. In each profitability group, forests deemed high-risk due to landslide susceptibility accounted for 15%–20% (Table 1). As 28.2% of the forest area is classified as having unclear ownership, the forest area available for sustainable timber production was estimated to comprise between 58% and 61% of the total (Table 1).

3.4. Sustainability Analysis

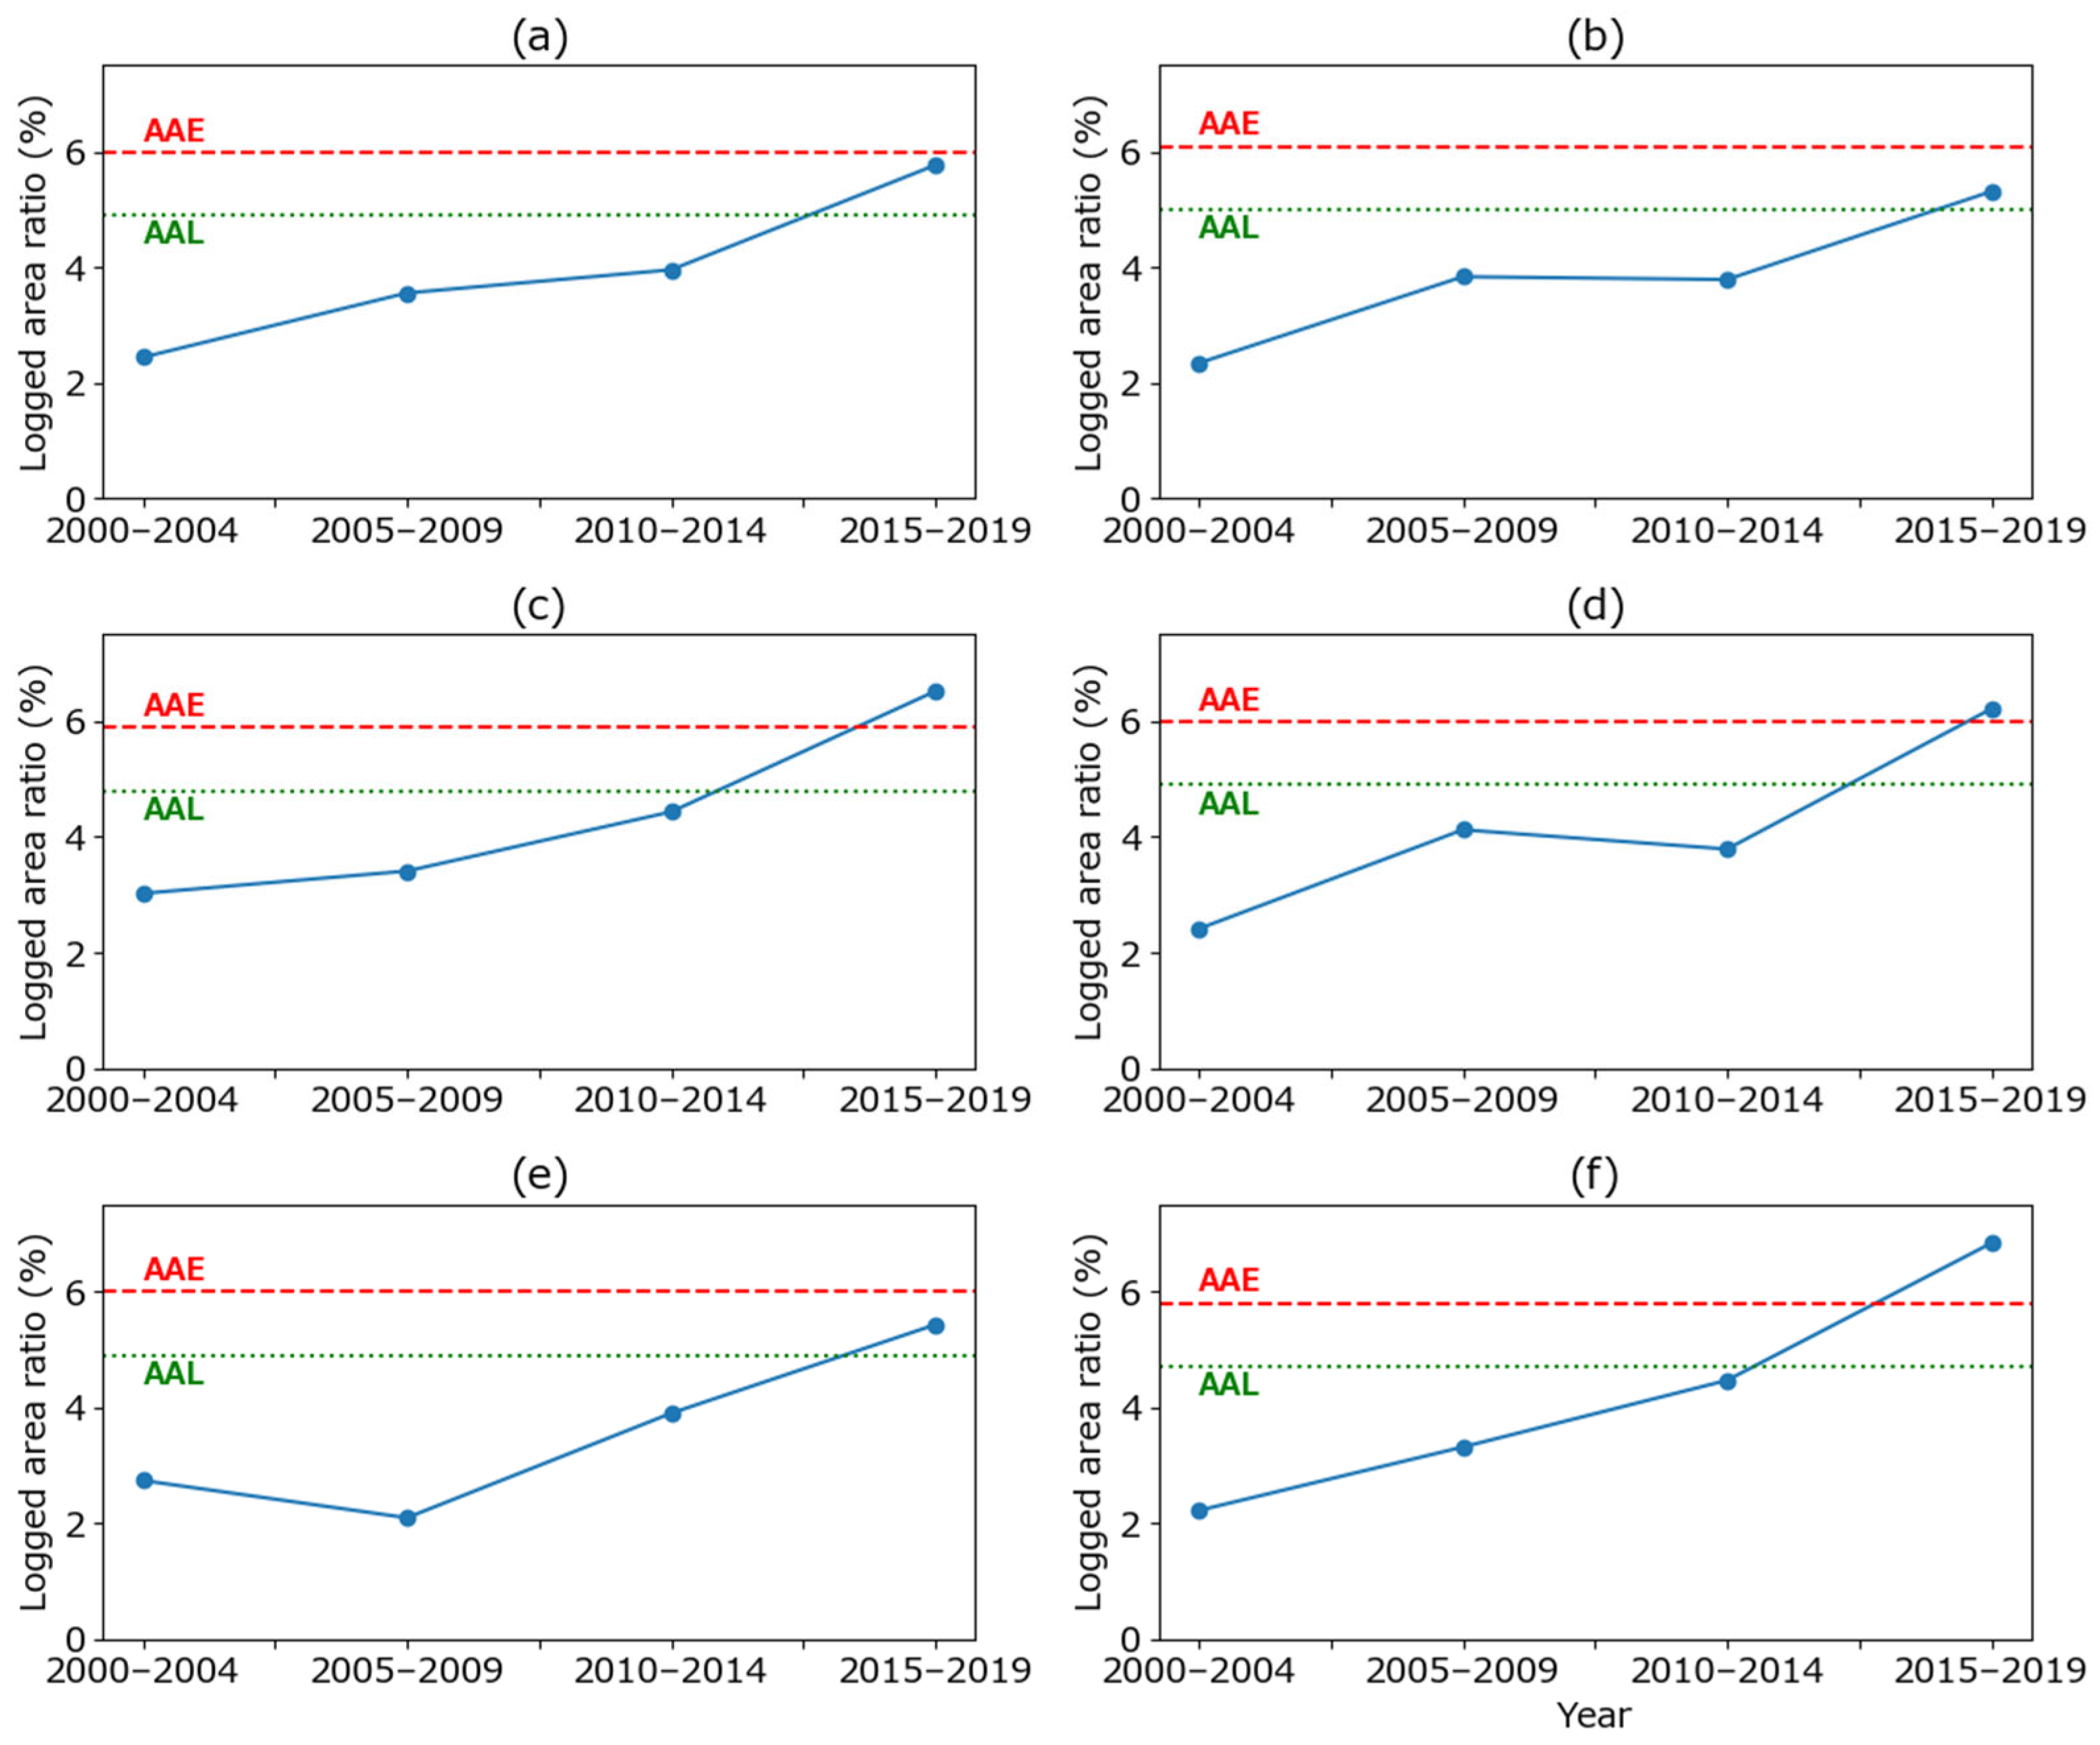
Across all forests, the logged-area ratio rose steadily from about 2.4 % in 2000–2004 to 5.8 % in 2015–2019, thereby exceeding the AAL but remaining just below the AAE (6.0%) (Figure 3a). In the lowest-profitability class (<0 JPY), logging stayed below both thresholds until 2015–2019, when it surpassed the AAL but remained below the AAE (Figure 3b). Similarly, the 0–10,000, 10,000–20,000, and 20,000–30,000 JPY groups showed gradual increases and exceeded the AAL in 2015–2019, and the 0–10,000 JPY and 10,000–20,000 JPY groups also exceeded the AAE in 2015–2019 (Figure 3c–e). The >30,000 JPY class had the most pronounced rise: ratios exceeded both the AAL and AAE in 2015–2019. These patterns indicate that, although the study area as a whole has not yet transgressed the experience–derived sustainable limit, actual harvest rates in more profitable forest stands are already outpacing both empirically and experientially defined allowable rates.

4. Discussion

For the promotion of a nature-positive society, sustainable timber production in planted forests is fundamental [40]. However, national policies aimed at increasing timber production without sufficient consideration of local conditions may undermine the sustainability of local ESs [41,42]. Therefore, accurately assessing the impacts of such top-down policies on local timber production and ES provision is essential. We compared actual harvested areas with the annual allowable logging area, which was based on logging age while accounting for other ES supplies. Logged areas have significantly increased in recent years, and in some highly profitable forest regions the sustainability of timber production and associated ESs may have been compromised.
To better understand the underlying factors contributing to this potential decline in sustainability, we examined the relationship between forest profitability and logging activities. There was no clear relationship between profitability and logged area before 2010 (Figure 3). However, since 2010, economically advantageous forest areas have been more frequently logged. This aligns with the central government’s timber production promotion policy, which emphasizes logging in profitable forest regions. Previous studies have suggested that logging tends to occur in areas with lower operational costs and better access to roads [43,44]. Such trends have become more apparent in the study area in recent years. These findings are consistent with those reported by Yamada and Fukumoto [24], who examined the broad-scale impacts of national policies in the same region. Overall, the results of this study clearly reveal the influence of central government policies on local logging patterns. In other words, this study empirically verifies the impact of top-down policy implementation on local forest management and ESs.
The sustainability assessment focused on plantation forests, excluding areas with a high risk of shallow landslides. Timber production can often be in a trade-off relationship with other ESs and may even exacerbate disaster risks [45,46]. Although high-risk forest areas have been logged in practice, we consider their exclusion in this analysis appropriate, as the sustainable provision of ESs is a fundamental goal of forest management. In fact, even in the study area, logging would not have exceeded the allowable limits if landslide risk had been disregarded (Table 1); however, such an approach would not guarantee the sustainable supply of ESs. Previous studies have also shown that spatially restricting logging to safer forest areas can improve ES outcomes [21,47]. With increasing recognition of the importance of NbS, it is essential to evaluate sustainability not merely in terms of resource quantities [48], but also in terms of whether timber production avoids undermining the balance among various ESs.
Similarly, social conditions are also critical for evaluating sustainability [25]. We excluded forests with unknown ownership under the assumption that they are unlikely to be actively managed. In addition, some forest lands are not used for timber production for social reasons such as landowners’ intentions or conflicts with the provision of other ESs [49]. Therefore, incorporating the lives and behaviors of local residents is also essential for the effective implementation of NbS. Taken together, ecological and social dimensions must be jointly considered when we evaluate the sustainability of NbS, calling for indicators that can capture the complexity of human–nature interactions in forest landscapes [50]. The sustainability assessed here took into account both ESs and local social conditions and provides an example of a potential indicator for NbS in sustaining forest ES supplies.
The assessment highlighted deterioration in the sustainability of timber production in specific parts of the study area. Although the total timber production across the entire region did not exceed the allowable area based on experience, increased harvesting led to threshold violations in some economically profitable forests. This contrast is due to relatively low logging activity in unprofitable forests, which account for more than half of the study area. Focusing solely on the overall figures while overlooking spatial details may result in misjudgments regarding local sustainability. The concentration of logging in profitable areas could lead to resource depletion in those zones. Consequently, local forestry industries may face disruptions due to the unavailability of profitable timber [51]. Even in the presence of sufficient forest resources, timber production may stagnate under such conditions. While previous studies have evaluated the sustainability of timber production in terms of profitability [52,53] or current harvesting volumes [54], no studies to date have assessed sustainability by linking spatial logging patterns and profitability at the local scale, as conducted here.
These findings suggest that relying solely on top-down, production-oriented policies may overlook critical local dynamics. While timber production in the study area has increased as intended by the central government’s policy, local logging patterns have inadvertently begun to compromise sustainability. The spatial imbalance in logging activities highlights the limitations of static, uniform policy frameworks. Adaptive management—including prediction, assessment, and improvement of policy effects [3,55]—offers an effective way to avoid such outcomes. Our results also show that top-down policies can have unintended consequences on local forest management. Therefore, future forest policy should incorporate more decentralized and participatory elements, empowering local actors to co-design and adjust management strategies [56,57].

5. Conclusions

This study assessed the sustainability of timber production in plantation forests by comparing actual logged areas with empirically and statistically defined allowable limits, while accounting for ecological risks and local social conditions. Our findings reveal a substantial increase in logging activities over the past two decades, with particularly intensive harvesting in economically profitable areas. Although overall timber production in the study area has not yet exceeded the allowable threshold based on experiential knowledge, logging in specific profitable zones has already surpassed sustainable limits, raising concerns over long-term forest resource depletion.
This study highlights the influence of top-down national policies on local forest management. The spatial imbalance in logging patterns, shaped by policy-driven incentives, underscores the limitations of uniform strategies that overlook local ecological and social complexities. By integrating environmental constraints such as landslide risk and social factors like unknown forest ownership, our sustainability assessment demonstrates the need for more nuanced, multi-dimensional indicators in evaluating NbS.
Whereas this study focused on spatial patterns of timber harvesting at the municipal scale, future research should evaluate sustainability within broader forest networks and in connection with climate change scenarios. A more comprehensive understanding of long-term sustainability will require integration of landscape-scale dynamics and climate resilience considerations [58]. In addition, further quantification of socio-political factors—such as the influence of subsidies and the environmental awareness of local communities—is essential for a more nuanced analysis of policy impacts [59]. Ultimately, the development of more multidimensional analytical approaches will be critical for proposing concrete management guidelines that support the realization of NbS in practice.

Author Contributions

Conceptualization, Y.Y. (Yusuke Yamada); methodology, Y.Y. (Yusuke Yamada), H.K., K.S., W.M.; formal analysis, Y.Y. (Yusuke Yamada), K.S.; writing—original draft preparation, Y.Y. (Yusuke Yamada); writing—review and editing, Y.Y. (Yuichi Yamaura), K.S.; visualization, Y.Y. (Yusuke Yamada); supervision, Y.Y. (Yuichi Yamaura); funding acquisition, Y.Y. (Yusuke Yamada). All authors have read and agreed to the published version of the manuscript.

Funding

This work was supported by JSPS KAKENHI Grant Number 23K11552.

Data Availability Statement

Logging location data are published in Zenodo at https://doi.org/10.5281/zenodo.4654619. The other data used in this study were obtained from local and prefectural government agencies and are not publicly available. However, they may be made available upon reasonable request and with permission from the respective data providers. Those interested in acquiring the data are encouraged to contact the corresponding author.

Acknowledgments

The authors thank the staff of Oita prefecture and Saiki municipality for providing information about the local forestry situations. During the preparation of this manuscript, the authors used ChatGPT (GPT-4-turbo) for the purposes of English editing. The authors have reviewed and edited the output and take full responsibility for the content of this publication.

Conflicts of Interest

The authors declare no conflicts of interest.

Abbreviations

The following abbreviations are used in this manuscript:
ESEcosystem service
NbSNature based solutions
AAEAnnual Allowable Logging Area based on Experience
AALAnnual Allowable Logging Area based on Logged Age Distribution

Appendix A

Table A1. A sequential operational scheme to calculate forest net income.
Number of initial plantation trees2500 trees/ha
Thinning ages20, 30, 40 years
Thinning ratios0.4, 0.4, 0.3
Logging age50 years
Log price12,500 JPY/m3
Seedling price75 JPY/tree
Labor cost27,900 JPY/person·day
Machinery cost50,000 JPY/day
Cutting time (C)N (107.3 e0.0266D + 90.2 e0.0366D) s
Yarding time (Y) V 8   (   2 3 R + 430 ) s
Working days C + Y 3600 5 4 day
Transporting cost2500 V JPY
N, numbers of trees; D, mean DBH (cm); V, tree volume (m3); R, distance from roads (m).
Table A2. Score table for evaluating shallow landslide risk.
Terrain ElementCategoryGeological Classification
SedimentaryVolcanicHypabyssal
Slope0%–30%000
31%–50%123123
51%–70%306149
71%–90%427166
>91%526157
Profile curvature<−0.01223128
−0.01–+0.01121817
>+0.014160
Plan curvature<150°223128
150°–210°121215
>211°000
Soil depth<0.5 m000
0.5–1.0 m344
1.0–2.0 m7109
>2.0 m152019
Forest age<5 years253532
5–15 years375147
15–35 years283734
35–55 years253532
>55 years223128
Table modified from MAFF [34].
Figure A1. Locations of observed logging from 2000 to 2019.
Forests 16 00989 g0a1
Figure A2. Evaluation map of forest net profit.
Forests 16 00989 g0a2

References

  1. Kalantari, Z.; Ferreira, C.S.S.; Pan, H.; Pereira, P. Nature-Based Solutions to Global Environmental Challenges. Sci. Total Environ. 2023, 880, 163227. [Google Scholar] [CrossRef]
  2. Seddon, N.; Daniels, E.; Davis, R.; Chausson, A.; Harris, R.; Hou-Jones, X.; Huq, S.; Kapos, V.; Mace, G.M.; Rizvi, A.R.; et al. Global Recognition of the Importance of Nature-Based Solutions to the Impacts of Climate Change. Glob. Sustain. 2020, 3, e15. [Google Scholar] [CrossRef]
  3. Cohen-Shacham, E.; Andrade, A.; Dalton, J.; Dudley, N.; Jones, M.; Kumar, C.; Maginnis, S.; Maynard, S.; Nelson, C.R.; Renaud, F.G.; et al. Core Principles for Successfully Implementing and Upscaling Nature-Based Solutions. Environ. Sci. Policy 2019, 98, 20–29. [Google Scholar] [CrossRef]
  4. Brockerhoff, E.G.; Barbaro, L.; Castagneyrol, B.; Forrester, D.I.; Gardiner, B.; González-Olabarria, J.R.; Lyver, P.O.B.; Meurisse, N.; Oxbrough, A.; Taki, H.; et al. Forest Biodiversity, Ecosystem Functioning and the Provision of Ecosystem Services. Biodivers. Conserv. 2017, 26, 3005–3035. [Google Scholar] [CrossRef]
  5. Harrison, P.A.; Vandewalle, M.; Sykes, M.T.; Berry, P.M.; Bugter, R.; de Bello, F.; Feld, C.K.; Grandin, U.; Harrington, R.; Haslett, J.R.; et al. Identifying and Prioritising Services in European Terrestrial and Freshwater Ecosystems. Biodivers. Conserv. 2010, 19, 2791–2821. [Google Scholar] [CrossRef]
  6. IPBES. IPBES Global Assessment Report on Biodiversity and Ecosystem Services of the Intergovernmental Science-Policy Platform on Biodiversity and Ecosystem Services; IPBES: Bon, Germany, 2019. [Google Scholar]
  7. Santika, T.; Wilson, K.A.; Budiharta, S.; Kusworo, A.; Meijaard, E.; Law, E.A.; Friedman, R.; Hutabarat, J.A.; Indrawan, T.P.; St. John, F.A.V.; et al. Heterogeneous Impacts of Community Forestry on Forest Conservation and Poverty Alleviation: Evidence from Indonesia. People Nat. 2019, 1, 204–219. [Google Scholar] [CrossRef]
  8. Knoke, T.; Messerer, K.; Paul, C. The Role of Economic Diversification in Forest Ecosystem Management. Curr. For. Rep. 2017, 3, 93–106. [Google Scholar] [CrossRef]
  9. Pohjanmies, T.; Triviño, M.; Le Tortorec, E.; Mazziotta, A.; Snäll, T.; Mönkkönen, M. Impacts of Forestry on Boreal Forests: An Ecosystem Services Perspective. Ambio 2017, 46, 743–755. [Google Scholar] [CrossRef]
  10. Gauthier, S.; Bernier, P.; Kuuluvainen, T.; Shvidenko, A.Z.; Schepaschenko, D.G. Boreal Forest Health and Global Change. Science 2015, 349, 819–822. [Google Scholar] [CrossRef]
  11. Japan Forestry Agency. The Basic Plan on Forest and Forestry; Japan Forestry Agency: Tokyo, Japan, 2021.
  12. Japan Forestry Agency. Annual Report on Forest and Forestry in Japan (Fiscal Year 2023); Japan Forestry Agency: Tokyo, Japan, 2023.
  13. Börner, J.; Schulz, D.; Wunder, S.; Pfaff, A. The Effectiveness of Forest Conservation Policies and Programs. Annu. Rev. Resour. Econ. 2020, 12, 45–64. [Google Scholar] [CrossRef]
  14. Macpherson, E.; Mortiaux, R.; Jorgensen, E. Scale-Sensitive Marine Law and Policy Design: Towards Ecosystem-Based Management across Spatial and Temporal Scales. Wiley Interdiscip. Rev. Energy. Environ. 2024, 13, e537. [Google Scholar] [CrossRef]
  15. Jensen, T.; Lussier, J.M. Economic Impacts of Partial Harvesting: Mitigating Mid-Term Timber Supply Shortages as a Result of Pest Outbreaks. For. Chron. 2021, 97, 271–276. [Google Scholar] [CrossRef]
  16. Olschewski, R.; Klein, A.M.; Tscharntke, T. Economic Trade-Offs between Carbon Sequestration, Timber Production, and Crop Pollination in Tropical Forested Landscapes. Ecol. Complex. 2010, 7, 314–319. [Google Scholar] [CrossRef]
  17. Carpentier, S.; Filotas, E.; Handa, I.T.; Messier, C. Trade-Offs between Timber Production, Carbon Stocking and Habitat Quality When Managing Woodlots for Multiple Ecosystem Services. Environ. Conserv. 2017, 44, 14–23. [Google Scholar] [CrossRef]
  18. Jucker, T.; Bouriaud, O.; Avacaritei, D.; Coomes, D.A. Stabilizing Effects of Diversity on Aboveground Wood Production in Forest Ecosystems: Linking Patterns and Processes. Ecol. Lett. 2014, 17, 1560–1569. [Google Scholar] [CrossRef]
  19. Noviandi, R.; Gomi, T.; Pratama, M.; Ritonga, R.P.; Fathani, T.F.; Maylda Pratama, G. Understanding the Role of Vegetation Root Systems in the Initiation of Rainfall-Induced Shallow Landslides: Scaling Perspectives. J. For. Res. 2025, 30, 165–178. [Google Scholar] [CrossRef]
  20. WWF. Global Roadmap for a Nature-Positive Economy an Economic and Financial Reform Agenda to Meet Narure and Climate Goals; WWF: Gland, Switzerland, 2024. [Google Scholar]
  21. Yamaura, Y.; Yamada, Y.; Matsuura, T.; Tamai, K.; Taki, H.; Sato, T.; Hashimoto, S.; Murakami, W.; Toda, K.; Saito, H.; et al. Modeling Impacts of Broad-Scale Plantation Forestry on Ecosystem Services in the Past 60 Years and for the Future. Ecosyst. Serv. 2021, 49, 101271. [Google Scholar] [CrossRef]
  22. Polyakov, M.; Wear, D.N.; Huggett, R.N. Harvest Choice and Timber Supply Models for Forest Forecasting. For. Sci. 2010, 56, 344–355. [Google Scholar] [CrossRef]
  23. Prestemon, J.P.; Wear, D.N. Linking Harvest Choices to Timber Supply. For. Sci. 2000, 46, 377–389. [Google Scholar] [CrossRef]
  24. Yamada, Y.; Fukumoto, K. Spatial Relationships between Annual Timber Productions and Logging Locations in the Prefectures of Kyushu Island. J. Jpn. For. Soc. 2023, 105, 259–263. [Google Scholar] [CrossRef]
  25. Yamada, Y.; Yamaura, Y.; Shimizu, K.; Murakami, W.; Nanko, K.; Takayama, N. Conflicts among Ecosystem Services May Depend on Environmental Awareness: A Multi-Municipality Analysis. Forestry 2024, 97, 424–435. [Google Scholar] [CrossRef]
  26. Dataset: Country-Wide Mapping of Harvest Areas and Post-Harvest Forest Recovery Using Landsat Time Series Data in Japan. Available online: https://zenodo.org/records/11634214 (accessed on 22 February 2023).
  27. Shimizu, K.; Saito, H. Country-Wide Mapping of Harvest Areas and Post-Harvest Forest Recovery Using Landsat Time Series Data in Japan. Int. J. Appl. Earth Obs. Geoinf. 2021, 104, 102555. [Google Scholar] [CrossRef]
  28. Gorelick, N.; Hancher, M.; Dixon, M.; Ilyushchenko, S.; Thau, D.; Moore, R. Google Earth Engine: Planetary-Scale Geospatial Analysis for Everyone. Remote Sens. Environ. 2017, 202, 18–27. [Google Scholar] [CrossRef]
  29. Japan Forestry Agency. Procedures for Harvest Forecasts Using Forest Stand Density Control Diagram; Japan Forestry Agency: Tokyo, Japan, 2024.
  30. Nishizono, T.; Inoue, A.; Hosoda, K. Relationship between Relative Yield Index and Relative Spacing Index: Theoretical Derivation of the Relationship and Its Characteristics. J. Jpn. For. Plann. 2013, 47, 16–28. [Google Scholar] [CrossRef]
  31. Oka, M. Studies on the Analysis and Evaluation on Mechanized Yarding. Ph.D. Thesis, University of Tokyo, Tokyo, Japan, 2006. [Google Scholar]
  32. Saito, H.; Murakami, W.; Daimaru, H.; Oguchi, T. Effect of Forest Clear-Cutting on Landslide Occurrences: Analysis of Rainfall Thresholds at Mt. Ichifusa, Japan. Geomorphology 2017, 276, 1–7. [Google Scholar] [CrossRef]
  33. Shuin, Y.; Turumi, K.; Matsue, K.; Aruga, K.; Tasaka, T. Evaluation of Soil Reinforcement by Tree Root System Using a Distributed Shallow Landslides Model. J. Jpn. Soc. Reveget. Technol. 2009, 35, 9–14. [Google Scholar] [CrossRef]
  34. MAFF. Investigation Method of the Disaster Risk District in the Mountain; MAFF: Tokyo, Japan, 2016.
  35. Shuin, Y.; Hotta, N.; Matsue, K.; Aruga, K.; Tasaka, T. Simulating Effects of Spatial Distribution of Different Stand Age of Hinoki Cypress on the Location of Shallow Landslides. J. Jpn. Soc. Reveget. Technol. 2011, 37, 102–107. [Google Scholar] [CrossRef]
  36. Heinonen, T.; Pukkala, T.; Asikainen, A. Variation in Forest Landowners’ Management Preferences Reduces Timber Supply from Finnish Forests. Ann. For. Sci. 2020, 77, 31. [Google Scholar] [CrossRef]
  37. Onda, N.; Ochi, S.; Tsuzuki, N. Examination of Social Factors Affecting Private Forest Owners’ Future Intentions for Forest Management in Miyazaki Prefecture: A Comparison of Regional Characteristics by Forest Ownership Size. Forests 2023, 14, 309. [Google Scholar] [CrossRef]
  38. Yoshihara, S. Realities and Challenges of Land Issues in the Era of Depopulation. Jpn. J. Real. Estate Sci. 2017, 31, 79–83. [Google Scholar] [CrossRef]
  39. The Ministry of Land Infrastructure Transport and Tourism of Japan. Special Measures Law for Facilitating the Use of Land with Unknown Owners; The Ministry of Land Infrastructure Transport and Tourism of Japan: Tokyo, Japan, 2019.
  40. Demarais, S.; Verschuyl, J.P.; Roloff, G.J.; Miller, D.A.; Wigley, T.B. Tamm Review: Terrestrial Vertebrate Biodiversity and Intensive Forest Management in the U.S. For. Ecol. Manag. 2017, 385, 308–330. [Google Scholar] [CrossRef]
  41. Benra, F.; Nahuelhual, L.; Gaglio, M.; Gissi, E.; Aguayo, M.; Jullian, C.; Bonn, A. Ecosystem Services Tradeoffs Arising from Non-Native Tree Plantation Expansion in Southern Chile. Landsc. Urban. Plan. 2019, 190, 103589. [Google Scholar] [CrossRef]
  42. Blattert, C.; Eyvindson, K.; Hartikainen, M.; Burgas, D.; Potterf, M.; Lukkarinen, J.; Snäll, T.; Toraño-Caicoya, A.; Mönkkönen, M. Sectoral Policies Cause Incoherence in Forest Management and Ecosystem Service Provisioning. For. Policy. Econ. 2022, 136, 102689. [Google Scholar] [CrossRef]
  43. Levers, C.; Verkerk, P.J.; Müller, D.; Verburg, P.H.; Butsic, V.; Leitão, P.J.; Lindner, M.; Kuemmerle, T. Drivers of Forest Harvesting Intensity Patterns in Europe. For. Ecol. Manag. 2014, 315, 160–172. [Google Scholar] [CrossRef]
  44. Poje, A.; Pezdevšek Malovrh, Š.; Krč, J. Factors Affecting Harvesting Intensity in Small-Scale Private Forests in Slovenia. Small-scale For. 2016, 15, 73–91. [Google Scholar] [CrossRef]
  45. Bennett, E.M.; Peterson, G.D.; Gordon, L.J. Understanding Relationships among Multiple Ecosystem Services. Ecol. Lett. 2009, 12, 1394–1404. [Google Scholar] [CrossRef] [PubMed]
  46. Temperli, C.; Blattert, C.; Stadelmann, G.; Brändli, U.B.; Thürig, E. Trade-Offs between Ecosystem Service Provision and the Predisposition to Disturbances: A NFI-Based Scenario Analysis. For. Ecosyst. 2020, 7, 27. [Google Scholar] [CrossRef]
  47. Frizzle, C.; Fournier, R.A.; Trudel, M.; Luther, J.E. Towards Sustainable Forestry: Using a Spatial Bayesian Belief Network to Quantify Trade-Offs among Forest-Related Ecosystem Services. J. Environ. Manag. 2022, 301, 113817. [Google Scholar] [CrossRef]
  48. Leiter, M.; Neumann, M.; Egusa, T.; Harashina, K.; Hasenauer, H. Assessing the Resource Potential of Mountainous Forests: A Comparison between Austria and Japan. Forests 2022, 13, 891. [Google Scholar] [CrossRef]
  49. Ficko, A. Private Forest Owners’ Social Economic Profiles Weakly Influence Forest Management Conceptualizations. Forests 2019, 10, 956. [Google Scholar] [CrossRef]
  50. Palomo, I.; Locatelli, B.; Otero, I.; Colloff, M.; Crouzat, E.; Cuni-Sanchez, A.; Gómez-Baggethun, E.; González-García, A.; Grêt-Regamey, A.; Jiménez-Aceituno, A.; et al. Assessing Nature-Based Solutions for Transformative Change. One Earth 2021, 4, 730–741. [Google Scholar] [CrossRef]
  51. Bowe, S.A.; Ballweg, J.M.; Blinn, C.R.; Nolle, D.A.; Smail, R.A. The Logging Sector in Minnesota and Wisconsin: Status, Issues, and Challenges in 2021. J. For. 2025, 123, 41–62. [Google Scholar] [CrossRef]
  52. Zhang, J.; Alavalapati, J.R.R.; Shrestha, R.K.; Hodges, A.W. Economic Impacts of Closing National Forests for Commercial Timber Production in Florida and Liberty County. J. For. Econ. 2005, 10, 207–223. [Google Scholar] [CrossRef]
  53. Alounsavath Master, P.; Kim, S. Bin Economic Feasibility of a Sustainable Production Forest Management System in Xaibouathong Forest Management Area, Khammouan Province, Lao PDR. Forest Sci. Technol. 2021, 17, 119–124. [Google Scholar] [CrossRef]
  54. Macpherson, A.J.; Carter, D.R.; Schulze, M.D.; Vidal, E.; Lentini, M.W. The Sustainability of Timber Production from Eastern Amazonian Forests. Land Use Policy 2012, 29, 339–350. [Google Scholar] [CrossRef]
  55. Deitch, M.J.; Gancel, H.N.; Croteau, A.C.; Caffrey, J.M.; Scheffel, W.; Underwood, B.; Muller, J.W.; Boudreau, D.; Cantrell, C.G.; Posner, M.J.; et al. Adaptive Management as a Foundational Framework for Developing Collaborative Estuary Management Programs. J. Environ. Manag. 2021, 295, 113107. [Google Scholar] [CrossRef]
  56. Reed, M.S. Stakeholder Participation for Environmental Management: A Literature Review. Biol. Conserv. 2008, 141, 2417–2431. [Google Scholar] [CrossRef]
  57. Rico, M.; González, A. Social Participation into Regional Forest Planning Attending to Multifunctional Objectives. For. Policy Econ. 2015, 59, 27–34. [Google Scholar] [CrossRef]
  58. Maxwell, C.J.; Scheller, R.M.; Wilson, K.N.; Manley, P.N. Assessing the Effectiveness of Landscape-Scale Forest Adaptation Actions to Improve Resilience under Projected Climate Change. Front. For. Glob. Change 2022, 5, 740869. [Google Scholar] [CrossRef]
  59. Miranda, K.M.; Parry, I.W.H.; Gupta, S. Public Expenditure Policy and the Environment: A Review and Synthesis. IMF Work. Pap. 1993, 93, 42. [Google Scholar] [CrossRef]
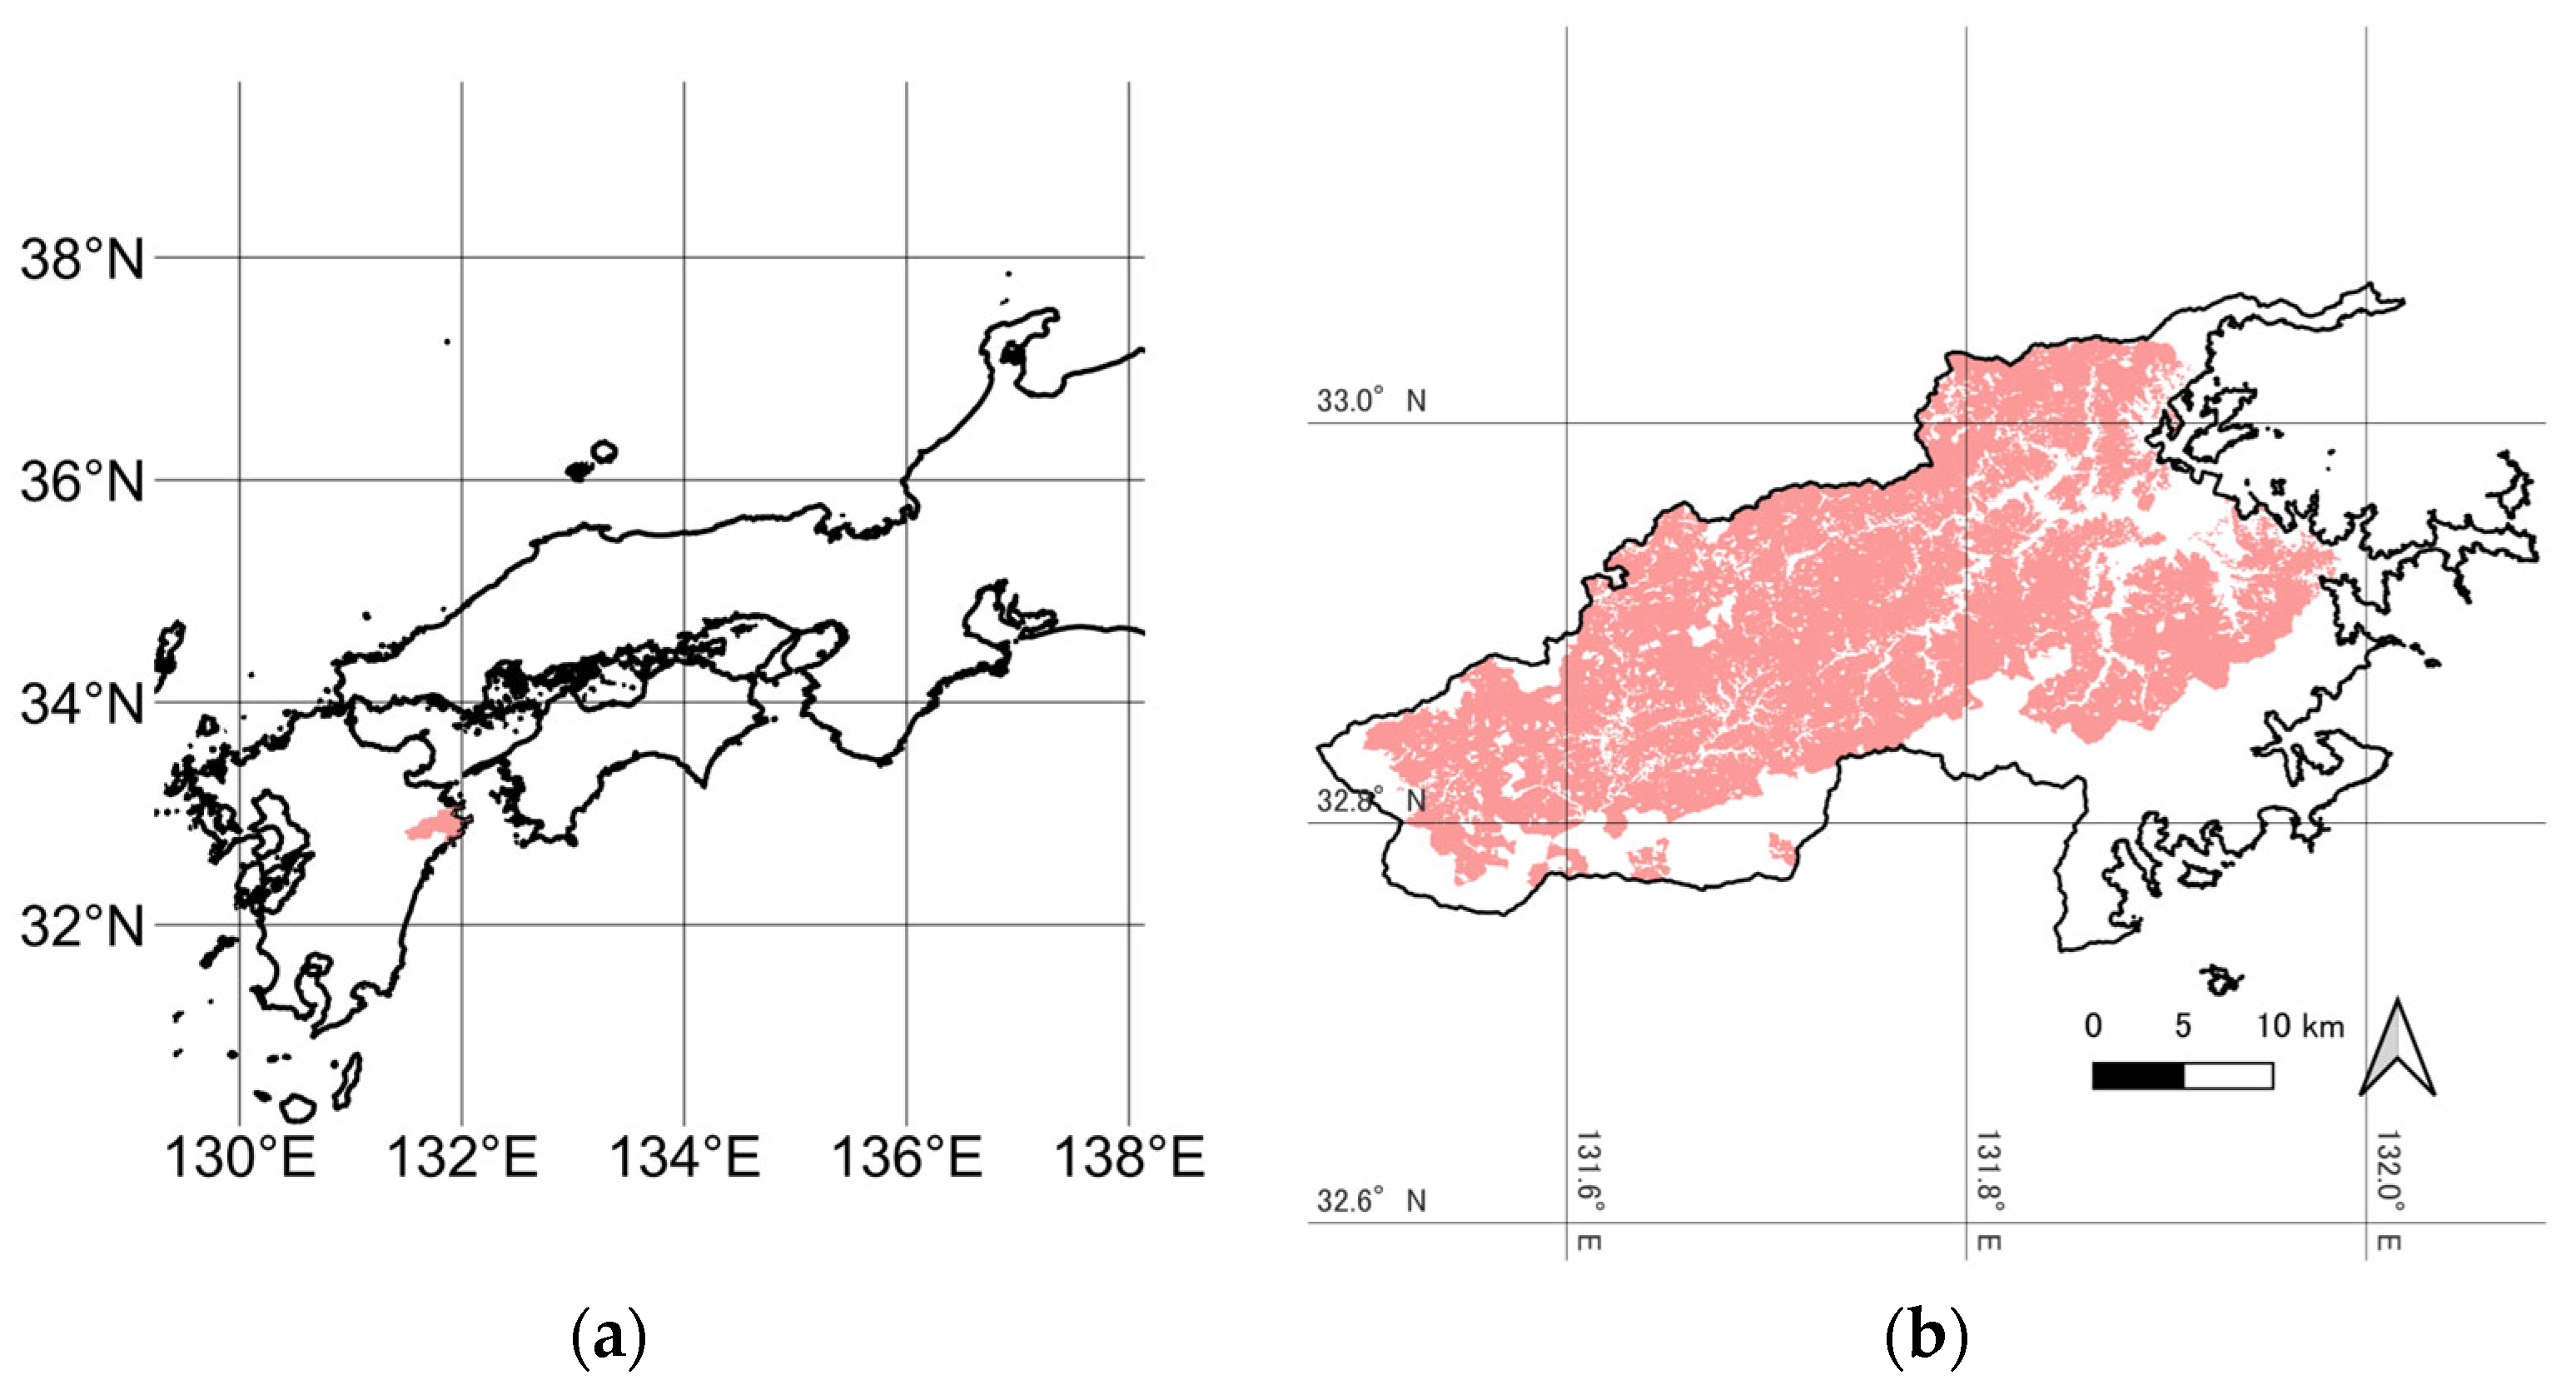
Figure 1. Location of study area: (a) Saiki municipality; (b) enlarged view of the study area with privately owned plantation forests.
Forests 16 00989 g001
Figure 2. Area distribution of each profitability group.
Forests 16 00989 g002
Figure 3. Comparison among logged area trends and annual allowable logging area in each profit group: (a) whole study area, (b) <0 JPY, (c) 0–10,000 JPY, (d) 10,000–20,000 JPY, (e) 20,000–30,000 JPY, and (f) ≥30,000 JPY. Blue lines, observed logged-area ratio (%); red lines, AAE; green lines, AAL (see Table 1).
Forests 16 00989 g003
Table 1. Forest area ratio available for sustainable timber production.
Forest Net Income (JPY)
<00–10,000 10,000–20,00020,000–30,00030,000≤
High-risk of landslide14.8%17.4%15.8%16.3%19.6%
Unclear ownership28.2%
Timber producing area61.2%59.3%60.5%60.1%57.7%
AAE (5 years)6.1%5.9%6.0%6.0%5.8%
AAL (5 years)5.0%4.8%4.9%4.9%4.7%
Disclaimer/Publisher’s Note: The statements, opinions and data contained in all publications are solely those of the individual author(s) and contributor(s) and not of MDPI and/or the editor(s). MDPI and/or the editor(s) disclaim responsibility for any injury to people or property resulting from any ideas, methods, instructions or products referred to in the content.