Article

Soil Biogeochemical Feedback to Fire in the Tropics: Increased Nitrification and Denitrification Rates and N2O Emissions Linked to Labile Carbon and Nitrogen Fractions

1
School of Tropical Agriculture and Forestry, Hainan University, Haikou 570228, China
2
School of Breeding and Multiplication, Sanya Institute of Breeding and Multiplication, Hainan University, Sanya 572025, China
3
Soil Science Department, Faculty of Agriculture, Zagazig University, Zagazig 44511, Egypt
*
Author to whom correspondence should be addressed.
Forests 2025, 16(6), 983; https://doi.org/10.3390/f16060983
Submission received: 13 May 2025 / Revised: 8 June 2025 / Accepted: 9 June 2025 / Published: 11 June 2025
(This article belongs to the Section Forest Soil)

Abstract

:
Although tropical ecosystems have become increasingly vulnerable to fire over the past century, the mechanisms by which fire disturbance influences N2O emissions in these regions remain poorly understood. This study investigated the effects of fire on nitrous oxide (N2O) emissions, the gross nitrification rate (GN), denitrification genes, and carbon (C) and nitrogen (N) fractions in a tropical forest. The results showed that fire increased the GN by 41.5%. The abundance of the nirK and nirS genes encoding nitrite reductase increased by 16.3% and 27.5%, respectively, while the abundance of the nosZI gene encoding N2O reductase increased by 28%, suggesting a potentially enhanced denitrification capacity. This enhancement in nitrification and denitrification was mainly due to increased easily oxidizable organic C (EOC, +35%), light fraction organic C (LFOC, +32%), hydrolyzable ammonium N (HAN, +13%), and amino sugar N (ASN, +11%), which provided additional substrates for nitrification and denitrification. As a result, soil N2O emissions increased by 18% in response to fire. Soil N2O emissions showed a significant and positive linear correlation with GN, EOC, LFOC, HAN, nirK, nirS, and nosZI. Thus, the post-fire increase in N2O emissions is likely driven by enhanced nitrification and denitrification processes, facilitated by the elevated availability of labile C and N fractions. Our findings provide new evidence for the role of soil C and N fractions in controlling N2O emission and nitrification–denitrification under fire disturbances in tropical soils.

1. Introduction

Globally, approximately 500 million hectares of terrestrial ecosystems are burned each year [1], altering ecosystem dynamics in both the short and long term [2,3]. Fire is more prevalent in tropical and subtropical ecosystems than in any other region on Earth [4]. As a strong and direct environmental factor, fire can have a significant impact on long-term soil nutrient transformations by affecting the microbial abundance, soil biochemistry, and vegetation cover [5]. Due to climate change, the length of the wildfire season, as well as the frequency and scale of severe fires have increased [6], which will have profound impacts on the physical, chemical, and biological properties of forest soils [7].
Nitrous oxide (N2O), a potent greenhouse gas (GHG), is produced and emitted in the soil in close association with soil nutrient cycling processes [8]. Soil is a major source of N2O [9,10], and has a global warming potential nearly 300 times greater than that of carbon dioxide (CO2) over a 100-year period [11]. Although an increasing number of studies have explored the effects of fire on soil GHG emissions, most of them have focused mainly on CO2 emissions [12,13,14], and there are fewer studies on the feedback of soil N2O to fire perturbations. Some studies have indicated that soil N2O emissions may increase significantly in the short term after fire [15]. This may be because fire raises the concentration of inorganic nitrogen (N) in the soil, which provides an energy source for the microbial consumption process of N2O production [16]. At the same time, the change in the soil properties by fire may also affect the activity of nitrifying and denitrifying bacteria in the soil, which may influence the production and emission of N2O [17].
Nitrification (the oxidation of ammonium (NH4+) to nitrate (NO3)) and denitrification (the reduction of NO3 to N2 or N oxides) are important factors in the production of N2O in soil [18,19]. Studies have shown that fire can stimulate nitrification [20]. However, in another study, a fire reduced the transcriptional activity and nitrifying enzyme activity of archaeal nitrifying bacteria [21]. The denitrification process is regulated by specific genes, primarily involving nitrite reductase encoded by the nirK and nirS genes and N2O reductase encoded by the nosZI gene, and dynamic changes in these microbial communities regulate N2O emissions [18,22]. According to Yang et al. [23], fire disrupts the structure of soil microbial communities, which in turn affects the abundance and activity of denitrifying bacteria, and post-fire soil restoration leads to changes in the composition of denitrifying microbial populations, which potentially affect the rate and efficiency of denitrification. Huang et al. [24] on forest ecosystems provide further evidence that fire may lead to increased soil N concentrations and N-transforming enzyme activities. This leads to an increase in the abundance of microbially mediated functional genes (nitrification and denitrification) associated with soil N loss. Although tropical ecosystems have become increasingly vulnerable to fire over the past century, the effect of fire disturbance on N2O emissions in these regions is unclear [25]. In particular, how post-fire changes in the soil biochemistry and related functional genes influence soil N2O emissions in the tropical soils is still unknown.
Previous studies have shown that the patterns of influence of organic carbon (C) and total N on soil N2O emissions and their associated functional genes are not consistent [26,27]. These conflicting results make it difficult to draw firm conclusions about how the response of the soil C and N content to fire affects N2O emissions, probably because previous studies have neglected the response of soil C and N fractions to fire. Soil C and N fractions can indirectly affect soil N2O emissions by affecting soil nitrification and denitrification genes [10]. For instance, Wang et al. [28] reported that easily oxidizable organic C (EOC) is a key factor in perturbing the community composition of denitrifying bacteria. This is because EOC can directly participate in denitrification [29] due to its high turnover rate and ability to be absorbed and utilized by microorganisms [30,31]. Hydrolyzable NH4+-N (HAN) is derived from acid-resistant organic components [32], which facilitates microbial uptake and assimilation [32,33]. HAN can significantly contribute to soil N2O emissions by increasing the abundance of denitrification genes [29]. Understanding the mechanisms by which fire contributes to the production and emission of N2O in tropical forest soils and ultimately to the mitigation of global warming is critical [15]. Yet, it remains unclear how the response of soil C and N fractions to fire affects N2O emissions in tropical forests. We hypothesized that fire would stimulate nitrification and denitrification genes and ultimately N2O emissions from tropical forest soils by increasing the concentrations of C and N fractions (e.g., EOC, HAN).
To fill this research gap and validate the research hypothesis, we selected a suburban forest in tropical China as the study area (which experienced wildfire disturbance in April 2024) and analyzed soil samples from both the fire-affected area and an adjacent unburned control site. The main objective of this study was to investigate how and why fire disturbance affects soil N2O emission in tropical ecosystems. Understanding these changes is important to predict post-fire GHG emissions and their implications for ecosystem nutrient dynamics.

2. Materials and Methods

2.1. Site Description and Sample Collection

The study site is located in Danzhou City, Hainan Province, China (19°29′ N, 109°40′ E). The area has a typical tropical island monsoon climate with mean annual temperatures ranging from 23.5 °C to 24.1 °C and mean annual precipitation of about 1600 mm. The soil type is sandy loam (USDA classification), with forest vegetation dominated by native species. Dominant tree species include Hainan green plum (Vatica mangachapoi) and thick-barked tree (Lannea coromandelica), among others. The shrub layer includes mountain sesame (Helicteres angustifolia) and nine-section wood (Psychotria rubra), with occasional eucalyptus or rubber trees. Land use history is primarily natural succession, managed through natural growth. The region experienced its recent forest wildfire in April 2024, resulting in the complete destruction of lowland vegetation, charred tree roots, and a 0 to 1 cm thick layer of white and black ash and charred plant debris covering the soil surface. Samples were collected from a 45-hectare burned area and an adjacent 45-hectare unburned area. The unburned plots were sampled based on the absence of ash or charcoal in the organic layer, ensuring no recent fire disturbance. The distance between the burned and unburned sites was approximately 250 m, and the minimum distance between plots was 100 m. Soil samples were collected from three 50 × 50 m plots at each site (unburned and burned areas). Five points were randomly selected from each plot and mixed to form a composite soil sample. All sub-sample plots were selected following uniform criteria, including similar vegetation and terrain with slopes < 25°. Soil samples were kept in sterile plastic bags, transported quickly to the laboratory, and sieved (2 mm) for further processing. Subsamples were stored at 4 °C for physicochemical analysis and at −80 °C for DNA extraction.

2.2. Soil Properties

Soil pH was analyzed using the potentiometric method with a water–soil ratio of 1:2.5. Soil NH4+ and NO3 were extracted with 2 M KCl solution at a ratio of 1:5 (soil:water) and determined by spectrophotometer. Soil organic C (SOC) was determined through potassium dichromate–sulfate digestion, and total N was measured using the semi-micro Kjeldahl method. Dissolved organic C (DOC) was determined using deionized water extraction and a TOC analyzer [34]. Potassium permanganate oxidation–UV spectrophotometry was used to determine the concentration of EOC. Sodium hexametaphosphate extraction and potassium dichromate external heating method were used to determine the concentration of particulate organic C (POC) [35]. The potassium dichromate oxidation–external heating method was used to determine the concentration of recalcified organic C in soil, and the difference method was used to obtain the concentration of light fraction organic C (LFOC) [36]. Soil N fractions were determined following the methodology of Lin et al. [37]. The Kjeldahl microtitration method was used to determine acid-hydrolyzable N (AHN). Soil HAN was determined using the magnesium oxide steam distillation method, while the concentration of amino sugar N (ASN) was calculated as follows: the hydrolyzed material was subjected to steam distillation using a phosphate–borate buffer solution, and the difference between the resulting value and HAN was taken as ASN. Amino acid N (AAN) was determined using the indophenol colorimetric method. The concentration of hydrolyzed non-ammonium N (HUN) was calculated using the formula: HUN = AHN − (ASN + AAN + HAN). Non-hydrolyzable N (NHN) was estimated by subtracting AHN from total N. Gross nitrification rate (GN) was measured by the 15N isotope technique and using a Sercon Integra 2 isotope ratio mass spectrometer (Sercon Ltd., Crewe, UK).

2.3. DNA Extraction and Quantitative PCR Analyses

Total nucleic acids were extracted from 0.5 g of soil aggregate components. Following the manufacturer’s instructions, soil DNA extraction was performed using the Fast DNA® Soil Spin Kit (MP Biomedicals, Solon, OH, USA). The extracted DNA was stored at −20 °C for subsequent use. The quality and concentration of soil DNA were determined using a NanoDrop 2000 spectrophotometer (Thermo Fisher Scientific, Wilmington, DE, USA). To explore the response of soil N2O emissions related to functional microorganisms, real-time quantitative PCR analysis was employed to measure the abundance of multiple genes. These genes include those of ammonia-oxidizing archaea (AOA), ammonia-oxidizing bacteria (AOB), nitrite-reducing bacteria and fungi (nirK, nirS, and fungal nirK), as well as N2O-reducing bacteria (nosZI). Gene abundance was evaluated through real-time quantitative PCR conducted on a CFX-96 thermal cycler (Bollinger Laboratories, Hercules, CA, USA). The analysis included three biological replicates, with three technical replicates set up for each biological replicate. The qPCR reaction mixture contained 10 µL SYBR Premix Ex Taq (Dalian Bao Bio Company, Dalian, China), 0.5 µM of each primer, and 1 µL of DNA template (7.0–23.5 ng). The amplification program was as follows: 95 °C for 1 min × 1 cycle; 95 °C for 15 s, 60 °C for 15 s, and 72 °C for 30 s × 40 cycles; and 95 °C for 5 s, 60 °C for 1 min, and 95 °C and 50 °C for 30 s × 1 cycles.

2.4. Soil N2O Measurements

Gas samples was collected after 1, 2, 4, 7, 14, 21, and 28 days of incubation at 60% water holding capacity. Before gas collection, a substantial amount of air was introduced into the serum vials to displace the gas within them. The vials were then sealed with adhesive plugs and aluminum caps. Approximately 15 mL of gas was extracted from the vials using a 25 mL syringe at both 0 and 45 min after sealing. During the collection process, the syringe was moved back and forth to ensure thorough mixing of the gas inside the vials. The gas was analyzed using a gas chromatograph (Shimadzu GC-2014, Shimadzu Corporation, Suzhou, China) to determine the concentrations of N2O.

2.5. Statistical Analyses

The experimental data were organized using Excel 2019. Analysis of variance (ANOVA) was used to further analyze intergroup differences using Duncan’s multiple comparison method, with (p < 0.05) as the criterion for statistical significance. Corresponding graphs were drawn using Origin 2021. Principal component analysis was applied to explore the relationships among variables. Statistical analyses were performed using IBM SPSS Version 24. Bivariate correlation analysis and linear fitting methods were used to analyze the correlations between soil physicochemical properties, genes, and GN, and the linear correlation between quantitative variables was quantified using Pearson’s correlation coefficient (p < 0.05).

3. Results

3.1. Soil Physicochemical Properties

Our results indicated that forest fires induced significant changes in soil chemical properties (Table 1). Forest fires increased the soil pH (+5.02%, p = 0.001) and the concentrations of SOC (+27.9%, p = 0.002), NH4+-N (+33.3%, p = 0.047), EOC (+35.0%, p = 0.01), LFOC (+31.9%, p = 0.02), HAN (+13.1%, p = 0.003), ASN (+11.4%, p = 0.023), and HUN (+84.6%, p = 0.006). In contrast, forest fires reduced the soil concentrations of NO3-N (−7.41%, p = 0.001), POC (−34.8%, p = 0.001), DOC (−8.92%, p < 0.0001), and NHN (−30.1%, p = 0.006). However, forest fires exerted no significant influence on the concentrations of total N and AAN.

3.2. N-Cycling Functional Gene Abundances

Forest fires significantly reduced the abundances of AOA (−37.5%, p = 0.002) and AOB (−71.0%, p < 0.0001; Figure 1a,b). In contrast, forest fires significantly increased the abundances of nirK (+16.3%, p = 0.043), nirS (+27.5%, p = 0.007), and nosZI (+28.0%, p = 0.001; Figure 1c–e). However, fire had no significant effect on the abundance of fungi-nirK (Figure 1f).

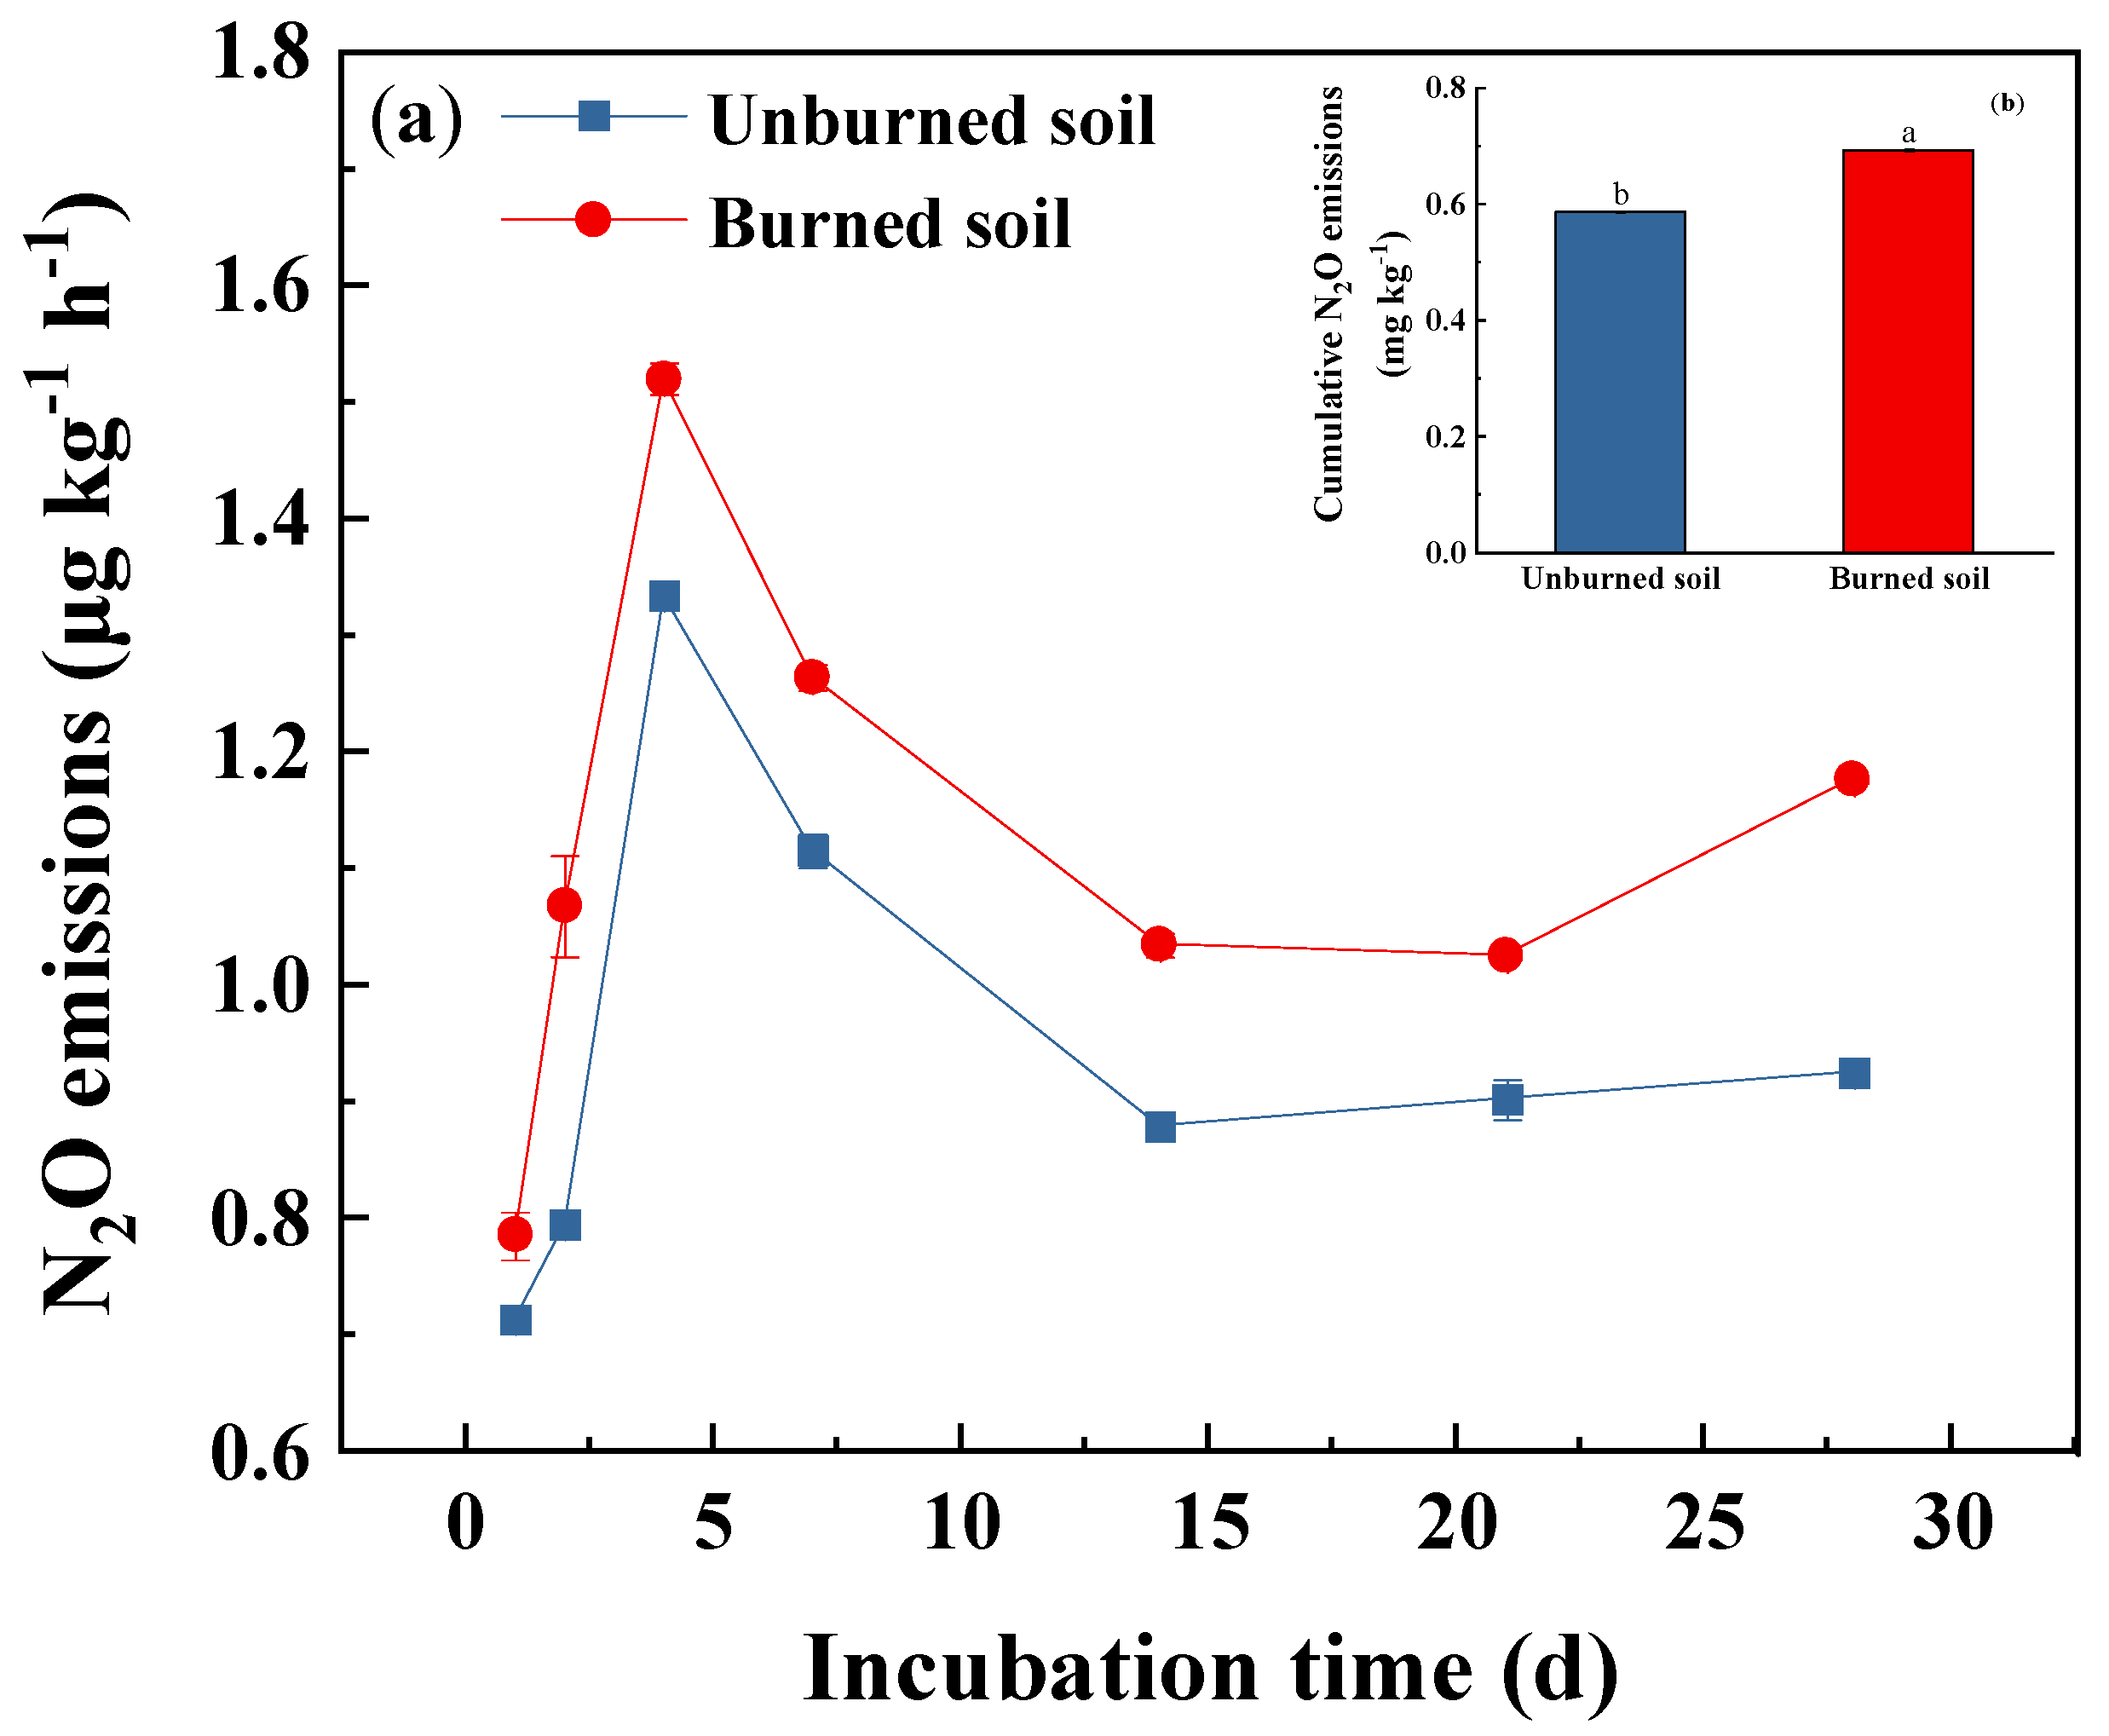
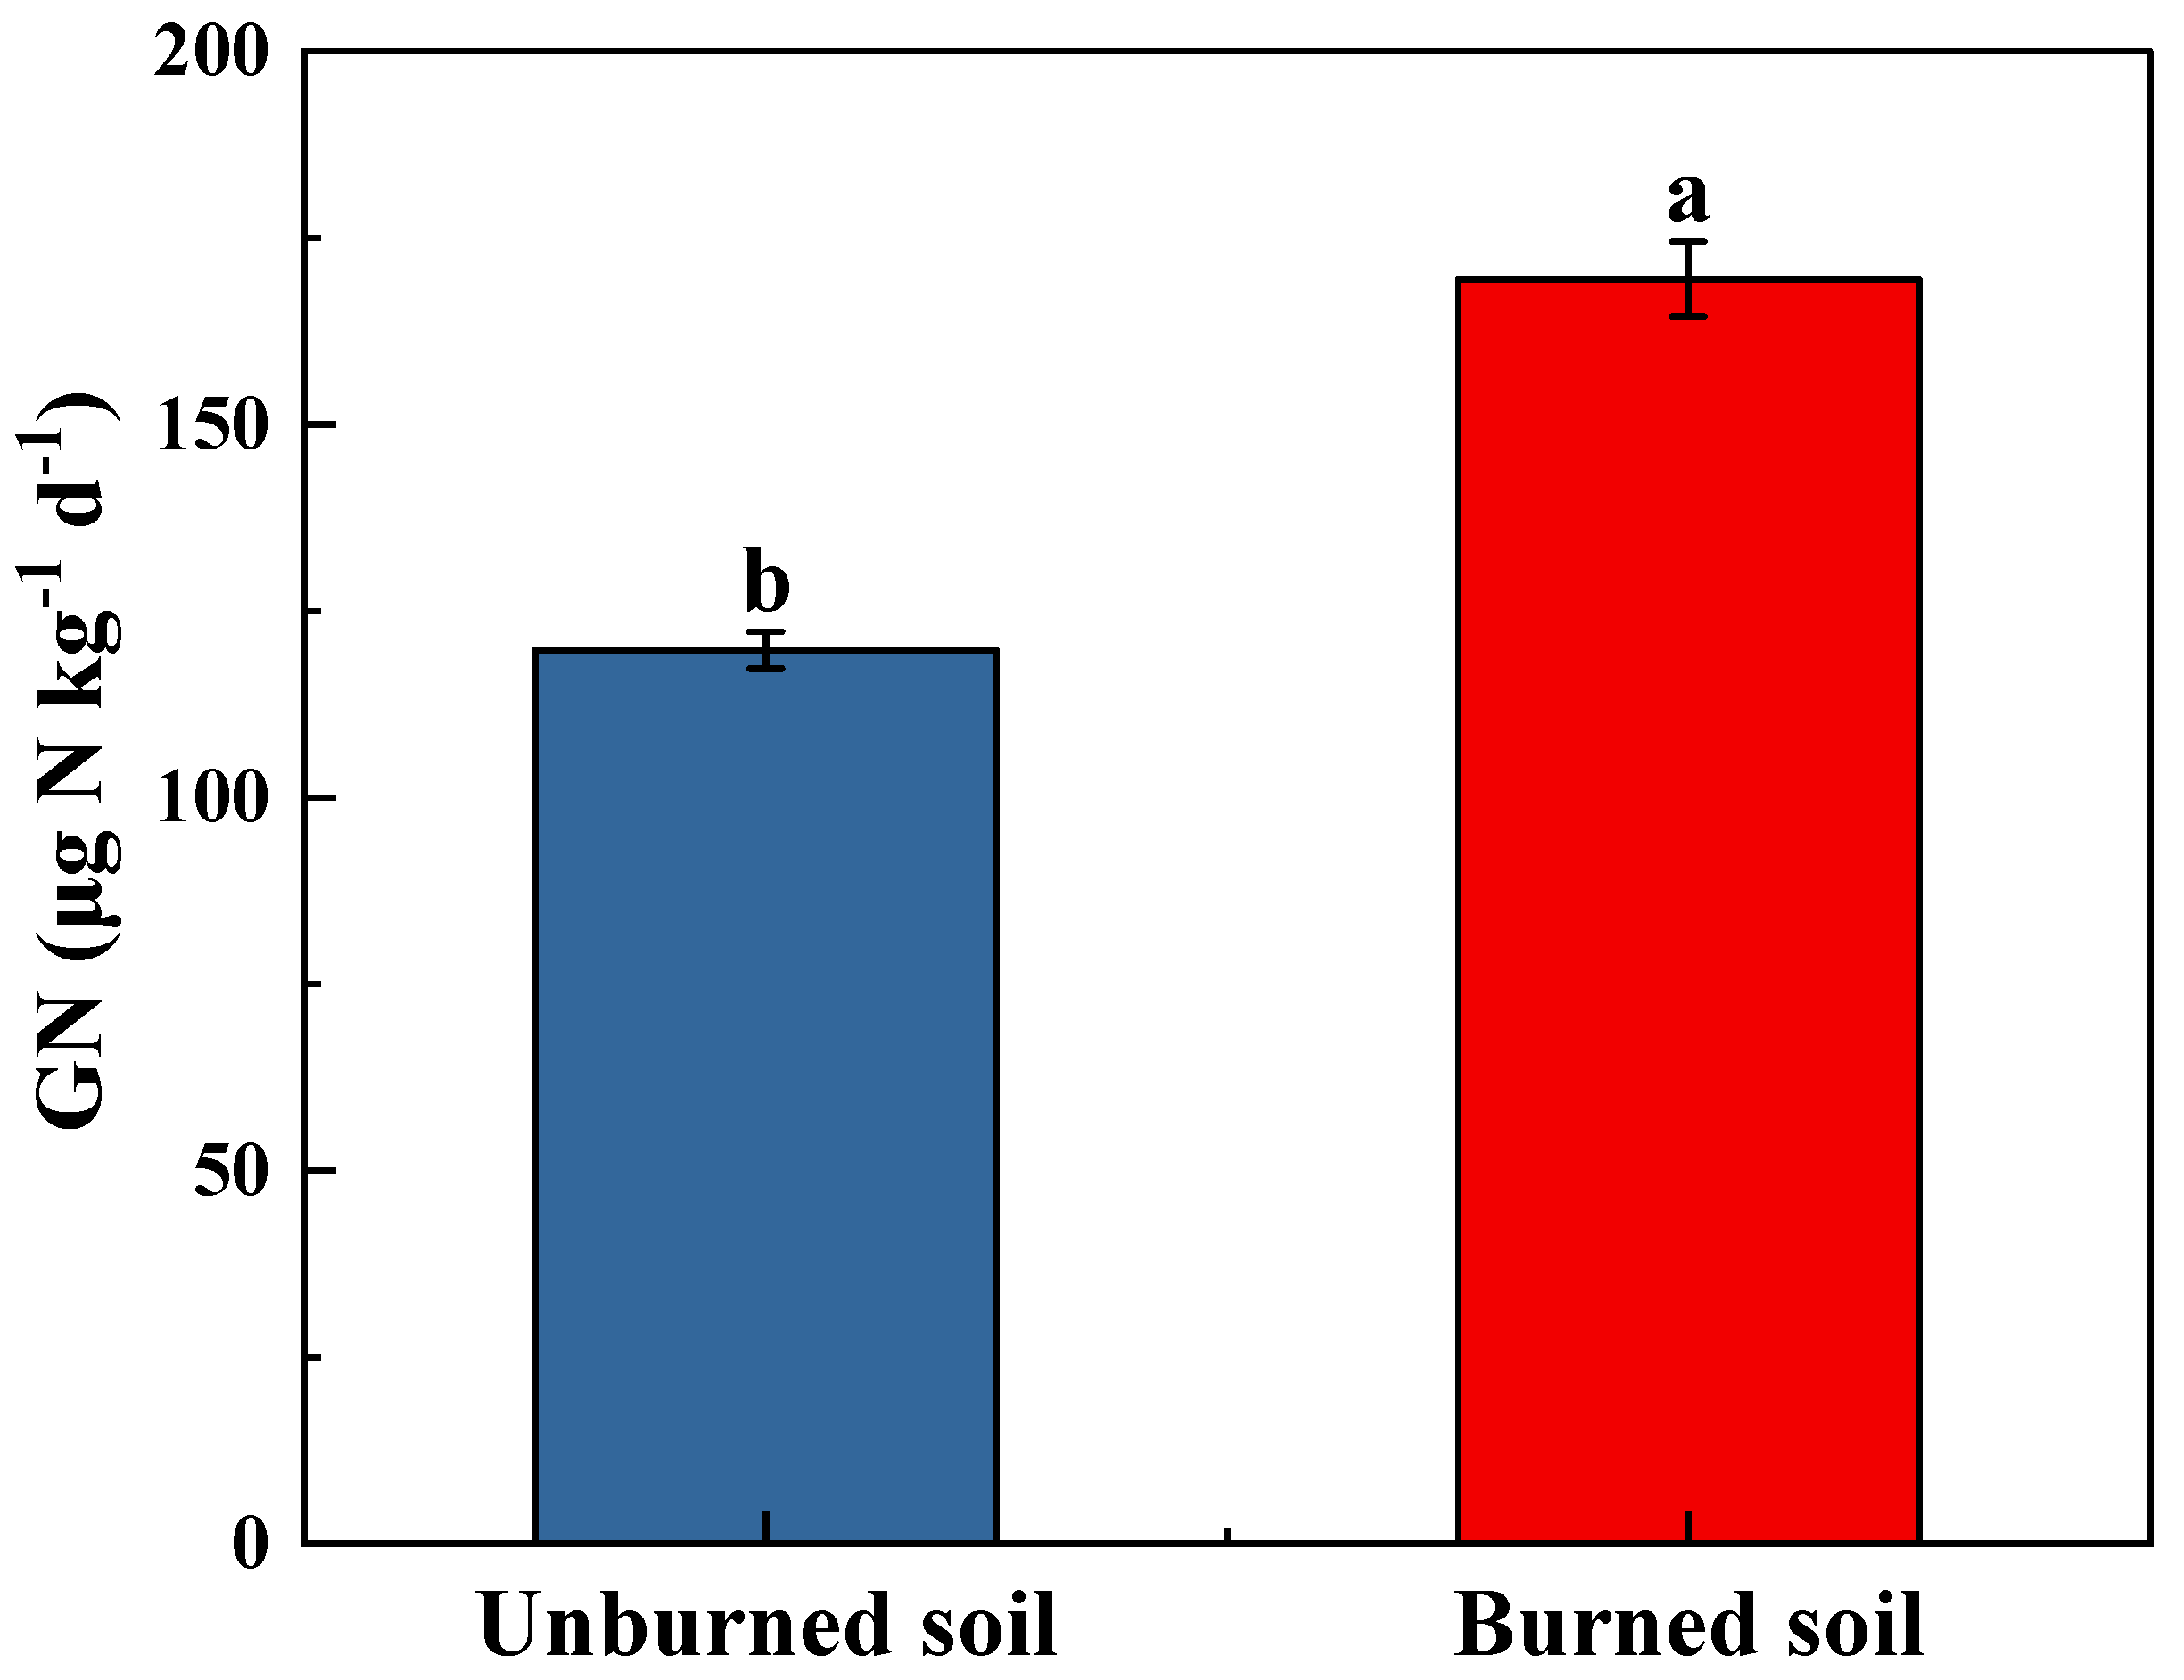
3.3. Soil N2O Fluxes and Gross Nitrification Rate

As shown in Figure 2, forest fires continuously augmented soil N2O fluxes. The statistical analysis indicated that the treatment effects were significant (p < 0.05). Peak N2O emissions from both unburned and burned soils occurred on day 4. After 28 days of incubation, the cumulative N2O emission from the burned soil was significantly higher than that from the unburned soil (p < 0.05). Forest fires significantly increased GN by 41.5% compared to unburned soils (Figure 3).

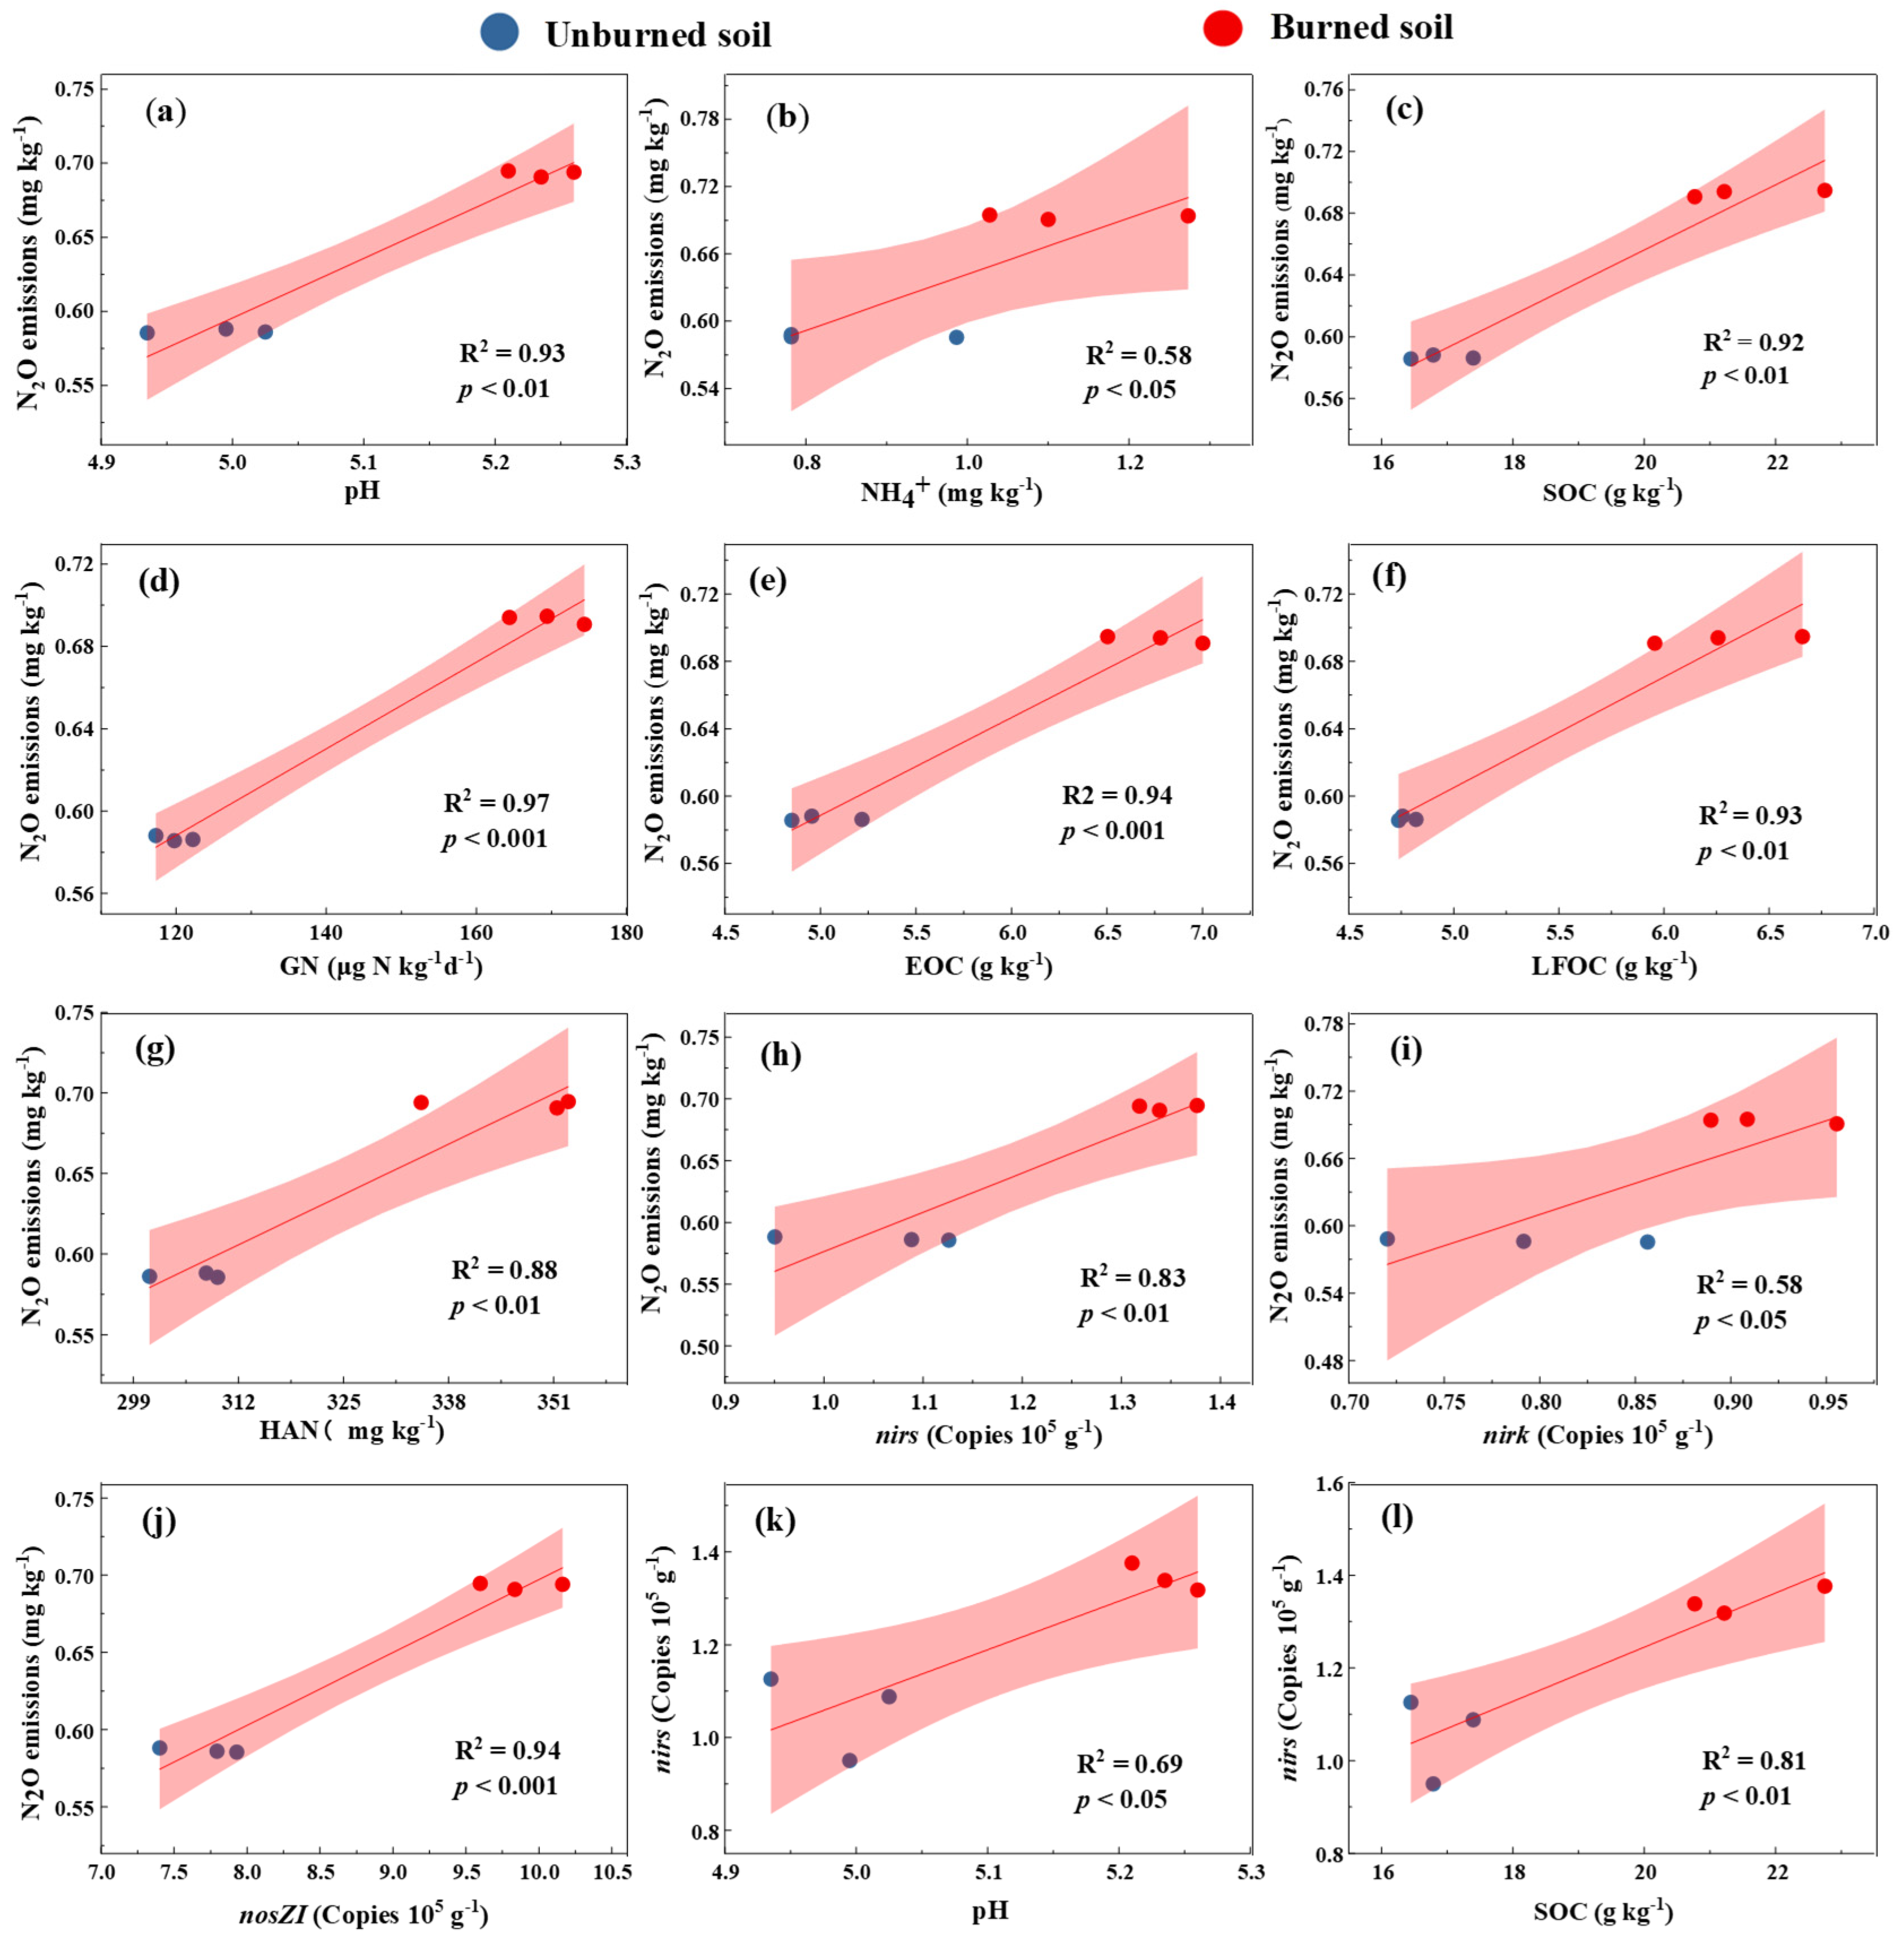
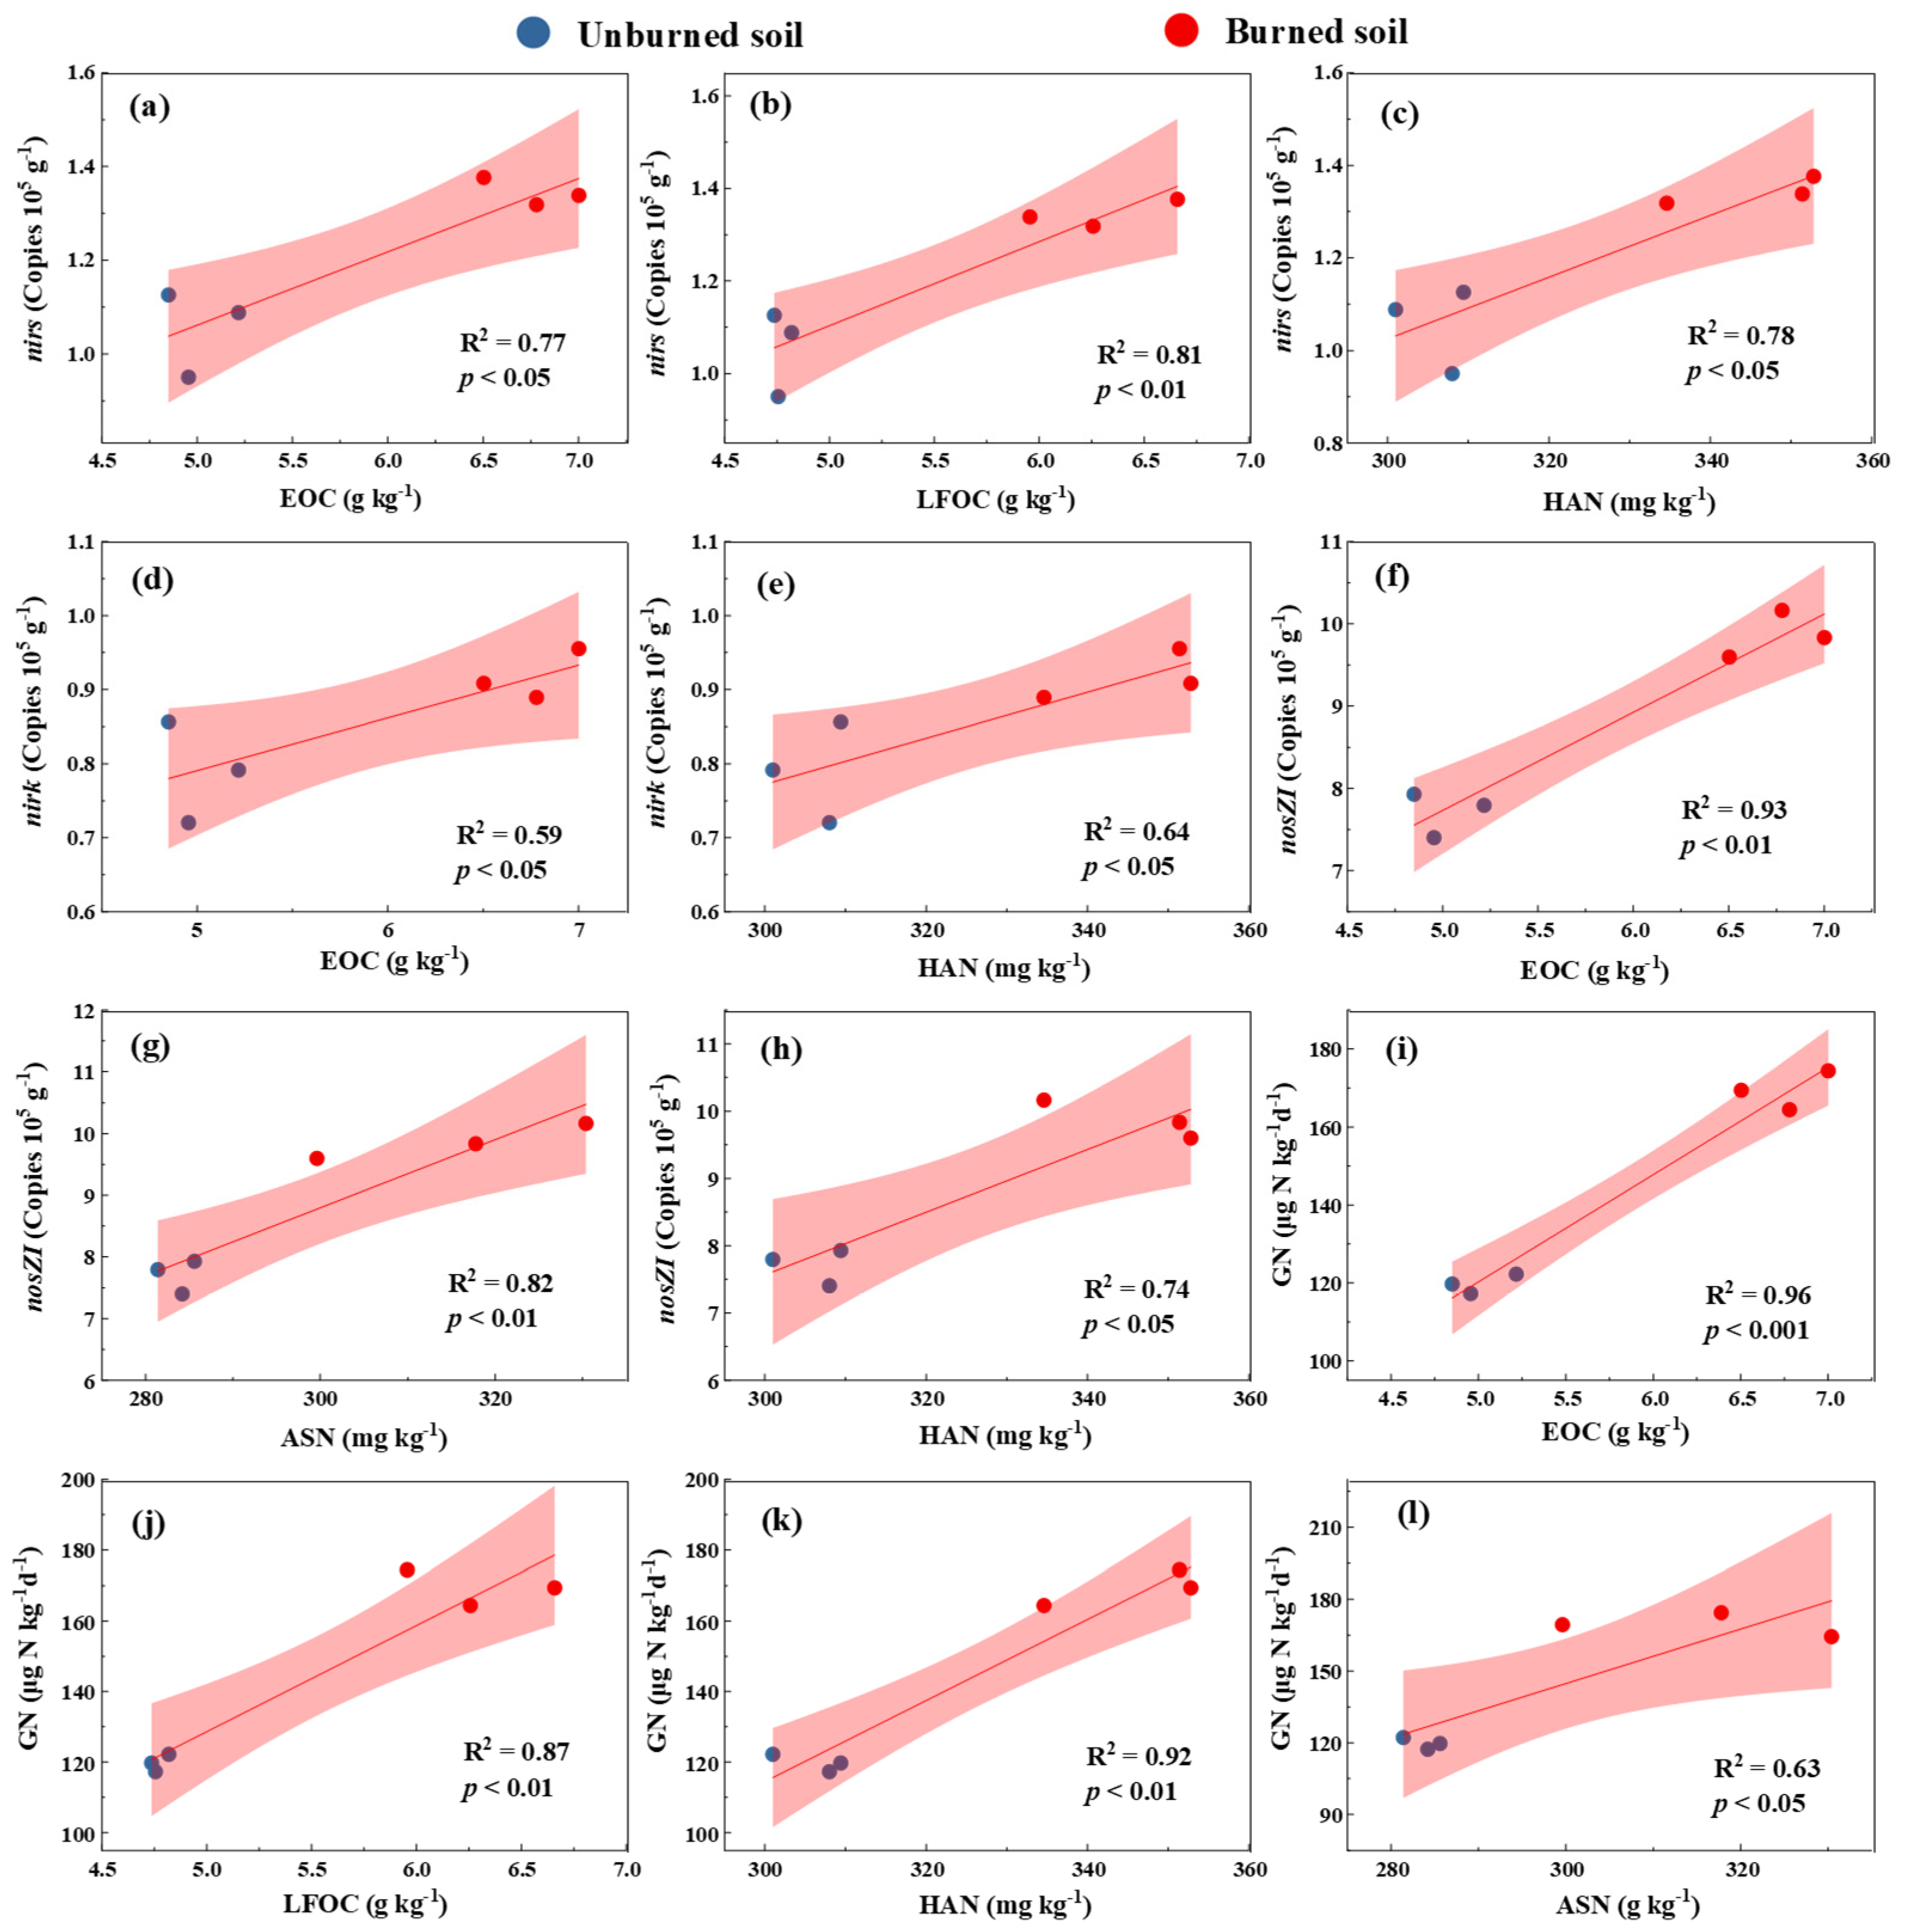
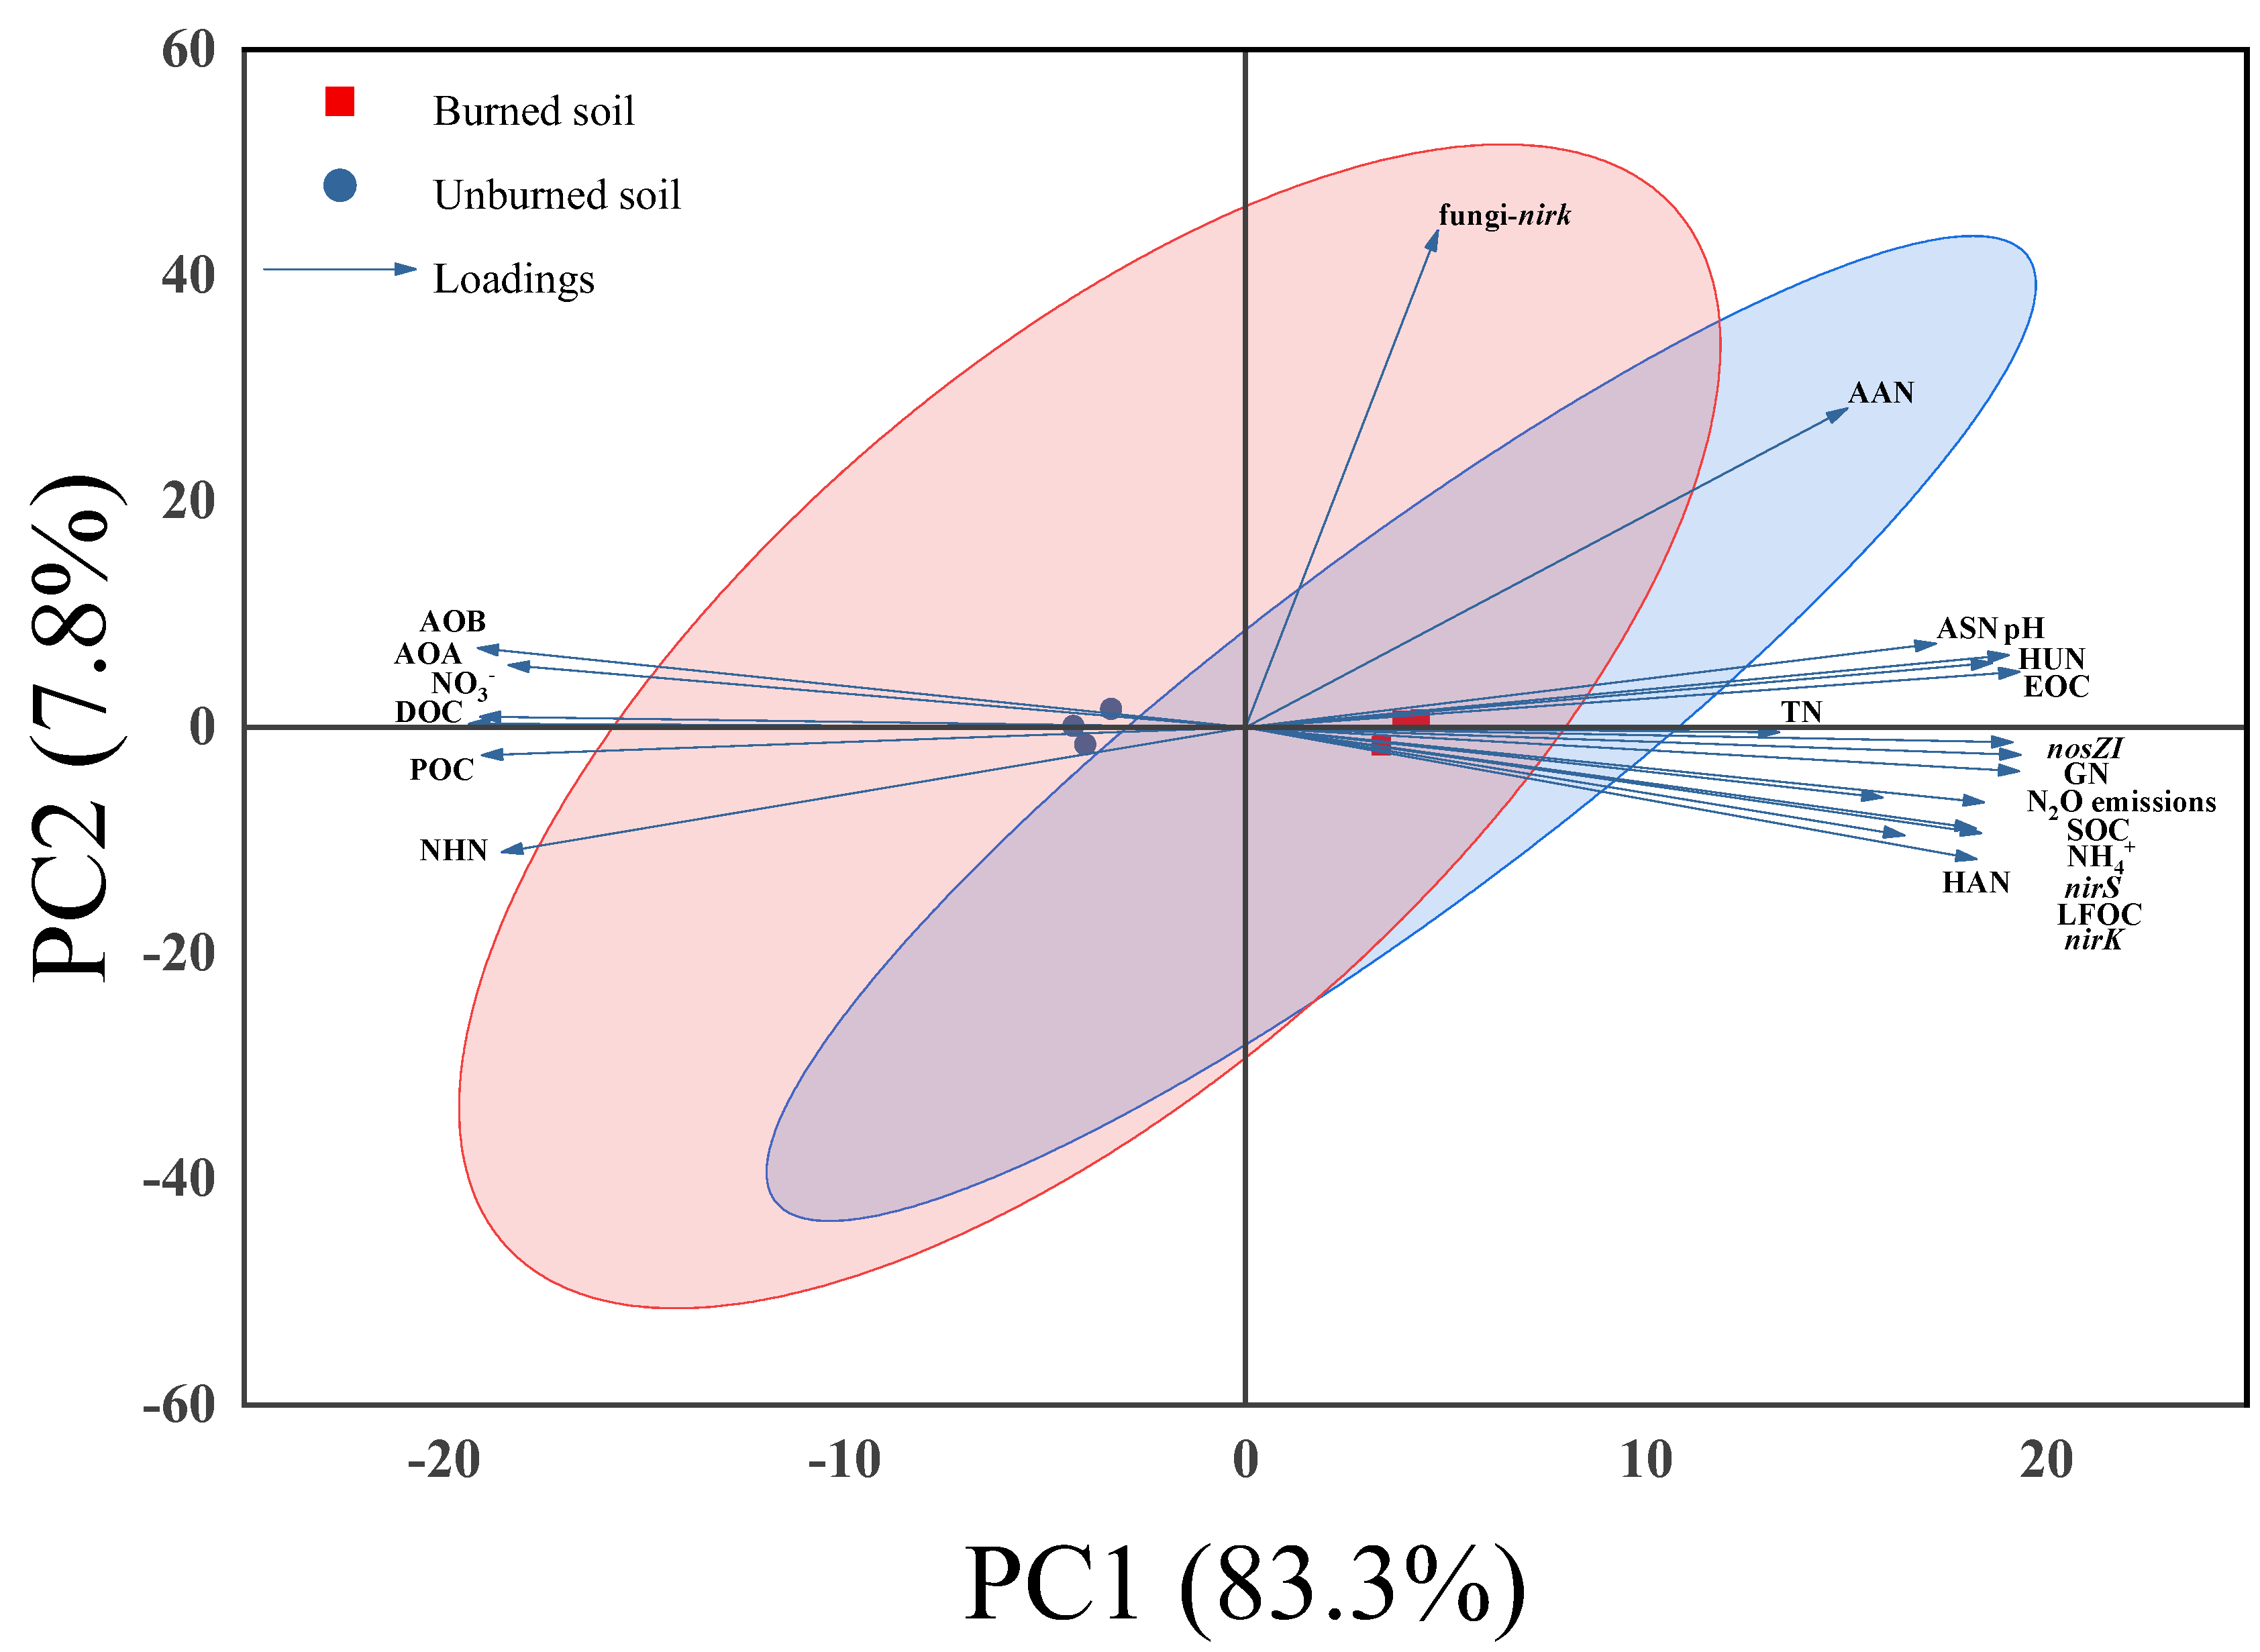
3.4. Relationships Among Studied Variables

The fitted relationships showed that soil N2O emissions were significantly and positively linearly correlated with the soil pH, NH4+, SOC, GN, EOC, LFOC, HAN, nirS, nirK, and nosZI (Figure 4a–j). The abundance of nirS increased significantly with the increasing soil pH, SOC, EOC, LFOC, and HAN (Figure 4k,l and Figure 5a–c). EOC and HAN were positively and linearly correlated with nirK (Figure 5d,e). The abundance of nosZI significantly increased with the increasing EOC, ASN, and HAN (Figure 5f–h). The GN rate had a significant and positive correlation with EOC, LFOC, HAN, and ASN (Figure 5i–l).
The principal component analysis results revealed strong relationships among the studied variables (Figure 6). PC1 and PC2 explained 83.3% and 7.8% of the total variance, respectively, with a cumulative contribution rate of 91.1%. Burned soil and unburned soil exhibited a clear separation trend in the PC1–PC2 space, which intuitively reflects significant differences between the two soil types in the combination of variables analyzed. GN, total N, HUN, pH, EOC, N2O emissions, ASN, SOC, LFOC, HAN, NH4⁺, and denitrification-related genes nirS, nirK, and nosZI showed high correlations in the PC1 region.

4. Discussion

4.1. Fire Increased Soil NO3 Production

At the ecosystem scale, the effects of fire on GN are extremely complex, with processes intertwined with changes in soil physicochemical properties, changes in the microbial community structure and function, and the feedback regulation of the ecosystem [21]. Zhu et al. [15] showed that fire significantly increased the gross N mineralization rate by 37.8%, which may have provided a richer inorganic N substrate for nitrification, thus driving up the GN. This is consistent with our findings that fire disturbance led to a significant increase in the NH4+ concentration in tropical forest soils (Table 1), providing substrate support for the nitrification process. However, fire led to a substantial reduction in the microbial assimilation of NO3 [15], increasing the risk of NO3 loss (Table 1). Alterations in the microbial community structure and function play a central role in how fire affects GN. AOB and AOA are the main microbial taxa driving nitrification, and changes in their abundance, activity, and community composition directly affect nitrification rates [38]. Srikanthasamy et al. [21] found a decreasing trend in the archaeal nitrifying transcriptional activity and nitrifying enzyme activity after a fire in a study in a humid savanna. Consistent with their findings, the abundance of AOA and AOB significantly decreased in our study (Figure 1a,b). Fire significantly increased the pH of tropical forest soils [15]. For AOA and AOB, the soil pH is a key factor in their ecological niche isolation [39]. The increase in the soil pH after fire may disrupt the original ecological balance of AOA and AOB, leading to a decrease in their abundance. However, the soil microbial population killed by high temperatures can act as a substrate for the N cycling process [15,40], thus maintaining or increasing GN. The scientific community is still divided on the effects of fire on C and N in soil [41]. Our results showed that the effect of fire on the soil’s total N was not significant (Table 1). However, the reasons for the inconsistent results of C and N changes may be multifaceted. As suggested by Meng et al. [42], previous studies have tended to focus on the overall change in the C or N concentration or the size of the C or N pool, while neglecting the C and N fractions [29].
The principal component analysis revealed that GN had a significant correlation with HUN, ASN, HAN, LFOC, and EOC in the PC1 (Figure 6), indicating the key role of soil C and N fractions in controlling the nitrification process. The GN is closely associated with HUN, and the hydrolysis products of HUN may provide a N source for nitrifying microorganisms or influence the metabolic environment of microorganisms [43,44], thereby influencing the rate of GN. Amino sugars in soil, as an important component of microbial-derived organic N, participate in soil N transformation and storage [45], thereby promoting an increase in GN (Figure 5l). HAN originates from acid-resistant organic components and serves as a temporary reservoir for rapidly retaining N, contributing approximately 20%–35% of soil N [32] and influencing soil N transformation [29]. LFOC, as a highly active organic C component in soil, provides microorganisms with rapidly available C sources, promoting microbial growth and metabolism [46]. Changes in the EOC content may affect microbial C source utilization and alter the soil microenvironment [28], indirectly regulating GN. An adequate C source supply maintains microbial activity, enhances their N transformation capacity, and thereby increases the rate of GN.

4.2. Fire Stimulated N2O Emissions by Increasing GN and Affecting C and N Fractions

N2O emissions from soils are regulated by a combination of biotic and abiotic factors. Nitrification is the process of ammonia oxidation to NO3, which is the main source of N2O emissions in soil [47]. In this study, we investigated the relationship between GN and N2O emissions in soil under fire disturbances. Our results showed a significant and positive correlation between GN and N2O emissions (Figure 4d). The ammonia monooxygenase amoA gene, encoded by AOA and AOB, plays a key stimulatory role in the nitrification process [48]. NH4+ is a substrate for ammonia oxidation by AOA and AOB, and an increase in the substrate concentration can promote ammonia oxidation to some extent [49,50]. Even if fire reduces the abundance of AOA and AOB (Figure 1a,b), the remaining AOA and AOB can still utilize the abundant substrate for ammonia oxidation, thus maintaining or increasing GN. However, the relationship between GN and N2O emissions is not always straightforward. Other factors, such as C and N concentration, and the presence of functional genes for denitrification, also affect the production of N2O [29]. Our results also confirm this, as N2O emissions show a high correlation with HUN, EOC, ASN, SOC, LFOC, HAN, LFOC, NH4⁺, nirS, nirK, and nosZI (Figure 6). Denitrification is regulated by specific genes, and in this process, nitrite reductase (encoded by the nirK and nirS genes) and N2O reductase (encoded by the nosZI gene) play key roles [51,52]. Soil microbial activities are vigorous in tropical humid regions, and the reduced soil permeability after fire creates an anaerobic microenvironment that provides a suitable growth environment for denitrifying microorganisms and ultimately increases soil N2O emissions [53]. Our results support this hypothesis as fire occurrences led to the positive feedback of denitrifying N cycle genes (nirK, nirS, and nosZI; Figure 1c–e). The results of previous studies on the effects of SOC and total N on N2O emissions have been inconsistent [54,55]. For example, the study by Garcia-Ruiz et al. [56] showed that there was no correlation between SOC and the total N and soil N2O emissions. However, some studies also reported that soil N2O emissions were positively correlated with SOC and total N [26,57]. Soil total N did not correlate with N2O emissions, but soil C and N fractions may have potentially influenced the N2O emissions (Figure 6). The significant increase in EOC concentrations after the fire may be due to the relative stability of aggregates in forest soils in the tropics and the increase in EOC concentrations with the increasing temperature [58,59] (Table 1). The results showed that the denitrification genes (nirS, nirK, and nosZI) were significantly and positively correlated with EOC (Figure 5a,d,f), which was consistent with the findings of Wang et al. [28] indicating that EOC was the main reason triggering the community structure of denitrifying bacteria. The significant increase in the concentration of LFOC in our results (Table 1) is consistent with the findings of Wang et al. [60], who showed that the concentration of LFOC in the soil of fire-prone plant communities in Poyang Lake increased significantly from 14.8 g kg−1 to 20.6 g kg−1 after the fire. The increase in LFOC in the burned soil may be attributed to the post-fire root growth and activity enhancement [61]. Both EOC and LFOC are important energy sources for denitrifiers, increasing the expression of nirk and nirS, crucial genes involved in nitrite reduction in the denitrification pathway.
The experimental results of Zhu et al. [29] showed that HAN could significantly contribute to soil N2O emission by increasing denitrifying gene abundance. This is consistent with our results (Figure 4g and Figure 6). HAN originates from acid-tolerant organic constituents and is a temporary reservoir for rapid N fixation. It includes partially exchangeable NH4+, and the unique rapid-release characteristics of its inorganic nitrogen may represent a critical factor in the enhancement of soil N2O emissions [32]. A higher HAN concentration adsorbs soil NH4+, the substrate for the nitrification process [62]. Fire increases soil NH4+ dramatically, providing energy support for nitrification and denitrification (Figure 6). Interestingly, HAN and ASN showed a significant positive correlation with nosZI after tropical forest fires, demonstrating that N fractions can indirectly affect N2O emissions by influencing denitrification genes (Figure 5g,h). On the one hand, this might stem from the high turnover rate of EOC and its capacity to be directly absorbed and utilized by microorganisms [30,31], which allows it to participate directly in the nitrification process [29]. LFOC exhibits a significant positive correlation with soil respiration and plays a role in organic matter mineralization [63], thus providing substrate support for the nitrification process. On the other hand, fires lead to higher concentrations of HAN and ASN (Table 1), which can adsorb soil NH4⁺, and NH4⁺ is the substrate for the nitrification process [62].
Consistent with previous research findings, this study confirms that fire significantly increases N2O emissions [15,16]. Building on this, this study further reveals that labile C and N play a key driving role in N2O emissions triggered by fire disturbances. This paper is the first to explore the impact of C and N fractions on N2O emissions under fire disturbances in Hainan Province, and it provides an in-depth analysis of the mechanisms by which C and N fractions influence N2O emissions. These findings provide important indicators for assessing N2O emissions from soils in tropical regions. As an important ecological disturbance factor, wildfires not only significantly impact the soil, but also reshape the vegetation composition and structure. Many fire-sensitive plant species die due to the high temperatures caused by wildfires [64]. Frequent wildfires drive changes in the species composition, dominance, and spatial distribution patterns [65]. These changes in the vegetation composition and structure may directly or indirectly influence nitrification, denitrification processes, and soil physical and chemical properties [66], ultimately altering N2O emission patterns. However, due to limitations in the study duration, sampling scope, and analytical methods, systematic research on changes in the vegetation composition and structure has not yet been conducted. This limitation may result in an incomplete understanding of post-fire ecosystem evolution and an inability to fully elucidate the complex feedback mechanisms between the vegetation and soil. Future research plans could incorporate dimensions such as the species composition and community structure into existing research sites to further explore the co-evolutionary mechanisms between the two under fire disturbances.

5. Conclusions

In this study, we investigated the impact of changes in C and N fractions caused by tropical forest fires in Hainan Province on soil N2O emissions. We examined the intricate relationship between fire events and soil N2O emission fluxes, as well as associated changes in genes related to N cycling. The study results showed that N2O emissions were significantly increased under fire disturbances and that fire had a significant effect on C and N fractions in forests. Fire induced positive feedback of GN and denitrification genes (nirK, nirS, and nosZI), which led to a significant increase in soil N2O emissions by 18.2%. These findings emphasize that the C and N fractions (EOC, LFOC, HAN, and ASN) are key regulators of N2O emissions, influencing the relative abundance of functional denitrification genes. We suggest that future studies on soil N2O emissions should not only focus on total soil C and N, but should also consider the roles of the C and N fractions in regulating GN and denitrification genes and soil N2O emissions.

Author Contributions

M.K.: Conceptualization, methodology, writing—original draft, writing—review and editing. A.M.Y. and R.Z.: Investigation, formal analysis, validation. J.F., X.S., Y.W. (Yunxing Wan) and Y.W. (Yuhong Wen): Formal analysis, validation, investigation. Y.W. (Yanzheng Wu), A.S.E., J.Z., Q.H. and L.M.: Conceptualization, methodology, software, resources, investigation, supervision, project administration, funding acquisition. All authors have read and agreed to the published version of the manuscript.

Funding

Financial support for this work was provided by the National Natural Science Foundation of China (RZ2400002277) and the Hainan Provincial Graduate Students’ Innovative Research Project (RC2500003534).

Data Availability Statement

Data are contained within this article.

Conflicts of Interest

The authors declare no conflicts of interest.

References

  1. Lizundia-Loiola, J.; Oton, G.; Ramo, R.; Chuvieco, E. A spatio-temporal active-fire clustering approach for global burned area mapping at 250 m from MODIS data. Remote Sens. Environ. 2020, 236, 111493. [Google Scholar] [CrossRef]
  2. Butler, O.M.; Elser, J.J.; Lewis, T.; Mackey, B.; Chen, C. The phosphorus-rich signature of fire in the soil-plant system: A global meta-analysis. Ecol. Lett. 2018, 21, 335–344. [Google Scholar] [CrossRef] [PubMed]
  3. Pellegrini, A.F.A.; Ahlstrom, A.; Hobbie, S.E.; Reich, P.B.; Nieradzik, L.P.; Staver, A.C.; Scharenbroch, B.C.; Jumpponen, A.; Anderegg, W.R.L.; Randerson, J.T.; et al. Fire frequency drives decadal changes in soil carbon and nitrogen and ecosystem productivity. Nature 2018, 553, 194–198. [Google Scholar] [CrossRef]
  4. Alonso-Canas, I.; Chuvieco, E. Global burned area mapping from ENVISAT-MERIS and MODIS active fire data. Remote Sens. Environ. 2015, 163, 140–152. [Google Scholar] [CrossRef]
  5. Blunden, M.H.; Florence, L.; Bryceson, S.R.; Clark, G.J.; Morgan, J.W.; Wood, J.L. Fire regime impacts on soil microbes, soil organic carbon and ground cover in an Australian tropical savanna. Int. J. Wildland Fire 2024, 33, 12. [Google Scholar] [CrossRef]
  6. Nelson, A.R.; Narrowe, A.B.; Rhoades, C.C.; Fegel, T.S.; Daly, R.A.; Roth, H.K.; Chu, R.K.; Amundson, K.K.; Young, R.B.; Steindorff, A.S.; et al. Wildfire-dependent changes in soil microbiome diversity and function. Nat. Microbiol. 2022, 7, 1419–1430. [Google Scholar] [CrossRef] [PubMed]
  7. Marfella, L.; Mairota, P.; Marzaioli, R.; Glanville, H.C.; Pazienza, G.; Rutigliano, F.A. Long-term impact of wildfire on soil physical, chemical and biological properties within a pine forest. Eur. J. For. Res. 2024, 143, 1379–1399. [Google Scholar] [CrossRef]
  8. Zhang, W.; Li, Y.; Xu, C.; Li, Q.; Lin, W. Isotope signatures of N2O emitted from vegetable soil: Ammonia oxidation drives N2O production in NH4+-fertilized soil of North China. Sci. Rep. 2016, 6, 29257. [Google Scholar] [CrossRef]
  9. Arai, H.; Hadi, A.; Darung, U.; Limin, S.H.; Takahashi, H.; Hatano, R.; Inubushi, K. Land use change affects microbial biomass and fluxes of carbon dioxide and nitrous oxide in tropical peatlands. Soil Sci. Plant Nutr. 2014, 60, 423–434. [Google Scholar] [CrossRef]
  10. Guetlein, A.; Gerschlauer, F.; Kikoti, I.; Kiese, R. Impacts of climate and land use on N2O and CH4 fluxes from tropical ecosystems in the Mt. Kilimanjaro region, Tanzania. Glob. Change Biol. 2018, 24, 1239–1255. [Google Scholar] [CrossRef]
  11. Krishna, M.; AchutaRao, B.A.N.; Aldrian, E.; Armour, K. Climate Change 2021: The Physical Science Basis. Available online: https://www.ipcc.ch/report/ar6/wg1/ (accessed on 8 June 2025).
  12. Metcalfe, D.B.; Rocha, W.; Balch, J.K.; Brando, P.M.; Doughty, C.E.; Malhi, Y. Impacts of fire on sources of soil CO2 efflux in a dry Amazon rain forest. Glob. Change Biol. 2018, 24, 3629–3641. [Google Scholar] [CrossRef]
  13. Hu, M.; Song, J.; Li, S.; Li, Z.; Hao, Y.; Di, M.; Wan, S. Understanding the effects of fire and nitrogen addition on soil respiration of a field study by combining observations with a meta-analysis. Agric. For. Meteorol. 2020, 292, 108106. [Google Scholar] [CrossRef]
  14. Akande, O.J.; Ma, Z.; Huang, C.; He, F.; Chang, S.X. Meta-analysis shows forest soil CO2 effluxes are dependent on the disturbance regime and biome type. Ecol. Lett. 2023, 26, 765–777. [Google Scholar] [CrossRef]
  15. Zhu, Q.; Liu, J.; Liu, L.; El-Tarabily, K.A.; Uwiragiye, Y.; Dan, X.; Tang, S.; Wu, Y.; Zhu, T.; Meng, L.; et al. Fire Reduces Soil Nitrate Retention While Increasing Soil Nitrogen Production and Loss Globally. Environ. Sci. Technol. 2024, 58, 23004–23017. [Google Scholar] [CrossRef] [PubMed]
  16. Guo, J.; Feng, H.; Peng, C.; Du, J.; Wang, W.; Kneeshaw, D.; Pan, C.; Roberge, G.; Feng, L.; Chen, A. Fire effects on soil CH4 and N2O fluxes across terrestrial ecosystems. Sci. Total Environ. 2024, 948, 174708. [Google Scholar] [CrossRef] [PubMed]
  17. Stephens, E.Z.; Homyak, P.M. Post-fire soil emissions of nitric oxide (NO) and nitrous oxide (N2O) across global ecosystems: A review. Biogeochemistry 2023, 165, 291–309. [Google Scholar] [CrossRef]
  18. Luo, X.; Zeng, L.; Wang, L.; Qian, H.; Hou, C.; Wen, S.; Wang, B.; Huang, Q.; Chen, W. Abundance for subgroups of denitrifiers in soil aggregates asscociates with denitrifying enzyme activities under different fertilization regimes. Appl. Soil Ecol. 2021, 166, 103983. [Google Scholar] [CrossRef]
  19. Bahram, M.; Espenberg, M.; Parn, J.; Lehtovirta-Morley, L.; Anslan, S.; Kasak, K.; Koljalg, U.; Liira, J.; Maddison, M.; Moora, M.; et al. Structure and function of the soil microbiome underlying N2O emissions from global wetlands. Nat. Commun. 2022, 13, 1430. [Google Scholar] [CrossRef] [PubMed]
  20. Vasquez, K.T. Wildfires May Alter the Nitrogen Cycle—And Air Pollution. Eos 2021, 102. [Google Scholar] [CrossRef]
  21. Srikanthasamy, T.; Barot, S.; Koffi, F.K.; Tambosco, K.; Marcangeli, Y.; Carmignac, D.; N’Dri, A.B.; Gervaix, J.; Le Roux, X.; Lata, J.-C. Short-term impact of fire on the total soil microbial and nitrifier communities in a wet savanna. Ecol. Evol. 2021, 11, 9958–9969. [Google Scholar] [CrossRef] [PubMed]
  22. Wu, X.; Liu, H.; Fu, B.; Wang, Q.; Xu, M.; Wang, H.; Yang, F.; Liu, G. Effects of land-use change and fertilization on N2O and NO fluxes, the abundance of nitrifying and denitrifying microbial communities in a hilly red soil region of southern China. Appl. Soil Ecol. 2017, 120, 111–120. [Google Scholar] [CrossRef]
  23. Yang, S.; Zheng, Q.; Yang, Y.; Yuan, M.; Ma, X.; Chiariello, N.R.; Docherty, K.M.; Field, C.B.; Gutknecht, J.L.; Hungate, B.A. Fire affects the taxonomic and functional composition of soil microbial communities, with cascading effects on grassland ecosystem functioning. Glob. Change Biol. 2020, 26, 431–442. [Google Scholar] [CrossRef] [PubMed]
  24. Huang, Z.; Zhan, X.; Tigabu, M.; He, Y.; Li, Z.; Wang, G.; Guo, F. Rhizosphere soil microbial communities and nitrogen transformation response to forest fire smoke. Appl. Soil Ecol. 2025, 208, 105990. [Google Scholar] [CrossRef]
  25. Jiang, D.; Xu, C.; Xu, X.; Luo, Y.; Chen, C.; Ju, C.; Chen, H.Y.H.; Shi, Z.; Ruan, H. Carbon and nitrogen dynamics in tropical ecosystems following fire. Glob. Ecol. Biogeogr. 2022, 31, 378–391. [Google Scholar] [CrossRef]
  26. Duan, P.P.; Zhou, J.; Feng, L.; Jansen-Willems, A.B.; Xiong, Z.Q. Pathways and controls of N2O production in greenhouse vegetable production soils. Biol. Fertil. Soils 2019, 55, 285–297. [Google Scholar] [CrossRef]
  27. Malghani, S.; Yoo, G.Y.; Giesemann, A.; Well, R.; Kang, H. Combined application of organic manure with urea does not alter the dominant biochemical pathway producing N2O from urea treated soil. Biol. Fertil. Soils 2020, 56, 331–343. [Google Scholar] [CrossRef]
  28. Wang, N.; Luo, J.-L.; Juhasz, A.L.; Li, H.-B.; Yu, J.-G. Straw decreased N2O emissions from flooded paddy soils via altering denitrifying bacterial community compositions and soil organic carbon fractions. Fems Microbiol. Ecol. 2020, 96, fiaa046. [Google Scholar] [CrossRef]
  29. Zhu, Q.; Liu, L.; Wang, C.; Wan, Y.; Yang, R.; Mou, J.; Liu, J.; Wu, Y.; Tang, S.; Zhu, T.; et al. Carbon and nitrogen fractions control soil N2O emissions and related functional genes under land-use change in the tropics. Environ. Pollut. 2023, 335, 122370. [Google Scholar] [CrossRef]
  30. Lan, J. Responses of soil organic carbon components and their sensitivity to karst rocky desertification control measures in Southwest China. J. Soils Sediments 2021, 21, 978–989. [Google Scholar] [CrossRef]
  31. Han, X.; Liu, X.; Li, Z.; Li, J.; Yuan, Y.; Li, H.; Zhang, L.; Liu, S.; Wang, L.; You, C.; et al. Characteristics of Soil Organic Carbon Fractions and Stability along a Chronosequence of Cryptomeria japonica var. sinensis Plantation in the Rainy Area of Western China. Forests 2022, 13, 1663. [Google Scholar] [CrossRef]
  32. Lu, H.; He, H.; Zhao, J.; Zhang, W.; Xie, H.; Hu, G.; Liu, X.; Wu, Y.; Zhang, X. Dynamics of fertilizer-derived organic nitrogen fractions in an arable soil during a growing season. Plant Soil 2013, 373, 595–607. [Google Scholar] [CrossRef]
  33. Zhang, Y.; Zhang, X.; Zhou, C.; Lei, P.; Sootahar, M.K.; Ni, J. Organic and Inorganic Nitrogen forms as Affected by Phosphorus Additions in a Maize-Mustard Cropping System. Clean-Soil Air Water 2022, 50, 2100240. [Google Scholar] [CrossRef]
  34. Taikui, L.; Zhanling, G.; Changlin, K.; Jinling, L.; Xiangning, Z.; Xiaolin, Y. Effects of Extraction Conditions on the Test Results of Soil Dissolved Organic Carbon. J. Ecol. Environ. Sci. 2017, 26, 1878. [Google Scholar] [CrossRef]
  35. Xuesong, G.; Peng, H.; Liangji, D.; Shirong, Z.; Chun, H. Distribution characteristics of soil total organic carbon and particle organic carbon on the purple hilly region slopes. J. Ecol. Environ. Sci. 2009, 18, 337. [Google Scholar] [CrossRef]
  36. Bingyan, L.; Haiyan, X.; Xiaodong, W.; Biying, C.; Zipeng, G.; Shouye, X. Differences of Soil Organic Carbon Components in Different Grassland Types of Qilian Mountain. J. Earth Sci. 2024, 49, 1487–1497. [Google Scholar] [CrossRef]
  37. Lin, J.; Tang, Y.; Liu, D.; Zhang, S.; Lan, B.; He, L.; Yu, Z.; Zhou, S.; Chen, X.; Qu, Y. Characteristics of organic nitrogen fractions in sediments of the water level fluctuation zone in the tributary of the Yangtze River. Sci. Total Environ. 2019, 653, 327–333. [Google Scholar] [CrossRef]
  38. Wang, D.; Sheng, K.; Zhao, W.; Li, L.; Zhang, Q.; Wang, Y. Dominance of archaeal ammonia-oxidizers in soil nitrification across different soil types and fertilities in North China plain. Eur. J. Soil Biol. 2021, 106, 103354. [Google Scholar] [CrossRef]
  39. Tzanakakis, V.A.; Taylor, A.E.; Bakken, L.R.; Bottomley, P.J.; Myrold, D.D.; Dorsch, P. Relative activity of ammonia oxidizing archaea and bacteria determine nitrification-dependent N2O emissions in Oregon forest soils. Soil Biol. Biochem. 2019, 139, 107612. [Google Scholar] [CrossRef]
  40. Elrys, A.S.; Ali, A.; Zhang, H.M.; Cheng, Y.; Zhang, J.B.; Cai, Z.C.; Müller, C.; Chang, S.X. Patterns and drivers of global gross nitrogen mineralization in soils. Glob. Change Biol. 2021, 27, 5950–5962. [Google Scholar] [CrossRef]
  41. Li, J.; Pei, J.; Liu, J.; Wu, J.; Li, B.; Fang, C.; Nie, M. Spatiotemporal variability of fire effects on soil carbon and nitrogen: A global meta-analysis. Glob. Change Biol. 2021, 27, 4196–4206. [Google Scholar] [CrossRef]
  42. Meng, C.; Liu, Y.; Su, W.; Zhang, J.; Luo, Y.; Zhang, Q.; Di, H.; Tang, C.; Xu, J.; Li, Y. Nutrient availability and microbial traits constrained by soil texture modulate the impact of forest fire on gross nitrogen mineralization. For. Ecol. Manag. 2023, 541, 121067. [Google Scholar] [CrossRef]
  43. Zhang, M.; Zeng, H.; Afzal, M.R.; Gao, X.; Li, Y.; Subbarao, G.V.; Zhu, Y. BNI-release mechanisms in plant root systems: Current status of understanding. Biol. Fertil. Soils 2022, 58, 225–233. [Google Scholar] [CrossRef]
  44. Subbarao, G.; Sahrawat, K.L.; Nakahara, K.; Ishikawa, T.; Kishii, M.; Rao, I.; Hash, C.; George, T.; Rao, P.S.; Nardi, P. Biological nitrification inhibition—A novel strategy to regulate nitrification in agricultural systems. Adv. Agron. 2012, 114, 249–302. [Google Scholar] [CrossRef]
  45. Glaser, B.; Turrión, M.a.-B.; Alef, K. Amino sugars and muramic acid—Biomarkers for soil microbial community structure analysis. Soil Biol. Biochem. 2004, 36, 399–407. [Google Scholar] [CrossRef]
  46. Hassan, W.; Bashir, S.; Ahmed, N.; Tanveer, M.; Shah, A.N.; Bano, R.; David, J. Labile Organic Carbon Fractions, Regulator of CO2 Emission: Effect of Plant Residues and Water Regimes. Clean-Soil Air Water 2016, 44, 1358–1367. [Google Scholar] [CrossRef]
  47. Inatomi, M.; Hajima, T.; Ito, A. Fraction of nitrous oxide production in nitrification and its effect on total soil emission: A meta-analysis and global-scale sensitivity analysis using a process-based model. PLoS ONE 2019, 14, e0219159. [Google Scholar] [CrossRef]
  48. Prosser, J.I.; Hink, L.; Gubry-Rangin, C.; Nicol, G.W. Nitrous oxide production by ammonia oxidizers: Physiological diversity, niche differentiation and potential mitigation strategies. Glob. Change Biol. 2020, 26, 103–118. [Google Scholar] [CrossRef]
  49. Verhamme, D.T.; Prosser, J.I.; Nicol, G.W. Ammonia concentration determines differential growth of ammonia-oxidising archaea and bacteria in soil microcosms. ISME J. 2011, 5, 1067–1071. [Google Scholar] [CrossRef]
  50. Rutting, T.; Schleusner, P.; Hink, L.; Prosser, J.I. The contribution of ammonia-oxidizing archaea and bacteria to gross nitrification under different substrate availability. Soil Biol. Biochem. 2021, 160, 108353. [Google Scholar] [CrossRef]
  51. Zhang, L.; Zeng, G.; Zhang, J.; Chen, Y.; Yu, M.; Lu, L.; Li, H.; Zhu, Y.; Yuan, Y.; Huang, A.; et al. Response of denitrifying genes coding for nitrite (nirK or nirS) and nitrous oxide (nosZ) reductases to different physico-chemical parameters during agricultural waste composting. Appl. Microbiol. Biotechnol. 2015, 99, 4059–4070. [Google Scholar] [CrossRef]
  52. Li, X.; Qiao, J.; Li, S.; Haggblom, M.M.; Li, F.; Hu, M. Bacterial Communities and Functional Genes Stimulated During Anaerobic Arsenite Oxidation and Nitrate Reduction in a Paddy Soil. Environ. Sci. Technol. 2020, 54, 2172–2181. [Google Scholar] [CrossRef]
  53. van Lent, J.; Hergoualc’h, K.; Verchot, L.V. Reviews and syntheses: Soil N2O and NO emissions from land use and land-use change in the tropics and subtropics: A meta-analysis. Biogeosciences 2015, 12, 7299–7313. [Google Scholar] [CrossRef]
  54. Long, X.-E.; Huang, Y.; Chi, H.; Li, Y.; Ahmad, N.; Yao, H. Nitrous oxide flux, ammonia oxidizer and denitrifier abundance and activity across three different landfill cover soils in Ningbo, China. J. Clean. Prod. 2018, 170, 288–297. [Google Scholar] [CrossRef]
  55. Gao, W.; Yao, Y.; Gao, D.; Wang, H.; Song, L.; Sheng, H.; Cai, T.; Liang, H. Responses of N2O emissions to spring thaw period in a typical continuous permafrost region of the Daxing’an Mountains, northeast China. Atmos. Environ. 2019, 214, 116822. [Google Scholar] [CrossRef]
  56. Garcia-Ruiz, R.; Gomez-Munoz, B.; Hatch, D.J.; Bol, R.; Baggs, E.M. Soil mineral N retention and N2O emissions following combined application of 15N-labelled fertiliser and weed residues. Rapid Commun. Mass Spectrom. 2012, 26, 2379–2385. [Google Scholar] [CrossRef]
  57. Zhang, L.; Huo, Y.; Guo, D.; Wang, Q.; Bao, Y.; Li, L. Effects of Multi-nutrient Additions on GHG Fluxes in a Temperate Grassland of Northern China. Ecosystems 2014, 17, 657–672. [Google Scholar] [CrossRef]
  58. Adkins, J.; Miesel, J.R. Post-fire effects of soil heating intensity and pyrogenic organic matter on microbial anabolism. Biogeochemistry 2021, 154, 555–571. [Google Scholar] [CrossRef]
  59. Liu, F.; Qin, S.; Fang, K.; Chen, L.; Peng, Y.; Smith, P.; Yang, Y. Divergent changes in particulate and mineral-associated organic carbon upon permafrost thaw. Nat. Commun. 2022, 13, 5073. [Google Scholar] [CrossRef]
  60. Wang, X.; Xu, J.; Wu, Z.; Shen, Y.; Cai, Y. Effect of annual prescribed burning of wetlands on soil organic carbon fractions: A 5-year study in Poyang, China. Ecol. Eng. 2019, 138, 219–226. [Google Scholar] [CrossRef]
  61. Timothy, D.A.; Moses, I.; Johnstone, K.; Nekesa, O.A. Effects of wildland fire on the tropical alpine moorlands of Mount Kenya. Catena 2017, 149, 300–308. [Google Scholar] [CrossRef]
  62. Zhang, Y.; Ding, H.; Zheng, X.; Ren, X.; Cardenas, L.; Carswell, A.; Misselbrook, T. Land-use type affects N2O production pathways in subtropical acidic soils. Environ. Pollut. 2018, 237, 237–243. [Google Scholar] [CrossRef] [PubMed]
  63. Schrumpf, M.; Kaiser, K.; Guggenberger, G.; Persson, T.; Koegel-Knabner, I.; Schulze, E.D. Storage and stability of organic carbon in soils as related to depth, occlusion within aggregates, and attachment to minerals. Biogeosciences 2013, 10, 1675–1691. [Google Scholar] [CrossRef]
  64. Trotta, G.; Cadez, L.; Boscutti, F.; Vuerich, M.; Asquini, E.; Boscarol, G.; Cingano, P.; Azzani, G.; Pischedda, S.; Tomao, A.; et al. Interpreting the shifts in forest structure, plant community composition, diversity, and functional identity by using remote sensing-derived wildfire severity. Fire Ecol. 2024, 20, 94. [Google Scholar] [CrossRef]
  65. Penman, T.D.; Towerton, A. Soil temperatures during autumn prescribed burning: Implications for the germination of fire responsive species? Int. J. Wildland Fire 2008, 17, 572–578. [Google Scholar] [CrossRef]
  66. Kasischke, E.S.; Stocks, B.J. Fire, Climate Change, and Carbon Cycling in the Boreal Forest; Springer Science & Business Media: Berlin/Heidelberg, Germany, 2012; Volume 138. [Google Scholar]
Figure 1. The abundance of ammonia-oxidizing archaea (AOA–amoA, (a)), ammonia-oxidizing bacteria (AOB–amoA, (b)), nitrite-reducing bacteria (nirK, (c)), nitrite-reducing bacteria (nirS, (d)), N2O-reducing bacteria (nosZI, (e)), and nitrite-reducing fungi (fungi-nirK, (f)). Different lowercase letters in the data indicate significant differences between groups (p < 0.05, n = 3).
Forests 16 00983 g001
Figure 2. Soil N2O emissions over a one-month period: (a) represents soil N2O emission flux and (b) represents cumulative soil N2O emissions. Values are expressed as mean ± standard error (n = 3). Different lowercase letters in (b) indicate significant differences between treatment groups (p < 0.05).
Forests 16 00983 g002
Figure 3. Soil gross nitrification rate under unburned and burned soil. Different lowercase letters in the data indicate significant differences between groups (p < 0.05, n = 3).
Forests 16 00983 g003
Figure 4. The relationship between soil chemical properties, gross nitrification rate, nitrogen cycle gene abundance, and soil N2O emissions across ecosystems. Red fitted line denotes trend fitting of scatter data using a linear model and red area denotes confidence interval. The correlation between N2O emissions and pH (a), NH4⁺ (b), SOC (c), GN (d), EOC (e) LFOC (f), HAN (g), nirS (h), nirK (i), and nosZI (j). The correlation between nirS and pH (k) and SOC (l). NH4⁺, ammonium nitrogen; SOC, soil organic carbon; GN, gross nitrification rate; LFOC, light fraction organic carbon; EOC, easily oxidizable organic carbon; HAN, hydrolyzable ammonium nitrogen; nirK and nirS denote genes associated with nitrite-reducing bacteria; and nosZI denotes genes associated with N2O-reducing bacteria.
Forests 16 00983 g004
Figure 5. The relationship between soil carbon and nitrogen fractions, gross nitrification rate, and nitrogen cycle gene abundance across ecosystems. Red fitted line denotes trend fitting of scatter data using a linear model and red area denotes confidence interval. (a) the correlation between nirS and EOC; (b) the correlation between nirS and LFOC; (c) the correlation between nirS and HAN; (d) the correlation between nirK and EOC; (e) the correlation between nirK and HAN; (f) the correlation between nosZI and EOC; (g) the correlation between nosZI and ASN; (h) the correlation between nosZI and HAN; (i) the correlation between GN and EOC; (j) the correlation between GN and LFOC; (k) the correlation between GN and HAN; (l) the correlation between GN and ASN. GN, the gross nitrification rate; LFOC, light fraction organic carbon; EOC, easily oxidizable organic carbon; HAN, hydrolyzable ammonium nitrogen; ASN, amino sugar nitrogen; nirK and nirS denote genes associated with nitrite-reducing bacteria; and nosZI denotes genes associated with N2O-reducing bacteria.
Forests 16 00983 g005
Figure 6. Principal component bivariate analysis: blue arrows indicate the contribution of each soil nutrient indicator to principal component 1 (PC1) and principal component 2 (PC2). The direction of the arrows represents their correlation with principal components 1 and 2, while the length of the arrows indicates the degree of correlation with principal components 1 and 2. Consistent arrows indicate a positive correlation between properties, while perpendicular arrows indicate no correlation. TN, total N; NH4+, ammonium; NO3, nitrate; SOC, soil organic C; EOC, easily oxidizable organic C; DOC, dissolved organic C; LFOC, light fraction organic C; POC, particulate organic C; ASN, amino sugar N; HUN, hydrolyzable unknown N; AAN, amino acid N; HAN, hydrolyzable ammonium N; NHN, non-hydrolyzable N; N2O emissions, cumulative nitrous oxide emissions; GN, gross nitrification rate; AOA, ammonia-oxidizing archaea; AOB, ammonia-oxidizing bacteria; fungi-nirK, nitrite-reducing fungi; nirK, nirS, nitrite-reducing bacteria, nosZI, and N2O reducing bacteria.
Forests 16 00983 g006
Table 1. The impact of fire on soil physicochemical properties.
ParameterUnburned SoilBurned Soil
pH4.99 ± 0.05 b5.24 ± 0.03 a
TN (g kg−1)1.26 ± 0.00 a1.29 ± 0.03 a
NH4+ (mg kg−1)0.85 ± 0.12 b1.13 ± 0.13 a
NO3 (mg kg−1)6.87 ± 0.07 a6.36 ± 0.05 b
SOC (g kg−1)16.9 ± 0.48 b21.6 ± 1.04 a
EOC (g kg−1)5.01 ± 0.19 b6.76 ± 0.25 a
DOC (g kg−1)0.15 ± 0.00 a0.14 ± 0.00 b
LFOC (g kg−1)4.77 ± 0.04 b6.29 ± 0.35 a
POC (g kg−1)1.42 ± 0.04 a0.93 ± 0.09 b
ASN (mg kg−1)284 ± 2.14 b316 ± 15.5 a
HUN (mg kg−1)63.5 ± 16.7 b117 ± 4.92 a
AAN (mg kg−1)182 ± 21.0 a215 ± 17.6 a
HAN (mg kg−1)306 ± 4.50 b346 ± 10.1 a
NHN (mg kg−1)425 ± 33.1 a297 ± 25.6 b
TN, total N; NH4+, ammonium; NO3, nitrate; SOC, soil organic C; EOC, easily oxidizable organic C; DOC, dissolved organic C; LFOC, light fraction organic C; POC, particulate organic C; ASN, amino sugar N; HUN, hydrolyzable unknown N; AAN, amino acid N; HAN, hydrolyzable ammonium N; NHN, non hydrolyzable N. Different lowercase letters in the data indicate significant differences between groups (p < 0.05, n = 3).
Disclaimer/Publisher’s Note: The statements, opinions and data contained in all publications are solely those of the individual author(s) and contributor(s) and not of MDPI and/or the editor(s). MDPI and/or the editor(s) disclaim responsibility for any injury to people or property resulting from any ideas, methods, instructions or products referred to in the content.

