An Analysis of National Park Financing Mechanisms in Serbia

 , , , , , and
Abstract
1. Introduction
2. Method
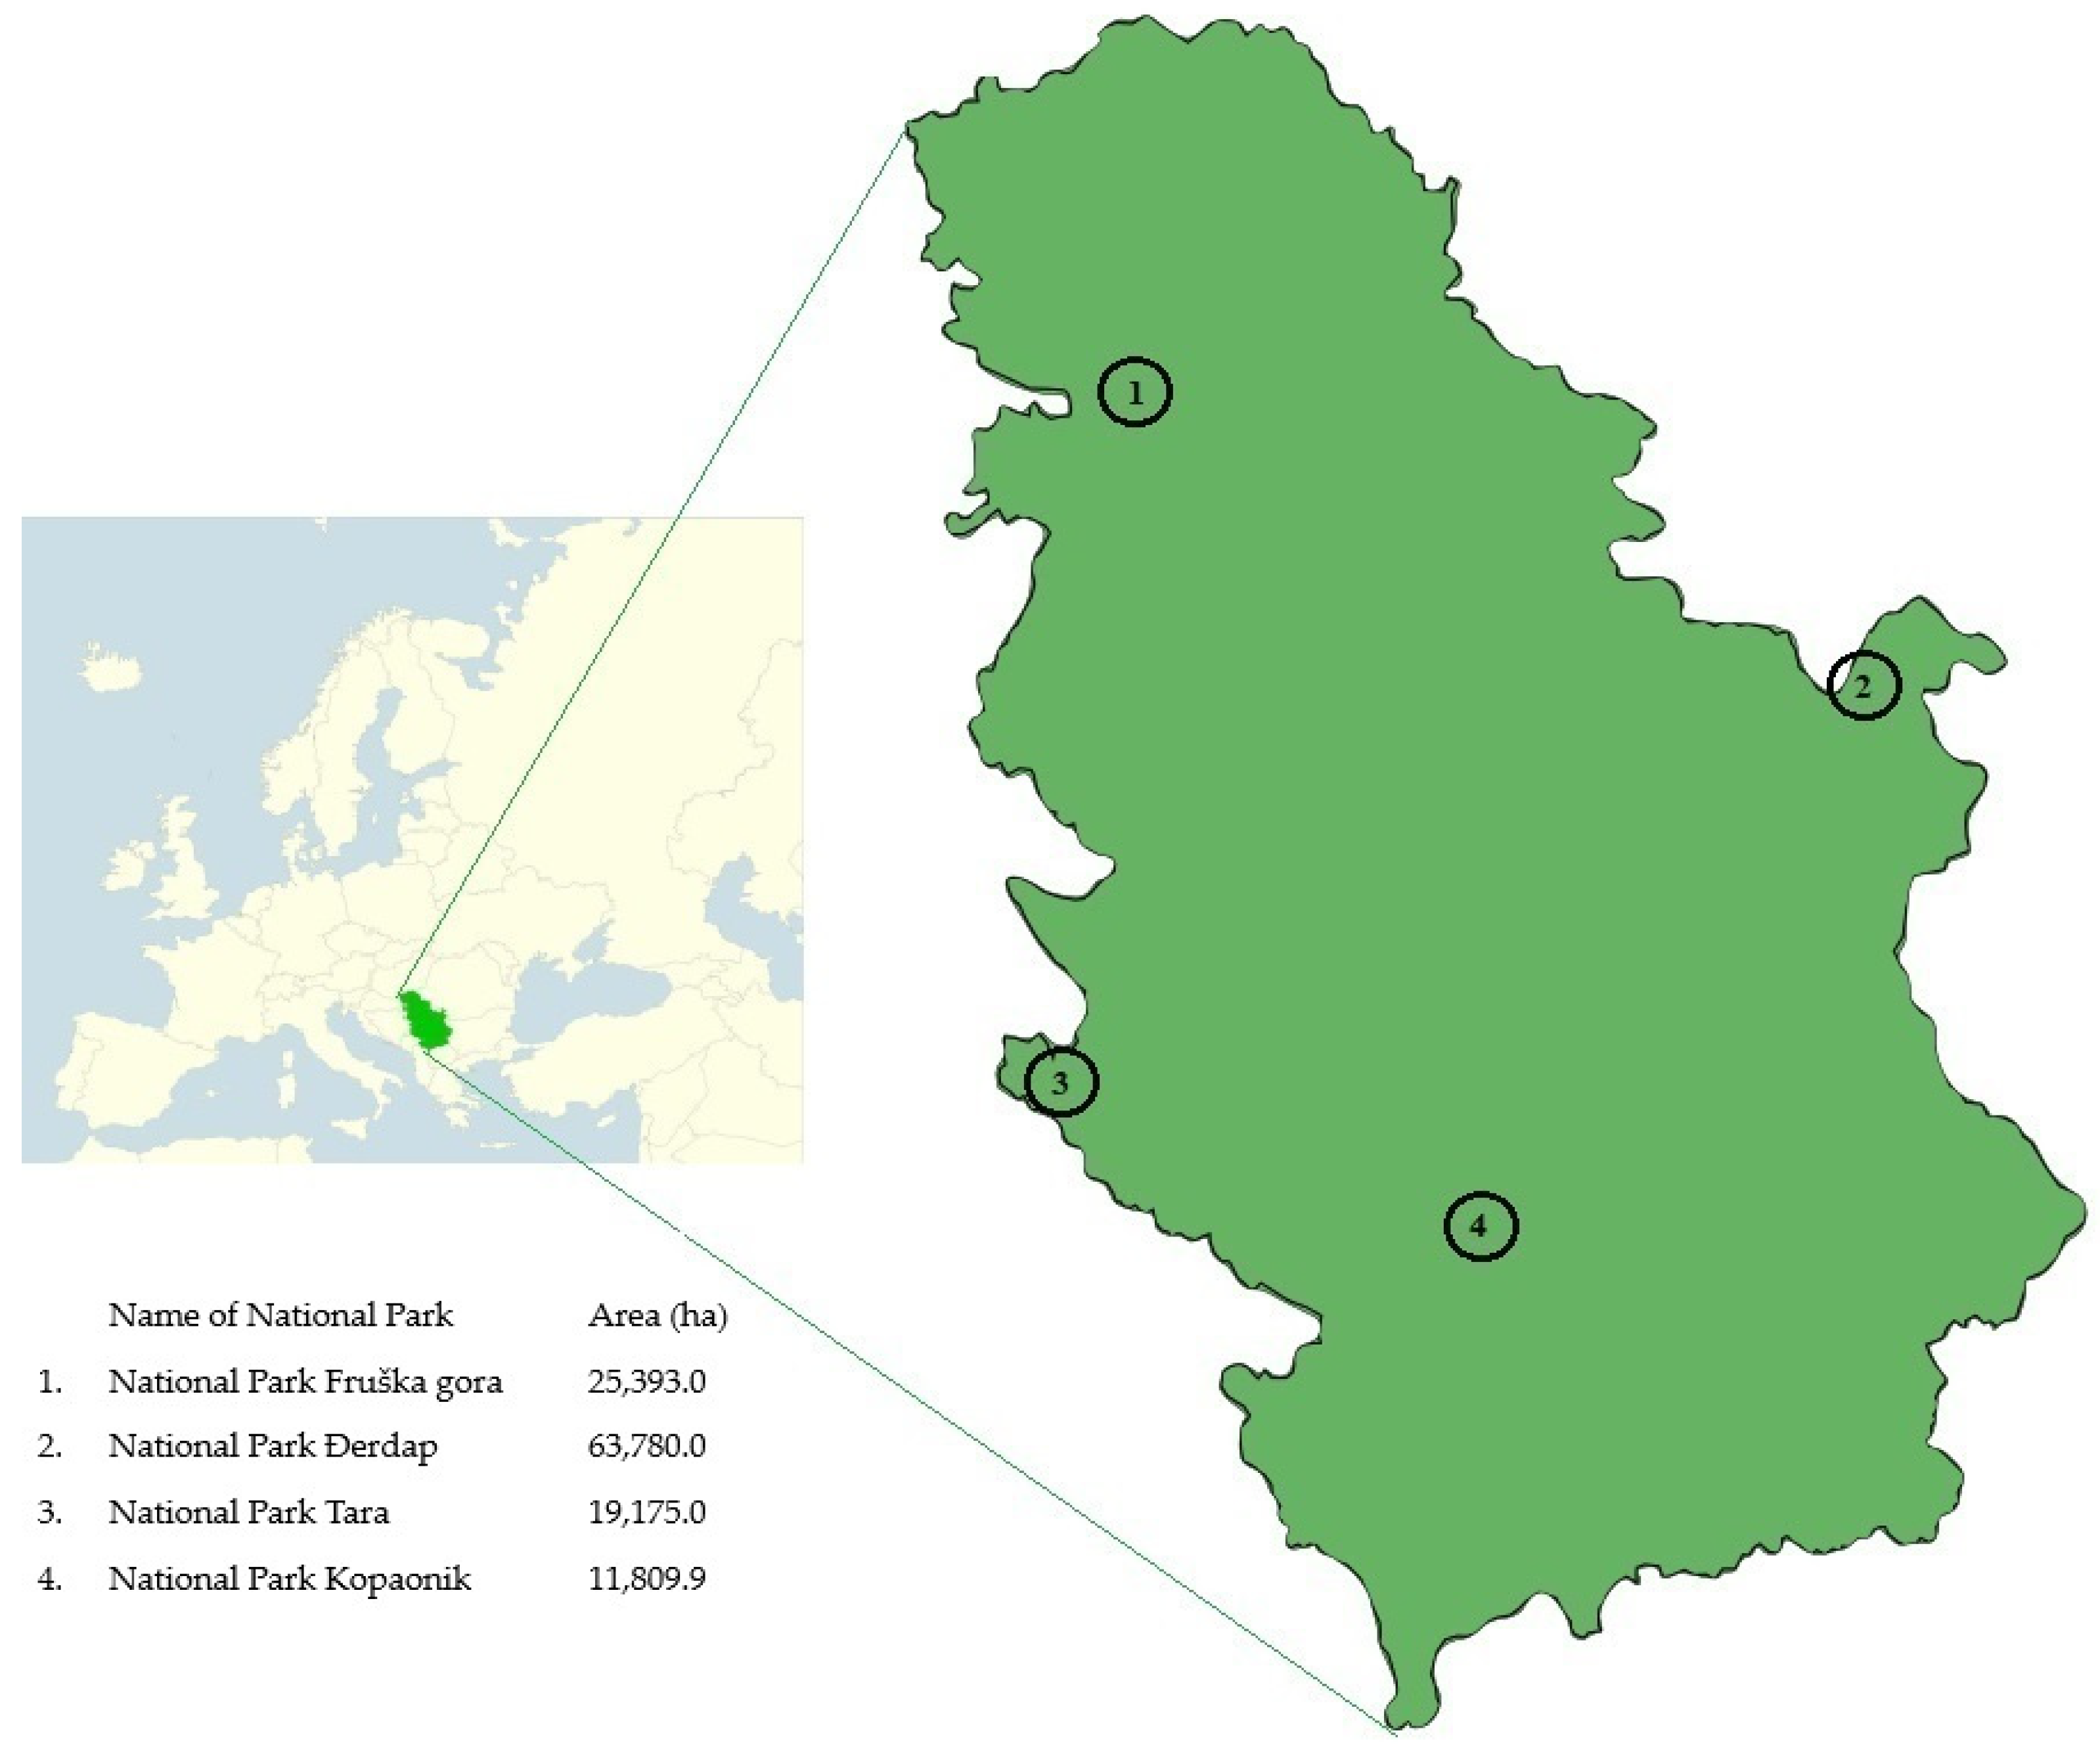
2.1. Study Area
2.2. Data Collection
2.3. Data Analysis
- GR is the growth rate;
- Value in Yearn is the value of the variable revenue for the current year;
- Value in Yearn−1 is the value of the variable revenue for the previous year.
- β0 represents the intercept;
- β1, β2, β3, and β4 are the coefficients for the independent variables;
- ε is the residual term representing the unexplained variation in the dependent variable.
3. Results
4. Discussion
5. Conclusions
Author Contributions
Funding
Data Availability Statement
Conflicts of Interest
References
- Cheng, T.A.; Katharine, R.E.; Sims, E.R.K.; Yi, Y. Economic development and conservation impacts of China’s nature reserves. J. Environ. Econ. Manag. 2023, 121, 102848. [Google Scholar] [CrossRef]
- Dudley, N. Guidelines for Applying Protected Area Management Categories; IUCN: Gland, Switzerland, 2008; Available online: https://portals.iucn.org/library/sites/library/files/documents/pag-021.pdf (accessed on 4 June 2025).
- Cisneros, E.; Börner, J.; Pagiola, S.; Wunder, S. Impacts of conservation incentives in protected areas: The case of Bolsa Floresta, Brazil. J. Environ. Econ. Manag. 2022, 111, 102572. [Google Scholar] [CrossRef]
- Staccione, A.; Brown, C.; Arneth, A.; Rounsevell, M.; Hrast Essenfelder, A.; Seo, B.; Mysiak, J. Exploring the effects of protected area networks on the European land system. J. Environ. Manag. 2023, 337, 117741. [Google Scholar] [CrossRef] [PubMed]
- Jones, N.; McGinlay, J.; Kontoleon, A.; Maguire-Rajpaul, V.A.; Dimitrakopoulos, P.G.; Gkoumas, V.; Riseth, J.Å.; Sepp, K.; Vanclay, F. Understanding Public Support for European Protected Areas: A Review of the Literature and Proposing a New Approach for Policy Makers. Land 2022, 11, 733. [Google Scholar] [CrossRef]
- Giełda-Pinas, K.; Starosta-Grala, M.; Wieruszewski, M.; Dynowska, J.; Molińska-Glura, M.; Adamowicz, K. Modeling the Effects of Strict Protection of Forest Areas—Part of the Provisions of the EU Biodiversity Strategy 2030. Sustainability 2025, 17, 737. [Google Scholar] [CrossRef]
- EC. Communication from the Commission to the European Parliament, the Council, European Economic and Social Committee and the Committee of the Regions: EU Biodiversity Strategy for 2030—Bringing Nature Back into Our Lives; European Commission: Luxembourg, 2020.
- Hermoso, V.; Carvalho, S.B.; Giakoumi, S.; Goldsborough, D.; Katsanevakis, S.; Leontiou, S.; Markantonatou, V.; Rumes, B.; Vogiatzakis, I.N.; Yates, K.L. The EU Biodiversity Strategy for 2030: Opportunities and challenges on the path towards biodiversity recovery. Environ. Sci. Policy. 2022, 127, 263–271. [Google Scholar] [CrossRef]
- NSSD. National Strategy for Sustainable Development of the Republic of Serbia; Official Gazette of the Republic of Serbia, No. 55/05, 71/05 and 101/07; The Government of the Republic of Serbia: Belgrade, Serbia, 2005.
- LSP. Law on the Spatial Plan of the Republic of Serbia from 2010 to 2020; Official Gazette of the Republic of Serbia, No. 88/2010; The Government of the Republic of Serbia: Belgrade, Serbia, 2010.
- NEPP. National Environmental Protection Program; Official Gazette of the Republic of Serbia, No. 12/10; The Government of the Republic of Serbia: Belgrade, Serbia, 2010.
- NSNRG. National Strategy for Sustainable Use of Natural Resources and Goods; Official Gazette of the Republic of Serbia, No. 33/2012; The Government of the Republic of Serbia: Belgrade, Serbia, 2012.
- Đorđević, I.; Poduška, Z.; Nevenić, R.; Serdar, R.G.; Bilibajkić, S.; Češljar, G.; Stefanović, T. Assessment of the system of funding of protected areas in the Republic of Serbia. Sustain. For. 2013, 67–68, 161–175. [Google Scholar]
- Jelić, I.; Tomićević-Dubljević, J. The importance of management plans in the management of protected areas in Serbia. UŠITS 2015, 3, 143–156. [Google Scholar]
- Sekulić, G.; Ivanić, Z.K.; Štefan, A. Protected Area Benefit Assessment Tool (PA-BAT) in Serbia; World Organization for Nature, WWF Adria: Zagreb, Croatia, 2018; Available online: https://wwfeu.awsassets.panda.org/downloads/pa_bat_report_2017_a5_03_2018__eng__web.pdf (accessed on 4 June 2025).
- ANC. Central Register for Protected Areas; Agency for Nature Conservation: Belgrade, Serbia, 2024; Available online: https://zzps.rs/ (accessed on 4 June 2025).
- Juffe-Bignoli, D.; Burgess, N.D.; Bingham, H.; Belle, E.M.S.; de Lima, M.G.; Deguignet, M.; Bertzky, B.; Milam, A.N.; Martinez-Lopez, J.; Lewis, E.; et al. Protected Planet Report 2014; UNEP-WCMC: Cambridge, UK, 2014; Available online: https://protectedplanetreport2020.protectedplanet.net/pdf/Protected_Planet_Report_2014.pdf (accessed on 4 June 2025).
- Terrestrial and Marine Protected Areas (% of Total Territorial Area). Available online: https://data.worldbank.org/indicator/ER.PTD.TOTL.ZS?name_desc=false (accessed on 26 May 2025).
- Forestry Company “Unsko—Sanske Šume” Ltd. Available online: https://ussume.ba/evropski-dan-parkova-24-5-2023-ae-parkovi-bosne-i-hercegovine-960/ (accessed on 26 May 2025).
- Mitrici, R. Romania’s national and natural parks and their ecological and ecoturistic importance. CTNS 2022, 11, 212–222. [Google Scholar] [CrossRef]
- Natural Reserves, National Parks and Conservation Zones in Bulgaria. Available online: https://www.bulgariahiddengems.com/post/national-parks-in-bulgaria (accessed on 26 May 2025).
- Global National Parks. Available online: https://www.globalnationalparks.com/greece/ (accessed on 26 May 2025).
- Ministry of Economy, Republic of Croatia. Available online: https://mingo.gov.hr/o-ministarstvu-1065/djelokrug-4925/zastita-prirode/zasticena-podrucja/nacionalni-parkovi/1194 (accessed on 26 May 2025).
- Sava Parks. Available online: http://www.savaparks.eu/nacionalni-park-triglav-610 (accessed on 26 May 2025).
- Albanian National Tourism Agency. Available online: https://egov-albania-al.online/ats/destinations/national-parks/index.html (accessed on 26 May 2025).
- Parkovi Dinarida. Available online: https://parksdinarides.org/ (accessed on 26 May 2025).
- Hungarian National Parks. Available online: https://magyarnemzetiparkok.hu/?lang=en (accessed on 26 May 2025).
- Protected Planet. Available online: https://www.protectedplanet.net/en/search-areas?filters%5Blocation%5D%5Btype%5D=country&filters%5Blocation%5D%5Boptions%5D%5B%5D=The+Republic+of+North+Macedonia&filters%5Biucn_category%5D%5B%5D=II (accessed on 26 May 2025).
- National Parks of Montenegro. Available online: https://nparkovi.me/ (accessed on 26 May 2025).
- LNP. Law on Nature Protection; Official Gazette of the Republic of Serbia, No. 36/09, 88/10, 91/10, 14/16 and 71/21; The Government of the Republic of Serbia: Belgrade, Serbia, 2009.
- LNP. Law on National Parks; Official Gazette of the Republic of Serbia, No. 84/15 and 95/18; The Government of the Republic of Serbia: Belgrade, Serbia, 2015.
- Đorđević, I.; Ranković, N.; Keča, I. Structure of financing revenues (2008–2012) of national parks in Republic of Serbia. Agric. For. 2013, 59, 173–183. [Google Scholar]
- Jovanović, B.N.; Garcia, S.; Keča, L.J. Are visitors, biodiversity or timber production better for nature conservation? Findings from an econometric analysis of the management costs of protected areas in Serbia. J. Environ. Manag. 2025, 375, 124048. [Google Scholar] [CrossRef] [PubMed]
- Đorđević, I.; Nonić, D.; Nedeljković, J. Management of protected areas in Serbia: Types and structure of managers. Agric. For. 2014, 60, 7–26. [Google Scholar]
- Nonić, D.; Petrović, N.; Medarević, M.; Glavonjić, P.; Nedeljković, J.; Stevanov, M.; Orlović, S.; Rakonjac, L.; Djordjević, I.; Poduška, Z.; et al. Forest Land Ownership Change in Serbia; COST Action FP1201—FACESMAP Country Report; European Forest Institute—Central-East and South-East European Regional Office: Vienna, Austria, 2015; Available online: https://facesmap.boku.ac.at/library/FP1201_Country%20Report_SERBIA.pdf (accessed on 4 June 2025).
- Đorđević, I.; Ranković, N.; Nonić, D.; Nedeljković, J.; Zlatić, M.; Tomićević, J. An analysis of the trend of protected area size in Serbia in the period from 1948 to 2016. Bull. Fac. For. 2017, 115, 65–88. [Google Scholar] [CrossRef]
- Borrini-Feyerabend, G.; Dudley, N.; Jaeger, T.; Lassen, B.; Pathak Broome, N.; Phillips, A.; Sandwith, T. Governance of Protected Areas: From Understanding to Action, Best Practice Protected Area Guidelines Series No. 20; IUCN: Gland, Switzerland, 2013; Available online: https://portals.iucn.org/library/sites/library/files/documents/PAG-020.pdf (accessed on 4 June 2025).
- LPE. Law on Public Enterprises; Official Gazette of the Republic of Serbia, No. 15/2016 and 88/2019; The Government of the Republic of Serbia: Belgrade, Serbia, 2016.
- Emerton, L.; Bishop, J.; Thomas, L. Sustainable Financing of Protected Areas: A Global Review of Challenges and Options; IUCN: Gland, Switzerland, 2006; Available online: https://portals.iucn.org/library/efiles/documents/PAG-013.pdf (accessed on 4 June 2025).
- Worboys, G.L.; Francis, W.; Lockwood, M. Connectivity Conservation Management: A Global Guide; Earthscan: London, UK, 2010. [Google Scholar] [CrossRef]
- Worboys, L.G.; Lockwood, M.; Kothari, A.; Feary, S.; Pulsford, I. Protected Area Governance and Management; The Australian National University: Canberra, Australia, 2015. [Google Scholar] [CrossRef]
- Philips, A. Economic Values of Protected Areas, Guidelines for Protected Area Managers; Task Force on Economic Benefits of Protected Areas of the World Commission on Protected Areas (WCPA) of IUCN, in Collaboration with the Economics Service Unit of IUCN; IUCN: Gland, Switzerland; Cambridge, UK, 1998; Available online: https://portals.iucn.org/library/efiles/documents/PAG-002.pdf (accessed on 4 June 2025).
- Eagles, P.; McCool, S.; Haynes, C. Sustainable Tourism in Protected Areas: Guidelines for Planning and Management; IUCN: Gland, Switzerland, 2002; Available online: https://portals.iucn.org/library/sites/library/files/documents/pag-008.pdf (accessed on 4 June 2025).
- Bovarnick, A.; Fernandez-Baca, J.; Galindo, J.; Negret, H. Financial Sustainability of Protected Areas in Latin America and the Caribbean: Investment Policy Guideline; United Nations Development Programme (UNDP): New York, NY, USA; The Nature Conservancy (TNC): Arlington, VA, USA, 2010; Available online: https://www.cbd.int/financial/finplanning/g-planscorelatin-undp.pdf (accessed on 4 June 2025).
- Mach, L.; Winner, C.; Rojas, C.; Klemond, M. Protected area entry fees and governance quality. Tour. Manag. 2020, 77, 104003. [Google Scholar] [CrossRef]
- Đorđević, I.; Ranković, N.; Nedeljković, J.; Tomićević-Dubljević, J.; Nonić, D.; Posavec, S.; Češljar, G. Mechanisms of financing the protected area management system in Serbia. Sumar. List. 2019, 143, 549–559. [Google Scholar] [CrossRef]
- Puzović, S. Protection and management of natural resources in Serbia. Nat. Prot. 2008, 60, 17–26. Available online: https://scindeks.ceon.rs/article.aspx?artid=0514-58990902017P (accessed on 4 June 2025).
- Spurgeon, J.; Marchesi, N.; Mesic, Z.; Thomas, L. Sustainable Financing Review for Croatia Protected Areas; Program on Forests-World Bank: London, UK, 2009; Available online: https://www.profor.info/knowledge/best-practices-financing-protected-areas-lessons-southeastern-europe (accessed on 4 June 2025).
- Fouda, M. An Overview of History, Achievements and Future Agenda. In Proceedings of the 1st Egyptian-International Conference on Protected Areas and Sustainable Development, Sharm El-Sheikh, Egypt, 23–26 October 2002. [Google Scholar]
- Balmford, A.; Green, J.M.; Anderson, M.; Beresford, J.; Huang, C.; Naidoo, R.; Walpole, M.; Manica, A. Walk on the wild side: Estimating the global magnitude of visits to protected areas. PLoS Biol. 2015, 13, e1002074. [Google Scholar] [CrossRef] [PubMed]
- Watson, J.; Dudley, N.; Segan, D.; Hockings, M. The performance and potential of protected areas. Nature 2014, 515, 67–73. [Google Scholar] [CrossRef]
- O’Flynn, L.; Schweinsberg, S.; Wearing, S. Financing Protected Areas: The Social and Environmental Impact Bond’s Role in Terrestrial Protected Area Sustainability. J. Park Recreat. Adm. 2022, 40, 123–129. [Google Scholar] [CrossRef]
- Baral, N.; Dhungana, A. Diversifying finance mechanisms for protected areas capitalizing on untapped revenues. For. Policy Econ. 2014, 41, 60–67. [Google Scholar] [CrossRef]
- IUCN. Financing Protected Areas, Guidelines for Protected Area Managers; IUCN: Gland, Switzerland, 2000; Available online: https://portals.iucn.org/library/node/7774 (accessed on 4 June 2025).
- Dlamini, C.S.; Masuku, M. Towards Sustainable Financing of Protected Areas: A Brief Overview of Pertinent Issues. Int. J. Biodivers. Conserv 2013, 5, 436–445. [Google Scholar] [CrossRef]
- Mansourian, S.; Dudley, N. Public Funds to Protected Areas; WWF International: Gland, Switzerland, 2008. [Google Scholar] [CrossRef]
- Eagles, P.F.J. Understanding the market for sustainable tourism, in S.F. McCool and A.E. Watson (compilers) Linking tourism, the environment and sustainability. In Proceedings of the Special Session of the Annual General Meeting of the National Recreation and Parks Association, Minneapolis, MN, USA, 12–14 October 1994; US Department of Agriculture, Forest Service, Intermountain Research Station: Ogden, UT, USA, 1995. [Google Scholar]
- Hockings, M.; Stolton, S.; Leverington, F.; Dudley, N.; Courrau, J. Evaluating Effectiveness: A Framework for Assessing Management Effectiveness of Protected Areas, 2nd ed.; IUCN: Gland, Switzerland; Cambridge, UK, 2006; Available online: https://portals.iucn.org/library/efiles/documents/pag-014.pdf (accessed on 4 June 2025).
- IUCN. Guidelines for Protected Area Management Categories; UCN: Gland, Switzerland; Cambridge, UK, 1994; Available online: https://portals.iucn.org/library/efiles/documents/1994-007-En.pdf (accessed on 4 June 2025).
- Convention on Biological Diversity. Protected Areas in Today’s World: Their Values and Benefits for the Welfare of the Planet; CBD Technical Series No. 36; Secretariat of the Convention on Biological Diversity: Montreal, QC, Canada, 2008. Available online: https://www.cbd.int/doc/publications/cbd-ts-36-en.pdf (accessed on 4 June 2025).
- Loch, A.; Scholz, G.; Adamson, D.; Sexton, S.; Peralta, A. Validating costly protected area restoration after (increasing) disasters. J. Environ. Manag. 2024, 370, 122305. [Google Scholar] [CrossRef] [PubMed]
- Pezdevšek Malovrh, Š.; Paletto, A.; Posavec, S.; Dobšinská, Z.; Đorđević, I.; Marić, B.; Avdibegović, M.; Kitchoukov, E.; Stijović, A.; Trajkov, P.; et al. Evaluation of the Operational Environment Factors of Nature Conservation Policy Implementation: Cases of Selected EU and Non-EU Countries. Forests 2019, 10, 1099. [Google Scholar] [CrossRef]
- Rylance, A.; Snyman, S.; Spenceley, A. The Contribution of Tourism Revenue to Financing Protected Area Management in Southern Africa. Tour. Rev. Int. 2017, 21, 139–149. [Google Scholar] [CrossRef]
- Steven, R.; Castley, J.G.; Buckley, R. Tourism Revenue as a Conservation Tool for Threatened Birds in Protected Areas. PLoS ONE 2013, 8, e62598. [Google Scholar] [CrossRef]
- Kaffashi, S.; Radam, A.; Shamsudin, M.N.; Yacob, M.R.; Nordin, N.H. Ecological Conservation, Ecotourism, and Sustainable Management: The Case of Penang National Park. Forests 2015, 6, 2345–2370. [Google Scholar] [CrossRef]
- Bookbinder, M.P.; Dinerstein, E.; Rijal, A.; Cauley, H.; Rajouria, A. Ecotourism’s support of biodiversity conservation. Conserv. Biol. 1998, 12, 1399–1404. [Google Scholar] [CrossRef]
- Buckley, R. Pay to play in parks: An Australian policy perspective on visitor fees in public protected areas. J. Sustain. Tour 2003, 11, 56–73. [Google Scholar] [CrossRef]
- Buckley, R. Parks and tourism. PLoS Biol. 2009, 7, e1000143. [Google Scholar] [CrossRef]
- Buckley, R.C. Conservation Tourism; CAB International: Wallingford, UK, 2010.
- Castley, J.G. Southern and Eastern Africa; Buckley, R.C., Ed.; CAB International: Wallingford, UK, 2010; pp. 145–175. [CrossRef]
- Buckley, R. Tourism and environment. Annu. Rev. Environ. Resour. 2011, 36, 397–416. [Google Scholar] [CrossRef]
- Tisdell, C.; Wilson, C. Nature-Based Tourism and Conservation; Edward Elgar: Cheltenham, UK, 2012. [Google Scholar] [CrossRef]
- Baral, N.; Stern, M.J.; Bhattarai, R. Contingent valuation of ecotourism in Annapurna Conservation Area, Nepal: Implications for sustainable park finance and local development. Ecol. Econ. 2008, 66, 218–227. [Google Scholar] [CrossRef]
- Wang, P.; Wolf, A.S. A targeted approach to payments for ecosystem services. Glob. Ecol. Conserv. 2019, 17, e00577. [Google Scholar] [CrossRef]
- Moros, L.; Corbera, E.; Vélez, M.A.; Flechas, D. Pragmatic conservation: Discourses of payments for ecosystem services in Colombia. Geoforum 2020, 108, 169–183. [Google Scholar] [CrossRef]
- Zhou, Y.; Zhao, L.; Li, Z. Wetland Ecological Restoration and Payment for Ecosystem Service Standard: A Case Study of Ganjiangyuan National Wetland Park. Wetlands 2023, 43, 22. [Google Scholar] [CrossRef]
- Sims, E.R.K. Conservation and development: Evidence from Thai protected areas. J. Environ. Econ. Manag. 2010, 60, 94–114. [Google Scholar] [CrossRef]
- Bohorquez, J.; Dvarskas, A.; Jacquet, J.; Sumaila, R.; Nye, J.; Pikitch, E.K. A New Tool to Evaluate, Improve, and Sustain Marine Protected Area Financing Built on a Comprehensive Review of Finance Sources and Instruments. Front. Mar. Sci. 2022, 8, 742846. [Google Scholar] [CrossRef]
- Iyer, V.; Mathias, K.; Meyers, D.; Victurine, R.; Walsh, M. Finance Tools for Coral Reef Conservation: A Guide. Wildlife Conservation Society and Conservation Finance Alliance, 2018. Available online: https://static1.squarespace.com/static/57e1f17b37c58156a98f1ee4/t/5c7d85219b747a7942c16e01/1551730017189/50+Reefs+Finance+Guide+FINAL-sm.pdf (accessed on 4 June 2025).
- Silver, J.J.; Campbell, L.M. Conservation, development and the blue frontier: The republic of seychelles’ debt restructuring for marine conservation and climate adaptation program. Int. Soc. Sci. J. 2018, 68, 241–256. [Google Scholar] [CrossRef]
- Mallin, M.-A.F.; Stolz, D.C.; Thompson, B.S.; Barbesgaard, M. In oceans we trust: Conservation, philanthropy, and the political economy of the Phoenix Islands Protected Area. Mar. Policy 2019, 107, 103421. [Google Scholar] [CrossRef]
- Femmami, N.; Le Port, G.; Cook, T.; Binet, T. Financing Mechanisms: A Guide for Mediterranean Marine Protected Areas; BlueSeeds, MAVA Foundation: Bordeaux, France, 2021. [Google Scholar]
- Maesano, M.; Lasserre, B.; Marchetti, M. Increasing wood mobilization through sustainable forest management in protected areas of Italy. Ann. Silvic. Res. 2014, 38, 13–21. [Google Scholar] [CrossRef]
- Verkerk, P.J.; Zanchi, G.; Lindner, M. Trade-offs between forest protection and wood supply in Europe. Environ. Manag. 2014, 53, 1085–1094. [Google Scholar] [CrossRef]
- Miyamoto, A.; Sano, M.; Terazono, R.; Yamada, S.; Shimizu, A. Assessment of wood provisioning in protected subtropical forest areas for sustainable management beyond the zone. J. Environ. Manag. 2021, 287, 112337. [Google Scholar] [CrossRef]
- Santoro, A.; Piras, F. Natural Forests or Cultural Forests? Forest Changes within Italian Protected Areas in the Last 85 Years. Forests 2023, 14, 921. [Google Scholar] [CrossRef]
- Ezquerro, M.; Diaz-Balteiro, L.; Pardos, M. Implications of forest management on the conservation of protected areas: A new proposal in Central Spain. For. Ecol. Manag. 2023, 548, 121428. [Google Scholar] [CrossRef]
- Lerink, B.J.W.; Schelhaas, M.J.; Schreiber, R.; Aurenhammer, P.; Kies, U.; Vuillermoz, M.; Ruch, P.; Pupin, C.; Kitching, A.; Kerr, G.; et al. How much wood can we expect from European forests in the near future? Forestry 2023, 96, 434–447. [Google Scholar] [CrossRef]
- Krejić, Ž.; Milićević, S. Motives for visiting the national parks of Serbia. Eco. Mont. 2021, 13, 21–28. [Google Scholar] [CrossRef]
- LBS. Law on Budget System; Official Gazette of the Republic of Serbia, No. 54/2009, 73/2010, 101/2010, 101/2011, 93/2012, 62/2013, 108/2013, 142/2014, 68/2015, 103/2015, 99/2016, 113/2017, 95/2018, 31/2019, 72/2019, 149/2020, 118/2021, 138/2022, 118/2021, 92/2023 and 94/2024; The Government of the Republic of Serbia: Belgrade, Serbia, 2009.
- LF. Law on Fees for the Use of Public Goods; Official Gazette of RS, No. 95/2018, 49/2019 and 92/2023; The Government of the Republic of Serbia: Belgrade, Serbia, 2018.
- Milosavljević, S.; Radosavljević, I. Fundamentals of Political Science Methodology; Official Gazette; The Government of the Republic of Serbia: Belgrade, Serbia, 2008.
- Bulmer, M. Sociological Research Methods, An Introduction, 2nd ed; Transaction Publishers: Piscataway, NJ, USA, 2003; Available online: https://www.biblio.com/book/sociological-research-methods-introduction-bulmer-m/d/1427877857?srsltid=AfmBOor4j8TIHpQKr6jOWg3DFaZtpznCyIR4UPibXs9mreK-UJJ15sW4 (accessed on 4 June 2025).
- Neuman, W.L. Qualitative and Quantitative Approaches, 7th ed.; Pearson Inc.: Harlow, UK, 2014. [Google Scholar]
- Šešić, B. Fundamentals of Social Science Methodology; Scientific Book: Belgrade, Serbia, 1984. [Google Scholar]
- Miljević, M. Methodology of Scientific Work; University of East Sarajevo—Faculty of Philosophy: Zvornik, Republic of Srpska, 2007. [Google Scholar]
- Đuković, M. Backsliding Rule of Law and “Stabilitocracy” in Montenegro; Mihr, A., Pierobon, C., Eds.; Polarization, Shifting Borders and Liquid Governance; Springer: Cham, Switzerland, 2024. [Google Scholar] [CrossRef]
- LF. Law on Forests; Official Gazette of the Republic of Serbia, No. 30/2010, 93/2012, 89/2015 and 95/2018; The Government of the Republic of Serbia: Belgrade, Serbia, 2010.
- Sikora, J.; Uglis, J.; Jeczmyk, A.; Luniewski, S.; Jalinik, M.; Wartecka-Wazynska, A. Financial Aspects of National Parks in Poland. Eur. Res. Stud. 2024, 4, 325–345. [Google Scholar] [CrossRef]
- Manning, R.E. Studies in Outdoor Recreation: Search and Research for Satisfaction; Oregon State University Press: Corvallis, OR, USA, 1999; Available online: https://osupress.oregonstate.edu/book/studies-in-outdoor-recreation-1 (accessed on 4 June 2025).
- Walpole, M.J.; Goodwin, H.J.; Ward, K.G.R. Pricing policy for tourism in protected areas: Lessons from Komodo National Park, Indonesia. Conserv. Biol. 2001, 15, 218–227. [Google Scholar] [CrossRef]
- Whitelaw, P.A.; King, B.E.M.; Tolkach, D. Protected areas, conservation and tourism—Financing the sustainable dream. J. Sustain. Tour. 2014, 22, 584–603. [Google Scholar] [CrossRef]
- Nonić, D.; Šumarac, P.; Đorđević, I.; Nedeljković, J. Sustainable management of the national park Kopaonik—Opportunities and challenges. Bull. Fac. For. 2024, 15, 59–80. [Google Scholar] [CrossRef]
- Buckley, R.C.; Witting, N.; Guest, M. Managing People in Australian Parks; CRC Tourism: Gold Coasts, Australia, 2001. [Google Scholar]
- Mayer, M.; Job, H. The economics of protected areas—A European perspective. Z. Wirtschgeogr. 2014, 58, 73–97. [Google Scholar] [CrossRef]
- Thur, S.M. User fees as sustainable financing mechanisms for marine protected areas: An application to the Bonaire National Marine Park. Mar. Policy 2010, 34, 63–69. [Google Scholar] [CrossRef]
- Travel and Tour World. Available online: https://www.travelandtourworld.com/news/article/montenegro-national-parks-attract-nearly-half-a-million-tourists-in-five-months-generating-over-2-3-million-euros-in-revenue/ (accessed on 26 May 2025).
- Binet, T.; Diazabakana, A.; Hernandez, S. Sustainable Financing of Marine Protected Areas in the Mediterranean: A financial Analysis; Vertigo Lab: Bordeaux, France; MedPAN: Marseille, France; RAC/SPA: Tunis, Tunisia; WWF Mediterranean: Rome, Italy, 2015; Volume 114. [Google Scholar]
- Zyl, H.V.; Kinghorn, J.; Emerton, L. National Park entrance fee: A global benchmarking focused on affordability. Parks 2019, 25, 39–54. [Google Scholar] [CrossRef]
- Dharmaratne, S.G.; Sang, Y.F.; Walling, J.L. Tourism potentials for financing protected areas. Ann. Tour. Res. 2000, 27, 590–610. [Google Scholar] [CrossRef]
- Nevenić, R. Integrated Management of Natural Resources in the Domain of Forest Policy. Available online: https://www.forest.org.rs/pdf/SustainableForestryZBORNIKRADOVA54-552006god.pdf (accessed on 4 June 2025).
- Eagles, P.; Hillel, O. Improving protected area finance through tourism. Task Force on Tourism and Protected Areas. In Proceedings of the 9th Meeting of the Conference of the Parties to the Convention on Biological Diversity, Bonn, Germany, 19–30 May 2008. [Google Scholar]
- Siltanen, J.; Petursson, G.J.; Cook, D.; Davidsdottir, B. Evaluating economic impacts of protected areas in contexts with limited data; the case of three national parks in Iceland. J. Environ. Manag. 2023, 342, 118085. [Google Scholar] [CrossRef] [PubMed]
- Rogowski, M.; Zawilińska, B.; Hibner, J. Managing tourism pressure: Exploring tourist traffic patterns and seasonality in mountain national parks to alleviate overtourism effects. J. Environ. Manag. 2025, 373, 123430. [Google Scholar] [CrossRef]
- Mmopelwa, G.; Kgathia, D.L.; Molefheb, L. Tourists’ perceptions and their willingness to pay for park fees: A case study of self-drive tourists and clients for mobile tour operators in Moremi Game Reserve, Botswana. Tour. Manag. 2007, 28, 1044–1056. [Google Scholar] [CrossRef]
- Peters, H.; Hawkins, J.P. Access to marine parks: A comparative study in willingness to pay. Ocean Coast. Manag. 2009, 52, 219–228. [Google Scholar] [CrossRef]
- Inglis, J.; Whitelaw, P.; Pearlman, M. Best Practice in Strategic Park Management Towards an Integrated Park Management Model; Sustainable tourism; CRC: Boca Raton, FL, USA, 2005; Available online: https://sustain.pata.org/wp-content/uploads/2014/12/Inglis_ParkMgtModel.pdf (accessed on 4 June 2025).
- Kay, P.; Polonsky, M.J.; Inglis, J. Understanding Managerial Perspectives of Volunteering at Nonprofit Leisure Events: A Comparison of Typologies Within Open Gardens Australia. J. Nonprofit Public Sect. Mark. 2017, 29, 64–97. [Google Scholar] [CrossRef]
- Martinić, I. Management of Nature Protected Areas, Planning, Development and Sustainability; University of Zagreb—Faculty of Forestry: Zagreb, Croatia, 2010; Available online: https://www.sumari.hr/biblio/pdf/11175.pdf (accessed on 4 June 2025).
- Kettunen, M.; Torkler, P.; Rayment, M. Financing Natura 2000 Guidance Handbook, Part I—EU Funding Opportunities in 2014–2020; European Commission DG Environment, Publications Office of the European Union: Luxembourg, 2014; Available online: https://www.europarc.org/news/2017/11/financing-natura-2000-handbook/ (accessed on 4 June 2025).
- Saayman, A.; Saayman, M. The Socio-demographics and visitation patterns of arts festivals in South Africa. Events Manag. 2006, 9, 211–222. [Google Scholar] [CrossRef]
- Adams, W.M.; Hutton, J. People, Parks and Poverty: Political Ecology and Biodiversity Conservation. Conserv. Soc. 2007, 5, 147–183. [Google Scholar]
- Eagles, P.F.J.; Romagosa, F.; Buteau-Duitschaever, C.W.; Havitz, M.; Glover, D.T.; McCutcheon, B. Good governance in protected areas: An evaluation of stakeholders’ perceptions in British Columbia and Ontario Provincial Parks. J. Sustain. Tour. 2012, 21, 60–79. [Google Scholar] [CrossRef]
- Mitchell, R.; Wooliscroft, B.; Higham, J.E.S. Applying sustainability in national park management: Balancing public and private interests using a sustainable market orientation model. J. Sustain. Tour. 2012, 21, 695–715. [Google Scholar] [CrossRef]
- Thiene, M.; Swait, J.; Scarpa, R. Choice set formation for outdoor destinations: The role of motivations and preference discrimination in site selection for the management of public expenditures on protected areas. J. Environ. Econ. Manag. 2017, 81, 152–173. [Google Scholar] [CrossRef]
- SRC. Status Report of Nature in the Republic of Croatia for the Period from 2008 to 2012 Year; Government of the Republic of Croatia: Zagreb, Croatia, 2017. Available online: https://www.sabor.hr/sites/default/files/uploads/sabor/2019-01-18/081114/STANJE-PRIRODE-RH-2008-2012.pdf (accessed on 4 June 2025).
- Cieślukowski, M. Znaczenie Fiskalne Parków Narodowych w Polsce; Łuniewski, R.N.S., Bakier, S., Jalinik, M., Eds.; Pozaprodukcyjne Funkcje Zasobów Leśnych; Oficyna Wydawnicza Politechniki Białostockiej: Białystok, Poland, 2023; Available online: https://pb.edu.pl/oficyna-wydawnicza/wp-content/uploads/sites/4/2023/12/Pozaprodukcyjne-funkcje-zasobow-lesnych-1.pdf (accessed on 4 June 2025).

| Country | Country Area (km2) | Protected Area (km2) | National Park (km2) | Protected Area (%) | National Park/Country Area (%) | National Park/Protected Area (%) |
|---|---|---|---|---|---|---|
| Bosnia and Herzegovina [18,19] | 51,209.0 | 4864.9 | 638.5 | 9.5 | 1.2 | 13.1 |
| Romania [18,20] | 238,391.0 | 57,929.0 | 3167.6 | 24.3 | 1.3 | 5.5 |
| Bulgaria [18,21] | 110,996.0 | 39,514.6 | 1503.6 | 35.6 | 1.4 | 3.8 |
| Serbia [16,18] | 88,361.0 | 8267.6 | 1429.6 | 9.4 | 1.6 | 17.3 |
| Greece [18,22] | 131,694.0 | 14,749.7 | 2909.5 | 11.2 | 2.2 | 19.7 |
| Croatia [18,23] | 56,594.0 | 21,794.3 | 1382.0 | 38.5 | 2.4 | 6.3 |
| Slovenia [18,24] | 20,271.0 | 8197.6 | 840.0 | 40.4 | 4.1 | 10.2 |
| Albania [18,25,26] | 28,748.0 | 5174.6 | 1388.1 | 18.0 | 4.8 | 26.8 |
| Hungary [18,27] | 93,012.0 | 21,020.7 | 4803.4 | 22.6 | 5.2 | 22.9 |
| North Macedonia [18,28] | 25,713.0 | 7251.1 | 1774.6 | 28.2 | 6.9 | 24.5 |
| Montenegro [18,29] | 13,821.0 | 2223.7 | 1063.5 | 16.1 | 7.7 | 47.8 |
| Average | 23.1 | 3.5 | 18.0 | |||
| National Parks | Regression Equations |
|---|---|
| Tara | GRT = −0.39 + 0.84 × GRB + 0.06 × GRG + 0.06 × GRF + 0.01 × GRO + ε |
| Đerdap | GRT = −1.31 + 0.74 × GRB + 0.043 × GRG + 0.27 × GRF + 0.00 × GRO + ε |
| Fruška gora | GRT = −0.99 + 0.79 × GRB + 0.03 × GRG + 0.16 × GRF + 0.04 × GRO + ε |
| Kopaonik | GRT = 0.06 + 0.72 × GRB + 0.05 × GRG + 0.20 × GRF + ε |
| Indicator | Tara | Đerdap | ||||||||||
|---|---|---|---|---|---|---|---|---|---|---|---|---|
| Mean | Median | Min | Max | Stan. Dev. | Coeff. Var. (%) | Mean | Median | Min | Max | Stan. Dev. | Coeff. Var. (%) | |
| GRB | 3.42 | 3.04 | −21.26 | 18.44 | 10.52 | 307.82 | 3.54 | 3.18 | −52.71 | 102.70 | 33.54 | 947.46 |
| GRG | 6.89 | 6.52 | −35.91 | 58.22 | 26.45 | 384.07 | 51.51 | 2.78 | −81.64 | 605.86 | 171.20 | 332.39 |
| GRF | 10.62 | 3.56 | −16.51 | 70.14 | 22.68 | 213.64 | 4.33 | 3.19 | −45.90 | 43.76 | 22.08 | 510.41 |
| GRO | 0.66 | 0.17 | −68.22 | 104.54 | 47.74 | 7224.98 | 36.90 | −0.41 | −91.50 | 310.38 | 111.62 | 302.50 |
| GRT | 3.51 | 2.84 | −18.2 | 14.95 | 8.68 | 247.37 | 4.89 | 3.21 | −53.07 | 106.92 | 33.55 | 685.63 |
| Fruška gora | Kopaonik | |||||||||||
| GRB | 1.58 | −2.57 | −28.83 | 23.82 | 13.36 | 844.39 | 4.69 | 3.92 | −16.80 | 34.94 | 16.04 | 342.20 |
| GRG | 26.42 | −9.61 | −47.38 | 455.70 | 126.31 | 478.03 | 8.71 | 0.18 | −26.45 | 92.40 | 30.51 | 350.37 |
| GRF | 9.70 | 8.89 | −21.33 | 45.19 | 20.73 | 213.71 | 14.02 | 11.25 | −29.85 | 56.82 | 24.00 | 171.15 |
| GRO | 0.32 | 0.78 | −40.76 | 33.75 | 20.99 | 6513.12 | ||||||
| GRT | 2.65 | 1.81 | −28.60 | 24.03 | 12.55 | 474.31 | 6.69 | 4.84 | −16.48 | 32.93 | 16.31 | 243.58 |
| Indicator | Tara | Đerdap | Fruška Gora | Kopaonik | ||||
|---|---|---|---|---|---|---|---|---|
| p-Value | 95% Confidence Interval | p-Value | 95% Confidence Interval | p-Value | 95% Confidence Interval | p-Value | 95% Confidence Interval | |
| Constant | 0.02 | [−0.72, −0.07] | 0.12 | [−3.03, 0.41] | 0.04 | [−1.96, −0.01] | 0.90 | [−1.00, 1.13] |
| GRB | 0.00 | [0.80, 0.87] | 0.00 | [0.66, 0.83] | 0.00 | [0.72, 0.86] | 0.00 | [0.62, 0.82] |
| GRG | 0.00 | [0.04, 0.075] | 0.00 | [0.02, 0.06] | 0.00 | [0.02, 0.04] | 0.00 | [0.02, 0.09] |
| GRF | 0.00 | [0.04, 0.08] | 0.00 | [0.19, 0.36] | 0.00 | [0.12, 0.21] | 0.00 | [0.13, 0.26] |
| GRO | 0.00 | [0.01, 0.02] | 0.57 | [−0.01, 0.02] | 0.10 | [−0.01, 0.09] | / | / |
| National Parks | ||||||||
|---|---|---|---|---|---|---|---|---|
| Statistic | Tara | Đerdap | Fruška Gora | Kopaonik | ||||
| R-squared | 99.81% | 99.60% | 99.20% | 99.38% | ||||
| Adjusted R-squared | 99.73% | 99.42% | 98.84% | 99.19% | ||||
| F-ratio | 1184.74 | 562.87 | 278.49 | 533.05 | ||||
| p-value | 0.00 | 0.00 | 0.00 | 0.00 | ||||
| Standard Error of Estimate | 0.45 | 2.54 | 1.35 | 1.47 | ||||
| Mean Absolute Error | 0.29 | 1.43 | 0.96 | 0.96 | ||||
| Durbin-Watson Statistic | 1.82 (p = 0.53) | 1.76 (p = 0.31) | 1.49 (p = 0.14) | 1.55 (p = 0.23) | ||||
| Lag 1 residual autocorrelation | −0.058 | −0.078 | 0.245 | 0.203 | ||||
| Analysis of Variance (ANOVA) for National Parks | ||||||||
| Source | F-Ratio | p-Value | F-Ratio | p-Value | F-Ratio | p-Value | F-Ratio | p-Value |
| Business revenue | 4384.72 | 0.00 | 2099.56 | 0.0000 | 1001.81 | 0.0000 | 1527.84 | 0.0000 |
| Grant revenue | 293.36 | 0.00 | 97.28 | 0.0003 | 48.73 | 0.0000 | 30.92 | 0.0002 |
| Fee revenue | 42.49 | 0.00 | 54.29 | 0.0001 | 60.08 | 0.0000 | 40.38 | 0.0001 |
| Other business revenue | 18.40 | 0.00 | 0.35 | 0.5705 | 3.31 | 0.1021 | ||
| Compared Source | National Parks | |||
|---|---|---|---|---|
| Tara | Đerdap | Fruška Gora | Kopaonik | |
| GRB–GRG | 0.64 | −0.80 | −0.11 | 0.06 |
| GRB–GRF | −0.54 | 0.23 | −0.28 | −0.82 |
| GRB–GRO | −0.27 | 0.36 | −0.26 | / |
| GRG–GRF | −0.61 | −0.46 | 0.24 | −0.23 |
| GRG–GRO | −0.44 | −0.36 | −0.36 | / |
| GRF–GRO | 0.50 | 0.33 | 0.30 | / |
Disclaimer/Publisher’s Note: The statements, opinions and data contained in all publications are solely those of the individual author(s) and contributor(s) and not of MDPI and/or the editor(s). MDPI and/or the editor(s) disclaim responsibility for any injury to people or property resulting from any ideas, methods, instructions or products referred to in the content. |
© 2025 by the authors. Licensee MDPI, Basel, Switzerland. This article is an open access article distributed under the terms and conditions of the Creative Commons Attribution (CC BY) license (https://creativecommons.org/licenses/by/4.0/).
Share and Cite
Đorđević, I.; Češljar, G.; Tomićević-Dubljević, J.; Čule, N.; Hadrović, S.; Braunovic, S.; Živojinović, I. An Analysis of National Park Financing Mechanisms in Serbia. Forests 2025, 16, 963. https://doi.org/10.3390/f16060963
Đorđević I, Češljar G, Tomićević-Dubljević J, Čule N, Hadrović S, Braunovic S, Živojinović I. An Analysis of National Park Financing Mechanisms in Serbia. Forests. 2025; 16(6):963. https://doi.org/10.3390/f16060963
Chicago/Turabian StyleĐorđević, Ilija, Goran Češljar, Jelena Tomićević-Dubljević, Nevena Čule, Sabahudin Hadrović, Sonja Braunovic, and Ivana Živojinović. 2025. "An Analysis of National Park Financing Mechanisms in Serbia" Forests 16, no. 6: 963. https://doi.org/10.3390/f16060963
APA StyleĐorđević, I., Češljar, G., Tomićević-Dubljević, J., Čule, N., Hadrović, S., Braunovic, S., & Živojinović, I. (2025). An Analysis of National Park Financing Mechanisms in Serbia. Forests, 16(6), 963. https://doi.org/10.3390/f16060963