Article

Characteristic and Adaptive Strategy in Leaf Functional Traits of Giant Panda (Ailuropoda melanoleuca) Staple Bamboo Species

1
College of Forestry, Sichuan Agricultural University, Chengdu 611130, China
2
Sichuan Provincial Key Laboratory of Forest Ecology and Conservation in the Upper Reaches of the Yangtze River, Sichuan Agricultural University, Chengdu 611130, China
3
Sichuan Mt. Emei Forest Ecosystem National Observation and Research Station, Sichuan Agricultural University, Chengdu 611130, China
4
Consejo Superior de Investigaciones Científicas, Unitat d’Ecologia Global CREAF-CSIC-UAB, Edifici C, Universitat Autònoma de Barcelona, 08193 Barcelona, Spain
5
Centre de Recerca Ecològica i Aplicacions Forestals, Cerdanyola del Vallès, 08193 Barcelona, Spain
6
Key Laboratory of Forest Cultivation in Plateau Mountain of Guizhou Province, Institute for Forest Resources and Environment of Guizhou, College of Forestry, Guizhou University, Guiyang 550025, China
7
Institute of Mountain Hazards and Environment, Chinese Academy of Sciences, Chengdu 610041, China
*
Author to whom correspondence should be addressed.
Forests 2025, 16(6), 954; https://doi.org/10.3390/f16060954
Submission received: 7 May 2025 / Revised: 1 June 2025 / Accepted: 4 June 2025 / Published: 5 June 2025

Abstract

:
Leaf functional traits are important indicators that reveal plant adaptation and response to environmental changes. Characteristics and adaptive strategies of leaf functional traits of staple bamboo species (SBSs) for the giant panda (Ailuropoda melanoleuca) remain unclear, which limits conservation management of the giant panda and its habitat. Here, this study investigated 10 SBSs in 15 nature reserves across 36 counties, measured eight leaf functional traits, analyzed trait characteristics, variation, and drivers of variation, and examined trait-based strategies and strategy–environmental constraint relationships. Our results indicate that: coefficients of variation in leaf functional traits spanned from 9.58% to 79.16%, and significant differences were found among SBSs for leaf functional traits except chlorophyll concentration. The linear mixed-effects models revealed that the taxonomic factors explained 20.16 to 77.94% of variation, and environmental factors explained 17.03 to 29.12%. Leaf functional traits exhibited distinct environmental associations, primarily driven by geographic location, topography, and soil phosphorus availability. Hierarchical clustering and principal component analysis revealed 10 SBS clustered into two groups, corresponding to conservative and acquisitive resource-use strategies. Canonical correspondence analysis revealed that SBSs with conservative strategies were distributed in warm and moist habitats, and SBSs with acquisition strategies were distributed in habitats with high solar radiation. Our results reveal the key trait characteristics of SBSs and the strategy-environmental constraint model based on traits, which can provide scientific basis for the ecological management practice of SBSs.

1. Introduction

The giant panda (Ailuropoda melanoleuca), an endemic species to China classified as “Vulnerable” by the IUCN Red List of Threatened Species, currently inhabits mountainous regions exclusively along the western edge of the Sichuan Basin and the Qinling Mountains and serves as a flagship species for global biodiversity conservation [1,2]. As a highly specialized herbivore, over 99% of its diet consists of bamboo, with preferred species termed staple bamboo species (SBSs) [3]. SBSs not only constitute the primary food source but also form critical components of vegetation communities in panda habitats [4]. However, climate change is decoupling the geographic ranges of giant pandas and their SBS distributions. This decoupling manifests through reduced SBS diversity, dramatic range contraction, and limited dispersal capacity to synchronize with panda migration, consequently elevating foraging pressures and survival risks on pandas [5,6,7]. Therefore, elucidating SBS survival strategies and their environmental relationships is essential for understanding climate response mechanisms and assessing long-term prospects of panda populations.
As crucial organs for plant metabolism, leaves exhibit functional traits that reflect carbon assimilation efficiency, resource allocation strategies, and environmental responsiveness [8]. Leaf morphology and function exhibit high interspecific diversity and intraspecific plasticity as a result of evolutionary adaptation to spatio-temporal environmental variation [9,10,11], i.e., leaf functional trait variation. Leaf functional trait variation arises from synergistic effects of genetic constraints and environmental filters [12,13,14]. For instance, a global study including 3700 species found that approximately 70% of leaf nitrogen (N) and 60% of phosphorus (P) concentration variations were jointly explained by species identity (representing genetic background) and environmental factors [15]. However, the relative contributions of genetic and environmental factors effects vary across traits. For example, in Chinese desert plants, 19.3%–72.6% of leaf trait variations are explained by combined genetic–environmental effects, with environmental factors driving 66.3% of leaf tissue density and 52.0% of leaf mass per area variations, whereas genetic factors account for 54.2% of leaf thickness variation [16]. This demonstrates that the relative importance of genetic and environmental factors varied among different functional traits.
Survival strategies based on functional traits reveal how plants optimize resource acquisition under environmental constraints [8,17,18]. The classic leaf economics spectrum (LES) theory conceptualizes a continuum from conservative (high investment, slow return) to acquisitive (low investment, fast return) strategies in carbon and other resource utilization of plants [8,19]. Species with an acquisitive strategy typically exhibit low construction costs with high nutrient concentrations and metabolic rates, contrasting species with conservative strategies displaying inverse patterns [8]. These strategic differences underpin species adaptation along environmental gradients [20,21]. However, trait–environment relationships show substantial variations across ecosystems and taxonomic groups. While global studies have revealed some classical matching patterns (e.g., larger leaf species matched to high precipitation climates and low latitudes) [9,22], there is still considerable uncertainty about associations at regional scales [23,24,25,26,27], especially in topographically complex ecosystems [28,29]. Consequently, understanding adaptive survival strategies of plants based on leaf functional trait assemblages and revealing how these strategies are correlated with habitat environmental factors remains a challenge in the field of functional trait ecology, especially at regional scales where species are diverse and terrain is complex.
SBSs belong to Bambusoideae (Poaceae), predominantly woody small-diameter bamboos with characteristic monocarpic reproduction, lignified culms, hollow internodes, and clonal growth [30,31]. These unique biological characteristics may drive distinct functional trait variation and adaptation patterns compared to other plant taxa [32]. More importantly, SBSs are mainly distributed in forest understory environments at altitudes of 1300–3500 m, and the combination of high altitude and understory shaded habitats further increases the unpredictability of their trait variation and adaptive strategies [33,34]. For example, a study on Andean montane bamboos revealed an unexpected absence of negative correlations between LMA and nutrient concentrations, suggesting differences from classical LES predictions in mountainous systems [28]. Unfortunately, current SBS research predominantly focuses on natural regeneration [35], biological characteristics [36], biomass allocation [4], nutrient dynamics [37], and distribution modeling under climate change scenarios [38,39]. Critical knowledge gaps still exist regarding: (1) the factors that influence variation in leaf functional traits in SBSs; and (2) the adaptive strategies of SBS leaf functional traits and how they correspond to habitat environmental conditions.
To address these gaps, we investigated 10 SBSs across 36 panda-inhabited counties, establishing 69 sampling sites (207 plots) along 1150–3360 m elevational gradients within 15 protected areas based on the Fourth National Giant Panda Survey [40]. We quantified eight key leaf functional traits in SBSs, including structural (leaf thickness, leaf area, leaf mass per area), hydraulic (vein length per area, fourth-order leaf vein diameter), photosynthetic (chlorophyll concentration), and nutrient economic (nitrogen and phosphorus concentrations) traits, which capture the major axes of variation in the ecological strategies of the plant in relation to resource acquisition, utilization, and adaptation to environmental gradients [8,41,42]. We analyzed the characteristics, variation, and factors influencing the functional traits. Based on these trait characteristics, we classified adaptive strategy groups of SBS and linked these groups to environmental factors in their habitats, to reveal the “strategy–environment” matching patterns of SBSs. This study advances understanding of SBS trait-based strategies and adaptation mechanisms, while providing critical insights for bamboo conservation and panda habitat management.

2. Material and Methods
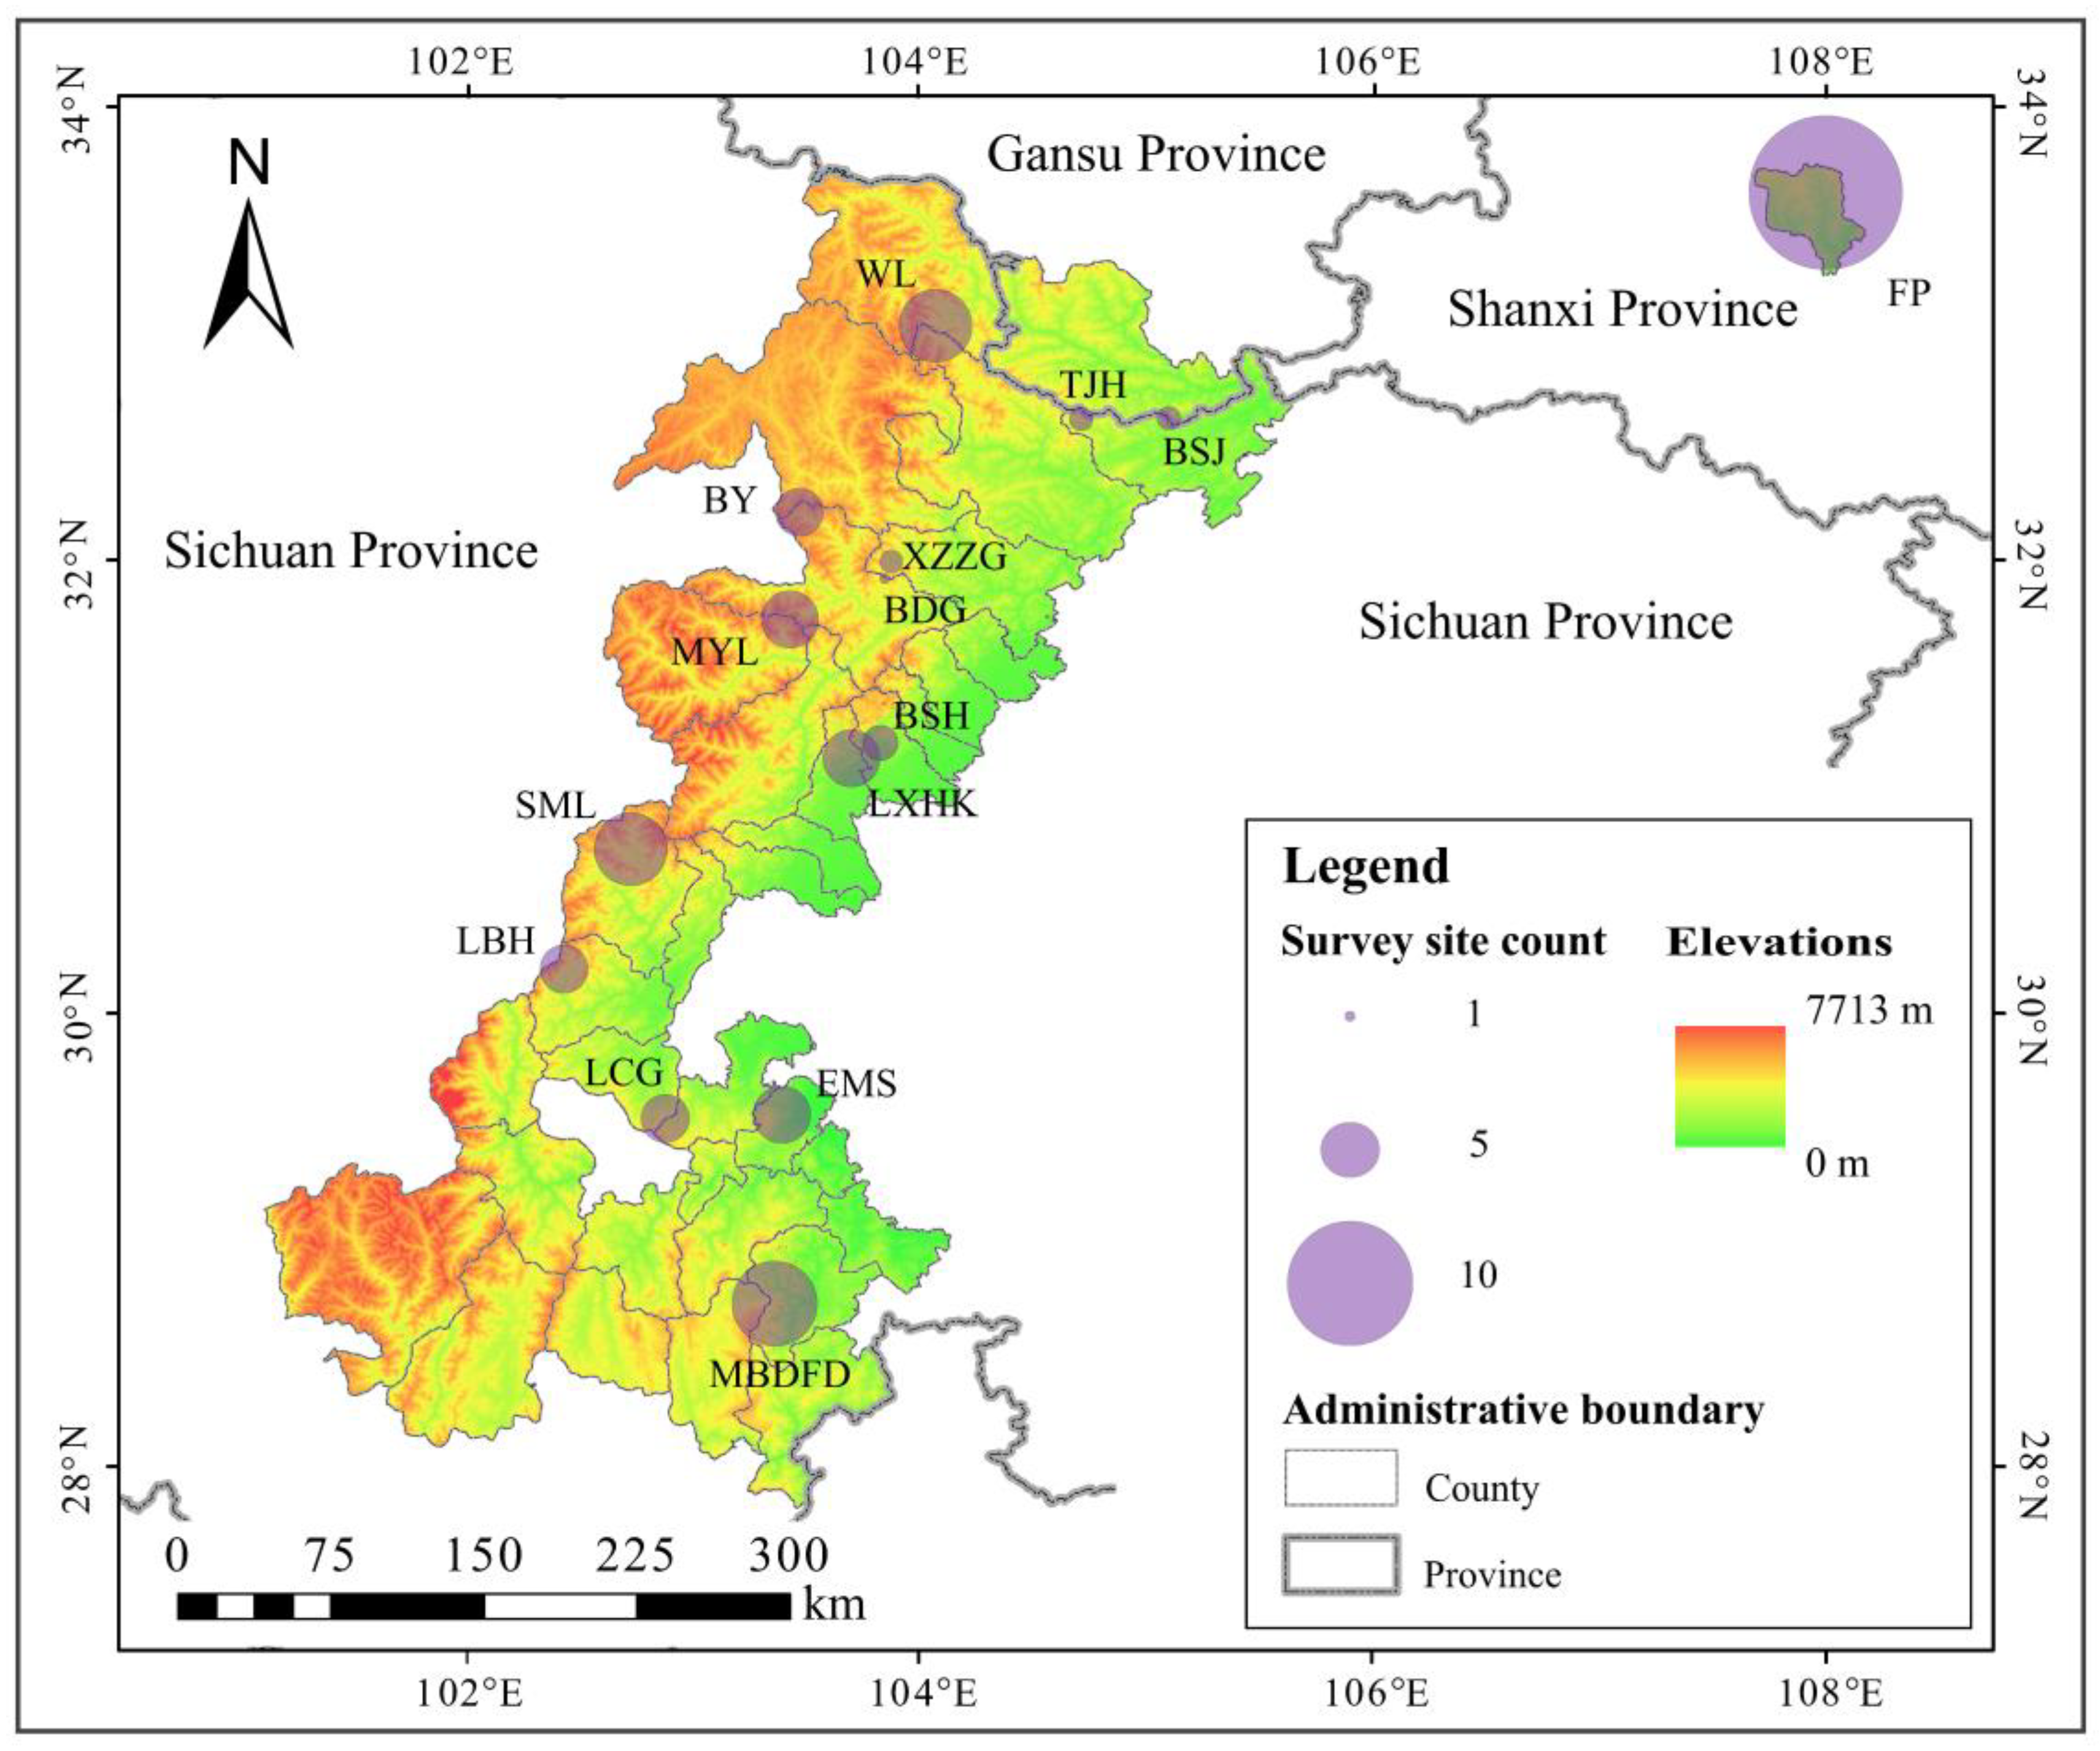
2.1. Study Area

The study area covers counties and nature reserves where panda activity has been observed, as recorded in China’s Fourth National Giant Panda Survey [40]. Spanning three provinces—Sichuan, Shaanxi, and Gansu—the study region covers 12 cities and 36 counties (Figure 1). Geographically, the area lies between 102° and 108° E longitude and 28° and 34° N latitude, incorporating four major mountain systems: the Qinling, Min, Qionglai, and Daxiangling-Xiaoxiangling ranges. Most of the mountain ranges in the study area have an elevation between 1500 to 3500 m [43]. The region is significantly influenced by the East Asian monsoon circulation and is located in a transitional zone between the continental north subtropical and warm temperate monsoon climate zones. From southeast to northwest, as elevation increases, the local climate shifts from subtropical humid conditions in river valleys to warm temperate humid, and further to temperate semi-humid and alpine humid climates. The annual average temperature in the study area ranges from 2 to 12 °C, with extreme lows of −28 °C and highs of 37.7 °C. Annual precipitation ranges from 500 to 1200 mm, with uneven seasonal distribution, with more rainfall occurring in summer and autumn, while winter and spring receive less. The diverse topographic and climatic conditions of this region make it an ideal setting for studying the variation and trade-offs in leaf functional traits of the SBS of giant pandas.

2.2. Staple Bamboo Species

According to the National Fourth Giant Panda Survey Report [40], 37 bamboo species primarily utilized/consumed by giant pandas were documented in the study area. The top 10 bamboo species ranked by descending frequency of giant panda occurrence records were identified as follows: Fargesia denudata, F. qinlingensis, Arundinaria faberi, Bashania fargesii, F. qinlingensis, Yushania brevipaniculata, F. robusta, F. nitida, F. scabrida, Chimonobambusa szechuanensis. These species were therefore initially selected as focal study subjects.
Subsequent field investigations and sampling revealed that F. scabrida exhibited sporadic distribution within the Baishuijiang Nature Reserve, with fewer than three accessible sampling sites, precluding robust statistical analysis. Consequently, this species was excluded from further study. Field surveys additionally identified Fargesia dracocephala (36 occurrence records) as a widely distributed species in the Foping Nature Reserve, warranting its inclusion. The final study subjects comprised ten bamboo species: F. denudata, F. qinlingensis, A. faberi, Bashania fargesii, F. qinlingensis, Y. brevipaniculata, F. robusta, F. nitida, F. dracocephala, C. szechuanensis (Figure 2).

2.3. Survey Sites Setting

To minimize anthropogenic disturbance, survey sites were established within protected areas (nature reserves and scenic zones) across the study region. Sampling protocols were designed to capture variations in leaf functional traits of giant panda staple bamboos, as well as their adaptive strategies, following three principles: (1) Priority was given to protected areas with the largest distribution ranges of each target bamboo species to reflect characteristic habitats and trait values. (2) For conspecific populations, protected areas with maximal spatial separation were prioritized to assess trait variation. (3) Within mountain ranges, survey sites were systematically established at 200 m elevation intervals across the altitudinal distribution range of each target species to assess trait variation.
Field investigations and sample collection were conducted from May to August 2022, progressing south-to-north across study areas. Through ground-truthing, 69 survey sites were established within 15 protected areas, spanning elevations of 1150–3360 m (Table 1). At each site, three 20 m × 20 m plots were delineated in bamboo stands with homogeneous growth vigor, matching slope aspect and position, and comparable elevation (±20 m at plot centroids), totaling 207 plots.
To address sampling bias from clonal replication (rhizomatous clonal growth in bamboos may produce genetically identical ramets) [36,44], a minimum 15 m buffer was maintained between plots within each survey site [45]. Additionally, five 3 m × 3 m subplots were positioned at plot corners and centers for standardized sampling, ensuring spatial independence of ramet collections.

2.4. Sampling and Trait Measurement

In each of the five subplots per sampling site, one healthy 2–3 years-old bamboo with average height was selected as a measurement subject, yielding 15 sampled individuals per site. Individuals were identified as 2–3 years old based on fully extended branches, smooth green culms lacking white trichomes or black encrustations, and nodes free of accumulated leaf litter [46,47]. Then, fully expanded leaves from upper, middle, and lower canopy positions, and the east, south, west, and north canopy directions of each sampled individuals were collected, totaling 50 g per measurement subject. Composite leaf samples (250 g per plot) were homogenized, stored in humidified Ziplock bags, and promptly transferred to the laboratory for leaf trait measurements. For soil sampling, surface litter and weeds were removed, and loose topsoil was cleared prior to collecting 0–20 cm depth soil cores using a 5 cm diameter auger following a five-point sampling design. Composite soil samples per plot were homogenized, stored in Ziplock bags, and immediately transported to the laboratory for nutrient analysis. During the site survey, geographic information (longitude, latitude, elevation, slope, slope aspect, and slope position) was recorded for each sampling site using GPS (A8, ZL Electronic Technology Co., Ltd., Hefei, China), while canopy cover was visually inspected (Table S1).
In the lab, 50 morphologically intact leaves were selected from each sample set. Leaf thickness (LT) was measured on 30 of these leaves using a caliper with 0.01 mm precision. Leaf area (LA) was then measured using a scanner (BenQ-5560, BenQ Corporation, Shanghai, China) and calculated using ImageJ 1.8.0 (Wayne Rasband-National Institute of Health, Bethesda, MD, USA) based on scanned images. The leaves were oven-dried at 60 °C for 48 h after a brief desiccation treatment at 120 °C for 30 min to determine biomass per leaf (MPL). Leaf mass per area (LMA) was calculated based on the MPL and LA [48].
For vein length per area (VLA), another set of 10 leaves were selected. The secondary veins were counted, and the leaf length and area were measured. Major vein density was calculated by multiplying the number of primary and secondary veins by leaf length, then dividing by leaf area. A 2 cm × 0.5 cm section was cut from each leaf and soaked in a 5% NaOH solution for 12 to 48 h, depending on leaf thickness and texture, to soften the tissue and make the venation more visible [49]. The sections were observed under an optical microscope (SZX16, Olympus Corporation, Tokyo, Japan) at a magnification of 4 × 10, producing images with a resolution of 0.219 mm × 0.326 mm. Minor veins were manually traced using Image J 1.8.0 software, and VLA was calculated as the sum of major and minor vein densities, expressed in mm−2. Meanwhile, the fourth-order leaf vein diameter (FVD), which represents the material transport capacity of leaf venation network ends and the structural strength of the blade, was measured for each section using Image J 1.8.0. The results of FVD were expressed in μm.
For chlorophyll concentration measurement, the last 10 leaves were cut into strips approximately 5 mm long and 1 mm wide. Then, a 0.100 ± 0.05 g sample was weighed and placed into a glass mortar, to which 2 mL of a 1:1:1 mixture of 90% acetone, methanol, and ethanol was added [50]. The sample was ground, transferred to a 10 mL centrifuge tube, and the volume was adjusted to 8 mL with extraction solution. The tubes were shaken gently and kept in the dark at 4 °C for 1.5 h. After extraction, the solution was centrifuged at 3000 rpm for 5 min in a centrifuge (Allegra 64R, Beckman Coulter Inc., Brea, CA, USA), and the supernatant was collected. Chlorophyll a and chlorophyll b concentrations were determined at wavelengths of 647 nm and 664 nm using a UV–Vis spectrophotometer (UV 2450, Shimadzu Corporation, Tokyo, Japan), with the following formulas used to calculate concentrations [50]:
C h l l a = 1.7858 × A 647 + 11.8668 × A 664 × 8 0.1 × 0.001
C h l l b = 18.9775 × A 647 4.8950 × A 664 × 8 0.1 × 0.001
where Chlla and Chllb represent chlorophyll a and chlorophyll b concentrations in mg g−1, and A647 and A664 are absorbance values at 647 nm and 664 nm, respectively. The total chlorophyll concentration (Chll) was calculated as the sum of Chlla and Chllb.
The remaining leaf samples were dried in an oven at 60 °C for 48 h after a 30 min desiccation treatment at 120 °C. At the same time, soil samples were dried in a shaded environment. The dried leaf and soil samples were then ground, passed through a 100-mesh sieve, and analyzed for nitrogen (N) and phosphorus (P) concentrations using an automatic Kjeldahl analyzer and the molybdenum blue method [32], respectively. The results were expressed in mg g−1.

2.5. Climate Data of Sampling Site

To investigate climatic effects on leaf functional trait variation in SBS and their adaptive strategy–environment coordination, historical climate data were extracted from the WorldClim (https://www.worldclim.org/ accessed on 16 August 2024) based on geographic coordinates of sampling sites. The climatic variables were derived at a spatial resolution of 30 arc-seconds (ca. 1 km at the equator) from historical data covering the period 1970–2000. Temperature and precipitation are key climatic drivers of leaf functional trait variation and survival strategy differentiation [51,52]. Furthermore, in mountain habitats, meteorological factors including solar radiation, wind speed, and atmospheric vapor pressure mediate plant energy acquisition, water balance, and structural stability, thereby shaping patterns of functional trait variation and adaptive strategies [53,54]. Accordingly, the following climate variables were extracted in our study: mean annual temperature (MAT, °C), mean annual precipitation (MAP, mm), solar radiation (Srad, kJ m−2 day−1), vapor pressure (Vapr, kPa), and wind speed (WS, m s−1).

3. Statistical Analyses

To characterize thresholds and variations in leaf functional traits of giant panda’s staple bamboo species, we calculated minimum (Min), maximum (Max), mean (Mean), median (Median), and standard deviation (SD) for each trait. The coefficient of variation (CV = 100 × SD/Mean) was computed to evaluate trait variation [55].
Homogeneity of variances of leaf functional trait values were tested using the Levene’s test (car 3.1.2). For datasets meeting variance homogeneity, one-way ANOVA was used to test for significant differences in trait values among species, followed by Tukey HSD post hoc tests (multcomp 1.4.22) was applied [56]. For heteroscedastic data, Welch ANOVA (oneway.test) with Holm-adjusted pairwise t-tests was employed [57]. Statistical significance was set at α = 0.05. Results were visualized as boxplots (ggplot2 3.5.0) [58].
Linear mixed-effects models (LMMs) were constructed to quantify relative contributions of taxonomic and environmental factors to trait variation [59]. Taxonomic (Genus and Species) was modeled as nested random effects (Genus/Species). Environmental fixed effects included geographic (Longitude, Latitude, Elevation), topographic (Slope, Slope position, Slope aspect), climatic (MAT, MAP, Srad, Vapr, WS), soil nutrients (SoilN, SoilP), and canopy cover (CanCov). Prior to modeling, multicollinearity among environmental variables was assessed via variance inflation factors (VIF) using the vif() function from the car. Wind speed (WS; VIF > 10) was excluded, and the remaining predictors exhibited VIF < 10, indicating acceptable collinearity [60]. All trait variables were z-score standardized. Variance components from random effects were extracted via VarCorr(), with marginal R2 (fixed effects) and conditional R2 (fixed + random effects) calculated to quantify explanatory power [61,62]. Fixed effect estimates and variance partitioning were visualized using forest plots and stacked bar charts (ggplot2).
Species-specific mean trait values were used to compute Euclidean distance matrices. Hierarchical clustering (Ward.D2 linkage, using the hclust() function) and principal component analysis (PCA, using the prcomp() function) were employed to delineate adaptive strategies [63,64]. Ten species were classified into distinct adaptive groups based on the cut height of the dendrogram derived from hierarchical clustering and supported by PCA ordination patterns. Visualizations included cluster dendrograms and PCA biplots (ggplot2).
Canonical correspondence analysis (CCA) was performed to investigate the relationships between adaptive strategies and climate and soil factors [65]. After removing collinear variables (WS), remaining climatic and soil factors (VIF < 10) were retained. The “strategy-climate” CCA triplot revealed associations between adaptive groups and habitat characteristics [66]. All data analyses were performed in R 4.2.0 [67], within the RStudio 2022.2.2.485 environment [68].

4. Results

4.1. Trait Characteristics and Variation

LT and LA ranged from 0.05 to 0.15 mm and from 4.96 to 57.57 cm2, respectively, with CVs of 31.87% and 79.16% (Table 2). LMA, VLA, FVD, Chll, LN, and LP ranged from 24.69 to 66.56 g m−2, 82.09 to 166.86 cm cm−2, 6.72 to 17.63 μm, 4.75 to 7.98 mg g−1, 16.70 to 40.57 mg g−1, and 0.77 to 2.59 mg g−1, respectively, with CVs of 24.76%, 15.69%, 25.45%, 19.05%, and 24.69% (Table 2). Chll ranged from 4.75–7.98 mg g−1, with CV of 9.58% (Table 2).
Significant differences (p < 0.05) were observed in all functional traits except Chll among the 10 SBS (Figure 3). Specifically, B. fargesii exhibited the largest LT and LA, F. robusta had the highest LMA, F. rufa had the highest VLA, F. nitida had the highest FVD, and A. faberi had the highest LN and LP. Conversely, F. denudata showed the smallest LT, Y. brevipaniculata had the smallest LA, A. faberi had the lowest LMA and FVD, C. szechuanensis had the smallest VLA, and F. dracocephala had the lowest LN and LP.

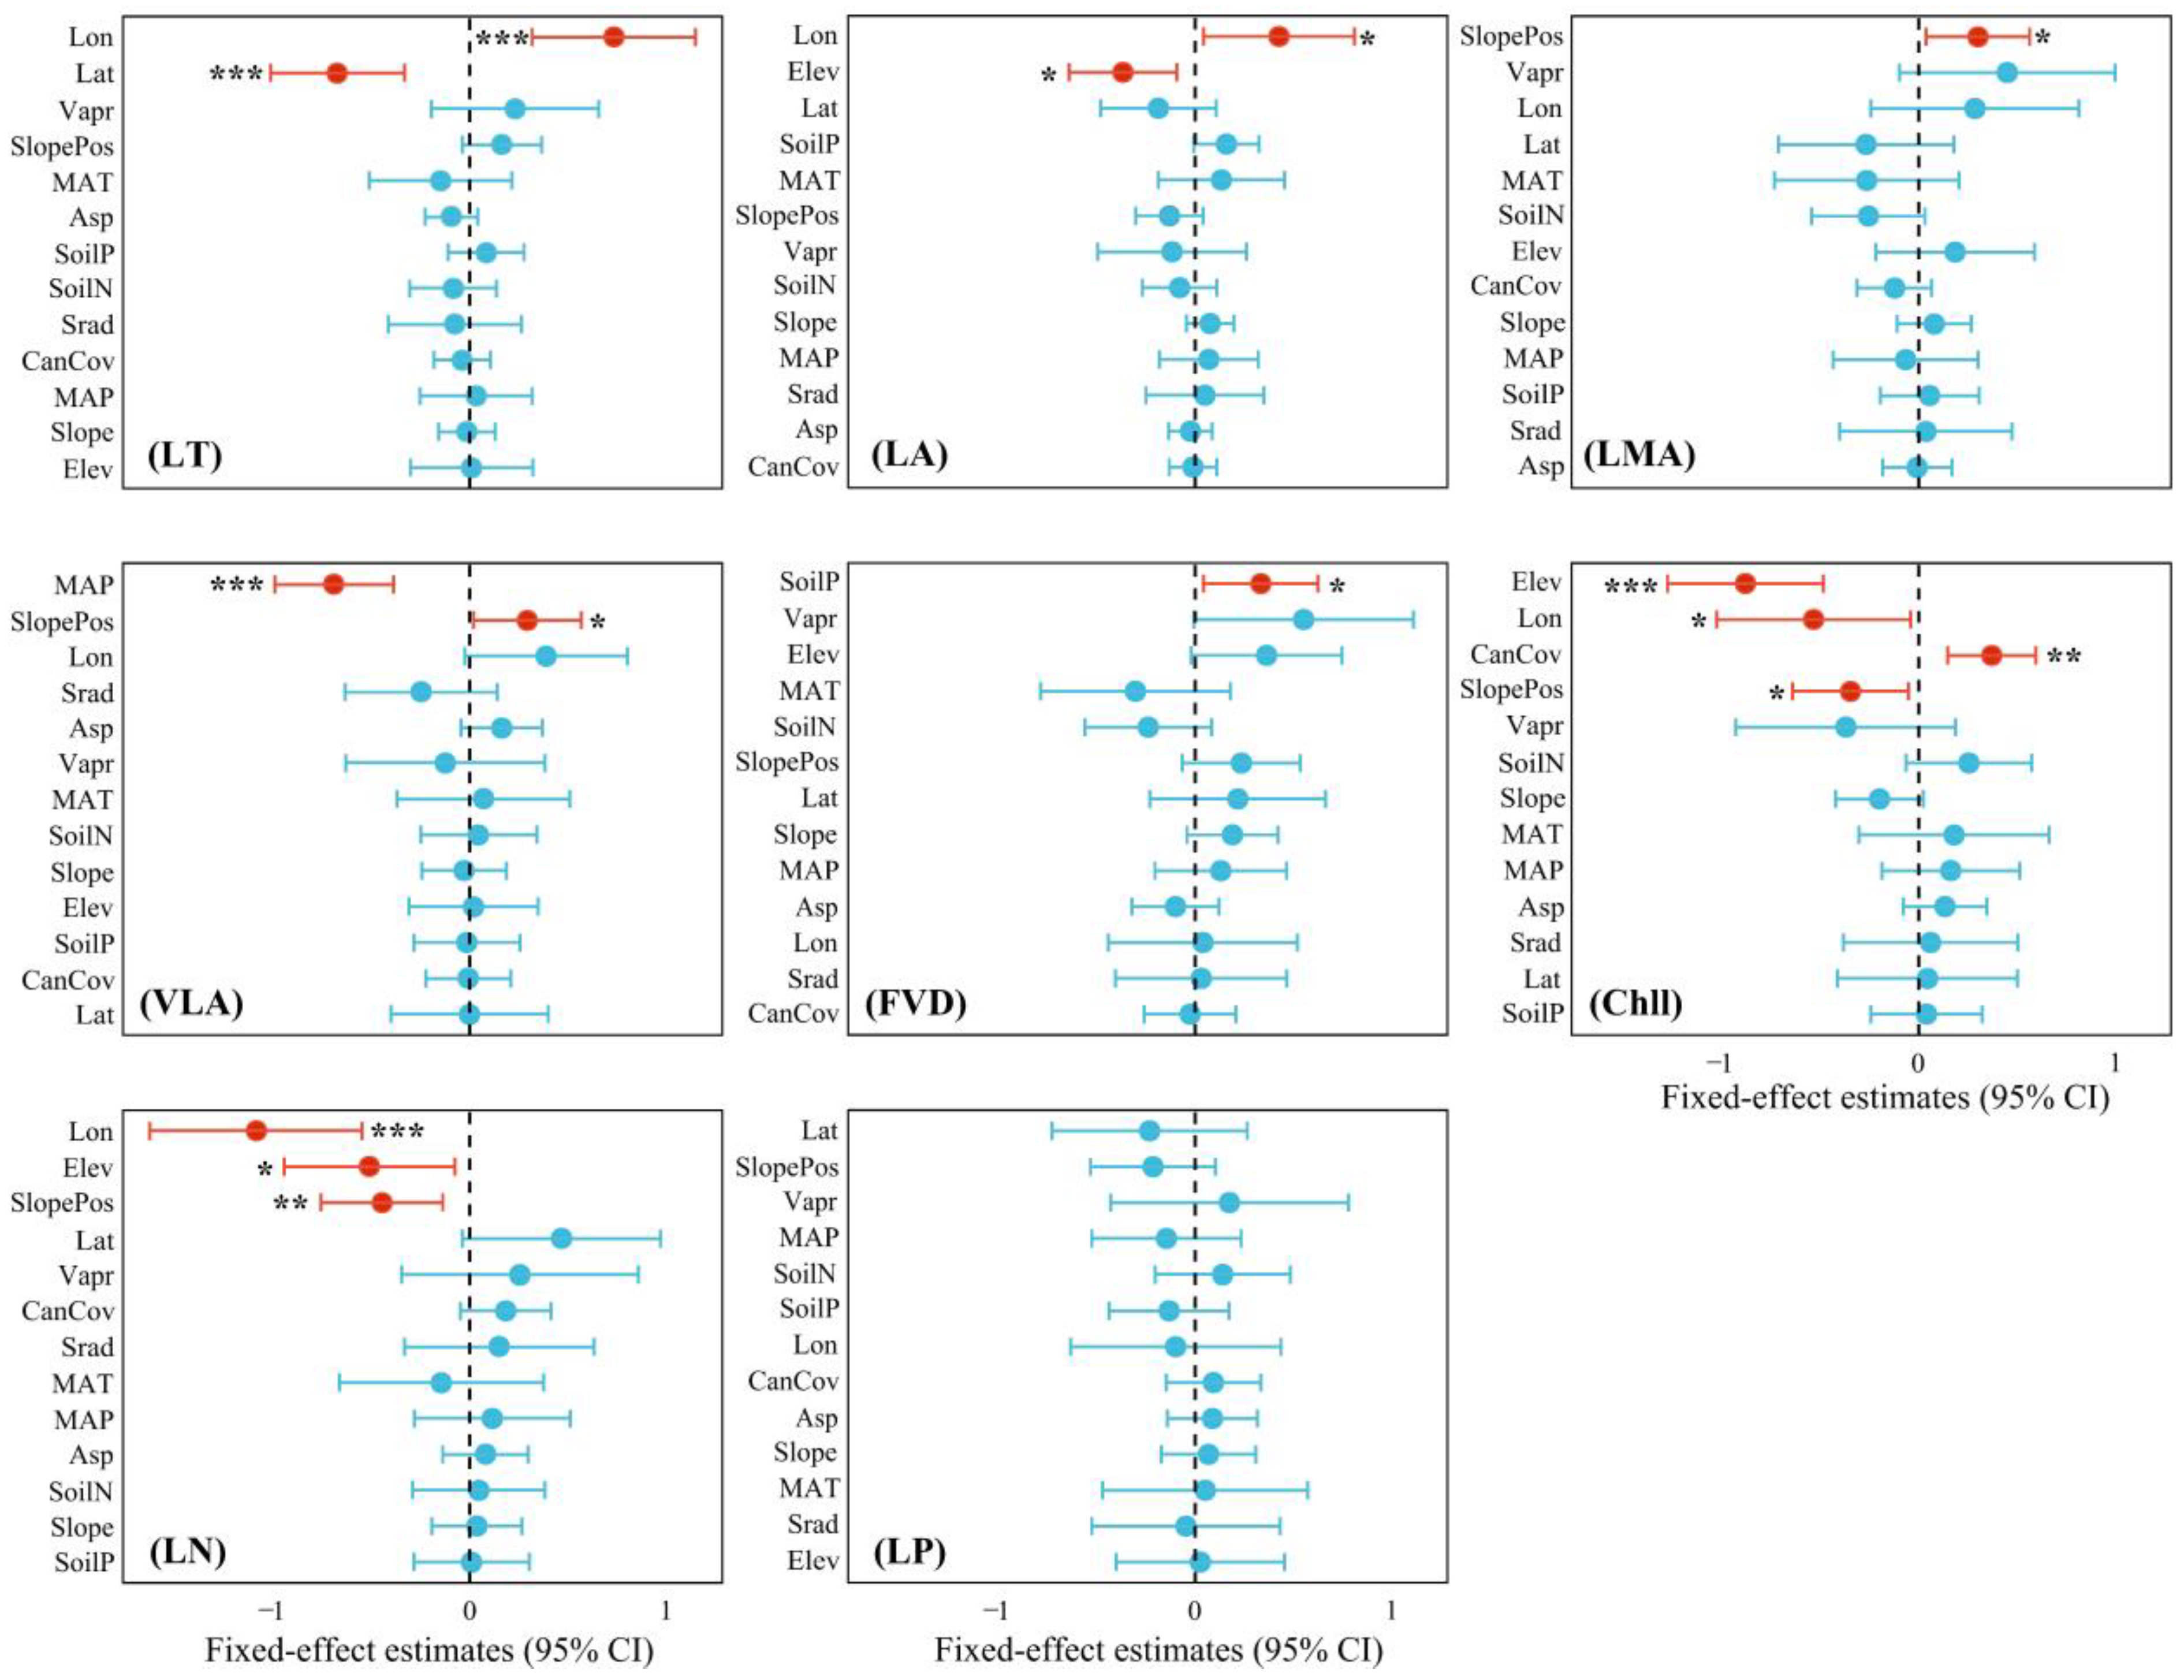
4.2. Factors Influencing Trait Variation

LMM results (Figure 4) indicated that taxonomy and environmental factors explained 36.16–89.55% (mean: 56.97%) of the variation in leaf functional traits (Figure 4). Specifically, taxonomy explained 3.07%–69.11% (mean: 29.98%), and environmental factors explained 10.95%–40.85% (mean: 26.99%).
The fixed effect estimates revealed significant effects of environmental variables on leaf functional traits (Figure 5). Specifically, Lon had positive effects on LT while Lat had negative effects on LT; Lon had positive effects on LA while Elev had negative effects on LA; LMA increased with SlopePos; MAP had negative effects on VLA while SlopePos had positive effects on VLA; SoilP had positive effects on FVD; Elev, Lon, and SlopePos had negative effects on Chll while CanCov had positive effects on Chll; and Lon, Elev, and SlopePos had negative effects on LN.

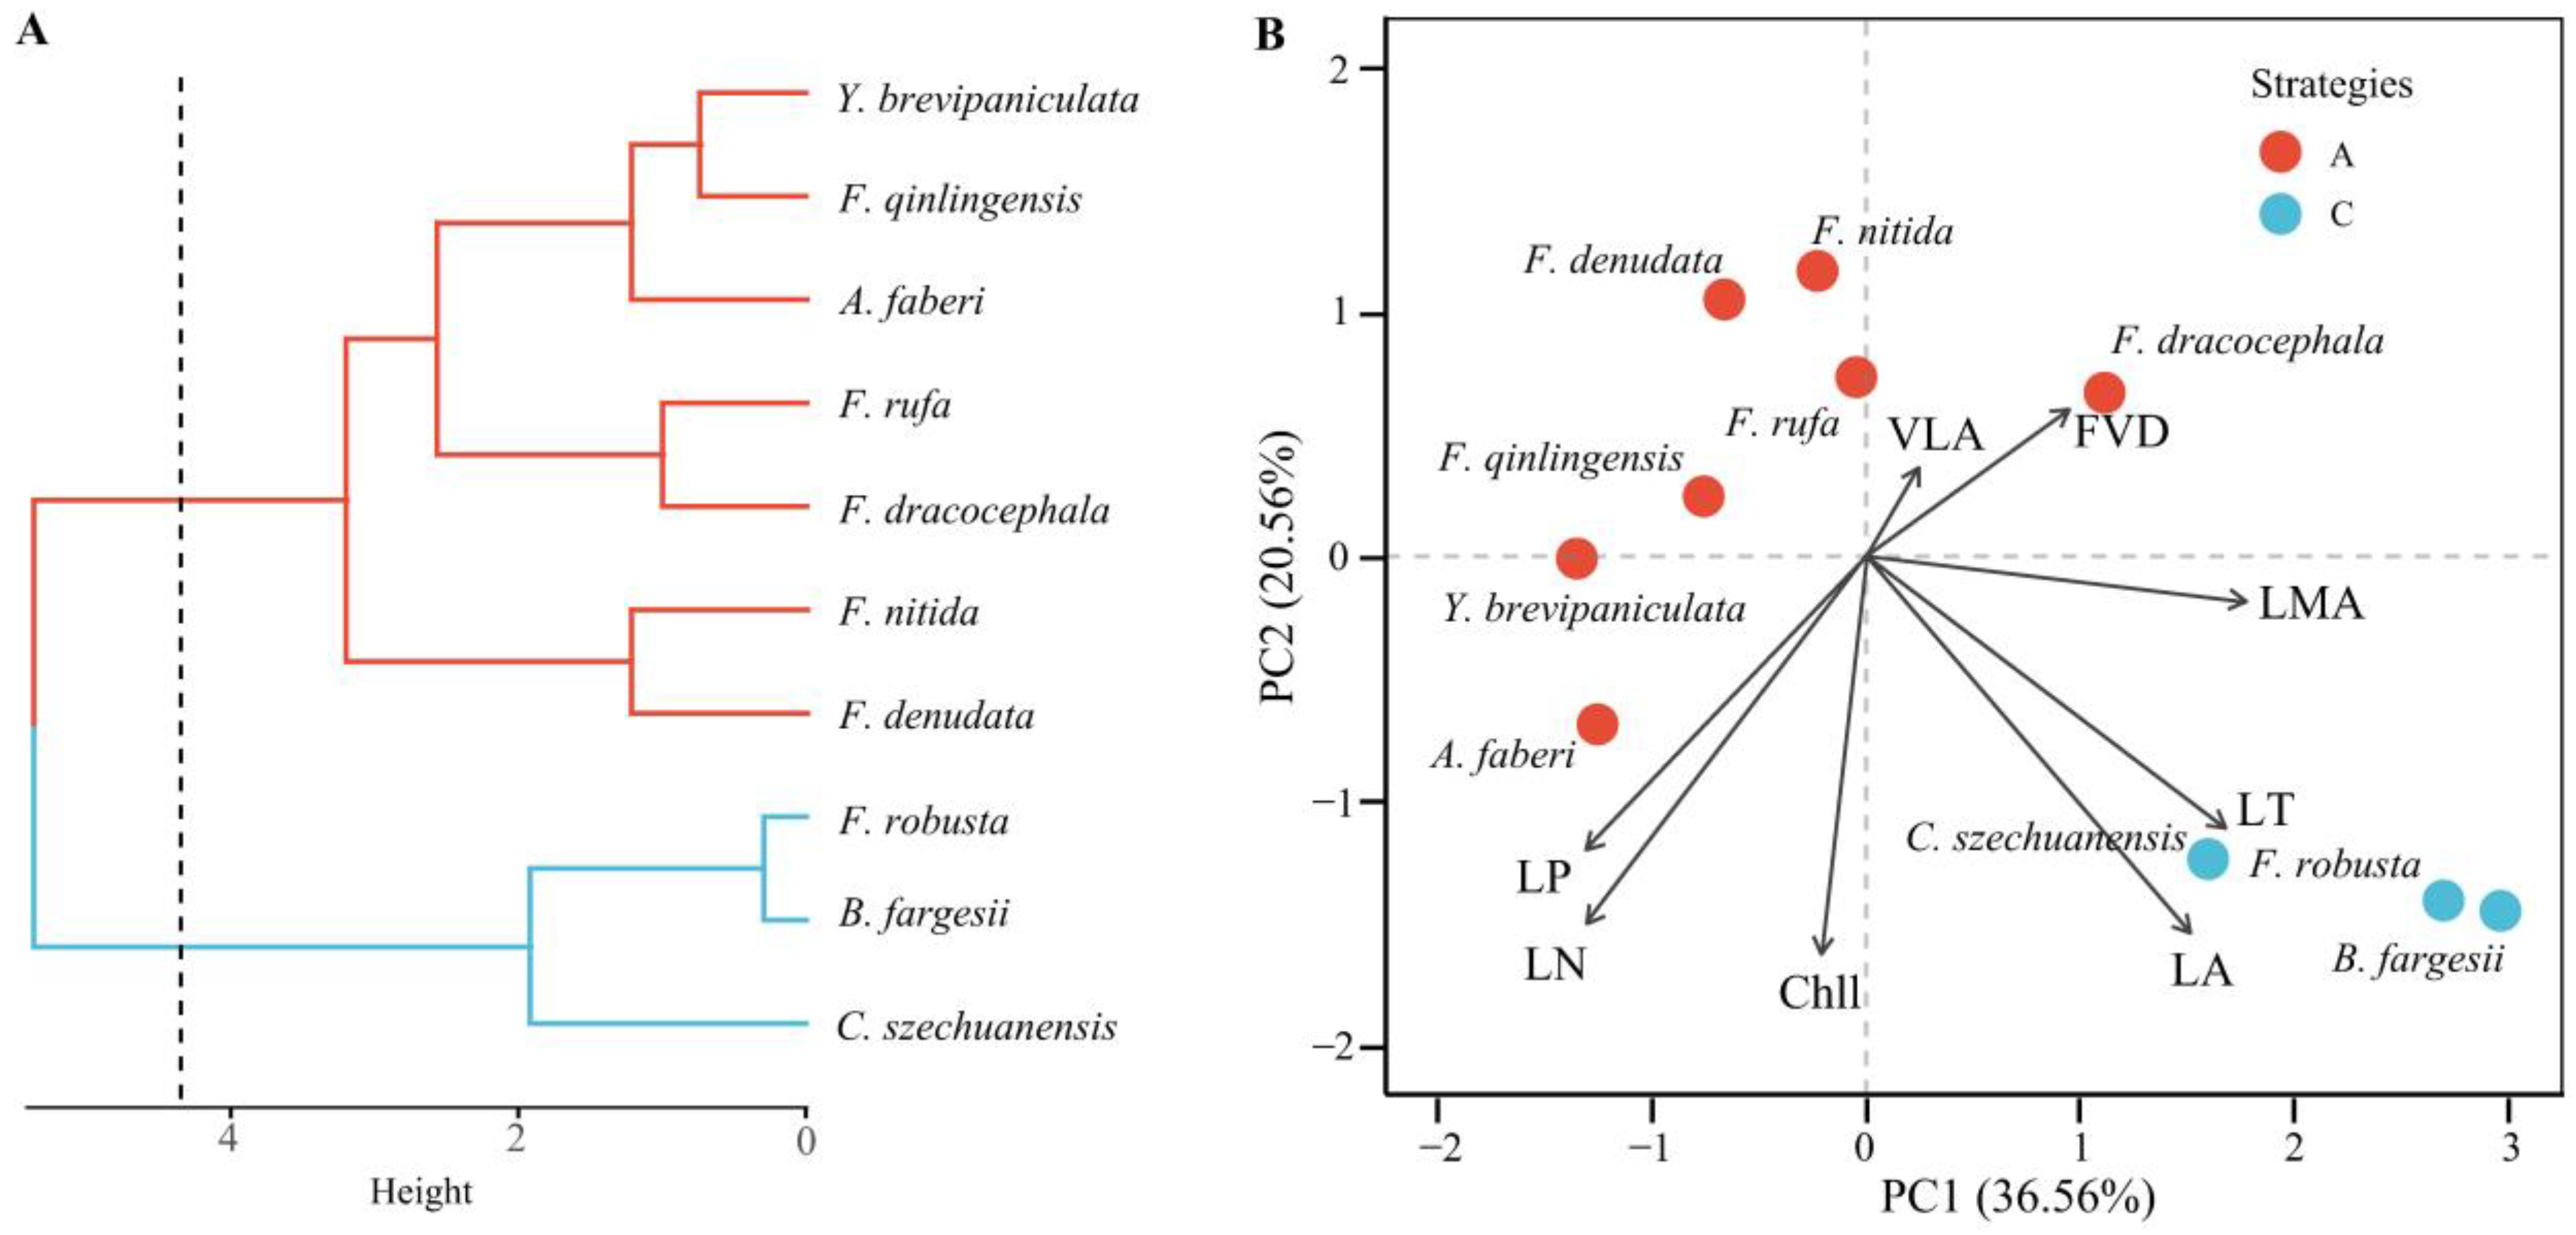
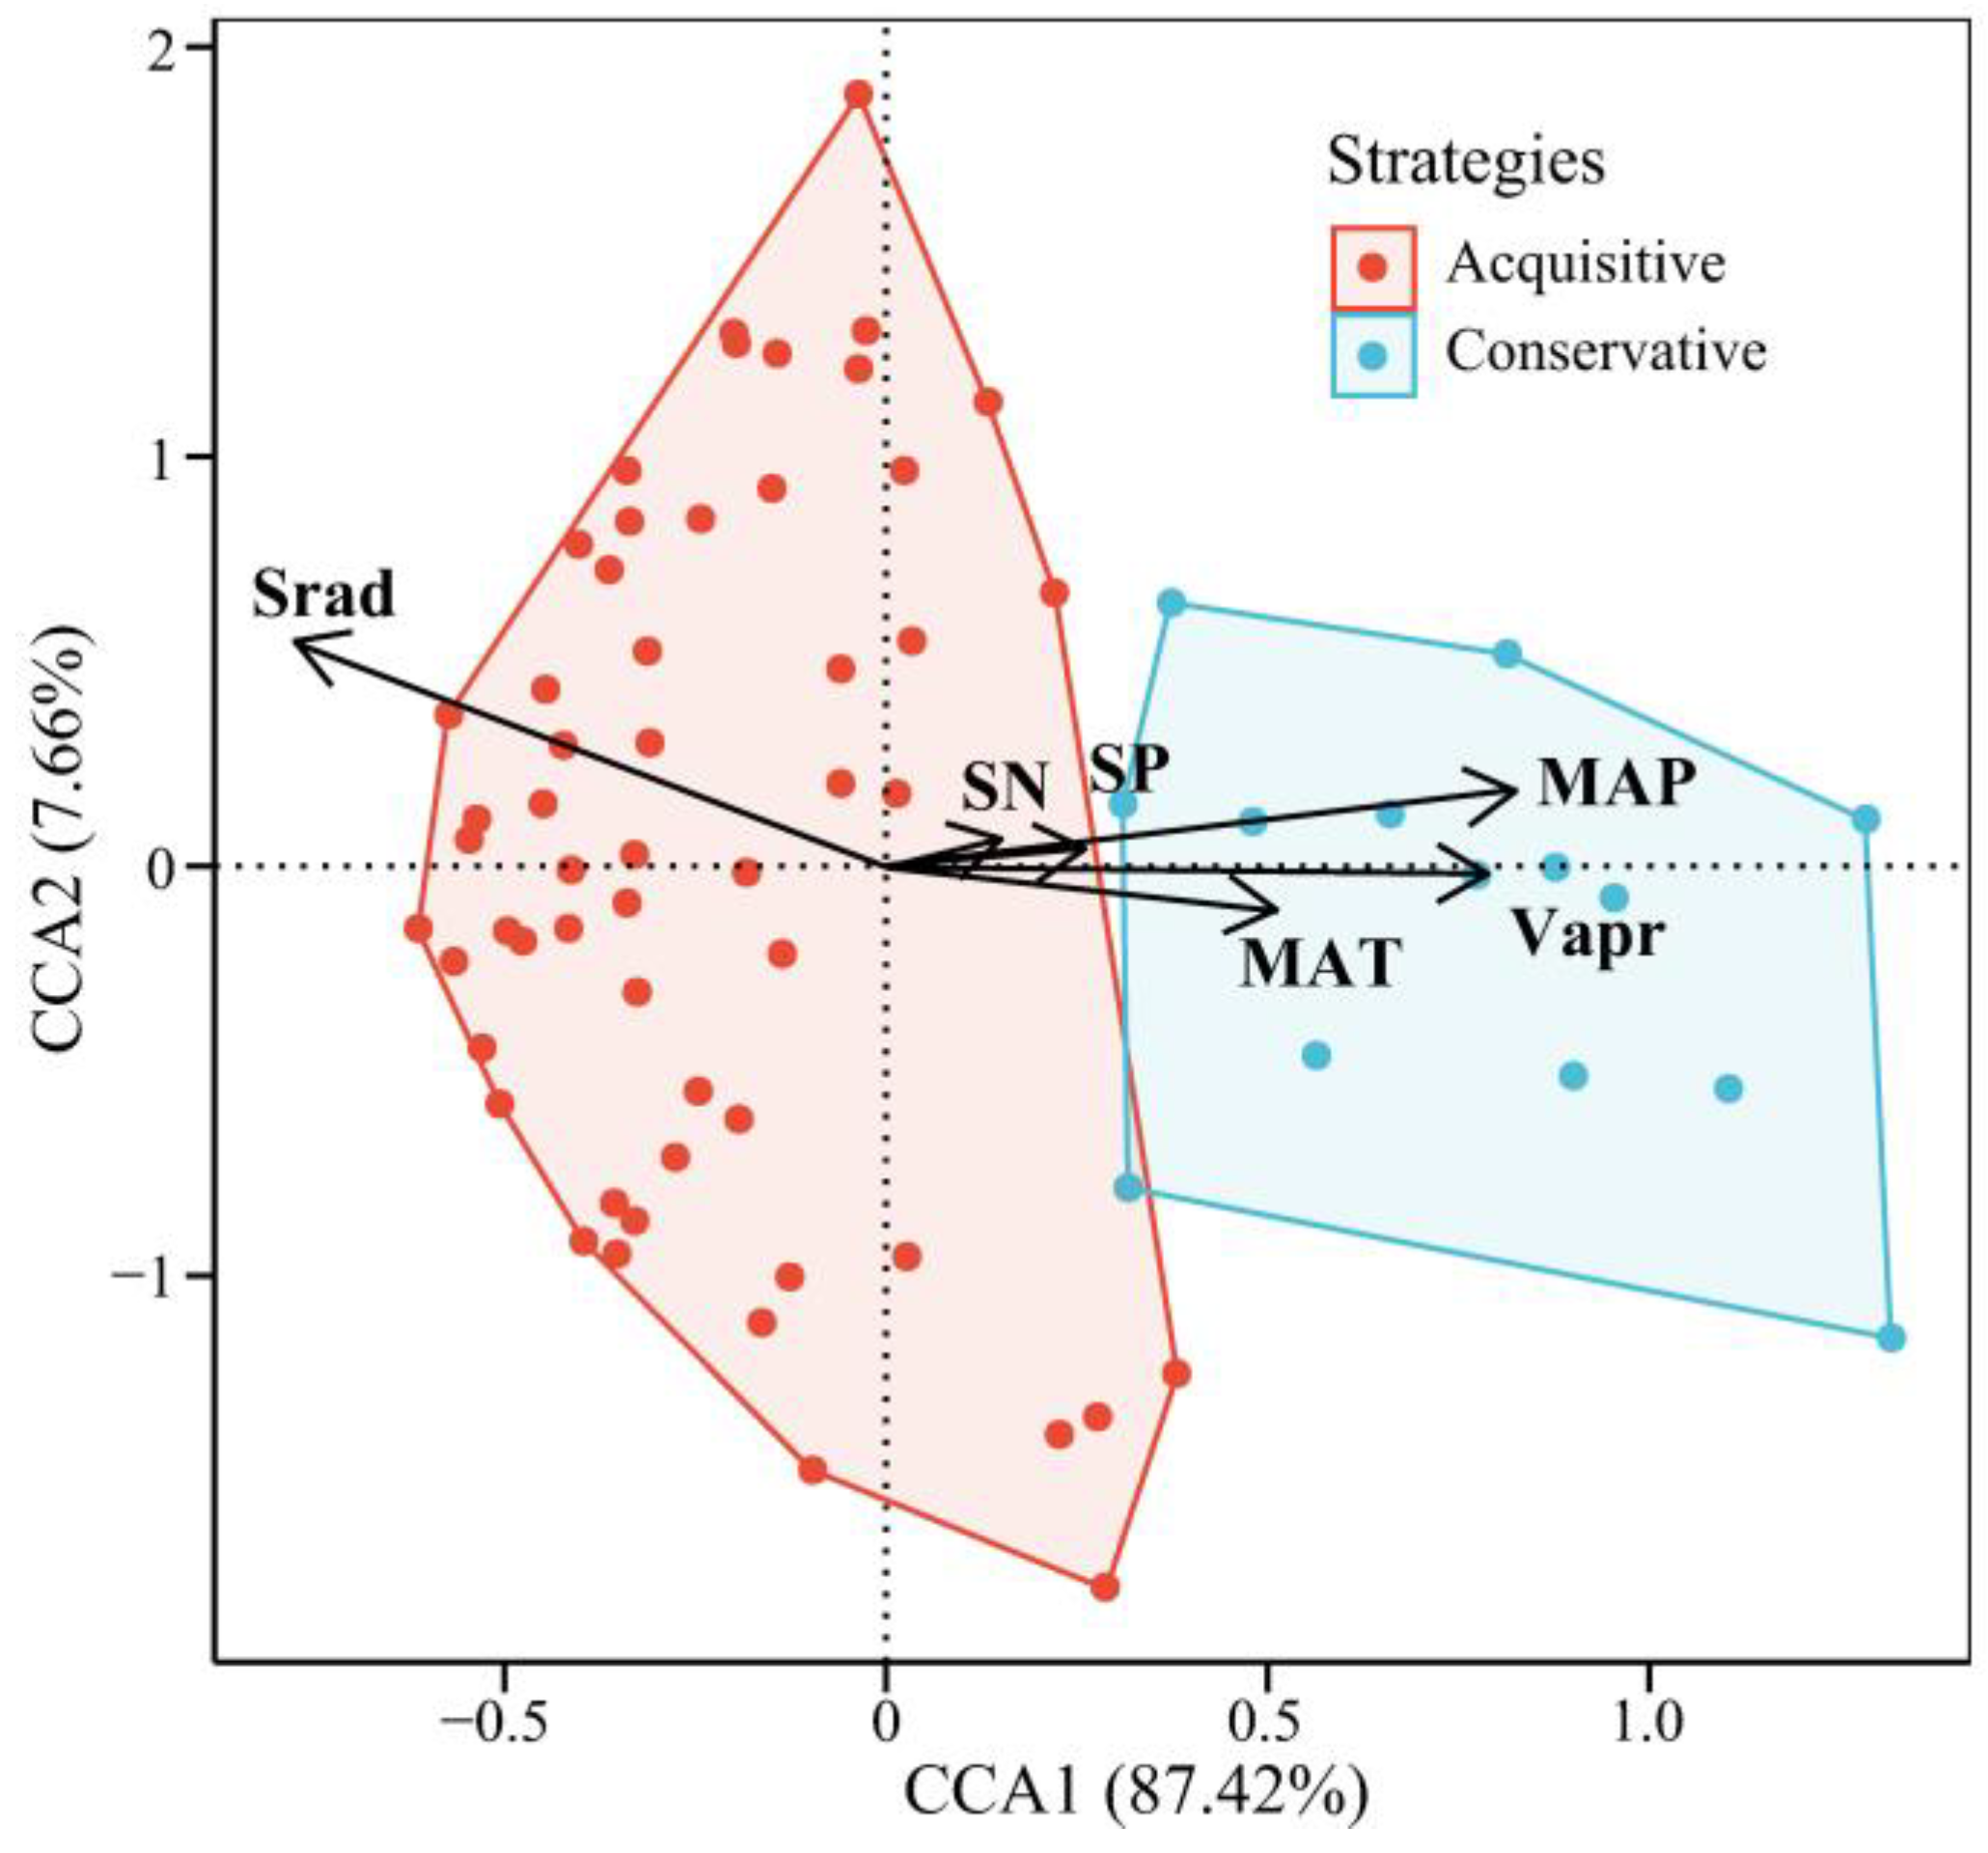
4.3. Trait-Based Strategies and Environmental Adaptation

The results of hierarchical cluster analysis (Figure 6A), PCA (Figure 6B), and CCA (Figure 7) showed that the 10 SBS could be classified into two groups based on leaf functional traits. PCA explained 36.56% and 20.56% of the variation along the first and second axes, respectively, while CCA explained 87.42% and 7.66% along the first and second constrained axes. Specifically, B. fargesii, F. robusta, and C. szechuanensis showed high LA, LT, LMA, and FVD as the first category, which were distributed in the habitats with high MAT, MAP, and Vapr. The rest of the bamboo species showed low LA, LT, LMA, and FVD and relatively high LN and LP as the second category, which were distributed in the habitats with high Srad.

5. Discussion

5.1. Trait Characteristics and Variation

Our study revealed that the coefficients of variation (CVs) of different leaf functional traits in SBSs varied widely, ranging from 9.58% to 79.16% (Table 2). Specifically, the CVs of morphological and structural traits were higher than those of physiological and nutrient-related traits, a pattern consistent with previous studies [8,41,69]. The high CVs of LA, LT, and LMA may stem from the heterogeneous habitats of SBS. The significant variation in LA (CV = 79.16%) is an adaptive response to competition for light resources: larger LA helps capture diffuse light in shaded understory environments [70], while smaller LA may imply lower construction costs and higher light use efficiency [71]. Similarly, the high variability of LMA (CV = 24.76%) and LT (CV = 31.87%) may stem from different carbon investment strategies, where some SBSs tend to invest in thicker foliage (high LMA and LT) to improve mechanical strength and longevity, while the others SBSs reduce structural investment to support rapid returns [72]. In contrast, the lower CVs of LN, LP, Chll, and VLA may be attributed to a combination of environmental filtering and physiological constraints. In this study, all species were understory species, and the high similarity of key habitat factors such as low light and high humidity may drive convergence of physiological traits through natural selection [73]. Stable chlorophyll and nutrient concentrations (Chll, LN, LP) may be due to the fact that photosynthesis-related pigment content and nutrient concentrations need to be maintained at a certain level for basal physiological metabolism in low-light environments [74]. In addition, the variation in VLA was also low, probably because the habitats of SBS are all wetting understories, and the sufficient water supply makes SBS not need to rely on the high variation in VLA to cope with possible water stress [75].
Our ANOVA results showed that morphological structural traits such as leaf area varied greatly among SBSs, while physiological nutrient traits such as chlorophyll concentration varied insignificantly or less among SBSs (Figure 3). The LMM results also revealed that leaf morphological and structural traits were driven predominantly by taxonomic effects, whereas physiological and nutrient traits were mainly influenced by environment (Figure 4). In the LMM, species identity explained the majority of variance for traits like LA (nearly ~69% of its variation attributable to species differences), highlighting strong phylogenetic or functional conservation in these traits [15,76]. This finding accords with previous studies showing that a large portion of variation in structural leaf traits is tied to taxonomic or functional group differences [77,78]. By contrast, for foliar chemical traits such as leaf nitrogen and chlorophyll content, environmental factors accounted for a sizable share of the variation, on par with or even exceeding species effects. This is in line with global analyses demonstrating that around one-third of the variability in leaf nutrient levels can be explained by environmental gradients [15,79], emphasizing high plasticity in these traits.
Furthermore, the specific environmental factors driving trait variation differed among traits. Leaf thickness, for example, increased significantly with latitude and longitude in our dataset (Figure 5), suggesting that geographic gradients shape this structural trait—a pattern consistent with leaf trait shifts along biogeographical gradients [20,80]. In contrast, chlorophyll content was positively correlated with canopy cover (higher under shaded conditions) but declined with increasing elevation, steeper slope positions, and eastward longitude (Figure 5). These relationships imply that greater light availability (lower canopy cover) and high-elevation or exposed environments constrain chlorophyll levels, whereas shaded, low-elevation habitats allow leaves to maintain higher chlorophyll [81,82]. Such trait–environment associations echo known plastic responses of leaf traits to light gradients within canopies and to climatic stress across forest ecosystem [33]. Moreover, the correlations between functional traits and climatic factors in this study were relatively weak (Figure 5), which contrasts with some previous findings [14]. This discrepancy may be attributed to the use of climate data from the WorldClim database, which is limited in its ability to capture fine-scale variation in certain climatic variables within the mountainous regions of the study area [83,84]. Future research should incorporate in situ measurements of microclimatic conditions to more accurately assess the effects of climate on functional trait variation [85]. Overall, our findings underscore that both species identity (and its inherent trait strategy determined by genetic makeup) and habitat conditions jointly determine trait expression. Different traits are dominated by different drivers: species identity imposes a strong signature on structural traits, while environmental filtering plays an equally important role for leaf nutrient and physiological traits.

5.2. Trait-Based Strategies and Environment Adaptation

The clustering and ordination analyses revealed a clear dichotomy in leaf trait syndromes among the 10 SBS, reflecting the classic trade-off between conservative and acquisitive resource-use strategies (Figure 6). Species in the conservative group (e.g., B. fargesii, F. robusta, C. szechuanensis) develop larger, thicker leaves with higher leaf mass per area (LMA) (Figure 6B), indicating substantial structural investment per unit leaf area [72,86]. These costly constructions might mean longer leaf lifespans and enhanced durability [8]. In contrast, species in the acquisitive group produce smaller, thinner leaves (low LMA and thickness) but with significantly higher foliar nitrogen and phosphorus concentrations (Figure 6B). Such traits are hallmarks of a fast-return strategy—maximizing nutrient turnover for quick growth and resource uptake [8,41]. This acquisitive–conservative axis of trait variation captures the balance between leaf construction costs and resource acquisition potential, as observed in the global leaf economics spectrum [8,19], and underscores inherent differences in how SBSs invest resources in their leaves.
Plant functional trait syndromes and their matched habitat correspondence are constrained by environmental factors [87,88]. CCA analyses showed that SBSs adopting a conservative strategy predominantly reside in warm and humid habitats, which are characterized by higher MAT, MAP, and Vapr. In contrast, acquisitive species are associated with intense solar radiation (Figure 7). This difference is caused by different selection pressures along environmental gradients. First, in colder or seasonally limited habitats (usually located at high altitudes or high latitudes), where SBSs have shorter growing seasons and a higher risk of physiological drought due to frost in winter [89,90], they strongly select for rapid access to resources through the production of leaves with high nutrient concentrations and low construction costs. In contrast, conservative strategies are preferred in warmer, wetter conditions, where the growing season is longer, water and heat are plentiful, and SBSs can construct more costly foliage to maximize longevity and retain nutrients to support continued photosynthesis and growth [91,92,93]. Similar results have been observed in evergreen and deciduous tree species. For example, as elevation increases, the vegetation distribution of mountains typically shifts from broadleaf evergreens with smaller, thicker leaves to broadleaf deciduous species with larger, thinner leaves [94]. In summary, our findings demonstrate that leaf trait trade-offs in these staple bamboos are tightly aligned with environmental conditions, leading to two distinct adaptive syndromes. Climatic and soil gradients act as filters that favor either an acquisitive or a conservative syndrome, thereby driving the differentiation of species’ strategies across habitats.

6. Conclusions

Leaf morphological and structural traits in SBSs were more variable and mainly influenced by taxonomic factors; leaf physiological nutrient traits were less variable and more strongly regulated by environmental factors. The adaptive strategies of ten SBSs can be broadly categorized into two types: a conservative strategy group, represented by B. fargesii, F. robusta, and C. szechuanensis, characterized by higher leaf area and structural investment; and an acquisitive strategy group, comprising the remaining species with lower structural investment but higher nutrient concentrations. These two groups show distinct climate–strategy matching patterns, with the conservative group primarily distributed in warm and humid habitats, and the acquisitive group occurring in environments with high solar radiation. Our results emphasize the characterization of functional traits of SBS leaves and the factors influencing their variation and reveal trait-based adaptive strategies and their correspondence with environmental factors, which are crucial for the effective conservation and management of the main bamboo species of giant pandas in the wild, especially considering the potential impacts of climate change on their habitats.

Supplementary Materials

The following supporting information can be downloaded at: https://www.mdpi.com/article/10.3390/f16060954/s1, Table S1: Basic background information for each survey site of SBS.

Author Contributions

Conceptualization, X.L., Y.Z. (Yuanbin Zhang), C.H. and J.P.R.; Methodology, X.L., Y.Z. (Yilin Zhou), J.H., L.T., X.C., Y.Z. (Yuanbin Zhang), S.Z., J.S., C.H. and J.P.R.; Validation, X.Z. and W.Z.; Formal analysis, W.Z.; Investigation, X.L., Y.Z. (Yilin Zhou), X.Z., R.W., Z.L., J.H. and S.Z.; Writing—original draft, X.L.; Writing—review & editing, X.L., Y.Z. (Yilin Zhou), X.Z., W.Z., R.W., Z.L., J.H., L.T., X.C., Y.Z. (Yuanbin Zhang), S.Z., J.S., C.H. and J.P.R.; Supervision, C.H. All authors have read and agreed to the published version of the manuscript.

Funding

This work was supported by the National Natural Science Foundation of China (32401425), the China Postdoctoral Science Foundation (2024M763192), the Natural Science Foundation of Sichuan Province (2025ZNSFSC0266 and 2025ZNSFSC1033, and 2024NSFSC1191), the Science and Technology Project of Sichuan Province (2021YFYZ0006), and the Special Project for Guiding Local Science and Technology Development by the Central Government of China (Sichuan Province) (2023ZYD0103). Xiong Liu was funded by a joint-PhD scholarship from China Scholarship Council (CSC, no. 202206910036). JP and JS were supported by the Spanish Government grants PID2022-140808NB-I00, and TED2021-132627 B–I00 funded by MCIN, AEI/10.13039/501100011033 European Union Next Generation EU/PRTR.

Data Availability Statement

Data is contained within the article.

Acknowledgments

We thank the following protect areas for their support of the experiment: Baishuihe, Baishuijiang, Baiyang, Baodinggou, Emeishan, Foping, Labahe, Longcanggou, Longxi-Hongkou, Mabiandafengding, Miyaluo, Shenmulei, Tangjiahe, Wanglang, and Xiaozhaizigou. We are grateful to our mountain guides and those who helped with sample collection. We thank Yuxiang Wang, Lei Yang, and Jun Chen for their contributions in the laboratory experiments.

Conflicts of Interest

The authors declare no conflict of interest.

References

  1. Wei, F.; Fan, H.; Hu, Y. Ailuropoda Melanoleuca (Giant Panda). In Trends in Genetics; Elsevier: Amsterdam, The Netherlands, 2020; Volume 36, pp. 68–69. [Google Scholar]
  2. Wei, F.; Swaisgood, R.; Hu, Y.; Nie, Y.; Yan, L.; Zhang, Z.; Qi, D.; Zhu, L. Progress in the Ecology and Conservation of Giant Pandas. Conserv. Biol. 2015, 29, 1497–1507. [Google Scholar] [CrossRef] [PubMed]
  3. Zhao, H.; Yang, J.R.; Xu, H.; Zhang, J. Pseudogenization of the Umami Taste Receptor Gene Tas1r1 in the Giant Panda Coincided with Its Dietary Switch to Bamboo. Mol. Biol. Evol. 2010, 27, 2669–2673. [Google Scholar] [CrossRef]
  4. Kang, D.; Lv, J.; Li, S.; Chen, X.; Wang, X.; Li, J. Relationship between Bamboo Growth Status and Woody Plants in a Giant Panda Habitat. Ecol. Indic. 2019, 98, 840–843. [Google Scholar] [CrossRef]
  5. Tang, J.; Swaisgood, R.R.; Owen, M.A.; Zhao, X.; Wei, W.; Pilfold, N.W.; Wei, F.; Yang, X.; Gu, X.; Yang, Z.; et al. Climate Change and Landscape-Use Patterns Influence Recent Past Distribution of Giant Pandas. Proc. R. Soc. B Biol. Sci. 2020, 287, 20200358. [Google Scholar] [CrossRef]
  6. Kong, L.; Xu, W.; Xiao, Y.; Pimm, S.L.; Shi, H.; Ouyang, Z. Spatial Models of Giant Pandas under Current and Future Conditions Reveal Extinction Risks. Nat. Ecol. Evol. 2021, 5, 1309–1316. [Google Scholar] [CrossRef]
  7. Tuanmu, M.N.; Viña, A.; Winkler, J.A.; Li, Y.; Xu, W.; Ouyang, Z.; Liu, J. Climate-Change Impacts on Understorey Bamboo Species and Giant Pandas in China’s Qinling Mountains. Nat. Clim. Change 2013, 3, 249–253. [Google Scholar] [CrossRef]
  8. Wright, I.J.; Reich, P.B.; Westoby, M.; Ackerly, D.D.; Baruch, Z.; Bongers, F.; Cavender-Bares, J.; Chapin, T.; Cornellssen, J.H.C.; Diemer, M.; et al. The Worldwide Leaf Economics Spectrum. Nature 2004, 428, 821–827. [Google Scholar] [CrossRef] [PubMed]
  9. Wright, I.J.; Dong, N.; Maire, V.; Prentice, I.C.; Westoby, M.; Díaz, S.; Gallagher, R.V.; Jacobs, B.F.; Kooyman, R.; Law, E.A.; et al. Global Climatic Drivers of Leaf Size. Science 2017, 357, 917–921. [Google Scholar] [CrossRef] [PubMed]
  10. Osnas, J.L.D.; Katabuchi, M.; Kitajima, K.; Joseph Wright, S.; Reich, P.B.; Van Bael, S.A.; Kraft, N.J.B.; Samaniego, M.J.; Pacala, S.W.; Lichstein, J.W. Divergent Drivers of Leaf Trait Variation within Species, among Species, and among Functional Groups. Proc. Natl. Acad. Sci. USA 2018, 115, 5480–5485. [Google Scholar] [CrossRef]
  11. Heberling, J.M.; Fridley, J.D. Biogeographic Constraints on the World-Wide Leaf Economics Spectrum. Glob. Ecol. Biogeogr. 2012, 21, 1137–1146. [Google Scholar] [CrossRef]
  12. Reich, P.B.; Wright, I.J.; Cavender-Bares, J.; Craine, J.M.; Oleksyn, J.; Westoby, M.; Walters, M.B. The Evolution of Plant Functional Variation: Traits, Spectra, and Strategies. Int. J. Plant Sci. 2003, 164, S143–S164. [Google Scholar] [CrossRef]
  13. Yu, X.; Ji, R.; Li, M.; Xia, X.; Yin, W.; Liu, C. Geographical Variation in Functional Traits of Leaves of Caryopteris mongholica and the Role of Climate. BMC Plant Biol. 2023, 23, 394. [Google Scholar] [CrossRef]
  14. Zhang, J.; Zhai, J.; Wang, J.; Si, J.; Li, J.; Ge, X.; Li, Z. Interrelationships and Environmental Influences of Photosynthetic Capacity and Hydraulic Conductivity in Desert Species Populus pruinosa. Forests 2024, 15, 1094. [Google Scholar] [CrossRef]
  15. Tian, D.; Yan, Z.; Schmid, B.; Kattge, J.; Fang, J.; Stocker, B.D. Environmental versus Phylogenetic Controls on Leaf Nitrogen and Phosphorous Concentrations in Vascular Plants. Nat. Commun. 2024, 15, 5346. [Google Scholar] [CrossRef] [PubMed]
  16. Akram, M.A.; Wang, X.; Shrestha, N.; Zhang, Y.; Sun, Y.; Yao, S.; Li, J.; Hou, Q.; Hu, W.; Ran, J.; et al. Variations and Driving Factors of Leaf Functional Traits in the Dominant Desert Plant Species along an Environmental Gradient in the Drylands of China. Sci. Total Environ. 2023, 897, 165394. [Google Scholar] [CrossRef]
  17. Zhou, J.; Cieraad, E.; van Bodegom, P.M. Global Analysis of Trait–Trait Relationships within and between Species. New Phytol. 2022, 233, 1643–1656. [Google Scholar] [CrossRef]
  18. Bai, X.L.; Feng, T.; Zou, S.; He, B.; Chen, Y.; Li, W.J. Differences in Leaf Functional Traits of Quercus rehderiana Hand.-Mazz. in Forests with Rocky and Non-Rocky Desertification in Southwest China. Forests 2024, 15, 1439. [Google Scholar] [CrossRef]
  19. Reich, P.B.; Walters, M.B.; Ellsworth, D.S. From Tropics to Tundra: Global Convergence in Plant Functioning. Proc. Natl. Acad. Sci. USA 1997, 94, 13730–13734. [Google Scholar] [CrossRef]
  20. Liu, R.; Yang, X.; Gao, R.; Huang, Z.; Cornelissen, J.H.C. Coordination of Economics Spectra in Leaf, Stem and Root within the Genus Artemisia along a Large Environmental Gradient in China. Glob. Ecol. Biogeogr. 2023, 32, 324–338. [Google Scholar] [CrossRef]
  21. Asner, G.P.; Knapp, D.E.; Anderson, C.B.; Martin, R.E.; Vaughn, N. Large-Scale Climatic and Geophysical Controls on the Leaf Economics Spectrum. Proc. Natl. Acad. Sci. USA 2016, 113, E4043–E4051. [Google Scholar] [CrossRef]
  22. Pan, Y.; Cieraad, E.; Armstrong, J.; Armstrong, W.; Clarkson, B.R.; Colmer, T.D.; Pedersen, O.; Visser, E.J.W.; Voesenek, L.A.C.J.; van Bodegom, P.M. Global Patterns of the Leaf Economics Spectrum in Wetlands. Nat. Commun. 2020, 11, 4519. [Google Scholar] [CrossRef] [PubMed]
  23. Muir, C.D.; Conesa, M.; Roldán, E.J.; Molins, A.; Galmés, J. Weak Coordination between Leaf Structure and Function among Closely Related Tomato Species. New Phytol. 2017, 213, 1642–1653. [Google Scholar] [CrossRef]
  24. Anderegg, L.D.L.; Berner, L.T.; Badgley, G.; Sethi, M.L.; Law, B.E.; HilleRisLambers, J. Within-Species Patterns Challenge Our Understanding of the Leaf Economics Spectrum. Ecol. Lett. 2018, 21, 734–744. [Google Scholar] [CrossRef] [PubMed]
  25. Cui, E.; Weng, E.; Yan, E.; Xia, J. Robust Leaf Trait Relationships across Species under Global Environmental Changes. Nat. Commun. 2020, 11, 2999. [Google Scholar] [CrossRef]
  26. Deng, F.; Xiao, L.; Huang, J.; Luo, H.; Zang, R. Changes in Leaf Functional Traits Driven by Environmental Filtration in Different Monsoon Tropical Forest Types. Forests 2023, 14, 2101. [Google Scholar] [CrossRef]
  27. Wen, Y.; Chen, C.; He, B.; Lu, X. CSR Ecological Strategies and Functional Traits of the Co-Existing Species along the Succession in the Tropical Lowland Rain Forest. Forests 2022, 13, 1272. [Google Scholar] [CrossRef]
  28. Fadrique, B.; Baraloto, C.; Bravo-Avila, C.H.; Feeley, K.J. Bamboo Climatic Tolerances are Decoupled from Leaf Functional Traits across an Andean Elevation Gradient. Oikos 2022, 2022, e09229. [Google Scholar] [CrossRef]
  29. Yao, L.; Ding, Y.; Yao, L.; Ai, X.; Zang, R. Trait Gradient Analysis for Evergreen and Deciduous Species in a Subtropical Forest. Forests 2020, 11, 364. [Google Scholar] [CrossRef]
  30. Ahmad, Z.; Upadhyay, A.; Ding, Y.; Emamverdian, A.; Shahzad, A. Bamboo: Origin, Habitat, Distributions and Global Prospective. In Biotechnological Advances in Bamboo; Ahmad, Z., Ding, Y., Shahzad, A., Eds.; Springer: Singapore, 2021; pp. 1–31. ISBN 9789811613098. [Google Scholar]
  31. Clark, L.G.; Londoño, X.; Ruiz-Sanchez, E. Bamboo Taxonomy and Habitat. In Tropical Forestry Series; Liese, W., Köhl, M., Eds.; Springer International Publishing: Berlin/Heidelberg, Germany, 2015; pp. 1–30. ISBN 978-3-319-14133-6. [Google Scholar]
  32. Liu, X.; Zhou, S.; Hu, J.; Zou, X.; Tie, L.; Li, Y.; Cui, X.; Huang, C. Variations and Trade-Offs in Leaf and Culm Functional Traits among 77 Woody Bamboo Species. BMC Plant Biol. 2024, 24, 387. [Google Scholar] [CrossRef]
  33. Keenan, T.F.; Niinemets, Ü. Global Leaf Trait Estimates Biased due to Plasticity in the Shade. Nat. Plants 2016, 3, 16201. [Google Scholar] [CrossRef]
  34. Blonder, B.; Salinas, N.; Bentley, L.P.; Shenkin, A.; Chambi Porroa, P.O.; Valdez Tejeira, Y.; Boza Espinoza, T.E.; Goldsmith, G.R.; Enrico, L.; Martin, R.; et al. Structural and Defensive Roles of Angiosperm Leaf Venation Network Reticulation across an Andes–Amazon Elevation Gradient. J. Ecol. 2018, 106, 1683–1699. [Google Scholar] [CrossRef]
  35. Li, Y.; Viña, A.; Yang, W.; Chen, X.; Zhang, J.; Ouyang, Z.; Liang, Z.; Liu, J. Effects of Conservation Policies on Forest Cover Change in Giant Panda Habitat Regions, China. Land Use Policy 2013, 33, 42–53. [Google Scholar] [CrossRef]
  36. Lu, Z.; Franklin, S.B. Clonal Integration and Regeneration in Bamboo Bashania fargesii. For. Ecol. Manag. 2022, 523, 120504. [Google Scholar] [CrossRef]
  37. Christian, A.L.; Knott, K.K.; Vance, C.K.; Falcone, J.F.; Bauer, L.L.; Fahey, G.C.J.; Willard, S.; Kouba, A.J. Nutrient and Mineral Composition during Shoot Growth in Seven Species of Phyllostachys and Pseudosasa Bamboo Consumed by Giant Panda. J. Anim. Physiol. Anim. Nutr. 2015, 99, 1172–1183. [Google Scholar] [CrossRef]
  38. Yang, H.; Zhang, D.; Winkler, J.A.; Huang, Q.; Zhang, Y.; Wu, P.; Liu, J.; Ouyang, Z.; Xu, W.; Chen, X.; et al. Field Experiment Reveals Complex Warming Impacts on Giant Pandas’ Bamboo Diet. Biol. Conserv. 2024, 294, 110635. [Google Scholar] [CrossRef]
  39. Tian, H.; Zeng, Y.; Zhang, Z.; Lu, M.; Wei, W. Grazing-Induced Habitat Degradation: Challenges to Giant Panda Survival Resulting from Declining Bamboo and Soil Quality. Animals 2025, 15, 202. [Google Scholar] [CrossRef]
  40. Chinese State Forestry Administration. The Fourth National Giant Panda Survey; Chinese Science Press: Beijing, China, 2021; pp. 1–125. [Google Scholar]
  41. Díaz, S.; Kattge, J.; Cornelissen, J.H.C.; Wright, I.J.; Lavorel, S.; Dray, S.; Reu, B.; Kleyer, M.; Wirth, C.; Colin Prentice, I.; et al. The Global Spectrum of Plant Form and Function. Nature 2016, 529, 167–171. [Google Scholar] [CrossRef]
  42. Migliavacca, M.; Musavi, T.; Mahecha, M.D.; Nelson, J.A.; Knauer, J.; Baldocchi, D.D.; Perez-Priego, O.; Christiansen, R.; Peters, J.; Anderson, K.; et al. The Three Major Axes of Terrestrial Ecosystem Function. Nature 2021, 598, 468–472. [Google Scholar] [CrossRef]
  43. Wei, W.; Swaisgood, R.R.; Pilfold, N.W.; Owen, M.A.; Dai, Q.; Wei, F.; Han, H.; Yang, Z.; Yang, X.; Gu, X.; et al. Assessing the Effectiveness of China’s Panda Protection System. Curr. Biol. 2020, 30, 1280–1286.e2. [Google Scholar] [CrossRef]
  44. Makita, A. The Significance of the Mode of Clonal Growth in the Life History of Bamboos. Plant Species Biol. 1998, 13, 85–92. [Google Scholar] [CrossRef]
  45. Li, Q.; Peng, C.; Zhang, J.; Li, Y.; Song, X. Nitrogen Addition Decreases Methane Uptake Caused by Methanotroph and Methanogen Imbalances in a Moso Bamboo Forest. Sci. Rep. 2021, 11, 5578. [Google Scholar] [CrossRef] [PubMed]
  46. Liese, W.; Weiner, G. Ageing of Bamboo Culms. A Review. Wood Sci. Technol. 1996, 30, 77–89. [Google Scholar] [CrossRef]
  47. Guo, W.; Cherubini, P.; Zhang, J.; Hu, X.; Li, M.H.; Qi, L. Soil Physicochemical Properties Determine Leaf Traits but Not Size Traits of Moso Bamboo (Phyllostachys edulis). Environ. Res. Lett. 2022, 17, 114061. [Google Scholar] [CrossRef]
  48. Pérez-Harguindeguy, N.; Díaz, S.; Garnier, E.; Lavorel, S.; Poorter, H.; Jaureguiberry, P.; Bret-Harte, M.S.; Cornwell, W.K.; Craine, J.M.; Gurvich, D.E.; et al. New Handbook for Standardised Measurement of Plant Functional Traits Worldwide. Aust. J. Bot. 2013, 61, 167–234. [Google Scholar] [CrossRef]
  49. Blonder, B.; Violle, C.; Enquist, B.J. Assessing the Causes and Scales of the Leaf Economics Spectrum Using Venation Networks in Populus tremuloides. J. Ecol. 2013, 101, 981–989. [Google Scholar] [CrossRef]
  50. Ritchie, R.J. Consistent Sets of Spectrophotometric Chlorophyll Equations for Acetone, Methanol and Ethanol Solvents. Photosynth. Res. 2006, 89, 27–41. [Google Scholar] [CrossRef]
  51. Bruelheide, H.; Dengler, J.; Purschke, O.; Lenoir, J.; Jiménez-Alfaro, B.; Hennekens, S.M.; Botta-Dukát, Z.; Chytrý, M.; Field, R.; Jansen, F.; et al. Global Trait–Environment Relationships of Plant Communities. Nat. Ecol. Evol. 2018, 2, 1906–1917. [Google Scholar] [CrossRef]
  52. Li, J.; Prentice, I.C. Global Patterns of Plant Functional Traits and Their Relationships to Climate. Commun. Biol. 2024, 7, 1136. [Google Scholar] [CrossRef]
  53. Reich, P.B.; Wright, I.J.; Lusk, C.H. Predicting Leaf Physiology from Simple Plant and Climate Attributes: A Global Glopnet Analysis. Ecol. Appl. 2007, 17, 1982–1988. [Google Scholar] [CrossRef]
  54. Fyllas, N.M.; Bentley, L.P.; Shenkin, A.; Asner, G.P.; Atkin, O.K.; Díaz, S.; Enquist, B.J.; Farfan-Rios, W.; Gloor, E.; Guerrieri, R.; et al. Solar Radiation and Functional Traits Explain the Decline of Forest Primary Productivity along a Tropical Elevation Gradient. Ecol. Lett. 2017, 20, 730–740. [Google Scholar] [CrossRef]
  55. Salazar Zarzosa, P.; Diaz Herraiz, A.; Olmo, M.; Ruiz-Benito, P.; Barrón, V.; Bastias, C.C.; de la Riva, E.G.; Villar, R. Linking Functional Traits with Tree Growth and Forest Productivity in Quercus ilex Forests along a Climatic Gradient. Sci. Total Environ. 2021, 786, 147468. [Google Scholar] [CrossRef]
  56. Ren, L.; Guo, X.; Liu, S.; Yu, T.; Guo, W.; Wang, R.; Ye, S.; Lambertini, C.; Brix, H.; Eller, F. Intraspecific Variation in Phragmites australis: Clinal Adaption of Functional Traits and Phenotypic Plasticity Vary with Latitude of Origin. J. Ecol. 2020, 108, 2531–2543. [Google Scholar] [CrossRef]
  57. Murphy, S. Analysis of Variance. In Translational Orthopedics; Eltorai, A.E.M., Bakal, J.A., Haglin, J.M., Abboud, J.A., Crisco, J.J., Eds.; Handbook for Designing and Conducting Clinical and Translational Research; Academic Press: New York, NY, USA, 2024; Chapter 30; pp. 151–154. ISBN 978-0-323-85663-8. [Google Scholar]
  58. Wickham, H. Ggplot2. Wiley Interdiscip. Rev. Comput. Stat. 2011, 3, 180–185. [Google Scholar] [CrossRef]
  59. Asao, S.; Hayes, L.; Aspinwall, M.J.; Rymer, P.D.; Blackman, C.; Bryant, C.J.; Cullerne, D.; Egerton, J.J.G.; Fan, Y.; Innes, P.; et al. Leaf Trait Variation is Similar among Genotypes of Eucalyptus camaldulensis from Differing Climates and Arises in Plastic Responses to the Seasons Rather than Water Availability. New Phytol. 2020, 227, 780–793. [Google Scholar] [CrossRef]
  60. Mo, L.; Crowther, T.W.; Maynard, D.S.; van den Hoogen, J.; Ma, H.; Bialic-Murphy, L.; Liang, J.; de-Miguel, S.; Nabuurs, G.J.; Reich, P.B.; et al. The Global Distribution and Drivers of Wood Density and Their Impact on Forest Carbon Stocks. Nat. Ecol. Evol. 2024, 8, 2195–2212. [Google Scholar] [CrossRef]
  61. Lai, J.; Zou, Y.; Zhang, S.; Zhang, X.; Mao, L. Glmm.Hp: An R Package for Computing Individual Effect of Predictors in Generalized Linear Mixed Models. J. Plant Ecol. 2022, 15, 1302–1307. [Google Scholar] [CrossRef]
  62. Lai, J.; Zhu, W.; Cui, D.; Mao, L. Extension of the Glmm.Hp Package to Zero-Inflated Generalized Linear Mixed Models and Multiple Regression. J. Plant Ecol. 2023, 16, rtad038. [Google Scholar] [CrossRef]
  63. Murtagh, F.; Legendre, P. Ward’s Hierarchical Agglomerative Clustering Method: Which Algorithms Implement Ward’s Criterion? J. Classif. 2014, 31, 274–295. [Google Scholar] [CrossRef]
  64. Abdi, H.; Williams, L.J. Principal Component Analysis. Wiley Interdiscip. Rev. Comput. Stat. 2010, 2, 433–459. [Google Scholar] [CrossRef]
  65. González, I.; Déjean, S.; Martin, P.G.P.; Baccini, A. CCA: An R Package to Extend Canonical Correlation Analysis. J. Stat. Softw. 2008, 23, 1–14. [Google Scholar] [CrossRef]
  66. Wang, H.; Wang, R.; Harrison, S.P.; Prentice, I.C. Leaf Morphological Traits as Adaptations to Multiple Climate Gradients. J. Ecol. 2022, 110, 1344–1355. [Google Scholar] [CrossRef] [PubMed]
  67. R Core Team. R: A Language and Environment for Statistical Computing. Available online: http://www.r-project.org/ (accessed on 16 August 2020).
  68. Team, R. RStudio: Integrated Development Environment for R; RStudio Inc.: Boston, MA, USA, 2015; Volume 14. [Google Scholar]
  69. Rosas, T.; Mencuccini, M.; Barba, J.; Cochard, H.; Saura-Mas, S.; Martínez-Vilalta, J. Adjustments and Coordination of Hydraulic, Leaf and Stem Traits along a Water Availability Gradient. New Phytol. 2019, 223, 632–646. [Google Scholar] [CrossRef] [PubMed]
  70. Givnish, T.J. Adaptation to Sun and Shade: A Whole-Plant Perspective. Funct. Plant Biol. 1988, 15, 63–92. [Google Scholar] [CrossRef]
  71. Burton, J.I.; Perakis, S.S.; McKenzie, S.C.; Lawrence, C.E.; Puettmann, K.J. Intraspecific Variability and Reaction Norms of Forest Understorey Plant Species Traits. Funct. Ecol. 2017, 31, 1881–1893. [Google Scholar] [CrossRef]
  72. Poorter, H.; Niinemets, Ü.; Poorter, L.; Wright, I.J.; Villar, R. Causes and Consequences of Variation in Leaf Mass per Area (LMA): A Meta-Analysis. New Phytol. 2009, 182, 565–588. [Google Scholar] [CrossRef]
  73. Kraft, T.S.; Wright, S.J.; Turner, I.; Lucas, P.W.; Oufiero, C.E.; Supardi Noor, M.N.; Sun, I.F.; Dominy, N.J. Seed Size and the Evolution of Leaf Defences. J. Ecol. 2015, 103, 1057–1068. [Google Scholar] [CrossRef]
  74. Lusk, C.H.; Falster, D.S.; Jara-Vergara, C.K.; Jimenez-Castillo, M.; Saldaña-Mendoza, A. Ontogenetic Variation in Light Requirements of Juvenile Rainforest Evergreens. Funct. Ecol. 2008, 22, 454–459. [Google Scholar] [CrossRef]
  75. Sack, L.; Scoffoni, C. Leaf Venation: Structure, Function, Development, Evolution, Ecology and Applications in the Past, Present and Future. New Phytol. 2013, 198, 983–1000. [Google Scholar] [CrossRef]
  76. Westoby, M.; Yates, L.; Holland, B.; Halliwell, B. Phylogenetically Conservative Trait Correlation: Quantification and Interpretation. J. Ecol. 2023, 111, 2105–2117. [Google Scholar] [CrossRef]
  77. Firn, J.; McGree, J.M.; Harvey, E.; Flores-Moreno, H.; Schütz, M.; Buckley, Y.M.; Borer, E.T.; Seabloom, E.W.; La Pierre, K.J.; MacDougall, A.M.; et al. Leaf Nutrients, Not Specific Leaf Area, Are Consistent Indicators of Elevated Nutrient Inputs. Nat. Ecol. Evol. 2019, 3, 400–406. [Google Scholar] [CrossRef]
  78. Liu, R.H.; Bai, J.L.; Bao, H.; Nong, J.L.; Zhao, J.J.; Jiang, Y.; Liang, S.C.; Li, Y.J. Variation and Correlation in Functional Traits of Main Woody Plants in the Cyclobalanopsis glauca Community in the Karst Hills of Guilin, Southwest China. Chin. J. Plant Ecol. 2020, 44, 828–841. [Google Scholar] [CrossRef]
  79. Sardans, J.; Vallicrosa, H.; Zuccarini, P.; Farré-Armengol, G.; Fernández-Martínez, M.; Peguero, G.; Gargallo-Garriga, A.; Ciais, P.; Janssens, I.A.; Obersteiner, M.; et al. Empirical Support for the Biogeochemical Niche Hypothesis in Forest Trees. Nat. Ecol. Evol. 2021, 5, 184–194. [Google Scholar] [CrossRef] [PubMed]
  80. Hartikainen, S.M.; Robson, T.M. The Roles of Species’ Relatedness and Climate of Origin in Determining Optical Leaf Traits over a Large Set of Taxa Growing at High Elevation and High Latitude. Front. Plant Sci. 2022, 13, 1058162. [Google Scholar] [CrossRef]
  81. Yang, S.J.; Sun, M.; Zhang, Y.J.; Cochard, H.; Cao, K.F. Strong Leaf Morphological, Anatomical, and Physiological Responses of a Subtropical Woody Bamboo (Sinarundinaria nitida) to Contrasting Light Environments. Plant Ecol. 2014, 215, 97–109. [Google Scholar] [CrossRef]
  82. Hallik, L.; Kull, O.; Niinemets, Ü.; Aan, A. Contrasting Correlation Networks between Leaf Structure, Nitrogen and Chlorophyll in Herbaceous and Woody Canopies. Basic Appl. Ecol. 2009, 10, 309–318. [Google Scholar] [CrossRef]
  83. Opedal, Ø.H.; Armbruster, W.S.; Graae, B.J. Linking Small-Scale Topography with Microclimate, Plant Species Diversity and Intra-Specific Trait Variation in an Alpine Landscape. Plant Ecol. Divers. 2015, 8, 305–315. [Google Scholar] [CrossRef]
  84. Delle Monache, D.; Martino, G.; Chiocchio, A.; Siclari, A.; Bisconti, R.; Maiorano, L.; Canestrelli, D. Mapping Local Climates in Highly Heterogeneous Mountain Regions: Interpolation of Meteorological Station Data vs. Downscaling of Macroclimate Grids. Ecol. Inform. 2024, 82, 102674. [Google Scholar] [CrossRef]
  85. Kemppinen, J.; Lembrechts, J.J.; Van Meerbeek, K.; Carnicer, J.; Chardon, N.I.; Kardol, P.; Lenoir, J.; Liu, D.; Maclean, I.; Pergl, J.; et al. Microclimate, an Important Part of Ecology and Biogeography. Glob. Ecol. Biogeogr. 2024, 33, e13834. [Google Scholar] [CrossRef]
  86. John, G.P.; Scoffoni, C.; Buckley, T.N.; Villar, R.; Poorter, H.; Sack, L. The Anatomical and Compositional Basis of Leaf Mass per Area. Ecol. Lett. 2017, 20, 412–425. [Google Scholar] [CrossRef]
  87. Xing, K.; Niinemets, Ü.; Rengel, Z.; Onoda, Y.; Xia, J.; Chen, H.Y.H.; Zhao, M.; Han, W.; Li, H. Global Patterns of Leaf Construction Traits and Their Covariation along Climate and Soil Environmental Gradients. New Phytol. 2021, 232, 1648–1660. [Google Scholar] [CrossRef]
  88. Joswig, J.S.; Wirth, C.; Schuman, M.C.; Kattge, J.; Reu, B.; Wright, I.J.; Sippel, S.D.; Rüger, N.; Richter, R.; Schaepman, M.E.; et al. Climatic and Soil Factors Explain the Two-Dimensional Spectrum of Global Plant Trait Variation. Nat. Ecol. Evol. 2022, 6, 36–50. [Google Scholar] [CrossRef] [PubMed]
  89. Berdanier, A.B.; Klein, J.A. Growing Season Length and Soil Moisture Interactively Constrain High Elevation Aboveground Net Primary Production. Ecosystems 2011, 14, 963–974. [Google Scholar] [CrossRef]
  90. Deng, C.; Bai, H.; Gao, S.; Zhao, T.; Ma, X. Differences and Variations in the Elevation-Dependent Climatic Growing Season of the Northern and Southern Slopes of the Qinling Mountains of China from 1985 to 2015. Theor. Appl. Climatol. 2019, 137, 1159–1169. [Google Scholar] [CrossRef]
  91. Kudo, G. Intraspecific Variation of Leaf Traits in Several Deciduous Species in Relation to Length of Growing Season. Écoscience 1996, 3, 483–489. [Google Scholar] [CrossRef]
  92. Blume-Werry, G.; Wilson, S.D.; Kreyling, J.; Milbau, A. The Hidden Season: Growing Season Is 50% Longer below than above Ground along an Arctic Elevation Gradient. New Phytol. 2016, 209, 978–986. [Google Scholar] [CrossRef] [PubMed]
  93. Rathore, N.; Thakur, D.; Chawla, A. Seasonal Variations Coupled with Elevation Gradient Drives Significant Changes in Eco-Physiological and Biogeochemical Traits of a High Altitude Evergreen Broadleaf Shrub, Rhododendron Anthopogon. Plant Physiol. Biochem. 2018, 132, 708–719. [Google Scholar] [CrossRef]
  94. Li, J.; Chen, X.; Niklas, K.J.; Sun, J.; Wang, Z.; Zhong, Q.; Hu, D.; Cheng, D. A Whole-Plant Economics Spectrum Including Bark Functional Traits for 59 Subtropical Woody Plant Species. J. Ecol. 2022, 110, 248–261. [Google Scholar] [CrossRef]
Figure 1. Study area and the number of survey sites in each protected area. The size of the purple circle represents the number of survey sites in the natural reserve. The texts next to the purple circles were the abbreviation names of the protected areas. The full names of the protected areas were shown in Table S1.
Forests 16 00954 g001
Figure 2. Occurrence records of giant pandas in 10 staple bamboo species. Data source: the Fourth National Giant Panda Survey Report [40].
Forests 16 00954 g002
Figure 3. Variance analysis of leaf functional traits among SBS. Different lowercase letters indicate significant differences between SBS (α = 0.05). (A): LT: leaf thickness; (B) LA: leaf area; (C) LMA: leaf mass per area; (D) VLA: vein length per area; (E) FVD: fourth-order vein diameter; (F) Chll: chlorophyll concentration; (G) LN: leaf nitrogen concentration; (H) LP: leaf phosphorus concentration.
Forests 16 00954 g003
Figure 4. Variance decomposition of variation in leaf functional traits of 10 SBS based on LMM. LT: leaf thickness; LA: leaf area; LMA: leaf mass per area; VLA: vein length per area; FVD: fourth-order vein diameter; Chll: chlorophyll concentration; LN: leaf nitrogen concentration; LP: leaf phosphorus concentration.
Forests 16 00954 g004
Figure 5. Fixed effect estimate values of environmental factors for leaf functional trait variations (α = 0.05). Dots indicate effect values and short horizontal lines indicate confidence intervals; red color indicates that the effect of the environmental factor on the trait is significant (*** p < 0.001; ** p < 0.01; * p < 0.05); light blue color indicates that the effect of the environmental factor on the trait is not significant (p > 0.05). Lon: longitude; Lat: latitude; Vapr: vapor pressure; SlopePos: slope position; MAT: mean annual temperature; Asp: slope aspect; SoilP: soil phosphorus concentration; SoilN: soil nitrogen concentration; Srad: solar radiation; CanCov: canopy cover; MAP: mean annual temperature; Slope: slope; Elev: elevation.
Forests 16 00954 g005
Figure 6. Hierarchical cluster analysis (A) and PCA (B) results of leaf functional traits among 10 SBS. (A) The dashed line indicates the optimal grouping tree height. (B) Dots represent bamboo species mean values. Red dots represent species with an acquisitive strategy (abbr. A) and light blue dots represent species with a conservative strategy (abbr. C). LT: leaf thickness; LA: leaf area; LMA: leaf mass per area; VLA: vein length per area; FVD: fourth-order vein diameter; Chll: chlorophyll concentration; LN: leaf nitrogen concentration; LP: leaf phosphorus concentration.
Forests 16 00954 g006
Figure 7. CCA ordination of trait-based strategies constrained by environmental factors. The shaded areas indicate the environmental distribution ranges of species with different strategy types. MAT: mean annual temperature; MAP: mean annual temperature; Vapr: vapor pressure; Srad: solar radiation; SoilP: soil phosphorus concentration; SoilN: soil nitrogen concentration.
Forests 16 00954 g007
Table 1. Protected areas and number of survey sites for the 10 staple bamboo species of giant pandas.
IDSpeciesProtected Area and the Number of Survey SiteSum
1A. faberiEMS (4), MBDFD (3), LBH (3), LCG (2), LXHK (2), BSH (1)15
2B. fargesiiFP (2), TJH (1), BSJ (1)4
3C. szechuanensisMBDFD (3), LCG (2), EMS (1)6
4F. denudataWL (6), BY (2), BDG (1)9
5F. dracocephalaFP (6)6
6F. qinlingensisFP (5)5
7F. robustaLXHK (3), BSH (1)4
8F. rufaXZZG (2), LBH (1), TJH (1), BSJ (1)5
9F. nitidaMYL (5), BY (2), SML (1), MBDFD (1)9
10Y. brevipaniculataSML (5), BSH (1)6
Sum69
The full names of the protected areas were shown in Table S1.
Table 2. Descriptive statistics and CVs of leaf functional traits across 10 SBS.
LT (mm)LA (cm2)LMA (g m−2)VLA (cm cm−2)FVD (μm)Chll (mg g−1)LN (mg g−1)LP (mg g−1)
Min0.054.9624.6982.096.724.7516.700.77
Max0.1557.5766.56166.8617.637.9840.572.59
Median0.0810.5240.01129.2910.767.0027.291.54
Mean ± SD0.08 ± 0.0316.06 ± 12.7141.28 ± 10.22127.96 ± 20.0711.07 ± 2.826.86 ± 0.6627.78 ± 5.291.56 ± 0.38
CVs (%)31.8779.1624.7615.6925.459.5819.0524.69
LT: leaf thickness; LA: leaf area; LMA: leaf mass per area; VLA: vein length per area; FVD: fourth-order vein diameter; Chll: chlorophyll concentration; LN: leaf nitrogen concentration; LP: leaf phosphorus concentration.
Disclaimer/Publisher’s Note: The statements, opinions and data contained in all publications are solely those of the individual author(s) and contributor(s) and not of MDPI and/or the editor(s). MDPI and/or the editor(s) disclaim responsibility for any injury to people or property resulting from any ideas, methods, instructions or products referred to in the content.

