Article

Restoration of Understory Plant Species and Functional Diversity in Temperate Plantations Along Successional Stages

1
College of Landscape Architecture and Art, Northwest A&F University, Yangling 712100, China
2
Key Laboratory of Ecological Prewarning, Protection and Restoration of Bohai Sea, Ministry of Natural Resources, School of Life Sciences, Shandong University, Qingdao 266237, China
*
Author to whom correspondence should be addressed.
These authors contributed equally to this work and should be considered co-first authors.
Forests 2025, 16(6), 956; https://doi.org/10.3390/f16060956
Submission received: 21 April 2025 / Revised: 24 May 2025 / Accepted: 28 May 2025 / Published: 5 June 2025
(This article belongs to the Section Forest Ecology and Management)

Abstract

:
Context: Planting forests is an important strategy to combat biodiversity loss and ecosystem service degradation, but its effects on biodiversity and ecosystem services remain uncertain. Objectives: This study aimed to investigate the restoration of plants along successional and environmental gradients in planted forests by examining how understory plant diversity (species richness, composition, functional diversity), functional diversity—the range of species’ traits influencing ecosystem functions and services and their environmental drivers—evolve in temperate plantations over time. Methods: We examined a total of 36 plots with different stand ages in Chongli District, China, and compared the differences in species richness, biodiversity, composition, and functional diversity across different successional stages and over time. We also analyzed the response mechanisms of species richness and functional diversity to environmental factors at both the local and landscape scales. Results and Discussion: Our results showed species diversity, species richness, and functional diversity tended to increase with time in most plots and stabilized after 45 years. Although species richness was lower in mature plots (>100 years), functional diversity was higher, and species composition was significantly differentiated. This trade-off reflects environmental filtering selecting for competitively dominant species with distinct functional traits, while continuous species turnover prevents compositional convergence. The increase in functional diversity was not directly related to the rise in species richness, but it depended on the relative dominance of several species with different functional characteristics in the ecosystem. Simulation analysis confirmed this pattern aligns with a Simpson’s index-driven trait complementarity mechanism. At the local scale, stand age was the most significant positive factor influencing species richness and functional diversity. Soil total nitrogen and organic matter only negatively affected species richness in interactions. At the landscape scale, landscape heterogeneity plays an important role in restoring functional diversity. Historical afforestation since the 1950s restricted comparisons to secondary forests, lacking primary forest baselines. Conclusions: The results suggest that the effects of the successional stage and multiscale environmental factors should be comprehensively considered in the restoration strategy of restored forests.

1. Introduction

Planting forests has the potential to reverse various forest loss and degradation trends [1] and provide forest products for local people [2]. Afforestation of plantations may replace natural forests and enhance hydrological regulation and nutrient cycling. In regions experiencing natural forest loss, plantation stands preserve partial ecological functionality and serve as refugia for specialized species [3]. Additionally, it has become an important method for mitigating climate change [4]. However, there is still a lack of empirical studies on the recovery of forests in terms of biodiversity after planting [5].
The ecological impact of reforestation projects is still controversial [6]. The planting of forests is primarily used for commercial purposes such as timber and crop production, with restoration of biodiversity being a secondary consideration. The planted forests can change the land-use properties of surface habitats, such as grasslands and farmland, which will likely have a profound impact on biodiversity. Nevertheless, research in this field remains scarce [7]. Most converted forests are monoculture plantations, which often exhibit simplified vegetation structures and lack the diverse understory plant communities found in natural forests [3], often due to low structural complexity and functional redundancy [8]. Previous studies have shown that converting single-use forest land to other uses can lead to declines in the diversity of various organisms [9]. There is still a lack of studies on ecosystem functioning, especially biodiversity restoration, after planted forests are planted.
The ultimate aim of reforestation is to restore ecosystem functions and increase ecosystem services [10]. Therefore, there is a need to assess the quality of restoration by evaluating ecosystem services. Some commonly used methods to determine ecosystem services and functions are based on functional plant traits [11]. However, these methods have limitations. Many studies on plant functional traits have focused primarily on leaves, which are weakly correlated with ecosystem services, while ignoring other important traits [12]. This may not be conducive to accurately assessing changes in ecological functions and services. To address these limitations, our study adopts a service-oriented trait selection framework [13] to assess how temperate plantations regain multi-dimensional ecosystem services through understory recovery. Furthermore, the relationship between plant functional diversity and species diversity remains uncertain. Although enhanced biodiversity is widely considered a driver of restoration efficacy, this paradigm exhibits limited applicability in forest ecosystems. Elevated floristic richness observed in degraded forests exposed to anthropogenic logging or natural disturbances frequently signifies ecosystem retrogression rather than functional rehabilitation. Paradoxically, spatiotemporal heterogeneity in resource distribution or disturbance patterns may facilitate resilience-building via community reassembly processes [14]. Furthermore, increased temporal and spatial variability in resource availability or disturbance regimes may enhance ecosystem resilience through adaptive reorganization [14], grazing or disturbance exclusion over time can lead to structurally stable and diverse vegetation, especially under moderate intensity [15]. Nonetheless, in some cases, services such as ecosystem cultural functions, medicinal resources, esthetic values, or mediating functions are determined by a dominant species or key species with specific ecological functions [16]. Consequently, assessing the biodiversity may not be sufficient to fully comprehend the alterations in ecosystem functions and services.
The adoption of natural regeneration strategies post-establishment in plantations is advocated under the premise of optimizing restoration outcomes. However, this paradigm faces cross-scale limitations: (1) localized reforestation success through in situ protection proves susceptible to landscape-level perturbations [17] and (2) dissynchronicity between taxonomic and functional responses to environmental filters generates systemic mismatches in ecological complexity restoration. Evidence suggests fragmented landscapes increase species richness due to edge effects, but landscape fragmentation can lead to the inability of some species with specific traits to survive and recolonize [18] so that trait-based functional diversity may decline [19]. It is necessary to explore the response mechanism of functional diversity to environmental variables. Their changing patterns over time may also be different [20]. Several studies have demonstrated that the natural restoration method can effectively restore biodiversity [21], but whether it can quickly restore ecosystem functions and services is still controversial [22]. It is crucial to comprehend the variables influencing biodiversity and functional diversity in plantations at different stages of succession because this knowledge is essential for developing sustainable management practices and restoring degraded sites [23].
This study investigated the understory plants in planted forests at different time periods (Table A1). We aimed to record and reveal changes in understory plant diversity and functional diversity along successional and environmental gradients. We used data collected from 36 plots in a converted forest with different stand ages to address the following questions: (i) Are species diversity, species composition, and functional diversity significantly different in the different successional stages? (ii) Are trends in species diversity and functional diversity consistent? (iii) Do species diversity and functional diversity respond consistently to environmental factors at different scales?

2. Materials and Methods

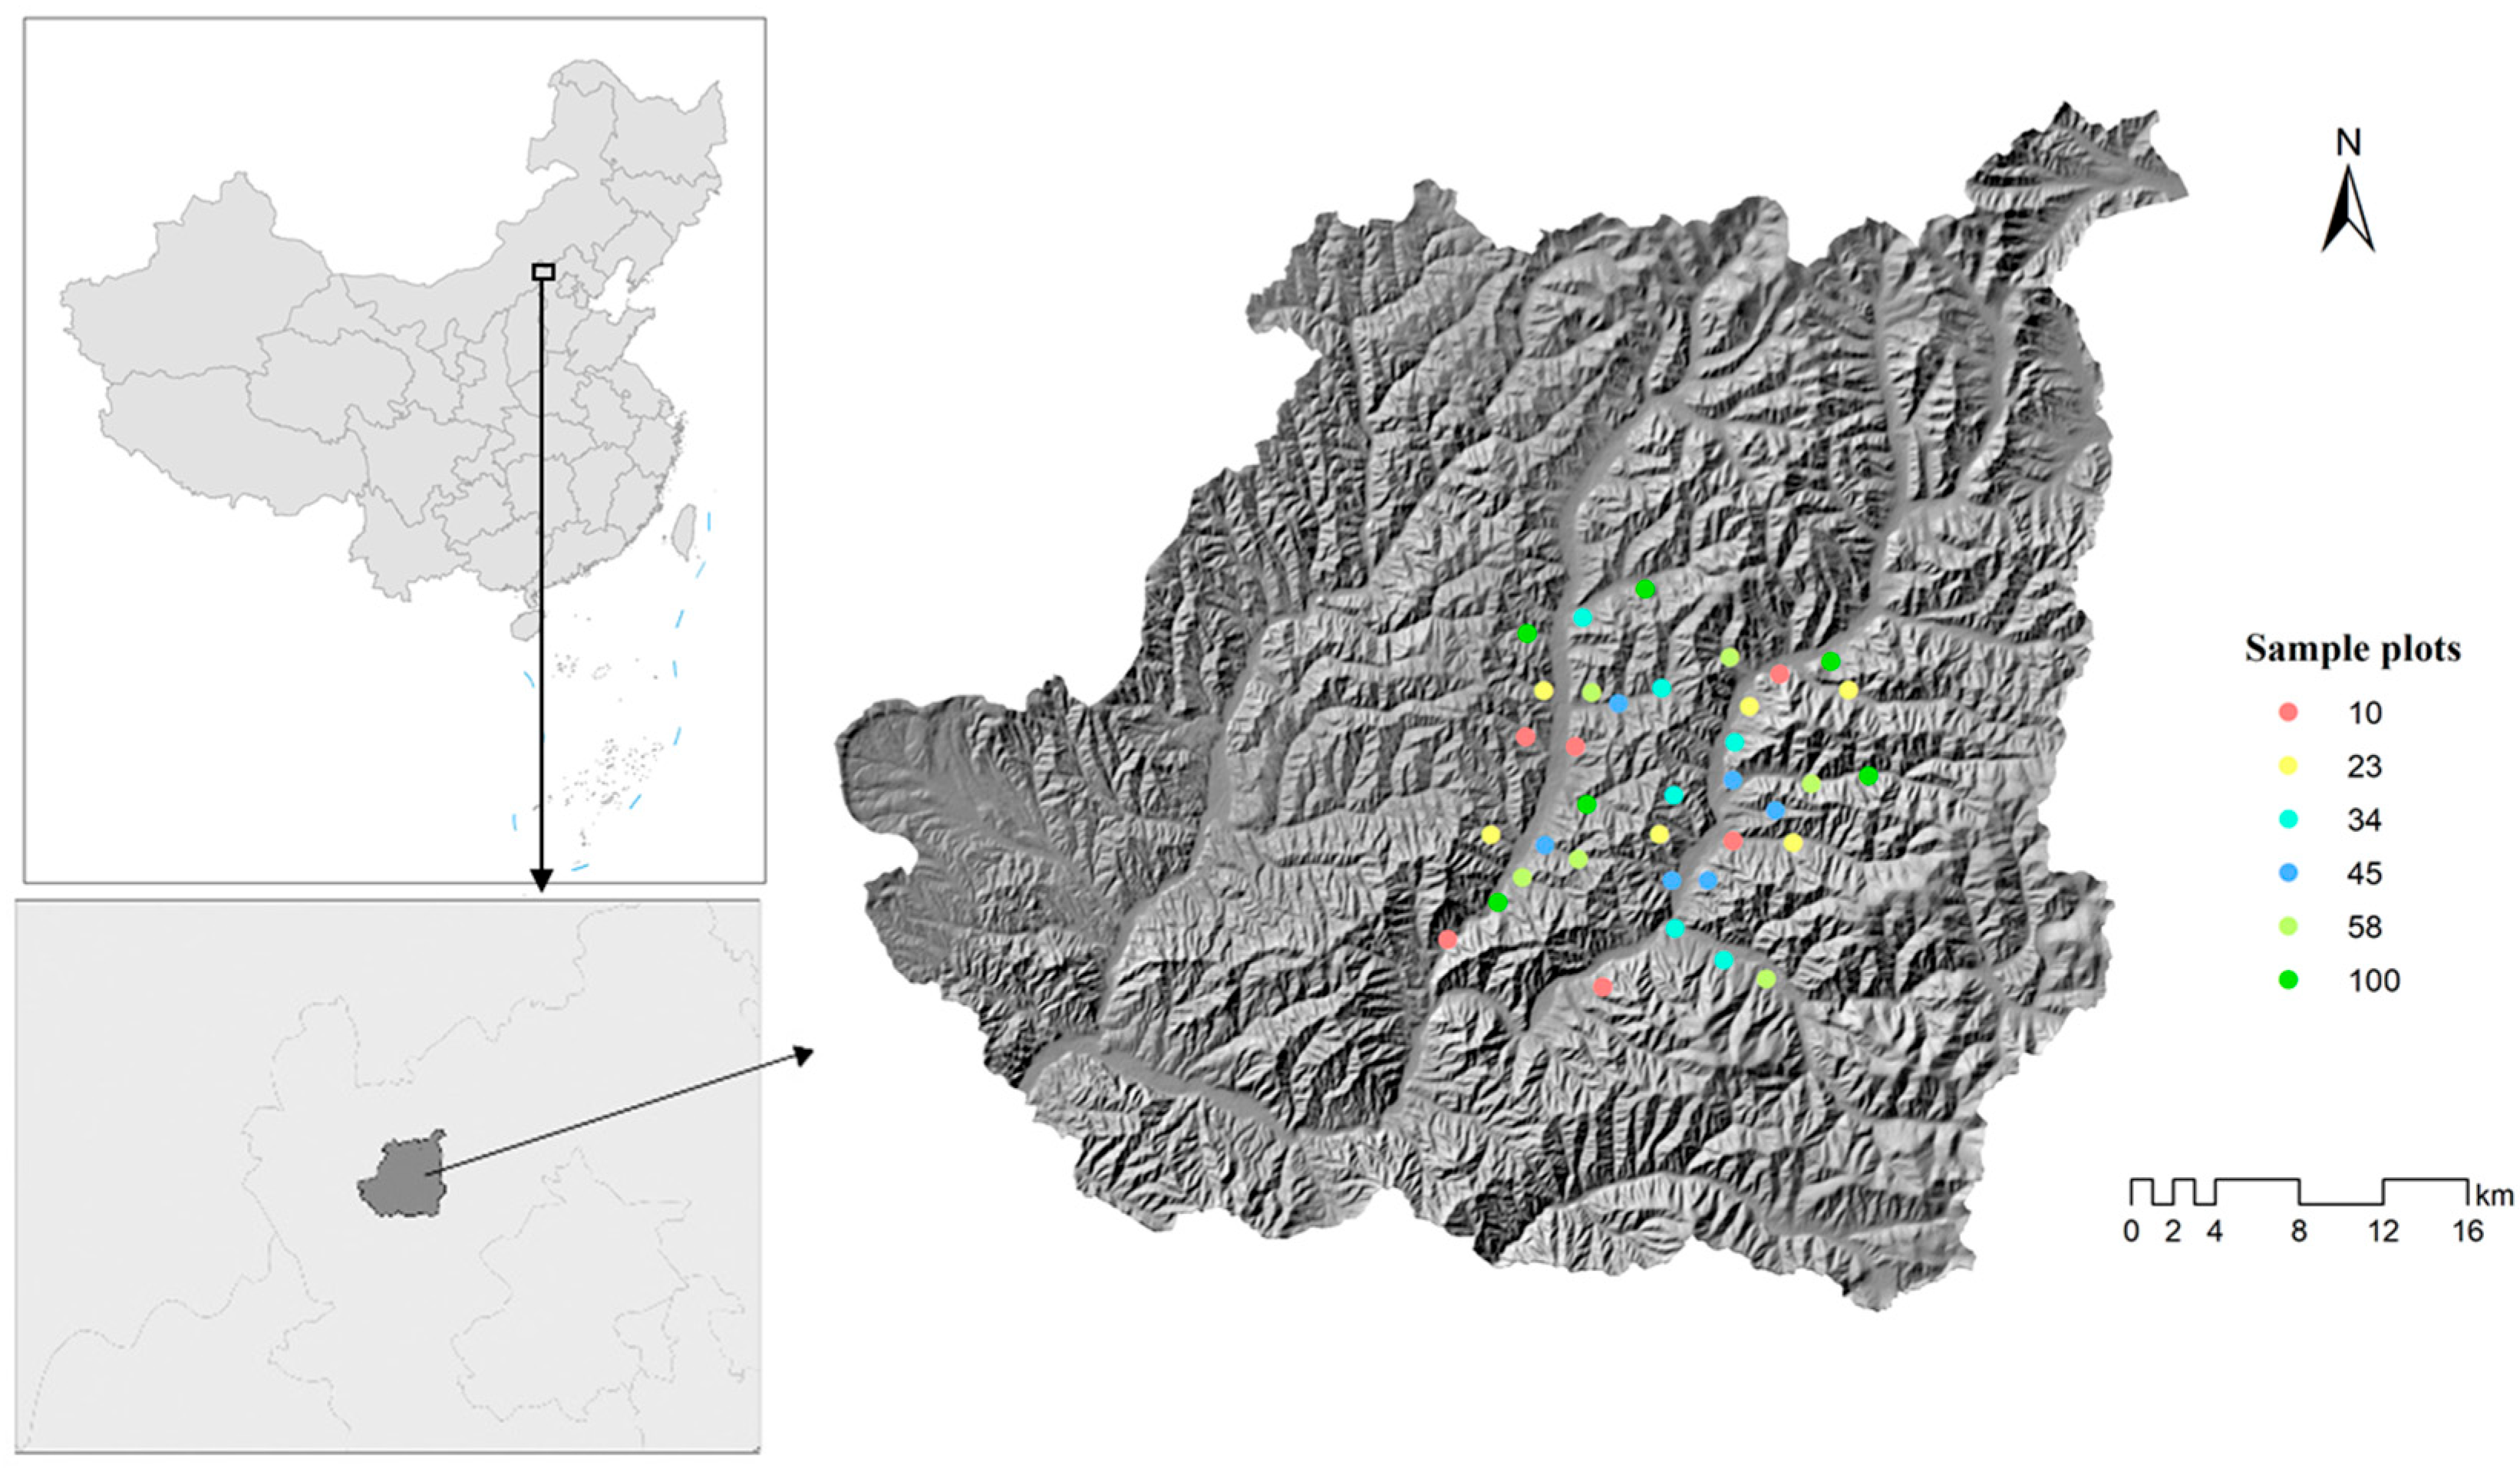
2.1. Study Region and Plot Data Collection

2.1.1. Site Description

The study region is located in Chongli District (40°47′–41°17′ N, 114°17′–115°34′ E), Zhangjiakou City, Hebei Province, China, which is a transition zone between the Inner Mongolia Plateau and North China Plain (Figure 1). This region experiences an East Asian continental monsoon climate, with a mean annual temperature of ~4.5 °C and a mean annual precipitation exceeding 488 mm. Approximately 80% of Chongli District’s territory is mountainous, with a forest coverage rate of 52.38%. Since the 1950s, the area has been affected by deforestation and overgrazing (see interviews with local farmers). Beginning in 1999, Chongli District has been carrying out large-scale afforestation activities.

2.1.2. Sampling Design

To avoid excessive environmental differences in the sampling sites, all the sampling sites located in the north of Chongli District were excluded to avoid the influence of altitude (Figure 1). All the sample plots were located in an artificially planted Pinus sylvestris (Pinus sylvestris var. mongolica) forest. Preliminary investigations during the pilot phase revealed suspected large-scale, recurrent mining operations in the western sector of the study area, though systematic field measurements were not yet obtained at this exploratory stage. Coal mining reduces plant species richness, favoring pollution-tolerant species over sensitive ones, and alters community composition [24]. To eliminate the confounding effects of mining activities and geographical heterogeneity on the experimental results and minimize external interference in causal inference, we set all sample plots in the central and eastern parts of the study area. Additionally, to prevent spatial autocorrelation, we removed all sample plots less than 1 km apart. Ultimately, we established 36 sample plots and categorized all plots into six age groups: 10, 23, 34, 45, 58, and >100 years, as defined by the time since recovery. Specifically, the “time since recovery” refers to the duration of natural restoration following the establishment of plantations of Pinus sylvestris var. mongolica. The restoration time ranges for each group were defined as follows: 10-year group (6–12 years), 23-year group (21–26 years), 34-year group (33–36 years), 45-year group (43–46 years), 58-year group (53–63 years), and >100-year group (Table 1). All plots were exclusively composed of monocultures of Mongolian Scots pine, with understory herbaceous communities spontaneously colonizing through natural succession. All plots > 100 years were coniferous forests and should be at least 100–200 years old.
Given that all sampled plantations were pure stands of Pinus sylvestris var. mongolica with a similar stand structure and management history, we did not measure canopy cover (a proxy for light availability) as an environmental variable. Field observations confirmed that canopy closure was relatively consistent across the sampled successional stages, minimizing its potential confounding effect on understory plant diversity. This homogenized light environment allowed us to focus on other drivers without the need for explicit light measurements.

2.1.3. Vegetation Data

We investigated vascular plants in June and September 2016 and 2017. We used the quadrat method to sample plants and set a 20 × 20 m2 in the middle of each sample plot. We divided each plot into four 10 × 10 m2 subplots and recorded all trees and shrubs in the subplots. We further recorded all herbaceous species in four randomly placed 1 × 1 m2 plots, one within each subplot. We carried out plant species identification and recording on the spot. We brought plants that could not be identified on the spot back to the laboratory for identification by taxonomy experts or by referring to the “Electronic Edition of Flora of China” (https://www.plantplus.cn/frps2019/) (accessed on 19 February 2025). We recorded all plant species coverage as species abundance.

2.2. Environmental Factors

2.2.1. Environmental Variables at the Landscape Scale

We took remote sensing images (Landsat-8 satellite 2016) as the base map and placed all the sample points within a radius of 1 km from the center to conduct the landscape surveys. We selected the Landscape Fragmentation Index to represent the degree of fragmentation of the landscape, reflect the complexity of the landscape’s spatial structure, and demonstrate the degree of human interference in the landscape. We selected the patch size of sample forests as an indicator to reflect the size of the habitat patches. We based the land-use maps we used in our analysis on field surveys and calculated the landscape metrics using FRAGSTATS 4.2 [25]. The landscape metric parameters classification thresholds were defined based on ecological rationale and rigorously validated through remote sensing data analysis. Multi-scale sensitivity testing (500–2000 m) achieved an accuracy of 86% (κ = 0.79).

2.2.2. Environmental Variables at Local Scale

Soil sampling and plant investigation were carried out at the same time. We selected soil indicators. The total soil nitrogen (SN) in the soil can reflect the intensity of land use before the conversion of farmland. The second soil index is soil organic matter (SOM), which has an important impact on species richness and species composition [26]. We took five randomly selected soil samples at a depth of 0–20 cm using a 50 mm diameter sand auger at each plot, and we sieved the samples < 2 mm to remove roots and other large organic debris. We homogenized and air-dried them before chemical analysis, pooled dried samples within each plot, and ground each one in a ball mill until the material had a talcum powder consistency. We then analyzed SN using the Kjeldahl method [27] and studied SOM using the dichromate titration method.

2.2.3. Selection of Plant Traits

We selected a series of representative species characteristics and chose seven plant traits for each recorded plant species (Table 2). We chose every trait explicitly for its relevance to ecosystem service provision: (1) Life form: Complex vegetation structure is conducive to maintaining microclimate conditions and higher biodiversity. (2) Growing cycle: Perennial species require a longer succession than annual or biennial species, but once established, they are more competitive and resistant [28]. In addition, the continuous soil cover ensured by perennials reduces erosion and nutrients, and it improves nutrient availability [29]. (3) Dominance in situ: This indicator is related to soil and water conservation and microclimate regulation, and it also characterizes the influence and adaptability of the species. (4) Edible or healing effect: This indicator reflects the provision of ecosystem services. (5) Nectariferous plants: This function characterizes the supply function of pollination services. (6) Flower color: It is known to influence the perception of scenic beauty [30] and also has a very important cultural value. (7) Red List species: The “Red List of Chinese Species” (https://www.mee.gov.cn/), (accessed on 3 April 2025), which is related to the function of biodiversity conservation.

2.3. Data Analysis

We tested sampling independence among the sampling plots by a Mantel statistic based on Pearson’s product-moment correlation between two matrices: spatial (Euclidean bidimensional) and compositional distance (Sorensen). We first analyzed whether the forest land with different ages varied significantly regarding plant species richness (without the influence of abundance), Simpson’s Diversity Index (we chose the inversed Simpson index), and functional diversity. We used the inverse of Simpson to make it more intuitive, in which higher values indicate lower dominance (therefore, high diversity) in the assemblages. Functional diversity (RaoQ) was calculated using Gower distances to accommodate mixed trait types. We performed the computations using the function dbFD() in the R package FD [31]. We used a one-way ANOVA with post hoc contrast tests to compare the differences in the three indicators between different ages. To explore the differences between species composition in different plots, we used nonmetric multidimensional scaling (NMDS) for analysis and chose the Bray–Curtis distance. We conducted this analysis using CANOCO 5.0 [32] and used linear regression to analyze the relationship between functional diversity, Simpson’s Diversity Index, and species richness. Finally, we treated the plant species richness, Simpson’s Diversity Index, and functional diversity as dependent variables. Their change is linked to potential environmental predictor variables on the local (age, total soil nitrogen, soil organic matter) and landscape (patch size, landscape richness) scales in a set of generalized linear models (GLMs) with fixed variance (vegan package; [33]) in R 3.1.5 (R Development Core Team 2018). We also considered all interaction effects but only showed effects with a significant response.

3. Results

We identified and recorded a total of 199 species and 49 families belonging to understory vascular plant species (Online Resource 1). Due to the lack of some characteristics, a total of nine plots with species were not identified. Among them, we identified one species from Cruciferae at the family level and four species from Artemisia, Agrostis, Bromus, and Apium at the genus level. The abundance of these unidentified species accounts for less than 1% of the total species abundance and does not affect the calculation of all the indicators.
The comparison of species richness in forests of different ages (Figure 2) showed the species richness in plots that have been converted for more than 100 years (the oldest forest land) and the plots that have been converted for 13 years (the youngest forest land) is relatively low, significantly lower than the 58-, 45-, and 33-year plots. The highest value of species richness appeared in the plots with a conversion time of 58 years, which was significantly higher than the 13-, 26-, and 100-year plots. In comparing plant diversity, we found no significant difference between the oldest forest land and other forest land, but the 58 and 45-year plots are significantly higher than the 33-, 26-, and 13-year plots. Functional diversity tends to increase with the age of forests, with the oldest forest land exhibiting significantly higher diversity than younger forest land. Nonmetric multiscale analysis (NMDS) showed the difference in species composition between the samples (Figure 3). The results showed six sample plots in the oldest forest land were far away from other plots, meaning their species composition was significantly different from other samples. Of all the plots in the oldest forest land, the distance between each other is also relatively long, indicating the species composition of different places is also quite different. The species composition of the 13- and 25-year-old plots differed from the other age plots, in addition to the oldest plots.
The linear regression analysis results indicate there is no linear correlation between species richness and functional diversity. However, functional diversity increases with increasing plant Simpson’s diversity (y = 3.9503x − 1.7035, R2 = 0.310, p < 0.001).
This study thus revealed that woodland age has a significant impact on species richness. Additionally, the area of the patch where the plot was located showed a positive correlation with species richness (Table 3). Furthermore, an increase in landscape fragmentation was found to significantly affect species richness (Figure 4). The soil variables we tested, namely soil total nitrogen and soil organic matter, did not significantly impact species richness. However, we found their interaction to be significantly related to species richness (Table 3). The age of forest land is the most important factor influencing functional diversity, whereas total nitrogen and organic matter do not show a significant correlation. Landscape richness and fragmentation positively correlate with functional diversity, but patch area is insignificant (Table 4). No other interactions in this model showed a significant correlation with any dependent variables.

4. Discussion

4.1. Accumulation of Species Richness, Diversity, and Functional Diversity

Our results showed species richness, diversity, and functional diversity all tended to increase with time (except for plots > 100 years). However, the increase is not significant after 45 years (Figure 2). A similar study demonstrated the initial 10–30 years of the restoration process in newly established forest plots exhibited the most rapid increase in species [1]. In our study, the turning point occurred at 45 years. This may be due to the specificity of the converted forest land, which, after the loss of human disturbance, has become a new habitat with superior conditions, providing many opportunities for plant species to invade. Another possibility is that the local temperature is relatively low, and the ecological processes are slow, prolonging the length of this process.
For the >100 years plots, species richness was lower than all other plots, and species diversity was not significantly different from the other plots. But its functional diversity was significantly higher than other plots. On the one hand, this is because, after environmental filtering, species compete with each other and become the main resistance to survival [34]. Species with strong competitiveness occupy an ecological niche, and after forming an advantage, other species are slowly eliminated and cannot invade anymore. This also explains the low species richness but high functional diversity of the oldest plots. On the other hand, local climatic conditions have changed, preventing some species from adapting [35].
By establishing multi-species mixed plantations, we can accelerate the transition towards natural forest stands [36]. Thinning treatments may potentially expedite the development of late-successional species composition in young stands by creating structural features analogous to old-growth forest ecosystems [37]. Additionally, incorporating predictive successional modeling into silvicultural planning could help address current knowledge gaps in characterizing the developmental trajectories of newly restored forests [38].

4.2. Divergence of Species Composition

Our study showed significant differences in species composition between the oldest plots and woodlands of other ages. There was no convergence between the oldest growth (Figure 3). A possible explanation for this is that the species composition continued to change after 50 years [39], the time span between the oldest plot and the other plots was greater, and there was also a time gradient between the plots, so the species composition differences were greatest and did not converge. Our study showed that the species composition of woodlands increases over time and is constantly changing. In the early stages of restoration (13 and 26 years), species composition changed more rapidly. Other researchers have previously reported the occurrence of divergence in species composition along the successional gradient [40]. Plant species change rapidly in the early stages of succession, but it may take hundreds of years to reach a relatively stable final succession (or similar to natural forest) [41].
Maintaining mixed canopies alongside pure-stand mosaics can amplify microhabitat contrasts while preserving natural disturbances and landscape-level structural variability. Regulating canopy light regimes, managing species-specific litter properties, and selecting site-adapted trees to alter soil chemistry and water-nutrient dynamics further reinforce compositional distinctions. Integration of pure and mixed forests across successional stages may sustain habitat transitions, balancing competitive and facilitative interactions to perpetuate divergence [42].

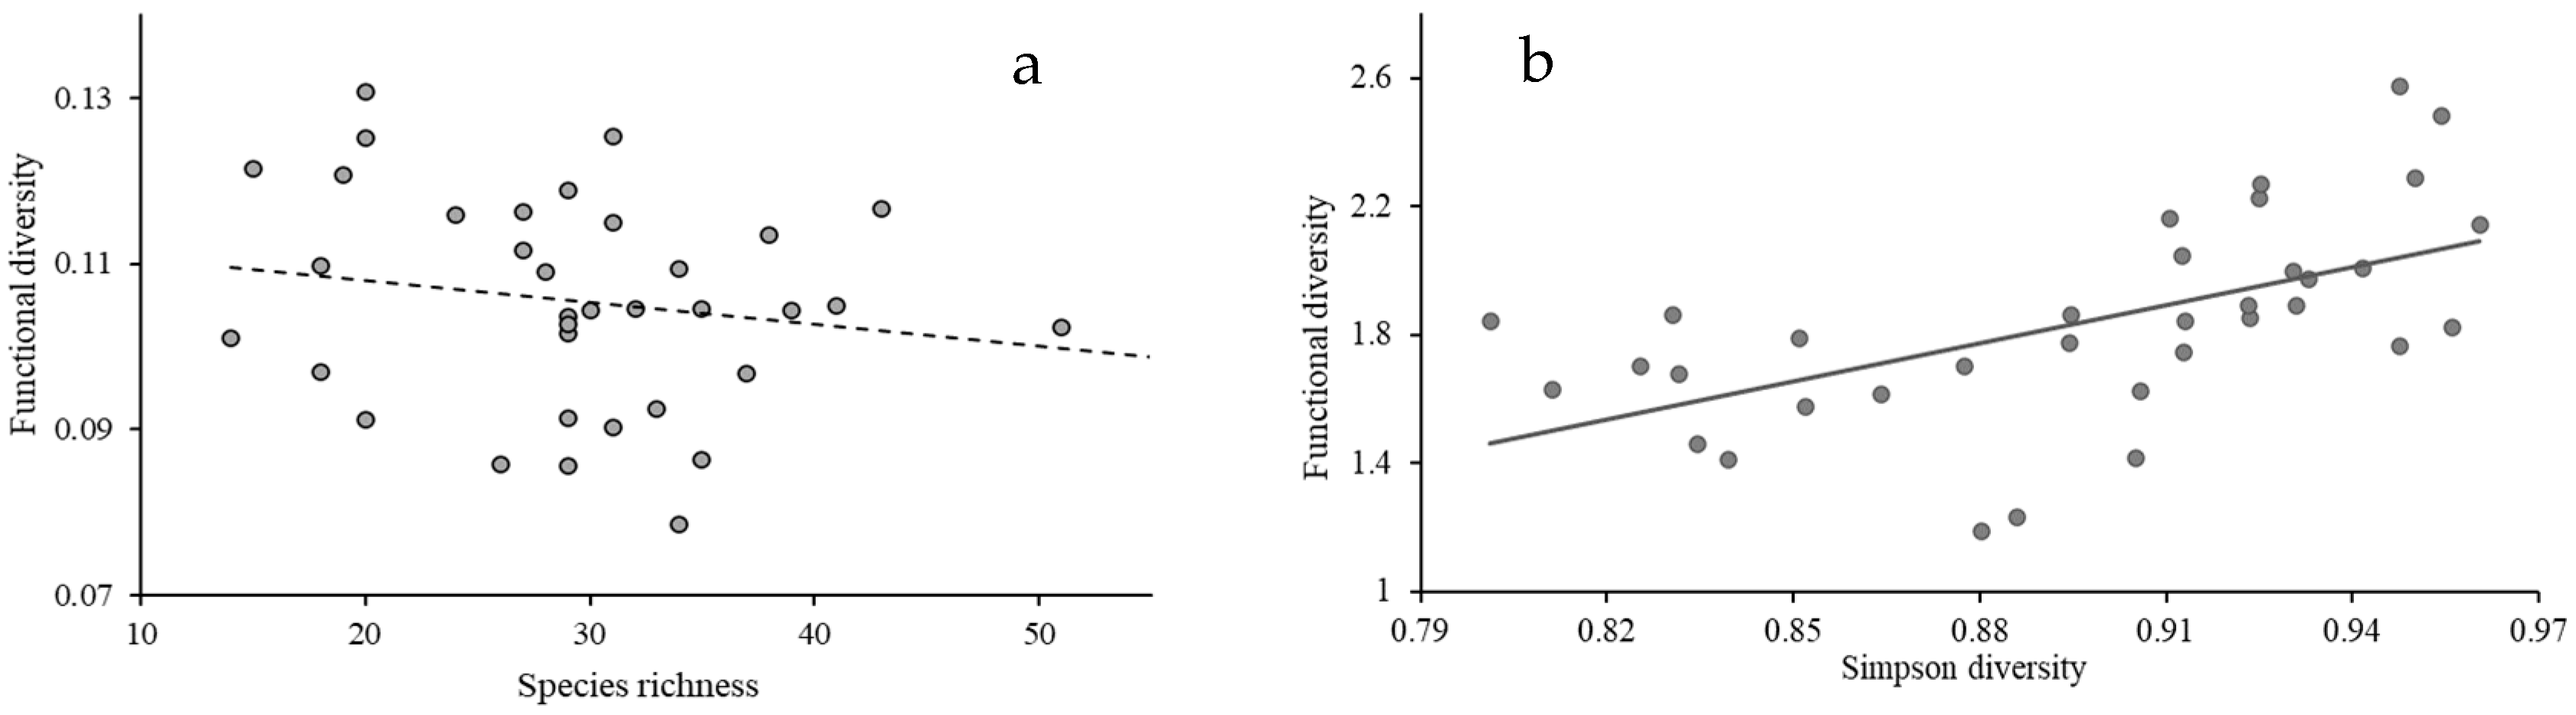
4.3. Relationship Between Functional Diversity and Species Diversity

The results showed that increasing species richness does not increase functional diversity or improve ecosystem services. Functional diversity was positively correlated with the Simpson’s Diversity Index, related to the calculation method. A high Simpson’s index is likely to indicate the dominance of a wide range of species with different functional characteristics [43]. Many ecological restoration evaluation projects tend to choose species richness as an indicator of biodiversity or ecological function restoration. This study, as well as some other related studies, has shown that such assessments may not accurately reflect the functional status of ecosystems [44].
In this study, we chose traits that are associated with the ecological services that plants can provide, so the level of functional diversity in this study reflects the level of ecosystem services to some extent. This approach is a good way to link traits—functional diversity—to ecosystem services. It can simultaneously achieve the restoration of ecosystem functions and improvements of ecosystem services [45]. However, this method is currently not widely used [45]. The lower abundance of nectariferous plants in >100-year stands highlights potential human pressures on pollination services. Monoculture plantations and pesticide use in adjacent agricultural areas may reduce floral diversity, limiting pollinator habitats. While direct pollinator data were not measured, this decline in nectar-rich species could disrupt plant–pollinator networks—a critical trade-off to address in sustainable forest management.

4.4. Response of Functional Diversity to the Environment

At the local scale, functional diversity and species richness respond similarly to the environment. Forest age has a positive effect on species richness, which is consistent with the results of other studies on plant restoration after returning farmland to forest. This relationship aligns with observations from managed Pinus tabuliformis plantations in northern China, where moderate thinning (30%–50%) in younger stands (e.g., half-mature forests ≤ 30 years) promotes understory plant richness by creating heterogeneous light conditions and alleviating resource competition, ultimately facilitating species establishment [37]. Furthermore, the results show that forest age has a positive effect on restoring functional diversity, demonstrating that planted forests can restore some ecosystem functions after prolonged periods of low disturbance. Soil total nitrogen and organic matter had no significant effects on functional diversity and species richness, respectively, but their interaction was significantly negatively correlated with species richness. One possible reason for this is that the synergistic effect of the two soil factors has a potential positive effect on certain highly competitive plants, which may inhibit less competitive species. Management strategies should seek a balance between species composition and nutrient resource interactions to avoid resource competition and exclusion.
At the landscape scale, functional diversity and species richness do not respond to the environment in the same way. Landscape richness and landscape fragmentation constitute two important dimensions of landscape heterogeneity. Our results showed that both landscape richness and landscape fragmentation were significantly positively correlated with functional diversity because heterogeneous environments provide more ecological niches, allowing multiple species with different functional characteristics to coexist. The results emphasize the important role of landscape heterogeneity in restoring functional diversity. To achieve this, management strategies must consider the complex effects of landscape fragmentation on functional diversity and species richness and seek to maintain and restore ecosystem function while conserving species diversity.

4.5. Soil Biogeochemical Drivers of Biodiversity Dynamics

The antagonistic interaction between soil TN and SOM in reducing plant species richness could arise through multiple interrelated mechanisms: (1) accelerated microbial mineralization of nitrogen-enriched SOM releasing NH4+ pulses that enhance light competition among plants, alongside [46] (2) SOM-TN coupling inducing microbial C/N imbalances that reduce recalcitrant organic matter persistence, possibly exacerbating rhizotoxicity through pH shifts in weakly buffered soils. However, critical unknowns remain regarding threshold responses of organic acid fluxes, microbial depolymerization kinetics, and SOM-pH buffering capacities across TN gradients, requiring targeted quantification of extracellular enzyme cascades and microbe-mineral interactions to resolve these drivers [47].

4.6. Limitations in Experimental Design

The study area (Chongli District) has undergone uninterrupted land-use transitions since the 1950s, including extensive deforestation followed by large-scale afforestation, resulting in near-total eradication of primary forests. Consequently, our comparisons are restricted to secondary forests at different successional stages, without reference to pristine forest conditions as a baseline. Additionally, while our trait-based analysis inferred pollination service potential through nectariferous plants, direct measurements of pollinator abundance and interactions were not conducted.

5. Conclusions

In this study, we aimed to investigate the differences in species richness, biodiversity, species composition, and functional diversity in artificial forests at different successional stages, noting trends over time. Meanwhile, we also focused on the response mechanisms of species richness and functional diversity to local and landscape-scale environmental variables. The results of the study showed species richness, species diversity, and functional diversity increased over time in all age plots except for the >100-year plots and leveled off after 45 years. The species richness of the >100-year plots was lower than all plots, but the functional diversity was higher, and the differentiation of species composition was most significant. The increase in functional diversity was not significantly correlated with the increase in species richness but relied on the relative dominance of species with different functional characteristics in the ecosystem. Our results showed environmental variables at different scales had different effects on species richness and functional diversity. At the local scale, stand age had a positive effect on both species richness and functional diversity, whereas soil total nitrogen and soil organic matter showed a negative effect on species richness only in interactions. At the landscape scale, landscape heterogeneity (landscape richness and landscape fragmentation) played an important role in restoring functional diversity. Our study thus demonstrated restoration projects for returned forests should comprehensively consider the effects of succession stage and multiscale environmental factors. For young returned forests, functional diversity can be increased by altering landscape heterogeneity; for mature returned forests, species richness can be restored under natural succession while focusing on maintaining functional diversity and enhancing the protection of species with important functional characteristics.

Author Contributions

Conceptualization, Y.C. and X.L.; methodology, X.L.; software, W.Z.; formal analysis, M.F.S.; investigation, X.L.; data curation, Y.C.; writing—original draft preparation, X.L. and W.Z.; writing—review and editing, M.F.S. and Y.C.; visualization, X.L.; supervision, W.Z. All authors have read and agreed to the published version of the manuscript.

Funding

This work was supported by the National Natural Science Foundation of China (32201429) and (41671181), the Natural Science Foundation of Shaanxi Province of China (2021JQ-153).

Data Availability Statement

The datasets generated during this study are available from the corresponding author on responsible request.

Conflicts of Interest

The authors declare no conflicts of interest.

Appendix A

Table A1. List of plant species found in the study areas.
Species NameGeneric NameFamily Name
Artemisia argyiArtemisiaAsteraceae
Rumex patientiaRumexPolygonaceae
Cyperus nipponicusCyperusCyperaceae
Imperata cylindricaImperataPoaceae
Thymus mongolicusThymusLabiatae
Patrinia scabiosaefoliaPatriniaValerianaceae
Echinochloa crusgalliEchinochloaPoaceae
Viola variegataViolaViolaceae
Ixeris sonchifoliaIxerisAsteraceae
Bupleurum chinenseBupleurumUmbellifera
Agropyron cristatumAgropyronPoaceae
Vicia fabaViciaLeguminosae
Xanthium sibiricumXanthiumAsteraceae
Melilotus suaveolensMelilotusLeguminosae
Stellaria dichotomaStellariaCaryophyllaceae
Potentilla supinaPotentillaRosaceae
Plantago asiaticaPlantagoPlantaginaceae
Arabis pendulaArabisBrassicaceae
Salix babylonicaSalixSalicaceae
Cirsium selosumCirsiumAsteraceae
Allium fistulosumAlliumLiliaceae
Cleistogenes caespitosaCleistogenesPoaceae
Geranium dahuricumGeraniumGeraniaceae
Saussurea davuricaSaussureaAsteraceae
Astragalus dahuricusAstragalusLeguminosae
Calystegia hederaceaCalystegiaConvolvulaceae
Cirsium japonicumCirsiumAsteraceae
Artemisia sieversianaArtemisiaAsteraceae
Euphorbia humifusaEuphorbiaEuphorbiaceae
Cynanchum thesioidesCynanchumAsclepiadaceae
Sanguisorba officinalisSanguisorbaRosaceae
Androsace umbellataAndrosacePrimulaceae
Malva crispaMalvaMalvaceae
Lepidium apetalumLepidiumBrassicaceae
Heracleum hemsleyanumHeracleumUmbellifera
Clematis brevicaudataClematisRanunculaceae
Potentilla multicaulisPotentillaRosaceae
Schizonepeta multifidaSchizonepetaLabiatae
Roegneria kamojiRoegneriaPoaceae
Cynanchum chinenseCynanchumAsclepiadaceae
Potentilla anserinaPotentillaRosaceae
Potentilla bifurcaPotentillaRosaceae
Potentilla discolorPotentillaRosaceae
Amaranthus retroflexusAmaranthusAmaranthaceae
Saposhnikovia divaricataPastinacaUmbellifera
Clinopodium chinenseClinopodiumLabiatae
Saussurea runcinataSaussureaAsteraceae
Chrysanthemum lavandulaefoliumChrysanthemumAsteraceae
Brassica oleraceaBrassicaBrassicaceae
Polygonum alpinumPolygonumPolygonaceae
Setaria viridisSetariaPoaceae
Cynodon dactylonCynodonPoaceae
Lycium chinenseLyciumSolanaceae
Vicia craccaViciaLeguminosae
Bidens pilosaBidensAsteraceae
Rorippa indicaRorippaBrassicaceae
Campylotropis macrocarpaCampylotropisLeguminosae
Salix chaenomeloidesSalixSalicaceae
Pinus thunbergiiPinusPinaceae
Caragana roseaCaraganaLeguminosae
Ostryopsis davidianaOstryopsisBetulaceae
Halenia corniculataGenthianaceaeHalenia
Medicago ruthenicaMedicagoLeguminosae
Scabiosa tschiliensisScabiosaDipsacaceae
Larix principis-rupprechtiiLarixPinaceae
Cucumis sativusCucumisCucurbitaceae
Artemisia annuaArtemisiaAsteraceae
Polygonatum sibiricumPolygonatumLiliaceae
Chenopodium glaucumChenopodiumChenopodiaceae
Leontopodium leontopodioidesLeontopodiumAsteraceae
Agastache rugosaLabiataeAgastache
Kummerowia striataKummerowiaLeguminosae
Panicum miliaceumPanicumPoaceae
Populus × canadensisPopulusSalicaceae
Chenopodium acuminatumChenopodiumChenopodiaceae
Equisetum ramosissimumEquisetumEquisetaceae
Arthraxon hispidusArthraxonPoaceae
Vicia sativaViciaLeguminosae
Sonchus arvensisSonchusAsteraceae
Diospyros lotusDiospyrosEbenaceae
Mulgedium tataricumMulgediumAsteraceae
Sonchus oleraceusSonchusAsteraceae
Ixeris polycephalaIxerisAsteraceae
latifolius TauschEchinopsAsteraceae
Oxytropis caeruleaOxytropisLeguminosae
Stellera chamaejasmeStelleraEuphorbiaceaec
Geranium wilfordiiGeraniumGeraniaceae
Lomatogonium carinthiacumLomatogoniumGentianaceae
Salix chaenomeloidesSalixSalicaceae
Asparagus schoberioidesAspargusAspargus
Agrimonia pilosaAgrimoniaRosaceae
Phragmites australisPhragmitesPoaceae
Rhamnus bungeanaRhamnusRhamnaceae
Vigna radiataVignaLeguminosae
Ampelopsis humulifoliaAmpelopsisVitaceae
Portulaca oleraceaPortulacaPortulacaceae
Iris lecteaIrisIridaceae
Solanum tuberosumSolanumSolanaceae
Digitaria sanguinalisDigitariaPoaceae
Datura stramoniumDaturaSolanaceae
Erodium stephanianumErodiumGeraniaceae
Rosa bellaRosaRosaceae
Gueldenstaedtia vernaGueldenstaedtiaLeguminosae
Clematis hexapetalaClematisRanunculaceae
UnknownAstragalusLeguminosae
UnknownPolygonumPolygonaceae
Medicago sativaMedicagoLeguminosae
Hemistepta lyrataHemisteptaAsteraceae
Caragana korshinskiiCaraganaLeguminosae
Aconitum barbatumAconitumRanunculaceae
Myosoton aquaticumMalachiumCaryophyllaceae
Eleusine indicaEleusinePoaceae
Galium verumGaliumRubiaceae
Elymus dahuricusElymusPoaceae
Thermopsis lanceolataThermopsisBetulaceae
Plantago depressaPlantagoPlantaginaceae
Potentilla flagellarisPotentillaRosaceae
Taraxacum mongoliumTaraxacumAsteraceae
Stemmacantha unifloraStemmacanthaAsteraceae
Capsella bursa-pastorisCapsellaBrassicaceae
Rubia cordifoliaRubiaRubiaceae
Clematis aethusifoliaClematisRanunculaceae
Gentiana macrophyllaGentianaGentianaceae
Corydalis repensCorydalisPapaveraceae
Euphorbia esulaEuphorbiaEuphorbiaceae
Hippophae rhamnoidesHippophaeElaeagnaceae
Oxytropis psamocharisOxytropisLeguminosae
Allium senescensAlliumLiliaceae
Kalimeris lautureanaKalimerisAsteraceae
Armeniaca sibiricaArmeniacaRosaceae
Potentilla kleinianaPotentillaRosaceae
Duchesnea indicaDuchesneaRosaceae
Adenophora polyanthaAdenophoraCampanulaceae
Geranium sibiricumGeraniumGeraniaceae
Amethystea caeruleaAmethysteaLabiatae
Ammannia bacciferaAmmanniaLythraceae
Polygonum lapathifoliumPolygonumPolygonaceae
Medicago lupluinaMedicagoLeguminosae
Asparagus cochinchinensisAsparagusLiliaceae
Hyoscyamus nigerHyoscyamusSolanaceae
Convolvulus arvensisConvolvulusConvolvulaceae
Beta vulgarisBetaChenopodiaceae
Acalypha australisAcalyphaEuphorbiaceaec
Mazus japonicusMazusRanunculaceae
Spiraea pubescensSpiraeaRosaceae
Orostachys fimbriatusOrostachysCrassulaceae
Vicia unijugaViciaLeguminosae
Potentilla chinensisPotentillaRosaceae
Equisetum arvenseEquisetumEquisetaceae
Saussurea ussuriensisSaussureaAsteraceae
Myosotis silvaticaMyosotisBoraginaceae
Carex rigescensCarexCyperaceae
Berberis poiretiiBerberisBerberidaceae
Leonurus sibiricusLeonurusLabiatae
Polygala tenuifoliaPolygalaPolygalaceae
UnknownSedumCrassulaceae
Dracocephalum moldavicaDracocephalumLabiatae
Elsholtzia ciliataElsholtziaLabiatae
Chrysanthemum chanetiiChrysanthemumAsteraceae
Bidens parvifloraBidensAsteraceae
Oxytropis glabraOxytropisLeguminosae
Rhamnus parvifoliaRhamnusRhamnaceae
Populus simoniiPopulusSalicaceae
Inula japonicaInulaAsteraceae
Scorzonera austriacaScorzoneraAsteraceae
Linum usitatissimumLinumLinaceae
Corydalis yanhusuoCorydalisPapaveraceae
Leymus chinenseLeymusPoaceae
Glycine sojaGlycineLeguminosae
Arundinella hirtaArundinellaPoaceae
Deyeuxia arundinaceaDeyeuxiaPoaceae
Avena fatuaAvenaPoaceae
Papaver nudicaulePapaverPapaveraceae
Iris dichotomaIrisIridaceae
Leonurus artemisiaLeonurusLabiatae
Artemisia capillarisArtemisiaAsteraceae
Poa sphondylodesPoaPoaceae
Pinus tabulaeformisPinusPinaceae
Ulmus pumilaUlmusUlmaceae
Achnatherum sibiricumAchnatherumPoaceae
Zea maysZeaPoaceae
polygonatum odratumPolygonatumLiliaceae
Pharbitis purpureaPharbitisConvolvulaceae
Polygala tenuifoliaPolygalaPolygalaceae
Viola prioanthaViolaViolaceae
Poa annuaPoaPoaceae
Thalictrum squarrosumThalictrumRanunculaceae
Potentilla bifurcaPotentillaRosaceae
Halerpestes ruthenicaHalerpestesRanunculaceae
Stipa capillataStipaPoaceae
Astragalus adsurgensAstragalusLeguminosae
Axyris amaranthoidesAxyrisChenopodiaceae
Salsola collinaSalsolaChenopodiaceae
Artemisia scopariaArtemisiaAsteraceae
Oplismenus compositusOplismenusPoaceae
Aster tataricusAsterAsteraceae
Oxalis corniculataOxalisOxalidaceae

References

  1. Abbas, S.; Nichol, J.E.; Zhang, J.; Fischer, G.A. The accumulation of species and recovery of species composition along a 70 year succession in a tropical secondary forest. Ecol. Indic. 2019, 106, 105524. [Google Scholar] [CrossRef]
  2. Le, H.D.; Smith, C.; Herbohn, J.; Harrison, S. More than just trees: Assessing reforestation success in tropical developing countries. J. Rural Stud. 2012, 28, 5–19. [Google Scholar] [CrossRef]
  3. Brockerhoff, E.G.; Jactel, H.; Parrotta, J.A.; Ferraz, S.F.B. Role of eucalypt and other planted forests in biodiversity conservation and the provision of biodiversity-related ecosystem services. For. Ecol. Manag. 2013, 301, 43–50. [Google Scholar] [CrossRef]
  4. Hazarika, R.; Bolte, A.; Bednarova, D.; Chakraborty, D.; Gaviria, J.; Kanzian, M.; Kowalczyk, J.; Lackner, M.; Lstibůrek, M.; Longauer, R.; et al. Multi-actor perspectives on afforestation and reforestation strategies in Central Europe under climate change. Ann. For. Sci. 2021, 78, 60. [Google Scholar] [CrossRef]
  5. MacDonald, H. Envisioning better forest transitions: A review of recent forest transition scholarship. Heliyon 2023, 9, e20429. [Google Scholar] [CrossRef]
  6. Hua, F.; Bruijnzeel, L.A.; Meli, P.; Martin, P.A.; Zhang, J.; Nakagawa, S.; Miao, X.; Wang, W.; McEvoy, C.; Peña-Arancibia, J.L.; et al. The biodiversity and ecosystem service contributions and trade-offs of forest restoration approaches. Science 2022, 376, 839–844. [Google Scholar] [CrossRef]
  7. Nunes, S.; Gastauer, M.; Cavalcante, R.B.L.; Ramos, S.J.; Caldeira, C.F.; Silva, D.; Rodrigues, R.R.; Salomão, R.; Oliveira, M.; Souza-Filho, P.W.M.; et al. Challenges and opportunities for large-scale reforestation in the Eastern Amazon using native species. For. Ecol. Manag. 2020, 466, 118120. [Google Scholar] [CrossRef]
  8. Kremer, K.; Jonsson, B.G.; Dutta, T.; Tavares, M.F.; Bauhus, J. Single-vs mixed-species plantations: A systematic review on the effects on biodiversity. Biol. Conserv. 2025, 307, 111182. [Google Scholar] [CrossRef]
  9. Hua, F.; Wang, X.; Zheng, X.; Brendan, F.; Wang, L.; Zhu, J.; Tang, Y.; Yu, D.W.; Wilcove, D.S. Opportunities for biodiversity gains under the world’s largest reforestation programme. Nat. Commun. 2016, 7, 12717. [Google Scholar] [CrossRef]
  10. Sala, O.E.; Chapin, F.S.; Armesto, J.J.; Berlow, E.; Bloomfield, J.; Dirzo, R.; Huber-Sanwald, E.; Huenneke, L.F.; Jackson, R.B.; Kinzig, A. Global biodiversity scenarios for the year 2100. Science 2000, 287, 1770–1774. [Google Scholar] [CrossRef]
  11. Lamb, D. Undertaking large-scale forest restoration to generate ecosystem services. Restor. Ecol. 2018, 26, 657–666. [Google Scholar] [CrossRef]
  12. Mammola, S.; Carmona, C.P.; Guillerme, T.; Cardoso, P. Concepts and applications in functional diversity. Funct. Ecol. 2021, 35, 1869–1885. [Google Scholar] [CrossRef]
  13. Chelli, S.; Bricca, A.; Tsakalos, J.L.; Andreetta, A.; Bonari, G.; Campetella, G.; Carnicelli, S.; Cervellini, M.; Puletti, N.; Wellstein, C.; et al. Multiple drivers of functional diversity in temperate forest understories: Climate, soil, and forest structure effects. Sci. Total Environ. 2024, 916, 170258. [Google Scholar] [CrossRef] [PubMed]
  14. Schneiders, A.; Van Daele, T.; Van Landuyt, W.; Van Reeth, W. Biodiversity and ecosystem services: Complementary approaches for ecosystem management? Ecol. Indic. 2012, 21, 123–133. [Google Scholar] [CrossRef]
  15. Berisha, N.; Geci, D. The analysis of the influence of grazing intensity on the diversity and abundance of plants and spiders (Arachnida: Araneae). Eur. J. Environ. Sci. 2023, 13, 31–38. [Google Scholar] [CrossRef]
  16. Genung, M.A.; Fox, J.; Winfree, R. Species loss drives ecosystem function in experiments, but in nature the importance of species loss depends on dominance. Glob. Ecol. Biogeogr. 2020, 29, 1531–1541. [Google Scholar] [CrossRef]
  17. Lelli, C.; Bruun, H.H.; Chiarucci, A.; Donati, D.; Frascaroli, F.; Fritz, Ö.; Goldberg, I.; Nascimbene, J.; Tøttrup, A.P.; Rahbek, C.; et al. Biodiversity response to forest structure and management: Comparing species richness, conservation relevant species and functional diversity as metrics in forest conservation. For. Ecol. Manag. 2019, 432, 707–717. [Google Scholar] [CrossRef]
  18. Luzuriaga, A.L.; Sánchez, A.M.; López-Angulo, J.; Escudero, A. Habitat fragmentation determines diversity of annual plant communities at landscape and fine spatial scales. Basic Appl. Ecol. 2018, 29, 12–19. [Google Scholar] [CrossRef]
  19. Li, T.; Xiong, Q.; Luo, P.; Zhang, Y.; Gu, X.; Lin, B. Direct and indirect effects of environmental factors, spatial constraints, and functional traits on shaping the plant diversity of montane forests. Ecol. Evol. 2020, 10, 557–568. [Google Scholar] [CrossRef]
  20. Onandia, G.; Schittko, C.; Ryo, M.; Bernard-Verdier, M.; Heger, T.; Joshi, J.; Kowarik, I.; Gessler, A. Ecosystem functioning in urban grasslands: The role of biodiversity, plant invasions and urbanization. PLoS ONE 2019, 14, e0225438. [Google Scholar] [CrossRef]
  21. Nichol, J.E.; Abbas, S. Evaluating Plantation Forest vs. Natural Forest Regeneration for Biodiversity Enhancement in Hong Kong. Forests 2021, 12, 593. [Google Scholar] [CrossRef]
  22. Matzek, V.; Wilson, K.A. Public support for restoration: Does including ecosystem services as a goal engage a different set of values and attitudes than biodiversity protection alone? PLoS ONE 2021, 16, e0245074. [Google Scholar] [CrossRef] [PubMed]
  23. Casas-Pinilla, L.C.; Iserhard, C.A.; Richter, A.; Gawlinski, K.; Cavalheiro, L.B.D.; Romanowski, H.P.; Kaminski, L.A. Different-aged Pinus afforestation does not support typical Atlantic Forest fruit-feeding butterfly assemblages. For. Ecol. Manag. 2022, 518, 120279. [Google Scholar] [CrossRef]
  24. Pandey, B.; Agrawal, M.; Singh, S. Coal mining activities change plant community structure due to air pollution and soil degradation. Ecotoxicology 2014, 23, 1474–1483. [Google Scholar] [CrossRef]
  25. Chen, B.; Iannone, B.V., III. FRAGSTATS: A Free Tool for Quantifying and Evaluating Spatial Patterns: FOR362/FR431, 6/2020. EDIS 2020, 2020, 1–12. [Google Scholar] [CrossRef]
  26. Li, X.; Hu, W.; Yu, Z. Importance of Soil Organic Matter and the Species Pool for Local Species Richness in Montane Ecosystems. Sustainability 2021, 13, 10634. [Google Scholar] [CrossRef]
  27. Kirk, P.L. Kjeldahl Method for Total Nitrogen. Anal. Chem. 1950, 22, 354–358. [Google Scholar] [CrossRef]
  28. Chambers, J.C.; Board, D.I.; Roundy, B.A.; Weisberg, P.J. Removal of perennial herbaceous species affects response of Cold Desert shrublands to fire. J. Veg. Sci. 2017, 28, 975–984. [Google Scholar] [CrossRef]
  29. Culman, S.W.; Snapp, S.S.; Ollenburger, M.; Basso, B.; DeHaan, L.R. Soil and Water Quality Rapidly Responds to the Perennial Grain Kernza Wheatgrass. Agron. J. 2013, 105, 735–744. [Google Scholar] [CrossRef]
  30. Lindemann-Matthies, P.; Junge, X.; Matthies, D. The influence of plant diversity on people’s perception and aesthetic appreciation of grassland vegetation. Biol. Conserv. 2010, 143, 195–202. [Google Scholar] [CrossRef]
  31. Laliberté, E.; Legendre, P.; Shipley, B.; Laliberté, M.E. Package ‘fd’. Measuring Functional Diversity from Multiple Traits, and Other Tools for Functional Ecology. 2014. Available online: https://cran.r-project.org/web/packages/FD/FD.pdf (accessed on 19 February 2025).
  32. Braak, C.J.F.; Šmilauer, P. CANOCO Reference Manual and User’s Guide: Software for Ordination, Version 5.0; Biometris: Ithaca, NY, USA, 2012. [Google Scholar]
  33. Pinheiro, H.T.; Rocha, L.A.; Macieira, R.M.; Carvalho-Filho, A.; Anderson, A.B.; Bender, M.G.; Di Dario, F.; Ferreira, C.E.L.; Figueiredo-Filho, J.; Francini-Filho, R.; et al. South-western Atlantic reef fishes: Zoogeographical patterns and ecological drivers reveal a secondary biodiversity centre in the Atlantic Ocean. Divers. Distrib. 2018, 24, 951–965. [Google Scholar] [CrossRef]
  34. Bennett, J.A.; Riibak, K.; Kook, E.; Reier, U.; Tamme, R.; Bueno, C.G.; Partel, M. Species pools, community completeness and invasion: Disentangling diversity effects on the establishment of native and alien species. Ecol. Lett. 2016, 19, 1496–1505. [Google Scholar] [CrossRef] [PubMed]
  35. Van Daele, F.; Honnay, O.; De Kort, H. The role of dispersal limitation and reforestation in shaping the distributional shift of a forest herb under climate change. Divers. Distrib. 2021, 27, 1775–1791. [Google Scholar] [CrossRef]
  36. Boothroyd-Roberts, K.; Gagnon, D.; Truax, B. Can hybrid poplar plantations accelerate the restoration of forest understory attributes on abandoned fields? For. Ecol. Manag. 2013, 287, 77–89. [Google Scholar] [CrossRef]
  37. Yang, H.; Pan, C.; Wu, Y.; Qing, S.; Wang, Z.; Wang, D. Response of understory plant species richness and tree regeneration to thinning in Pinus tabuliformis plantations in northern China. For. Ecosyst. 2023, 10, 100105. [Google Scholar] [CrossRef]
  38. Prach, K.; Walker, L.R. Four opportunities for studies of ecological succession. Trends Ecol. Evol. 2011, 26, 119–123. [Google Scholar] [CrossRef]
  39. Ganatsas, P.; Tsitsoni, T.; Tsakaldimi, M.; Zagas, T. Reforestation of degraded Kermes oak shrublands with planted pines: Effects on vegetation cover, species diversity and community structure. New For. 2012, 43, 1–11. [Google Scholar] [CrossRef]
  40. Ma, J.; Liu, S.; Shi, Z.; Zhang, Y.; Kang, B.; Chen, B. Changes in species composition and diversity in the restoration process of sub-alpine dark brown coniferous forests in western Sichuan Province, China. Front. For. China 2008, 3, 300–307. [Google Scholar] [CrossRef]
  41. Rozendaal, D.M.A.; Bongers, F.; Mitchell Aide, T.; Alvarez-Davila, E.; Ascarrunz, N.; Balvanera, P.; Becknell, J.M.; Bentos, T.V.; Brancalion, P.H.S.; Cabral, G.A.L.; et al. Biodiversity recovery of Neotropical secondary forests. Sci. Adv. 2019, 5, eaau3114. [Google Scholar] [CrossRef]
  42. Mestre, L.; Toro-Manríquez, M.; Soler, R.; Huertas-Herrera, A.; Martínez-Pastur, G.; Lencinas, M.V. The influence of canopy-layer composition on understory plant diversity in southern temperate forests. For. Ecosyst. 2017, 4, 6. [Google Scholar] [CrossRef]
  43. Ricotta, C.; Szeidl, L.; Pavoine, S. Towards a unifying framework for diversity and dissimilarity coefficients. Ecol. Indic. 2021, 129, 107971. [Google Scholar] [CrossRef]
  44. Lazarina, M.; Michailidou, D.E.; Tsianou, M.; Kallimanis, A.S. How Biodiversity, Climate and Landscape Drive Functional Redundancy of British Butterflies. Insects 2023, 14, 722. [Google Scholar] [CrossRef] [PubMed]
  45. Siwicka, E.; Thrush, S.F.; Hewitt, J.E. Linking changes in species-trait relationships and ecosystem function using a network analysis of traits. Ecol. Appl. 2020, 30, e02010. [Google Scholar] [CrossRef] [PubMed]
  46. Midolo, G.; Alkemade, R.; Schipper, A.M.; Benítez-López, A.; Perring, M.P.; De Vries, W. Impacts of nitrogen addition on plant species richness and abundance: A global meta-analysis. Glob. Ecol. Biogeogr. 2019, 28, 398–413. [Google Scholar] [CrossRef]
  47. Eisenhauer, N.; Hines, J.; Isbell, F.; van der Plas, F.; Hobbie, S.E.; Kazanski, C.E.; Lehmann, A.; Liu, M.; Lochner, A.; Rillig, M.C.; et al. Plant diversity maintains multiple soil functions in future environments. eLife 2018, 7, e41228. [Google Scholar] [CrossRef]
Figure 1. Location of the study area and the plots. The different colored dots represent different forest ages, and the numbers represent median forest ages.
Forests 16 00956 g001
Figure 2. Plant species richness, plant diversity, and functional diversity in different successional age classes (the same letter indicate no significant difference, different letters indicate significant differences).
Forests 16 00956 g002
Figure 3. Nonmetric multidimensional scaling (NMDS) analysis based on Jaccard dissimilarity. Ellipses showing 60% confidence interval for each age class (stress = 0.58, Bray–Curtis distance).
Forests 16 00956 g003
Figure 4. Relationship between species richness and functional diversity (a) (R2 = 0.071, p > 0.05), and the relationship between Simpson diversity and functional diversity (b) (R2 = 0.310, p < 0.001).
Forests 16 00956 g004
Table 1. Basic situation of the plots.
AgeNumber of PlotsAge of Midpoint
6~12610
21~26623
33~36634
43~46645
53~63658
>1006>100
Table 2. Species traits and related ecosystem services.
Plant TraitTrait CharacteristicsData SourcesRelated Ecosystem Services
Life formarbor, shrub, herbaceousfield observationssoil conservation, climate change
Growth cycleannual, perennialdatabase query 1community stability, soil retention
Dominance in situscattered, small groups, larger
groups, larger stands, dominating
large areas
field observationsregulation, support
Flower colornone (too small to see), green, white, yellow, violet, purple,
orange, red, blue, pink, mix
field observationsbiological control, culture
Red List speciesyes, nodatabase query 2biodiversity
Edible or healing effectyes, nodatabase query 3supply
Nectariferous plantyes, nodatabase query 4pollination
database query 1: https://www.iplant.cn/ (accessed on 15 March 2024). database query 2: https://www.mee.gov.cn/ (accessed on 28 May 2024). database query 3: https://www.chsla.org.cn/ (accessed on 28 May 2024). database query 4: https://www.data.ac.cn/table/tbf78 (accessed on 12 January 2025).
Table 3. Relationship between the plant richness and environmental factors in a generalized linear model.
Independent VariablesCoefficientStandard ErrorZ-Valuep-Value
Age1.179±0.1852.0610.039 *
Soil total nitrogen0.369±0.2151.7170.085
Soil organic matter0.003±0.0070.4630.643
Landscape richness0.416±0.3181.9070.060
Patch size2.319±1.1721.9790.047 *
Landscape fragmentation−0.648±0.315−2.0550.039 *
Soil total N × Soil organic matter−0.005±0.003−1.9640.049 *
Significance levels: * p < 0.05.
Table 4. Coefficients, standard errors, Z-values, and p-values in the generalized linear model for the relationship between plant richness and environmental factors.
Independent VariablesCoefficientStandard ErrorZ-Valuep-Value
Age3.367±0.0012.8500.003 **
Soil total nitrogen0.069±0.0341.0850.085
Soil organic matter0.003±0.1510.4630.643
Landscape richness0.806±0.0681.9070.050 *
Patch size0.319±0.0261.9790.077
Landscape fragmentation2.368±0.0492.9640.022 *
Significance levels: * p < 0.05; ** p < 0.01.
Disclaimer/Publisher’s Note: The statements, opinions and data contained in all publications are solely those of the individual author(s) and contributor(s) and not of MDPI and/or the editor(s). MDPI and/or the editor(s) disclaim responsibility for any injury to people or property resulting from any ideas, methods, instructions or products referred to in the content.

