Article

Altitudinal Variation in Effect of Climate and Neighborhood Competition on Radial Growth of Picea schrenkiana Fisch. et C.A.Mey. in the Middle Tianshan Mountains, China

by
Xinchao Fan
1 and
Gheyur Gheyret
1,2,*
1
College of Geographical Sciences and Tourism, Xinjiang Normal University, Urumqi 830054, China
2
Xinjiang Key Laboratory of Lake Environment and Resources in Arid Zone, Urumqi 830054, China
*
Author to whom correspondence should be addressed.
Forests 2025, 16(6), 948; https://doi.org/10.3390/f16060948
Submission received: 3 May 2025 / Revised: 28 May 2025 / Accepted: 2 June 2025 / Published: 4 June 2025
(This article belongs to the Section Forest Meteorology and Climate Change)

Abstract

:
Against the background of global warming, forests across environmental gradients show distinct responses to climate change, necessitating research on tree growth patterns under specific conditions. Climate and competition are critical factors affecting tree growth, yet their combined effects across altitudinal gradients remain unclear, especially in arid regions such as Central Asia. This study investigated how climate and competition influence radial growth of Picea schrenkiana Fisch. et C.A.Mey. across altitudinal gradients (1500–2670 m) in the Middle Tianshan Mountains. Using dendroclimatology, competition indices, multivariate statistical analyses, and nonlinear models across 12 plots, we examined spatial variability in growth responses. Results revealed significant altitudinal differences in growth responses to climate and competition across altitudes. At low elevations, growth is primarily limited by water availability; drought indices and spring precipitation exert positive effects, while high temperatures inhibit growth. At mid-elevations, climate becomes the dominant driver, particularly spring temperature and precipitation playing key roles, while competition has no significant effect. At high elevations, temperature becomes the primary driver of growth; however, the overall sensitivity to climate is reduced compared to lower elevations. Multiple regression analyses confirm that water-related factors drive growth at lower and middle elevations, whereas temperature is the primary driver at higher elevations. Further model comparison indicates that while nonlinear models performed slightly better at mid-elevations, linear approaches similarly provided interpretable climate–growth relationships. This study demonstrates significant spatial variation in growth determinants, with water-driven controls dominating at lower elevations and competition effects ranging from significant to non-significant as altitude increases. Future warming may further intensify drought stress at lower elevations, and whether or not the weak positive responses currently observed at higher elevations will persist remains uncertain. These findings provide a scientific basis for sustainable management of arid mountain forests under climate change.

1. Introduction

Global climate change profoundly affects forest ecosystems. As global warming intensifies, forests face increasingly variable growth environments [1]. On one hand, warming could lengthen the growing season; on the other, it can lead to forest decline [2]. Forests responses vary across geographical and environmental gradients, necessitating detailed investigations of tree growth patterns under specific conditions.
Among abiotic factors that influencing tree growth, water and temperature are primary environmental drivers [3]. Temperature and precipitation are the most commonly used climate indicators to predict tree growth [4]. Water deficits can induce xylem cavitation, potentially causing irreversible hydraulic failure [5], while temperature changes affect cambium activity and growing season length [6]. Under extreme conditions, water stress and carbon starvation are major mechanisms of tree decline or death [7,8]. As a natural record of climate change, tree rings are primarily influenced by fluctuations in temperature and moisture. The “lagged effect of climate” on tree growth means that annual ring widths reflect both current and past climatic conditions. Therefore, dendrochronology is a useful tool for studying the relationship between climate and radial tree growth [9,10]. Using tree-ring analysis, researchers can explore the differential responses of trees to climate change across different environmental gradients (such as elevational gradients).
Similarly to the latitude–longitude gradient, many abiotic factors, including temperature, precipitation, and soil characteristics, vary with changes in elevation. However, because the geographic distance of the environmental gradient is much shorter across the elevation gradient, it may offer advantages over other natural hydrothermal gradients that exhibit steeper characteristics [11]. In recent years, an increasing number of researchers have investigated the influence of elevation on the connection between tree growth and climatic factors using tree-ring analysis [12,13,14]. Environmental heterogeneity caused by hydrothermal differences means that different tree species and even trees of the same species respond differently to climatic factors across the elevational gradient [15]. Generally, tree growth at the highest elevations is usually restricted by low temperatures, whereas at lower elevations, water availability is the main limiting factor [16,17,18]. However, some researchers suggest that similar climatic factors affect the radial growth of trees in each elevation [19,20]. The most likely reasons for the inconsistent conclusions are differences in tree species and climatic conditions in different study areas [21]. For example, tree-ring research from the Tibetan Plateau indicate that across the altitude gradient, the growth-temperature relationship shifts progressively from negative to positive, while the relationship between growth and precipitation is reversed [22]. Research on the altitude gradient range of 1200 m of Siberian larch, a typical conifer species of the Altai Mountains, show that the correlation coefficients of growth-temperature and growth-precipitation change in opposite directions: the former changes from negative to positive, while the latter changes from positive to negative [18]. Similarly, a recent study of European spruce shows that the correlation between radial growth and mean annual temperature and precipitation shifts positively and negatively with elevation, which is consistent with the above two studies [23].
In natural forests, trees inevitably interact, and biotic factors such as neighborhood density and species composition can influence the growth of focal trees. The meaning of competition is that trees must compete with their neighbors for finite resources including sunlight, water, and soil nutrients during the growth process, which leads to a decrease in the growth rate of neighboring trees and ultimately affects their biomass accumulation [24]. Competition among individuals is common in forests [25] because it both limits plant growth and drives changes in forest dynamics [26]. Larger trees generally exhibit greater efficiency in acquiring resource, while smaller trees experience greater competitive pressure, and tree size is positively correlated with growth [27]. Intense competition can increase mortality of larger individuals in the stand [28]. Numerous investigations have demonstrated that competition exerts a stronger influence on radial growth compared to climate, including research on Larix kaempferi (Lamb.) Carrière in different regions of China and two conifer species in America [26,29]. Research on the distribution of European beech across altitudinal gradients reveals that competition has a more significant role at low altitudes, but that climatic factors are the primary limitation to tree growth at high altitudes. At mid elevations, trees experience a balanced influence of both climate and competition [30]. A study in the Carpathian Mountains found that radial growth of Norway spruce at high altitudes is primarily restricted by climatic factors such as temperature and moisture, while at lower altitudes, dense stands face the dual limitation of water and competition, with older trees being more influenced by climate [31]. Moreover, research in southern New Zealand has shown that growth of alpine beech (Nothofagus solandri (Hook.f.) Oerst. var. cliffortioides (Hook.f.) Poole) is influenced by tree size, competition intensity and elevation. At lower altitudes, light competition significantly limits growth, whereas at higher elevations, light competition weakens, and harsh environmental conditions and nutrient competition become the main limiting factors [32]. Thus, it is useful and necessary to investigate how these factors collectively affect tree radial growth and how their impact varies along elevational gradients.
The Tianshan Mountains, located in the middle and high latitudes of the Northern Hemisphere, are a significant region affected by global climate warming [33]. Picea schrenkiana Fisch. et C.A.Mey. is a dominant species in this area, covering the largest area and storing the most carbon. It is found primarily at elevations ranging from 1500 to 2800 m in the central part of the Tianshan Mountains, with a clear vertical zonal distribution. This species contributes significantly to retaining water, which regulates the climate and stores carbon. While Picea schrenkiana has a high tolerance to extreme weather conditions, which contributes to its wide distribution at different altitudes, although it is mainly found at middle altitudes where the climate is most favorable.
Numerous research papers have investigated the responses of Picea schrenkiana at different elevations, but most of them are limited in spatial scope [34,35]. Moreover, in mountainous areas with complex hydrothermal conditions, the response of Picea schrenkiana to climate across all altitudes is not well understood. Furthermore, no comprehensive studies have systematically examined how climate, competition, tree age and size influence the radial growth of Picea schrenkiana across altitudinal gradients. Comprehending these factors is essential for effective management and conservation of forests in ecologically fragile arid regions, especially in the context of global warming and achieving sustainable development.
In our research, we collected a number of Picea schrenkiana tree samples from elevations ranging from 1500 to 2670 m in the middle of the Tianshan Mountains in China. Our research objectives are (1) to identify the climatic factors that drive Picea schrenkiana radial growth at different altitudes and their variation. (2) To analyze patterns in the response of Picea schrenkiana radial growth to climate and neighborhood competition across the altitude gradient, and to determine the contribution of competition and climate to radial growth at different altitudes.
The hypotheses of this research are as follows: (1) The response of radial growth to climatic variables varies across the elevational gradient in sensitivity and intensity. (2) Early growing season precipitation and spring-summer maximum temperatures affect growth at all elevations, with varying importance by altitude. (3) With increasing altitude, the effect of competition on the radial growth of Picea schrenkiana decreases.

2. Materials and Methods
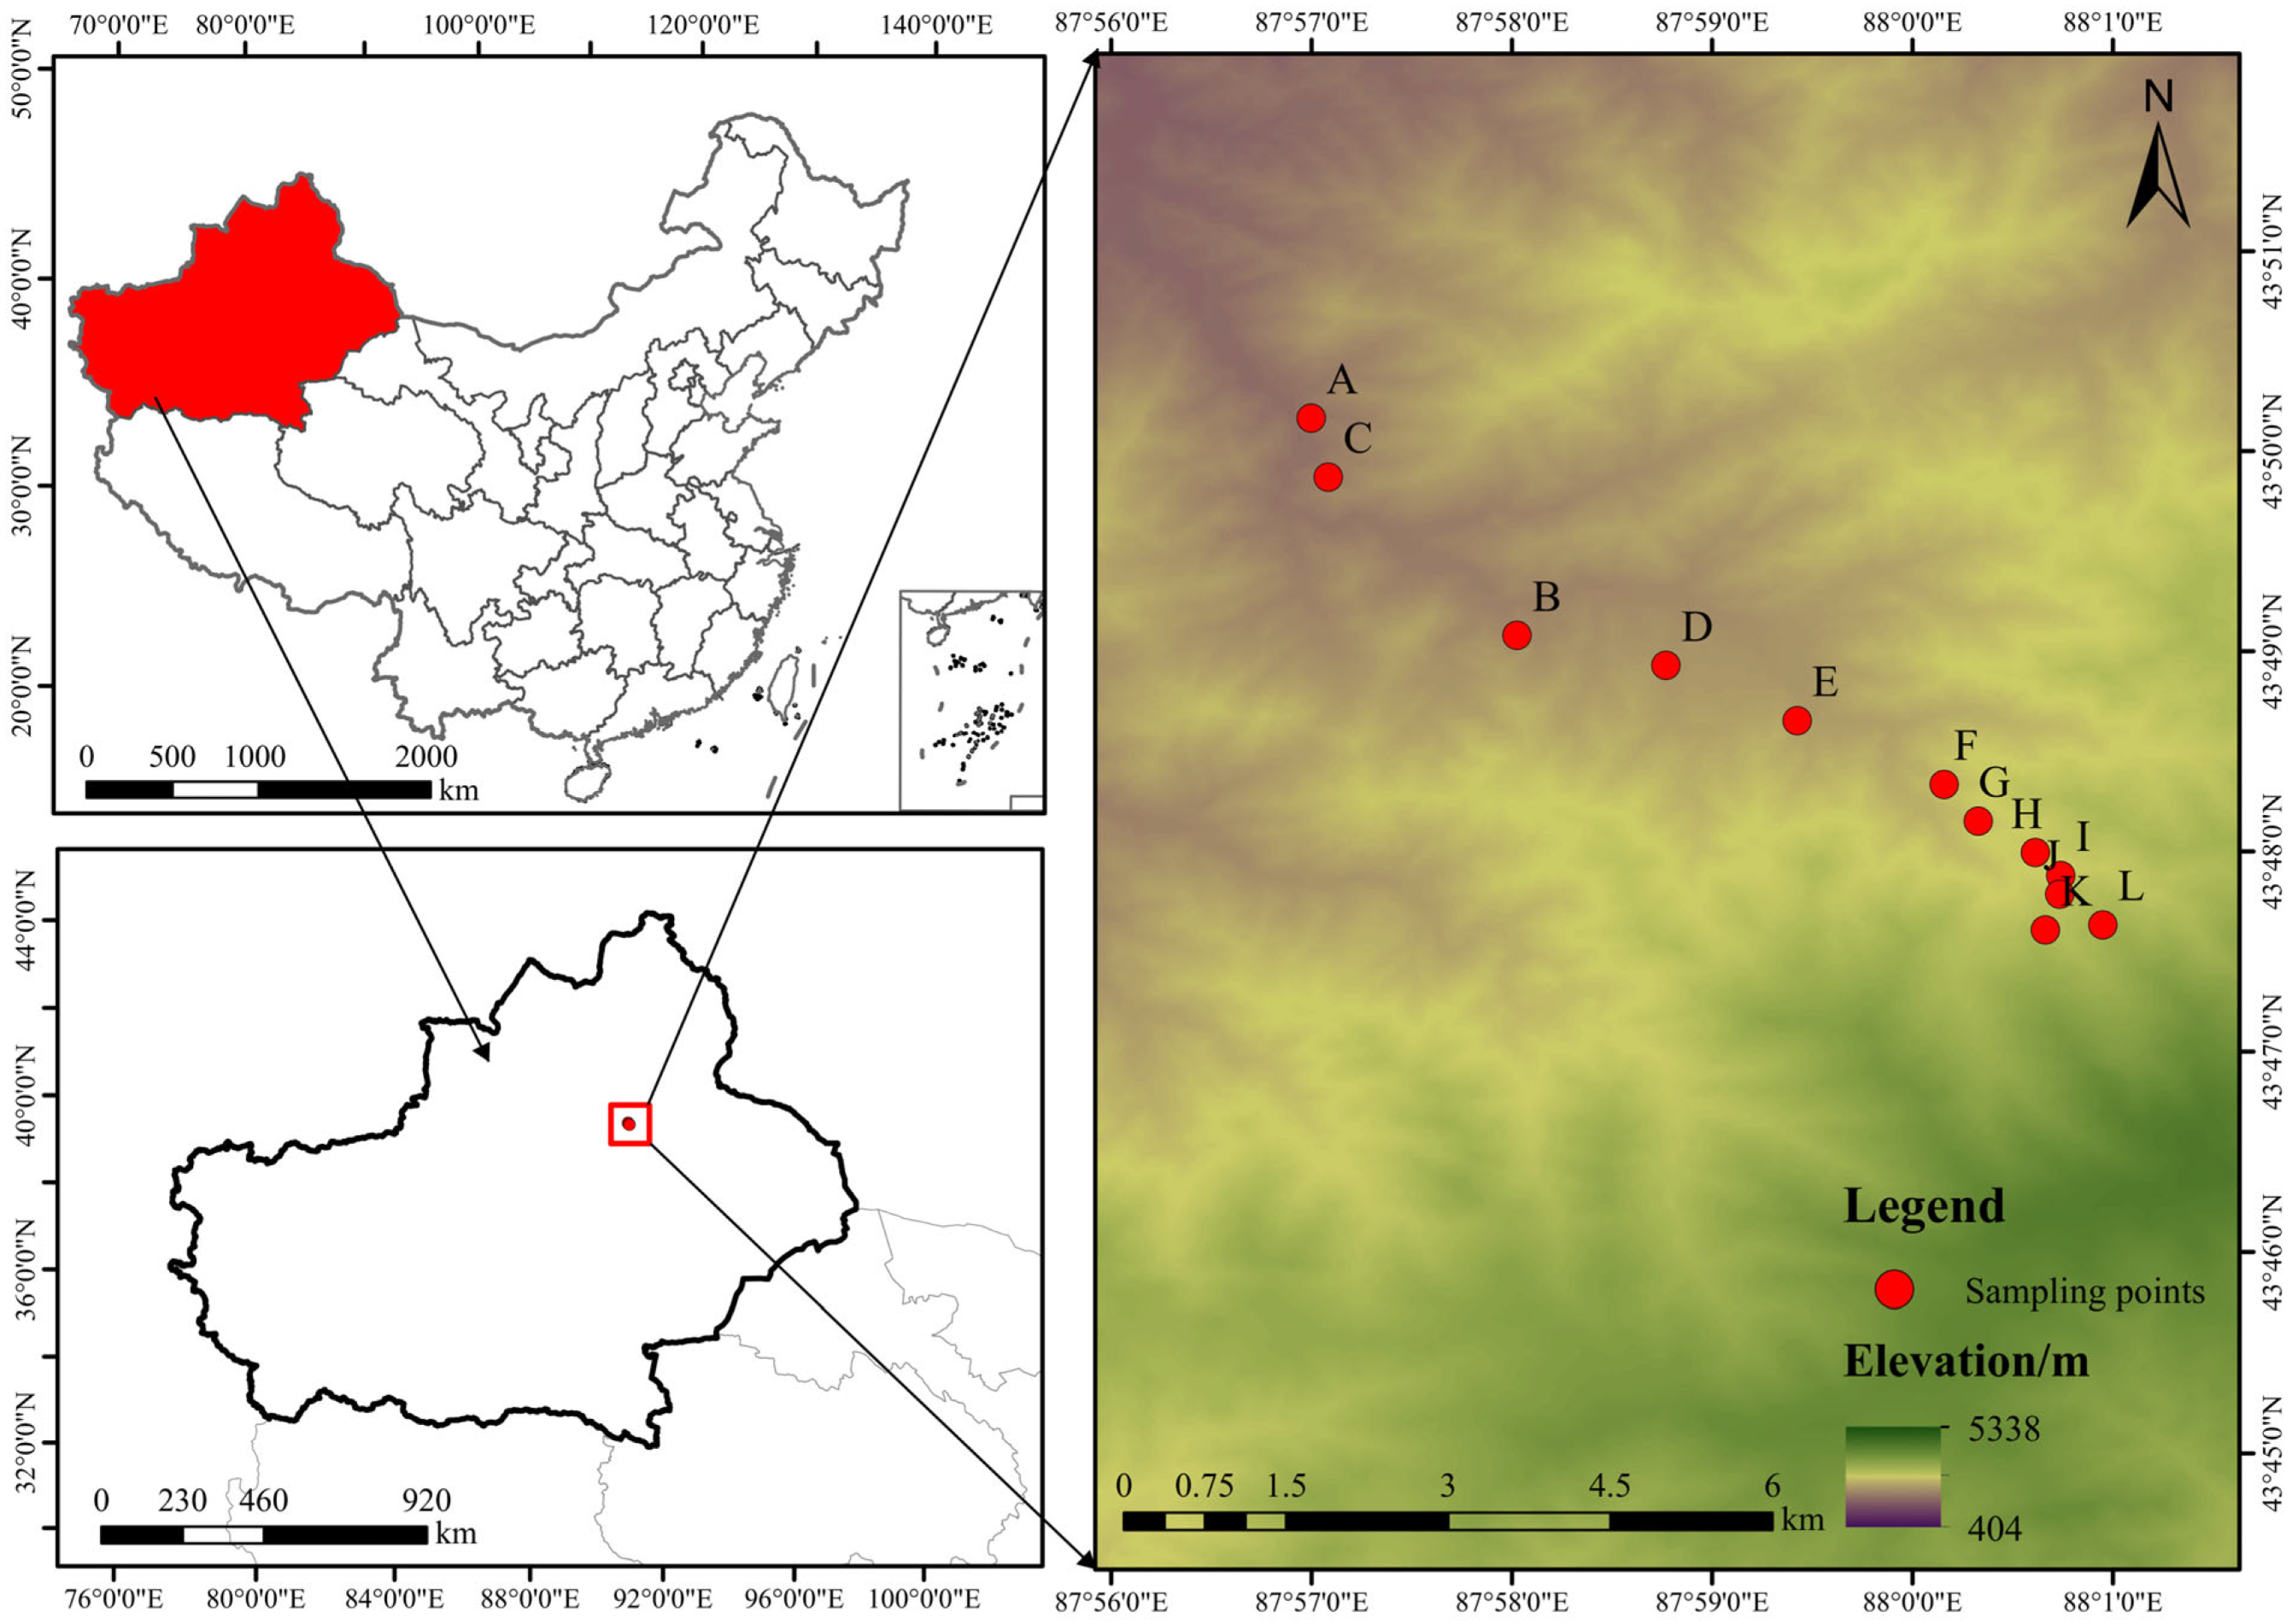
2.1. Study Area

We carried out our research in the Picea schrenkiana forest of the Tianshan National Forest Park, located on the northern aspect of the central Tianshan Mountains in Urumqi, Xinjiang Uygur Autonomous Region, China (43°38′06″–43°54′30″ N, 87°49′17″–88°07′28″ E) (Figure 1). The area has a complex terrain with interwoven ridges and valleys. According to long-term observations from the nearest meteorological station, Tianchi (43°53′ N, 88°07′ E, 1935 m a.s.l., about 9 km from the study area), the mean annual temperature is about 2.2 °C. The annual mean temperature throughout the year varies from −11.5 °C to 15.4 °C. It is highest in July (15.4 °C) and lowest in January (−11.5 °C). The frost-free period is about 24% of the year. Annual precipitation averages around 550 mm, with the majority (75%) of precipitation occurring between April and August (Figure 2). The dominant species in the Tianshan forest is Picea schrenkiana, which grows in relatively moist areas such as shady slopes, semi-shady slopes, and river valleys at altitudes of 1500~2700 m [36]. In addition to Picea schrenkiana, a small number of Populus tremula L., Sorbus tianschanica Rupr.and Salix xerophila Flod. are found in the lower elevations of the area. The soils under the forest at different altitudes are mainly gray-brown, rich in organic matter, and with good water retention capacity. Due to limited human disturbance and a well-preserved ecological environment, this area is suitable for studying how climate and competition influence radial growth patterns of Picea schrenkiana across altitudinal gradients.

2.2. Collection of Tree Data and Chronology Construction

Field surveys were carried out from July to August 2023 across the altitude gradient of the Tianshan National Forest Park. Sampling was conducted at approximately 100 m intervals starting at 1500 m. At each altitude, a 30 m × 20 m plot was selected in an area with minimal human activity. This resulted in 12 plots spanning an elevation range of 1500–2670 m (Figure 1). In each plot, 20 target trees were selected, then we sampled 20 target trees by extracting cores (parallel to the slope) at DBH level (1.3 m) in two directions parallel to the slope using a wood core sampler with an inner diameter of 5.1 mm (Haglöf, Långsele, Sweden). Finally, we collected a total of 480 cores from 240 trees in the 12 plots and sealed them in plastic tubes for transport to the laboratory.
Previous research shows that distance-independent competition indices perform comparably to distance-dependent competition indices in assessing tree competition [27]. Due to their simplicity, distance-independent indices are widely used in numerous studies [37,38]. In this study, we measured several parameters for all trees, including tree height, DBH (diameter at breast height), and crown spread.
In the laboratory, tree-ring analysis was proceeded as follows: the collected tree cores were first secured in samples, placed in wooden slots, and naturally desiccated. The surface of the cores was sanded sequentially with multiple-grit sandpapers until clear tree rings were visible under the microscope. Ring-width measurements were obtained using the LINTAB system (Rinntech, Heidelberg, Germany) in combination with TSAP (v4.81)—a time series analysis software, with a high measurement accuracy (0.001 mm). Cross-dating was then performed using COFECHA software (v6.06P) to ensure the accuracy of the results [39]. Damaged or outlier samples that deviated significantly from the main sequence (r < 0.2) were excluded (n = 35 cores), leading to a final dataset that contained 445 cores from 228 trees (Table 1).
Non-climatic growth patterns were removed from the original tree-ring series using the ARSTAN software (v44) in order to construct chronologies. Specifically, in order to retain low-frequency variations related to climate and remove the influence of inherent growth trends, a negative exponential curve (k > 0, no = opt 5) was used as the detrending method to generate standardized width indices for each tree core [40]. The detrended individual series were obtained and standard chronologies were created for each plot using the bi-weight robust mean method. Three types of chronologies have been created: Standard chronology, Residual chronology, and Ars chronology (autoregressive chronology). Compared to the other two chronologies, the standard chronology effectively removed growth rate differences between individual trees and preserved low- and mid-frequency climate signals. Therefore, the standard chronology was used as the basis for all further analyses.

2.3. Climate Data

The Tianchi meteorological station, located nearest to the study area (43°53′ N, 88°07′ E, 1935 m a.s.l.), served as our source of meteorological data (Figure S1). We obtained the climate data whose time span is 1959 to 2022 from the Science Data Center of National Meteorological (http://data.cma.cn/, accessed on 22 April 2024). The selected climate variables included mean monthly temperature (Tmean), mean monthly maximum temperature (Tmax), mean monthly minimum temperature (Tmin), monthly total precipitation (PCP), and mean monthly diurnal temperature range (DTR) (Figure 2). In contrast with traditional drought indices, the self-calibrated Palmer Drought Severity Index (scPDSI) incorporates soil moisture, providing a more comprehensive measure of regional moisture conditions. To better analyze the response of Picea schrenkiana to climate, this study includes scPDSI as a key climatic variable [18]. It was obtained from the global high-resolution (1/24°) Terra-Climate dataset (https://www.climatologylab.org/terraclimate.html, accessed on 10 May 2024). Considering the delayed response of tree growth to climatic conditions, we selected climatic data from June of the previous year to September of the current year for analysis and compared the standardized chronologies of Picea schrenkianaa at different altitudes.

2.4. Analysis of the Relationship Between Radial Growth and Climate at Different Altitudes

Principal Component Analysis (PCA) was applied to explore the homogeneity of chronologies across different altitude plots, which helped to reveal the variations in radial growth of Picea schrenkiana under different hydrothermal gradients, with data for the common period of expressed population signal (EPS) (1940–2022) from the 12 sampling plots [41]. The loadings of the first two principal component (PC1, PC2) patterns served as the basis for sample grouping [18,38]. Grouping based on this method ensured within-group homogeneity of growth responses, with only plot F (2030 m) and plot I (2320 m) reassigned to adjacent altitude groups according to their chronology similarity [18], while the final grouping results still generally followed the altitudinal gradient. Subsequently, to reduce the dimensionality of the data and to highlight common radial growth characteristics within each group, we again performed PCA on the chronology data of each group, extracting the PC1 score to represent the characteristic chronology of that group. This approach effectively captured the common variation trends within each group. The correlation of tree radial growth with climate was examined using correlation analysis by calculating the correlation coefficients between each group’s characteristic chronology and the monthly climatic factors. Multiple regression models were then constructed to determine the most important climatic factors influencing tree growth in each group. Before building the regression models, stepwise regression was used to reduce multicollinearity among the predictors and to select the climate variables that significantly affected radial growth. After model construction, variance inflation factors (VIF < 3) were calculated to ensure that no collinearity problems existed among the selected variables. The multiple regression model is represented by the following equation:
TRI = α + Σ(βi × xi)
In Equation (1), TRI represents the characteristic chronology of each group (dependent variable), α indicates the y-intercept of the model, the meaning of βi is the regression coefficient indicating the influence of each climate variable on TRI, and Xi represents each climate variable (independent variable). The model was constructed using R software (v4.3.3), using the ‘car’ package (v3.1.2) to decompose the variance of the regression model (R2) and the ‘relaimpo’ package (v2.2.7) to calculate each variable’s relative importance for assessing its contribution to the radial growth of trees [42].
We also constructed Generalized Additive Models (GAM) using the “mgcv” package (v1.9.1) in R to explore potential nonlinear relationships [43]:
TRI = α + Σ s(xi) + ε
In Equation (2), α is the intercept, s(xi) represents smooth functions fitted using thin plate regression splines, and ε is the error term. Model performance was evaluated using the Akaike Information Criterion (AIC) to compare linear models and GAMs.
From a growing season perspective, May to July is a critical period for earlywood formation, and moisture conditions during spring and summer are particularly important for Picea schrenkiana growth [44]. Based on the model fitting results and guided by the principle of maximizing explanatory power, this research selected climate variables related to the growing season, consisting of mean temperature and precipitation for both the previous and current year, for linear regression analysis. The correlation coefficients between temperature, precipitation and tree growth at different altitudes were analyzed to reveal the differential impact of climatic factors on Picea schrenkiana growth at different altitudes.

2.5. Analysis of the Relationship Between Competition and Radial Growth at Different Altitudes

For each target tree, all trees that were taller than 2 m and had a diameter at breast height (DBH) more than 5 cm within a 3 m radius were considered its competitive trees. This competition radius was determined based on the average crown width of Picea schrenkiana (approximately 3.05 m), as measured in Tianshan mountain by Jiao et al. [45,46], which reflects the actual crown competition influence zone. To quantify the intensity of competition affecting the target tree, we followed the method of Huang et al. [47] and Liang et al. [38] to calculate three distance-independent competition indices at the individual tree level: tree density (N, stems/ha), total DBH of competing trees (SDBH, m/ha), and total stem basal area of competing trees (SBA, m2/ha). For each target tree, the calculation equation for the competition index (CI) is as follows:
C I = m × 1 A j = 1 n ( D B H j ) k
In Equation (3), CI represents the competition index, and m is the proportional factor that depends on the specific calculation when k = 0, m = 1 (for calculating N), when k = 1, m = 1 (for calculating SDBH), and when k = 2, m = π/4 (for calculating SBA). A represents the area of the plot where the neighborhood trees are located, whose value in the research is 0.006 (30 × 20 m), n represents the total number competing trees, and DBHj refers to the diameter at breast height of each competing tree.
In addition, tree growth responds differently to climate and competition over short and long time periods, so it is necessary to examine the relationship between tree growth and climatic variables over different time intervals. In this research, a package called “dplR” (v1.7.8) was used to compute each target tree’s cumulative basal area increment (BAI), a more accurate growth metric than diameter increment as it accounts for tree geometry and is more suitable for studying tree responses to environmental factors [29], at each altitude across the corresponding climate data. We calculated the cumulative diameter growth over the last decade (2013–2022), two decades (2003–2022), three decades (1993–2022), and four decades (1983–2022). The formula is as follows:
BAI = π(R02 − R12)
In Equation (4), BAI refers to the basal area increment at different times; R0 and R1 represent the outermost and innermost radius of the tree rings, respectively. Climate variables for different time periods were replaced by the mean of the corresponding climate indicators for each time period.
Reconstructing annual competition indices is time-consuming and impractical. Because both target and competitor trees grow simultaneously, their competitive interactions are assumed to remain relatively constant [37,38]. To minimize potential error, we limited the analysis to growth data from the past 40 years. We assessed the relationship between each target tree’s cumulative basal area increments and its competition index across different time intervals. To avoid edge effects, all selected target trees were located at least 3 m from plot boundaries. We used linear regression models to fit the relationship between competition indices and cumulative basal area increment, and to assess how this relationship changes with elevation, aiming to identify the optimal competition index. Using linear mixed-effects models (LMM), we assessed the relationships between basal area increment (BAI) and various drivers (competition, climate, and tree age) across altitude groups. The LMM analysis was performed using the “lme4” package [48] in R software. Mean annual temperature and precipitation were selected as climate variables to ensure standardization across elevation gradients, allowing for meaningful comparisons while adequately representing the climatic characteristics of the study region [26,38]. Although both DBH and age were initially considered, considering age can better reflect ontogenetic development stages and cumulative environmental exposure history, we took age into model. In addition, tree ID was regarded as a random effect. Given the notable age differences in trees across altitudinal sites, the effects of competition on growth may vary with tree developmental stage. Therefore, we included the interaction term Age × CI to examine whether competition impacts growth differently across tree ages, linear relationships between competition indices and tree age were also examined within each elevation group (Figure S2). The linear mixed model formula was as follows:
BAI ~ CI + TMP + PRE + Age +Age × CI + ε
In this formula, BAI represents basal area increment (cm2/year); CI represents the optimal competition index; TMP and PRE represent mean annual temperature (°C) and annual total precipitation (mm), respectively; Age represents tree age (years); Age × CI represents the interaction between tree age and competition; and ε is random effect meaning individual tree variations. Multicollinearity was assessed with variance inflation factors (Vif < 3), and model fit was evaluated with the “MuMIn” package (v1.48.4). The relative importance of each predictor was quantified using hierarchical partitioning (LMG method) in the “relaimpo” package [43].

3. Results

3.1. Climate Change and Statistical Characteristics of Chronologies

Using historical precipitation and temperature data (1959–2022) from the meteorological station, we analyzed the characteristics of climate change in the study region. The results from the linear regression analysis (Figure 3) demonstrate that the region’s temperature increased significantly during this period (p < 0.05), which is consistent with global climate change trends. Precipitation exhibited considerable variation, but no significant trend was observed (p > 0.05).
Statistical analysis of the standardized chronologies at different altitudes indicates that the time span of the chronology ranges from 90 to 322 years, with the longest beginning in 1701 (K, 2530 m) and the shortest beginning in 1933 (B, 1603 m) (Table 1). The mean sensitivity (MS) of the chronologies decreased from 0.36 at the lowest altitude to 0.16 at the highest altitude, suggesting that Picea schrenkiana is less sensitive to interannual climate variability at higher altitudes. Most of the chronologies have a standard deviation (SD) greater than 0.3 and a signal-to-noise ratio (SNR) greater than 10, indicating that the chronologies contain substantial climate information. The first order autocorrelation (AR1) generally increased with altitude, ranging from 0.21 to 0.48, with values greater than 0.4, especially after site E (1900 m), indicating that growth at higher altitudes is more influenced by the previous year’s climatic conditions. Correlation coefficients (R) varied from 0.29 to 0.61, reaching their highest value at site C (1703 m). The overall sample representativeness of each plot (EPS) was greater than the reliable threshold of 0.85, although EPS was generally lower at higher altitudes compared to lower and middle altitudes.
Principal component analysis (PCA) results revealed the growth patterns of Picea schrenkiana in response to climate change at different altitudes in the study area. PC1 and PC2 together explained 68.8% of the total growth variation, with 46.4% variation explained by PC1 and 22.4% by PC2 (Figure 4a). PC1 explained 83%, 68%, and 63% of the growth variation in the low, middle, and high-altitude groups, respectively, and was used to construct each altitudinal group’s characteristic chronologies (Figure 4b). The results indicated that the three groups of chronologies had similar fluctuation trends in certain years, suggesting that they were influenced by similar climatic factors. However, the low-altitude group was more sensitive to climate variability (SD = 0.67), while the high-altitude group showed greater stability (SD = 0.39), with the mid-altitude group showing intermediate sensitivity (SD = 0.51). These differences are strongly associated with each group’s environmental characteristics, reflecting both similarities and differences in how Picea schrenkiana responds to climate change at different altitudes.

3.2. Differences in Response of Radial Growth to Climatic Variables at Different Altitudes

The correlation analysis results revealed significant differences in the responses of spruce chronologies to climate factors across different altitudinal groups. The radial growth of spruce in the low-altitude group showed a significant negative correlation with temperature (Tmin, Tmean, Tmax) from May to July of the current year (p < 0.05), as well as with Tmax in April of the current year and from July to September of the previous year, indicating that high temperatures inhibit growth in low-altitude spruce (Figure 5). The radial growth was positively affected by precipitation (PCP) in June of the previous year and from April to June of this year (p < 0.05), with the most significant influence shown in April and May of this year (p < 0.001). Furthermore, there was a notable inverse relationship between the chronologies and the daily temperature range (DTR) from July to September of last year and April to July of this year. There was a constant positive relationship with the Palmer Drought Severity Index (scPDSI) throughout all months, with the strongest correlation happening from May to July of this year (p < 0.001). There was a total explanatory power of 61% according to multiple regression analysis, with the drought index in June of this year (c6 scPDSI) contributing the most to growth at 49%, followed by the DTR in September of the previous year at 27%, and precipitation in May of this year at 24%. Figure 6 shows the results.
At higher elevations, spruce has a less robust reaction to water supply and a more nuanced reaction to temperature. Figure 5 shows that there was a substantial inhibitory effect of Tmax from July to September of the previous year (p < 0.05), as well as a significant negative connection with temperature (Tmin, Tmean, Tmax) from April to May of this year (p < 0.05). From July to September of the previous year, the daily temperature range (DTR) had the most impact, with the strongest link seen in August (p < 0.001). The chronologies showed a strong positive relationship with the drought index from July to January and April to July of this year (p < 0.05) and with precipitation from August to May of this year (p < 0.05) when it came to water availability. Figure 6 shows that out of the three variables that were considered in the multiple regression analysis, the most important ones for radial growth were the DTR in September of the previous year (41%), the Tmax in August of this year (34%), and precipitation in May of this year (25%). The total explanatory power was 37%.
The characteristics of the mid-altitude group were midway between those of the low-altitude and high-altitude groups. The only time Tmax and Tmean were significantly adversely associated (p < 0.05) was in May of this year, even though they inhibited radial expansion overall. The growth was greatly affected by DTR, and there was a strong negative association between the two from June to October of last year and in April, June, and July of this year (p < 0.05). In terms of water availability, the group at mid-altitude responded more strongly to precipitation than the group at high-altitude, but only somewhat less than the group at low altitude. The positive link between precipitation in February, April, and May of this year (p < 0.01) and the drought index for each month was statistically significant, with the largest correlation in May and June of this year (p < 0.001). Figure 6 shows that out of the three variables that were tested in the multiple regression analysis, the drought index (scPDSI) in May of this year had the highest explanatory power at 66%, followed by DTR in September of last year at 21%, and finally DTR in June of last year at 13%.
The AIC results indicated that linear models performed comparably to GAMs for both low- and high-altitude groups (ΔAIC < 2). In contrast, the GAM (AIC = 60.24) outperformed the linear model (AIC = 75.17) for the mid-elevation group, with c5 scPDSI and p9 DTR exhibiting significant mild to moderate nonlinear responses (edf = 2.18–2.48, p < 0.05) (Table S1, Figure 7 and Figure S3). Additionally, p6 DTR at the mid-altitude group displayed a complex nonlinear pattern (edf = 6.48), but this relationship was not statistically significant (p > 0.05) (Figure 7 and Figure S3).
Regression analysis was used with climatic variables during the growing season to further explore how climatic factors affect Picea schrenkiana growth across altitudinal gradients. The results show a significant shift in the response of growth to climatic factors with increasing altitude (Figure 8). For temperature, the correlation between growth and temperature shifts from negative to positive with increasing altitude, except in June of the previous year, where no significant change could be found. At low altitudes, temperature has a negative effect on growth, whereas at higher altitudes this effect is reduced and may even become positive. Specifically, temperature in May of the current year (c5 Tmean) exerts a negative influence on growth at all sites, while high altitude sites show a positive correlation in June of the previous year and July of the current year, reflecting the importance of moisture in May.
For precipitation, the positive correlation coefficient between radial growth and precipitation is strongest at low altitudes and gradually weakens with increasing altitude. At high altitude sites, some months show a negative correlation (Figure 8a,d). Overall, growing season temperature and precipitation play a more pronounced positive role on tree growth at lower altitudes, while higher altitudes show complex responses and spatial heterogeneity that varies with altitude.

3.3. Altitudinal Variation in the Effects of Competition and Other Factors on Growth

The analysis of the correlation between the growth of the target trees and the competitive pressure they experience at different sites shows significant altitudinal differences. Over all time intervals, stem density competition index (N), DBH competition index (SDBH), and basal area competition index (SBA) all show a gradually decreasing negative correlation with growth with increasing altitude. Among these, SBA consistently provides best overall time intervals, especially over the last 10 years (Figure 9), with the highest adjusted R2 values. Therefore, SBA was selected as the competition variable for model construction.
The linear mixed-effects model analysis reveals that the growth of Picea schrenkiana is influenced by multiple factors, with these effects varying distinctly across altitude groups (Figure 10). Tree age is the most important predictor across all altitudes, and its relative importance increases significantly with elevation (65.9% at low-altitude group, 78.5% at the mid-altitude group, and 92.5% at high-altitude group; p < 0.001). At the low-altitude group, competition is the second most influential factor after tree age, explaining 15.9% of growth variation (p < 0.05), followed by temperature (TMP), which accounts for 13.4% (p < 0.05). At the mid-altitude group, temperature becomes the second most significant factor, contributing 15.1% (p < 0.05). In contrast, competition has a negligible effect at mid and high altitudes, contributing only 2.5% and 0.7%, respectively (both non-significant). Precipitation (PRE) plays a more prominent role at low and mid-altitude groups (4.8% and 2.4%, respectively, p < 0.001), but is less influential at high altitude group (1.1%, p < 0.01). Additionally, the interaction between tree age and competition had no significant effect on growth across all altitude groups.

4. Discussion

4.1. Altitudinal Variation in Radial Growth

In this research, the radial growth characteristics of Picea schrenkiana at different altitudes (1500 m to 2670 m) in the middle Tianshan Mountains were analyzed, and significant differences in tree growth were found across the whole altitudinal gradient. With increasing altitude, the variation in tree-ring patterns, the sensitivity to interannual climate variations, the signal-to-noise ratio (SNR), and the overall sample representativeness (EPS) gradually decrease. This suggests that high-altitude environments have less climate information recorded in their rings. These findings are not only consistent with research in the Middle Himalayas [49], the Tibetan Plateau [50], and the middle Qilian Mountains [51] but also reflect the differences in microclimate conditions at different altitudes.
In the study area, temperature decreases linearly with increasing altitude, while the seasonal movement of the maximum precipitation zone influences precipitation levels [52]. This uneven water–temperature balance results in different seasonal responses to climatic conditions at various altitudes. At high altitudes, low temperatures combined with short growing seasons result in more consistent climate signals, with trees showing less annual ring variability and reduced sensitivity to extreme climate events such as drought. This may be because Picea schrenkiana at high altitudes develops unique resource allocation and growth strategies to adapt to harsh environments, such as lower metabolic rates, modified xylem structures, and conservative water use strategies [53]. In addition, the increased autocorrelation of tree-ring data (EPS) at high altitudes reflects the delayed influence of climate on growth, and the similar pattern has also been found in research in Central Europe [54], the Chinese western arid region [19,54,55], and the European Alps [56].

4.2. Altitudinal Variation in the Growth–Climate Relationships

Our analysis shows that climate affects radial growth similarly across the elevation gradient, which is not consistent with the finding of opposite climate effects on forest radial growth at low and high altitudes shown by some researchers [16,17]. The possible reason that can explain our finding is the arid climate of the study area, where moisture conditions also limit radial growth at high altitudes [19,20,57]. While our research found that radial growth of Schrenk spruce varied with altitude in response to climate conditions, temperature had a negative effect on growth, while drought index and precipitation had positive effects. However, these climatic influences varied in both severity and timing across altitude.
Radial growth is significantly affected by temperature in the growing season, particularly from April to July in the current year and from July to September in the previous year. These negative effects vary with altitude, and the strongest limitation was found at low altitudes, particularly the marked negative effect of maximum temperatures. At mid-altitudes, only mean and maximum temperatures in May of the current year have a significant negative effect on radial growth. At high altitudes, growth was also suppressed by April and May of the current year. This disparity may be related to microclimatic and habitat environment variations associated with the altitudinal gradient. There is relatively adequate precipitation at middle altitudes (1900–2200 m) [36,52], sufficient moisture alleviates the negative effects of temperature, although soil evaporation can be improved as temperature increases. In contrast, spring drought stress caused by rising temperature is more significant at low altitudes, and high temperatures intensify soil moisture evaporation and plant transpiration [58]. It is generally believed that warmer spring temperatures can promote radial growth at high altitudes [59], but the research found that temperature increases in April and May significantly suppressed growth. The reason for this may be the species’ preference for cooler, wetter climates. Moreover, early and subsequent snowmelt may also increase the risk of water stress caused by higher early spring temperatures [57,59,60].
Temperature was found to have the greatest negative effect during the peak growing season (June to July), especially at low altitudes. High temperatures not only accelerate the rate of soil moisture evaporation but also intensify drought stress, leading to increased use of non-structural carbohydrates (NSCs) for osmotic regulation instead of radial growth [61]. Additionally, high temperature can cause stomatal closure, photodamage, and limited photosynthesis caused by high temperature [62]. Furthermore, high temperature also inhibits cambial cell division and development, accelerates respiration, and depletes carbon reserves, which will further affect growth in the following year [55].
Radial growth is generally suppressed by the diurnal temperature range (DTR). Specifically, the DTR between July and September of the previous year has a significant negative effect on growth at low, middle, and high altitudes. This is likely because larger DTRs are typically associated with higher maximum temperatures, resulting in greater soil moisture evaporation and increased drought stress, which can further cause xylem conduit embolism [63]. Notably, the negative influence of DTR is greater at lower altitudes early in the growing season, most likely due to smaller temperature fluctuations at higher altitudes, where Picea schrenkiana could adapt to poor conditions such as cold weather, making the effects of DTR less strong [19]. Overall, DTR limits growth through various mechanisms, including effects on daytime photosynthetic rates and nighttime metabolic activities [64].
Water availability is a key factor influencing radial growth. Studies show that precipitation in April and May is positively correlated with ring width at different altitudes, consistent with previous findings for Picea schrenkiana in central Tianshan [65]. Spring precipitation significantly improves soil moisture, alleviates physiological drought caused by early spring warming, and promotes photosynthesis and cambial activity, thereby enhancing earlywood formation [66]. At low-altitudes, precipitation in June of both previous and current years is particularly important for growth, indicating that increased precipitation during this period effectively mitigates drought stress and promotes growth [67]. At mid-altitudes, February snowfall is significantly positively correlated with ring width, suggesting that winter snow provides critical water supply for the early growing season through spring snowmelt [68]. At high-altitudes, precipitation in August of the previous year plays a vital role in latewood development and provides abundant nutrient reserves for the next year’s growth [69].
Growth responses to precipitation and temperature show significant variation across the altitudinal gradient. At low altitudes, tree growth is primarily water limited, with stronger correlations between growth and both temperature and precipitation. This pattern is consistent with observations of Black pine in the Mediterranean region [70]. At middle altitudes, temperature and precipitation show transitional effects—the negative influence of temperature and the positive influence of precipitation gradually decrease. This is because increased precipitation and lower temperatures at higher altitudes alleviate water stress. At high-altitudes, the positive influence of precipitation gradually diminishes and is even negatively correlated in some months. This may be due to lower evapotranspiration requirements in the cold environment and physiological adaptations of trees to extreme conditions [71]. Similarly, the phenomenon was also reported in research of fir on Baha Snow Mountain, Yunnan [50].
At different altitudes, Picea schrenkiana growth is strongly affected by the drought index in both the growing and non-growing seasons, indicating that the primary limiting factor for growth throughout the year is water availability. In addition, this research found that at high altitudes there was no significant correlation between radial and drought index for some months, while at mid- and low-altitudes, it was significant for nearly all months. These results agree with findings on larch in the northern Daxinganling [12] and arid regions of northwestern China [72].
Multiple regression analysis further revealed significantly different response patterns of radial growth to climatic factors at different altitudes. At low altitudes, water-related factors (c6scPDSI and c5PCP) primarily controlled radial growth with a relative contribution of 73%. At middle altitudes, c5scPDSI is the dominant factor, accounting for 65%. At high altitudes, temperature-related variables (p9DTR and p8Tmax) dominate, contributing 75%, while water-related factors (c5PCP) account for only 25%. These results suggest that during the early growing season, tree growth at low and middle altitudes relies heavily on water availability, as higher temperatures in lower altitude stimulate the cell division of earlywood which needs lots of moisture [73]. Similarly, research has found that in North American temperate forests, drought during May to June has the strongest effect on trees [74]. In contrast, at high altitudes where climatic conditions are more limiting, the growing season is typically delayed, and radial growth can be driven by temperatures and diurnal temperature range in summer and autumn [75]. According to the importance of moisture for spruce growth across elevations demonstrated by both correlation and multiple regression analyses, we think that scPDSI, by integrating the direct effects of precipitation and indirect effects of temperature, can effectively represent the primary climate signals influencing spruce growth. Therefore, considering scPDSI as an integrated climate indicator in future studies may provide a more parsimonious and effective analytical approach. Additionally, our results reveal that climate-growth relationships at mid-altitude exhibit certain nonlinear characteristics, primarily manifested as gradual variations in response curves of two variables (c5 scPDSI and p9 DTR) rather than abrupt fluctuations, indicating that climate-growth relationships in environmental transition zones remain predominantly linear. The influence of previous June DTR on growth displayed complex patterns, but it was not statistically significant (p > 0.05), likely stemming from data heterogeneity rather than genuine climatic signals. The growth of spruce in high-altitude showed a decline-recovery nonlinear response to previous September DTR, potentially reflecting the dual effects of autumn diurnal temperature variation under intense solar radiation: daytime warming increases soil moisture evaporation thereby suppressing photosynthesis, while nocturnal cooling reduces respiratory losses, thus generating complex net impacts [63,64]. Nevertheless, model comparison results show that linear models are sufficient for both low and high altitudes, confirming the validity of traditional linear approaches in dendroclimatic studies. However, the nonlinear patterns observed at mid-altitude indicate that future research should not assume linear relationships universally. Furthermore, like many other studies [12,16,17,18,19,20,37,55,57], we employed widely used mean climate values to assess climate-growth relationships across elevational gradients. However, in mountainous regions with pronounced temperature variations [11,19], the variability of monthly climate variables may also influence radial growth. Therefore, higher-resolution daily climate data should be utilized for our future studies to investigate more complex climate-growth relationships.
Studies of larch radial growth in the Altai Mountains by Zhou et al. [18] and in the Daxinganling by Bai et al. [16] show significant spatial variation in the relationship between climatic factors and tree growth across elevation gradients. Orešković et al. [23] found that the growth sensitivity of spruce to high temperatures decreased with increasing altitude, as did its dependence on precipitation. Similarly, research in southwestern Germany showed that the correlation between spruce and fir radial growth and growing season scPDSI weakens with altitude [76]. Thus, these studies, together with the current research, highlight the spatial heterogeneity of climate effects on forest ecosystems across elevation gradients.
In recent years, the climate trend is shifting from “warming and wetting” to “warming and drying” in the Tianshan region [77]. At low altitudes, Picea schrenkiana has low resistance to drought, and future droughts due to climate warming may exacerbate the decline of Picea schrenkiana forests in this region [78]. Although mid-altitudes are considered the optimal climatic zone for Picea schrenkiana [36], increasing drought stress may gradually reduce its adaptive capacity, especially during dry years [17]. At high altitudes, warming climate’s positive effects, such as an extended growing season and enhanced photosynthesis, may be beneficial in the future [18]. Although some sites at higher altitudes showed weak positive growth responses to temperature, indicating that warming may promote photosynthesis and cambial cell differentiation by improving cold environments and benefit growth to some extent [16,18,22], such responses were not observed across all sites. Meanwhile, potential increases in extreme drought events associated with global warming make the future fate of high-altitude spruce forests remain highly uncertain [2].

4.3. Altitudinal Variation in the Radial Growth-Competition Relationship

Traditional ecological theory suggests that in high productivity environments, where resources are abundant, competition among plants is intense, whereas in high stress environments competition tends to be weaker [79]. The basic reason is that in high productivity environments, resources are abundant but limited, causing plants to compete for them; whereas in high stress environments, resources are scarce, and plants focus on tolerance, reducing competition. The observed trends in Picea schrenkiana forest growth and competition across different altitudes in this study are consistent with this concept. At low altitudes, drier climatic conditions and higher stand densities result in water availability being the main limiting factor, leading to significant intraspecific competition. In contrast, at high altitudes, lower forest density reduces competition among neighboring trees for water, light, and space [36].
In this study, we found that age is the main negative factor affecting spruce growth across altitude gradients, which is consistent with ecological theories of tree senescence. Age contributes the most variance in each altitude group, indicating that spruce tree growth is primarily influenced by age-related trends. It is notable that the relative importance of age strengthens with increasing altitude, mainly due to the higher average tree age in high-altitude spruce stands. For example, Yu et al. [52] showed that average of Picea schrenkiana forest ages in different regions of the Tianshan Mountains were significantly positively correlated with altitude. Similarly, Di Filippo et al. [80] confirmed in their Eastern Alps study that European beech exhibited extremely significant positive correlation between maximum tree age and altitude, with the oldest individuals at higher altitudes. In our study area, low-altitude zones are near residential areas, which have experienced some degree of human disturbance. As altitude increases, the harsher conditions of high-altitudes-lower temperatures and shorter growing seasons drive spruce to adopt survival-dominated strategies rather than investing resources in rapid growth. Consequently, lower metabolic and growth rates help cope with limited environmental resources, reducing physiological maintenance costs and thereby extending tree lifespan, though also resulting in lower renewal rates [79,80,81]. This explains why the relative importance of the age factor in low-altitudes is less than that in high-elevation regions.
In our study area, low-altitude zones are near residential areas and have experienced certain human disturbances. Previous research suggests that low-altitude spruce forests are mainly composed of young trees formed after the 1940s [36]. These young and middle-aged spruce trees are in phases of rapid growth and renewal, primarily growing in understory environments and facing intense intraspecific competition for limited resources including moisture, sunlight, and minerals. Additionally, Tianshan low-elevation spruce forests have high canopy closure and the highest spruce population density [82], with density-dependent effects potentially amplifying competitive influences [83]. Therefore, in arid low-altitudes, competition affects resource allocation while climate regulates physiological activities, both significantly influencing radial growth. Ecological factors vary nonlinearly across altitudinal gradients, with mid-elevation zones having favorable precipitation and heat conditions. As the optimal growth zone for Schrenk’s spruce, mid-elevation areas contain the highest biomass across different age groups [36]. At mid-elevations, radial growth limitations with age become increasingly apparent, indicating population age structure increases with elevation. Although better moisture conditions may produce higher seedling densities potentially increasing intraspecific competition, this effect is mainly determined by intrinsic population biological characteristics rather than competition for external resources [84]. Furthermore, abundant litter at mid-altitudes significantly improves soil water-holding capacity and fertility, with higher precipitation providing stable resources for mature tree growth [85,86]. Consequently, favorable environmental factors at mid-altitudes mitigate the direct impacts of competition on stand growth.
Our research shows that high-elevation spruce has significantly lower response sensitivity to climate variables such as temperature and precipitation compared to mid and low-elevation areas, which is consistent with our previous findings on climate response sensitivity. Although our model results indicate that tree age explains the majority of growth variation, this is actually a result of the cumulative effects of long-term environmental stress. Liu et al. [87] conducted a vertical transect survey of Tianshan spruce forests and found that high-elevation regions have the highest spruce population aggregation, a distribution pattern likely representing an adaptation strategy to harsh environments. Therefore, in high-elevation areas, spruce growth is primarily influenced by biological factors and environmental conditions rather than intraspecific competition. Despite limited soil nutrients in high-elevation areas due to low temperatures and reduced litter [88], trees do not mainly compete for resources but instead create locally favorable microenvironments through aggregated growth, which collectively enhances resistance to adverse environmental conditions and thereby improving overall survival probability. In extreme environmental conditions like high elevations, environmental stress rather than resource competition becomes the key factor affecting spruce growth.
By analyzing the competitive patterns of Picea schrenkiana along altitudinal gradients in central Tianshan Mountains, we found distinct altitudinal differentiation in competition intensity: trees at water-deficient low elevations experienced significant competitive effects on growth, while competition effects were not significant at mid- and high elevations, benefiting from improved moisture conditions. Additionally, our individual-tree competition index quantified competition intensity at the individual level, providing a more objective reflection of the actual competitive pressure faced by each tree [37,38]. Through examining the interactive effects between age and competition as well as the linear relationship between competition index and tree age, results demonstrated that competition effects remained relatively stable across trees of different ages. The age differences in target trees at different elevations reflected natural regeneration dynamics along the altitudinal gradient, which we consider an integral component for understanding the mechanisms by which competition and climate drive spruce growth. However, future studies that select target trees of similar ages at mid- and high elevations for comparison with low-elevation trees would help further validate our core findings regarding the altitudinal differentiation of competitive patterns.

5. Conclusions

Our study systematically analyzed how radial growth of Picea schrenkiana responds to climatic and competitive factors at different altitude gradients in the central Tianshan Mountains. The results show significant differences in growth patterns across the altitudinal gradient: at low altitudes, water availability is the main limiting factor, with drought index and precipitation being the main drivers, and competition also significantly affects growth; at mid-altitudes, climate factors play a dominant role; at high altitudes, the response to climate is weaker, and competition does not exert significant suppressive effect on growth. At higher altitudes, the response to temperature and precipitation becomes weaker, while the sensitivity to the drought index is most pronounced at middle and low altitudes. Additionally, traditional linear regression models can effectively capture the climate-growth relationships across different altitudinal zones. Future climate warming may exacerbate drought stress in low altitude forests, while middle and high-altitude forests with greater environmental adaptability are likely to be less affected. To mitigate this trend, selective thinning at low altitudes is recommended to reduce competitive pressure, while increased monitoring of extreme climate events in mid- and high-altitude forests is crucial. This research provides scientific evidence to inform management and climate adaptation strategies for montane forest ecosystems in arid regions.

Supplementary Materials

The following supporting information can be downloaded at: https://www.mdpi.com/article/10.3390/f16060948/s1, Table S1: Comparison of linear and generalized additive models (GAM) for the optimal climate variables across elevation groups. The table shows model comparison results for the best climate variables identified for each elevation group. R2 squared values indicate the proportion of variance explained, and AIC are Akaike Information Criterion values; Figure S1: Map showing the location of sampling sites and the Tianchi meteorological station; Figure S2: Linear relationships between tree age (years) and competition index (m2 ha⁻1) for (a) Low-, (b) Mid-, and (c) High-altitude groups. Red lines represent linear fits with 95% confidence bands. R2 and p-values are shown for each group, indicating non-significant age-competition relationships across all altitudes; Figure S3: Comparison of effect plots between multiple linear regression models and GAMs for three altitude groups: (a) Low-altitude, (b) Mid-altitude, and (c) High-altitude. For each group, the upper row shows partial regression plots from linear models, while the lower row displays smooth term plots from GAM. Blue lines represent linear effects with 95% confidence intervals and p-values. Red curves show GAM smooth functions with gray confidence bands, p-values, and effective degrees of freedom (edf). Variable definitions follow Figure 7.

Author Contributions

G.G. conceived the ideas of the research; G.G. and X.F. designed the experiment and collected the data; G.G. and X.F. analyzed the data; G.G. and X.F. wrote the paper. All authors have read and agreed to the published version of the manuscript.

Funding

This research was funded by the Key Project of Xinjiang Key Laboratory of Lake Environment and Resources in Arid Zone (XJDX0909-2022-02), National Natural Science Foundation of China (32201306), Tianchi Doctoral program of the Xinjiang Uygur Autonomous Region (No. BS2021005), Xinjiang Normal University Young Talent Program (XJNUQB2024-13), Young Talent Program of the Association for Science and Technology of Xinjiang Uygur Autonomous Region (RCTJ54), Xinjiang Normal University Doctoral Research Fund Project (XJNUBS2201).

Data Availability Statement

Data will be made available on request.

Conflicts of Interest

The authors declare no conflict of interest.

References

  1. IPCC. Climate Change 2022: Mitigation of Climate Change. Contribution of Working Group III to the Sixth Assessment Report of the Intergovernmental Panel on Climate Change; Cambridge University Press: Cambridge, UK, 2022. [Google Scholar]
  2. Allen, C.D.; Breshears, D.D.; McDowell, N.G. On underestimation of global vulnerability to tree mortality and forest die-off from hotter drought in the Anthropocene. Ecosphere 2015, 6, 1–55. [Google Scholar] [CrossRef]
  3. Cabon, A.; Peters, R.L.; Fonti, P.; Martínez-Vilalta, J.; De Cáceres, M. Temperature and water potential co-limit stem cambial activity along a steep elevational gradient. New Phytol. 2020, 226, 1325–1340. [Google Scholar] [CrossRef]
  4. Coomes, D.A.; Flores, O.; Holdaway, R.; Jucker, T.; Lines, E.R.; Vanderwel, M.C. Wood production response to climate change will depend critically on forest composition and structure. Glob. Change Biol. 2014, 20, 3632–3645. [Google Scholar] [CrossRef]
  5. Choat, B.; Brodribb, T.J.; Brodersen, C.R.; Duursma, R.A.; López, R.; Medlyn, B.E. Triggers of tree mortality under drought. Nature 2018, 558, 531–539. [Google Scholar] [CrossRef] [PubMed]
  6. Begum, S.; Nakaba, S.; Yamagishi, Y.; Oribe, Y.; Funada, R. Regulation of cambial activity in relation to environmental conditions: Understanding the role of temperature in wood formation of trees. Physiol. Plant. 2013, 147, 46–54. [Google Scholar] [CrossRef] [PubMed]
  7. Adams, H.D.; Zeppel, M.J.B.; Anderegg, W.R.L.; Hartmann, H.; Landhäusser, S.M.; Tissue, D.T.; Huxman, T.E.; Hudson, P.J.; Franz, T.E.; Allen, C.D.; et al. A multi-species synthesis of physiological mechanisms in drought-induced tree mortality. Nat. Ecol. Evol. 2017, 1, 1285–1291. [Google Scholar] [CrossRef]
  8. Puchi, P.F.; Camarero, J.J.; Battipaglia, G.; Carrer, M. Retrospective analysis of wood anatomical traits and tree-ring isotopes suggests site-specific mechanisms triggering Araucaria araucana drought-induced dieback. Glob. Change Biol. 2021, 27, 6394–6408. [Google Scholar] [CrossRef]
  9. Pearl, J.; Keck, J.; Tintor, W.; Siekacz, L.; Herrick, H.M.; Meko, M.D.; Pearson, C. New frontiers in tree-ring research. Holocene 2020, 30, 923–941. [Google Scholar] [CrossRef]
  10. Peng, J.; Li, J.; Li, J.; Li, X.; Cui, J.; Peng, M.; Huo, J.; Yang, L. A Tree-Ring-Based Assessment of Pinus armandii Adaptability to Climate Using Two Statistical Methods in Mt. Yao, Central China during 1961–2016. Forests 2021, 12, 780. [Google Scholar] [CrossRef]
  11. Körner, C. The use of ‘altitude’ in ecological research. Trends Ecol. Evol. 2007, 22, 569–574. [Google Scholar] [CrossRef]
  12. Wang, Z.; Zhang, T.; Zhang, D.; Luo, T.; Wang, X.; Li, X.; Mao, H. Responses of Pinus sylvestris var. mongolica tree ring width to climate factors at different elevations in the Northern Greater Khingan Mountains. Dendrochronologia 2024, 83, 126166. [Google Scholar] [CrossRef]
  13. Zhang, H.; Cai, Q.; Liu, Y. Altitudinal difference of growth-climate response models in the north subtropical forests of China. Dendrochronologia 2022, 72, 125935. [Google Scholar] [CrossRef]
  14. Zhou, Y.; Yi, Y.; Liu, H.; Song, J.; Jia, W.; Zhang, S. Altitudinal trends in climate change result in radial growth variation of Pinus yunnanensis at an arid-hot valley of southwest China. Dendrochronologia 2022, 71, 125914. [Google Scholar] [CrossRef]
  15. Wilmking, M.; Maaten-Theunissen, M.; Maaten, E.; Scharnweber, T.; Buras, A.; Biermann, C.; Gurskaya, M.; Hallinger, M.; Lange, J.; Shetti, R.; et al. Global assessment of relationships between climate and tree growth. Glob. Change Biol. 2020, 26, 3212–3220. [Google Scholar] [CrossRef]
  16. Bai, X.; Zhang, X.; Li, J.; Duan, X.; Jin, Y.; Chen, Z. Altitudinal disparity in growth of Dahurian larch (Larix gmelinii Rupr.) in response to recent climate change in northeast China. Sci. Total Environ. 2019, 670, 466–477. [Google Scholar] [CrossRef]
  17. Sidor, C.G.; Popa, I.; Vlad, R.; Cherubini, P. Different tree-ring responses of Norway spruce to air temperature across an altitudinal gradient in the Eastern Carpathians (Romania). Trees 2015, 29, 985–997. [Google Scholar] [CrossRef]
  18. Zhou, P.; Huang, J.G.; Liang, H.; Rossi, S.; Bergeron, Y.; Shishov, V.V.; Jiang, S.; Kang, J.; Zhu, H.; Dong, Z. Radial growth of Larix sibirica was more sensitive to climate at low than high altitudes in the Altai Mountains, China. Agric. For. Meteorol. 2021, 304–305, 108392. [Google Scholar] [CrossRef]
  19. Wang, B.; Chen, T.; Wu, G.; Xu, G.; Zhang, Y.; Gao, H.; Zhang, Y. Qinghai spruce (Picea crassifolia) growth-climate response between lower and upper elevation gradient limits: A case study along a consistent slope in the mid-Qilian Mountains region. Environ. Earth Sci. 2016, 75, 236. [Google Scholar] [CrossRef]
  20. Yang, B.; He, M.; Melvin, T.M.; Zhao, Y.; Briffa, K.R. Climate control on tree growth at the upper and lower treelines: A case study in the Qilian Mountains, Tibetan Plateau. PLoS ONE 2013, 8, e69065. [Google Scholar] [CrossRef]
  21. Del Río, M.; Vergarechea, M.; Hilmers, T.; Alday, J.G.; Avdagić, A.; Binderhf, F.; Bosela, M.; Dobor, L.; Forrester, D.I.; Halilović, V.; et al. Effects of elevation-dependent climate warming on intra- and inter-specific growth synchrony in mixed mountain forests. For. Ecol. Manag. 2021, 479, 118587. [Google Scholar] [CrossRef]
  22. Song, W.Q.; Mu, C.C.; Zhang, Y.D.; Yang, X.X.; Liu, X.P.; Li, X.Q. Moisture-driven changes in the sensitivity of the radial growth of Picea crassifolia to temperature, northeastern Tibetan Plateau. Dendrochronologia 2021, 64, 125761. [Google Scholar] [CrossRef]
  23. Orešković, M.; Trlin, D.; Anić, I.; Oršanić, M.; Prša, L.; Mikac, S. Climate Sensitivity and Tree Growth Patterns in Subalpine Spruce-Dominated Forests of the North-Western Dinaric Alps. Forests 2024, 15, 1972. [Google Scholar] [CrossRef]
  24. Collet, C.; Ningre, F.; Barbeito, I.; Arnaud, A.; Piboule, A. Response of tree growth and species coexistence to density and species evenness in a young forest plantation with two competing species. Ann. Bot. 2014, 113, 711–719. [Google Scholar] [CrossRef] [PubMed]
  25. Anning, A.K.; McCarthy, B.C. Competition, size, and age affect tree growth response to fuel reduction treatments in mixed-oak forests of Ohio. For. Ecol. Manag. 2013, 307, 74–83. [Google Scholar] [CrossRef]
  26. Jiang, X.; Huang, J.-G.; Cheng, J.; Dawson, A.; Stadt, K.J.; Comeau, P.G.; Chen, H.Y.H. Interspecific variation in growth responses to tree size, competition and climate of western Canadian boreal mixed forests. Sci. Total Environ. 2018, 631–632, 1070–1078. [Google Scholar] [CrossRef]
  27. Filipescu, C.N.; Comeau, P.G. Aspen competition affects light and white spruce growth across several boreal sites in Western Canada. Can. J. For. Res. 2007, 37, 1701–1713. [Google Scholar] [CrossRef]
  28. Vayreda, J.; Martínez-Vilalta, J.; Gracia, M.; Retana, J. Recent climate changes interact with stand structure and management to determine changes in tree carbon stocks in Spanish forests. Glob. Change Biol. 2012, 18, 1028–1041. [Google Scholar] [CrossRef]
  29. Wu, C.; Chen, D.; Sun, X.; Zhang, S. Contributions of competition on Larix kaempferi tree-ring growth were higher than long-term climate in China. Agric. For. Meteorol. 2022, 320, 108967. [Google Scholar] [CrossRef]
  30. Schurman, J.; Janda, P.; Rydval, M.; Mikolaš, M.; Svoboda, M.; Babst, F. Climate-competition tradeoffs shape the range limits of European beech and Norway spruce along elevational gradients across the Carpathian Mountains. Ecography 2024, 2024, e06715. [Google Scholar] [CrossRef]
  31. Primicia, I.; Camarero, J.J.; Janda, P.; Čada, V.; Morrissey, R.C.; Trotsiuk, V.; Bače, R.; Teodosiu, M.; Svoboda, M. Age, competition, disturbance and elevation effects on tree and stand growth response of primary Picea abies forest to climate. For. Ecol. Manag. 2015, 354, 281–290. [Google Scholar] [CrossRef]
  32. Coomes, D.A.; Allen, R.B. Effects of size, competition and altitude on tree growth. J. Ecol. 2007, 95, 1084–1097. [Google Scholar] [CrossRef]
  33. Chen, Y.; Li, W.; Deng, H.; Fang, G.; Li, Z. Changes in Central Asia’s Water Tower: Past, Present and Future. Sci. Rep. 2016, 6, 35458. [Google Scholar] [CrossRef] [PubMed]
  34. Wang, Q.; Yierjiang, B.; Xu, D.; Chen, H. Effects of climate on radial growth of Picea schrenkiana at different altitudes in the central Tianshan Mountains. J. For. Environ. 2024, 44, 530–538. [Google Scholar]
  35. Zhou, X.D.; Chang, S.L.; Wang, G.Z.; Sun, X.J.; Zhang, Y.T.; Li, X. Altitudinal differentiation of Picea schrenkiana radial growth responses to climate change in the Tianshan Mountains. Sci. Silvae Sin. 2024, 60, 45–56. [Google Scholar]
  36. Wang, T.; Liang, Y.; Ren, H.; Yu, D.; Ni, J.; Ma, K. Age structure of Picea schrenkiana forest along an altitudinal gradient in the central Tianshan Mountains, northwestern China. For. Ecol. Manag. 2004, 196, 267–274. [Google Scholar] [CrossRef]
  37. Kang, J.; Liang, H.; Jiang, S.; Zhu, H.; Zhou, P.; Huang, J. Effects of competition and climate on tree radial growth of Pinus sibirica in Altai Mountains, Xinjiang, China. Chin. J. Plant Ecol. 2020, 44, 1195–1202. [Google Scholar] [CrossRef]
  38. Liang, H.; Huang, J.-G.; Ma, Q.; Li, J.; Wang, Z.; Guo, X.; Zhu, H.; Jiang, S.; Zhou, P.; Yu, B.; et al. Contributions of competition and climate on radial growth of Pinus massoniana in subtropics of China. Agric. For. Meteorol. 2019, 274, 7–17. [Google Scholar] [CrossRef]
  39. Holmes, R.L. Computer-assisted quality control in tree-ring dating and measurement. Tree-Ring Bull. 1983, 43, 69–75. [Google Scholar]
  40. Cook, E.R. A Time Series Approach to Tree-Ring Standardization. Ph.D. Thesis, University of Arizona, Tucson, AZ, USA, 1985. [Google Scholar]
  41. Wigley, T.M.L.; Briffa, K.R.; Jones, P.D. On the Average Value of Correlated Time Series, with Applications in Dendroclimatology and Hydrometeorology. J. Appl. Meteorol. Climatol. 1984, 23, 201–213. [Google Scholar] [CrossRef]
  42. Wood, S.N. Fast stable restricted maximum likelihood and marginal likelihood estimation of semiparametric generalized linear models. J. R. Stat. Soc. Ser. B 2011, 73, 3–36. [Google Scholar] [CrossRef]
  43. Gromping, U. Relative importance for linear regression in R: The package relaimpo. J. Stat. Softw. 2006, 17, 1–27. [Google Scholar] [CrossRef]
  44. Zhang, R.; Yuan, Y.; Gou, X.; Zhang, T.; Zou, C.; Ji, C.; Fan, Z.; Qin, L.; Shang, H.; Li, X. Intra-annual radial growth of Schrenk spruce (Picea schrenkiana Fisch. et Mey) and its response to climate on the northern slopes of the Tianshan Mountains. Dendrochronologia 2016, 40, 36–42. [Google Scholar] [CrossRef]
  45. Jiao, L.; Jiang, Y.; Wang, M.; Zhang, W.; Zhang, Y. Age-Effect Radial Growth Responses of Picea schrenkiana to Climate Change in the Eastern Tianshan Mountains, Northwest China. Forests 2017, 8, 294. [Google Scholar] [CrossRef]
  46. Jiao, L.; Chen, K.; Wang, S.J.; Liu, X.P. Stability evaluation of radial growth of Picea schrenkiana in different age groups in response to climate change in the eastern Tianshan Mountains. J. Mt. Sci. 2020, 17, 1735–1748. [Google Scholar] [CrossRef]
  47. Huang, J.G.; Stadt, K.J.; Dawson, A.; Comeau, P.G. Modelling growth-competition relationships in trembling aspen and white spruce mixed boreal forests of Western Canada. PLoS ONE 2013, 8, e77607. [Google Scholar] [CrossRef] [PubMed]
  48. Bates, D.; Machler, M.; Bolker, B.M.; Walker, S.C. Fitting linear mixed-effects models using lme4. J. Stat. Softw. 2015, 67, 1–48. [Google Scholar] [CrossRef]
  49. Rai, S.; Dawadi, B.; Wang, Y.; Lu, X.; Ru, H.; Ram, S. Growth response of Abies spectabilis to climate along an elevation gradient of the Manang valley in the central Himalayas. J. For. Res. 2020, 31, 2245–2254. [Google Scholar] [CrossRef]
  50. Sun, M.; Li, J.; Cao, R.; Tian, K.; Zhang, W.; Yin, D.; Zhang, Y. Climate-Growth Relations of Abies georgei along an Altitudinal Gradient in Haba Snow Mountain, Southwestern China. Forests 2021, 12, 1569. [Google Scholar] [CrossRef]
  51. Gou, X.; Chen, F.; Yang, M.; Li, J.; Peng, J.; Jin, L. Climatic response of thick leaf spruce (Picea crassifolia) tree-ring width at different elevations over Qilian Mountains, northwestern China. J. Arid Environ. 2005, 61, 513–524. [Google Scholar] [CrossRef]
  52. Yu, S.; Zhang, T.; Jiang, S.; Zhang, R.; Qin, L.; Shang, H.; Yang, Y. Tree-ring minimum density chronologies of Picea schrenkiana along an elevation gradient in the Tien Shan Mountains, China. Dendrochronologia 2020, 102, 209–221. [Google Scholar] [CrossRef]
  53. Wei, X.; Peng, J.; Li, J.; Li, J.; Peng, M.; Li, X.; Liu, Y.; Li, J. Climate-growth relationships of Pinus tabuliformis along an altitudinal gradient on Baiyunshan Mountain, Central China. J. For. Res. 2024, 35, 28–40. [Google Scholar] [CrossRef]
  54. Lyu, L.; Suvanto, S.; Nöjd, P.; Henttonen, H.M.; Mäkinen, H.; Zhang, Q.B. Tree growth and its climate signal along latitudinal and altitudinal gradients: Comparison of tree rings between Finland and Tibetan Plateau. Biogeosciences 2017, 14, 3083–3095. [Google Scholar] [CrossRef]
  55. Jiao, L.; Jiang, Y.; Wang, M.; Kang, X.; Zhang, W.; Zhang, L.; Zhao, S. Responses to climate change in radial growth of Picea schrenkiana along elevations of the eastern Tianshan Mountains, northwest China. Dendrochronologia 2016, 40, 117–127. [Google Scholar] [CrossRef]
  56. Cai, Q.; Liu, Y.; Qian, H.; Liu, R. Inverse effects of recent warming on trees growing at the low and high altitudes of the Dabie Mountains, subtropical China. Dendrochronologia 2020, 59, 125649. [Google Scholar] [CrossRef]
  57. Jiao, L.; Chen, K.; Liu, X.; Qi, C.; Xue, R. Comparison of the response stability of Siberian larch to climate change in the Altai and Tianshan. Ecol. Indic. 2021, 128, 107823. [Google Scholar] [CrossRef]
  58. Panthi, S.; Fan, Z.-X.; van der Sleen, P.; Zuidema, P.A. Long-term physiological and growth responses of Himalayan fir to environmental change are mediated by mean climate. Glob. Change Biol. 2020, 26, 1778–1794. [Google Scholar] [CrossRef]
  59. Li, X.; Liang, E.; Camarero, J.J.; Rossi, S.; Zhang, J.; Zhu, H.; Fu, Y.H.; Sun, J.; Wang, T.; Piao, S.; et al. Warming-induced phenological mismatch between trees and shrubs explains high-elevation forest expansion. Natl. Sci. Rev. 2023, 10, nwad182. [Google Scholar] [CrossRef]
  60. Gao, S.; Liang, E.; Liu, R.; Babst, F.; Camarero, J.J.; Fu, Y.H.; Piao, S.; Rossi, S.; Shen, M.; Wang, T.; et al. An earlier start of the thermal growing season enhances tree growth in cold humid areas but not in dry areas. Nat. Ecol. Evol. 2022, 6, 397–404. [Google Scholar] [CrossRef]
  61. Deslauriers, A.; Huang, J.-G.; Balducci, L.; Beaulieu, M.; Rossi, S. The contribution of carbon and water in modulating wood formation in black spruce saplings. Plant Physiol. 2016, 170, 2072–2084. [Google Scholar] [CrossRef]
  62. Zhou, F.; Dong, Z.; Fang, K.; Cheng, D.; Tang, H.; Ou, T.; Zhang, F.; Chen, D. Summer heat induced the decline of Pinus taiwanensis forests at its southern limit in humid Subtropical China. Agric. For. Meteorol. 2024, 350, 109974. [Google Scholar] [CrossRef]
  63. Brodribb, T.J.; Powers, J.; Cochard, H.; Choat, B. Hanging by a thread? Forests and drought. Science 2020, 368, 261–266. [Google Scholar] [CrossRef] [PubMed]
  64. Wang, J.; Liu, D. Larger diurnal temperature range undermined later autumn leaf senescence with warming in Europe. Glob. Ecol. Biogeogr. 2022, 32, 734–746. [Google Scholar] [CrossRef]
  65. Guo, Y.; Liu, H.; Ren, J.; Zhan, X.; Cao, S. Tree growth responses to vertical climate gradients in the central Tianshan Mountains. Quat. Res. 2007, 27, 322–331. [Google Scholar]
  66. Chen, L.; Huang, J.-G.; Stadt, K.J.; Comeau, P.G.; Zhai, L.; Dawson, A.; Alam, S.A. Drought explains variation in the radial growth of white spruce in western Canada. Agric. For. Meteorol. 2017, 233, 133–142. [Google Scholar] [CrossRef]
  67. Zywiec, M.; Muter, E.; Zielonka, T.; Delibes, M.; Calvo, G.; Fedriani, J.M. Long-term effect of temperature and precipitation on radial growth in a threatened thermo-Mediterranean tree population. Trees 2017, 31, 491–501. [Google Scholar] [CrossRef]
  68. Reinmann, A.B.; Susser, J.R.; Demaria, E.M.C.; Templer, P.H. Declines in northern forest tree growth following snowpack decline and soil freezing. Glob. Change Biol. 2019, 25, 420–430. [Google Scholar] [CrossRef]
  69. Lo, Y.-H.; Blanco, J.A.; Seely, B.; Welham, C.; Kimmins, J.P. Relationships between climate and tree radial growth in interior British Columbia, Canada. For. Ecol. Manag. 2010, 259, 932–942. [Google Scholar] [CrossRef]
  70. Linares, J.C.; Tíscar, P.A. Buffered climate change effects in a Mediterranean pine species: Range limit implications from a tree-ring study. Oecologia 2011, 167, 847–859. [Google Scholar] [CrossRef]
  71. Feng, X.; Lin, P.; Zhao, W. The physiological constraints of alpine treeline in Qilian Mountains. For. Ecol. Manag. 2022, 503, 119761. [Google Scholar] [CrossRef]
  72. Xu, G.; Chen, T.; Liu, X.; Wen, T.; Wang, W.; Wang, X.; Yao, Q.; Wu, G.; Zhao, C. Spruce trees have stronger drought sensitivity at low- than high-elevation sites across China’s aridity zones. Glob. Ecol. Conserv. 2024, 53, e03000. [Google Scholar] [CrossRef]
  73. Torbenson, M.C.A.; Stahle, D.W.; Villanueva Díaz, J.; Cook, E.R.; Griffin, D. The relationship between earlywood and latewood ring-growth across North America. Tree-Ring Res. 2016, 72, 53–66. [Google Scholar] [CrossRef]
  74. D’Orangeville, L.; Maxwell, J.; Kneeshaw, D.; Pederson, N.; Duchesne, L.; Logan, T.; Houle, D.; Arseneault, D.; Beier, C.M.; Bishop, D.A.; et al. Drought timing and local climate determine the sensitivity of eastern temperate forests to drought. Glob. Change Biol. 2018, 24, 2339–2351. [Google Scholar] [CrossRef] [PubMed]
  75. Moser, L.; Fonti, P.; Buntgen, U.; Esper, J.; Luterbacher, J.; Franzen, J.; Frank, D. Timing and duration of European larch growing season along altitudinal gradients in the Swiss Alps. Tree Physiol. 2010, 30, 225–233. [Google Scholar] [CrossRef]
  76. Van der Maaten-Theunissen, M.; Kahle, H.-P.; van der Maaten, E. Drought sensitivity of Norway spruce is higher than that of silver fir along an altitudinal gradient in southwestern Germany. Ann. For. Sci. 2013, 70, 185–193. [Google Scholar] [CrossRef]
  77. Yao, J.; Mao, W.; Chen, J.; Dilinuer, T. Signal and impact of wet-to-dry shift over Xinjiang, China. Acta Geogr. Sin. 2021, 76, 57–72. [Google Scholar]
  78. Long, M.; Knox, R.G.; Levine, N.M.; Entekhabi, D.; Swann, A.L. Ecosystem heterogeneity and diversity mitigate Amazon forest resilience to frequent extreme droughts. New Phytol. 2018, 219, 845–847. [Google Scholar] [CrossRef]
  79. Grime, J.P. Plant Strategies and Vegetation Processes; John Wiley & Sons: Chichester, UK, 1977. [Google Scholar]
  80. Di Filippo, A.; Biondi, F.; Čufar, K.; De Luis, M.; Grabner, M.; Maugeri, M.; Presutti Saba, E.; Schirone, B.; Piovesan, G. Bioclimatology of beech (Fagus sylvatica L.) in the Eastern Alps: Spatial and altitudinal climatic signals identified through a tree-ring network. J. Biogeogr. 2007, 34, 1873–1892. [Google Scholar] [CrossRef]
  81. Peñuelas, J. A big issue for trees. Nature 2005, 437, 965–966. [Google Scholar] [CrossRef]
  82. He, J.N.; Ning, C.W.; Zhang, W.T.; Halik, Ü.; Shen, Z.H. Altitudinal patterns of population structure dynamics of Picea schrenkiana in the northern slope of the eastern Tianshan Mountains. Acta Ecol. Sin. 2024, 44, 5389–5398. [Google Scholar]
  83. Alados, C.L.; Saiz, H.; Gartzia, M.; Nuche, P.; Escós, J.; Navarro, T.; Pueyo, Y. Plant-plant interactions scale up to produce vegetation spatial patterns: The influence of long- and short-term process. Ecosphere 2017, 8, 233–242. [Google Scholar] [CrossRef]
  84. Peet, R.K.; Christensen, N.L. Competition and tree death. BioScience 1987, 37, 586–595. [Google Scholar] [CrossRef]
  85. Fang, Y.; Liang, Z.; Zhang, Y.; Shi, Q.D.; Sun, X.J.; Li, J.M.; Li, X.; Dong, Z.T. Characteristics of altitudinal gradient changes in water retention of Tianshan spruce forest ecosystems. Ecol. Environ. Sci. 2023, 32, 1574–1584. [Google Scholar]
  86. Xi, L.; Li, S.Y.; Xia, X.Y.; Chen, Y.W.; Wang, J.; Ma, X.L.; Kenijialimu, M.Z.; Maimaiti, A.Y.; Wang, W.X. Effects of altitude, stand age, and canopy density on soil fertility in Picea schrenkiana forest. Chin. J. Ecol. 2023, 42, 2477–2485. [Google Scholar]
  87. Liu, G.F.; Ding, Y.; Zang, R.G.; Guo, Z.J.; Zhang, X.P.; Cheng, K.W.; Bai, Z.Q.; Ayoufu, B. Distribution patterns of Picea schrenkiana var. tianschanica population in Tianshan Mountains. Chin. J. Appl. Ecol. 2011, 22, 9–13. [Google Scholar]
  88. Ghotsa Mekontchou, C.; Houle, D.; Bergeron, Y.; Drobyshev, I. Contrasting root system structure and belowground interactions between Black Spruce (Picea mariana (Mill.) B.S.P) and Trembling Aspen (Populus tremuloides Michx) in boreal mixedwoods of Eastern Canada. Forests 2020, 11, 127. [Google Scholar] [CrossRef]
Figure 1. Map showing sampling site locations in the middle Tianshan Mountains.
Forests 16 00948 g001
Figure 2. The trends of mean monthly temperature and precipitation during 1959~2022.
Forests 16 00948 g002
Figure 3. (a) Trends of PCP (yearly total precipitation), (b) Tmean (yearly mean temperature), (c) Tmin (yearly mean minimum temperature), and (d) Tmax (yearly annual maximum temperature) in the study area from 1959 to 2022.
Forests 16 00948 g003
Figure 4. (a) Spatial distribution of PC1 and PC2 for the 12 standardized chronologies with EPS > 0.85 over the common period (1940–2022). Each altitude group is encircled by a 95% confidence ellipse, where red represents low the altitude group, green represents the mid altitude group, and blue represents the high-altitude group. SD represents the amplitude of the variation. (b) Temporal variation trends of PC1 scores for the low, mid, and high-altitude groups during the same period (1959–2022) in relation to climate data. The low altitude group is represented by red circle, the mid altitude group is represented by green circle, and the high-altitude group is represented by blue circle.
Forests 16 00948 g004
Figure 5. The correlation heatmap of the characteristic chronologies for each altitudinal group and different climatic factors (1959–2022). The time range from June of the previous year to September of the current year is shown as p6–c9. * signifies p < 0.05, ** signifies p < 0.01, and *** signifies p < 0.001.
Forests 16 00948 g005
Figure 6. Relative importance of key climatic factors for tree radial growth in different altitudinal groups. The low-altitude group includes c6 scPDSI, p9 DTR, and c5 PCP, which represent the drought index in June of the current year, the mean diurnal temperature range (DTR) in September of the previous year, and precipitation in May of the current year, respectively. In the mid-altitude group, c5 scPDSI, p9 DTR, and p6 DTR represent the drought index of May of the current year, the mean diurnal temperature range (DTR) of September of the previous year, and the mean diurnal temperature range (DTR) of June of the previous year. The high-altitude group consists of p9 DTR, p8 Tmax and c5 PCP which refer to the mean diurnal temperature range (DTR) in September of the previous year, the mean maximum temperature (Tmax) in August of the previous year and the precipitation in May of the current year, respectively.
Forests 16 00948 g006
Figure 7. Partial effect plots from generalized additive models (GAM) depicting the relationships between best explanatory climate variables and characteristic chronologies of each altitude group (ai). Variable definitions as in Figure 6. Solid lines represent fitted partial effects, with gray shading indicating 95% confidence intervals. p-values and effective degrees of freedom (edf) are annotated in each panel.
Forests 16 00948 g007
Figure 8. Changes in the correlation coefficients between radial growth and temperature and precipitation at different altitudes. Climate variables include mean temperature in May of the current year (a), precipitation in June of the previous year (b), precipitation in June of the current year (c), precipitation in July of the previous year (d), and precipitation in July of the current year (e); mean temperature in May of the current year (f), mean temperature in June of the previous year (g), mean temperature in June of the current year (h), and mean temperature in July of the current year (i). The shaded area in each figure represents the 95% confidence interval, and the solid line represents the fitted line.
Forests 16 00948 g008
Figure 9. Scatter plots illustrating the relationship between competition index (SBA) and cumulative growth at different time intervals across the altitude gradient. (a) 10-year interval; (b) 20-year interval; (c) 30-year interval; (d) 40-year interval. The blue line represents the fitted line, and the gray area shows the 95% confidence interval. Each subplot includes the regression equation and the coefficient of determination (R2).
Forests 16 00948 g009
Figure 10. Tree basal area increment (BAI) in relation to competition (CI), temperature (TMP), precipitation (PRE), age (Age)in different altitude categories for the last 40 years, as shown in Figure 9. Panels (ac) show the locations of low-, medium-, and high-altitude groups, respectively. Tree growth rate is positively correlated with the “blue bars” and negatively correlated with the “red bars” when looking at the different predictor variables. Significant effects are indicated by asterisks: * p < 0.05, ** p < 0.01 and *** p < 0.001.
Forests 16 00948 g010
Table 1. Standardized chronologies for each plot. The time span (the total length of the sample), MS (mean Sensitivity), SD (standard deviation), AR1 (autoregressive model of order 1), R (correlation between series), SNR (signal-to-noise ratio), and EPS (expressed population signal). EPS > 0.85 means that the sub-signal strength of the sample exceeds 0.85 from that year on.
PlotAltitude (m)Core (Tree)Time SpanMSSDAR1RSNREPS > 0.85
A150739 (20)1902–20220.360.340.210.3822.780.96 (1940)
B160340 (20)1933–20220.340.300.080.4932.670.97 (1938)
C170340 (20)1886–20220.350.400.370.6151.000.98(1908)
D180738 (19)1897–20220.290.340.170.3823.410.96(1924)
E190040 (20)1894–20220.270.370.400.4735.620.97 (1919)
F203040 (20)1768–20220.220.520.680.3317.940.95 (1925)
G210639 (20)1751–20220.200.320.730.4933.890.97 (1890)
H222139 (20)1731–20220.170.380.860.5035.290.97 (1753)
I232037 (19)1724–20220.220.330.680.3511.190.92 (1856)
J241531 (17)1711–20220.170.250.510.2911.560.92 (1839)
K253034 (18)1701–20220.190.420.720.4520.490.95 (1803)
L267036 (19)1747–20220.160.230.480.2911.850.92 (1849)
Disclaimer/Publisher’s Note: The statements, opinions and data contained in all publications are solely those of the individual author(s) and contributor(s) and not of MDPI and/or the editor(s). MDPI and/or the editor(s) disclaim responsibility for any injury to people or property resulting from any ideas, methods, instructions or products referred to in the content.

