Article

The Audiovisual Assessment of Monocultural Vegetation Based on Facial Expressions

Key Laboratory of Cold Region Urban and Rural Human Settlement Environment Science and Technology, School of Architecture and Design, Harbin Institute of Technology, Ministry of Industry and Information Technology, 92 Xidazhi Street, Nangang District, Harbin 150001, China
*
Author to whom correspondence should be addressed.
Forests 2025, 16(6), 937; https://doi.org/10.3390/f16060937
Submission received: 24 April 2025 / Revised: 20 May 2025 / Accepted: 29 May 2025 / Published: 3 June 2025
(This article belongs to the Special Issue Soundscape in Urban Forests - 2nd Edition)

Abstract

:
Plant vegetation is nature’s symphony, offering sensory experiences that influence ecological systems, human well-being, and emotional states and significantly impact human societal progress. This study investigated the emotional and perceptual impacts of specific monocultural vegetation (palm and rubber) in Nigeria, through audiovisual interactions using facial expression analysis, soundscape, and visual perception assessments. The findings reveal three key outcomes: (1) Facial expressions varied significantly by vegetation type and time of day, with higher “happy” valence values recorded for palm vegetation in the morning (mean = 0.39), and for rubber vegetation in the afternoon (mean = 0.37). (2) Gender differences in emotional response were observed, as male participants exhibited higher positive expressions (mean = 0.40) compared to females (mean = 0.33). (3) Perceptual ratings indicated that palm vegetation was perceived as more visually beautiful (mean = 4.05), whereas rubber vegetation was rated as having a more pleasant soundscape (mean = 4.10). However, facial expressions showed weak correlations with soundscape and visual perceptions, suggesting that other cognitive or sensory factors may be more influential. This study addresses a critical gap in soundscape research for monocultural vegetation and offers valuable insights for urban planners, environmental psychologists, and restorative landscape designs.

1. Introduction

The uniqueness of Nigerian vegetation is in its ability to naturally sustain different species of wildlife, vegetation, and water bodies; provide food; promote tourism; and yet support scientific research opportunities [1,2]. However, each vegetation has its distinct ecosystem with different features. The Nigerian vegetation ecosystem can be diverse/mixed or monocultural, with the most diverse vegetation found in such locations as Abuja Millennium Park [3], Obudu Mountain Resorts Cross River [4,5], Ikyogen Cattle Ranch Benue State [6], and Oba Hills Forest Reserves, etc., which have been studied with focus on sustainability, conservation/preservation, economic benefits, and tourism value. On the other hand, monocultural vegetation also exists in Nigeria, such as the famous Ngwo Pine Forest Enugu, Ada Palm Plantation Imo, Enghuat Rubber Plantation Warri [7], and Umunanta Rubber Plantation Imo State, etc. These monocultural vegetations represent a major land use system with socio-economic and cultural importance [8] that contribute to the local communities through employment, material resources, and export revenues. However, they support less biodiversity and provide ecological benefit when compared to diverse/mixed-species vegetation [9]. Their simplified ecological structure reduces environmental complexity, which can influence human perception, visual appeal, and emotional response. Studying monocultural plantations allows the isolation of specific sensory and emotional effects, thereby addressing a critical gap in soundscape and restorative landscape research.
The Nigerian ecosystem is characterized by abundant forests with different vegetation belts holding numerous types of value, including economic, ecological, tourism, social, and cultural. These vegetation belts are divided into two categores: (a) forest zones and (b) savannah ecological zones. However, both zones are further divided into three sub-groups each. The forest vegetation belt is divided into (i) mangrove swamp forest, (ii) freshwater swamp forest, and (iii) montane/rainforest vegetation [10], while the savannah zone is divided into (i) Sahel savannah, (ii) Guinea savannah and (iii) Sudan savannah [11]. These forest ecosystems are comprised of various natural sounds, including those produced by different species of primates, hornbills, and turaco birds of the Guinea savannah. These sounds vary across different times, seasons, and locations and are significantly influenced by human activities impacting the forest ecosystem. Forests contribute majorly to the value of the ecosystem [12], promoting the good health and longevity of the natural and built environment [13]. They also play an essential role in the natural water cycle, regulating nitrogen and carbon, as well as providing critical habitats for different flora and fauna [14], which in turn promotes biodiversity [15] and contributes to resolving negative climate changes [8,9]. Vegetation has the capacity to support human livelihoods through the provision of nutritious food that enhances dietary diversity [16], as well as wood, fuel, medicines, finance, income, and employment through various supply chains [17]. Continuous visual exposure to greenery has been associated with enhanced psychological perception in humans [18,19]. In addition, the interaction with natural vegetative environments has the potential to reduce stress, promote positive emotional states, and improve both mental health and overall well-being [20,21]. Recent research has demonstrated that exposure to natural vegetation scenes contributes to stress reduction, enhances mood, promotes positive mental health, and facilitates quick recovery from physical and psychological illnesses. Building on this foundation, current studies [22] further reveal that the sounds of birds, wind, and water are amongst the many components of the natural world that are easily accessible in human daily life, with research showing that these natural sounds generated from natural vegetation have positive effects on humans, including enhancing relaxation and improving human cognitive reasoning [22,23,24,25,26]. Despite the growing body of knowledge on how vegetation improves the quality of human life, much research has focused on diverse vegetation types, mainly due to their abundance, while few studies have elaborated on how monocultural vegetation can positively affect human well-being. Thus, this research seeks to address that gap.
As demonstrated in previous studies [27,28,29], forests typically makes up a higher percentage of the natural visual landscape and play an important role in soundscape perception. As the perception of natural sounds influences the quality of our lifestyles and recreational conditions [30,31], there has been a significant increase in environmental soundscape research in the last decade [32]. According to International Standard Organisation (ISO 2014) [33], soundscape is defined as the acoustic environment as perceived or experienced and/or understood by humans. It represents a step change in the environmental acoustics field, since it combines social, physical, and psychological approaches [32]. However, [34,35] emphasized that the most important factor in soundscape is how the acoustic environment is perceived and assessed by people within the context of time, place, and activity. Unlike other environmental noise management approaches where sound is perceived as a waste [34], other researchers of environmental and natural sounds view sound as a resource rather than a waste [31,32,35]. Conventionally, soundscapes are studied and analyzed via in situ experiences, laboratory experiments, or narrative interviews [36]. Currently the assessment of soundscape via audiovisual interactions has gained a higher ground, as many researchers have identified that audiovisual interactions can significantly influence the results of soundscape perception, the reason being that audio and visual feelings are paired; the attention paid to visual cues may consciously change the perception of sound and vice versa [37]. The perception of soundscapes in forests, urban centers, and natural landscapes has been analyzed [38,39,40] with a focus on diverse vegetation types and landscape features.
However, despite a growing body of research on the restorative effects of natural environments, many studies have overlooked the unique characteristics of monocultural vegetation types, thereby increasing the research gap which this study addresses by evaluating monocultural plantation and its soundscape perception via audiovisual interactions. In summary, the literature has shown that audiovisual interactions are important and affect the cognitive and multisensory processing of data in humans [41,42]. Motivatedied by research gap, [43] explored the perception of forest soundscapes in Beijing Eastern Suburban Forest Park by analyzing audio segments and questionnaire responses based on eight quality attributes outlined in ISO 12913. However, the study selected a natural forest without defining its key landscape features, a crucial factor influencing human perception of forest soundscapes. Similarly, [44] investigated natural sounds in urban greenery in Sweden, assessing their potential for nature preservation. Using questionnaire surveys, the study examined people’s perceptions of natural sounds across various vegetation types. However, the study did not consider vegetation species dominance as a key factor that could influence the perception of natural sounds or overall soundscape.
Since the introduction of the soundscape concept, the interaction between sound and visuals has been integrated into soundscape research, especially in the field of urban planning [45], and the significance of audiovisual interactions on soundscape perception is still in use up to now. Currently the goal of soundscape perception is not limited to the evaluation of traffic or soundscape. Rather, it is deeply rooted into the total optimization of soundscape design itself [29,45]. Classical studies have explored how the interaction between visual and auditory elements in an environment affects aesthetic appeal and emotional responses. Research has shown that natural and animal sounds enhance the perceived quality of a setting [30] and research participants preferred auditory-visual pairings that were harmonious and consistent [46]. Another study revealed that in terms of audiovisual pairings, the exposure to natural environments can improve mental health and human well-being [47]. As audiovisual research continues to grow, a recent study of the effects of different audiovisual landscapes, based on eye-tracking experiments, was explored in a single-plant vegetation forest (bamboo) in the Southern Sichuan Bamboo Sea [48]. The results showed that the soundscape guided participants’ visual attention toward a focus on natural elements, and the visual restorative properties of recreational and ornamental bamboo spaces were perceived better in terms of their visual aspect than those of pathway and cultural-type spaces. This study transitions to a shift in the selection of vegetation types for audiovisual interactions when compared to the last few decades when research conducted via audiovisual experiments has been focused on diverse-vegetation forests. Hence, this study will provide further and future highlights for the understudied field of restorative environments.
The human face is made up of static features (nose, eyes, and mouth) which are important to our interpersonal interactions. Paul Ekman, a leading researcher on facial expressions, states that there are a thousand ways our face can move [49,50]. These facial movements are known facial expressions and are the primary expressions of human emotions, and these emotions are solid expressions of how we feel in any event or occurrence. In visual emotion recognition, facial expression is widely utilized to identify human emotions, and its corresponding data are easy to acquire [51]. Human facial emotions are the most familiar facial expressions and a key topic for many disciplines in psychology [52,53,54] because they allow for the central understanding of human behavior, either social, cognitive, or even clinical. Previous research relied on the analysis of emotions via standardized images in understanding how human facial reaction [53,55], where facial reaction is analyzed only on the basis of visual perception of various images. Although this has played an important role in the development of facial science [51], there is need to provide clearer evidence to determine how human faces react to situations, events, sounds, and natural environments in real-time. This research focused on assessing the changes and differences in human facial expressions when exposed to different monocultural vegetation via audiovisual interactions, hence allowing the further assessment of soundscape and visual perception.
The importance of studying human facial expression cannot be overlooked, as previous research helped to provide accurate classification of emotions and determine higher and lower emotional levels [56]. Facial expression recognition method is a potential tool for predicting urban sound perception since it can correctly and in real time gather human perception data from facial photos and videos [57]. This field of research, although it has been explored, still requires further and in-depth work to highlight aspects of single-plant vegetation forests that have been insufficiently studied when compared to diverse forests. This gap in knowledge provides the basis for further investigation, within this study focusing on the understudied monocultural plantations in the eastern region of Nigeria. Therefore, this research paper aims to determine and assess the human facial expression responses to single-plant vegetation forests, assessing soundscape and visual perception through audiovisual interactions, which will be achieved through the following objectives:
(1)
Determine via audiovisual interactions the significant differences in human facial expression when exposed to different monocultural vegetations.
(2)
Assess the difference and relationship between human soundscape and visual perception of each monocultural vegetation.
(3)
Explore the relationship between soundscape perception of monocultural vegetation and facial expression.

2. Materials and Methods

2.1. Selection Criteria and Sound Sources
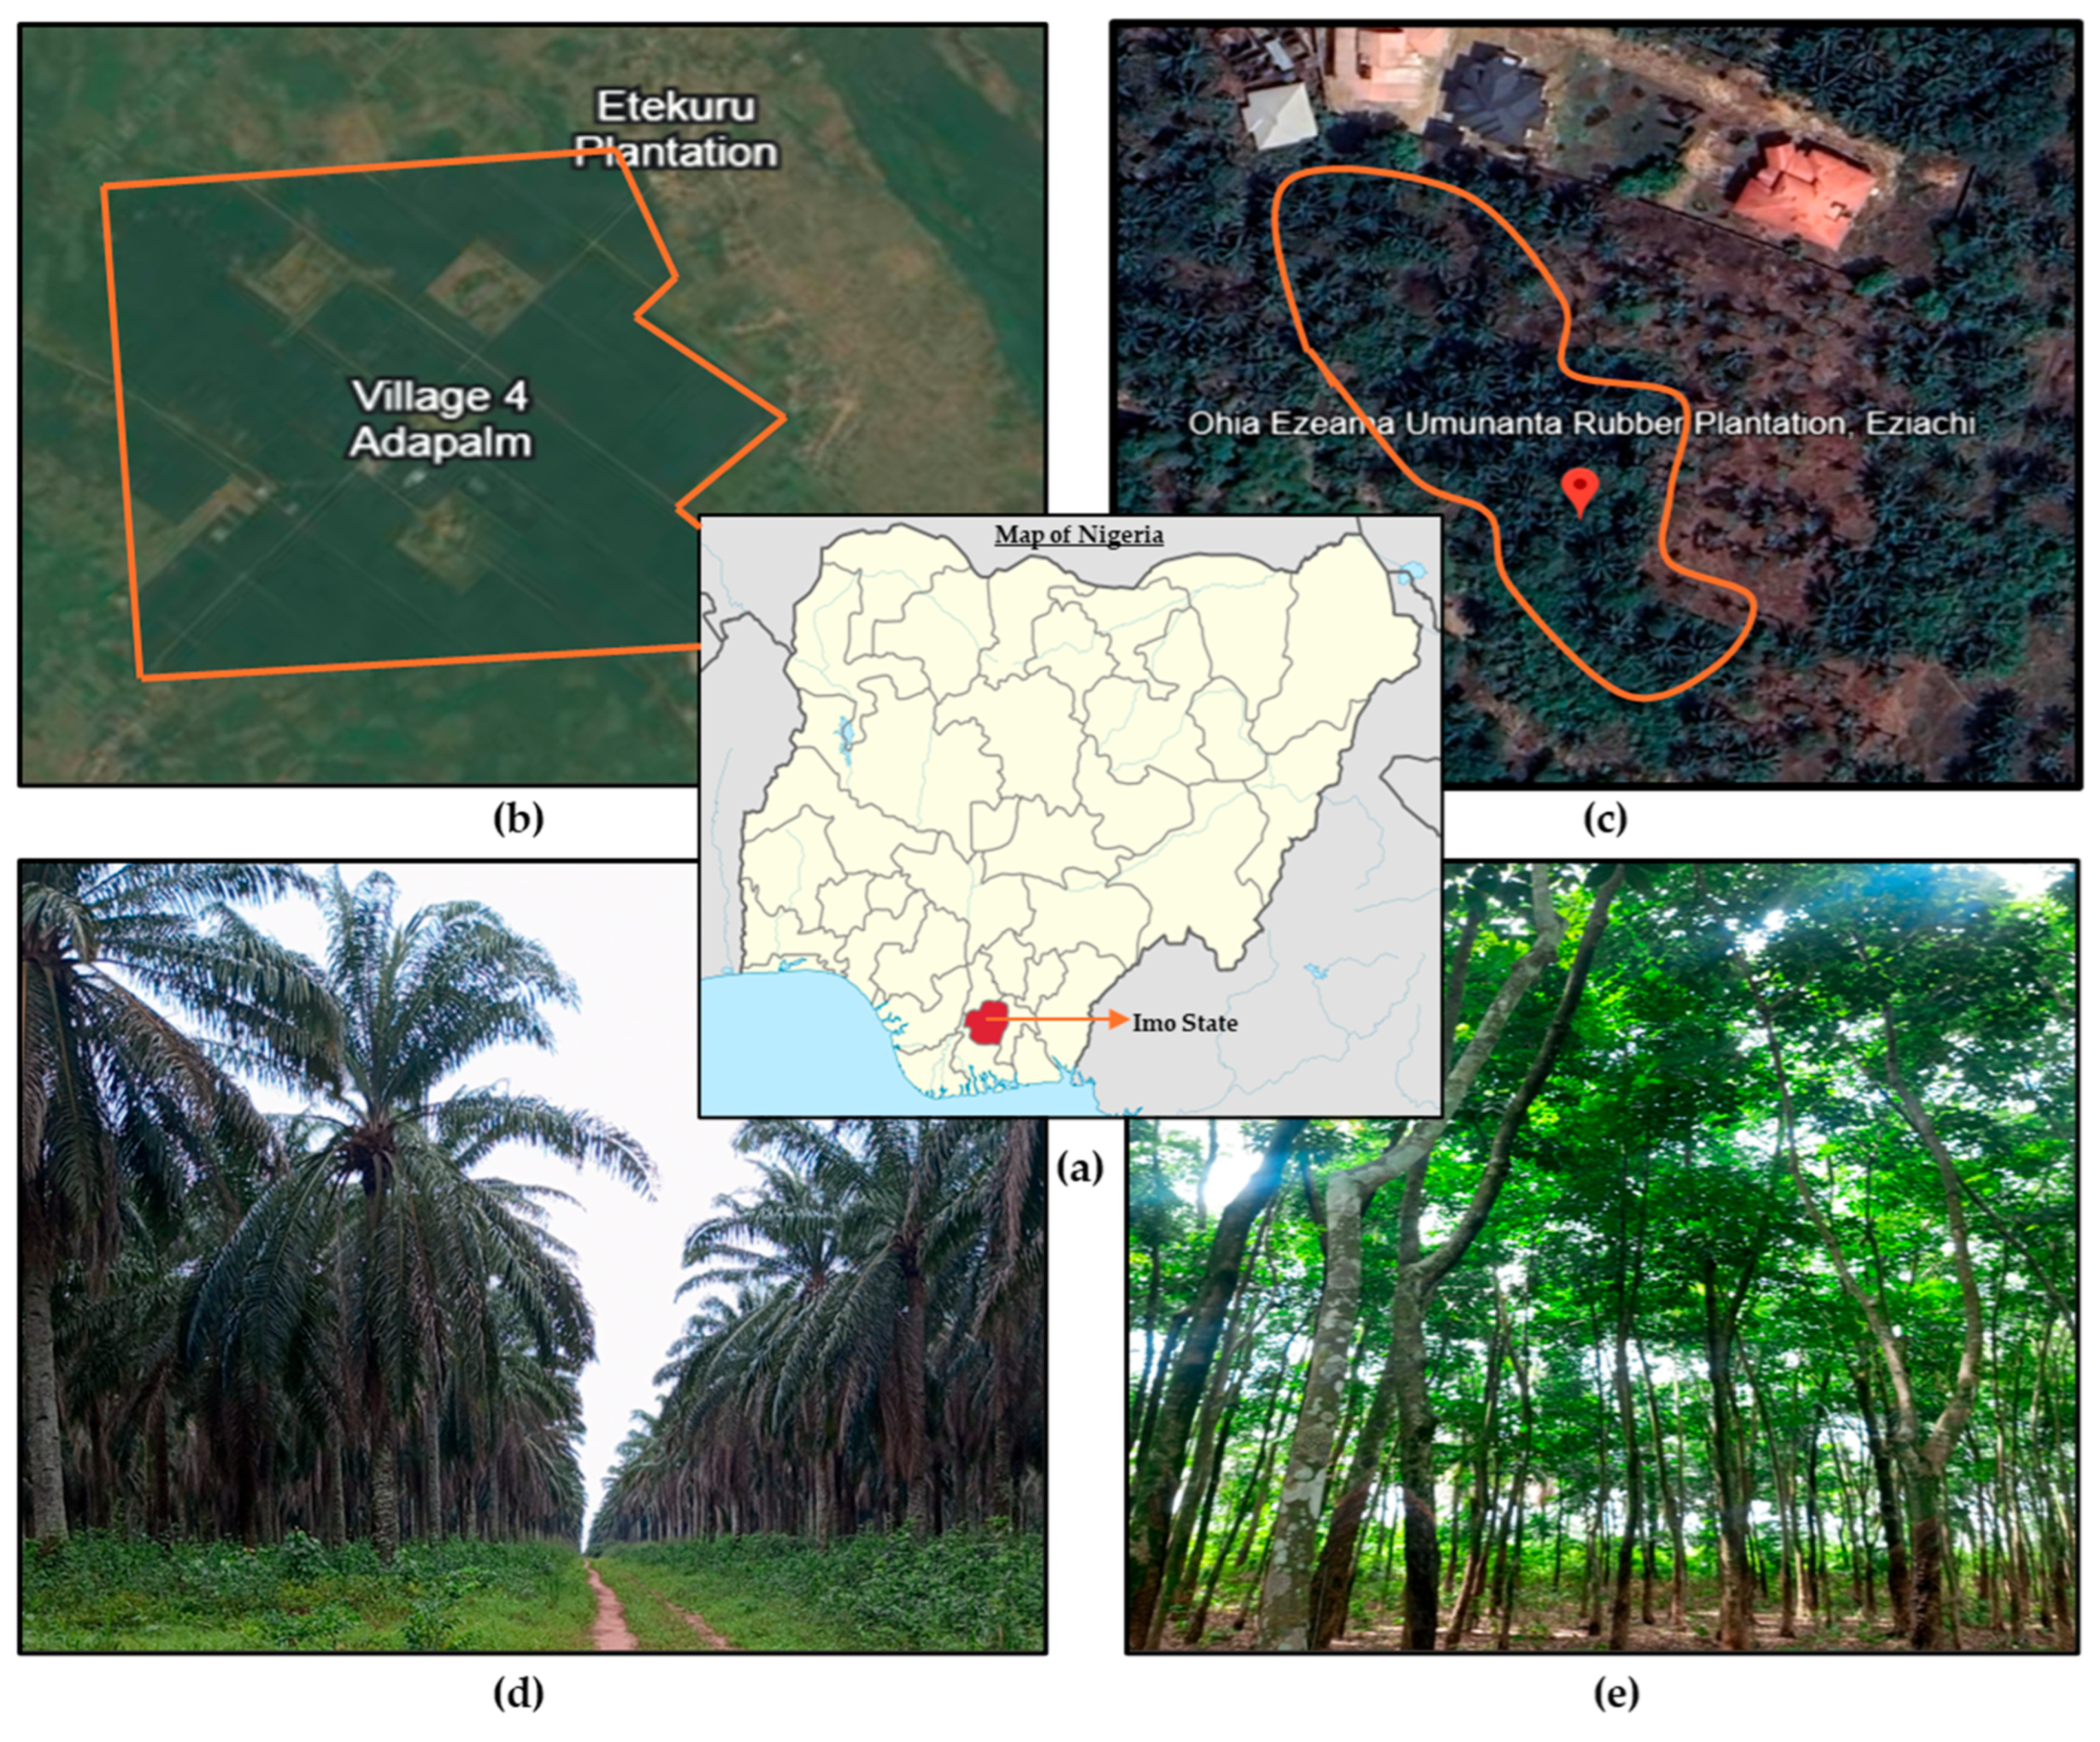
The selection of the study area that conforms to the aim of the research was based on two key criteria. The forest vegetation must consist of (1) ≥75% of a singular type of natural vegetation based on studies by [48]. (2) It must have economic value as a source of food, timber, and/or raw materials. Recognizing the economic value of the study area is essential for integrating ecological preservation with sustainable development, especially in regions were these vegetation resources are central to livelihoods. Thus, these requirements gave rise to the selection of the two study areas for purposes of this research, which are (1) Ada Palm (Elaeis guineensis) Forest Plantation Imo State and (2) Umunanta Rubber (Hevea Brasiliensis) Plantation Imo State. The selection of the plant type to be explored was also based on its significance. From research [58,59], Elaeis guineensis is the most important plant in West and Central Africa as far back as pre-colonialism. It is a plant used to represent culture, tradition, wealth, and spirituality, especially in eastern parts of Nigeria, hence its selection [60]. On the other hand, the selection of rubber plant for this study was influenced by cultural history, as the rubber plantation was child-friendly. This was due to its characteristic of producing seeds and flowers, which attracted more avian species and people. People, both children and adults, were also attracted to the typical rubber plantation out of curiosity to see and experience how the rubber sap was tapped.
These logical reasons—bonded by culture, distinct physical characteristics, and economic value—influenced the selection of these two notable plants for research purposes. The determination of whether the vegetation was monocultural was carried out through the calculation of percentage of vegetation cover, using the grid system formula below. Each vegetation consisted of mainly natural sounds from different bird species; the Ada palm vegetation was a major source of food that attracted more bird species, such as the famous “Okwa” (Francolin) and “Ugo” (Eagle), while the Umunanta rubber vegetation consisted of natural sound sources from birds such as “Egbe” (Kite) and “Ashaa” (Village Weaver). Although both vegetations consisted of majority natural-sound sources, they also showed minimal anthropological sounds and crickets chirping. Table 1 shows the selection criteria and sound sources of each selected study area. Below is the grid system formula used in the study:
Vegetation % Coverage = Squares of vegetation/Total squares × 100

Study Area

Ada Palm Forest Plantation is located at latitude 5°27′40″ N and longitude 6°50′15″ E in Ohaji Local Government Imo State Nigeria, as shown in (Figure 1). Ohaji Local Government is an autonomous community known for rich cultural preservation and agriculture. Ada Palm Forest Plantation is referred to as the largest palm plantation in Nigeria. The palm plantation spans about 4310 ha of land and is of the family of (Arecaceae). The primary species of palm found in the Ada Palm Forest Plantation is Elaeis guineensis. This species is characterized by large, fan-shaped leaves and serves as a major economic source of palm oil and traditional crafts. Its products are processed for both local consumption and international export. The average height of Elaeis guineensis ranges from 6 to 8 m, allowing it to provide significant shelter from solar radiation, which contributes to lower ambient temperatures and enhanced comfort. Historically, Elaeis guineensis played a vital role in sustainable building practices, with its large leaves woven into roof coverings for houses constructed from natural clay. Given its economic, environmental, and cultural significance, the preservation of Elaeis guineensis is crucial. In addition, the Elaeis guineensis species possesses significant cultural and religious meanings to the eastern region of Nigeria; used in cultural ceremonies, it symbolizes victory, superiority, peace, abundance, and strength.
Umunanta Rubber Plantation lies within latitude 5°46′02″ N and longitude 7°04′29″ E in Eziachi Imo State Nigeria. Hevea brasiliensis, a specie native to Brazil, and commonly known as the rubber tree, is harvested for its latex, which is refined into rubber and utilized in commercial production and processing. This species is a valuable commercial tree, typically cultivated in plantations for economic purposes. The latex, which exudes from the stem when the tree is tapped or wounded, is the primary product of the Hevea brasiliensis, making it a critical resource in various industries. The Umunanta Rubber Plantation has existed since the early 19th century. Before the discovery of oil, rubber was a crucial agricultural commodity that significantly contributed to the Nigerian economy. Its cultivation provided substantial employment opportunities, particularly for people in the midwestern and eastern regions of Nigeria, including present-day Edo and Delta States. Rubber trees (Hevea brasiliensis) are characterized by their relatively few branches, glossy leaves, and flowers that produce fruits and seeds that split to release seeds. Additionally, rubber trees play a vital role in promoting biodiversity. Their flowers attract various avian species, which enhances the ecological balance within their environment.

2.2. Video and Sound Recording

An in situ video recording was conducted at each study area location. Four different sampling locations were randomly selected on the basis of proximity to better natural sounds. Evidential research has assessed the viability of using iPhone recordings for acoustic measurements and suggests that iPhones are useful tools and that results are comparable in quality to those captured with conventional acoustic instruments [61,62]. Hence, due to its advanced built-in microphone array and high-fidelity recording capabilities, this study adopted the use of an iPhone 13 (Apple Inc, Cupertino, CA, USA) for its video recording of the vegetation and audio recording of sound. The video recording of each monocultural vegetation lasted for a duration of 3 min. For video recording, the instrument was mounted on a Zhi Yun Smooth 5 Gimbal stabilizer (Guilin, China), and recording was done at a height of 1.5–1.8 m [63]. The video recordings were done during the dry season at different times of day, i.e., morning (10 AM) and afternoon (3 PM) in the month of July 2024. A total of four videos recording sessions was collected, totaling 12 min, and was analyzed using a licenced Noldus FaceReader 9.0. Additionally, multiple photographs of each study area were taken at 10:00 AM and 3:00 PM to facilitate the evaluation of visual stimuli. This approach was essential for comparing the distinct visual characteristics of rubber and palm vegetation, as both species exhibit different physical features. The sound recording was done post video recording, by random selection of the area with better natural sounds in each single-plant vegetation. Each sound recording lasted for 60 s [64] in each vegetation and was carried out with the aid of an adjustable tripod at the height of 2.0 m [65]. The audio recording was used to analyze the soundscape perception of each monocultural vegetation and aided in the identification of distinct avian species found in each vegetation. The unique differences and similarities obtained from each in situ audio and video recording also contributed as a basis for subjective analysis and interpretation of results.

2.3. Research Participants

A total of 40 people participated in this research. The selection of participants ensured representation across all ages, genders, and familiarity with natural environments. Participants were local residents of the country, both students and working adults. The sample size (N = 40) included 24 (60%) males and 16 (40%) females, aged between 18–60 years. However, 15 (9 males, 6 females) people out of the 40 participants participated in the three parts of the research, including facial expression (visual, audio, and audiovisual), while the remaining 25 participated in 2 parts of the research (visual and audio). The participants’ age percentages are (18 yrs) 2.5%, (19–30) 42.5%, (31–40 yrs) 37.5%, and (41–60) 17.5%.
The sample size of participants (N = 40) was determined and guided based on methodological consistency with previous studies on audiovisual perception and facial expression recognition techniques [28,66]. In addition to the use of objective measurement tools, such as Noldus FaceReader 9.0, the research participants were exposed to multiple stimuli (visual, audio, and audiovisual), resulting in repeated observations per subject, which enhanced the statistical power and validity of the findings. Therefore, the chosen sample size was considered appropriate for the exploration and controlled nature of this study.
This sample size aligns with sample sizes used in previous studies investigating similar perceptual responses, as commonly reported in experimental soundscape and audiovisual interaction research [28,29,67]. Adequate findings have been recorded with sample size ranging from 15–40. Hence the sample size in this research is deemed sufficient to capture meaningful perceptual responses to natural soundscape and vegetation interactions.

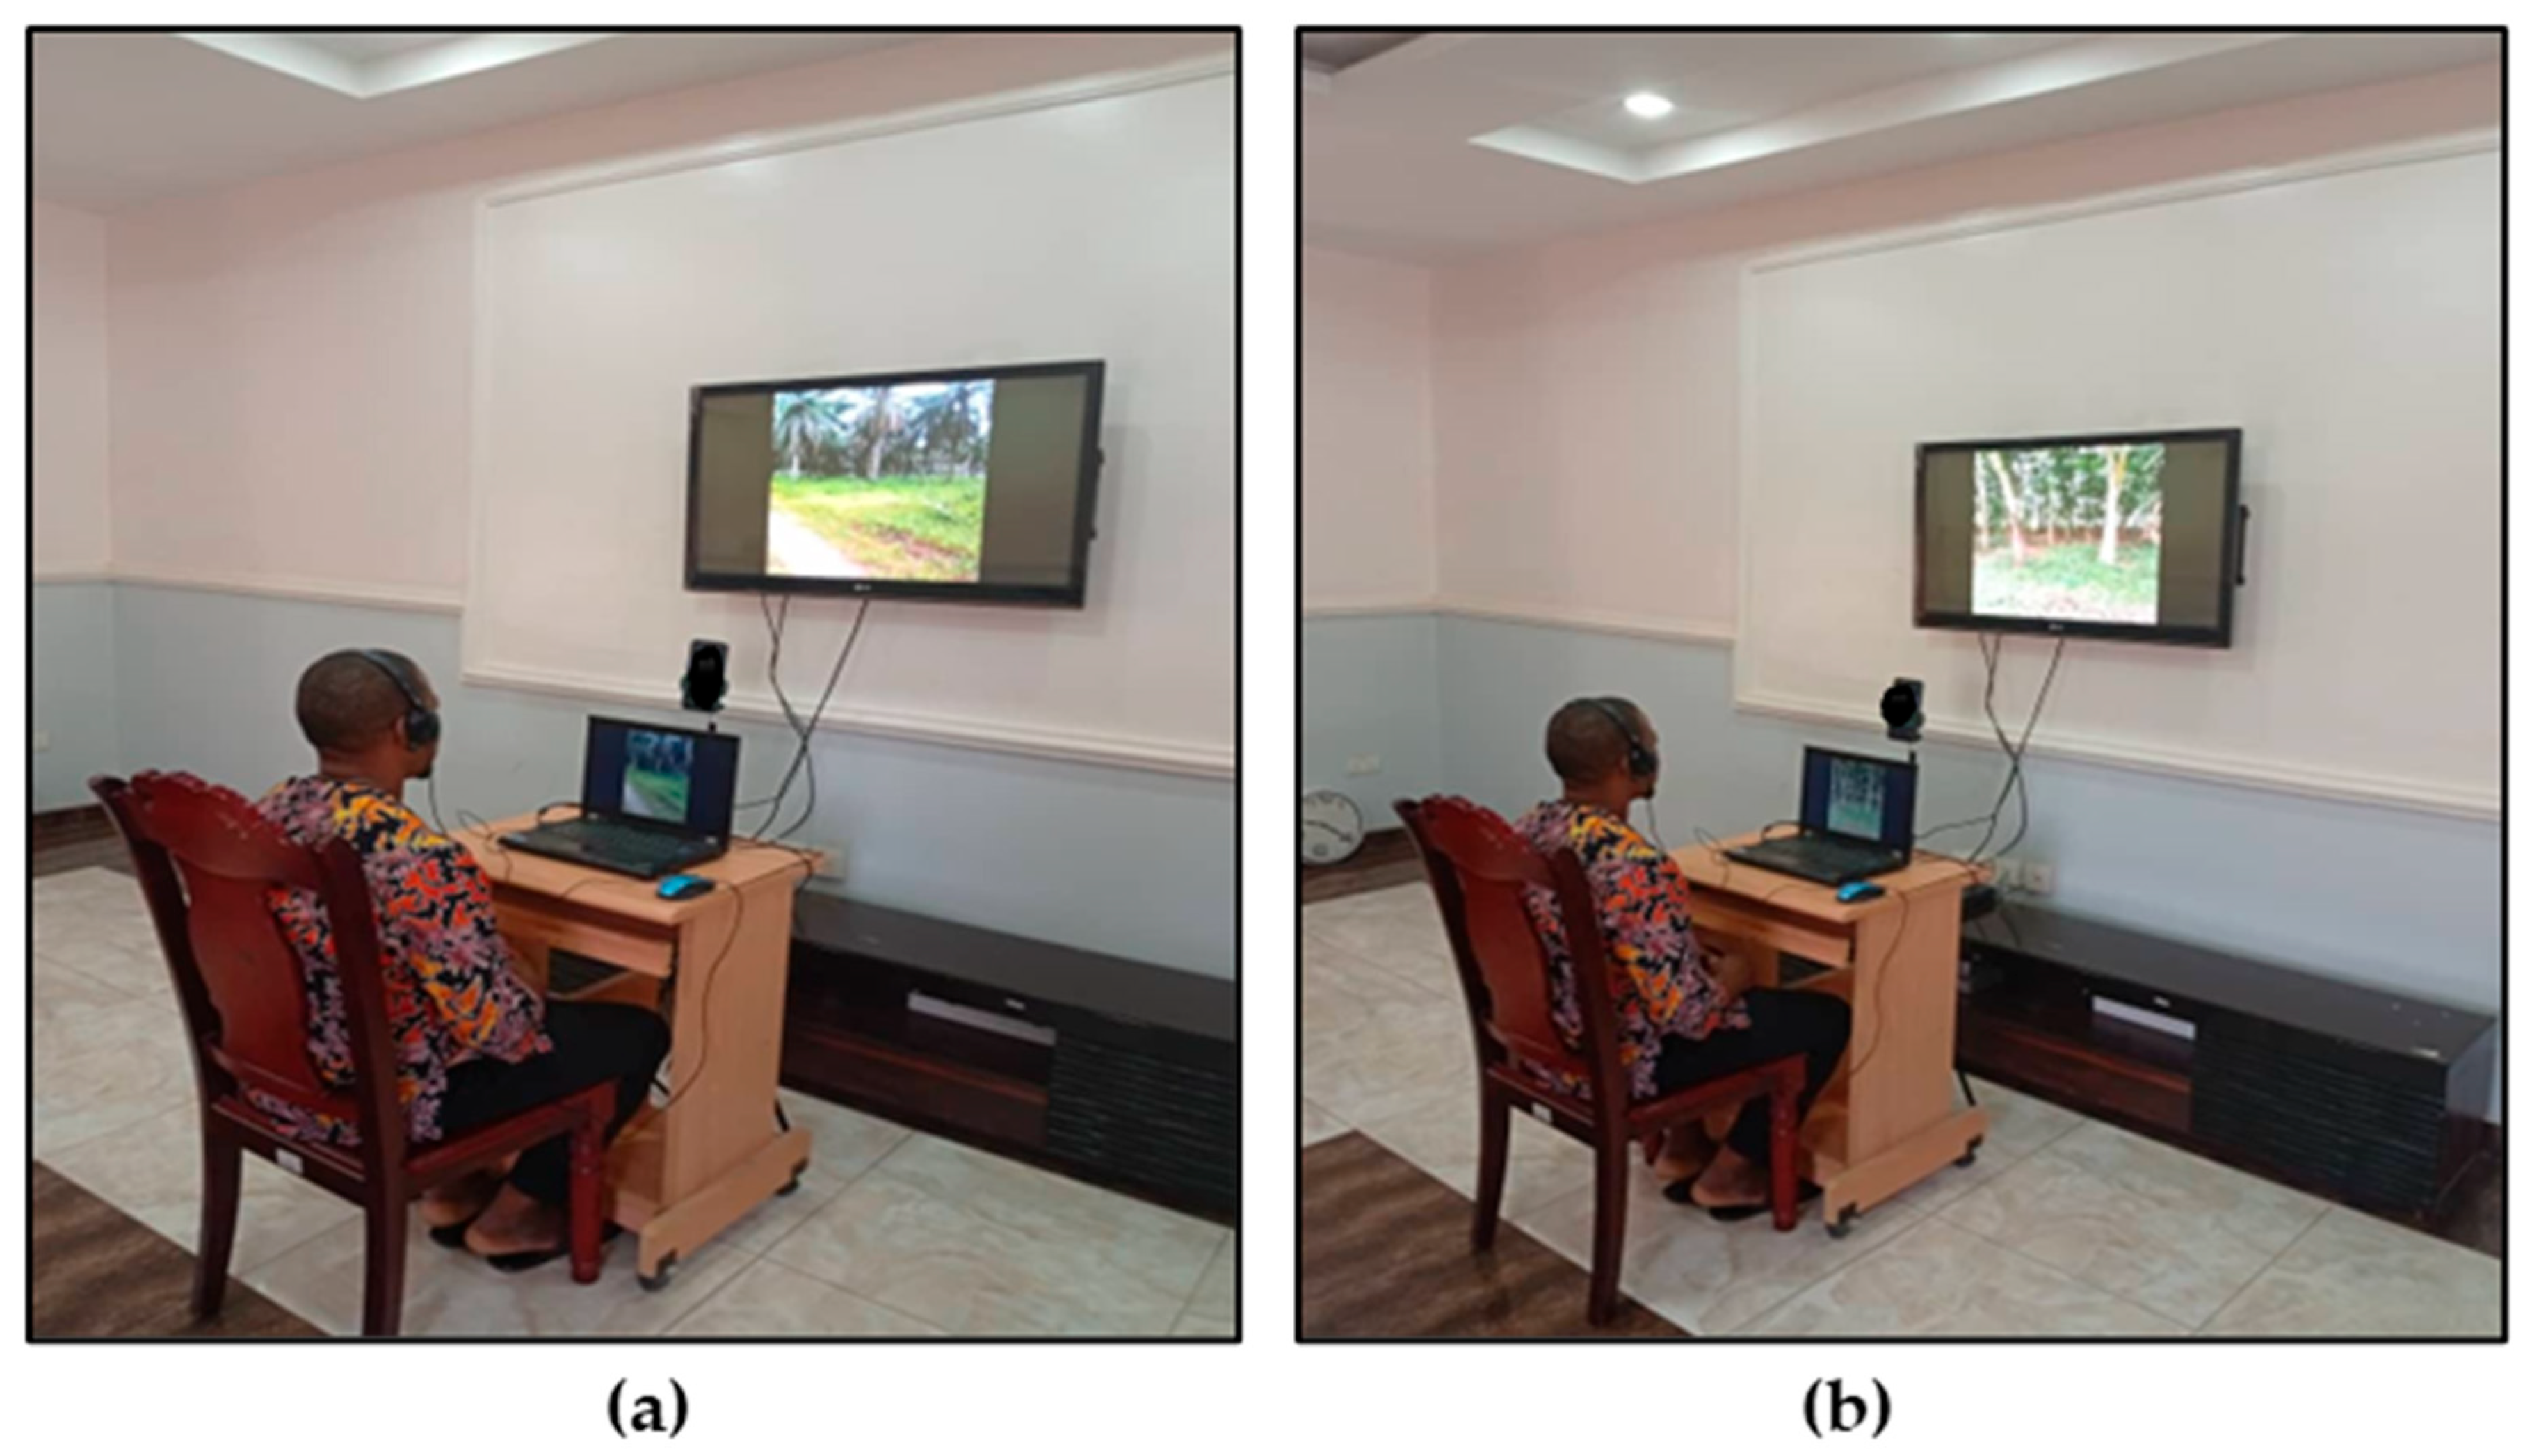
2.4. Laboratory Experiments

The experiment was conducted based on the idea of Dores et al., which states that laboratory experiments are a conventional method for studying emotional perception, recognition, and presentation of facial expressions [68]. Hence, the audiovisual interaction experiment was conducted in a temporarily set up laboratory. The temporary laboratory was a well-ventilated, quiet, and private living space set up similarly to previous studies [57,64]. The laboratory had an average background noise level of 35.4 dB, measured using a digital sound level meter (AS824, Dongguan, China), an instrument with a microphone that captures and accesses sound by measuring sound pressure levels in decibels (dBA). Each participant was given prior information on the nature of the experiment and the data protection consent form, and willingly consented to participate in the experiment. Participants were also asked to state if they had any hearing or vision impairment which was not recorded. Figure 2 shows the laboratory set-up, which consisted of a wall-mounted digital screen where the audio, visual, and audiovisual recordings were projected. An adjustable tripod stand was used to support the facial recording instrument, and a noise-masking headset was used to listen to each recording.
The laboratory experiment involving participants lasted for a duration of 1 month. The experiment was divided into three parts, namely visual, audio, and audiovisual for each single-plant vegetation [28,29]. The visual experiment was first conducted via a series of images of a single-plant vegetation viewed for about 15–20 s. The audio experiment was conducted second, and each participant listened to each 60 s audio recording of palm vegetation and rubber vegetation. The audiovisual/facial expression experiment was conducted third; the 3 min video of each monocultural vegetation (morning and afternoon session) was played on the wall-mounted screen, and an iPhone 13 was used to take video of participants’ facial expressions. Facial expression can be measured in real time or from video recording; however, this research measured facial expression from the videos recorded. The videos were saved in mp4 format and transferred to a Dell laptop (Austin, TX, USA) for batch analysis using Noldus FaceReader 9.0. Participants were given enough time to relax before starting the experiments, as well as enough time to decide when they wished to start the next video. After watching each 3 min video, a 3–5 min break was given to participants to relax and rest. Hence, the experiment lasted for approximately 25–35 min per person [65,69]. This audiovisual experiment was carried out to obtain objective and subjective information on the participants’ facial expressions in response to two different monocultural vegetations and soundscapes.

Questionnaire Design

A questionnaire survey was important to access the visual and soundscape perception of the monocultural vegetations. Participants were given a 5 min questionnaire to fill regarding the soundscape perception, appropriateness, and visual appeal of each monocultural vegetation (both rubber and palm) audio they listened to and viewed. Hence, a total of two sets of questionnaire data were obtained, one for each of the two study areas analyzed. The questionnaire was structured into three sections, as shown in Table 2. Each semantic differential pair for the analysis of soundscape and visual perception was rated on a 5-point Likert scale from (−2 to +2) according to previous research [70,71]. A total number of 13 questions were asked; the first section answered questions about participants demographics and socioeconomic characteristics. The second section answered questions regarding the overall soundscape based on five semantic differential pairs: annoying–pleasant, chaotic–calm, uneventful–eventful, monotonous–vibrant, and inappropriate–appropriate [72]. Meanwhile, the third section assessed the overall visual perception based on four semantic differential pairs: ugly–beautiful, natural–artificial, anxious–relaxed, and uncomfortable–comfortable [36].

2.5. Analysis

To determine the significant differences in human facial expression when exposed to different monocultural vegetations, Noldus FaceReader software was used for facial expression recognition [66,73,74,75], a software that is applied for psychological evaluations [76,77,78]. The FaceReader applied for this study is a highly advanced and automated system that delivers accurate and reliable data on facial expressions and offering clear insights into how various stimuli influence emotions. The facial expression analysis first involved saving the recorded video of participants as mp4 format videos for continuous access. However, this format was compatible with the software, which allowed for uninterrupted upload and batch analysis of facial expressions. Videos pertaining to each study vegetation were compiled into morning and afternoon; similarly, videos of male and female gender were grouped from both study vegetations. Therefore, six groups of videos were analyzed. The background sounds were removed, and videos were compiled using Microsoft Clipchamp video editor. The facial expression recognition analysis obtained valence values of each participant, considering seven key facial psychological expressions, namely (1) neutral, (2) happy, (3) sad, (4) angry, (5) surprised, (6) scared, and (7) disgusted, based on previous research [51]. Microsoft Excel was used for graphical annotations, and SPSS 25.0 was used to conduct all statistical analysis to better understand each research objective. Descriptive statistical analysis was conducted on participants’ socioeconomic factors, soundscape, and visual perception results obtained from the questionnaire survey. Analysis of variance (ANOVA) was used to determine the significant differences in valence and facial expressions of participants in both monocultural vegetations (rubber and palm). In addition, a comparison of key facial psychological expressions was analyzed to determine dominant and less dominant facial expressions with respect to each vegetation. A descriptive analysis determined how the sound and visual environment was perceived; further, Pearson’s correlation analysis was conducted to explore the relationship between soundscape perception and facial expressions with respect to each monocultural vegetation and the relationship between soundscape and visual perception.

3. Results

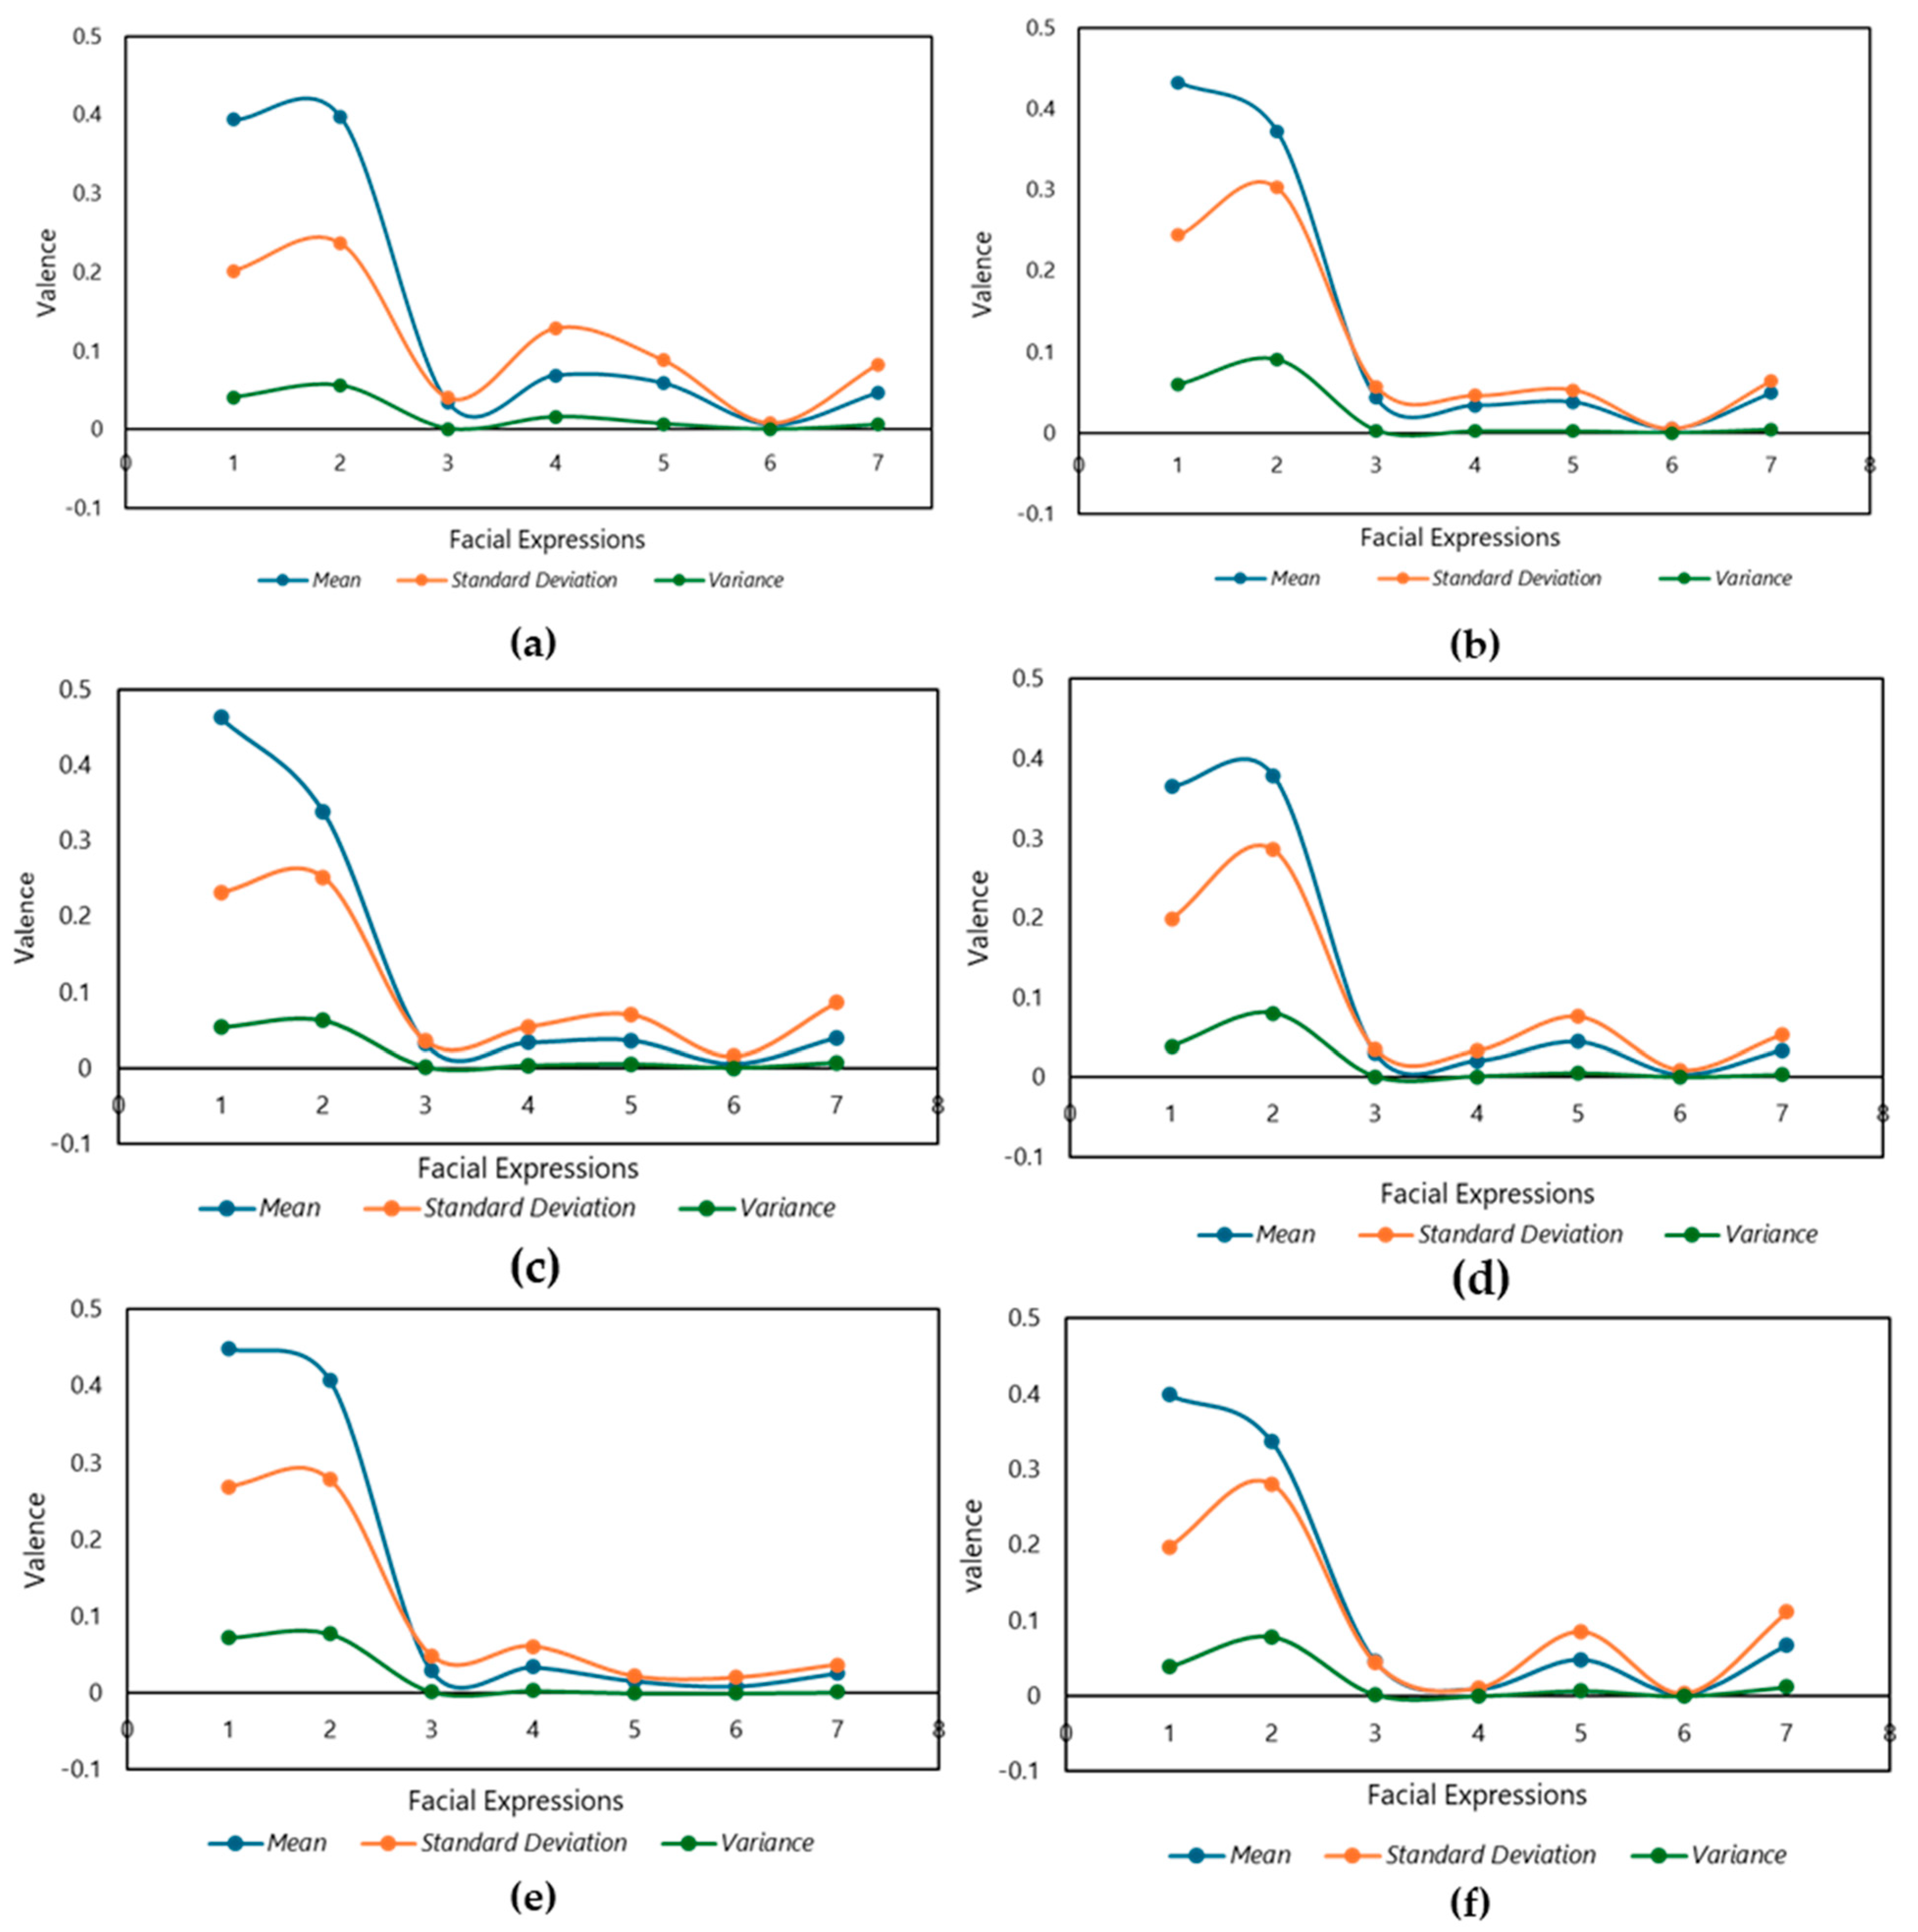
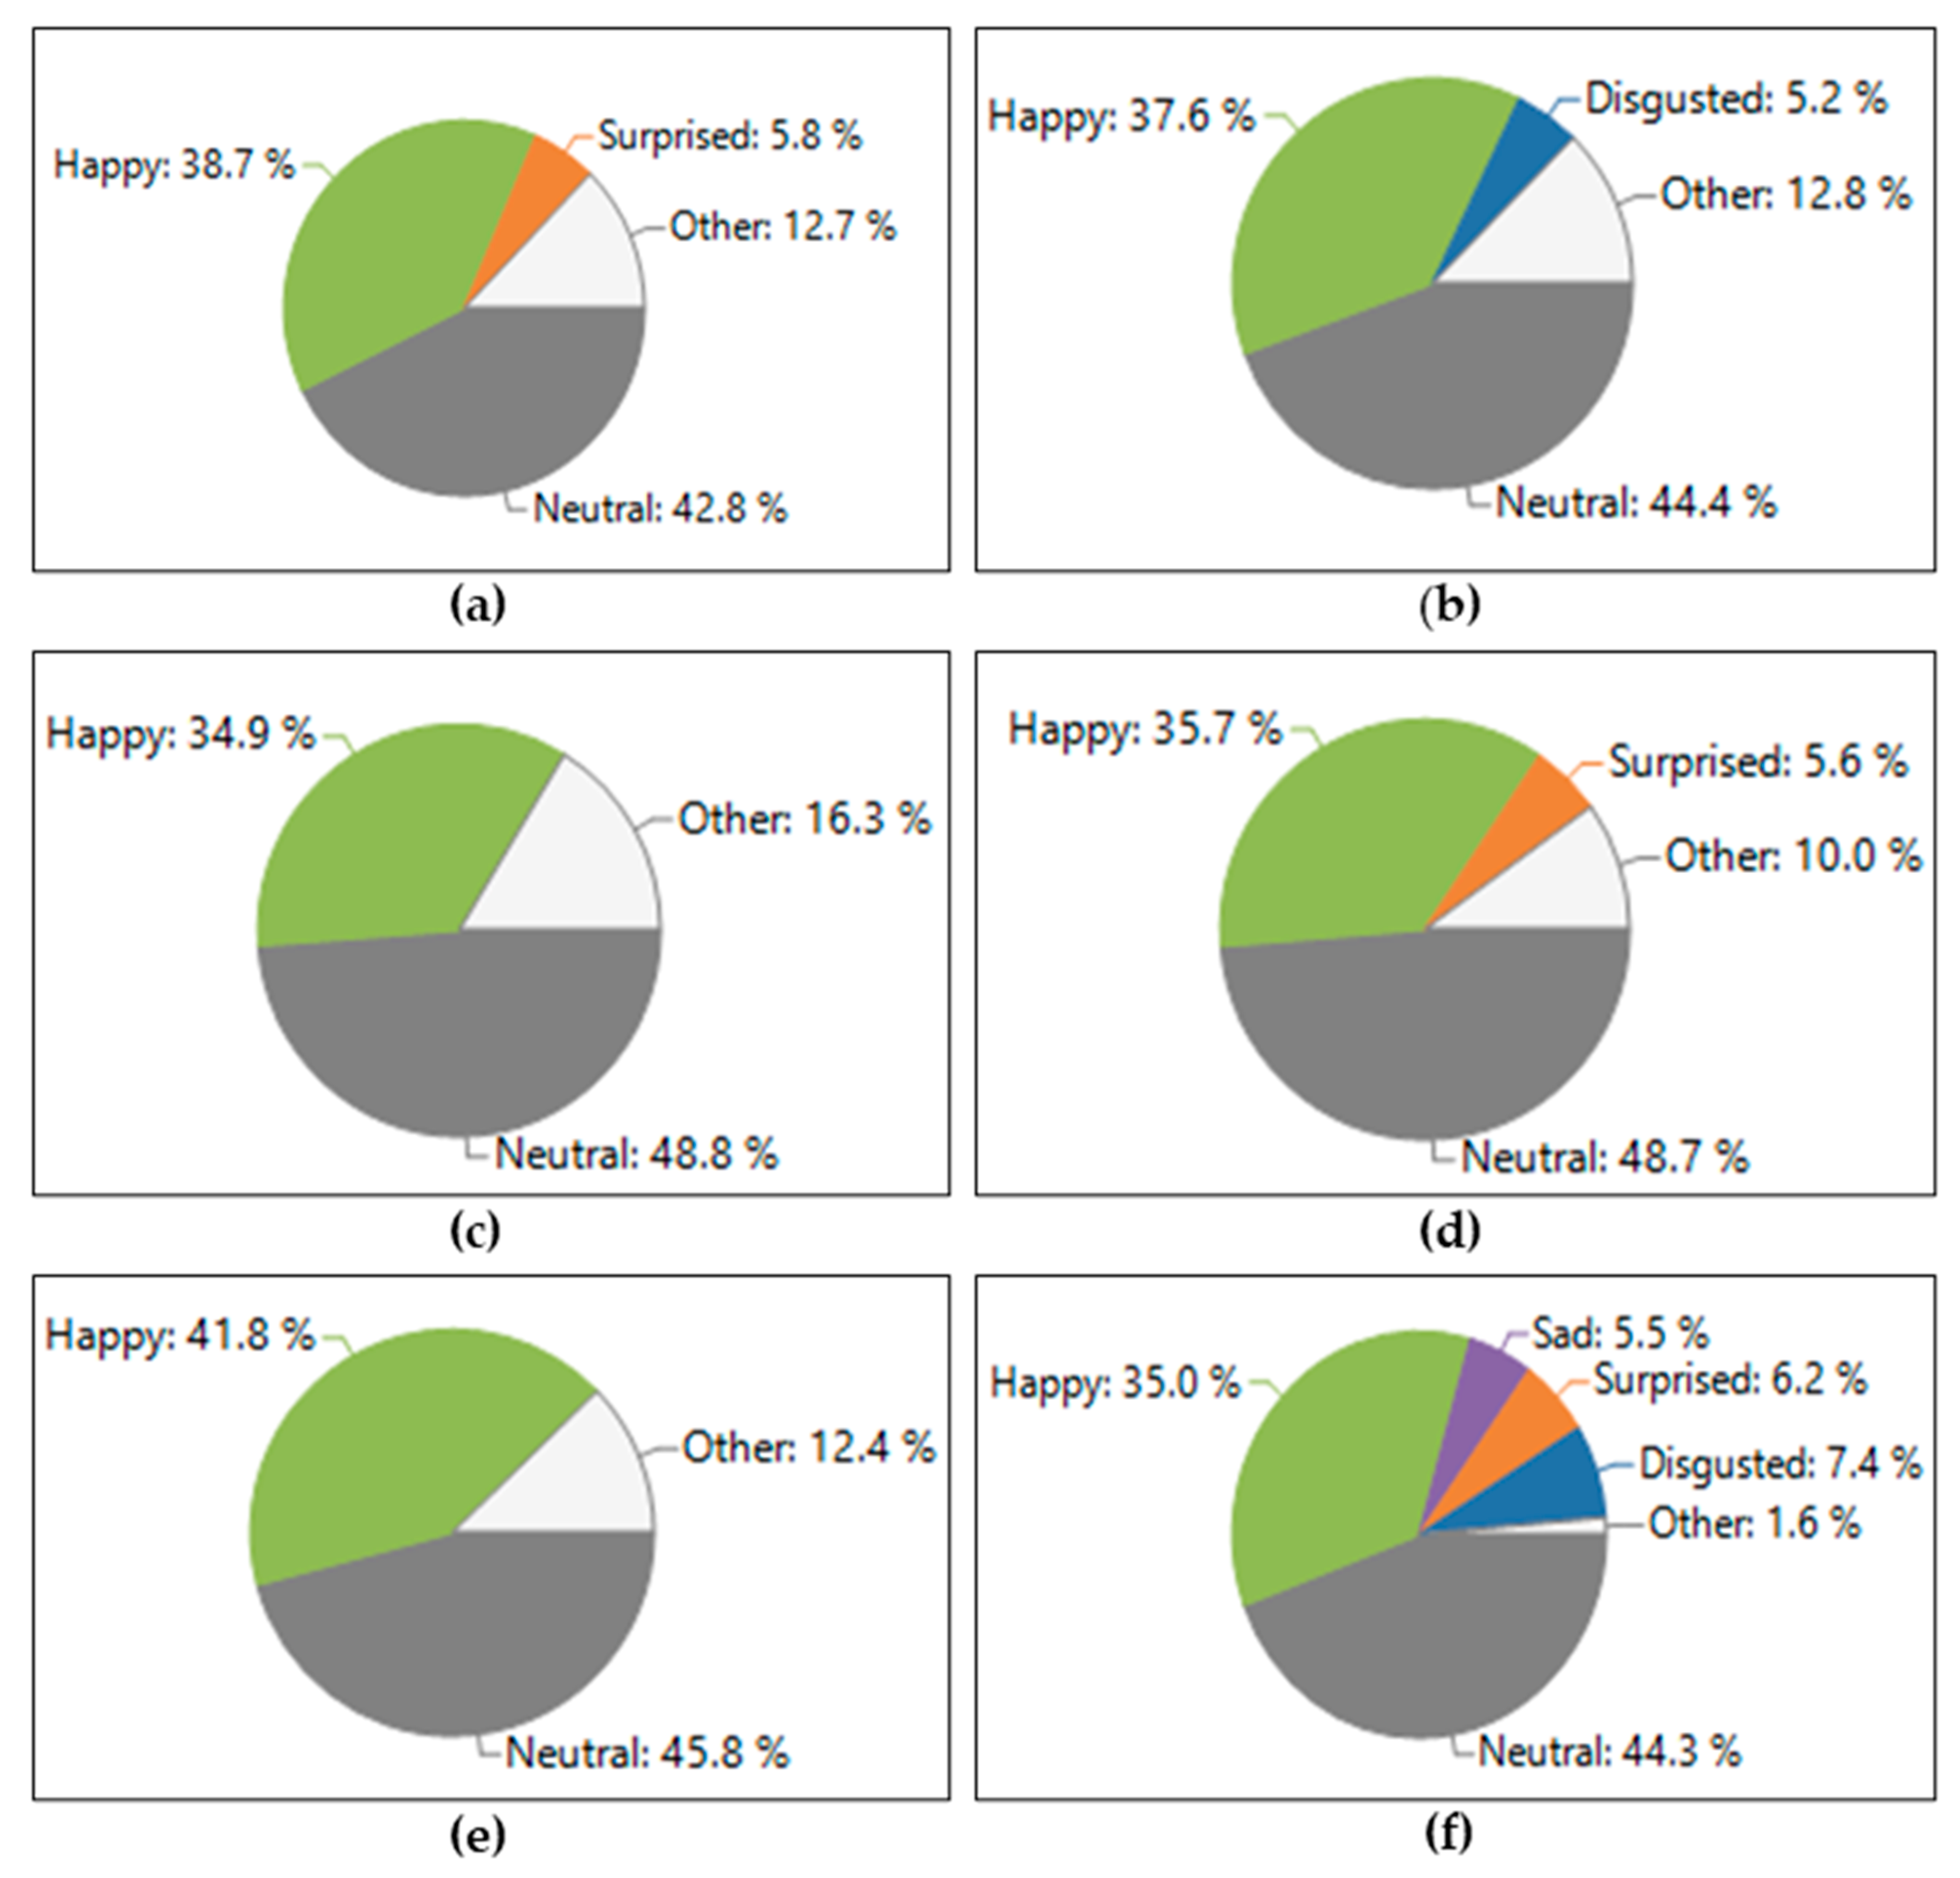
3.1. Analysis of Monocultural Vegetation on Human Facial Expressions

A descriptive analysis of participants’ valence values of facial expressions was conducted to show comparison in the mean, standard deviation, and variance values of palm vegetation and rubber vegetation at morning and afternoon time of day. Figure 3 is a graphical representation of the results of the seven facial expression valence means for palm vegetation, rubber vegetation, and comparisons of male and female facial expression, where 1 = neutral, 2 = happy, 3 = sad, 4 = angry, 5 = surprised, 6 = scared, and 7 = disgusted [51]. Figure 3a,b shows results for palm vegetation facial expression analysis of morning recording and afternoon recording, respectively. In Figure 3a, the highest valence mean value of (0.39) was recorded for the “happy” facial expression, while the lowest mean value of (0.006) was recorded for the “scared” facial expression during the morning audiovisual recording. The valence reflects the facial expression of each stimulus, which is measured from a scale of (−0.5) to (+0.5). Also, in Figure 3b the highest valence mean value (0.43) was recorded for the “neutral” facial expression, and the lowest mean value of (0.005) for the “scared” facial expression. Comparing results from Figure 3a,b, participants were happier in facial expressions for palm vegetation morning recording, unlike the afternoon recording, where they expressed neutral feelings. However, participants showed similar lower mean valence values for scared facial expression, which is a negative expression. This can also be explained as caused by the birdsongs and the radiance blooming off the palm vegetation, which might have been dominant in the morning compared to afternoon, explaining the “happy” and “neutral” facial expression differences.
Figure 3c,d shows the results of valence mean values of facial expression for rubber vegetation for morning and afternoon recording, respectively. In Figure 3c, a higher valence mean value of (0.46) for the “neutral” facial expression was recorded, and lowest valence mean value of (0.006) was recorded for the “scared” facial expression for rubber vegetation in morning recording. Also, in Figure 3d the highest mean valence value of (0.37) was recorded for the “happy” facial expression for afternoon recording, and the lowest mean value of (0.004) was recorded for the “scared” facial expression. This means that the participants showed happier facial expression in response to rubber vegetation in the afternoon when compared to the morning recording, where participants’ expressions where neutral. This might have been influenced by the nature of birds that are dominant in rubber vegetations, where their birdcalls were stronger in the afternoon, and the physical characteristics of rubber plant having flowers and seeds that bloom in the afternoon, hence the influence of audio and visual characteristics of a monocultural vegetation type on human facial expressions. Figure 3e,f analyzed the mean valence values of participants’ gender—male and female, respectively. The essence of this analysis was to determine the different psychological emotions in terms of facial expressions that the male and female gender could show, in case they differed. As shown in Figure 3e, the mean value of (0.45) was recorded for “neutral” facial expression, (0.40) “happy”, and the lowest (0.009) for “scared” facial expression. Meanwhile, Figure 3f recorded the valence mean value of (0.39) for “neutral” facial expression, (0.33) for “happy”, and (0.002) for “scared” facial expression. The results revealed that male participants showed higher neutral and happy facial feelings in response to monocultural vegetation when compared to female participants, who showed lesser feelings, which could be seen in the difference of their valence mean values (0.06) “neutral” and (0.07) “happy”.
A one-way ANOVA statistical analysis was conducted to determine significant statistical differences within and between both monocultural vegetations. Firstly, the ANOVA result revealed no statistically significant difference between participants’ facial expressions in morning audiovisual interactions and afternoon audiovisual interactions with palm vegetation. Where F (107, 74) = 1.421, p = 0.054. This suggests a trend indicating that timing has no effect on facial expression responses on palm vegetation, indicating that facial expression reaction does not significantly differ between morning and afternoon sessions. Secondly, the one-way ANOVA statistical analysis between the participants’ facial expressions of morning and afternoon audiovisual interactions with rubber vegetation revealed a significant difference between morning and afternoon time, where F (116, 93) = 16.103, p = 0.00 (p ≤ 0.05), which suggests that the time of day influences facial expression responses, indicating that participants exhibited significantly different facial expression in the morning and afternoon session.
Thirdly, a one-way analysis of variance compared the effects of vegetation type (palm vs. rubber) on participants’ facial expression responses. The analysis revealed a significant statistical difference between the two monocultural vegetations, F (174,189) = 2.572, p = 0.00 (p ≤ 0.05). This indicates that variations in facial expressions of participants were significantly dependent on the type of vegetation. This could be attributed to varying physical aesthetics elicited by the two vegetation types. Fourthly, analysis of facial expression between the male and female participants in both single-plant vegetation showed statistical differences where F (206,283) = 10.672, p = 0.00 (where p ≤ 0.05). This indicates that male and female participants exhibited significantly different facial expressions when interacting with both monocultural vegetations, suggesting that gender influences facial expression responses to palm and rubber vegetation.
Figure 4a–f shows a graphical representation of the percentage of dominant facial expressions in different monocultural vegetation. Each facial expressions in each vegetation showed similarities and differences in dominant or less dominant facial expressions. Figure 4a shows the dominant facial expressions for palm vegetation in morning, with “neutral” and “happy” facial expressions having dominant percentage values of 42.8% and 38.7%, respectively. Figure 4b also shows similarity in dominant facial expression, where “neutral” and “happy” facial expressions had a higher percentage value of 44.4% and 37% when compared to the five other facial expressions. In Figure 4c,d, participants showed similar range in the percentage of dominant facial expression for rubber vegetation, where for morning session 34.9% was attributed to “happy”, 48.8% “neutral“, and 16.3% was attributed to the other five facial expressions assessed. However, a distinctive pattern of facial expression was observed among female participants as shown in Figure 4f, who exhibited a wider range of facial expressions compared to the male participants shown in Figure 4e, who primarily displayed two dominant expressions. This observation may be attributed to the perception that females are generally regarded as more emotionally sensitive, potentially leading to varied psychological responses to the same event.
This analysis means that majority of the participants exhibited happy and neutral expressions compared to sad, angry, surprised, scared, and disgusted expressions. This distribution suggests that the environment presented in this study as a stimulus was pleasant and hence promoted the positive responses and state of emotional neutrality with very minimal instances of negative arousal. The prevalence of neutral expressions could suggest that although the different single-plant vegetation environment did not provoke high negative emotions, it may have highly stimulated all participants emotionally, leading to a neutral facial expression which reflects passive observation and cognitive engagement, allowing participants to maintain a baseline emotional state.

3.2. Relationship Between Soundscape and Visual Perception of Monocultural Vegetation

Prior to establishing whether there is a relationship between soundscape perception and visual perception, a descriptive statistic of the participants’ soundscape and visual perception of rubber and palm vegetation was conducted, as shown in Table 3 and Table 4. Based on a 5-point Likert scale, rubber vegetation had a slightly higher mean value of (4.10) S.D (0.59) for “annoying–pleasant” perception when compared to palm vegetation with (4.07) S.D (0.69). Although the difference in mean scores between the two vegetation types is relatively small (ΔM = 0.03), this suggests a comparable perception of soundscape pleasantness by participants across both single-plant vegetations. Also, the mean and SD values for visual perception of both vegetations, as shown in Table 4, recorded a higher mean value of (4.05) SD (0.59) for “ugly–beautiful” for palm vegetation and mean (3.97) SD (0.53) for rubber vegetation, indicating that participants perceived palm vegetation as more visually beautiful than rubber vegetation.
However, this study shows that palm vegetation is perceived as more visually pleasing and rubber vegetation soundscape is perceived as more pleasant. A similarity can be seen in the “chaotic–calm” perception of soundscape in both vegetation; the equal mean and SD values of 4.27 and 0.59, respectively, were recorded. This suggests that the sound of both vegetations based on the five-point Likert scale (1 = chaotic and 5 = calm) tends to be more calming than chaotic, which indicates that the ecosystem of both vegetations is relatively stable and peaceful, as reflected in a higher mean and lower SD values. Generally, the soundscape across both vegetations showed nearly identical mean and SD values. The mean values are above 4.00, which indicates a general perception of the soundscape as pleasant, eventful, vibrant, and appropriate. The standard deviation values range from (0.51) to (0.72), showing moderate variability in the responses, with the highest variability (0.72) observed in the “uneventful–eventful” scale for rubber vegetation, suggesting that participants had more diverse opinions on whether the soundscape felt more uneventful or eventful. The variance also reveals a similar pattern as “uneventful–eventful”, showing the highest variability (0.51 for palm and 0.52 for rubber), which indicates high differences in the perception across participants. The lowest variance value was recorded for palm vegetation for the monotonous–vibrant scale, which explains that most participants agreed in rating this perception as vibrant. The strong negative skewness (−2.04) in the “annoying–pleasant” scale for palm vegetation also confirms a pleasant response from participants towards the soundscape.
In Table 5, the relationship between soundscape perception and visual perception of both rubber and palm vegetation was determined through Pearsons’s correlation analysis. The findings reveal consistently strong and statistically significant positive correlations (p < 0.01) between the visual qualities of beautiful, natural, comfortable, and relaxed, and soundscape attributes of pleasantness, calm, vibrant, and appropriateness. A positive strong correlation coefficient ranging from (r = 0.750–0.955) was observed in palm vegetation, which indicates a relationship between sound and visual perception; hence, palm vegetation when perceived as visually appealing is also perceived as acoustically pleasant. Notably, the strongest relationship was observed between the dimensions “anxious–relaxed” and “annoying–pleasant” (r = 0.951), suggesting that visual relaxation strongly enhances auditory pleasantness. Similarly, perceptions of palm vegetation as natural and beautiful were closely associated with more calm, eventful, and appropriate soundscapes. Rubber plantation also demonstrated strong positive correlations ranging from (r = 0.695 to 0.955) across all perceptual dimensions, though slightly weaker in certain areas compared to palm. While visual perception in both plantation types positively influenced soundscape perception, palm vegetation exhibited a slightly higher efficacy in promoting auditory comfort and vibrancy.

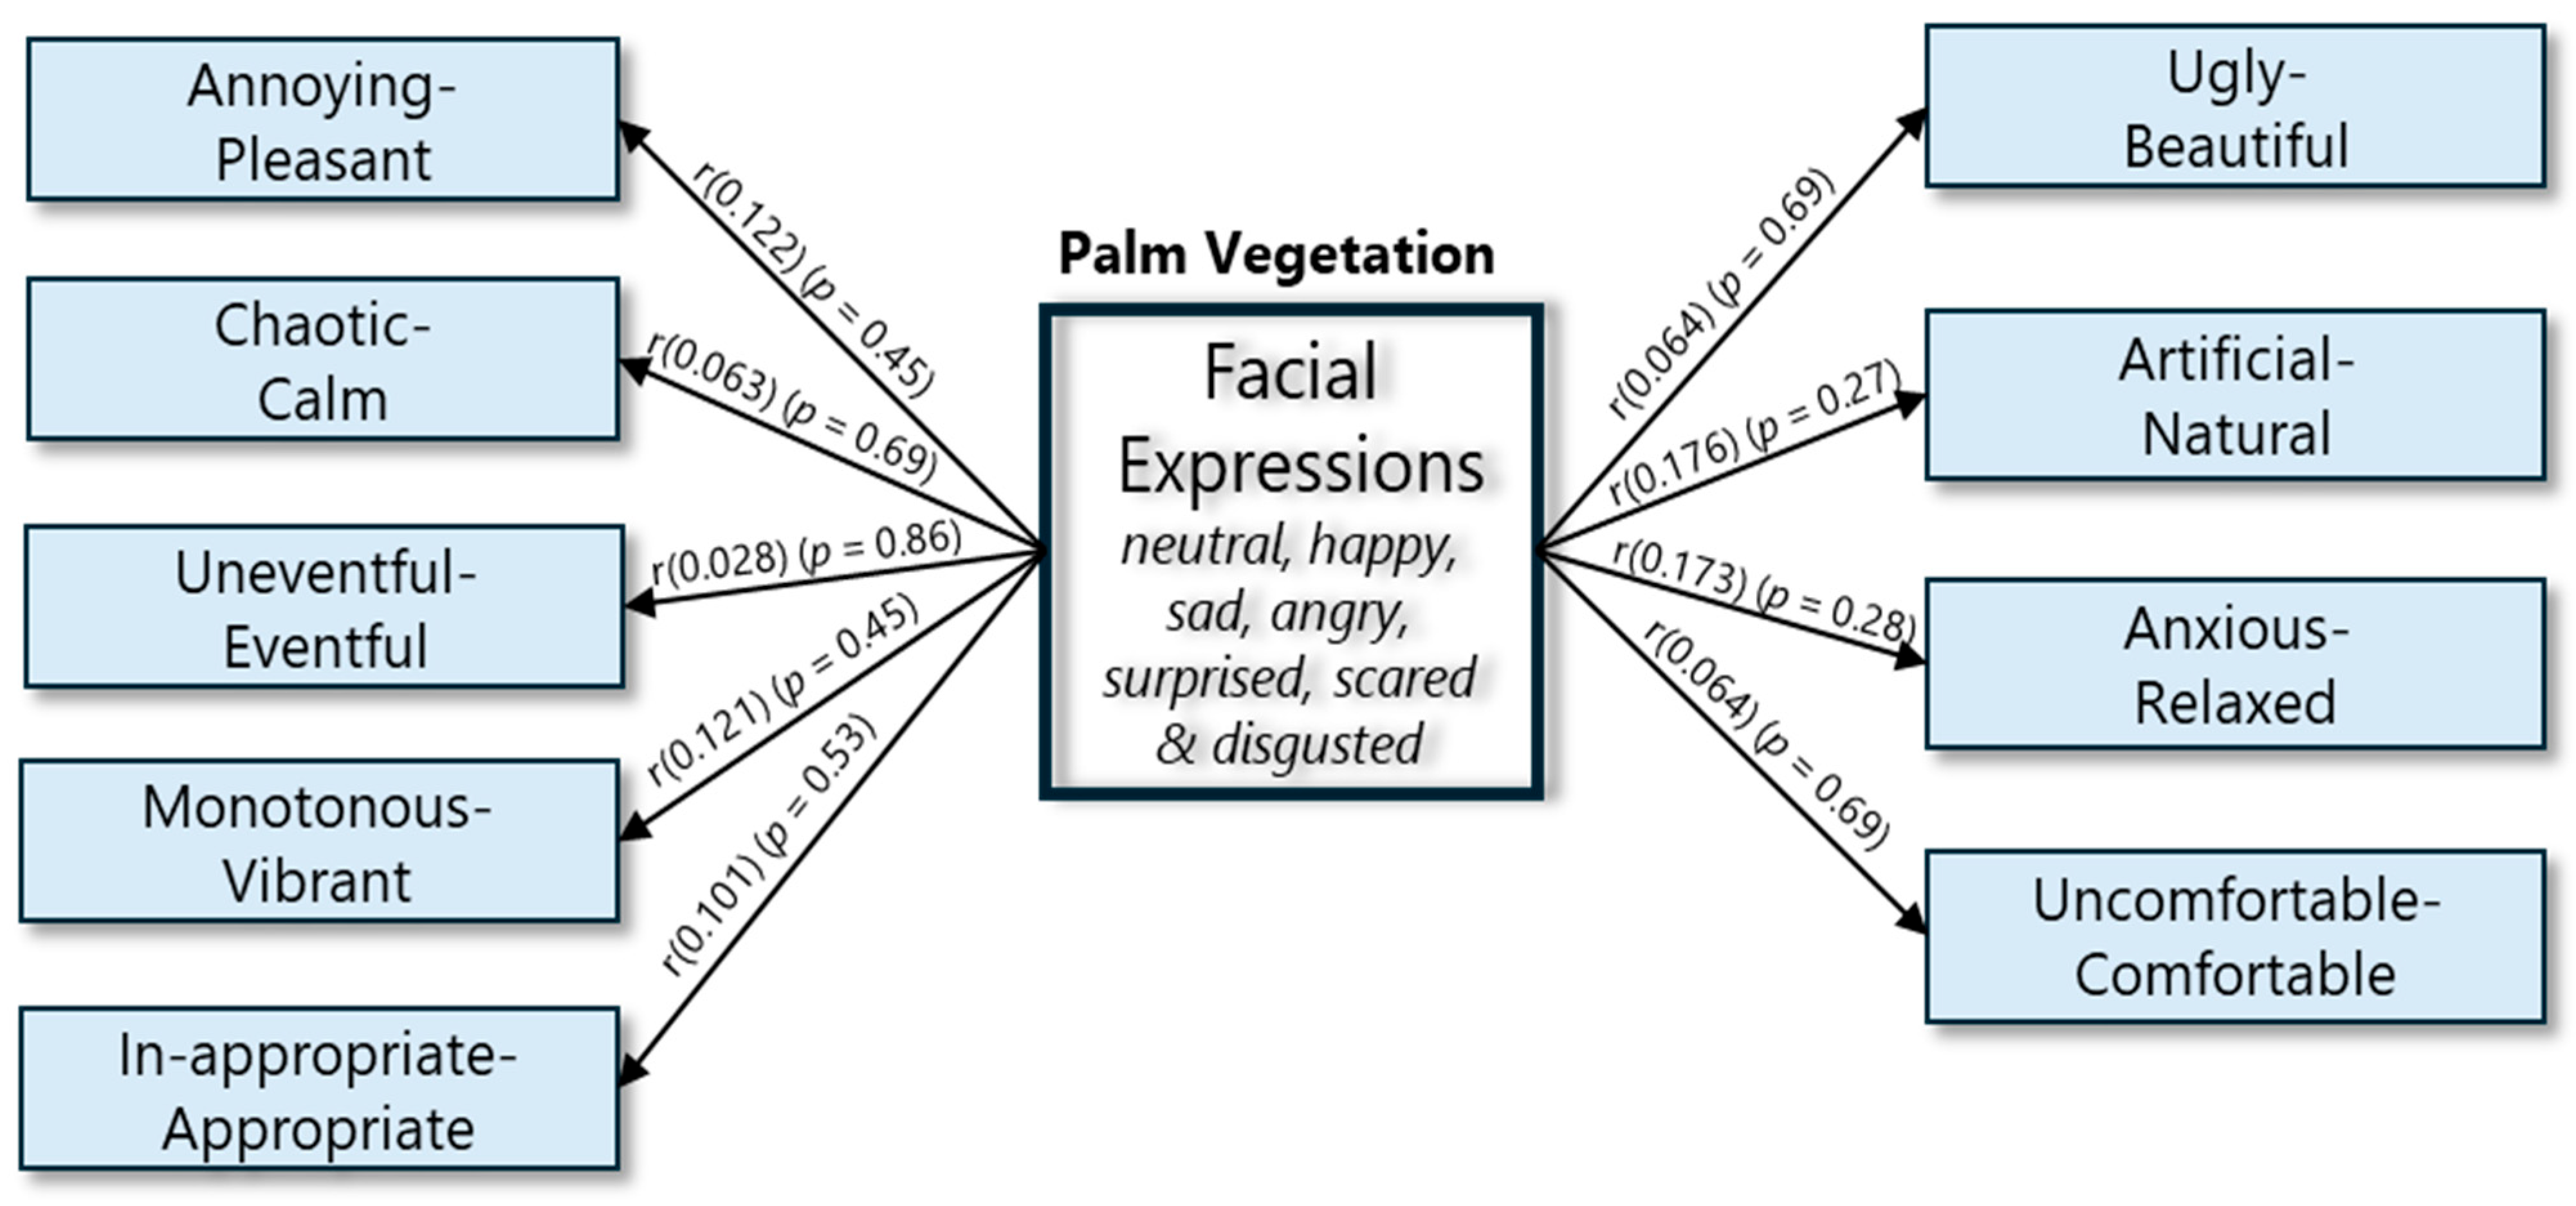
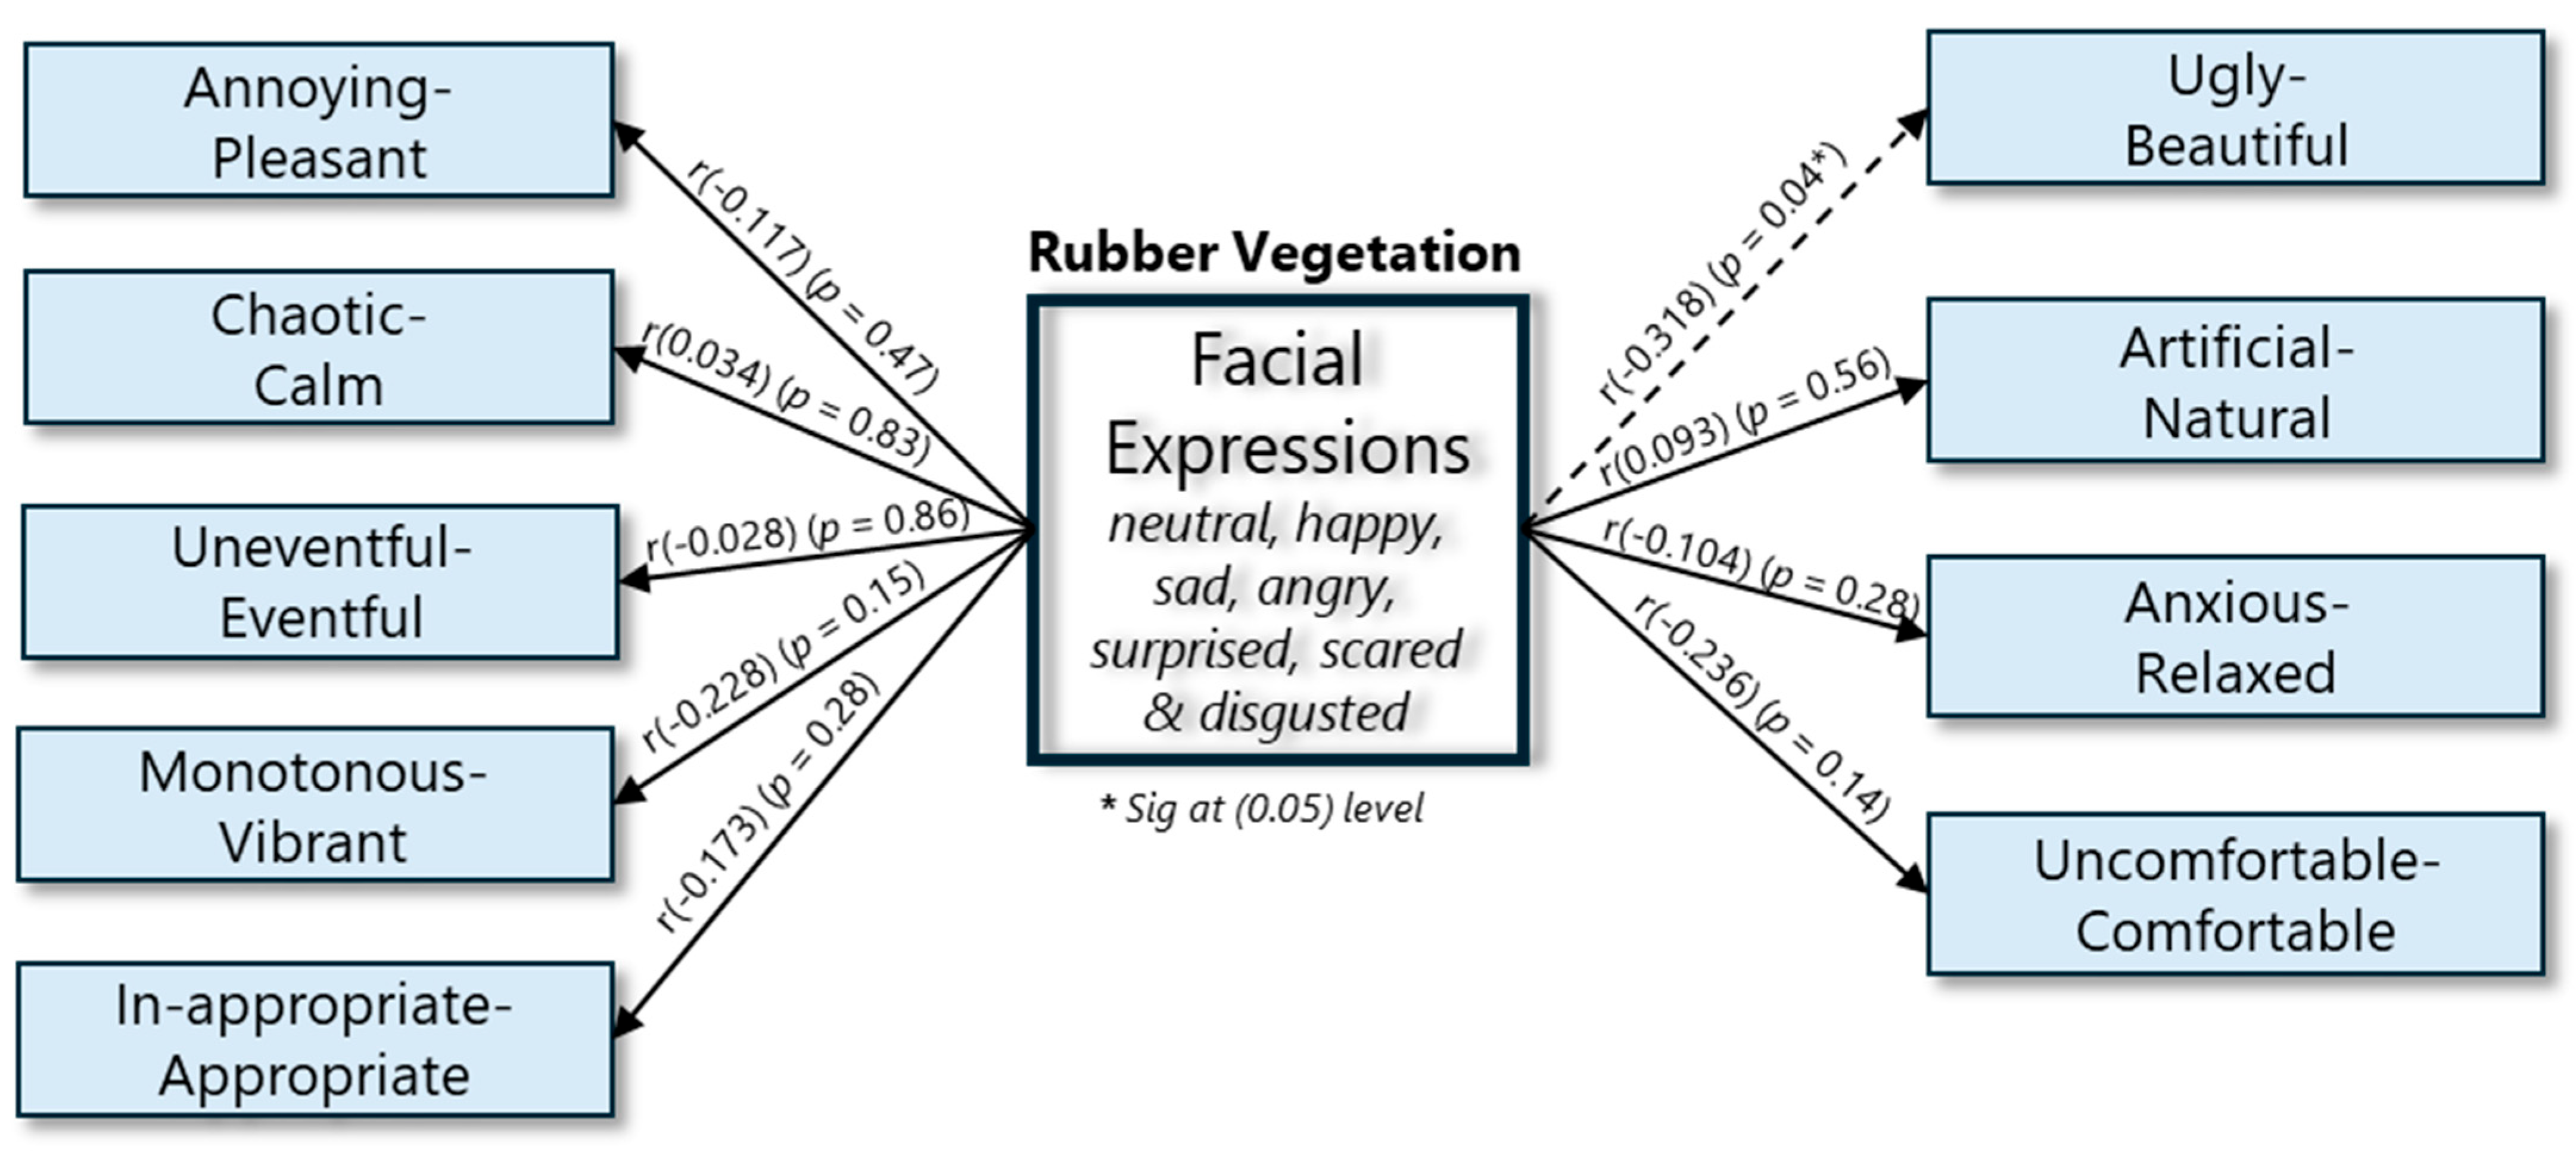
3.3. Relationship Between Soundscape Perception and Facial Expression

A Pearsons correlation (r) was conducted to determine the relationship between facial expressions and soundscape and facial expression and visual perception of palm and rubber vegetation. Figure 5 is a graphical representation of Pearson correlation analysis between soundscape perception based on the five soundscape scales. The results show a weak positive correlation (r = 0.122, p = 0.45) for the “unpleasant–pleasant” scale, which means that there is a slight association between perceived soundscape and facial expression. However, the correlation is not statistically significant, showing that in this context facial expressions do not strongly reflect soundscape perception. This interpretation also applies to other soundscape perception scales, such as monotonous–vibrant (r = 0.121, p = 0.45) and inappropriate–appropriate (r = 0.101, p = 0.53), showing a non-statistically significant result and a weak positive correlation. However, for chaotic–calm (r = 0.063, p = 0.69) and uneventful–eventful (r = 0.028, p = 0.86), the analysis yielded a weak positive correlation and showed an almost negligible association between the soundscape scales and facial expression. This result shows that emotional responses that are shown through human facial expressions might be influenced by other external factors, such as personal auditory sensitivity or cognitive processing, rather than solely by soundscape characteristics. The research also investigated the relationship between visual perception across four perceptual scales shown in Figure 5: “ugly–beautiful”, “artificial–natural”, “anxious–relaxed,” and “uncomfortable–comfortable”. The analysis revealed a weak relationship (r = 0.064, p = 0.69) observed for “ugly–beautiful”, indicating that no meaningful association exists between facial expressions and visual aesthetics. However, a positive correlation (r = 0.176, p = 0.27) was observed for “artificial–natural” suggesting that participants’ facial expressions could change in relation to environmental artificiality and naturalness. Other perceptual scales also showed no significant relationship between facial expressions and visual perception of palm vegetation.
Figure 6 shows a graphical representation of Pearson correlation analysis between soundscape perception of rubber vegetation based on the five soundscape scales. Generally, the results indicate weak and non-significant correlations across all soundscape perception scales, suggesting that facial expressions do not strongly align with subjective evaluations of soundscapes. Annoying–pleasant revealed a weak negative correlation (r = −0.117, p = 0.47), showing that facial expressions exhibited a slight tendency to change in response to variations in soundscape perceptions along the “annoying–pleasant” scale. A weak negative correlation was observed (r = −0.173, p = 0.28), implying a slight tendency for facial expressions to vary in response to whether soundscape was deemed inappropriate or appropriate. Differently, the correlation analysis for “uneventful–eventful” and “chaotic–calm” yielded (r = −0.028, p = 0.86) and (r = 0.034, p = 0.83), respectively. A near-zero correlation was observed—demonstrating no meaningful relationship—between facial expressions and soundscape scales. Hence, facial expressions remain largely unaffected by participants’ interpretations of soundscape calmness and eventfulness. A distinct observation was made when visual perception and facial expression of rubber vegetation where correlated. Results revealed a significant negative relationship for “ugly–beautiful” visual scale (r = −0.318, p = 0.04), suggesting that as participants perceived the vegetation to be more beautiful, their facial expressions became less negative. The correlation between facial expressions and the “artificial–natural” scale was weak and statistically insignificant (r = 0.093, p = 0.56). This suggests that whether participants perceived the vegetation as artificial or natural had little to no influence on their facial expressions. A weak positive correlation was observed between facial expressions and the perception of rubber vegetation on the uncomfortable–comfortable scale (r = 0.236, p = 0.14). However, this correlation was not statistically significant. This suggests that participants who found the vegetation more comfortable tended to exhibit more positive facial expressions. Yet, the lack of statistical significance indicates that the relationship is not strong enough to be conclusive.

4. Discussion

Through audiovisual interactions, the present study provides evidence that facial expressions, as a measure of emotional responses, vary significantly based on the type of vegetation and the time of day. Supporting studies by [79,80] show that attractive and natural forest trees with foliage will evoke significantly higher levels of positive facial emotions in humans. The critical patterns observed in participants demonstrated that vegetation characteristics play a vital role in influencing facial expression responses. Palm vegetation evoked more positive facial expressions in the morning, while rubber vegetation was associated with a more positive affective response in the afternoon. The findings of this study have important implications for the development and management of therapeutic landscapes and the natural environment. The emotional responses observed in this study, especially the prevalence of positive facial expressions in response to palm and rubber environments, suggest that even monocultural plantations can provide psychological benefits when appropriately managed. This is especially relevant in countries where mixed-species vegetation are in abundance, but monocultures are underrated, and incorporating these findings into urban planning can support mental health.

4.1. Gender as an Influence on Facial Expressions

A meta-analysis of gender differences in smiling revealed a significant tendency for females to smile more than males [81], and conclusive research by Hall also provides the foundational insight that men and women differ in their use of non-verbal cues, especially facial expressions [82]. This accounts for the current study revealing a statistically significant difference in facial expressional responses of male and female participants. However, this research establishes similar results showing that the female gender shows more emotions and expresses them more easily than men, but differs to the extent that males exhibit higher neutral and happy facial expressions than females. Hence, this research—in line with previous studies [83,84]—concludes that gender differences should not be ignored in emotional recognition and affective psychology research. Other studies have investigated how men and women use facial expressions differently, emphasizing that women were more expressive in facial expressions during social and interpersonal interactions [85,86]. This explains why this study revealed more facial expression being displayed by women during the audiovisual interactions.

4.2. Research Significance

This study offers timely and significant contributions to contemporary research on the multisensory perception of natural environments, particularly on how visual and auditory perceptions interact with facial emotional expression. While much attention has been given to the psychological benefits of natural green spaces, most studies have focused on multispecies or diverse green environments (e.g., forests, parks, or urban green areas) [19,87,88] and how the exposure to natural sounds (e.g., water, birdsong) in restorative environments increases perceived calmness and reduces cognitive fatigue [89]. This research, in contrast, uniquely examines monocultural vegetation landscapes—specifically palm and rubber environments and their relationships to soundscape perception, visual aesthetics, and facial emotional responses. These vegetation types, although common in tropical and subtropical countries, are deeply underrepresented in environmental psychological research. Therefore, the significance of this research’s focus on monocultural vegetation allows for a more controlled examination of how these specific plant types influence visual aesthetics, perceived soundscape, and facial emotional expression, a notably underexplored area. Additionally, unlike previous work that largely assessed self-reported cognitive outcomes, this study incorporates facial expression analysis, hence bridging the gap between visual and soundscape perceptions and nonverbal facial emotional responses. For instance, Fischer and LaFrance’s research on why women are more emotionally expressive than men discovered that gender and social norms influence emotional expressiveness; however, they did not establish the link to this expressiveness to specific vegetation types or their perceived environmental qualities, which this study has established. This study further reveals that visual aesthetics, rather than soundscape alone, are more likely to influence facial emotional responses, especially in environments dominated by rubber vegetation. These findings contrast with Hong and Jeon’s [90] research that emphasized the dominant role of sound in shaping affective impressions in urban parks. This study has demonstrated that visual qualities of vegetation can evoke emotional expression independently of sound. Therefore, this study advances the field by refining the understanding of sensory–emotional interplay in natural environments and disentangling visual and auditory impact, through its emphasis that visual aesthetics is a stronger predictor of emotional expression than sound, hence challenging existing models that prioritize auditory cues in environmental design.

4.3. Application and Recommendations

The findings of this study have practical applications and provide evidence-based guidance for designing emotionally supportive urban spaces in the fields of urban planning, landscape architecture, and environmental psychology in the following ways. Firstly, the strong visual–auditory synergy revealed in this study supports the strategic use of monocultural-type vegetation to enhance the aesthetic and acoustic quality of streetscapes, parks, campuses, and recreational zones. Planners and designers can select specific plant species not only for their ecological value, but also for their ability to foster positive sensory experiences and emotional well-being. Given the correlation between visual perception and soundscape perception, as well as the link between visual aesthetics and facial emotional responses, urban environments can be designed as therapeutic or restorative spaces. Environments can be designed or enhanced that are beneficial in healthcare facilities where stress reduction and emotional recovery are prioritized. Secondly, the incorporation of facial expression analysis introduced a novel method for assessing real-time emotional responses to natural environments. This approach can be adapted for smart urban systems that monitor and evaluate public satisfaction with outdoor spaces, thereby offering data-driven insights for responsive and adaptive landscape interventions.
Thirdly, incorporating vegetation types with aesthetic and acoustic appeal, such as palm and rubber forests, can foster environments that support cognitive functioning, positive facial expressions, and emotional well-being. The integration of palm and rubber vegetation into urban streetscapes has the potential to yield multiple benefits. Beyond enhancing the visual and acoustic quality of the urban environment, these vegetation types can contribute to economic sustainability by also serving as sources of economic revenue. Their adoption in streetscape planning will foster a more aesthetically pleasing and acoustically balanced environment, while simultaneously supporting local economies through commercial utilization. In addition, the findings can help the public to better understand how different types of vegetation affect not only biodiversity and climate, but also their emotional and sensory experiences. Such awareness can foster a stronger connection between urban residents and green infrastructure, therefore encouraging community participation in greening initiatives.

4.4. Limitation and Future Studies

Future research will consider a comparison in physical exposure to the environment through soundwalks and exposure to the environment via artificial intelligence. Also, a cross-cultural comparative study could provide subjective interpretation of visual and sound perception. Although the sample size is considered adequate for this exploratory study, it may still be viewed as a limitation. Future research will therefore include a larger and more diverse sample comprising both local and non-local residents, which will help to generate more generalizable findings and support the development of more tailored urban planning and greening strategies.

5. Conclusions

The findings of this study highlight the critical role of monocultural vegetation, particularly palm and rubber forests, in shaping human facial expression responses through audiovisual interactions.
Firstly, the analysis findings indicate that facial expressions vary significantly based on vegetation type and time of day. Participants exhibited higher valence for “happy” expressions in the morning for palm vegetation, whereas afternoon recordings reflected more neutral expressions. In contrast, rubber vegetation elicited neutral expressions in the morning and happier expressions in the afternoon, potentially influenced by avian activity and plant phenology. Gender differences were observed, with male participants displaying greater positive expressions than females. Statistical analyses revealed a significant effect of vegetation type on facial expressions, while time of day influenced responses for rubber but not palm vegetation. These results suggest that specific ecological characteristics of single-plant vegetation influence emotional responses, emphasizing the role of visual and auditory stimuli in shaping human perception.
Secondly, the findings indicate that both palm and rubber vegetation contribute to a positive soundscape and visual experience. Rubber vegetation was perceived as slightly more pleasant in terms of soundscape, while palm vegetation was rated as more aesthetically pleasing. The “chaotic–calm” perception showed similar ratings for both vegetation types, highlighting their calming nature. A negative skewness in the “annoying–pleasant” scale further confirms positive soundscape perceptions. The highest variability in “uneventful–eventful” suggests diverse opinions on soundscape dynamics. Overall, the results reveal that palm vegetation enhances visual appeal, while rubber vegetation offers a slightly more pleasant soundscape. These findings emphasize the potential of integrating monocultural vegetation in urban landscapes to optimize both aesthetic and acoustic environments.
Thirdly, the results reveal that facial expressions do not strongly correlate with soundscape or visual perception of palm and rubber vegetation. Weak and non-significant correlations across soundscape scales indicate that subjective evaluations of pleasantness, vibrancy, and calmness do not directly influence emotional responses. This suggests that external factors, such as cognitive processing and auditory sensitivity, may play a greater role in shaping facial expressions than soundscape alone. While visual perception of palm vegetation showed no meaningful relationship with facial expressions, a significant negative correlation was observed between the perception of ugly–beautiful and facial expressions for rubber vegetation, indicating that participants displayed more positive emotions when they perceived the vegetation as more beautiful. However, perceptions of artificiality and comfort had no strong impact on facial expressions. These findings highlight the complexity of human–environment interactions and suggest that while urban greenery influences perception, its effect on emotional expression may be mediated by other psychological and environmental factors.
Finally, this study advances the understanding of soundscape perception in single-plant vegetation compared to diverse vegetation, addressing a critical gap in urban environmental research. The findings provide valuable insights for landscape designers and urban planners, emphasizing the potential of palm and rubber vegetation in shaping aesthetically and acoustically enriching environments. Their integration into parks, streetscapes, and urban spaces offers both economic and ecological benefits, enhancing the overall sensory experience of urban dwellers. By incorporating vegetation types that contribute to both visual appeal and soundscape quality, cities can foster healthier, more sustainable, and livable environments.

Author Contributions

M.N., Conceptualisation, Methodology, Analysis and Original Draft. Q.M., Validation, Review, Supervision. D.Y., Supervision, Review and Editing. M.L., Software, Analysis. All authors have read and agreed to the published version of the manuscript.

Funding

This work was supported by the National Natural Science Foundation of China (NSFC) [grant number 52478083, 52208101, 52308089].

Data Availability Statement

Data are contained within the article.

Conflicts of Interest

The authors declare no conflicts of interest.

References

  1. Oriola, E.O. Forestry for Sustainable Development in Nigeria. Int. J. Afr. Stud. 2009, 1, 11–16. [Google Scholar]
  2. Ayeni, A.O. Forestry in Nigeria: A Brief Historical Overview, Phases of Development and Present Challenges; AARSE Special Publication: Lagos, Nigeria, 2013. [Google Scholar]
  3. Nwankwo, M.; Meng, Q.; Yang, D.; Liu, F. Effects of Forest on Birdsong and Human Acoustic Perception in Urban Parks: A Case Study in Nigeria. Forests 2022, 13, 994. [Google Scholar] [CrossRef]
  4. Terwase, I.T.; Abdul-Talib, A.-N.; Edogbanya, A.; Zengeni, K.T.; Yerima, H.M.; Ibrahim, M.B. Obudu Cattle Ranch: A Tourist Destination in Nigeria. Res. Humanit. Soc. Sci. 2015, 5, 67–71. [Google Scholar]
  5. Ugwukah, A.; Obomanu, V.S.O. Tourism and Economic Development in Nigeria: A Critical Assessment of the Obudu Mountain Resort, Cross River State 2008–2018. J. Tour. Hosp. Sports 2020, 48, 15–25. [Google Scholar] [CrossRef]
  6. Nomishan, T.S.; Andzenge, O.J.; Aarga, I. Interrogating the Tourism Industry of Benue State: The Past and Present of Makurdi Zoological Garden and Ikyogen Cattle Ranch, Benue State, Nigeria. SSRN Electron. J. 2020, 9, 1–14. [Google Scholar] [CrossRef]
  7. Odemero, A.F. Enterprise Shift Decision among Natural Rubber Plantation Owners in The Rain Forest Zone of Delta State, Nigeria. J. Biol. Agric. Healthc. 2013, 3, 39–44. [Google Scholar]
  8. Brockerhoff, E.G.; Barbaro, L.; Castagneyrol, B.; Forrester, D.I.; Gardiner, B.; González-Olabarria, J.R.; Lyver, P.O.B.; Meurisse, N.; Oxbrough, A.; Taki, H.; et al. Forest Biodiversity, Ecosystem Functioning and the Provision of Ecosystem Services. Biodivers. Conserv. 2017, 26, 3005–3035. [Google Scholar] [CrossRef]
  9. Gibson, L.; Lee, T.M.; Koh, L.P.; Brook, B.W.; Gardner, T.A.; Barlow, J.; Peres, C.A.; Bradshaw, C.J.A.; Laurance, W.F.; Lovejoy, T.E.; et al. Primary Forests Are Irreplaceable for Sustaining Tropical Biodiversity. Nature 2011, 478, 378–381. [Google Scholar] [CrossRef]
  10. Ayanlade, A.; Drake, N. Forest Loss in Different Ecological Zones of the Niger Delta, Nigeria: Evidence from Remote Sensing. GeoJournal 2016, 81, 717–735. [Google Scholar] [CrossRef]
  11. Akanni Oluyole, K. The Effect of Weather on Cocoa Production in Different Agro-Ecological Zones in Nigeria. World J. Agric. Sci. 2010, 6, 609–615. [Google Scholar]
  12. Tianhong, L.; Wenkai, L.; Zhenghan, Q. Variations in Ecosystem Service Value in Response to Land Use Changes in Shenzhen. Ecol. Econ. 2010, 69, 1427–1435. [Google Scholar] [CrossRef]
  13. Wang, H.; Hou, L.; Liu, Y.; Liu, K.; Zhang, L.; Huang, F.; Wang, L.; Rashid, A.; Hu, A.; Yu, C. Horizontal and Vertical Gene Transfer Drive Sediment Antibiotic Resistome in an Urban Lagoon System. J. Environ. Sci. 2021, 102, 11–23. [Google Scholar] [CrossRef]
  14. Shugart, H.H.; Saatchi, S.; Hall, F.G. Importance of Structure and Its Measurement in Quantifying Function of Forest Ecosystems. J. Geophys. Res. Biogeosciences 2010, 115, G00E13. [Google Scholar] [CrossRef]
  15. Lindenmayer, D.B.; Laurance, W.F.; Franklin, J.F. Global Decline in Large Old Trees. Science 2012, 338, 1305–1306. [Google Scholar] [CrossRef]
  16. Sunderland, T.; Abdoulaye, R.; Ahammad, R.; Asaha, S.; Baudron, F.; Deakin, E.; Duriaux, J.Y.; Eddy, I.; Foli, S.; Gumbo, D.; et al. A Methodological Approach for Assessing Cross-Site Landscape Change: Understanding Socio-Ecological Systems. For. Policy Econ. 2017, 84, 83–91. [Google Scholar] [CrossRef]
  17. Ahammad, R.; Stacey, N.; Sunderland, T.C.H. Use and Perceived Importance of Forest Ecosystem Services in Rural Livelihoods of Chittagong Hill Tracts, Bangladesh. Ecosyst. Serv. 2019, 35, 87–98. [Google Scholar] [CrossRef]
  18. Ulrich, R.S. Natural Versus Urban Scenes: Some Psychophysiological Effects. Environ. Behav. 1981, 13, 523–556. [Google Scholar] [CrossRef]
  19. Ulrich, R.S.; Simons, R.F.; Losito, B.D.; Fiorito, E.; Miles, M.A.; Zelson, M. Stress Recovery during Exposure to Natural and Urban Environments. J. Environ. Psychol. 1991, 11, 201–230. [Google Scholar] [CrossRef]
  20. Pearson, D.G.; Craig, T.; Berman, M.G. The Great Outdoors? Exploring the Mental Health Benefits of Natural Environments. Front. Psychol. 2014, 5, 1178. [Google Scholar] [CrossRef] [PubMed]
  21. Murage, P.; Anton, B.; Chiwanga, F.; Picetti, R.; Njunge, T.; Hassan, S.; Whitmee, S.; Falconer, J.; Waddington, H.S.; Green, R. Impact of Tree-Based Interventions in Addressing Health and Wellbeing Outcomes in Rural Low-Income and Middle-Income Settings: A Systematic Review and Meta-Analysis. Lancet Planet. Health 2025, 9, e157–e168. [Google Scholar] [CrossRef] [PubMed]
  22. Song, I.; Baek, K.; Kim, C.; Song, C. Effects of Nature Sounds on the Attention and Physiological and Psychological Relaxation. Urban For. Urban Green. 2023, 86, 127987. [Google Scholar] [CrossRef]
  23. Collado, S.; Staats, H.; Corraliza, J.A.; Hartig, T. Restorative Environments and Health. In Handbook of Environmental Psychology and Quality of Life Research; Springer: Cham, Switzerland, 2017; pp. 127–148. [Google Scholar] [CrossRef]
  24. Ratcliffe, E. Sound and Soundscape in Restorative Natural Environments: A Narrative Literature Review. Front. Psychol. 2021, 12, 570563. [Google Scholar] [CrossRef]
  25. Aletta, F.; Oberman, T.; Kang, J. Associations between Positive Health-Related Effects and Soundscapes Perceptual Constructs: A Systematic Review. Int. J. Environ. Res. Public Health 2018, 15, 2392. [Google Scholar] [CrossRef]
  26. Buxton, R.T.; Pearson, A.L.; Allou, C.; Fristrup, K.; Wittemyer, G. A Synthesis of Health Benefits of Natural Sounds and Their Distribution in National Parks. Proc. Natl. Acad. Sci. USA 2021, 118, e2013097118. [Google Scholar] [CrossRef]
  27. Lu, Y.; Hasegawa, Y.; Tan, J.K.A.; Lau, S.K. Effect of Audio-Visual Interaction on Soundscape in the Urban Residential Context: A Virtual Reality Experiment. Appl. Acoust. 2022, 192, 108717. [Google Scholar] [CrossRef]
  28. Preis, A.; Kociński, J.; Hafke-Dys, H.; Wrzosek, M. Audio-Visual Interactions in Environment Assessment. Sci. Total Environ. 2015, 523, 191–200. [Google Scholar] [CrossRef]
  29. Hong, J.Y.; Jeon, J.Y. Designing Sound and Visual Components for Enhancement of Urban Soundscapes. J. Acoust. Soc. Am. 2013, 134, 2026–2036. [Google Scholar] [CrossRef] [PubMed]
  30. Kang, J.; Schulte-Fortkamp, B. Soundscape and the Built Environment; CRC Press: Boca Raton, FL, USA, 2016; pp. 1–301. [Google Scholar] [CrossRef]
  31. Schulte-Fortkamp, B.; Fiebig, A. Impact of Soundscape in Terms of Perception. In Soundscape and the Built Environment; CRC Press: Boca Raton, FL, USA, 2016; pp. 69–88. [Google Scholar] [CrossRef]
  32. Kang, J. From Understanding to Designing Soundscapes. Front. Archit. Civ. Eng. China 2010, 4, 403–417. [Google Scholar] [CrossRef]
  33. ISO. ISO 12913-1:2014-Acoustics—Soundscape-Part 1: Definition and Conceptual Framework. Available online: https://www.iso.org/standard/52161.html (accessed on 9 June 2022).
  34. Brown, A.L. Soundscapes and Environmental Noise Management. Noise Control Eng. J. 2010, 58, 493–500. [Google Scholar] [CrossRef]
  35. Brown, A.L. Advancing the Concepts of Soundscapes and Soundscape Planning. In Proceedings of the Acoustics 2011: Annual Conference of the Australian Acoustical Society, Gold Coast, Australia, 2–4 November 2011. [Google Scholar]
  36. Aletta, F.; Kang, J.; Axelsson, Ö. Soundscape Descriptors and a Conceptual Framework for Developing Predictive Soundscape Models. Landsc. Urban Plan. 2016, 149, 65–74. [Google Scholar] [CrossRef]
  37. Southworth, M. The Sonic Environment of Cities. Environ. Behav. 1969, 1, 49–70. [Google Scholar] [CrossRef]
  38. Raman, T.L.; Aziz, N.A.A.; Yaakob, S.S.N. The Effects of Different Natural Environment Influences on Health and Psychological Well-Being of People: A Case Study in Selangor. Sustainability 2021, 13, 8597. [Google Scholar] [CrossRef]
  39. Wang, P.; He, Y.; Yang, W.; Li, N.; Chen, J. Effects of Soundscapes on Human Physiology and Psychology in Qianjiangyuan National Park System Pilot Area in China. Forests 2022, 13, 1461. [Google Scholar] [CrossRef]
  40. Bai, Z.; Zhang, S. Effects of Different Natural Soundscapes on Human Psychophysiology in National Forest Park. Sci. Rep. 2024, 14, 17462. [Google Scholar] [CrossRef]
  41. Molholm, S.; Ritter, W.; Murray, M.M.; Javitt, D.C.; Schroeder, C.E.; Foxe, J.J. Multisensory Auditory–Visual Interactions during Early Sensory Processing in Humans: A High-Density Electrical Mapping Study. Cogn. Brain Res. 2002, 14, 115–128. [Google Scholar] [CrossRef]
  42. He, Y.; Yang, T.; He, C.; Sun, K.; Guo, Y.; Wang, X.; Bai, L.; Xue, T.; Xu, T.; Guo, Q.; et al. Effects of Audiovisual Interactions on Working Memory: Use of the Combined N-Back + Go/NoGo Paradigm. Front. Psychol. 2023, 14, 1080788. [Google Scholar] [CrossRef]
  43. Bian, Q.; Zhang, C.; Wang, C.; Yin, L.; Han, W.; Zhang, S. Evaluation of Soundscape Perception in Urban Forests Using Acoustic Indices: A Case Study in Beijing. Forests 2023, 14, 1435. [Google Scholar] [CrossRef]
  44. Hedblom, M.; Knez, I.; Ode Sang, A.; Gunnarsson, B. Evaluation of Natural Sounds in Urban Greenery: Potential Impact for Urban Nature Preservation. R. Soc. Open Sci. 2017, 4, 170037. [Google Scholar] [CrossRef]
  45. Li, H.; Lau, S.K. A Review of Audio-Visual Interaction on Soundscape Assessment in Urban Built Environments. Appl. Acoust. 2020, 166, 107372. [Google Scholar] [CrossRef]
  46. Carles, J.L.; Barrio, I.L.; De Lucio, J.V. Sound Influence on Landscape Values. Landsc. Urban Plan. 1999, 43, 191–200. [Google Scholar] [CrossRef]
  47. Pheasant, R.J.; Fisher, M.N.; Watts, G.R.; Whitaker, D.J.; Horoshenkov, K.V. The Importance of Auditory-Visual Interaction in the Construction of “Tranquil Space”. J. Environ. Psychol. 2010, 30, 501–509. [Google Scholar] [CrossRef]
  48. Zhu, C.; Feng, X.; Luo, J.; Fu, S.; Li, T.; Wang, W.; Li, X. Effects of Different Audiovisual Landscapes in Bamboo Forest Space on Physical and Mental Restorative Potential of University Students: Based on Eye-Tracking Experiments. Front. For. Glob. Change 2024, 7, 1415514. [Google Scholar] [CrossRef]
  49. Ekman, P.; Friesen, W.V. Unmasking the Face: A Guide to Recognizing Emotions from Facial Expressions; Malor Books: Cambridge, MA, USA, 1975. [Google Scholar]
  50. Ekman, P.; Friesen, W.V. Facial Action Coding System; PsycTESTS Dataset; APA: Washington, DC, USA, 2019. [Google Scholar] [CrossRef]
  51. Schmidt, K.L.; Cohn, J.F. Human Facial Expressions as Adaptations:Evolutionary Questions in Facial Expression Research. Am. J. Phys. Anthr. 2001, 116 (Suppl. S33), 3. [Google Scholar] [CrossRef]
  52. Adolphs, R. Social Cognition and the Human Brain. Trends Cogn. Sci. 1999, 3, 469–479. [Google Scholar] [CrossRef]
  53. Dawel, A.; Miller, E.J.; Horsburgh, A.; Ford, P. A Systematic Survey of Face Stimuli Used in Psychological Research 2000–2020. Behav. Res. Methods 2022, 54, 1889–1901. [Google Scholar] [CrossRef] [PubMed]
  54. Fridlund, A.J.; Crivelli, C.; Jarillo, S.; Fernández-Dols, J.-M.; Russell, J.A. Facial Expressions. In Encyclopedia of Evolutionary Psychological Science; Springer: Cham, Switzerland, 2019; pp. 1–7. [Google Scholar] [CrossRef]
  55. Santhoshkumar, R.; Kalaiselvi Geetha, M. Deep Learning Approach for Emotion Recognition from Human Body Movements with Feedforward Deep Convolution Neural Networks. Procedia Comput. Sci. 2019, 152, 158–165. [Google Scholar] [CrossRef]
  56. Tarnowski, P.; Kołodziej, M.; Majkowski, A.; Rak, R.J. Emotion Recognition Using Facial Expressions. Procedia Comput. Sci. 2017, 108, 1175–1184. [Google Scholar] [CrossRef]
  57. Hu, X.; Meng, Q.; Yang, D.; Li, M. Facial Expression Recognition, a Predictive Tool for Perceiving Urban Open Space Environments under Audio-Visual Interaction. Energy Build. 2024, 318, 114456. [Google Scholar] [CrossRef]
  58. Sowunmi, M.A. The Significance of the Oil Palm (Elaeis guineensis Jacq.) in the Late Holocene Environments of West and West Central Africa: A Further Consideration. Veg. Hist. Archaeobotany 1999, 8, 199–210. [Google Scholar] [CrossRef]
  59. Okolo, C.C.; Okolo, E.; Nnadi, A.L.; Obikwelu, F.E.; Obalum, S.E.; Igwe, C. The Oil Palm (Elaeis guineensis Jacq): Nature’s Ecological Endowment to Eastern Nigeria. Agro-Science 2019, 18, 48. [Google Scholar] [CrossRef]
  60. Nkemdirim, I.B. An Insight into The Essence of Igbo Plant Symbols. In Representing African Indigenous Knowledge System; Rural Research & Advocacy Society: Owerri, Nigeria, 2018. [Google Scholar]
  61. Hornibrook, J.; Lin, E.; Ormond, T. Using the IPhone for Voice Recordings in Laryngology. Otolaryngol.–Head. Neck Surg. 2011, 145, 58–59. [Google Scholar] [CrossRef]
  62. Lin, E.; Hornibrook, J.; Ormond, T. Evaluating IPhone Recordings for Acoustic Voice Assessment. Folia Phoniatr. Logop. 2012, 64, 122–130. [Google Scholar] [CrossRef] [PubMed]
  63. Jia, Y.; Ma, H.; Kang, J.; Wang, C. The Preservation Value of Urban Soundscape and Its Determinant Factors. Appl. Acoust. 2020, 168, 107430. [Google Scholar] [CrossRef]
  64. Deng, L.; Luo, H.; Ma, J.; Huang, Z.; Sun, L.X.; Jiang, M.Y.; Zhu, C.Y.; Li, X. Effects of Integration between Visual Stimuli and Auditory Stimuli on Restorative Potential and Aesthetic Preference in Urban Green Spaces. Urban For. Urban Green. 2020, 53, 126702. [Google Scholar] [CrossRef]
  65. Zhao, W.; Li, H.; Zhu, X.; Ge, T. Effect of Birdsong Soundscape on Perceived Restorativeness in an Urban Park. Int. J. Environ. Res. Public Health 2020, 17, 5659. [Google Scholar] [CrossRef] [PubMed]
  66. Lewinski, P.; Fransen, M.L.; Tan, E.S.H. Predicting Advertising Effectiveness by Facial Expressions in Response to Amusing Persuasive Stimuli. J. Neurosci. Psychol. Econ. 2014, 7, 1–14. [Google Scholar] [CrossRef]
  67. Hong, J.Y.; Jeon, J.Y. The Effects of Audio–Visual Factors on Perceptions of Environmental Noise Barrier Performance. Landsc. Urban Plan. 2014, 125, 28–37. [Google Scholar] [CrossRef]
  68. Dores, A.R.; Barbosa, F.; Queirós, C.; Carvalho, I.P.; Griffiths, M.D. Recognizing Emotions through Facial Expressions: A Largescale Experimental Study. Int. J. Environ. Res. Public Health 2020, 17, 7420. [Google Scholar] [CrossRef]
  69. Yan, W.; Meng, Q.; Yang, D.; Li, M. Developing a theory of tranquility in urban public open spaces for future designs. Appl. Acoust. 2024, 217, 109824. [Google Scholar] [CrossRef]
  70. Jeon, J.Y.; Lee, P.J.; You, J.; Kang, J. Perceptual Assessment of Quality of Urban Soundscapes with Combined Noise Sources and Water Sounds. J. Acoust. Soc. Am. 2010, 127, 1357–1366. [Google Scholar] [CrossRef]
  71. Pérez-Martínez, G.; Torija, A.J.; Ruiz, D.P. Soundscape Assessment of a Monumental Place: A Methodology Based on the Perception of Dominant Sounds. Landsc. Urban Plan. 2018, 169, 12–21. [Google Scholar] [CrossRef]
  72. Axelsson, Ö. How to Measure Soundscape Quality. In Proceedings of the Euronoise 2015 Conference, Maastricht, The Netherlands, 31 May–3 June 2015. [Google Scholar]
  73. Liu, Y.; Wang, Z.; Yu, G. The Effectiveness of Facial Expression Recognition in Detecting Emotional Responses to Sound Interventions in Older Adults with Dementia. Front. Psychol. 2021, 12, 707809. [Google Scholar] [CrossRef]
  74. Meng, Q.; Hu, X.; Kang, J.; Wu, Y. On the Effectiveness of Facial Expression Recognition for Evaluation of Urban Sound Perception. Sci. Total Environ. 2020, 710, 135484. [Google Scholar] [CrossRef]
  75. Fadel, N.E. Facial Recognition Algorithms: A Systematic Literature Review. J. Imaging 2025, 11, 58. [Google Scholar] [CrossRef] [PubMed]
  76. Zarbakhsh, P.; Demirel, H. Low-Rank Sparse Coding and Region of Interest Pooling for Dynamic 3D Facial Expression Recognition. Signal. Image Video Process. 2018, 12, 1611–1618. [Google Scholar] [CrossRef]
  77. Bartlett, M.S.; Littlewort, G.; Frank, M.; Lainscsek, C.; Fasel, I.; Movellan, J. Recognizing Facial Expression: Machine Learning and Application to Spontaneous Behavior. In Proceedings of the 2005 IEEE Computer Society Conference on Computer Vision and Pattern Recognition, CVPR 2005, San Diego, CA, USA, 20–25 June 2005; Volume II, pp. 568–573. [Google Scholar] [CrossRef]
  78. Amor, B.B.; Drira, H.; Berretti, S.; Daoudi, M.; Srivastava, A. 4-D Facial Expression Recognition by Learning Geometric Deformations. IEEE Trans. Cybern. 2014, 44, 2443–2457. [Google Scholar] [CrossRef]
  79. Franěk, M.; Petružálek, J.; Šefara, D. Facial Expressions and Self-Reported Emotions When Viewing Nature Images. Int. J. Environ. Res. Public Health 2022, 19, 10588. [Google Scholar] [CrossRef]
  80. Franěk, M.; Petružálek, J. Viewing Natural vs. Urban Images and Emotional Facial Expressions: An Exploratory Study. Int. J. Environ. Res. Public Health 2021, 18, 7651. [Google Scholar] [CrossRef] [PubMed]
  81. LaFrance, M.; Hecht, M.A.; Paluck, E.L. The Contingent Smile: A Meta-Analysis of Sex Differences in Smiling. Psychol. Bull. 2003, 129, 305–334. [Google Scholar] [CrossRef]
  82. Hall, J.A. Nonverbal Sex Differences: Accuracy of Communication and Expressive Style; Johns Hopkins University Press: Baltimore, MD, USA, 1984; p. 207. [Google Scholar]
  83. Kring, A.M.; Gordon, A.H. Sex Differences in Emotion: Expression, Experience, and Physiology. J. Pers. Soc. Psychol. 1998, 74, 686–703. [Google Scholar] [CrossRef]
  84. Kret, M.E.; De Gelder, B. A Review on Sex Differences in Processing Emotional Signals. Neuropsychologia 2012, 50, 1211–1221. [Google Scholar] [CrossRef] [PubMed]
  85. Wiggert, N.; Wilhelm, F.H.; Derntl, B.; Blechert, J. Gender Differences in Experiential and Facial Reactivity to Approval and Disapproval during Emotional Social Interactions. Front. Psychol. 2015, 6, 1372. [Google Scholar] [CrossRef] [PubMed]
  86. McDuff, D.; El Kaliouby, R.; Kassam, K.; Picard, R. Affect Valence Inference from Facial Action Unit Spectrograms. In Proceedings of the 2010 IEEE Computer Society Conference on Computer Vision and Pattern Recognition-Workshops, CVPRW 2010, San Francisco, CA, USA, 13–18 June 2010; pp. 17–24. [Google Scholar] [CrossRef]
  87. Uebel, K.; Marselle, M.; Dean, A.J.; Rhodes, J.R.; Bonn, A. Urban Green Space Soundscapes and Their Perceived Restorativeness. People Nat. 2021, 3, 756–769. [Google Scholar] [CrossRef]
  88. Van Kamp, I.; Van Kempen, E.; Klaeboe, R.; Kruize, H.; Brown, A.L.; Lercher, P. Soundscapes, Human Restoration and Quality of Life. In Proceedings of the INTER-NOISE 2016—45th International Congress and Exposition on Noise Control Engineering: Towards a Quieter Future, Hamburg, Germany, 21–24 August 2016; pp. 1948–1958. [Google Scholar] [CrossRef]
  89. Benfield, J.A.; Taff, B.D.; Newman, P.; Smyth, J. Natural Sound Facilitates Mood Recovery. Ecopsychology 2014, 6, 183–188. [Google Scholar]
  90. Hong, J.Y.; Jeon, J.Y. Influence of Urban Contexts on Soundscape Perceptions: A Structural Equation Modeling Approach. Landsc. Urban Plan. 2015, 141, 78–87. [Google Scholar] [CrossRef]
Figure 1. Geographic location of study areas: (a) Map of Nigeria showing Imo State. (b) Aerial view of Ada Palm Plantation. (c) Aerial view of Umunanta Rubber Plantation. (d) Image of palm vegetation. (e) Image of rubber plantation.
Forests 16 00937 g001
Figure 2. Laboratory set-up for audiovisual experiment and facial expressions: (a) Palm vegetation experiment. (b) Rubber vegetation experiment.
Forests 16 00937 g002
Figure 3. Valence mean value of facial expressions: (a) Palm vegetation (morning); (b) Palm vegetation (afternoon); (c) Rubber vegetation (morning); (d) Rubber vegetation (afternoon); (e) Male participants; (f) Female participants.
Forests 16 00937 g003
Figure 4. Graphical representation of dominant facial expressions analyzed in each monocultural vegetation. (a) Palm morning. (b) Palm afternoon. (c) Rubber morning. (d) Rubber afternoon. (e) Male participants. (f) Female participants.
Forests 16 00937 g004
Figure 5. Correlation between soundscape, visual perception and facial expressions of palm vegetation.
Forests 16 00937 g005
Figure 6. Correlation between soundscape, visual perception and facial expressions of rubber vegetation.
Forests 16 00937 g006
Table 1. Study area and selection criteria.
Study AreaEconomic Value≥75% Single Vegetation CoverageAccessibility and ProximitySound Sources
Palm Forest (Study Area 1)Source of Food, Raw materials for Arts and Craft.>75% vegetation coverageAccessible and particular to Eastern regionFrancolin, Eagle and insects
Rubber Plantation (Study Area 2)Timber, raw materials, natural rubber latex.>75% vegetation coverageAccessible and particular to Eastern regionKite, Village weaver and insects
Table 2. Questionnaire design.
Questionnaire Design
Section 1: Socioeconomic and Demographic
GenderMale, Female
AgeUp to 18 yrs, 18–30 yrs, 31–40 yrs, 41–60 yrs, above 60 yrs
EducationNo education, secondary, undergraduate, graduate, and postgraduate.
OccupationEmployed, self-employed, business, student, and business
Section 2: Soundscape Perception
On a scale of 1–5, what is your overall soundscape perception of the vegetation sound environment?
(5 extremely Pleasant–1 extremely annoying)
(5 extremely calm–1 extremely chaotic)
(5 extremely eventful–1 extremely uneventful)
(5 extremely vibrant–1 extremely monotonous)
(5 extremely appropriate–1 extremely inappropriate)
Section 3: Visual Perception
(5 extremely beautiful–1 extremely ugly)
(5 extremely natural–1 extremely artificial)
(5 extremely relaxed–1 extremely anxious)
(5 extremely comfortable–1 extremely uncomfortable)
Table 3. Soundscape perception of monocultural vegetation.
Descriptive Statistics Annoying-Pleasant Chaotic-CalmUneventful-EventfulMonotonous-VibrantInappropriate-Appropriate
Palm Vegetation
Mean4.074.274.284.124.10
SD0.690.590.710.510.54
Variance 0.480.350.510.260.29
Skewness−2.04−0.17−0.900.200.08
Kurtosis9.39−0.461.230.770.51
Rubber Vegetation
Mean4.104.274.204.054.12
SD0.590.590.720.630.51
Variance 0.340.350.520.410.27
Skewness−0.80−0.17−0.75−0.040.20
Kurtosis3.55−0.460.85−0.390.77
where SD = standard deviation.
Table 4. Visual perception of monocultural vegetation.
Descriptive Statistics Ugly-Beautiful Artificial-NaturalAnxious-RelaxedUncomfortable-Comfortable
Palm Vegetation
Mean4.054.154.124.05
SD0.590.530.610.59
Variance0.350.280.360.35
Skewness−0.770.150.78−0.77
Kurtosis3.110.433.113.11
Rubber Vegetation
Mean3.974.154.104.00
SD0.650.530.620.55
Variance0.430.280.400.30
Skewness−0.530.15−0.71−0.94
Kurtosis1.230.432.314.33
Table 5. Relationship between soundscape and visual perception.
Annoying-Pleasant Chaotic-CalmUneventful-EventfulMonotonous-VibrantInappropriate-Appropriate
Palm Vegetation ** Significant at 0.01
Ugly-
Beautiful
0.919 **0.750 **0.807 **0.895 **0.929 **
Artificial-
Natural
0.869 **0.831 **0.762 **0.955 **0.917 **
Anxious-
Relaxed
0.951 **0.820 **0.804 **0.931 **0.891 **
Uncomfortable-
Comfortable
0.919 **0.750 **0.807 **0.895 **0.929 **
Rubber Vegetation ** Significant at 0.01
Ugly-
Beautiful
0.862 **0.732 **0.817 **0.916 **0.838 **
Artificial-
Natural
0.928 **0.831 **0.784 **0.881 **0.955 **
Anxious-
Relaxed
0.934 **0.806 **0.852 **0.876 **0.904 **
Uncomfortable-
Comfortable
0.861 **0.695 **0.767 **0.724 **0.807 **
Disclaimer/Publisher’s Note: The statements, opinions and data contained in all publications are solely those of the individual author(s) and contributor(s) and not of MDPI and/or the editor(s). MDPI and/or the editor(s) disclaim responsibility for any injury to people or property resulting from any ideas, methods, instructions or products referred to in the content.

