Article

Passive Long-Term Acoustic Sampling Reveals Multiscale Temporal Ecological Pattern and Anthropogenic Disturbance of Campus Forests in a High Density City

1
College of Architecture and Urban Planning, Tongji University, Shanghai 200070, China
2
Key Laboratory of Smart Spatial Planning Technology, Ministry of Natural Resources, Shanghai 200092, China
3
Shanghai Natural History Museum, Shanghai 200041, China
*
Author to whom correspondence should be addressed.
Forests 2025, 16(8), 1289; https://doi.org/10.3390/f16081289
Submission received: 31 May 2025 / Revised: 1 August 2025 / Accepted: 5 August 2025 / Published: 7 August 2025
(This article belongs to the Special Issue Soundscape in Urban Forests—2nd Edition)

Abstract

Biodiversity conservation and sustainable development in high-density forest urban areas have attracted growing attention and are increasingly recognized as critical for achieving the Sustainable Development Goals (SDGs). University campus forests, functioning as ecological islands, possess unique acoustic characteristics and play a vital role in supporting urban biodiversity. In this case study, acoustic monitoring was conducted over the course of a full year to objectively reveal the ecological patterns across temporal scales of the campus sound environment, by combining acoustic indices’ visualization combined with statistical analysis. The findings indicate (1) the existence of ecological sound patterns across different temporal scales, closely associated with phenological cycles; (2) the identification of the specific timing affected by the different species‘ activities, such as the breeding season of birds, the chirping time of cicadas and other insects, as well as the fluctuations in the intensity of human activities, and (3) the development of a methodological framework integrating a visualization technique with statistical analysis to enhance the understanding of long-term ecological dynamics. The results offer a foundation for promoting the sustainable conservation of campus biodiversity in high-density urban settings.

1. Introduction

University campuses, constituting vital components of urban ecological systems, can be utilized as representative case studies for the assessment and monitoring of urban ecosystem conditions [1]. From the perspective of landscape ecology, ecological islands in high-density urban areas contain more green spaces and higher biodiversity than surrounding urban environments [2,3]. The site in this study can be recognized as an ecological island within Shanghai’s land use configuration. Given that birds and insects exhibit high sensitivity to environmental changes, they function as effective bioindicators [4,5,6,7]. Natural sounds produced by birds and insects not only enhance students’ experiences of nature but also provide both emotional and physical health benefits [8,9]. However, anthropogenic sounds, such as traffic and mechanical noise, increasingly disrupt these environments, negatively impacting the organisms that inhabit them [10,11]. Despite growing recognition of the importance of urban soundscapes, the existing literature on accurately depicting temporal ecological patterns in human–wildlife interactions is limited and often substitutes human disturbance intensity with land use type [12,13,14,15,16,17].
Passive acoustic monitoring technology is an efficient, non-invasive, and continuous method for assessing ecosystem dynamics, which can help identify ecological patterns across multiple spatial and temporal scales [18]. Nevertheless, its application has been considerably underestimated. Furthermore, no standardized protocols currently define appropriate sampling strategies or the necessary recording durations for reliably revealing temporal ecological patterns. Most existing studies focus on differences between sites and treat study sites as static locations rather than dynamic environments [15,19,20,21,22,23,24,25]. The few studies that explore sampling methods also have different focuses. From the perspective of variance in acoustic indices’ standard error, one study found that at least 120 h of continuous recording is required to quantify a site’s soundscape characteristics [26]. From a species diversity measurement standpoint, another study determined that four days of recording at 180 min per day is necessary for adequate assessment [27]. Overall, the standardization of passive acoustic monitoring (PAM) remains in its infancy, with one report about PAM guidelines focusing solely on the standardization of collection metrics rather than monitoring resolution and duration [28].
Even when large-scale acoustic datasets are obtained, extracting effective indicators to reflect ecological patterns remains a major challenge, as considerable information can be lost when converting complex soundscapes into numerical arrays. Among existing approaches, voiceprint recognition and acoustic indices are the two most widely used. While voiceprint recognition, especially for bird species identification, can provide detailed insights, it is typically expensive and time-consuming. In contrast, acoustic indices (AIs) offer a rapid, scalable approach for analyzing large datasets and are widely adopted in ecological research. These indices-based time-series data capture multiple dimensions of soundscape variability, including frequency, intensity, and temporal characteristics, thereby offering a means to infer ecological patterns and biodiversity dynamics [29].
Nevertheless, the challenge of analyzing acoustic indices lies in the fact that different methodological approaches yield divergent conclusions [29,30]. The first step in analysis is data visualization. However, the current visualization methods are insufficient for effectively revealing long-term ecological patterns from acoustic indices. Existing methods primarily fall into two categories: traditional plots (e.g., line graphs and boxplots) and long-duration false-color (LDFC) spectrograms. Line plots simplify 24 h sound recordings into a few representative values and enable comparisons between selected periods [31]. However, because of space limitations, they cannot accommodate comparisons across hundreds of days, making them more suitable for studies focusing on contrasts between specific sites or conditions. Boxplots and scatter plots share similar limitations.
In contrast, LDFC spectrograms—an increasingly popular method—enhance the readability of Mel spectrograms and allow for more detailed visual comparisons [32,33]. These spectrograms preserve frequency and precise timing information, compressing thousands of acoustic data points from a 24 h period into a single graph. Although LDFC spectrograms are effective for comparing a few representative days across seasons or locations, they are less suitable for depicting continuous ecological patterns over extended periods. Consequently, both traditional graphs and LDFC methods are, respectively, too coarse and too detailed for examining ecological dynamics across hundreds of days. There remains a critical need for intermediate-resolution visualization methods.
To address these research gaps, the present study utilizes a campus forest located within a high-density urban environment as a case study. The case study aims to (1) uncover multiscale temporal ecological patterns in high-density urban forests, with particular emphasis on the influences of biological activity and human disturbances; and (2) develop a methodological framework for extracting ecological pattern information from large-scale acoustic datasets through data visualization and statistical analysis, thereby contributing to a deeper understanding of urban noise impacts and promoting the conservation of urban biodiversity.

2. Materials and Methods

2.1. Site Description

The study site, SanHaoWu, is located on the Tongji Campus in the Yangpu District of Shanghai, China (shown in Figure 1). This campus exemplifies a typical environment in a densely populated city. Covering an area of 7890 square meters, SanhaoWu was established in 1956 as a traditional Chinese garden and is recognized as one of the most biodiverse areas on the Tongji Campus, based on monitoring conducted over the past five years. Bird surveys across the campus have identified around 114 species, including Spilopelia chinensis, Alcedo atthis, Pycnonotus sinensis, Turdus mandarinus and Copsychus saularis. Additionally, infrared cameras have captured images of Erinaceus amurensis, Mustela sibirica and Callosciurus erythraeus.
The garden is surrounded by four lanes designated for non-motorized vehicles. Due to the continuous human activity on campus, this site represents a typical example of urban green space. The acoustic monitoring device, SongMeter4 (SM4, Wildlife Acoustics, Inc., Maynard, MA, USA), was installed on a camphor tree 1.8 m above the ground, located on a slight slope adjacent to an internal road within the garden. The geographic coordinates of the device are 31.291667° N, 121.509195° E.
The recording device is situated within dense vegetation, dominated by tree species such as Black Locust (Robinia pseudoacacia), Glossy Privet (Ligustrum lucidum) and Camphor Tree (Camphora officinarum), complemented by understory shrubs including Chinese Box (Buxus sinica) and Spotted Laurel (Aucuba japonicavariegata’). A campus public broadcast speaker column, approximately 3 m in height, is situated approximately 20 m northeast of the acoustic monitor. As a result, the acoustic recordings inevitably capture a diverse array of anthropogenic sounds, including vehicular traffic, campus announcements, student interactions, and mechanical noise associated with early morning street maintenance operations.

2.2. Data Collection

The acoustic data were recorded using a passive acoustic monitor (SM4) with a sampling rate of 44,100 Hz and a bit depth of 16 bits. Recordings were made in stereo dual-channel mode, with all other parameters set to their default values. The recording duration spanned from 8 November 2022 to 24 November 2023, covering a total of 381 days, representing a complete natural year. The sampling strategy involved recording for 5 min each hour, followed by a 55 min pause, resulting in a total of 120 min of audio recordings per day. After excluding files lost during battery replacement, a total of 8488 sound files were obtained. During the monitoring period, the ecological patterns were influenced by bird breeding season, insect acoustic activity, and variations in human activity levels.
To investigate the influence of the bird breeding season, data were selected from both the breeding season and a corresponding control period (characterized by the absence of breeding and insect activity) (shown in Figure 2). In Shanghai, March to May is widely recognized as the primary breeding season for major resident bird species, during which variations in acoustic rhythms may arise due to behaviors associated with courtship and mating. Control period data, unaffected by insect activity, were selected for comparison.
Preliminary analysis indicated that the impact of cicadas on the soundscape differed significantly from those of other insect species. Cicadas exhibit peak acoustic activity during July and August each year, whereas no clear consensus exists regarding the active periods of other insect species. In this study, months in which more than half of the days (≥15 days) exhibited insect chirping activity were classified as insect-active months, while those with fewer active days were categorized as insect-inactive periods. Manual audio inspections indicated that insect chirping largely ceased after 20 December 2022 and resumed around 30 June 2023 (shown in Figure 2). To avoid confounding effects from the bird breeding season, data from the breeding period were excluded from the analysis. Consequently, cicada-active periods were defined as July and August, other insect-active periods as September to December, and control periods (without breeding or insect activity) as January, February, and June (shown in Figure 2).
To investigate the effects of human activity variations on ecological patterns, data from November and the winter holiday period across two consecutive years were selected to compare periods of high and low human activity (shown in Figure 2). Human activity intensity was distinguished based on academic semesters and holiday breaks. To minimize confounding effects from bird breeding and insect chirping, November and the winter holiday were specifically chosen as study periods. Winter holiday starts on 19 January 2023 and ends on 17 February 2023.
Historical weather data were retrieved from the “Environment Cloud” platform using Python. These hourly data record temperature, humidity, and weather conditions. Rainy periods were filtered based on the “weather condition” column, as rain substantially interferes with soundscape data. Detailed information is provided in Supplementary Materials S1.
Sunrise and sunset data were obtained from the Sunrise-Sunset.org platform using Python to cross-reference and delineate daytime and nighttime soundscape boundaries. Detailed records are provided in Supplementary Materials S2.

2.3. Acoustic Indices Computation

Given the variety of available acoustic indices, six classic indices were selected based on their widespread application and relevance to biodiversity research [24,25,34,35].
R language packages are employed to compute six classic indices. Acoustic Complexity Indices (ACI), Acoustic Entropy Indices (H) and the Normalized Difference Soundscape Indices (NDSI) are calculated using the seewave package, and the Acoustic Diversity Indices (ADI), Bioacoustics Indices (BIO), and Acoustic Evenness Indices (AEI) are computed using the soundecology package [35]. A detailed description of the calculation methods for these acoustic indices can be found in Table 1. All indices were computed with default settings, except for BIO, for which the minimum frequency was set to 2000 Hz and the maximum frequency to 22,050 Hz, following the Nyquist–Shannon sampling theorem. The R version used for these computations was 4.5.0.

2.4. Data Visualization

Data visualization techniques were employed to reveal multiscale temporal ecological patterns of sound.
Annual scale: Six heatmaps were generated based on individual acoustic indices to illustrate temporal soundscape variations. Among them, the NDSI heatmap displayed the clearest temporal pattern, with values approaching 1 during biological sound dominance and −1 during anthropogenic noise dominance [35]. It was chosen based on observed performance, not a priori hypotheses. Full visualizations of all indices and raw data are presented in Supplementary Materials S3. Visualizations were generated using the Chiplot platform (https://www.chiplot.online/, accessed on 20 November 2024).
Monthly scale: Circular heatmaps based on BIO values were used to investigate biophony dynamics. BIO was selected because it quantifies the total energy above 2 kHz, with higher values indicating greater richness and diversity of biological sounds. It was chosen based on observed performance, not a priori hypotheses. These visualizations illustrate fluctuations in bird vocalization peaks across months.
Daily scale: To capture daily ecological trends, standardized and averaged values of all acoustic indices (except AEI, which is inversely correlated with biophony richness) were used. After excluding rainy and incomplete recording days, daily data were standardized using the z-score method. Two averaging processes were performed: first by categorized period, and second by index. A spline fitting method (smoothing factor = 0.1) was then applied to produce a smooth curve representing the ecological trend for each period. Analyses were conducted using Python 3.10 with the Matplotlib library (version 3.9.2) [41] and the scikit-learn library (version 1.6.1) [42]. Days with mean standardized index values above 0 were classified as daytime soundscapes, and those below 0 as nighttime soundscapes.

2.5. Statistical Analysis

Univariate tests were employed to assess differences in daily ecological patterns between periods categorized by biological and anthropogenic factors. A univariate approach was chosen to evaluate whether specific factors individually influenced the soundscape at given times from both a trend perspective and an hourly perspective, rather than investigating interactions across factors. The null hypothesis posits that the factor (e.g., bird breeding, insect activity, or human activity density) has no impact on the soundscape at the specified time. Conversely, the alternative hypothesis suggests that the factor does indeed influence the soundscape at the given time. The alternative hypothesis is supported when the p-value falls below the predetermined threshold.
Initially, rainy days and incomplete recording days were excluded from analysis. Differences in daily ecological trends and single-time-point comparisons were both considered. For instance, one period may exhibit generally higher sound richness than another, even if their daily trends appear similar. Thus, hourly comparisons of z-score standardized data were conducted to identify specific times influenced by each factor.
A highly significant test result, indicated by a lower p-value, suggests a stronger correlation between the time point and the specific factor. Since the research question involves multiple hypothesis testing, the Bonferroni correction method is applied to adjust for multiple comparisons, setting the critical p-value to 0.01/24. All statistical analyses were conducted using the scikit-learn package in Python version 3.10.

3. Results

3.1. Ecological Vital Patterns Across Different Time Scales

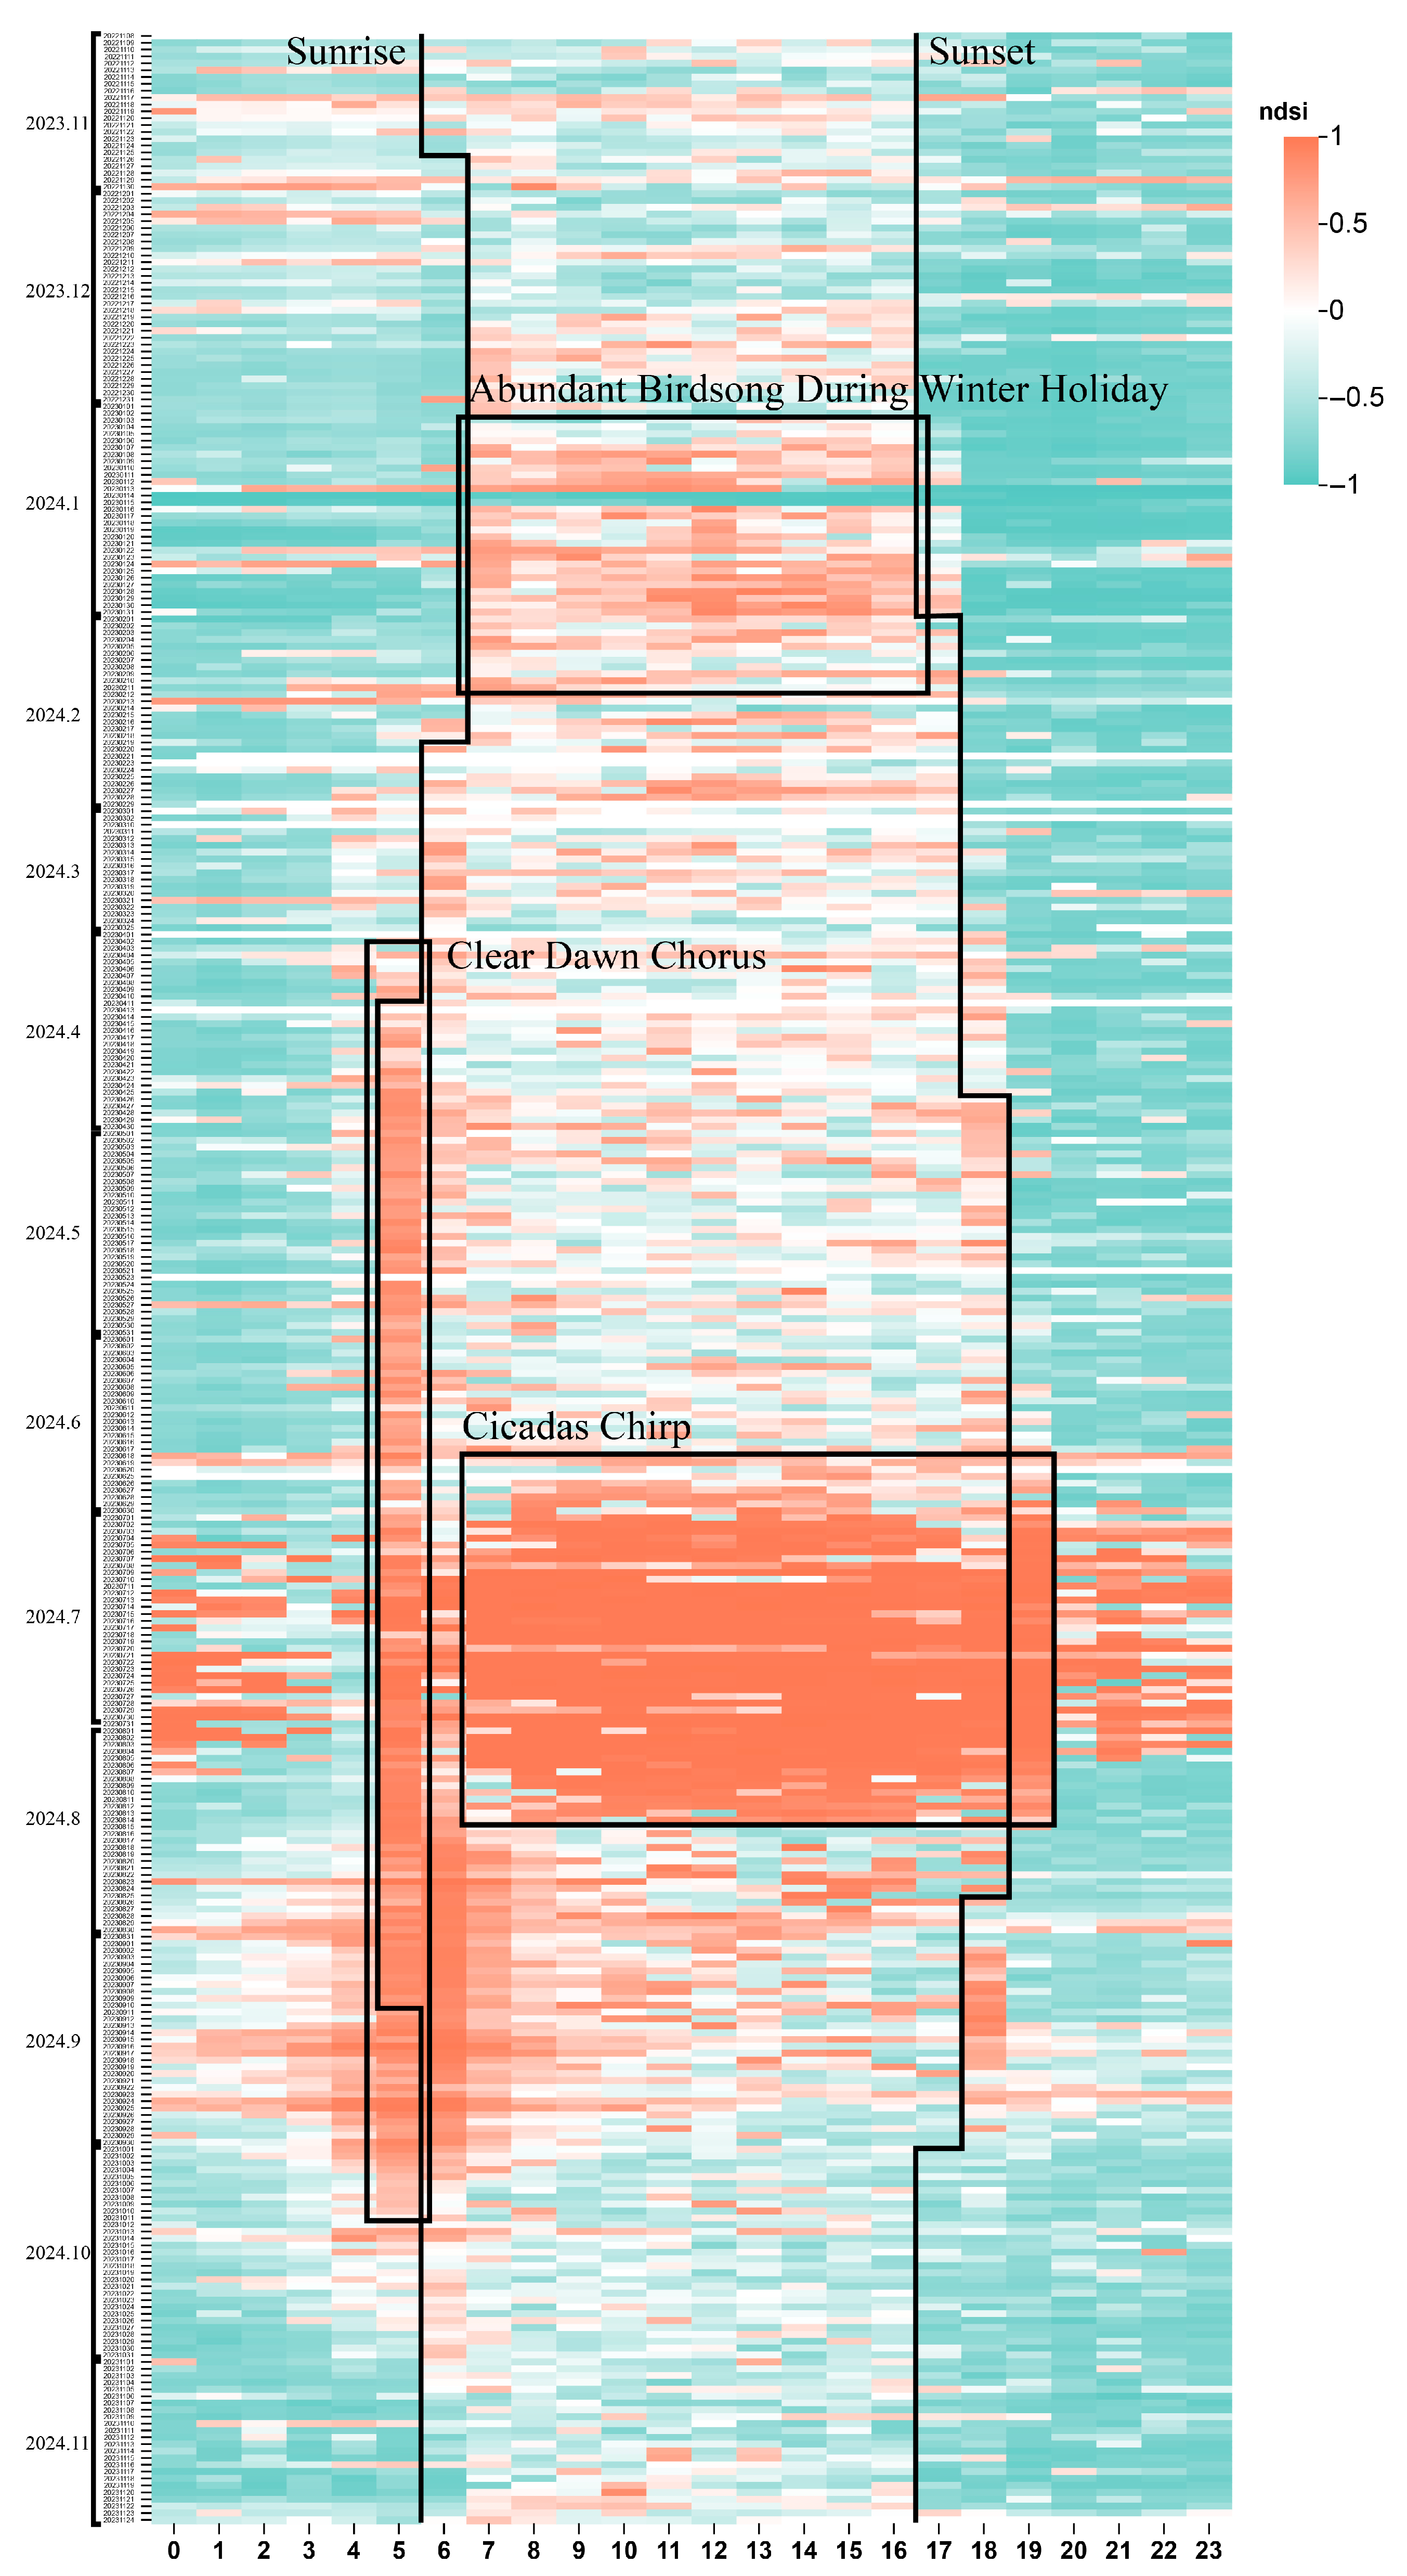
At the annual scale (shown in Figure 3), NDSI was chosen as it clearly reflects ecological pattern characteristics like bird breeding activities, insect chirping, and variations in human activity intensity, more so than other indices. In addition, a strong coupling relationship was observed between the NDSI values and the timing of sunrise and sunset. This is caused by bird vocalizations during the day and traffic noise at night.
At the monthly scale (shown in Figure 4), BIO was selected due to its effectiveness in capturing biological sound activity. According to the BIO heatmap, from November 2022 to January 2023, the onset of daytime sounds was delayed, and the richness and diversity of daytime sounds decreased, suggesting reduced bird activity. From February to June 2023, the onset of daytime sounds occurred earlier, and the duration of daytime acoustic activity was extended, featuring a prominent bird chorus. From July to September 2023, cicada chirping significantly influenced the soundscape, particularly from mid-July to mid-August, resulting in a decline in bird calls. From November to December 2023, both bird vocalizations and insect activity declined further, leading to reduced soundscape richness.
At the daily scale, ecological trends could be distinctly categorized into daytime and nighttime periods. Generally, sound diversity and richness declined after midnight, began to increase around 2 A.M., and peaked between 7 and 8 A.M. A turning point was observed around 10 A.M., followed by another peak around 1 P.M. Thereafter, sound richness gradually declined until the onset of nighttime sounds around 6 P.M. Additionally, a peak in nighttime sounds was noted around 9 P.M.

3.2. How Bird Breeding Seasons Influence Daily Ecological Pattern

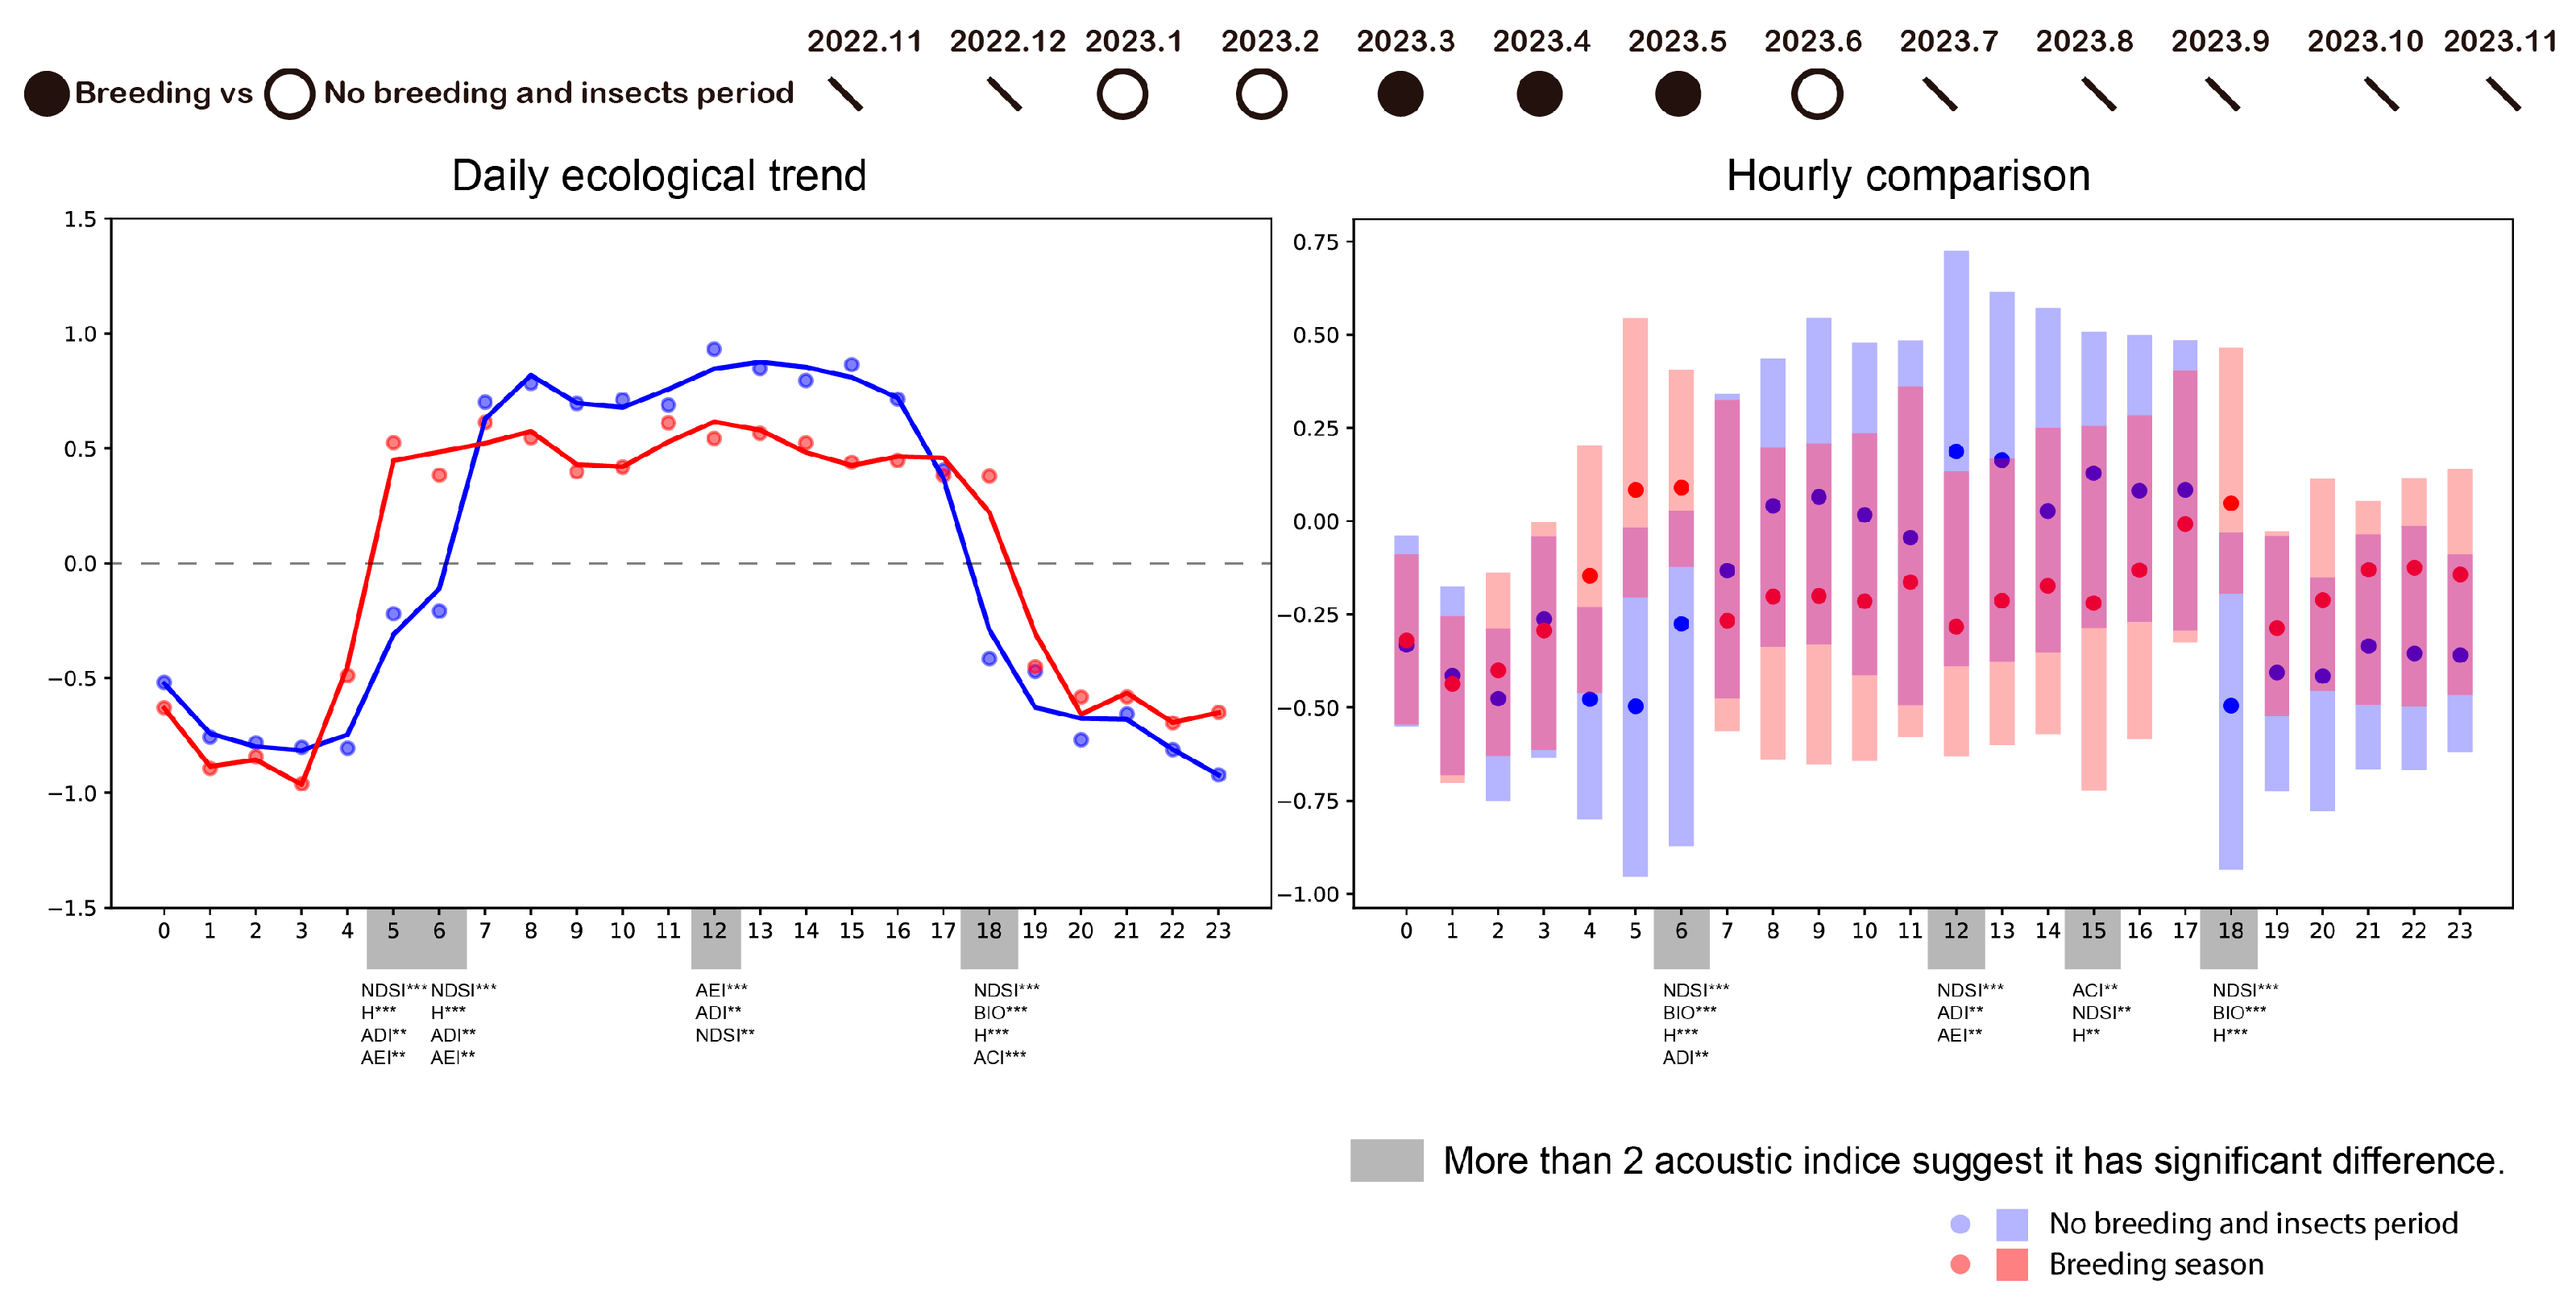
Based on daily ecological trends (shown in the left graph of Figure 5), the bird breeding season extended the duration of the daytime soundscape, resulting in three distinct acoustic peaks. During the breeding season, daytime acoustic activity persisted from 5 A.M. to 6 P.M., compared to 7 A.M. to 5 P.M. during the non-breeding, non-insect period—a difference of approximately three hours. Furthermore, during the breeding season, daytime soundscapes exhibited peaks at 8 A.M., 12 P.M., and 5 P.M., whereas during the non-breeding, non-insect period, peaks occurred at 8 A.M. and 1 P.M.
Hourly comparisons (shown in the right graph of Figure 5) revealed that soundscape richness at 6 A.M. and 6 P.M. was significantly higher during the breeding season than during the control period. Conversely, richness at 12 P.M. and 3 P.M. was significantly lower during the breeding season.
Overall, the onset of the breeding season results in alterations to daily ecological patterns, characterized by elevated early morning and evening peaks. Meanwhile, sound richness during other periods of the daytime exhibited a slight decline. Among all indices, NDSI emerged as the most effective indicator of these seasonal variations, highlighting its sensitivity to variations in bird singing frequency.

3.3. How Insects Influence Daily Ecological Pattern

Daily ecological trends revealed distinct differences between cicada-active periods and periods dominated by other insect activity. During periods of other insect activity, nighttime soundscapes began around 5 P.M.; during control periods (non-breeding, non-insect), they began at 6 P.M. (shown in the bottom left graph of Figure 6); and during cicada-active periods, they began later, around 8 P.M. Nighttime soundscapes in all three periods followed similar trends, reaching a trough between 2 A.M. and 4 A.M. and a minor peak around 9 P.M (shown in the top left graph of Figure 6). Regarding daytime soundscapes, the cicada-active period showed a distinct peak at 5 A.M., whereas the control and other insect-active periods exhibited peaks at 8 A.M.
Hourly comparisons showed that cicadas had a pervasive influence throughout the day, elevating soundscape richness consistently relative to the control period (shown in the top right graph of Figure 6). In contrast, the influence of other insects was mainly restricted to nighttime, enhancing nocturnal sound richness compared to the control period (shown in the bottom right graph of Figure 6).
Both cicadas and other insects blurred the traditional distinction between daytime and nighttime acoustic patterns. Cicada chirping exerted continuous influences throughout the day, particularly at 6 P.M. and 7 P.M., whereas the activity of other insects was primarily concentrated between 2 A.M. and 4 A.M. Different acoustic indices demonstrated varying sensitivities to these insect activities, with ADI, AEI, and NDSI showing strong performance in detecting the impacts of insects.

3.4. How Human Activity Intensity Influences Daily Ecological Pattern

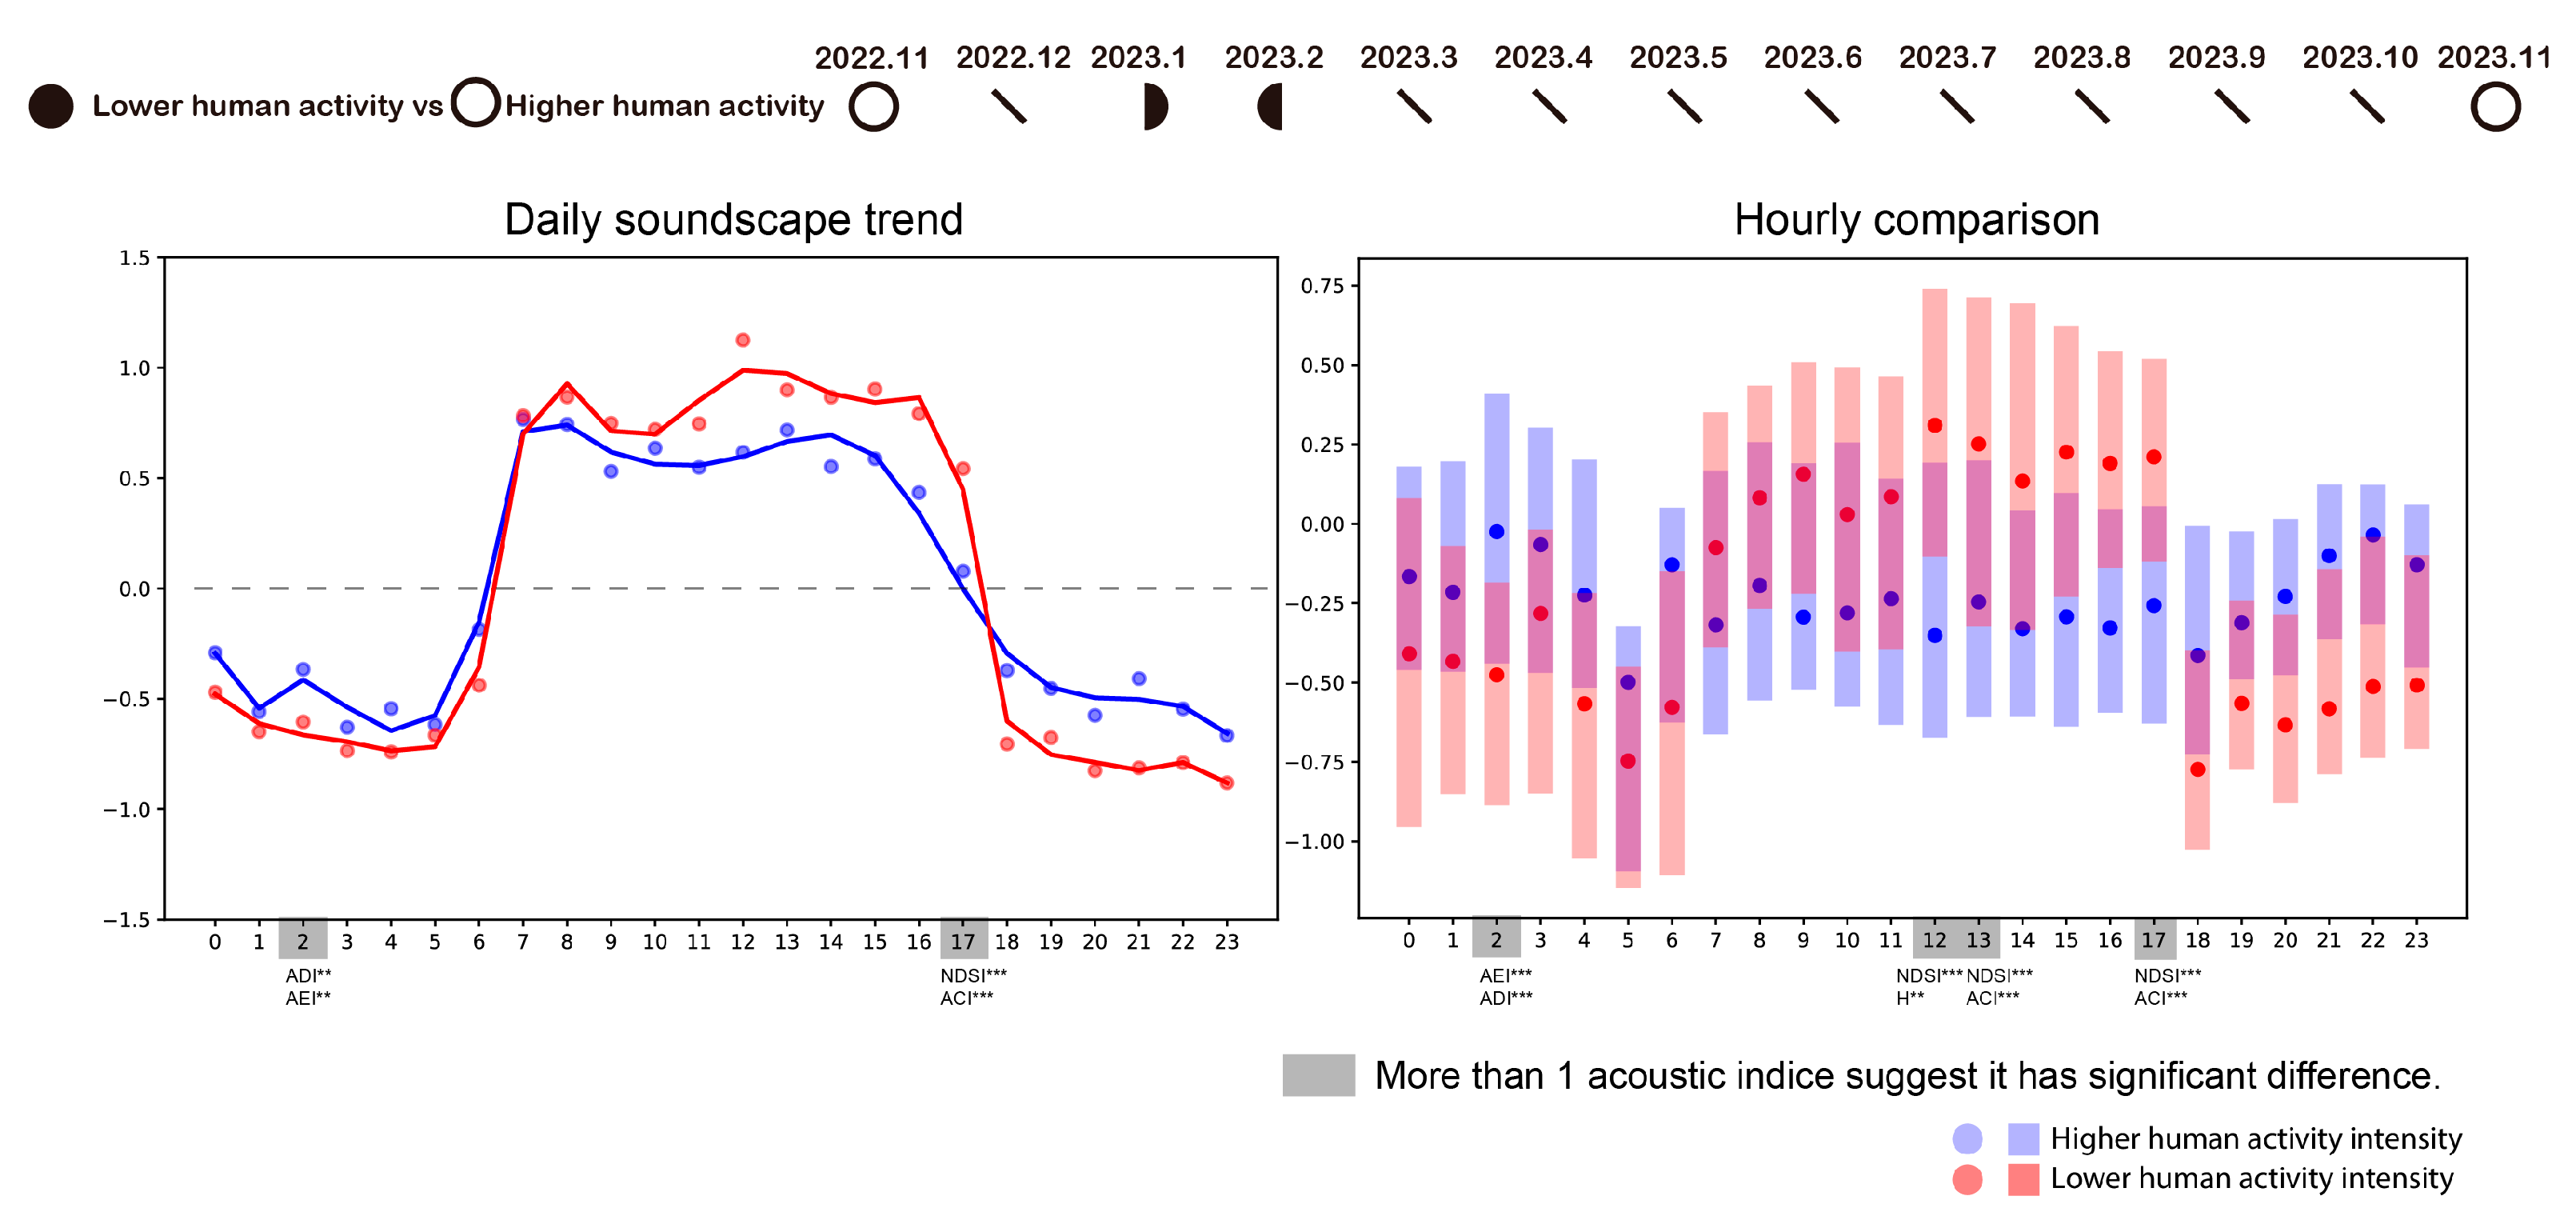
From daily ecological trends (shown in the left graph of Figure 7), notable similarities were observed between periods of higher and lower human activity intensity. In both cases, the daytime soundscape generally began at 7 A.M. and ended at 5 P.M. However, the timing of peaks differed: during periods of lower human activity, peaks were observed at 8 A.M., 12 P.M., and 4 P.M.; during periods of higher human activity, peaks occurred at 8 A.M. and 2 P.M.
Hourly comparisons (shown in the right graph of Figure 7) showed that at 2 A.M., soundscape richness during the low-human-activity period was significantly lower than during the high-activity period. Conversely, at 12 P.M., 1 P.M., and 5 P.M., soundscape richness was significantly higher during the low-human-activity period.
Periods characterized by lower human activity intensity exhibited decreased background noise at night and increased bird vocalization during the day, resulting in richer and more diverse soundscapes compared to periods of higher human activity. The impact of human activities was particularly pronounced around 5 P.M., coinciding with peak student movements during class transitions. Among the indices, NDSI and ACI were particularly effective in identifying these differences.

4. Discussion

This study employed the multi-temporal visualization of acoustic data collected over a full year. It examined three primary factors contributing to soundscape variation: bird breeding, insect chirping, and the intensity of human activity. By utilizing six classical acoustic indices, the impacts of these factors on daily ecological patterns were analyzed from both trend perspectives and characteristic time points.

4.1. The Relationship Between Phenology and Ecological Patterns

The results show that the ecological patterns revealed by acoustic indices align closely with phenological processes. The boundary between daytime and nighttime soundscapes was closely aligned with the timing of sunrise and sunset. Furthermore, through data visualization and statistical analysis, previously vague descriptions of various phenological phenomena and their impacts on ecological patterns were clarified with more precise temporal characterizations, as shown in Figure 8. And according to the BIO circular heatmaps, ecological patterns varied dynamically throughout the year, while daily ecological trends exhibited regular peaks and troughs within a 24 h cycle.
The impact of the bird breeding season on soundscape was most evident at 6 A.M., 12 P.M., and 6 P.M. This finding is consistent with results obtained from passive acoustic monitoring studies conducted in Australian woodlands by Scarpelli et al. [43]. Prior studies have shown that bird vocalizations are significantly influenced by light conditions and foraging behavior, leading to distinctive dawn soundscapes that differ markedly from nighttime soundscapes [44,45].
The impact of cicadas on soundscape was primarily observed at 6 P.M. and 7 P.M., whereas the influence of other insects was concentrated between 2 A.M. and 4 A.M. This difference is supported by biological studies showing that the primary energy peak of cicada songs falls within the 7–10 kHz range [46,47], significantly different from the 4–6 kHz range typically occupied by other insect species. During the cicada season, the first acoustic peak of the day—the dawn chorus—occurred approximately three hours earlier than during other periods, likely because cicadas occupied the acoustic niche usually dominated by birds [48]. This phenomenon is consistent with findings from a study conducted in Taiwan, which demonstrated that cicada chorusing influences bird vocalizations, particularly when cicadas produce wide-frequency, high-intensity sounds [49]. ADI, AEI, and NDSI show strong performance in detecting the impacts of insects, which was also confirmed in a study conducted in a Brazilian rainforest [50].
These findings have significant implications for campus environmental management, particularly for developing biodiversity conservation strategies aimed at minimizing human–wildlife conflicts. The timing of human activities could be adjusted to reduce disturbance to wildlife. For instance, noisy activities such as construction work and street sweeping should be scheduled to avoid the bird breeding season, the dawn chorus, and the dusk chorus, thereby minimizing interference with critical avian communication behaviors. Similarly, biodiversity surveys should be conducted during periods of peak biological activity. Cicada surveys, for example, can be optimally scheduled around 6 P.M. and 7 P.M. during July and August, while surveys targeting other insect species can be conducted between 2 A.M. and 4 A.M.

4.2. Big Data Visualization and Statistical Analysis Help Ecological Pattern Understanding and Management

In analyzing large-scale acoustic data, data visualization based on acoustic indices was employed to investigate ecological patterns across different temporal scales. Subsequently, statistical analyses were conducted to assess the impacts of various biological and anthropogenic factors based on period categorization.
The use of heatmaps enabled rapid visual analysis of year-long acoustic data, which aligns more closely with our research focus on ecological patterns. However, identifying specific sound sources and their contributions to the soundscape remained challenging, as frequency-based and species-specific information could not be distinguished from the indices alone. Future studies could complement these findings with species identification methods and long-duration false-color (LDFC) spectrograms [51]. For example, a study conducted in Brazilian national parks using LDFC spectrograms revealed that the largest differences in soundscapes between protected and non-protected areas occurred within the frequency range of 0.988 to 3.609 kHz, primarily between 5:30 A.M. and 9 A.M., although the analysis was limited to 10 days of data from each site [32]. The NDSI heatmap is similar to the diel plot in another article by Phillips et al. [52], but it is used for preliminary exploration in this study and for result illustration in another article.
The application of univariate analysis based on the period provided a clear identification of specific time points when soundscape changes occurred under the influence of different factors. This approach’s advantage lies in its ability to highlight fine-grained temporal patterns. However, it also has limitations: it does not account for interactions between multiple factors or between different time points, and its effectiveness heavily depends on accurate period categorization informed by prior ecological knowledge.
In addition, the comparison-centered methodological framework proposed in this study offers a practical tool for evidence-based campus ecosystem management. By identifying peak activity periods of protected species, campus managers could dynamically adjust human activities to align with conservation goals. Conversely, for species perceived as nuisances, such as cicadas in summer, vegetation could be adapted to concentrate cicada populations in areas with lower human activity intensity while minimizing their presence in busier zones. Creating more audio–visual integration environments with more natural features plays a greater role in reducing anxiety than environments with more artificial features [53,54]. Furthermore, comparing historical and current soundscape data could provide valuable insights for guiding habitat restoration and landscape regeneration efforts. These strategies are adaptable across various types of urban green spaces and can contribute meaningfully to broader urban sustainability and biodiversity conservation objectives aligned with the Sustainable Development Goals.

5. Conclusions

Through the long-term acoustic monitoring of a campus forest in a dense urban setting, this study uncovered multiscale ecological patterns strongly tied to phenological rhythms. Bird breeding activity was found to shape the soundscape most prominently during the dawn and dusk hours, while cicadas significantly influenced evening acoustic patterns during the summer months. Other insect species exerted a more subtle yet distinct effect on nighttime soundscapes between 2 A.M. and 4 A.M. Changes in human activity intensity had a comparatively minor impact, with detectable effects primarily around 5 P.M., coinciding with daily peaks in student movement. By integrating acoustic indices visualization with statistical analysis, this study offers a methodological framework for characterizing ecological patterns in urban forests, providing insights into the complex interplay between biological and anthropogenic factors. These findings can support more refined strategies for urban biodiversity conservation and human–wildlife coexistence, particularly in rapidly urbanizing environments. Future research could build upon these results by incorporating species-level acoustic identification and exploring interactive effects between human activities and biological soundscapes across finer temporal and spatial scales. Long-term passive acoustic monitoring, as demonstrated here, holds considerable promise for advancing ecological research and informing sustainable urban environmental management.

Supplementary Materials

The following supporting information can be downloaded at: https://www.mdpi.com/article/10.3390/f16081289/s1, File S1: Historical weather data; File S2: Sunrise and sunset data; File S3: Acoustic indices data and Visualizations; File S4: p value.

Author Contributions

Conceptualization, X.X., X.S. and H.X.; methodology, X.X. and X.S.; software, X.X. and X.S.; validation, X.X. and H.X.; formal analysis, X.X. and X.S.; investigation, X.S. and H.X.; resources, X.X. and H.X.; data curation, X.S. and H.X.; writing—original draft preparation, X.X. and X.S.; writing—review and editing, X.X., X.S. and H.X.; visualization, X.X. and X.S.; supervision, X.X. and H.X.; project administration, X.X.; funding acquisition, X.X. and H.X. All authors have read and agreed to the published version of the manuscript.

Funding

This research was funded by the National Natural Science Foundation of China, grant number 52478066. And the research was funded by the Key Laboratory of Land and Space Intelligent Planning Technology, grant number 20220307.

Data Availability Statement

The original contributions presented in this study are included in the article/Supplementary Materials. Further inquiries can be directed to the corresponding author.

Acknowledgments

The authors are grateful to Francesca Valsecchi, Fang Liu, Guangpu Guo, Jing Gan, Chengzhao Wu for their direct input, insightful discussions, and editorial work on this manuscript.

Conflicts of Interest

The authors declare no conflicts of interest.

References

  1. Han, M.J.N.; Kim, M.J. A systematic review of smart city research from an urban context perspective. Cities 2024, 150, 105027. [Google Scholar] [CrossRef]
  2. Turner, M.G.; Gardner, R.H. Landscape Ecology in Theory and Practice: Pattern and Process; Springer: New York, NY, USA, 2015; ISBN 978-1-4939-2793-7. [Google Scholar]
  3. Watson, D.M. A conceptual framework for studying species composition in fragments, islands and other patchy ecosystems. J. Biogeogr. 2002, 29, 823–834. [Google Scholar] [CrossRef]
  4. Chowdhury, S.; Dubey, V.; Choudhury, S.; Das, A.; Jeengar, D.; Sujatha, B.; Kumar, A.; Kumar, N.; Semwal, A.; Kumar, V. Insects as bioindicator: A hidden gem for environmental monitoring. Front. Environ. Sci. 2023, 11, 1146052. [Google Scholar] [CrossRef]
  5. Huhta, E.; Sulkava, P. The impact of nature-based tourism on bird communities: A case study in Pallas-Yllästunturi National Park. Environ. Manag. 2014, 53, 1005–1014. [Google Scholar] [CrossRef]
  6. Ramola, G.C.; Rawat, N.; Singh, R.; Sajwan, A.S.; Sahu, L.; Rawat, P. Insects as Ecological Indicators: A Review. Int. J. Environ. Clim. Change 2024, 14, 260–279. [Google Scholar] [CrossRef]
  7. Smits, J.E.G.; Fernie, K.J. Avian wildlife as sentinels of ecosystem health. Comp. Immunol. Microbiol. Infect. Dis. 2013, 36, 333–342. [Google Scholar] [CrossRef]
  8. Mucci, N.; Traversini, V.; Lorini, C.; De Sio, S.; Galea, R.P.; Bonaccorsi, G.; Arcangeli, G. Urban Noise and Psychological Distress: A Systematic Review. Int. J. Environ. Res. Public Health 2020, 17, 6621. [Google Scholar] [CrossRef]
  9. Lusk, J.L.; House, L.O.; Valli, C.; Jaeger, S.R.; Moore, M.; Morrow, J.L.; Traill, W.B. Effect of information about benefits of biotechnology on consumer acceptance of genetically modified food: Evidence from experimental auctions in the United States, England, and France. Eur. Rev. Agric. Econ. 2004, 31, 179–204. [Google Scholar] [CrossRef]
  10. Clark, C.; Crumpler, C.; Notley, H. Evidence for Environmental Noise Effects on Health for the United Kingdom Policy Context: A Systematic Review of the Effects of Environmental Noise on Mental Health, Wellbeing, Quality of Life, Cancer, Dementia, Birth, Reproductive Outcomes, and Cognition. Int. J. Environ. Res. Public Health 2020, 17, 393. [Google Scholar] [CrossRef]
  11. Erbe, C.; Dent, M.L.; Gannon, W.L.; McCauley, R.D.; Römer, H.; Southall, B.L.; Stansbury, A.L.; Stoeger, A.S.; Thomas, J.A. The Effects of Noise on Animals. In Exploring Animal Behavior Through Sound: Volume 1: Methods; Erbe, C., Thomas, J.A., Eds.; Springer International Publishing: Cham, Switzerland, 2022; pp. 459–506. ISBN 978-3-030-97540-1. [Google Scholar]
  12. Soga, M.; Gaston, K.J. The Ecology of Human–Nature Interactions. Proc. R. Soc. B Biol. Sci. 2020, 287, 20191882. [Google Scholar] [CrossRef]
  13. Müller, S.; Jahn, O.; Jung, K.; Mitesser, O.; Ammer, C.; Böhm, S.; Ehbrecht, M.; Farina, A.; Renner, S.C.; Pieretti, N.; et al. Temporal dynamics of acoustic diversity in managed forests. Front. Ecol. Evol. 2024, 12, 1392882. [Google Scholar] [CrossRef]
  14. Kuehne, L.M.; Padgham, B.L.; Olden, J.D. The Soundscapes of Lakes across an Urbanization Gradient. PLoS ONE 2013, 8, e55661. [Google Scholar] [CrossRef] [PubMed]
  15. Joo, W.; Gage, S.H.; Kasten, E.P. Analysis and interpretation of variability in soundscapes along an urban–rural gradient. Landsc. Urban Plan. 2011, 103, 259–276. [Google Scholar] [CrossRef]
  16. Bian, Q.; Wang, C.; Sun, Z.; Yin, L.; Jiang, S.; Cheng, H.; Zhao, Y. Research on spatiotemporal variation characteristics of soundscapes in a newly established suburban forest park. Urban For. Urban Green. 2022, 78, 127766. [Google Scholar] [CrossRef]
  17. Burivalova, Z.; Maeda, T.M.; Purnomo; Rayadin, Y.; Boucher, T.; Choksi, P.; Roe, P.; Truskinger, A.; Game, E.T. Loss of temporal structure of tropical soundscapes with intensifying land use in Borneo. Sci. Total Environ. 2022, 852, 158268. [Google Scholar] [CrossRef]
  18. Browning, E.; Gibb, R.; Glover-Kapfer, P.; Jones, K. Passive acoustic monitoring in ecology and conservation. WWF Conserv. Technol. Ser. 2017, 1, 1–75. [Google Scholar]
  19. Ross, S.R.P.J.; O’Connell, D.P.; Deichmann, J.L.; Desjonquères, C.; Gasc, A.; Phillips, J.N.; Sethi, S.S.; Wood, C.M.; Burivalova, Z. Passive acoustic monitoring provides a fresh perspective on fundamental ecological questions. Funct. Ecol. 2023, 37, 959–975. [Google Scholar] [CrossRef]
  20. Pieretti, N.; Duarte, M.H.L.; Sousa-Lima, R.S.; Rodrigues, M.; Young, R.J.; Farina, A. Determining Temporal Sampling Schemes for Passive Acoustic Studies in Different Tropical Ecosystems. Trop. Conserv. Sci. 2015, 8, 215–234. [Google Scholar] [CrossRef]
  21. Fuller, S.; Axel, A.C.; Tucker, D.; Gage, S.H. Connecting soundscape to landscape: Which acoustic index best describes landscape configuration? Ecol. Indic. 2015, 58, 207–215. [Google Scholar] [CrossRef]
  22. Hao, Z.; Wang, C.; Sun, Z.; van den Bosch, C.K.; Zhao, D.; Sun, B.; Xu, X.; Bian, Q.; Bai, Z.; Wei, K.; et al. Soundscape mapping for spatial-temporal estimate on bird activities in urban forests. Urban For. Urban Green. 2021, 57, 126822. [Google Scholar] [CrossRef]
  23. Zhao, Y.; Sheppard, S.; Sun, Z.; Hao, Z.; Jin, J.; Bai, Z.; Bian, Q.; Wang, C. Soundscapes of urban parks: An innovative approach for ecosystem monitoring and adaptive management. Urban For. Urban Green. 2022, 71, 127555. [Google Scholar] [CrossRef]
  24. Retamosa Izaguirre, M.; Barrantes-Madrigal, J.; Segura Sequeira, D.; Spínola-Parallada, M.; Ramírez-Alán, O. It is not just about birds: What do acoustic indices reveal about a Costa Rican tropical rainforest? Neotrop. Biodivers. 2021, 7, 431–442. [Google Scholar] [CrossRef]
  25. Bradfer-Lawrence, T.; Bunnefeld, N.; Gardner, N.; Willis, S.G.; Dent, D.H. Rapid assessment of avian species richness and abundance using acoustic indices. Ecol. Indic. 2020, 115, 106400. [Google Scholar] [CrossRef]
  26. Bradfer--Lawrence, T.; Gardner, N.; Bunnefeld, L.; Bunnefeld, N.; Willis, S.G.; Dent, D.H. Guidelines for the use of acoustic indices in environmental research. Methods Ecol. Evol. 2019, 10, 1796–1807. [Google Scholar] [CrossRef]
  27. de Camargo, U.; Roslin, T.; Ovaskainen, O. Spatio-temporal scaling of biodiversity in acoustic tropical bird communities. Ecography 2019, 42, 1936–1947. [Google Scholar] [CrossRef]
  28. Safe and Sound: A Standard for Bioacoustic Data|WILDLABS. Available online: https://wildlabs.net/discussion/safe-and-sound-standard-bioacoustic-data (accessed on 29 May 2025).
  29. Bradfer-Lawrence, T.; Desjonquères, C.; Eldridge, A.; Johnston, A.; Metcalf, O. Using acoustic indices in ecology: Guidance on study design, analyses and interpretation. Methods Ecol. Evol. 2023, 14, 2192–2204. [Google Scholar] [CrossRef]
  30. Alcocer, I.; Lima, H.; Sugai, L.S.M.; Llusia, D. Acoustic indices as proxies for biodiversity: A meta-analysis. Biol. Rev. 2022, 97, 2209–2236. [Google Scholar] [CrossRef]
  31. Lawrence, B.T.; Hornberg, J.; Haselhoff, T.; Sutcliffe, R.; Ahmed, S.; Moebus, S.; Gruehn, D. A widened array of metrics (WAM) approach to characterize the urban acoustic environment; a case comparison of urban mixed-use and forest. Appl. Acoust. 2022, 185, 108387. [Google Scholar] [CrossRef]
  32. Campos, I.B.; Fewster, R.; Truskinger, A.; Towsey, M.; Roe, P.; Vasques Filho, D.; Lee, W.; Gaskett, A. Assessing the potential of acoustic indices for protected area monitoring in the Serra do Cipó National Park, Brazil. Ecol. Indic. 2021, 120, 106953. [Google Scholar] [CrossRef]
  33. Towsey, M.; Znidersic, E.; Broken-Brow, J.; Indraswari, K.; Watson, D.M.; Phillips, Y.; Truskinger, A.; Roe, P. Long-duration, false-colour spectrograms for detecting species in large audio data-sets. J. Ecoacoustics 2018, 2, 1–13. [Google Scholar] [CrossRef]
  34. Zhao, Z.; Xu, Z.; Bellisario, K.; Zeng, R.; Li, N.; Zhou, W.; Pijanowski, B.C. How well do acoustic indices measure biodiversity? Computational experiments to determine effect of sound unit shape, vocalization intensity, and frequency of vocalization occurrence on performance of acoustic indices. Ecol. Indic. 2019, 107, 105588. [Google Scholar] [CrossRef]
  35. Sueur, J. Sound Analysis and Synthesis with R.; Springer International Publishing: Cham, Switzerland, 2018; ISBN 978-3-319-77645-3. [Google Scholar]
  36. Fairbrass, A.J.; Rennert, P.; Williams, C.; Titheridge, H.; Jones, K.E. Biases of acoustic indices measuring biodiversity in urban areas. Ecol. Indic. 2017, 83, 169–177. [Google Scholar] [CrossRef]
  37. Shaw, T.; Hedes, R.; Sandstrom, A.; Ruete, A.; Hiron, M.; Hedblom, M.; Eggers, S.; Mikusiński, G. Hybrid bioacoustic and ecoacoustic analyses provide new links between bird assemblages and habitat quality in a winter boreal forest. Environ. Sustain. Indic. 2021, 11, 100141. [Google Scholar] [CrossRef]
  38. Sueur, J.; Aubin, T.; Simonis, C. Seewave: A free modular tool for sound analysis and synthesis. Bioacoustics 2008, 18, 213–226. [Google Scholar] [CrossRef]
  39. Mammides, C.; Goodale, E.; Dayananda, S.K.; Kang, L.; Chen, J. Do acoustic indices correlate with bird diversity? Insights from two biodiverse regions in Yunnan Province, south China. Ecol. Indic. 2017, 82, 470–477. [Google Scholar] [CrossRef]
  40. Villanueva-Rivera, L.J.; Pijanowski, B.C. soundecology: Soundscape Ecology. R Package Version 1.3.2. 2016. Available online: https://github.com/ljvillanueva/soundecology (accessed on 4 August 2025).
  41. Hunter, J.D. Matplotlib: A 2D Graphics Environment. Comput. Sci. Eng. 2007, 9, 90–95. [Google Scholar] [CrossRef]
  42. Pedregosa, F.; Varoquaux, G.; Gramfort, A.; Michel, V.; Thirion, B.; Grisel, O.; Blondel, M.; Prettenhofer, P.; Weiss, R.; Dubourg, V.; et al. Scikit-learn: Machine Learning in Python. J. Mach. Learn. Res. 2011, 12, 2825–2830. [Google Scholar]
  43. Scarpelli, M.D.A.; Roe, P.; Tucker, D.; Fuller, S. Soundscape phenology: The effect of environmental and climatic factors on birds and insects in a subtropical woodland. Sci. Total Environ. 2023, 878, 163080. [Google Scholar] [CrossRef]
  44. Skorb, K.; Jankowiak, Ł.; Zbyryt, A. Light-emitting greenhouses affect daily vocalization behavior in birds. J. Ornithol. 2023, 164, 399–405. [Google Scholar] [CrossRef]
  45. Hillemann, F.; Cole, E.F.; Keen, S.C.; Sheldon, B.C.; Farine, D.R. Diurnal variation in the production of vocal information about food supports a model of social adjustment in wild songbirds. Proc. Biol. Sci. 2019, 286, 20182740. [Google Scholar] [CrossRef]
  46. Tan, M.K.; Robillard, T.; ter Hofstede, H. The circadian calling activity of a lebinthine cricket with high-frequency calls is unaffected by cicada choruses in the day. PeerJ 2023, 11, e14641. [Google Scholar] [CrossRef]
  47. Stölting, H.; Moore, T.E.; Lakes-Harlan, R. Substrate vibrations during acoustic signalling in the cicada Okanagana rimosa. J. Insect Sci. 2002, 2, 2. [Google Scholar] [CrossRef] [PubMed]
  48. Krause, B.L. The Niche Hypothesis: A virtual symphony of animal sounds, the origins of musical expression and the health of habitats. Soundscape Newsl. 1993, 6, 1–5. [Google Scholar]
  49. Chen, Y. The interference of cicada sounds on bird singing behavior. Master’s Thesis, Department of Forest Environment and Resources, National Taiwan University, Taiwan, China, 2017. [Google Scholar]
  50. Oliveira, E.G.; Ribeiro, M.C.; Roe, P.; Sousa-Lima, R.S. The Caatinga Orchestra: Acoustic indices track temporal changes in a seasonally dry tropical forest. Ecol. Indic. 2021, 129, 107897. [Google Scholar] [CrossRef]
  51. Brodie, S.; Towsey, M.; Allen-Ankins, S.; Roe, P.; Schwarzkopf, L. Using a Novel Visualization Tool for Rapid Survey of Long-Duration Acoustic Recordings for Ecological Studies of Frog Chorusing. Front. Ecol. Evol. 2022, 9, 761147. [Google Scholar] [CrossRef]
  52. Phillips, Y.F.; Towsey, M.; Roe, P. Revealing the ecological content of long-duration audio-recordings of the environment through clustering and visualisation. PLoS ONE 2018, 13, e0193345. [Google Scholar] [CrossRef]
  53. Xu, W.; Wang, H.; Su, H.; Sullivan, W.C.; Lin, G.; Pryor, M.; Jiang, B. Impacts of sights and sounds on anxiety relief in the high-density city. Landsc. Urban Plan. 2024, 241, 104927. [Google Scholar] [CrossRef]
  54. Jiang, B.; Xu, W.; Ji, W.; Kim, G.; Pryor, M.; Sullivan, W.C. Impacts of nature and built acoustic-visual environments on human’s multidimensional mood states: A cross-continent experiment. J. Environ. Psychol. 2021, 77, 101659. [Google Scholar] [CrossRef]
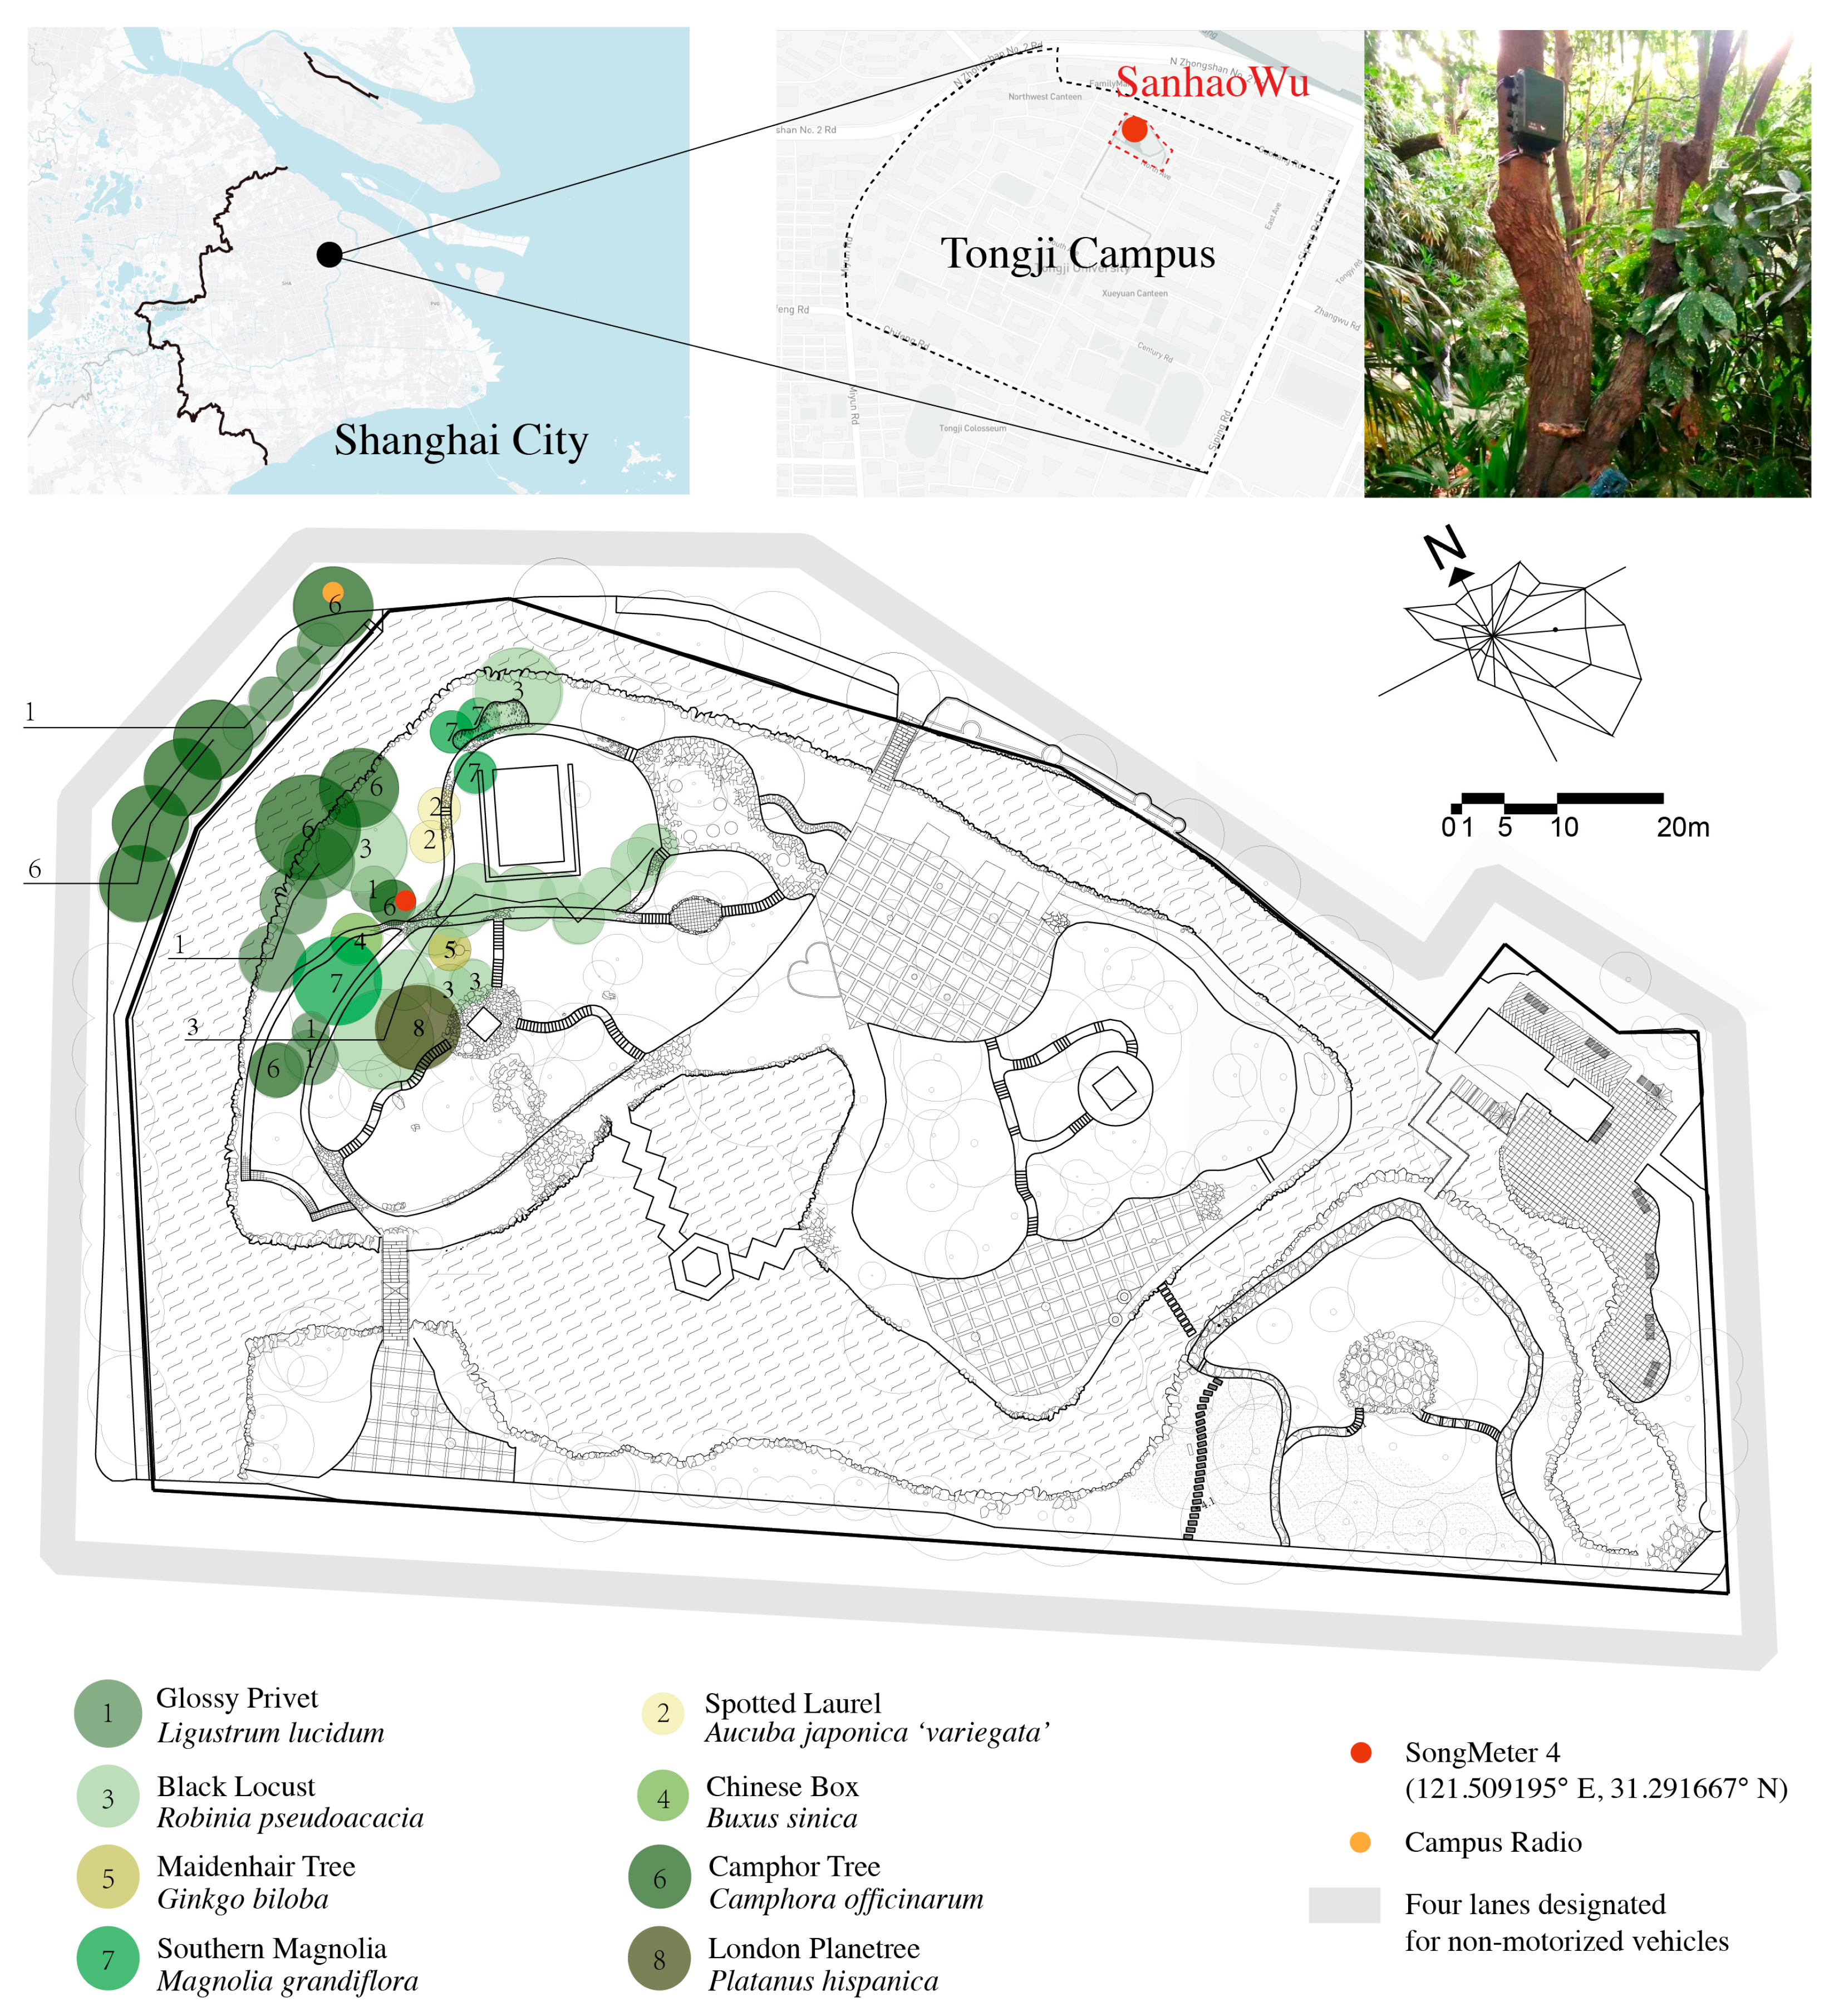
Figure 1. Study site. The study site, SanhaoWu, located on the Tongji University campus in central Shanghai, is a traditional garden established in 1956. The passive acoustic monitor (SM4) was installed within an area of dense vegetation, primarily composed of Glossy Privet (Ligustrum lucidum) and Black Locust (Robinia pseudoacacia). A broadcast speaker column is positioned approximately 20 m away from the recording device. Surrounding the SanhaoWu area are non-motorized traffic lanes, and garden footpaths are situated near the recording device, providing abundant opportunities to capture anthropogenic sounds.
Forests 16 01289 g001
Figure 2. Time period categorization Three primary factors influencing temporal ecological patterns in this study are the bird breeding season, insect acoustic activity, and human activity levels. Solid circles indicate periods affected by these factors, while hollow circles represent periods unaffected by them. Slashes represent periods not used in research considering confounding effects. Half solid circle means that only part of the data for that month was used. For example, the Lower human activity data only included data from 9 January 2023 to 17 February 2023.
Forests 16 01289 g002
Figure 3. Annual ecological pattern. The NDSI aligns closely with the timing of sunrise and sunset. Patterns such as abundant birdsong during holidays (associated with reduced human activity), a pronounced dawn chorus during the breeding season, and the prominent sound of cicadas were clearly reflected in the NDSI values.
Forests 16 01289 g003
Figure 4. Monthly ecological pattern. The black lines above and below represent nighttime and daytime soundscape. Each circular plot represents the soundscape of one month, with the inner circle indicating the beginning of the month, and the outer circle representing the end of the month. This visualization shows the dynamics of daytime and nighttime soundscapes over time. The greener the color, the higher the BIO value.
Forests 16 01289 g004
Figure 5. Daily ecological trend and hourly comparison associated with bird breeding season. The top panel illustrates the data ranges used for comparison. Solid circles indicate periods affected by the breeding season, while hollow circles represent corresponding control periods. Slashes indicate excluded periods. In the left graph, dots represent the average values of five normalized indices, and lines represent spline fitting curves (smoothing factor = 0.1). In the right graph, dots represent hourly medians of the normalized indices, with boxes indicating the interquartile range (25th to 75th percentiles). Grey rectangles denote time points where more than two indices indicated significant differences. Indices marked with three asterisks (***) indicate significance at the 0.001/24 level, while those marked with two asterisks (**) indicate significance at the 0.01/24 level. Specific p-values can be found in the Supplementary Materials.
Forests 16 01289 g005
Figure 6. Daily ecological trends and hourly comparisons associated with insects chirping. The top panel illustrates the data ranges used for comparison. Solid circles represent periods affected by cicadas or other insects, while hollow circles represent corresponding control periods. Slashes indicate excluded periods. In the left graphs, dots represent the average values of five normalized indices, and lines represent spline fitting curves (smoothing factor = 0.1). In the right graphs, dots represent hourly medians of the normalized indices, with boxes showing interquartile ranges. Grey rectangles indicate time points where more than two indices demonstrated significant differences. Indices marked with three asterisks (***) indicate significance at the 0.001/24 level, while those marked with two asterisks (**) indicate significance at the 0.01/24 level. Specific p-values can be found in the Supplementary Materials.
Forests 16 01289 g006
Figure 7. Daily ecological trends and hourly comparisons with human activity impact. The top panel illustrates the data ranges used for comparison. Solid circles represent periods of higher human activity, while hollow circles represent lower activity periods. Slashes indicate excluded periods. The half solid circle indicates that the lower human activity data only includes part of the data for that month, specifically from 9 January 2023 to 17 February 2023. In the left graph, dots represent the average values of five normalized indices, and lines depict spline fitting curves (smoothing factor = 0.1). In the right graph, dots represent hourly medians of the normalized indices, with boxes indicating interquartile ranges. Grey rectangles highlight time points where more than one acoustic index demonstrated significant differences. Indices marked with three asterisks (***) indicate significance at the 0.001/24 level, while those marked with two asterisks (**) indicate significance at the 0.01/24 level. Specific p-values can be found in the Supplementary Materials.
Forests 16 01289 g007
Figure 8. The specific timing of phenological factors on the ecological patterns. Double-centered circles represent time points with more pronounced impacts, showing significant differences in both trend and hourly comparisons, based on results from Section 3. Single-centered circles represent time points with weaker impacts, showing significant differences in either trend or hourly comparisons.
Forests 16 01289 g008
Table 1. Acoustic indices calculation method.
Acoustic IndicesAbbreviationComputing MethodInformationRelationship with
Biophony Richness
Calculation Package in R
Acoustic Complexity IndicesACINormalized summationThe complexity of STDFT matrixPositive [36,37]seewave [38]
Acoustic Diversity IndicesADIShannon-Wiener indicesShannon entropy on the spectral contentPositive [39]soundecology [40]
Bioacoustics IndicesBIOSummation of integralsRelative avian abundancePositive [36,37]soundecology [40]
Normalized Difference Soundscape IndicesNDSISummation of integralsThe ratio of human-generated to biological acoustic componentsPositive [36]seewave [38]
Acoustic Entropy IndicesHShannon-Wiener indicesShannon evenness of the amplitude envelope and frequency spectrumPositive [34]seewave [38]
Acoustic Evenness
Indices
AEIGini indicesGini coefficient on the spectral contentNegative [34,39]soundecology [40]
Disclaimer/Publisher’s Note: The statements, opinions and data contained in all publications are solely those of the individual author(s) and contributor(s) and not of MDPI and/or the editor(s). MDPI and/or the editor(s) disclaim responsibility for any injury to people or property resulting from any ideas, methods, instructions or products referred to in the content.