Article

Reshaping Nutrient Resorption Efficiency: Adaptive Strategies of Subtropical Slash Pine Plantations to Nitrogen and Phosphorus Additions

1
Jiangxi Provincial Key Laboratory of Subtropical Forest Resources Cultivation, 2011 Collaboration Innovation Center of Jiangxi Typical Trees Cultivation and Utilization, Jiangxi Agricultural University, Nanchang 330045, China
2
Forest Products Quality Inspection and Testing Center, Jiangxi Academy of Forestry, Nanchang 330013, China
3
School of Life Science, Jiangxi Science and Technology Normal University, Nanchang 330013, China
*
Author to whom correspondence should be addressed.
Forests 2025, 16(6), 928; https://doi.org/10.3390/f16060928
Submission received: 24 April 2025 / Revised: 22 May 2025 / Accepted: 30 May 2025 / Published: 31 May 2025
(This article belongs to the Section Forest Ecology and Management)

Abstract

:
The nitrogen (N) and phosphorus (P) additions were commonly used to improve plantation quality. However, the balance between nutrient uptake in the underground part and nutrient utilization in the aboveground part of Pinus elliottii (Slash pine) plantation in subtropical regions after N and P addition is still unclear. We conducted the experiment using a randomized complete block design with four treatments: N (50 kg N ha−2 yr−1, P (100 kg P ha−2 yr−1), NP (N + P), and a control (CK). Nutrient transport dynamics of underground (rhizosphere soil and roots) and aboveground (twigs and needles) parts of a 10-year-old Pinus elliottii plantations were evaluated. The trial was maintained for three consecutive growing seasons. The results showed that N and P additions significantly increased the N, P, and potassium (K) contents of soils and plant tissues in subtropical slash pine plantation forests, and showed a significant and gradual increase in interannual variations over the observation period (except for TN in soils, which increased first and then decreased). In terms of nutrient transport and reabsorption efficiency, N addition promoted the transport of elemental P from the translocating root system to the twigs, whereas P addition inhibited this process. P addition significantly increased the nitrogen reabsorption efficiency (NRE) of the needles, but decreased the phosphorus reabsorption efficiency (PRE), showing an element-specific response to the nutrient reabsorption process. Structural equation modeling further revealed that N or P addition had direct positive effects on soil N, P, and K content (path coefficients r: 0.54, 0.71, 0.41). N addition indirectly negatively affected N resorption efficiency (NRE) and K resorption efficiency (KRE) (r: −0.62, −0.51) but positively affected PRE (r: 0.44). Conversely, P addition had an indirect negative effect on PRE (r: −0.59). These results reveal that in subtropical regions, slash pine plantations adapt to N or/and P addition by adjusting nutrient absorption, transport, and resorption efficiency. This provided new insights into nutrient transport and distribution strategies in underground and aboveground parts of plants under N or/and P additions.

1. Introduction

Nitrogen (N) and phosphorus (P) are crucial macronutrients in the entire ecosystem. They do not cycle independently but exhibit highly complex interrelationships [1,2,3]. Plants absorb, transport, and utilize N and P, along with other essential mineral elements including potassium (K), calcium (Ca), magnesium (Mg), and micronutrients such as iron (Fe) and zinc (Zn), from the environment, coupling them in relatively limited proportions [4], This results in interconnected nutrient cycles throughout the entire ecosystem [5]. Recent investigations underscore the urgency of deciphering these coupled nutrient dynamics, particularly regarding their synergistic effects on soil nutrient budgets and plant adaptation strategies under anthropogenic forcing [6,7,8]. Given the importance of nitrogen and phosphorus in regulating ecosystem processes, such as in pine forests, understanding how they interact synergistically or inhibit each other is valuable [7,9,10]. Furthermore, exploring their potential for long-term feedback and dynamic equilibrium between plants and soil in response to nitrogen and phosphorus additions is also meaningful [11,12,13].
The addition of N and P may have a complex effect on the nutrient absorption and transport process of plants by changing soil nutritional status, affecting root morphology and physiological characteristics, and regulating the distribution and utilization efficiency of nutrient elements in plants [14,15,16]. Globally, K limitation in terrestrial ecosystems is as critical as N and P in constraining plant productivity. Up to 70% of studied terrestrial ecosystems exhibit some degree of K limitation [17]. N deposition strongly perturbs K cycling: while N inputs may transiently increase soil K leaching through acidification, prolonged N enrichment without K supplementation ultimately reduces K availability and intensifies K limitation via cation imbalance and organic matter depletion [18]. At present, studies on the effects of N and P addition on plant nutrient absorption and transport have been widely carried out worldwide [1,19,20,21]. Conversely, there was a paucity of information regarding the direct influence of prolonged fertilization practices on strategies for nutrient procurement. And there were relatively few studies on subtropical pine forests. However, understanding how soil fertility drives efficient nutrient use patterns in plants may be key. In addition, these effects may change with the increase in fertilization time [8,22,23]. We speculated that the reabsorption efficiency of some elements by plants may decrease with the increase in fertilization time. Therefore, the continuous observation of nutrients in the aboveground and underground parts after N and P additions is of great significance for understanding the strategies of plant nutrient distribution and the mechanisms of nutrient absorption and transport.
Slash pine (Pinus elliottii) plantations represent a prevalent type of forest ecosystem in the subtropical regions of southern China. Most of these plantations suffer from poor land and lack management, leading to stand degradation, fast harvesting operations, and declining productivity [19]. In these plantation forests, nutrient supplementation is a key measure to prevent stand degradation. Studies indicate that N deposition has intensified P limitation in subtropical forests through soil acidification and cation leaching [24,25]. Long-term high N input has significantly increased plant leaf N:P ratio and suppressed microbial P mineralization capacity, leading to the reduction in soil available P [9,26]. Plants dissolve mineral P via rhizosphere organic acid secretion, boost mycorrhizal symbiosis, enhance P availability, and balance N and P [27]. In addition, the synergistic effects of climate change and N deposition can further enhance P adsorption by iron and aluminum oxides [28,29]. However, short-term P addition can mitigate this impact. Maintaining dynamic equilibrium requires synchronous nitrogen-phosphorus management, strengthened mycorrhizal symbiosis, and threshold control to tackle forest productivity decline due to global change. However, the impacts of N and P addition on subtropical slash pine plantation forests remain uncertain. For example, the relationship and balance between the flow of N and P nutrients from underground to aboveground in slash pine plantations are still unclear, and there is no systematic discussion of their response to external environmental changes. For this purpose, the following questions were addressed in this study: (1) Are the trade-offs between nutrient capture and uptake by plants affected by N and P additions? (2) Whether nitrogen and phosphorus addition can regulate the efficiency of nutrient reabsorption in needles? The above issues are explored to understand the nutrient uptake and utilization strategies of the below- and aboveground portions of slash pine forests as a way to address the challenges posed by nitrogen deposition and phosphorus deficiency in the region.

2. Materials and Methods
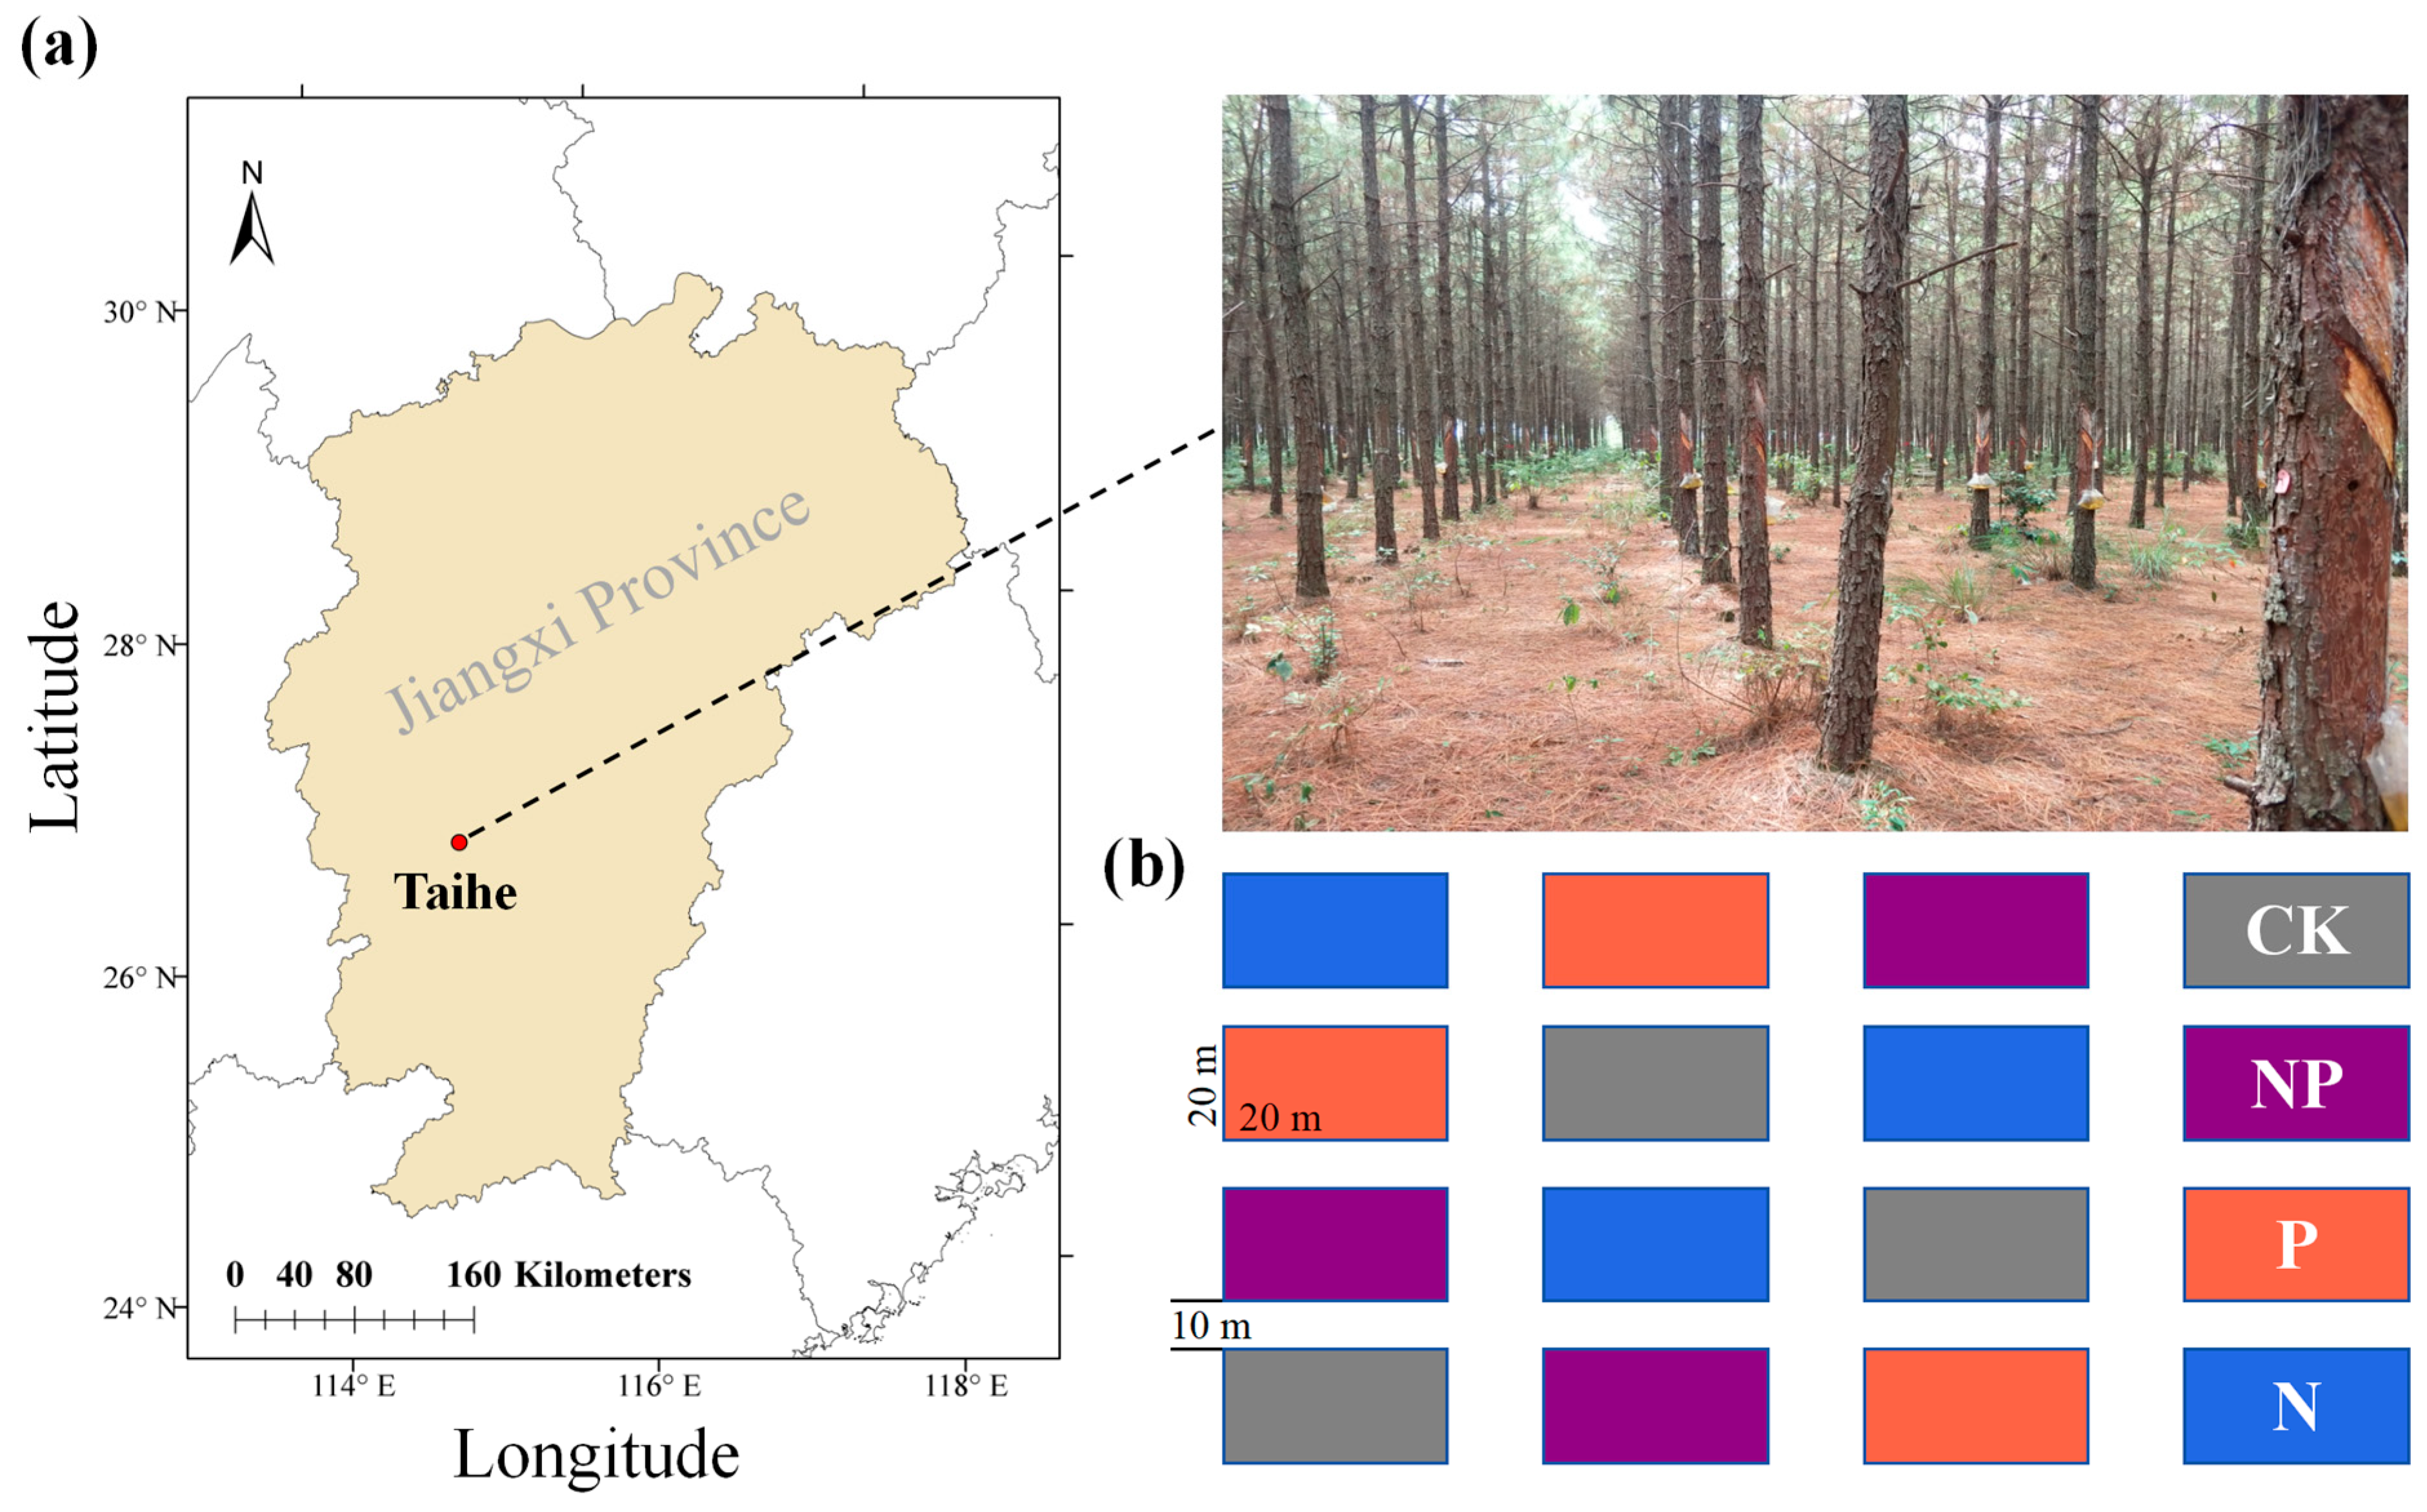
2.1. Study Site

The localization of study area was conducted in Tangzhou town, Taihe County, Ji’an city, Jiangxi Province (26°44′47″ N, 114°50′44″ E) (Figure 1a). The climate in the research area is a subtropical humid monsoon climate with four distinct seasons, with cold winters and hot summers. The average annual precipitation is 1370.5 mm, concentrated from April to June, with an annual average relative humidity of 80% and an average temperature of 18.7 °C. The soil in the research area is typical red soil, with an average elevation of 100 m. Before the fertilization treatment, the forest stand was 10-year-old slash pine plantations with a density of approximately 1724 trees per hectare, an average tree height of about 11.01 ± 0.10 m, and an average breast height diameter of about 13.78 ± 0.41 cm.

2.2. Experimental Design Treatments

The experiment was conducted in a pine forest, and a randomized block design was employed. The experiment had 16 plots in four replicate blocks. Each block had all four treatments for environmental variability. This setup was used for the nutrient addition experiment from 2018 to 2020. Each block contained four plots (20 m × 20 m) with four fertilizer treatments as follows: control (0 kg N or P ha−1 yr−1), N addition (50 kg N ha−1 yr−1), P addition (100 kg P ha−1 yr−1), and N + P (50 kg N ha−1 yr−1 + 100 kg P ha−1 yr−1) [30,31,32] (Figure 1b). N and P were applied twice a year (March and June) to maintain the fertilized plots. To ensure uniform dispersion of the fertilizer, the particles were mixed with sand. Dry fertilizer was manually applied to the soil surface of each plot in March and June. There should be a buffer zone of at least 10 m between plots to minimize the interference of nutrient addition to adjacent treated plots. Continuous fertilization was applied for three years (2018–2020). The N fertilizer is urea, and the active ingredient is 46% N. The P fertilizer is a calcium (CaO, 40%)-magnesium (MgO, 20%)-phosphate fertilizer with 14% active ingredient P2O5 and 6.11% pure P.

2.3. Sample Collection

Three individuals with similar growth traits were selected as biological replicates per block. In May and December of 2018–2020, the ground cover was removed from a 1 m radius circle at the base of the trunk of the target individual, and three soil blocks with lengths, widths, and depths of 30 cm, 10 cm and 20 cm, respectively, were excavated (three replicates). Soil still attached to the root sample (rhizosphere soil) was collected after slight shaking [33]. Roots of slash pine in the soil blocks were collected as root samples and categorized into fine (<2 mm) and coarse (≥2 mm) roots according to root diameter. Healthy twigs and needles in the upper sunny part of the canopy of the target individuals were also collected using high pruning shears. The needles are divided into new needles (<1 year-old) and old needles (>1 year-old) according to their positions in the twig’s orders.

2.4. Detection Methods

The rhizospheric soil was dried naturally, processed into a fine powder via a ball mill and then sifted through a 60-mesh sieve (0.25 mm) for uniformity. Total N (TN) was determined by the Kjeldahl method [34]. Total P (TP) was determined via the molybdenum-antimony colorimetric method [35]. The total K (TK) was determined via flame spectroscopy.
The plant samples were dehydrated in an oven at 110 °C for 0.5 h and dried to constant mass at 70 °C, subsequently pulverized with a ball mill, and sifted through a 100-mesh sieve (0.15 mm). The concentrations of total N, P, and K were analyzed via methods identical to those employed for soil [36].

2.5. Parameter Calculations

To evaluate the capacity of the root system to absorb nutrients from the soil, we determined the factor of root-to-soil nutrient accumulation factor (AFS-AR) [22,37,38], following a modified formula, Equation (1):
AFS-AR = NuAR/NuS
where NuAR denotes the nutrient content of the fine roots, and NuS represents the soil nutrient concentration. For the convenience of calculation and analysis, the soil nutrient content is calculated according to the rule of g/kg, and the plant nutrient content is calculated according to the rule of mg/kg in the formulas.
We employed an additional measure to quantify the transfer of nutrients from the roots to the foliage, referred to as the nutrient translocation factor (TF) [37]. We assessed nutrient movement from the fine roots responsible for nutrient absorption to those subjected to transportation, as well as the process of transporting nutrients from the subterranean to the aerial parts of the plant, as demonstrated in Equations (2)–(4):
TFAR-TR = NuTR/NuAR
TFTR-T = NuTwigs/NuTR
TFT-N = NuNeedles/NuTwigs
where translocation factor of nutrients from absorptive to transportive roots (TFAR-TR), translocation factor of nutrients from transportive roots to twigs (TFTR-T), and translocation factor of nutrients from twigs to needles (TFT-N) denote the transfer factors (TFs) for nutrients moving from absorptive to transportive roots and subsequently to twigs and needles. The abbreviations NuAR, NuTR NuTwig, and NuNeedles represent the concentrations of nutrients found in absorptive roots, transportive roots, twigs, and needles, respectively. An elevated TF value indicates a more efficient nutrient translocation process.
To minimize bias, we applied a mass loss correction factor (MLCF). The MLCFs associated with different plant growth forms have been documented by Vergutz et al. [39], and the conifer value is set at 0.745. Equation (5) was utilized to determine the NuRE:
NuRE% = (NuNeedles/NuLN × 0.745) × 100/NuNeedles
where Nu indicates the level of nutrients being examined; NuTwigs, NuNeedles, NuLT, and NuLN denote the respective nutrient densities within recently harvested twigs, needles, and the decomposing components of older twigs and needles, respectively.

2.6. Statistical Analyses

The data were standardized with Levene’s test to ensure homogeneity before proceeding with the statistical evaluations. To compare the effects of N and P treatments, one-way ANOVA was used, followed by Duncan’s multiple range test with LSD for pairwise comparisons. Furthermore, under N and P addition, the Pearson method was employed to analyze the correlations between nutrient uptake, transport, and resorption efficiencies of underground and aboveground parts in slash pine forests. Structural equation modeling (SEM) was used to analysis plant–soil dynamics interactions in the presence of N and P addition. Throughout the study, a significance level of 0.05 was consistently applied. Statistical procedures were executed with SPSS version 25.0, which was provided by SPSS Inc., Chicago, IL, USA. For SEM, Amos version 21.0 from the same company was utilized.

3. Results

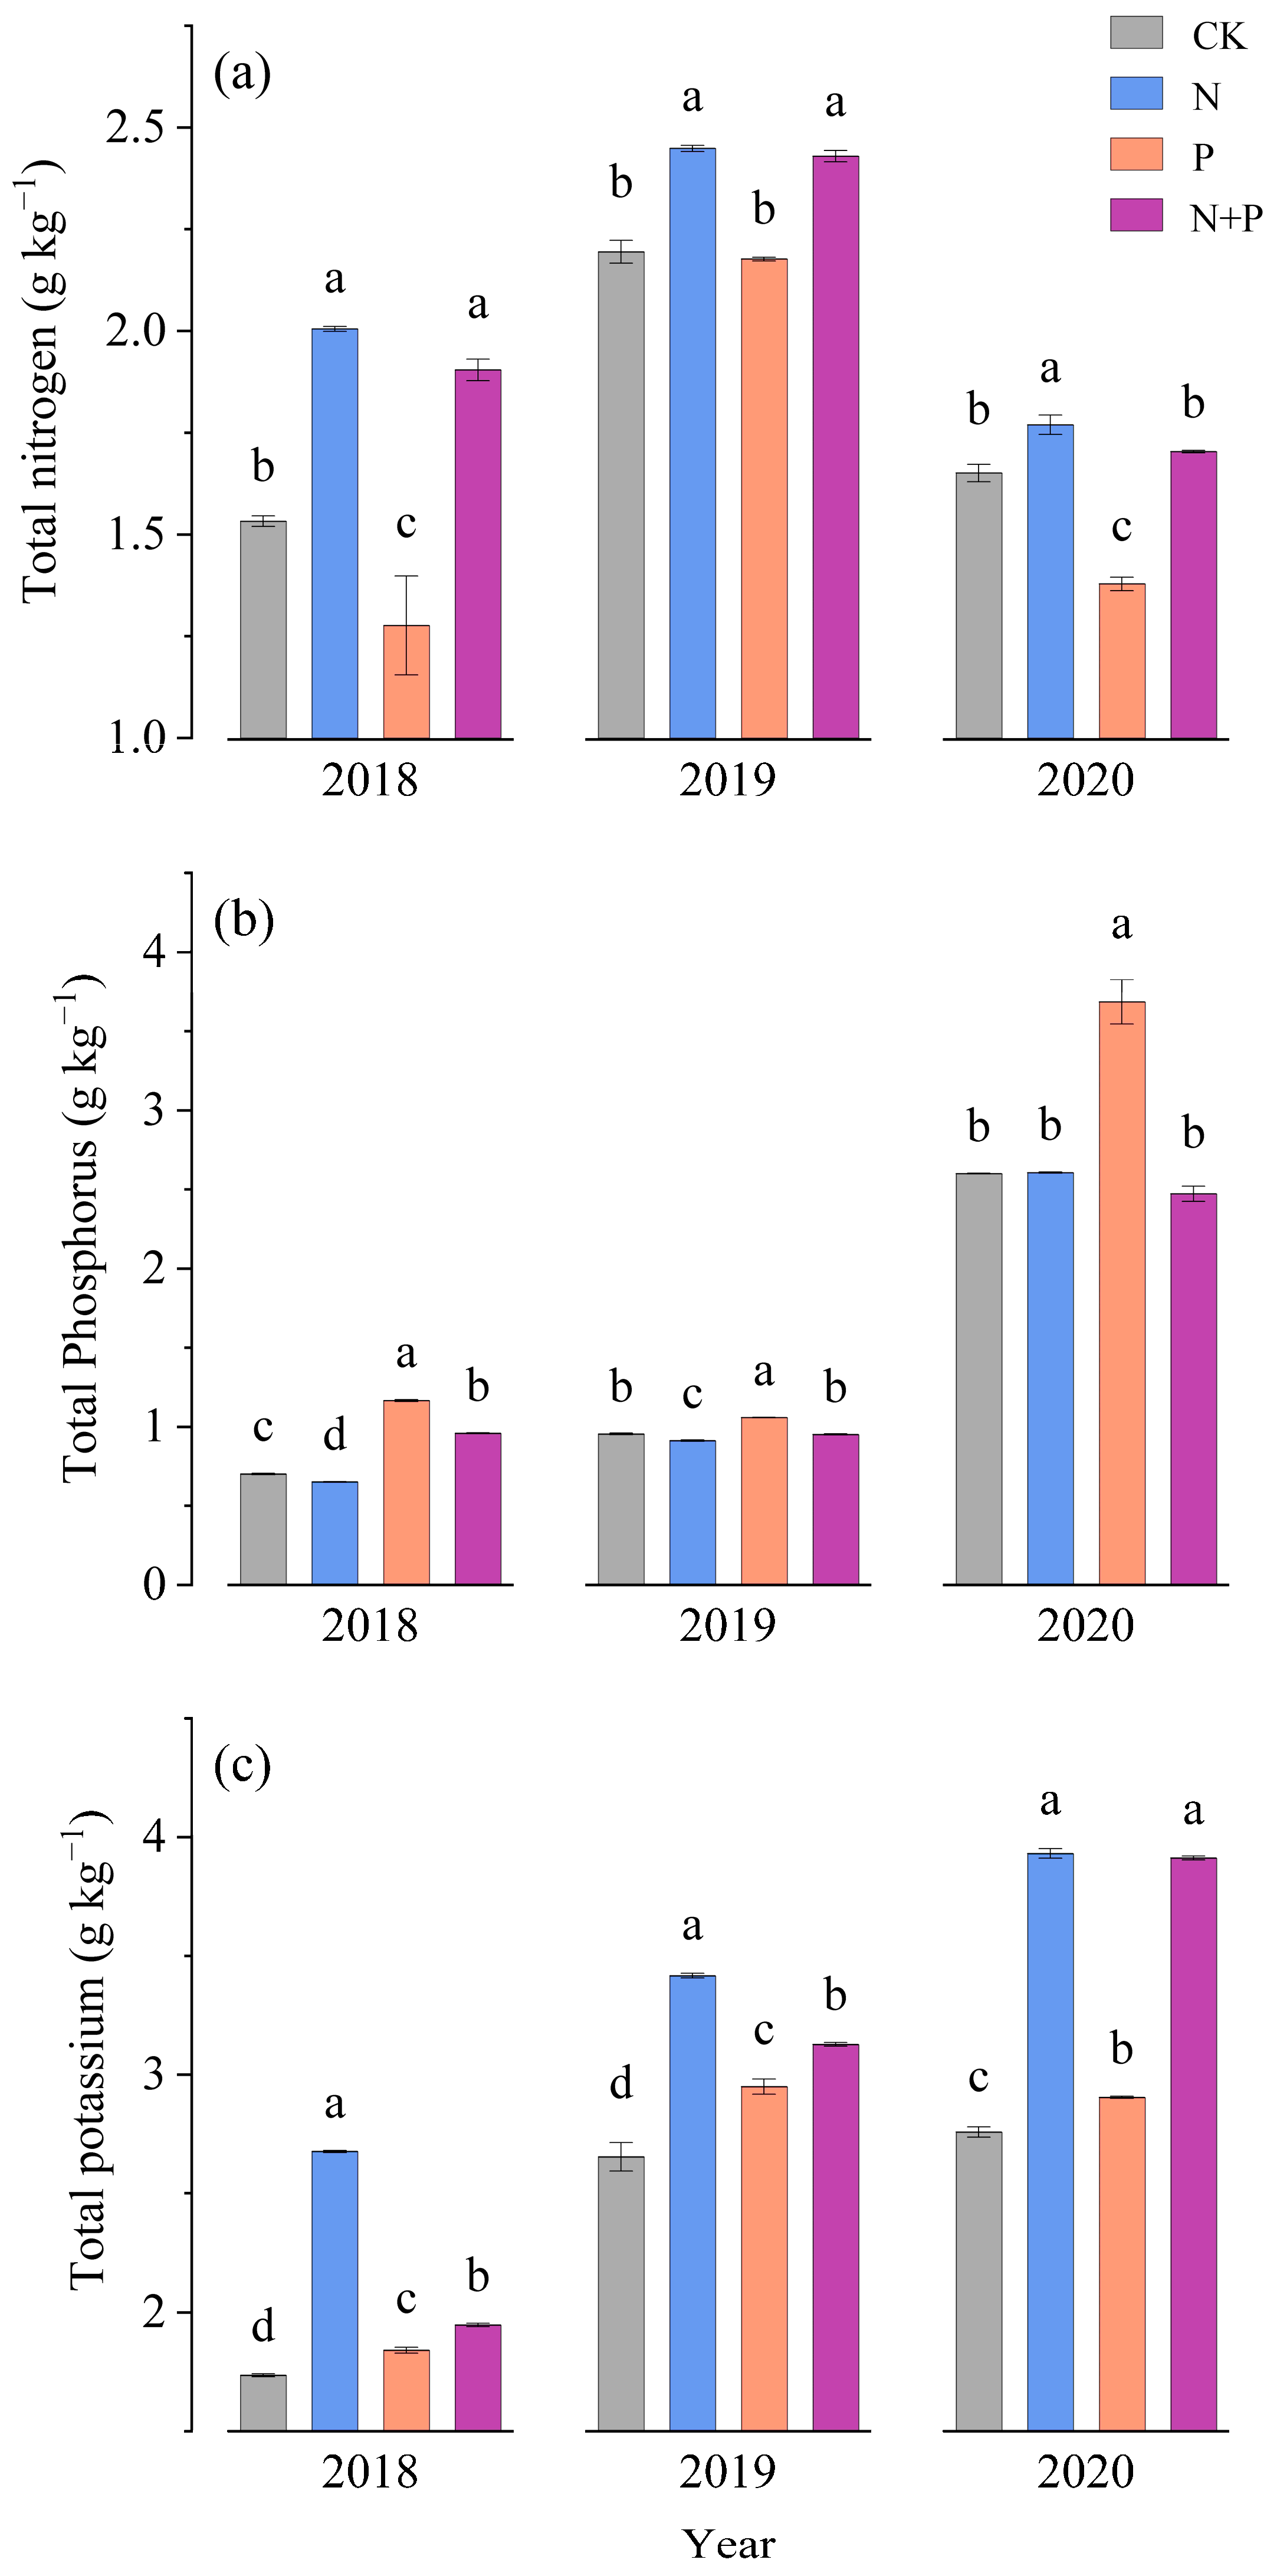
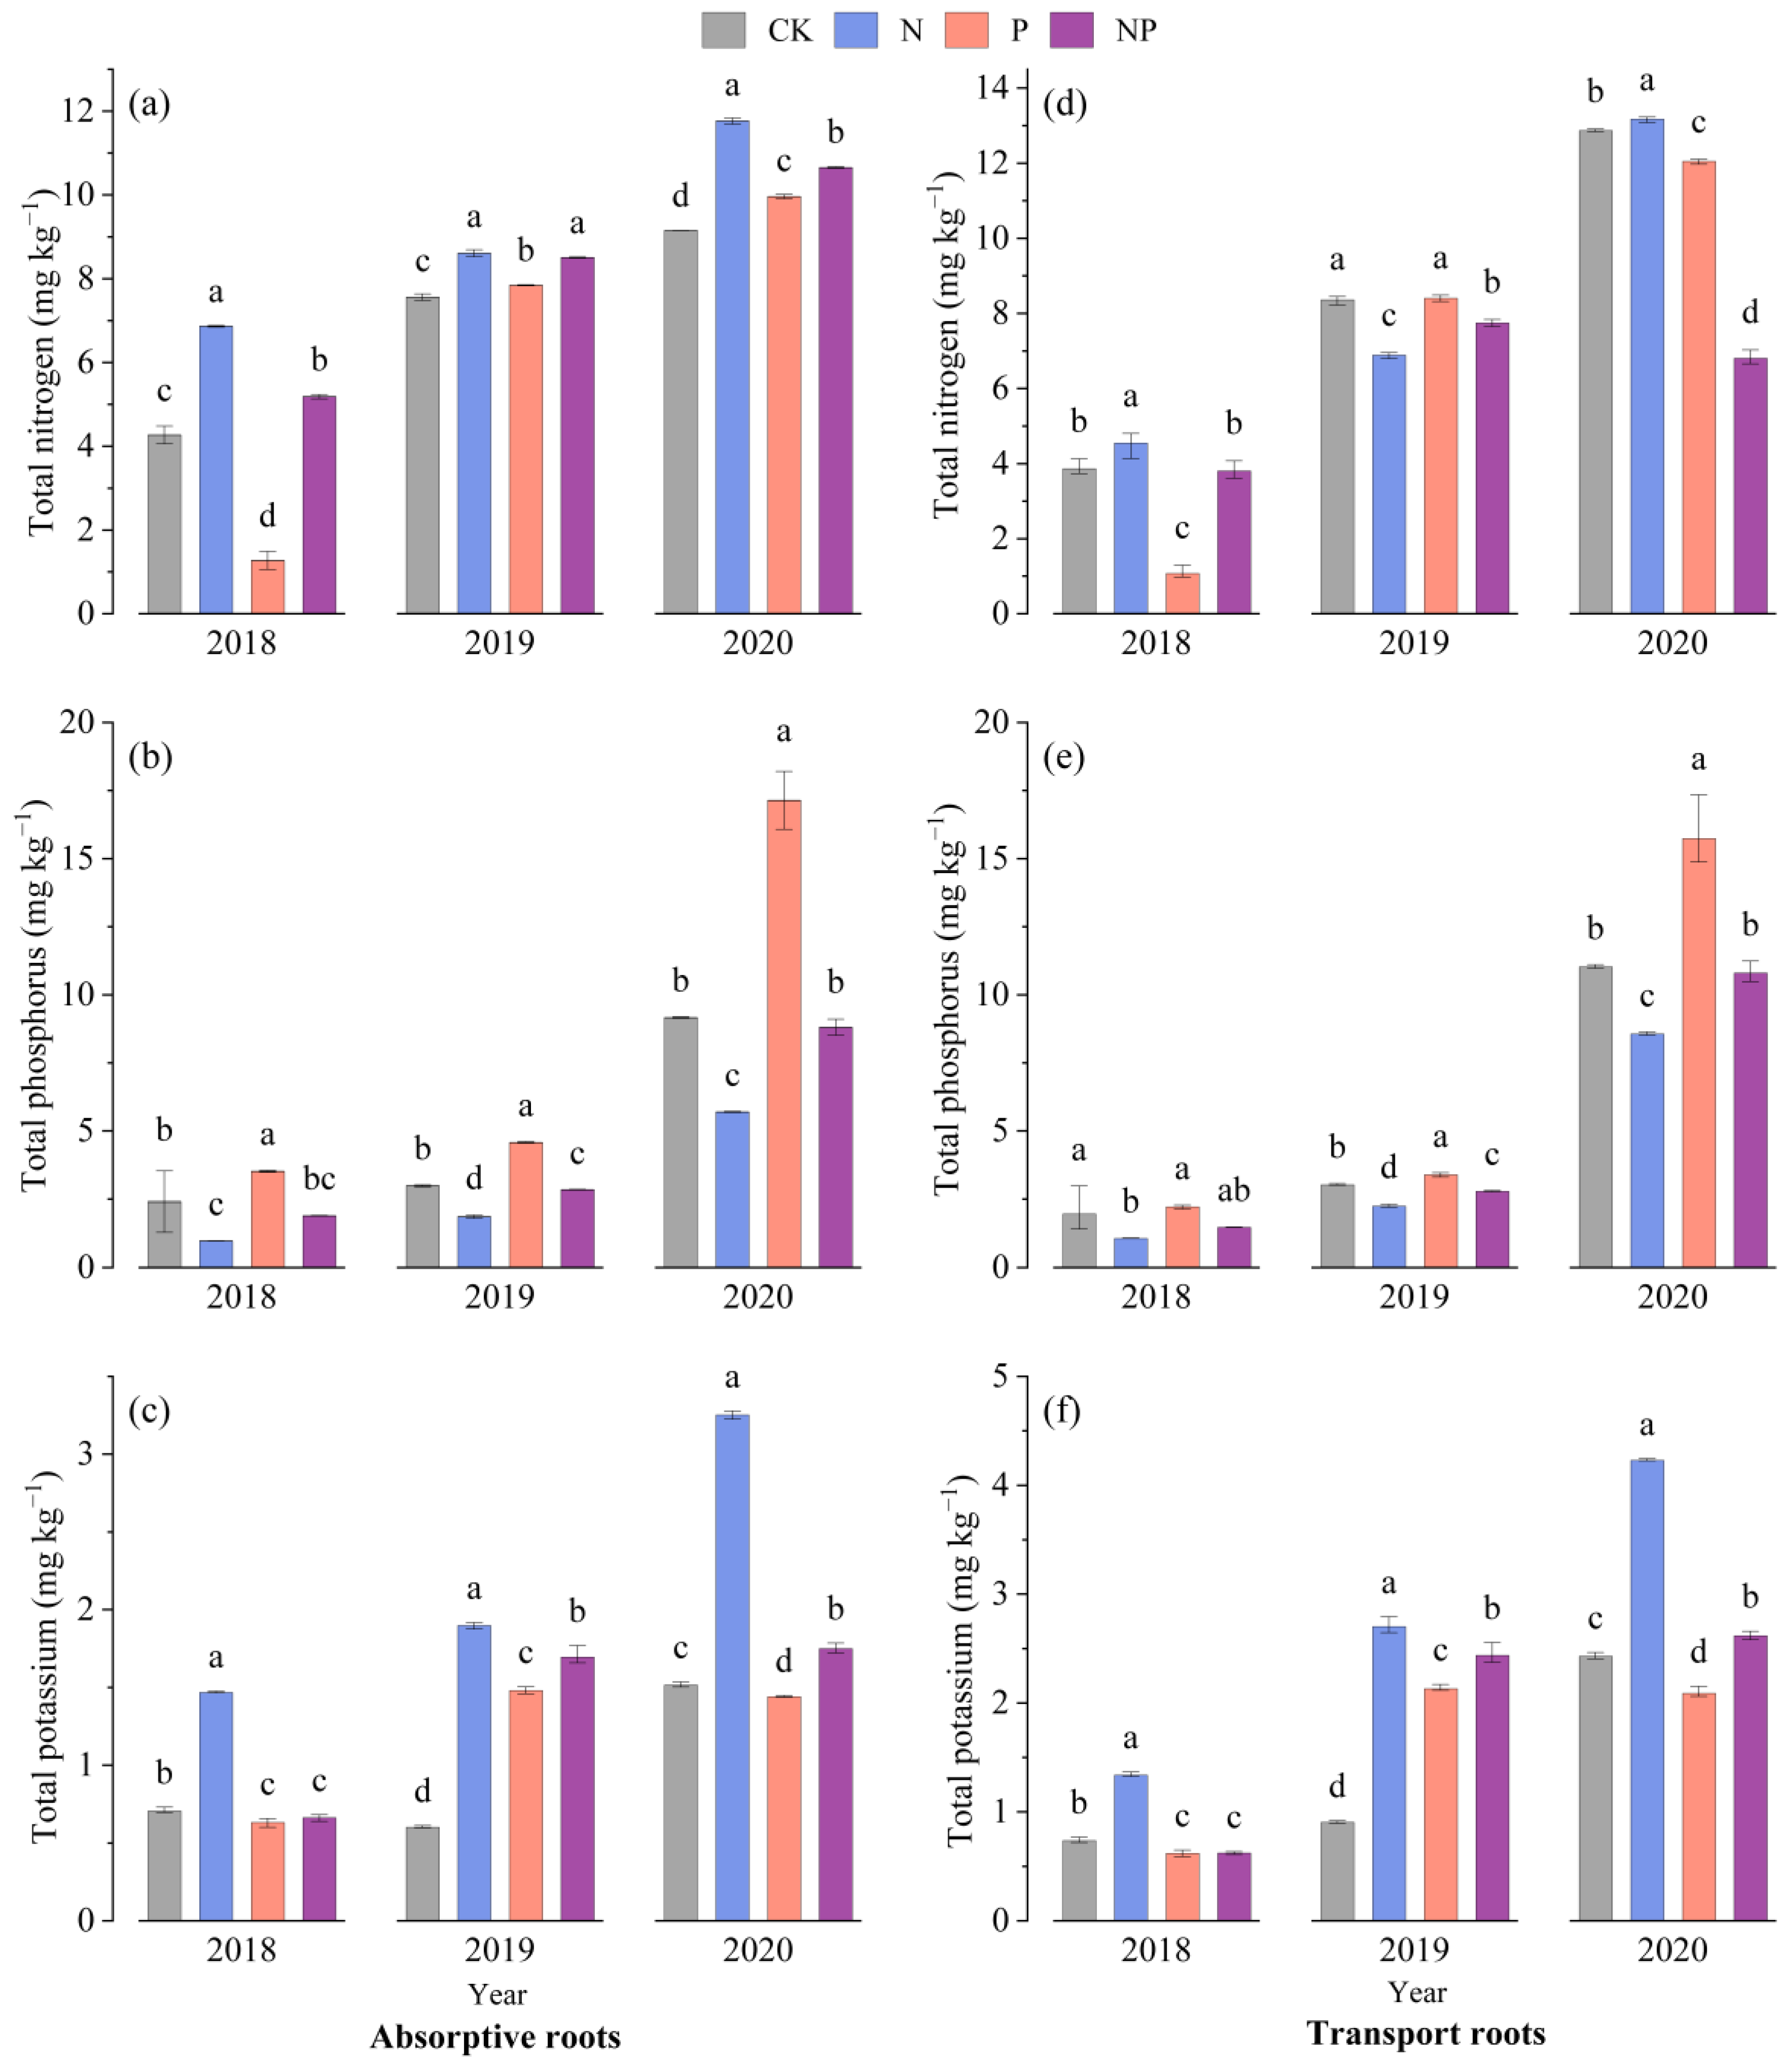
3.1. Dynamic Changes in Nutrient Content in Underground Part

Compared to the CK, N and NP addition increased soil TN and TK content, while P addition increased soil TP content from 2018 to 2020 (Figure 2a–c). Notably, in 2020, the TP content under each treatment showed a significant increase. In 2018, N and P treatments increased soil TN content compared to CK (p < 0.05). Soil TN content showed the interannual variability, which first increased and then decreased from 2018 to 2020. Soil TK content showed progressive increases, with the most substantial accumulation occurring in 2020.
The absorbing roots and transporting roots showed a similar trend of TN accumulation (Figure 3a–f), with significant differences among fertilization treatments (p < 0.05). N addition consistently enhanced TN in absorptive roots but exhibited weaker or inhibitory effects in transport roots. All fertilization treatments showed consistent interannual patterns for TP and TK content across root types, maintaining similar content levels and variation trends.

3.2. Dynamic Changes in Nutrient Content in Aboveground Part

The nutrient content of twigs and needles showed obvious interannual variation, and there was a certain degree of difference among fertilization treatments (Figure 4a–f). The TN content of twigs under each treatment increased firstly and then decreased. In 2019, the accumulation of TN in twigs was the highest. Except for N addition treatment, the TN content of needles in other treatments reached the maximum in 2019. With the increase in fertilization time, the accumulation of TP content in twigs and TP and TK content in needles increased gradually. Both twigs and needles displayed parallel TK accumulation trends, with significant post-amendment increases in 2019–2020 relative to 2018 baselines (p < 0.05).

3.3. The Nutrient Transfer from Soil to Absorbing Root

After three years of continuous observation, each of the four treatment methods had its own characteristics in terms of the transport of N, P, and K from the soil to the roots, and their performance levels also differed. The addition of N increased the value of AFS-AR-N, which was greater than that of P, NP, and the CK and significantly different from that of P and CK (Table 1), especially reaching a highly significant difference in 2020. The TFS-AR values of the N showed a gradual increasing trend with the fertilization time, and the P addition increased the TFS-AR-N values from 1.00 in 2018 to 7.23 in 2020. In contrast, the TFS-AR-N value of the P addition remained the lowest in 2018, and was significantly lower than other treatments in 2018 and 2019.
The AFS-AR-P value of N addition was the lowest with 1.51, indicating that N alone may not promote the absorption of P. P addition showed higher TFS-AR-P value in all years, with the highest in 2020, indicating that P addition could effectively improve P absorption. The TFS-AR-K value of N addition increased year by year and reached a maximum of 0.83 in 2020. The AFS-AR-K value of NP treatment increased first and then decreased, reaching a peak of 0.55 in 2019. In general, NP addition had a significant effect on the nutrient transfer factors from soil to absorbing roots.

3.4. The Nutrient Transfer from Absorbing Roots to Transportive Roots

From 2018 to 2020, the TFAR-TR-N value of CK were the highest with 0.90, 1.11 and 1.41 (Table 2), respectively. Compared with other treatments, the TFAR-TR-N value of N addition were lower in 2018 and 2019, which were 0.66 and 0.80, respectively.
With the increasing fertilization time, the TFAR-TR-P value of each treatment increased. Particularly, the N addition always showed the highest the TFAR-TR-P value, indicating that N may promote the translocation of P from absorbing roots to transporting roots.
The TFAR-TR-K value of N addition was the lowest with 0.91 in 2018, then increased to 1.42 in 2019, and then decreased to 1.30 in 2020. However, the TFAR-TR-K value of other treatments showed an increasing trend year by year, indicating that with the fertilization time, the transport efficiency of K element from absorbing roots to transporting roots increased.

3.5. The Nutrient Transfer from Transportive Roots to Twigs

In 2018, the NP treatment had the highest value of TFTR-T-N with 1.50 (Table 3). From 2018 to 2020, the TFTR-T-N value exhibited a gradual interannual decline across all treatments. Notably, the NP addition consistently demonstrated a higher value of TFTR-T-N, suggesting that the NP addition enhanced the translocation of N from the transportive roots to the twigs.
In 2018, the P addition had the lowest value of TFTR-T-P with 0.74, while the N addition had the highest value with 2.86, indicating that N addition can significantly increase P translocation from transportive roots to twigs. In 2020, the value of TFTR-T-P under N and NP treatments were significantly higher than other treatments.
The value of TFTR-T-K showed a gradually decreasing interannual variation from 2018 to 2020. Compared with other treatments, the value of TFTR-T-K under N addition were always the lowest, indicating that the transportive efficiency of K element from transportive roots to the twigs was low under N addition.

3.6. The Nutrient Transfer from Twigs to Needles

From 2018 to 2020, the value of TFT-N-N under each treatment from twigs to needles decreased gradually, except in N addition treatment (Table 4). In 2020, the value of TFT-N-N under N addition was the largest with 2.75.
The value of TFT-N-N under P addition was significantly lower than other treatments, indicating that P addition alone may not effectively translocate P elements from twigs to the needles.
For TFT-N-P, while CK, P addition, and NP addition first rose then fell from branch to leaf, N addition declined gradually. Notably, P addition was less effective on P transport from branch to leaf than the other three treatments, with a low TFT-N-P value (e.g., 0.79 in 2020) and significant differences compared to other treatments.
In 2020, N and P addition treatments had the greatest impact on TFT-N-K, increasing them to 1.40 and 1.22, respectively. Across all years, N addition had a greater effect that K translocation from twigs to needles than P addition.

3.7. The Nutrient Resorption Efficiency of Needles

P addition significantly increased the N resorption efficiency of needles, while decreased the P resorption efficiency of needles in each year, so that the P resorption efficiency of needles was significantly lower than that of other treatments, which was 52.27% in 2018, 51.20% in 2019, and 51.17% in 2020 (Table 5), respectively. With the increase in fertilization time, NP addition reduced the reabsorption efficiency of N in needles, and N addition and P addition reduced the reabsorption efficiency of K in needles.

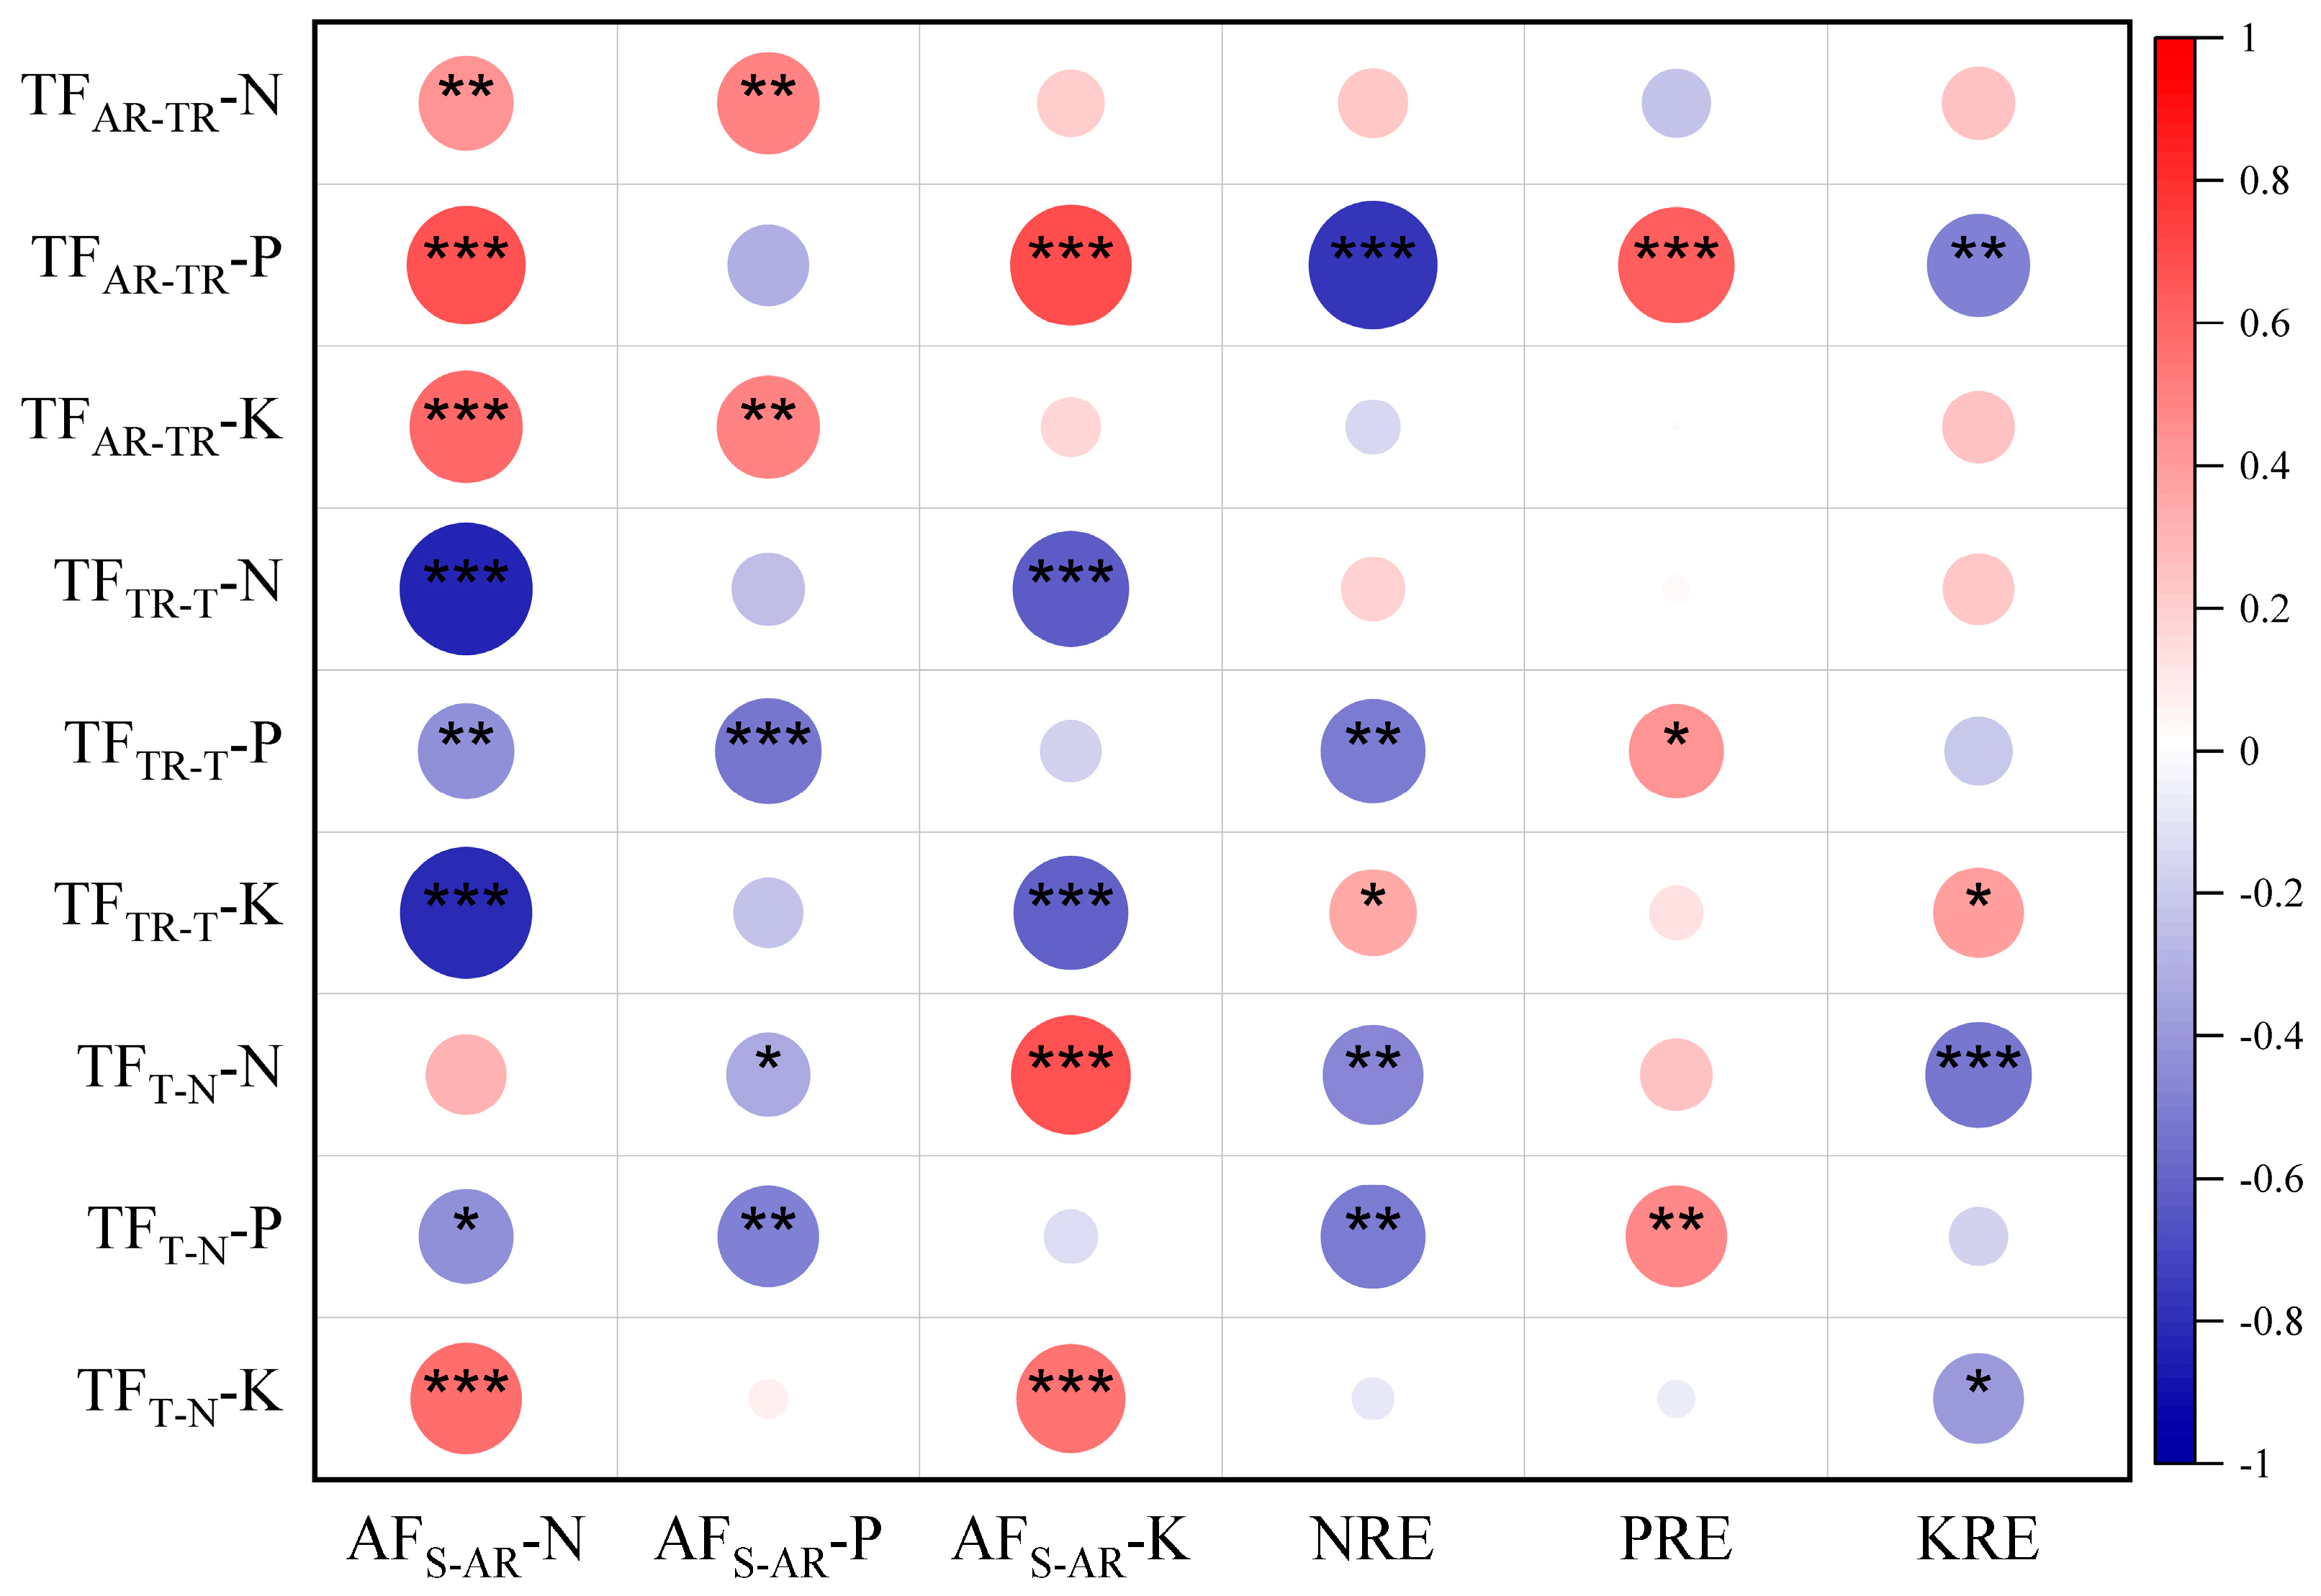
3.8. Relationship Between the Capacity of Nutrient Transport and Capture

There was a significant positive correlation between the transport factors of AFS-AR-N with TFAR-TR-N, TFAR-TR-P, and TFAR-TR-K (p < 0.001 for P and K; p < 0.01 for TFAR-TR-N) (Figure 5), AFS-AR-P was extremely positively correlated with TFAR-TR-N and K (p < 0.01), and AFS-AR-K showed an extremely significant positive correlation with TFAR-TR-P (p < 0.001). These findings indicate that the nutrients absorbed by roots promote their acquisition by transport roots. Conversely, AFS-AR-N showed extremely significant negative correlations with TFTR-T-N, TFTR-T P, and TFTR-T K (p < 0.001 for P and K; p < 0.01 for TFTR-T-N) and a significant negative correlation with TFT-N-P (p < 0.01), suggesting a negative effect of nutrient transport from transport roots to twigs and needles on root nutrient absorption. Additionally, TFAR-TR-P, TFTR-T-P, and TFT-N-P exhibited significant negative correlations with NRE (p < 0.01 for TFTR-T-P and TFT-N-P; p < 0.001 for TFAR-TR-P), implying that P concentration in plant tissues may inhibit N resorption efficiency while positively influencing PRE. Meanwhile, TFT-N-K had a significant negative correlation with KRE (p < 0.05), and similar antagonistic effects were observed in TFAR-TR-P and TFT-N-N. Overall, transport factors between aboveground and belowground plant parts showed varying degrees of correlation with needle resorption efficiency.

3.9. Predominant Elements That Influence the Most Important Processes of Nutrient Movement

Nutrient allocation and cycling in plant systems are significantly influenced by N and P additions, as indicated by SEM results (Figure 6). N application exerted a direct positive influence on soil N content (r = 0.54, Figure 6a), while adversely affecting NRE via an indirect pathway (r = −0.62). The absorption and transport factor for N (AFS-AR-N) positively affected the translocation of N from roots to aerial parts (TFAR-TR-N, r = 0.43). Root N content, modulated by the transport factor, influenced the N content in plant aerial parts (twigs and needles, r = −0.71, −0.39). Needle-acquired N negatively impacted N reabsorption efficiency (r = −0.50).
The impact of N and P application on P differed from that on N (Figure 6b). While N application had a direct negative effect on soil P content (r = −0.57), P application had a significant positive effect (r = 0.71). Notably, the transport of P from twigs to needles (TFTR-T-P) strongly positively influenced the P content in needles (TFT-N-P, r = 0.88), underscoring the importance of P acquisition by needles from twigs.
Although N application had a direct positive effect on soil K content (r = 0.41, Figure 6c), it adversely affected KRE via an indirect pathway (r = −0.51). In contrast, P application had a relatively minor impact on K absorption and translocation in plants.

4. Discussion

4.1. Nutrient Dynamic Transport of Aboveground and Underground Parts

This three-year localized experiment reveals the differential regulation of soil nutrient pools by N and P fertilization. N and NP inputs drive continuous accumulation of TN and TK, while sole P application strengthens TP fixation (Figure 1) [40]. These nutrient-specific responses are closely tied to the chemical coupling mechanisms of soil element cycling. N addition promotes nitrogen transformation and K+ release by stimulating humification and nitrification-denitrification microbial activity [17,41]. In contrast, sustained P input may inhibit P oxide fixation by altering soil anion-exchange sites. The study also shows inter-annual fluctuations in soil nutrient pool responses to fertilization. TN content first rises and then falls, likely due to the phased stimulation of N inputs. Initial N addition boosts microbial immobilization, but prolonged application increases nitrification and the risk of NO3-N leaching [42,43,44]. Notably, the significant TP increase at the end of the experiment may reflect not only P fertilizer accumulation but also a decline in iron and aluminum oxide phosphorus-fixing capacity during soil colloid aging [45,46], offering a theoretical basis for optimizing P fertilizer management.
In response to external environmental variations, plant belowground organs—particularly root systems—actively modulate their growth patterns and physiological functions to optimize nutrient acquisition for sustaining aerial organ development [47,48,49,50]. Subsequently, these organisms execute precise allocation of assimilates in accordance with intrinsic regulatory mechanisms that govern resource partitioning priorities [12]. This study showed that N addition consistently enhanced N in absorptive roots but exhibited weaker or inhibitory effects in transport roots, which means that fertilization preferentially regulated the nutrients in the underground part, especially the nutrient content in soil and absorbing roots. In addition, the nutrient content of needles and twigs has a certain degree of difference among fertilization treatments, and the N content of twigs was increased first and then decreased, indicating that the above-ground part will make different responses to N and P additions. This means that when nutrient input continues, soil nutrient availability increases, and plants tend to adjust nutrient allocation between different tissues and organs to coordinate the relationship between underground nutrient acquisition and above-ground nutrient utilization, ensuring a balanced allocation of resources in a changing nutrient environment [7,10].
As expected, N addition improved N absorption and reduced N resorption. Furthermore, we noted substantial relationships between NRE and TFS-AR-N (N capture) and TFAR–TR-N (N translocation), suggesting that the anticipated balance between nutrient acquisition and retention has materialized. This suggests that in an environment where nutrients are more abundant, plants will smartly choose a more energy-efficient way to obtain nutrients [16,51]. Our research revealed a significant link between TFS-AR-N and other nutrient transport coefficients (Figure 5). Nutrient transport from the soil to the roots and needles involves complex physiological and biochemical processes [15,21]. Nutrient acquisition is influenced not only by nutrient uptake mechanisms but also by a plant’s capacity to incorporate these nutrients and distribute them to various tissues [3,12]. Many factors influence the absorption and transport of nutrients, including temperature and precipitation [52]. In our investigation, the movement factor of K remained unchanged with the application of N and P.

4.2. Interannual Variation in Plant Nutrient Capture and Resorption

In the process of changing soil management practices, the recycling and utilization of plant nutrients changes with changes in soil nutrient availability [53]. Our research revealed that N and P addition considerably influences the processes of capturing, reabsorbing, and transporting these nutrients. N addition enhances soil N and K accessibility, yet it exacerbates the constraints on P availability [54]. Once phosphorus limitation is alleviated, the plant’s N uptake efficiency decreases in forests. This concurs with previous research findings [1,55]. Accordingly, the nutrient acquisition strategy of a plant can be adjusted accordingly [56]. This may be because soil N and P availability continues to increase as fertilization increases, causing their impact on the surrounding environment to intensify [57,58]. As for the factors like stand age of trees and litter decomposition, which are closely related to nutrient acquisition and balance of plants, they are not covered in this study and call for further investigation.

4.3. The Potential Use of Transport Capacity as a Measure of the Trade-Off Between Capture and Absorption

Our research indicates that the ability of N, P, and K to be translocated mirrors the balance between acquisition and assimilation processes. AFS-AR-N and TFTR-T-N exhibited a significant positive correlation, AFS-AR-N and TFTR-T-N exhibited a significant negative correlation, suggesting that the emphasis on the N capture strategy is evident through the enhanced transport capability from the roots to the twigs. The relationships between the LRE of N and P and the transfer factors for the TFTR-T and TFTR-L of N, P, and K indicate a heightened capacity for nutrient transport from the roots to the twigs [22], which mirrors the prioritization of N, P, and K in the strategy for nutrient uptake in the branches. LRE-K and TFTR-L-K exhibited a notable positive relationship, indicating that the augmented K conveyance from roots to leaves mirrors the emphasis on the leaf K absorption approach. The findings from our research suggest that the conveyance capability of nutrients serves as a quantifiable indicator, reflecting the interplay of nutrient capture and absorption in forest ecosystems.
SEM analysis (Figure 6) shows that N addition has a direct positive effect on soil N content but an indirect negative effect on NRE (r = −0.62). This indicates that increased soil N content from N addition does not effectively enhance plant N reabsorption, possibly due to saturated plant N demand or inhibition of reabsorption mechanisms from excessive N supply. Notably, needle-acquired N negatively affects NRE (r = −0.50). In pine forests, N allocation within plants prioritizes root storage to cope with future N shortage, reducing overall reabsorption efficiency due to needle N accumulation. Furthermore, TFTR-T-P strongly positively influences TFT-N-P (r = 0.88), highlighting the importance of needle P acquisition from twigs. This strong positive relationship may reflect plants’ efficient P utilization strategies, given P’s critical role in plant metabolism. Overall, these findings indicate that N and P addition has complex effects on nutrient allocation and cycling in plant systems [59]. These effects depend not only on the type of nutrient added but also on the combined effects of plant species, growth stages, and environmental conditions [16,22,60,61,62].
Caution should be exercised despite the above interpretations. Instead of direct measurement, estimations of nutrient absorption and transportation abilities have been inferred indirectly through the analysis of ratios between closely related nutrient reservoirs [37]. These ratios solely indicate the comparative levels of nutrient densities, with persisting doubts about the precise dimensions of the compartments and their temporal fluctuations. This research is founded on the hypothesis that the integrity of nutrient pools is independent of N and P supplementation [63]. Moreover, factors such as forest age and climate change during the fertilization of slash pines were not addressed in the analysis of this study. These will be examined in greater detail in subsequent experiments.

5. Conclusions

In this study, the changes in N, P, and K contents in the underground and aboveground tissues of subtropical slash pine plantations were continuously observed, and the trends of plant uptake, transport and reabsorption of nutrients were discussed to reveal the balance strategy of plants in nutrient acquisition. The results showed that N and P additions increased the contents of N, P, and K in soil and plant tissues with the obvious interannual variation. N addition promoted the transport of P element from transport roots to twigs, while P addition inhibited the transport of P element. There were different degrees of correlation between the transport factors between the aboveground and underground parts and the reabsorption efficiency of the needles. The correlation coefficients between the NRE in needles and the P transport factors from absorbing roots to transporting roots was −0.77. In addition, N and P additions had a direct positive effect on the content of N, P and K in soil. In contrast, N addition had an indirect negative effect on the NRE and KRE, but a positive effect on PRE. P addition had an indirect negative effect on PRE. In general, N and P additions enhanced the nutrient uptake and flow in the underground part of the pine plantations, while the coordination and dynamic balance of N and P in the aboveground part were more significant, indicating that the slash pine plantation had active adaptability to external nutrient changes (increased N and P input).

Author Contributions

Conceptualization, Methodology, Formal analysis, Investigation, Writing—original draft, Visualization, Y.F.; Conceptualization, Validation, Formal analysis, Data curation, Visualization, Writing—review and editing, A.W.; Experimental design, Investigation, Formal analysis, Writing—review and editing, Visualization, T.J.; Investigation, Resources, S.G.; Experimental design, investigation, M.Y.; Validation, Methodology, Z.C.; Resources, Funding acquisition, M.L.; Project administration, Funding acquisition, L.Z. All authors have read and agreed to the published version of the manuscript.

Funding

This research was funded by the National Key Research and Development Program of China during the 13th Five-Year Period (No. 2017YFD0600502-5) and the Jiangxi Province Graduate Innovation Special Fund Project (No. YC2020-B086). We appreciate this financial support.

Data Availability Statement

The data presented in this study are available on request from the corresponding author. The data is not publicly available due to privacy restrictions.

Acknowledgments

We thank the Jiangxi Feishang Forestry Industry Co., Ltd. for providing the experimental plantations. We also thank Chunhong Yang and Haozhi Long for their assistance in the field.

Conflicts of Interest

The authors declare no conflicts of interest.

References

  1. Marklein, A.R.; Houlton, B.Z. Nitrogen inputs accelerate phosphorus cycling rates across a wide variety of terrestrial ecosystems. New Phytol. 2012, 193, 696–704. [Google Scholar] [CrossRef]
  2. You, C.; Peng, C.; Xu, Z.; Liu, Y.; Zhang, L.; Yin, R.; Liu, L.; Li, H.; Wang, B.; Wang, L.; et al. Nitrogen addition mediates the response of foliar stoichiometry to phosphorus addition: A meta-analysis. Ecol. Process. 2021, 10, 58. [Google Scholar] [CrossRef]
  3. Oldroyd, G.E.D.; Leyser, O. A plant’s diet, surviving in a variable nutrient environment. Science 2020, 368, eaba0196. [Google Scholar] [CrossRef]
  4. Elser, J.J.; Dobberfuhl, D.R.; MacKay, N.A.; Schampel, J.H. Organism Size, Life History, and N:P Stoichiometry: Toward a unified view of cellular and ecosystem processes. BioScience 1996, 46, 674–684. [Google Scholar] [CrossRef]
  5. McGroddy, M.E.; Daufresne, T.; Hedin, L.O. Scaling of C:N:P stoichiometry in forests worldwide: Implications of treeestrial redfield-type ratios. Ecology 2004, 85, 2390–2401. [Google Scholar] [CrossRef]
  6. Guan, Z.-H.; Cao, Z.; Li, X.G.; Scholten, T.; Kühn, P.; Wang, L.; Yu, R.-P.; He, J.-S. Soil phosphorus availability mediates the effects of nitrogen addition on community- and species-level phosphorus-acquisition strategies in alpine grasslands. Sci. Total Environ. 2024, 906, 167630. [Google Scholar] [CrossRef]
  7. Ma, N.; Kou, L.; Li, S.; Dai, X.; Meng, S.; Jiang, L.; Xue, Y.; Zheng, J.; Fu, X.; Wang, H. Plant–soil feedback regulates the trade-off between phosphorus acquisition pathways in Pinus elliottii. Tree Physiol. 2023, 43, 1092–1103. [Google Scholar] [CrossRef]
  8. Yu, G.; Chen, J.; Yu, M.; Li, A.; Wang, Y.-P.; He, X.; Tang, X.; Liu, H.; Jiang, J.; Mo, J.; et al. Eighteen-year nitrogen addition does not increase plant phosphorus demand in a nitrogen-saturated tropical forest. J. Ecol. 2023, 111, 1545–1560. [Google Scholar] [CrossRef]
  9. Zhao, C.; Lin, Q.; Tian, D.; Ji, C.; Shen, H.; Fan, D.; Wang, X.; Fang, J. Nitrogen addition promotes conservative resource-use strategies via aggravating phosphorus limitation of evergreen trees in subtropical forest. Sci. Total Environ. 2023, 889, 164047. [Google Scholar] [CrossRef]
  10. Suonan, J.; Lu, X.; Li, X.; Hautier, Y.; Wang, C. Nitrogen addition strengthens the stabilizing effect of biodiversity on productivity by increasing plant trait diversity and species asynchrony in the artificial grassland communities. Front. Plant Sci. 2023, 14, 1301461. [Google Scholar] [CrossRef]
  11. Li, Q.; Yingxin, H.; Daowei, Z.; Shan, C. Mechanism of the trade-off between biological nitrogen fixation and phosphorus acquisition strategies of herbaceous legumes under nitrogen and phosphorus addition. Chin. J. Plant Ecol. 2021, 45, 286–297. [Google Scholar] [CrossRef]
  12. Kou, L.; Wang, H.; Gao, W.; Chen, W.; Yang, H.; Li, S. Nitrogen addition regulates tradeoff between root capture and foliar resorption of nitrogen and phosphorus in a subtropical pine plantation. Trees 2017, 31, 77–91. [Google Scholar] [CrossRef]
  13. See, C.R.; Yanai, R.D.; Fisk, M.C.; Vadeboncoeur, M.A.; Quintero, B.A.; Fahey, T.J. Soil nitrogen affects phosphorus recycling: Foliar resorption and plant–soil feedbacks in a northern hardwood forest. Ecology 2015, 96, 2488–2498. [Google Scholar] [CrossRef]
  14. Lambers, H.; Shane, M.W.; Cramer, M.D.; Pearse, S.J.; Veneklaas, E.J. Root Structure and Functioning for Efficient Acquisition of Phosphorus: Matching Morphological and Physiological Traits. Ann. Bot. 2006, 98, 693–713. [Google Scholar] [CrossRef]
  15. Ren, H.; Gao, G.; Ma, Y.; Li, Z.; Wang, S.; Gu, J. Shift of root nitrogen-acquisition strategy with tree age is mediated by root functional traits along the collaboration gradient of the root economics space. Tree Physiol. 2023, 43, 1341–1353. [Google Scholar] [CrossRef]
  16. Wen, Z.; Li, H.; Shen, Q.; Tang, X.; Xiong, C.; Li, H.; Pang, J.; Ryan, M.H.; Lambers, H.; Shen, J. Tradeoffs among root morphology, exudation and mycorrhizal symbioses for phosphorus-acquisition strategies of 16 crop species. New Phytol. 2019, 223, 882–895. [Google Scholar] [CrossRef]
  17. Sardans, J.; Peñuelas, J. Potassium: A neglected nutrient in global change. Glob. Ecol. Biogeogr. 2015, 24, 261–275. [Google Scholar] [CrossRef]
  18. Głąb, T.; Gondek, K. The influence of soil compaction and N fertilization on physico-chemical properties of Mollic Fluvisol soil under red clover/grass mixture. Geoderma 2014, 226–227, 204–212. [Google Scholar] [CrossRef]
  19. Wang, B.; Chen, J.; Huang, G.; Zhao, S.; Dong, F.; Zhang, Y.; He, W.; Wang, P.; Yan, Z. Growth and nutrient stoichiometry responses to N and P fertilization of 8-year old Masson pines (Pinus massoniana) in subtropical China. Plant Soil 2022, 477, 343–356. [Google Scholar] [CrossRef]
  20. Yuan, Z.Y.; Chen, H.Y.H. Negative effects of fertilization on plant nutrient resorption. Ecology 2015, 96, 373–380. [Google Scholar] [CrossRef]
  21. Wang, J.; Wang, J.; Guo, W.; Li, Y.; Wang, G.G.; Wu, T. Stoichiometric homeostasis, physiology, and growth responses of three tree species to nitrogen and phosphorus addition. Trees 2018, 32, 1377–1386. [Google Scholar] [CrossRef]
  22. Chen, F.-S.; Niklas, K.J.; Liu, Y.; Fang, X.-M.; Wan, S.-Z.; Wang, H. Nitrogen and phosphorus additions alter nutrient dynamics but not resorption efficiencies of Chinese fir leaves and twigs differing in age. Tree Physiol. 2015, 35, 1106–1117. [Google Scholar] [CrossRef]
  23. Hao, C.; Geshere Abdisa, G.; Wei, Z.; Xiaoyun, Z.; Mianhai, Z.; Qigui, M.; Tao, Z.; Jiangming, M. Nitrogen saturation in humid tropical forests after 6 years of nitrogen and phosphorus addition: Hypothesis testing. Funct. Ecol. 2015, 30, 305–313. [Google Scholar] [CrossRef]
  24. Fan, Y.; Zhong, X.; Lin, F.; Liu, C.; Yang, L.; Wang, M.; Chen, G.; Chen, Y.; Yang, Y. Responses of soil phosphorus fractions after nitrogen addition in a subtropical forest ecosystem: Insights from decreased Fe and Al oxides and increased plant roots. Geoderma 2019, 337, 246–255. [Google Scholar] [CrossRef]
  25. Wang, X.; Li, S.; Zhu, B.; Homyak, P.M.; Chen, G.; Yao, X.; Wu, D.; Yang, Z.; Lyu, M.; Yang, Y. Long-term nitrogen deposition inhibits soil priming effects by enhancing phosphorus limitation in a subtropical forest. Glob. Change Biol. 2023, 29, 4081–4093. [Google Scholar] [CrossRef]
  26. Zhu, Y.; Gao, Z.; Liu, L.; Li, J.; Zhu, T.; Ma, J.; DeLuca, T.H.; Duan, M. Nitrogen-Fixing Plants Enhance Soil Phosphorus Availability by Promoting Transformations Among Phosphorus Fractions in a Subtropical Karst Forest. Forests 2025, 16, 360. [Google Scholar] [CrossRef]
  27. Richardson, A.E.; Simpson, R.J. Soil Microorganisms Mediating Phosphorus Availability Update on Microbial Phosphorus. Plant Physiol. 2011, 156, 989–996. [Google Scholar] [CrossRef]
  28. Deng, Q.; Hui, D.; Sam Dennis; Reddy, K.C. Responses of terrestrial ecosystem phosphorus cycling to nitrogen addition: A meta-analysis. Glob. Ecol. Biogeogr. 2017, 26, 713–728. [Google Scholar] [CrossRef]
  29. Chen, Z.; Xiao, Y.; Dong, X.; Deng, Z.; Zhou, X.; Yan, G.; Zhang, J.; Han, S. Nitrogen addition promotes soil organic phosphorus accumulation through increasing microbial biomass phosphorus in a temperate forest. Plant Soil 2024, 1–16. [Google Scholar] [CrossRef]
  30. Ye, X.; Bu, W.; Hu, X.; Liu, B.; Liang, K.; Chen, F. Species divergence in seedling leaf traits and tree growth response to nitrogen and phosphorus additions in an evergreen broadleaved forest of subtropical China. J. For. Res. 2023, 34, 137–150. [Google Scholar] [CrossRef]
  31. Jia, T.; Yi, M.; Chen, F.; Lai, M.; Jin, C.; Nie, Z.; Zhou, L.; Xie, J.; Zhang, L. Response of C:N:P Stoichiometry to Phosphorus Addition and Homeostasis of Plant Tissues in a Subtropical Slash Pine Plantation. Forests 2023, 14, 1355. [Google Scholar] [CrossRef]
  32. Jia, T.; Fang, X.; Yuan, Y.; Fu, Y.; Yi, M.; Yuan, S.; Guo, S.; Lai, M.; Xie, J.; Zhang, L. Phosphorus addition alter the pine resin flow rate by regulating tree growth and non-structural carbohydrates in a subtropical slash pine plantation. Ind. Crops Prod. 2023, 199, 116782. [Google Scholar] [CrossRef]
  33. Ding, Z.; Tang, M.; Chen, X.; Yin, L.; Gui, H.; Zhu, B. Measuring rhizosphere effects of two tree species in a temperate forest: A comprehensive method comparison. Rhizosphere 2019, 10, 100153. [Google Scholar] [CrossRef]
  34. Sparks, D.L.; Page, A.L.; Helmke, P.A.; Loeppert, R.H.; Soltanpour, P.N.; Tabatabai, M.A.; Johnston, C.T.; Sumner, M.E. Methods of Soil Analysis. Part 3—Chemical Methods; ACSESS: Madison, WI, USA, 1996. [Google Scholar]
  35. Lu, R.K. Analysis Method of Soil Agricultural Chemistry; China Agricultural Science and Technology Press: Beijing, China, 2000. [Google Scholar]
  36. Parkinson, J.A.; Allen, S.E. A wet oxidation procedure suitable for the determination of nitrogen and mineral nutrients in biological material. Commun. Soil Sci. Plan. 1975, 6, 1–11. [Google Scholar] [CrossRef]
  37. Wu, A.; Hu, X.; Wang, F.; Guo, C.; Wang, H.; Chen, F. Nitrogen deposition and phosphorus addition alter mobility of trace elements in subtropical forests in China. Sci. Total Environ. 2021, 781, 146778. [Google Scholar] [CrossRef]
  38. Ye, D.; Li, T.; Chen, G.; Zheng, Z.; Yu, H.; Zhang, X. Influence of swine manure on growth, P uptake and activities of acid phosphatase and phytase of Polygonum hydropiper. Chemosphere 2014, 105, 139–145. [Google Scholar] [CrossRef]
  39. Vergutz, L.; Manzoni, S.; Porporato, A.; Novais, R.F.; Jackson, R.B. Global resorption efficiencies and concentrations of carbon and nutrients in leaves of terrestrial plants. Ecol. Monogr. 2012, 82, 205–220. [Google Scholar] [CrossRef]
  40. Bargaz, A.; Lyamlouli, K.; Chtouki, M.; Zeroual, Y.; Dhiba, D. Soil Microbial Resources for Improving Fertilizers Efficiency in an Integrated Plant Nutrient Management System. Front. Microbiol. 2018, 9, 1606. [Google Scholar] [CrossRef]
  41. Wang, R.; Bicharanloo, B.; Hou, E.; Jiang, Y.; Dijkstra, F.A. Phosphorus Supply Increases Nitrogen Transformation Rates and Retention in Soil: A Global Meta-Analysis. Earth’s Future 2022, 10, e2021EF002479. [Google Scholar] [CrossRef]
  42. Song, L.; Liao, J.; Ma, F.; Wang, S.; Yan, Y.; Chen, C.; Zhou, Q.; Niu, S. Nitrogen additions increase soil microbial nitrate- rather than ammonium- immobilization. Biol. Fertil. Soils. 2025, 61, 1–16. [Google Scholar] [CrossRef]
  43. Magill, A.H.; Aber, J.D.; Hendricks, J.J.; Bowden, R.D.; Melillo, J.M.; Steudler, P.A. Biogeochemical response of forest ecosystems to simulated chronic nitrogen deposition. Ecol. Appl. 1997, 7, 402–415. [Google Scholar] [CrossRef]
  44. Aber, J.D.; Magill, A.; Boone, R.; Melillo, J.M.; Steudler, P. Plant and Soil Responses to Chronic Nitrogen Additions at the Harvard Forest, Massachusetts. Ecol. Appl. 1993, 3, 156–166. [Google Scholar] [CrossRef] [PubMed]
  45. Johnston, A.E.; Poulton, P.R.; Fixen, P.E.; Curtin, D. Phosphorus: Its Efficient Use in Agriculture; Academic Press: Cambridge, MA, USA, 2014. [Google Scholar]
  46. Hinsinger, P. Bioavailability of soil inorganic P in the rhizosphere as affected by root-induced chemical changes: A review. Plant Soil 2001, 237, 173–195. [Google Scholar] [CrossRef]
  47. Song, Y.; Wan, G.-Y.; Wang, J.-X.; Zhang, Z.-S.; Xia, J.-Q.; Sun, L.-Q.; Lu, J.; Ma, C.-X.; Yu, L.-H.; Xiang, C.-B.; et al. Balanced nitrogen–iron sufficiency boosts grain yield and nitrogen use efficiency by promoting tillering. Mol. Plant 2023, 16, 1661–1677. [Google Scholar] [CrossRef]
  48. Fan, Y.; Lin, F.; Yang, L.; Zhong, X.; Wang, M.; Zhou, J.; Chen, Y.; Yang, Y. Decreased soil organic P fraction associated with ectomycorrhizal fungal activity to meet increased P demand under N application in a subtropical forest ecosystem. Biol. Fertil. Soils. 2018, 54, 149–161. [Google Scholar] [CrossRef]
  49. Li, J.; Liu, Z.-F.; Jin, M.-K.; Zhang, W.; Lambers, H.; Hui, D.; Liang, C.; Zhang, J.; Wu, D.; Sardans, J.; et al. Microbial controls over soil priming effects under chronic nitrogen and phosphorus additions in subtropical forests. ISME J. 2023, 17, 2160–2168. [Google Scholar] [CrossRef] [PubMed]
  50. Yu, G.; Wang, Y.; Li, A.; Wang, S.; Chen, J.; Mo, J.; Zheng, M. Root functional traits are important predictors for plant resource acquisition strategies in subtropical forests. Ecol. Appl. 2025, 35, e3082. [Google Scholar] [CrossRef]
  51. Yang, K.; Chen, G.; Xian, J.; Chang, H. Divergent adaptations of leaf functional traits to light intensity across common urban plant species in Lanzhou, northwestern China. Front. Plant Sci. 2023, 14, 1000647. [Google Scholar] [CrossRef]
  52. Xie, L.; Wang, L.; Pang, X.; Liu, Q.; Yin, C. Effects of soil water regime and nitrogen addition on ectomycorrhizal community structure of Picea asperata seedlings. J. Plant Nutr. Soil Sci. 2021, 184, 415–429. [Google Scholar] [CrossRef]
  53. Hedin, L.O. Global organization of terrestrial plant–nutrient interactions. Proc. Natl. Acad. Sci. USA 2004, 101, 10849–10850. [Google Scholar] [CrossRef]
  54. Li, Y.; Li, Y.; Yao, X.; Wen, Y.; Zhou, Z.; Lei, W.; Zhang, D.; Lin, H. Nitrogen-inducible GLK1 modulates phosphate starvation response via the PHR1-dependent pathway. New Phytol. 2022, 236, 1871–1887. [Google Scholar] [CrossRef] [PubMed]
  55. Lü, X.-T.; Reed, S.; Yu, Q.; He, N.-P.; Wang, Z.-W.; Han, X.-G. Convergent responses of nitrogen and phosphorus resorption to nitrogen inputs in a semiarid grassland. Glob. Change Biol. 2013, 19, 2775–2784. [Google Scholar] [CrossRef] [PubMed]
  56. Tong, R.; Ma, C.; Lou, C.; Yuan, W.; Zhu, N.; Wang, G.G.; Wu, T. Leaf nitrogen and phosphorus stoichiometry of the halophytes across China. Front. Plant Sci. 2023, 14, 1276699. [Google Scholar] [CrossRef]
  57. DeMalach, N. Toward a mechanistic understanding of the effects of nitrogen and phosphorus additions on grassland diversity. Perspect. Plant Ecol. 2018, 32, 65–72. [Google Scholar] [CrossRef]
  58. Phoenix, G.K.; Booth, R.E.; Leake, J.R.; Read, D.J.; Grime, J.P.; Lee, J.A. Simulated pollutant nitrogen deposition increases P demand and enhances root-surface phosphatase activities of three plant functional types in a calcareous grassland. New Phytol. 2004, 161, 279–290. [Google Scholar] [CrossRef]
  59. Fang, X.; Yang, D.; Deng, L.; Zhang, Y.; Lin, Z.; Zhou, J.; Chen, Z.; Ma, X.; Guo, M.; Lu, Z.; et al. Phosphorus uptake, transport, and signaling in woody and model plants. For. Res. 2024, 4, e017. [Google Scholar] [CrossRef]
  60. Kou, L.; Chen, W.; Jiang, L.; Dai, X.; Fu, X.; Wang, H.; Li, S. Simulated nitrogen deposition affects stoichiometry of multiple elements in resource-acquiring plant organs in a seasonally dry subtropical forest. Sci. Total Environ. 2018, 624, 611–620. [Google Scholar] [CrossRef] [PubMed]
  61. Guo, D.; Xia, M.; Wei, X.; Chang, W.; Liu, Y.; Wang, Z. Anatomical traits associated with absorption and mycorrhizal colonization are linked to root branch order in twenty-three Chinese temperate tree species. New Phytol. 2008, 180, 673–683. [Google Scholar] [CrossRef]
  62. Gao, X.; Gao, Y.; Li, X.; Zhang, C.; Zeng, Q.; Yuan, X.; Chen, Y.; Yu, Y.; Fu, S. Eleven-year canopy nitrogen addition enhances the uptake of phosphorus by plants and accelerates its depletion in soil. Forests 2024, 15, 416. [Google Scholar] [CrossRef]
  63. Perring, M.P.; Hedin, L.O.; Levin, S.A.; McGroddy, M.; de Mazancourt, C. Increased plant growth from nitrogen addition should conserve phosphorus in terrestrial ecosystems. Proc. Natl. Acad. Sci. USA 2008, 105, 1971–1976. [Google Scholar] [CrossRef]
Figure 1. Study site location and experimental design. (a) The localization of study site (26°44′47″ N, 114°50′44″ E) is a slash pine plantations located in Jiangxi Province. (b) The experimental design comprised 16 plots measuring 20  ×  20 m, each corresponding to a treatment repeated in four sets (blocks). Plots were at least 10 m apart and randomized within each block and consisted of a control (CK, unfertilized stand), N, P, and NP additions.
Forests 16 00928 g001
Figure 2. Dynamic changes in the nutrient contents in the soil from 2018 to 2020. Note: different letters indicate significant differences based on Duncan’s test (p < 0.05), the lowercase letters indicate significant differences among treatments within the same year. All data are expressed as mean values, and error bars indicate standard error (n = 3). The same as below. (ac) represent the content of N, P and K in the soil, respectively.
Forests 16 00928 g002
Figure 3. Dynamic changes in the nutrient contents in absorptive roots and transport roots from 2018 to 2020. Note: (ac) represent the content of N, P and K in the absorptive roots, respectively. (df) represent the content of N, P and K in the transport roots, respectively. Different lowercase letters indicate significant differences based on Duncan’s test (p < 0.05), the lowercase letters indicate significant differences among treatments within the same year.
Forests 16 00928 g003
Figure 4. Dynamic changes in the nutrient contents in the twigs and needles from 2018 to 2020. Note: (ac) represent the content of N, P and K in the twigs, respectively. (df) represent the content of N, P and K in the needles, respectively. Different lowercase letters indicate significant differences based on Duncan’s test (p < 0.05), the lowercase letters indicate significant differences among treatments within the same year.
Forests 16 00928 g004
Figure 5. Correlation between the capacity of nutrient transport and capture. TFS-AR, translocation factor of nutrients from soils to absorptive roots; TFS-TR, translocation factor of nutrients from soils to absorptive roots; TFTR-T, translocation factor of nutrients from transportive roots; TFTR-N, translocation factor of nutrients from transportive roots to leaves; NRE, resorption efficiency of N in needles; PRE, resorption efficiency of P in needles; KRE, resorption efficiency of K in needles. The red circle represents a positive correlation, and the blue circle represents a negative correlation; the darker the color is, the stronger the correlation. An asterisk indicates a significant correlation. * p < 0.05, ** p < 0.01 and *** p < 0.001.
Forests 16 00928 g005
Figure 6. SEM was used to analyze the impact of N and P supplementation on the movement of nutrients within a slash pine plantation. (a) The model fitting results for N: X2/df (Chi-square to degrees of freedom ratio) = 2.998, GFI (Goodness of Fit Index) = 0.985, RMSEA (Root Mean Square Error of Approximation) = 0.063, RMR (Root Mean Square Residual) = 0.0472, CFI (Comparative Fit Index) = 0.955. (b) The model fitting results for P: X2/df = 2.250, GFI = 0.964, RMSEA = 0.050, RMR = 0.0402, CFI = 0.987. (c) The model fitting results for K: X2/df = 2.758, GFI = 0.933, RMSEA = 0.051, RMR = 0.0527, CFI = 0.956. The arrows represent the theorized flow of causality, with the numbers adjacent to them denoting standardized path coefficients. The thickness of the arrows corresponds to the intensity of the interactions. Red arrows signify positive correlations, blue arrows denote negative correlations, and solid lines represent significant associations (p < 0.05), whereas dashed lines indicate nonsignificant associations (p > 0.05). The values labeled in the figure represent the path coefficients (r). The terms AFS-AR, TFAR–TR, TFTR–T, and TFT–N refer to the nutrient translocation factors from soil to roots, from absorptive to transporting roots, from transporting roots to twigs, and from transporting twigs to needles, respectively; LRE refers to needles’ resorption efficiency.
Forests 16 00928 g006
Table 1. Analysis of the nutrient translocation factor from soil to absorbing roots (AFS-AR) under N or/and P addition.
Year201820192020
AFS-AR-NCK2.79 ± 0.10 Cb3.45 ± 0.06 Bb5.55 ± 0.07 Ad
N3.42 ± 0.01 Ba3.52 ± 0.03 Bab6.65 ± 0.07 Ab
P1.00 ± 0.00 Cc3.60 ± 0.01 Bab7.23 ± 0.07 Aa
NP2.72 ± 0.02 Cb3.50 ± 0.02 Bab6.25 ± 0.00 Ac
AFS-AR-PCK3.43 ± 0.90 Aa3.13 ± 0.01 Ab3.53 ± 0.00 Ac
N1.51 ± 0.00 Cb2.05 ± 0.03 Bd2.19 ± 0.00 Ad
P3.02 ± 0.01 Cab4.32 ± 0.01 Bab4.66 ± 0.01 Aa
NP1.98 ± 0.01 Cab2.99 ± 0.01 Bc3.56 ± 0.01 Ab
AFS-AR-KCK0.41 ± 0.01 Bb0.23 ± 0.01 Cc0.55 ± 0.00 Ab
N0.55 ± 0.00 Ca0.56 ± 0.00 Bab0.83 ± 0.00 Aa
P0.34 ± 0.01 Bc0.50 ± 0.01 Ab0.50 ± 0.00 Ac
NP0.34 ± 0.01 Cc0.55 ± 0.01 Aab0.45 ± 0.01 Bd
The differences among N or/and P addition are statistically significant (p < 0.05), indicated by lowercase letters within the same year. indicated by capital letters within the same treatment. All data are expressed as mean ± SE (n = 3). The same is below.
Table 2. Analysis of the nutrient translocation factor from absorbing roots to transportive roots (TFAR-TR) under N or/and P addition.
Year201820192020
TFAR-TR-NCK0.90 ± 0.00 Ca1.11 ± 0.00 Ba1.41 ± 0.00 Aa
N0.66 ± 0.03 Cc0.80 ± 0.00 Bd1.12 ± 0.00 Ac
P0.85 ± 0.00 Ca1.07 ± 0.01 Bb1.21 ± 0.01 Ab
NP0.73 ± 0.03 Bb0.91 ± 0.01 Ac0.64 ± 0.01 Cd
TFAR-TR-PCK0.83 ± 0.02 Cb1.02 ± 0.00 Bb1.20 ± 0.00 Ac
N1.10 ± 0.00 Ca1.22 ± 0.00 Ba1.50 ± 0.00 Aa
P0.64 ± 0.02 Cd0.74 ± 0.01 Bd0.92 ± 0.01 Ad
NP0.78 ± 0.00 Cc0.98 ± 0.00 Bc1.23 ± 0.00 Ab
TFAR-TR-KCK1.04 ± 0.01 Ca1.50 ± 0.00 Ba1.60 ± 0.00 Aa
N0.91 ± 0.01 Cd1.42 ± 0.02 Ab1.30 ± 0.01 Bd
P0.98 ± 0.00 Bb1.44 ± 0.01 Ab1.45 ± 0.02 Ac
NP0.94 ± 0.01 Cc1.44 ± 0.00 Bb1.50 ± 0.00 Ab
Table 3. Analysis of the nutrient translocation factor from transportive roots to twigs (TFTR-T) under N or/and P addition.
Year201820192020
TFTR-T-NCK1.46 ± 0.06 Aa1.15 ± 0.01 Ba0.47 ± 0.00 Cb
N1.30 ± 0.01 Ab1.04 ± 0.04 Bb0.39 ± 0.03 Cc
P1.36 ± 0.01 Ab1.18 ± 0.01 Ba0.46 ± 0.00 Cb
NP1.50 ± 0.01 Aa1.15 ± 0.01 Ba1.12 ± 0.01 Ca
TFTR-T-PCK1.74 ± 0.03 Bc2.44 ± 0.02 Aa0.82 ± 0.01 Cb
N2.86 ± 0.06 Aa2.42 ± 0.27 Aa1.03 ± 0.01 Ba
P0.74 ± 0.01 Bd1.64 ± 0.06 Ab0.70 ± 0.02 Bc
NP2.01 ± 0.11 Ab2.19 ± 0.07 Aa1.05 ± 0.01 Ba
TFTR-T-KCK1.26 ± 0.06 Aa0.95 ± 0.01 Ba0.92 ± 0.01 Ba
N1.10 ± 0.01 Ab0.84 ± 0.04 Bb0.55 ± 0.00 Cb
P1.16 ± 0.01 Ab0.98 ± 0.01 Ba0.56 ± 0.00 Cb
NP1.30 ± 0.01 Aa0.95 ± 0.01 Ba0.92 ± 0.01 Ca
Table 4. Analysis of the nutrient translocation factor from twigs to needles (TFT-N) under N or/and P addition.
Year201820192020
TFT-N-NCK0.90 ± 0.00 Aab0.87 ± 0.00 Ba0.68 ± 0.00 Cb
N0.88 ± 0.00 Bbc0.86 ± 0.00 Bb2.75 ± 0.18 Aa
P0.89 ± 0.00 Ab0.87 ± 0.00 Ba0.62 ± 0.00 Cb
NP0.90 ± 0.00 Aa0.87 ± 0.00 Ba0.87 ± 0.00 Bb
TFT-N-PCK0.91 ± 0.00 Bc0.94 ± 0.00 Aa0.82 ± 0.00 Cb
N0.95 ± 0.00 Aa0.94 ± 0.01 Ba0.85 ± 0.00 Ba
P0.80 ± 0.00 Bd0.91 ± 0.00 Ab0.79 ± 0.01 Bc
NP0.92 ± 0.00 Ab0.93 ± 0.00 Aa0.86 ± 0.00 Ba
TFT-N-KCK0.88 ± 0.01 Bab0.84 ± 0.00 Ca0.96 ± 0.02 Aab
N0.86 ± 0.00 Bc0.82 ± 0.01 Bb1.40 ± 0.02 Aa
P0.87 ± 0.00 Abc0.85 ± 0.00 Aa1.22 ± 0.26 Aab
NP0.88 ± 0.00 Aa0.84 ± 0.00 Ba0.84 ± 0.00 Bb
Table 5. Analysis of the needles resorption efficiency for N (NRE), P (PRE), and K (KRE) under N or/and P addition.
Year201820192020
NRE (%)CK57.37 ± 1.22 Ab52.80 ± 0.26 Bb56.37 ± 0.13 Aa
N49.13 ± 0.27 Ad48.17 ± 0.38 Ac48.07 ± 1.11 Ac
P61.27 ± 0.28 Aa56.77 ± 0.52 Ca58.53 ± 0.64 Ba
NP56.67 ± 0.47 Ac53.07 ± 0.09 Bb52.90 ± 1.59 Bb
PRE (%)CK61.70 ± 0.87 Aa60.93 ± 0.30 Aab62.40 ± 0.06 Aa
N61.73 ± 0.28 Aa62.40 ± 0.67 Aa62.10 ± 0.42 Aa
P52.27 ± 0.24 Ab51.20 ± 0.87 Ac51.17 ± 0.55 Ab
NP61.07 ± 0.3 ABa60.27 ± 0.39 Bb61.67 ± 0.24 Aa
KRE (%)CK41.43 ± 0.79 Aa41.67 ± 0.54 Aab42.73 ± 0.50 Aa
N34.83 ± 0.28 Ac32.63 ± 0.47 Bc32.03 ± 0.30 Bd
P41.40 ± 0.20 Aa40.83 ± 0.09 Ab37.47 ± 0.20 Bc
NP36.7 ± 0.36 Cb42.4 ± 0.26 Aa40.30 ± 0.36 Bb
Disclaimer/Publisher’s Note: The statements, opinions and data contained in all publications are solely those of the individual author(s) and contributor(s) and not of MDPI and/or the editor(s). MDPI and/or the editor(s) disclaim responsibility for any injury to people or property resulting from any ideas, methods, instructions or products referred to in the content.

