Article

Contrasting Drought Sensitivity in Silver Fir and Scots Pine Revealed Through Growth and Wood Density Data

by
Juan Pablo Crespo-Antia
1,2,
Antonio Gazol
1,
Estér González de Andrés
1,
Cristina Valeriano
1,
Álvaro Rubio-Cuadrado
3,
Jan Altman
4,5,6,
Jiří Doležal
4,7,
Juan Carlos Linares
2 and
J. Julio Camarero
1,*
1
Instituto Pirenaico de Ecología (IPE-CSIC), 50059 Zaragoza, Spain
2
Departamento de Sistemas Físicos, Químicos y Naturales, Universidad Pablo de Olavide, 41013 Sevilla, Spain
3
Departamento de Sistemas y Recursos Naturales, Escuela Técnica Superior de Ingeniería de Montes, Forestal y del Medio Natural, Universidad Politécnica de Madrid, Ciudad Universitaria s/n, 28040 Madrid, Spain
4
Departamento of Functional Ecology, Institute of Botany, Czech Academy of Sciences, Zámek 1, 252 43 Průhonice, Czech Republic
5
Departamento of Geography, Institute of Ecology and Earth Sciences, University of Tartu, Vanemuise 46, 51003 Tartu, Estonia
6
Faculty of Forestry and Wood Sciences, Czech University of Life Sciences Prague, Kamýcká 129, 165 21 Prague 6-Suchdol, Czech Republic
7
Departamento of Botany, Faculty of Science, University of South Bohemia, Branisovska 1645/31a, 370 05 České Budejovice, Czech Republic
*
Author to whom correspondence should be addressed.
Forests 2025, 16(6), 921; https://doi.org/10.3390/f16060921
Submission received: 24 April 2025 / Revised: 27 May 2025 / Accepted: 29 May 2025 / Published: 30 May 2025
(This article belongs to the Section Forest Meteorology and Climate Change)

Abstract

Understanding species-specific drought responses is critical to predict forest resilience under climate change. We investigated how series of secondary growth, earlywood (EWD) and latewood (LWD) density of silver fir (Abies alba) and Scots pine (Pinus sylvestris) responded to climate variability from 1952 to 2020. We sampled three sites across a climatic gradient in the southwestern Pyrenees, obtaining density values from declining silver fir and from non-declining Scots pine individuals. We assessed climate–growth/density relationships and drought resilience indices to extreme drought events. Silver fir exhibited more conservative growth patterns and a negative relationship between EWD and water availability from prior winter to spring in drier sites, suggesting priority resource allocation to hydraulic safety. In contrast, Scots pine displayed declining growth trends and a similar response of EWD to spring water availability, suggesting a drought-avoidance strategy. Resilience analysis following major droughts (1986, 1998, 2005, and 2011) revealed contrasting patterns. In silver fir, drought resilience was more dependent on resistance (Rt) in wet sites and recovery (Rc) in dry ones, while EWD resilience was consistently explained by Rt across populations. This study, though based on three sites with limited wood density data, underscores the vulnerability of silver fir near its southern distribution limit and the importance of integrating growth and xylem traits to capture species- and site-specific responses to drought in mountain forests.

1. Introduction

Forests are increasingly threatened by climate change, particularly by more frequent and intense droughts, with an enhanced incidence in transitional areas such as temperate-to-Mediterranean forests [1]. In these ecotones, forest dieback and elevated mortality episodes have been widely reported [2,3]. Two main physiological hypotheses have been proposed to explain forest mortality under drought: carbon starvation and hydraulic failure [4]. Although these two mechanisms often act together, hydraulic failure appears to be the most supported mechanism among conifers [5,6]. Understanding species-specific growth responses and how they depend on hydraulic traits is essential to understanding forest vulnerability in a warmer and drier climate.
In conifers, wood density is closely related to xylem anatomical traits such as tracheid lumen diameter and cell-wall thickness, which influence hydraulic conductivity and vulnerability to embolism [7,8]. These anatomical traits underline the importance of evaluating inter-annual wood density fluctuations as proxies of hydraulic performance and indicators of drought sensitivity. For instance, dry growing season conditions have increased earlywood density, reflecting a reduction in lumen size and potential hydraulic conductivity [9]. Likewise, a decline in secondary growth has been identified as a reliable indicator of impending forest dieback and tree mortality [10,11]. Thus, analyzing wood density alongside growth metrics offers a functional perspective on tree response to environmental stress and for predicting drought-induced mortality [12].
Low earlywood density is associated with wider tracheids and thinner cell walls, enabling high water transport efficiency and supporting rapid growth, but it increases the risk of hydraulic failure under drought [8]. In contrast, high wood density implies narrower conduits and thicker walls, enhancing hydraulic safety and drought tolerance at the expense of growth rate and carbon investment [7,13]. Additionally, it has been found that minimum wood density, tightly related to earlywood density, in European mountain conifers increases under drought conditions during the early growing season, reflecting decreased hydraulic conductivity [14]. Thus, analyzing inter-annual wood density variability may help test the hydraulic failure hypothesis in forests that show a decline in growth. Furthermore, wood density must be compared with growth data, given the high variability in the responses to drought observed in some conifers such as fir species [15].
Silver fir (Abies alba Mill.) and Scots pine (Pinus sylvestris L.) are two major, widespread, economically and ecologically important conifers in European temperate and mountain forests. Yet, they exhibit contrasting physiological strategies and responses to drought [16,17,18]. Early warning signals of drought-induced growth decline mortality appear to be species-specific, with silver fir increasing growth autocorrelation and variability before tree death, while Scots pine did not show such clear signals [19]. These findings highlight that although both species may coexist and have been widely studied, integrative approaches are essential to drawing more robust conclusions about their resilience and adaptive capacity under increasing drought stress.
To our knowledge, despite their ecological importance, few studies have jointly assessed growth sensitivity, wood density, and resilience to extreme drought events in these species across sites subjected to different climate conditions. This is particularly relevant in the western Spanish Pyrenees, where both species coexist under increasingly warmer and drier conditions, and silver fir forms its southwestern distribution limit in Europe. In this study, we analyze tree-ring width and earlywood and latewood density variability across three Pyrenean Forest sites—two sites dominated by silver fir and one site where silver fir and Scots pine coexist—to evaluate (i) the relationship of secondary growth with earlywood (EWD) and latewood density (LWD; see all abbreviations in Table 1), (ii) the responses of detrended series of growth and density indexes to climate, and (iii) the impact of drought on growth and density indices by calculating resilience indices [20]. By integrating these complementary traits, we aim to understand whether differences in growth responses and wood properties can help explain the higher decline observed in some silver fir populations as compared to Scots pine [18,19].

2. Materials and Methods
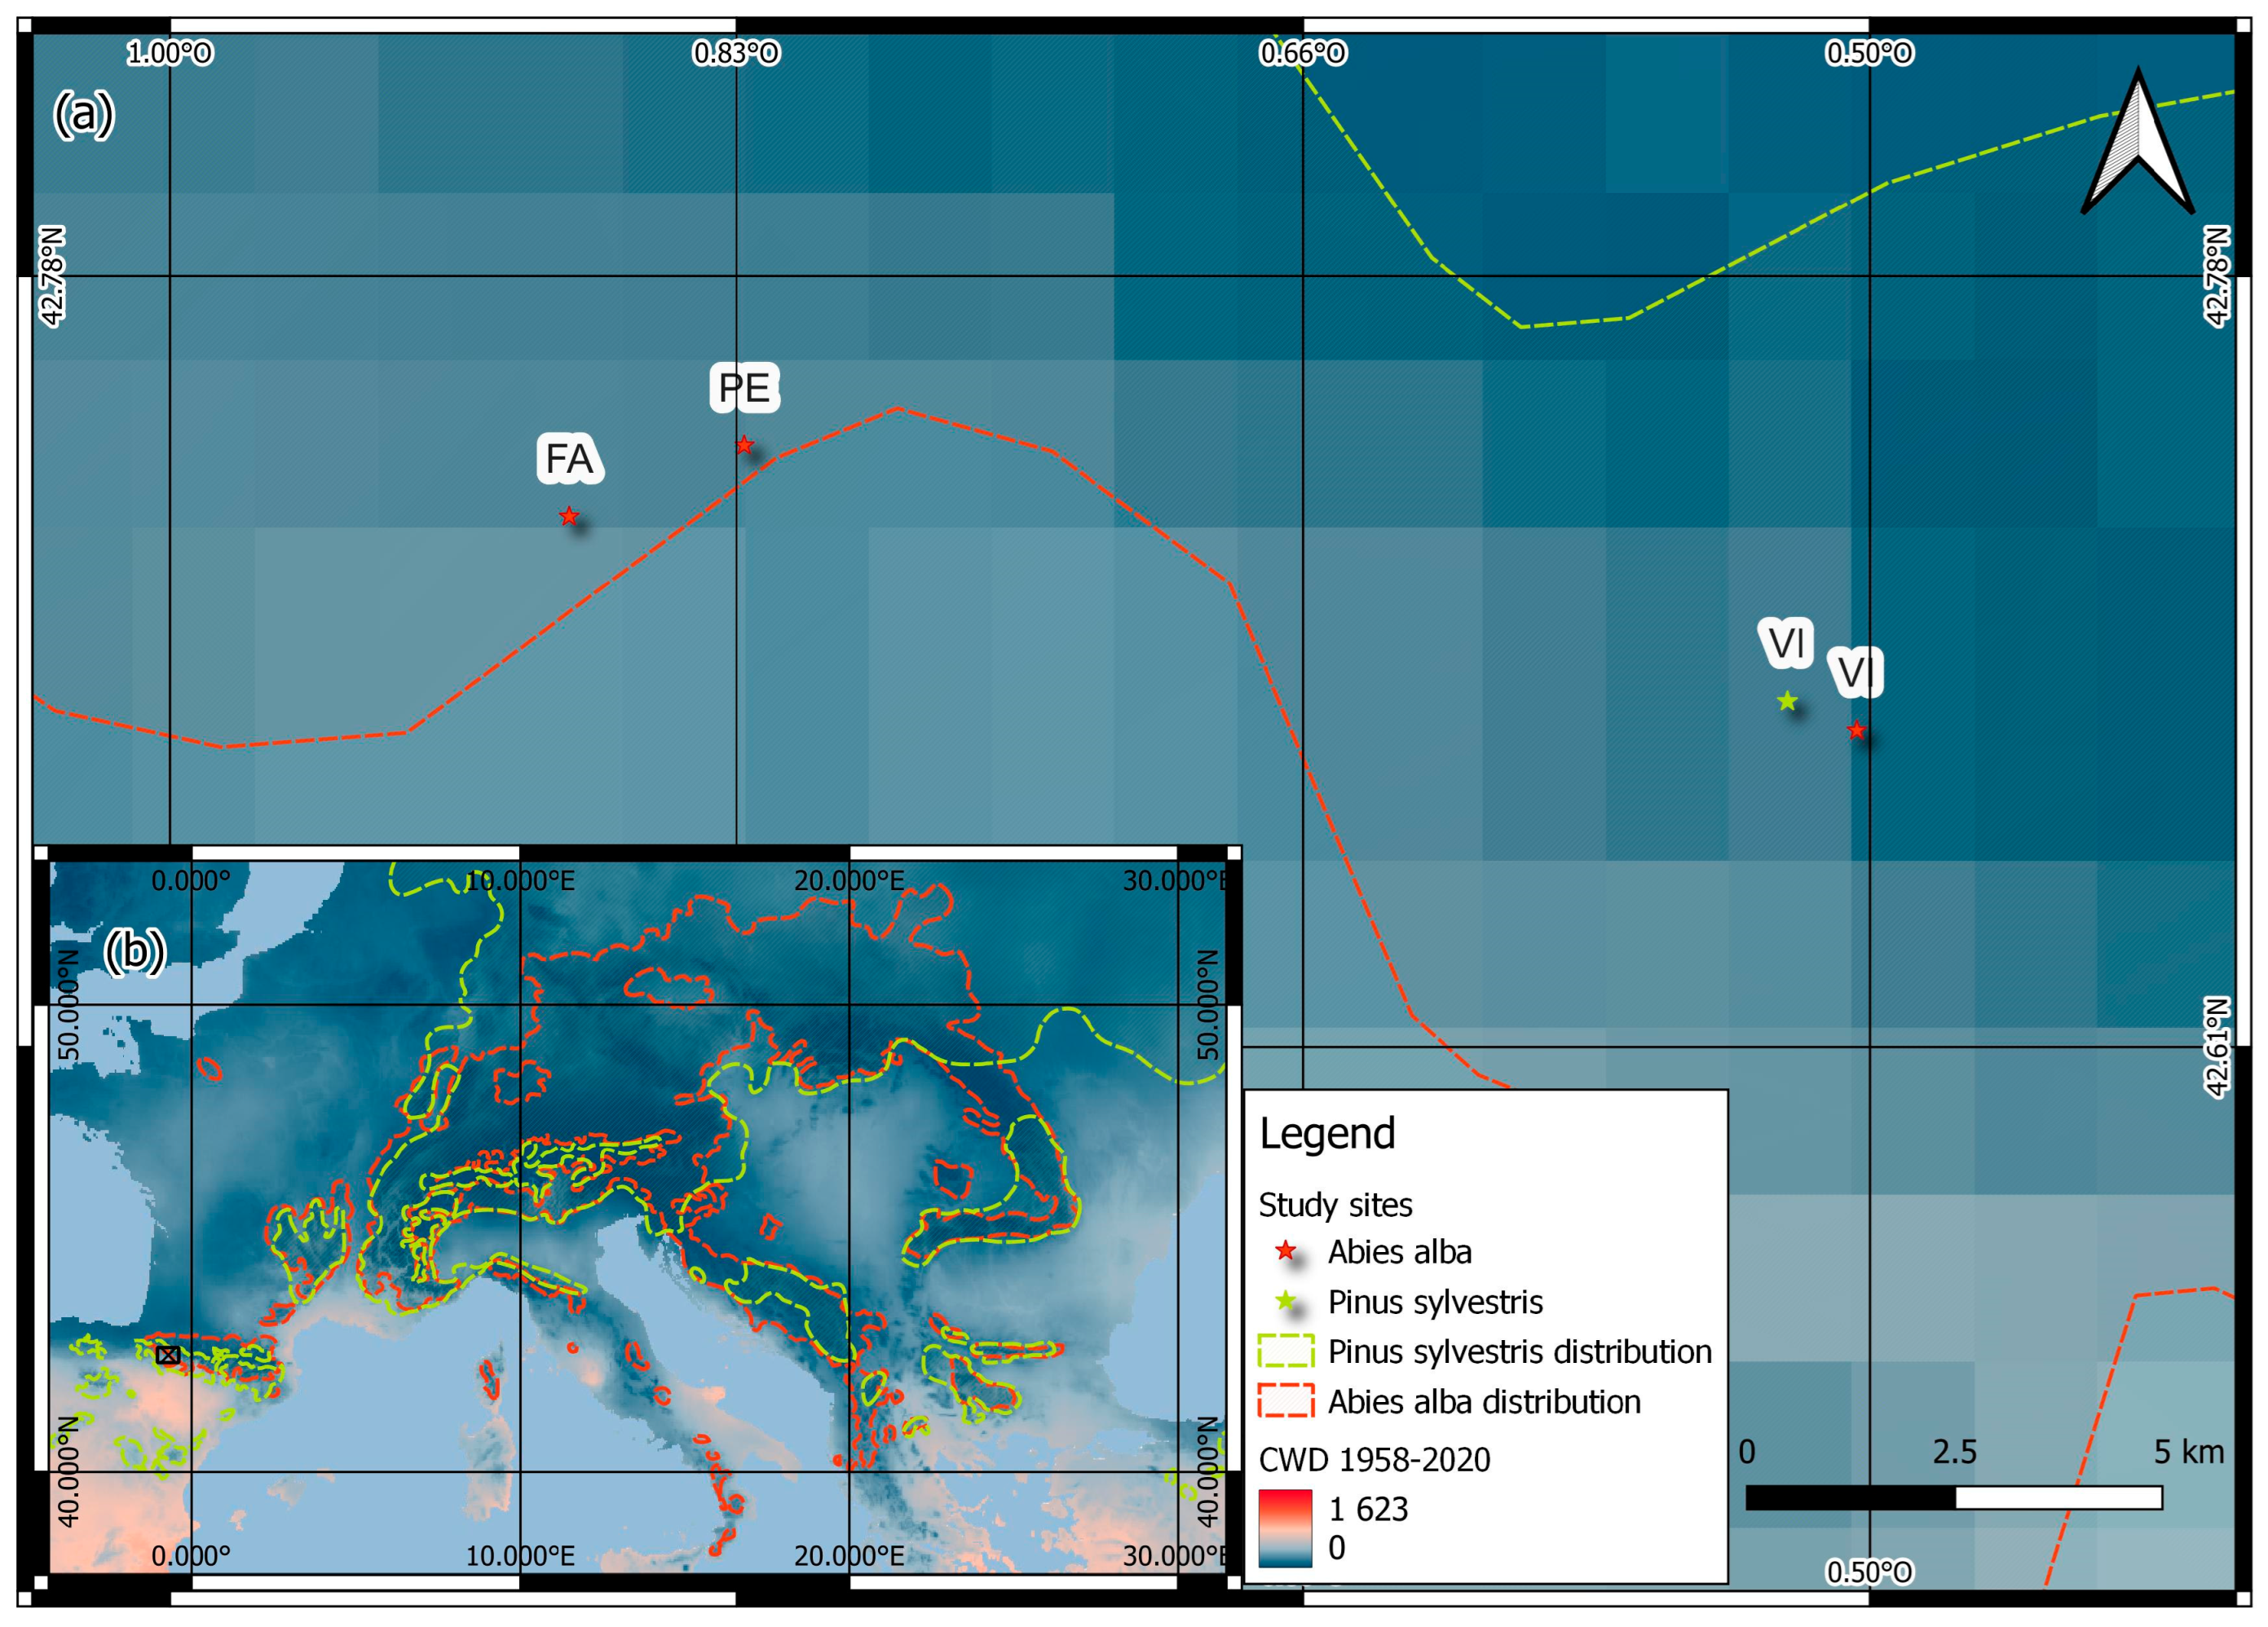
2.1. Study Sites

The study was conducted in montane, mixed to pure silver fir and Scots pine stands from the western Spanish Pyrenees (Figure 1). The mean annual temperature of the study sites ranges from 7 °C at the coldest site (Villanúa, hereafter site VI) to 10 °C at the warmer sites (Fago, hereafter site FA; Paco Ezpela, hereafter site PE), while annual precipitation varies from 1248 to 1580 mm (Table 2). Soils are basic. A list of abbreviations is provided in Table 1 to help readers.
The sampled stands are mixed silver fir forests with the presence of Scots pine (Pinus sylvestris L.) or European beech (Fagus sylvatica L.). European box (Buxus sempervirens) dominates the understory. Since the 1980s, ongoing dieback and mortality affecting silver fir have been observed in the three sites [18]. Furthermore, mistletoe (Viscum album L. ssp. abietis) has been shown to negatively impact the growth of silver fir in site VI [21]. The study sites have experienced recent thinning related to dieback in the 1980s and 1990s, but we avoided these areas with abundant stumps for sampling.
Figure 1. (a) Location of the studied silver fir and Scots pine stands (FA, PE, and VI) in the western Spanish Pyrenees and (b) map of silver fir (red dashed line polygon) and Scots pine (green dashed line polygon) distribution ranges in western Europe [22] highlighting the study region in the Pyrenees (black box). The color scale represents Climatic Water Deficit (CWD), with blue indicating higher moisture availability and red indicating moisture deficit. The CWD was gained for the period 1984–2023 using TerraClimate database [23].
Forests 16 00921 g001

2.2. Climatological Data

We obtained long-term climatological daily records for maximum temperature (Tmax), minimum temperature (Tmin), and precipitation (P) from the Spanish Meteorological Agency database (Agencia Estatal de Meteorología, AEMET) with a 5 km spatial resolution (https://www.aemet.es/es/serviciosclimaticos/cambio_climat/datos_diarios?w=2, accessed on 31 March 2025). From these data, we calculated the monthly and annual values of P, Tmax, Tmin, and mean temperature (Tmean). Potential Evapotranspiration (PET) was obtained from the ~4 km gridded TerraClimate database [23] to assess the climate water balance (P-PET) as a surrogate of drought.

2.3. Field Sampling and Dendrochronological Methods

The sample collection took place in late autumn 2000 and 2020–2024. Sampling followed standard dendrochronological methods [24]. In each site, a 100 m long and 10 m wide transect was sampled across a representative zone of the stand. Using the point-centered quarter method [25], four trees were selected every 10 m along the transect and their diameter at 1.3 m was measured. In each site, 15 to 25 mature trees were selected for taking cores.
Wood cores were taken at a height of 1.3 m (diameter at breast height; DBH). Two samples were collected per tree, using a 5 mm Pressler increment borer. In addition, 10 mm cores were taken from 20 trees of each species and site in late 2024 for density analyses selecting 10 non-declining and 10 declining/recently dead trees based on visual crown defoliation. Non-declining trees exhibited less than 50% crown defoliation, whereas declining or recently dead trees showed 50% or greater defoliation (including completely defoliated crowns). The cores were air-dried and the 5 mm cores were glued to wooden mounts and sanded with progressively finer sandpaper until the ring boundaries became distinctly visible. Ring width measurements were conducted on scanned images at a resolution of 1200 dpi (EPSON XL 10000 scanner (Epson, Suwa, Japan) with an accuracy of 0.001 mm, utilizing the CooRecorder-CDendro software [26]. Visual cross-dating was then applied to all samples, and this dating was further validated using COFECHA software [27].
The ring width series were used to estimate age at 1.3 m (based on counting of rings in cores with pith or with innermost curved rings after correcting for the missing rings) and basal area increment (BAI) following [28].
Each tree-ring width series was detrended to calculate climate-growth relationships by fitting a cubic regression spline with a 50% frequency response cutoff at 30 years. An autoregressive model was then applied to each detrended series to remove the first-order autocorrelation, building residual, pre-whitened ring width index chronologies. All the statistics detrending and chronology computation of tree-ring series were performed using the package dplR [29] with R (version 4.1.1.) [30].
For each tree sampled in late 2024, we obtained EWD and LWD from the 10 mm cores. Cores with well-defined rings were transversely cut into 1.2 mm strips using the DENDROCUT twin-bladed saw (WALESCH Electronic GmbH, Effretikon, Switzerland; https://www.walesch.ch). Densitometric scans were performed using the QTRS-01X Data Analyzer and Scanner (Qmos, Knoxville, TN, USA; http://www.qms-density.com). Although density cores were collected from both species and health classes, the demanding processing protocol and fragility of deadwood meant that final EWD and LWD values were only successfully obtained for dead silver fir and living Scots pine, which should be considered when interpreting patterns in wood density and resilience. Subsequently, EWD and LWD series were detrended following the same TRW detrending methodology explained above, i.e., fitting a cubic regression spline 50% frequency and autoregressive models (pre-whitening) in dplR, with the spline window cutoff set to two-thirds of each series length, thus adapting the detrending to the shorter density chronologies. However, density indices were calculated by division instead of subtraction to stabilize the variance and maintain consistency with TRWi series.

2.4. Resilience, Resistance, and Recovery Indices

To assess tree response to drought, we calculated the resistance (Rt), recovery (Rc), and resilience (Rs) indices [20] for BAI, EWD, and LWD indices on selected drought years (1986, 1998, 2005, and 2011). Each index was calculated using a 3-year window before and after each drought year. Resistance (Rt) is the ratio between the value during the drought year and the mean of the three preceding years, reflecting the capacity of trees to maintain growth under stress. Recovery (Rc) is the ratio between the mean of the three years following the drought and the value during the drought year, indicating the extent of growth rebound. Resilience (Rs) is the ratio between the post- and pre-drought periods, capturing the ability to return to pre-drought growth levels. While growth resilience reflects the ability of trees to resume growth, interpreting resilience in terms of wood density requires a different lens. Maintaining or recovering EWD or LWD may indicate preserving or re-establishing wood anatomical integrity and hydraulic conductivity in the early and late growing seasons, respectively.

2.5. Statistical Analyses

Linear regressions were fitted to examine climatic trends between sites. For each climate variable, we fitted a model using the calendar year as an explanatory variable and considering the period of 1952–2021. The climatic variables considered were Tmax, Tmin, Tmean, and P. A Kruskal–Wallis test was performed for the climatic variables to assess overall differences between populations, followed by a Dunn’s test with Bonferroni correction for pairwise comparisons using the rstatix R package [31].
To assess differences in tree growth and wood density across sites and species, we applied both parametric (one-way ANOVA) and non-parametric (Kruskal–Wallis test) statistical tests, depending on normality assumptions, using the ggstatsplot R package [32]. Analyses were conducted for DBH, age, ring width, EWD, and LWD, considering mean values calculated for each tree. Post hoc pairwise comparisons were performed using Bonferroni-adjusted p-values to account for multiple testing. Ring width, EWD, and LWD were analyzed over the whole period of the chronologies and for the 1981–2000 and 2001–2020 time periods. Statistical significance was set at p < 0.05. In addition, Pearson correlation analyses were performed between site-species mean growth and EWD and LWD indices to evaluate the relationship between radial growth and wood density.
We performed climate–growth correlation analyses for each population, examining the relationship between the residual series of ring width, EWD, and LWD and climatic variables including Tmax, Tmin, and P-PET. The climate window of analysis encompasses the period from before to the current September. The analysis was conducted for the period of 1952–2020 using the treeclim R package [33].
To analyze resilience indices (Rt, Rc, and Rs), we first applied non-parametric tests with Bonferroni-adjusted post hoc comparisons to detect differences across site-species groups using the ggstatsplot package [32]. Then, we fitted simple linear regression models, with Rs as the response variable and Rc and Rt as predictors for each site species and variable (BAI, EWD, and LWD indices), to explore the strength and direction of these relationships. Significant slopes (p < 0.05) were used to identify whether resilience was primarily driven by the ability to resist (Rt) or to recover (Rc) after drought events. All statistical analyses were conducted with R (version 4.1.1.) [30].

3. Results

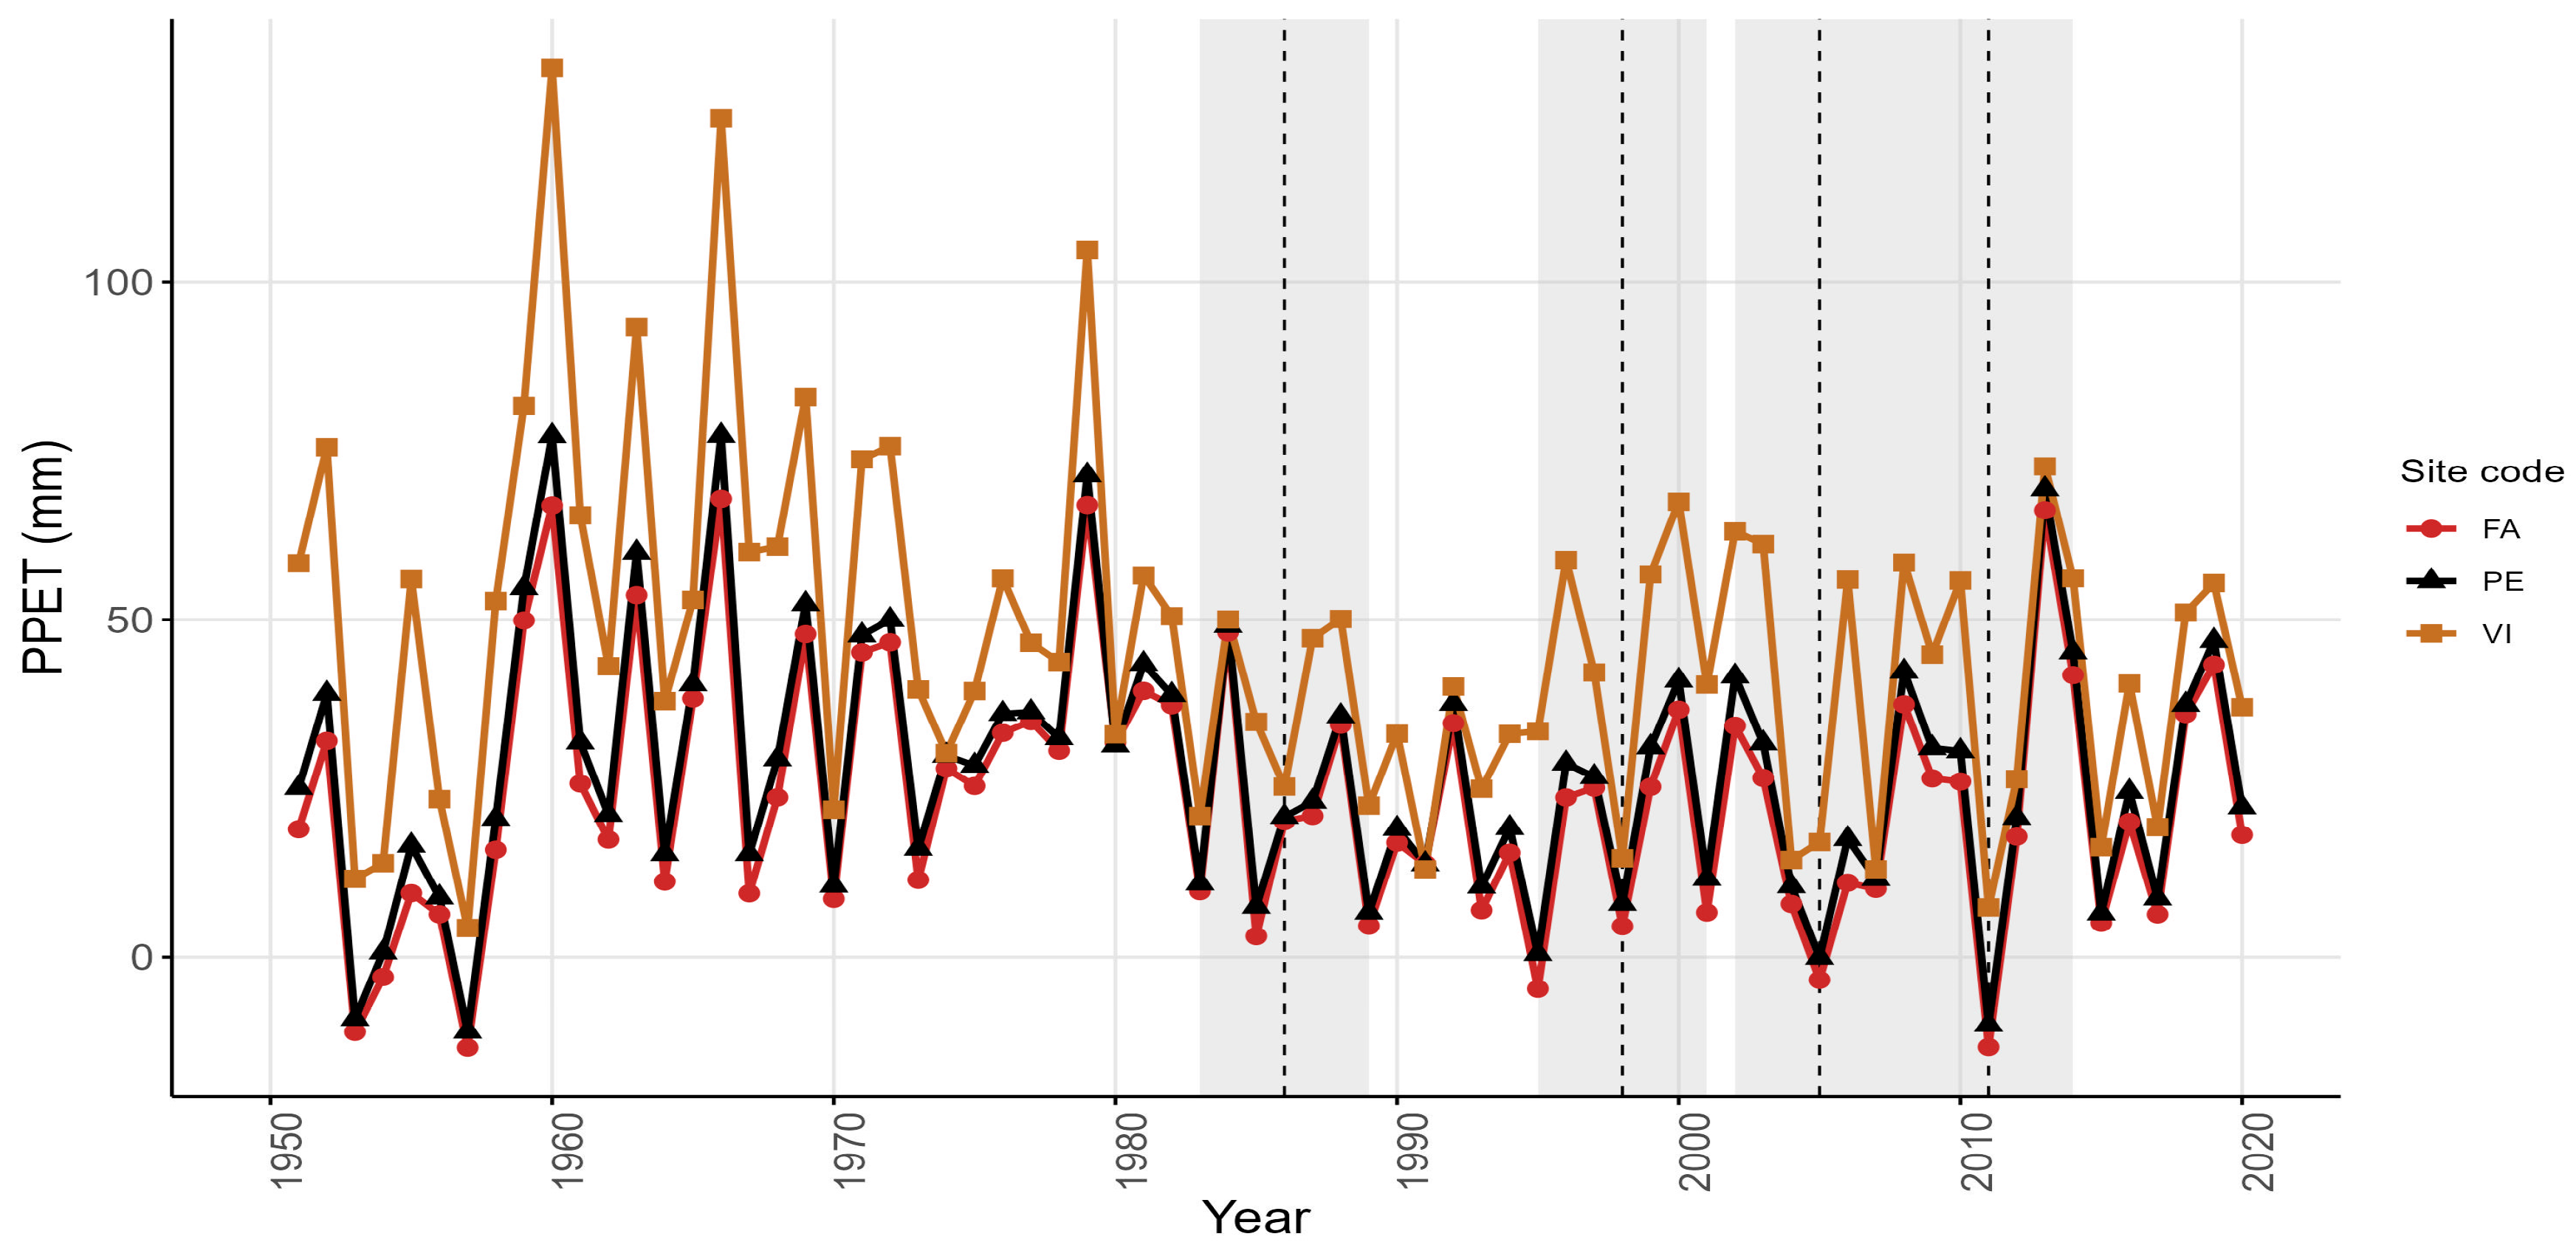
3.1. Climatic Trends and Drought Variability

Based on Kruskal–Wallis analyses (Table S1), we found that VI had lower temperatures and higher precipitation than the FA and PE sites. Additionally, a continuous increase in temperature was detected, whereas no trend in annual precipitation was identified (Figure S1). The water balance (P-PET, Figure 2) indicates several years of severe drought common to all study sites. We selected 1998, 2005, and 2011 as major droughts, and we added 1986 based on the significant negative impact on silver fir growth.

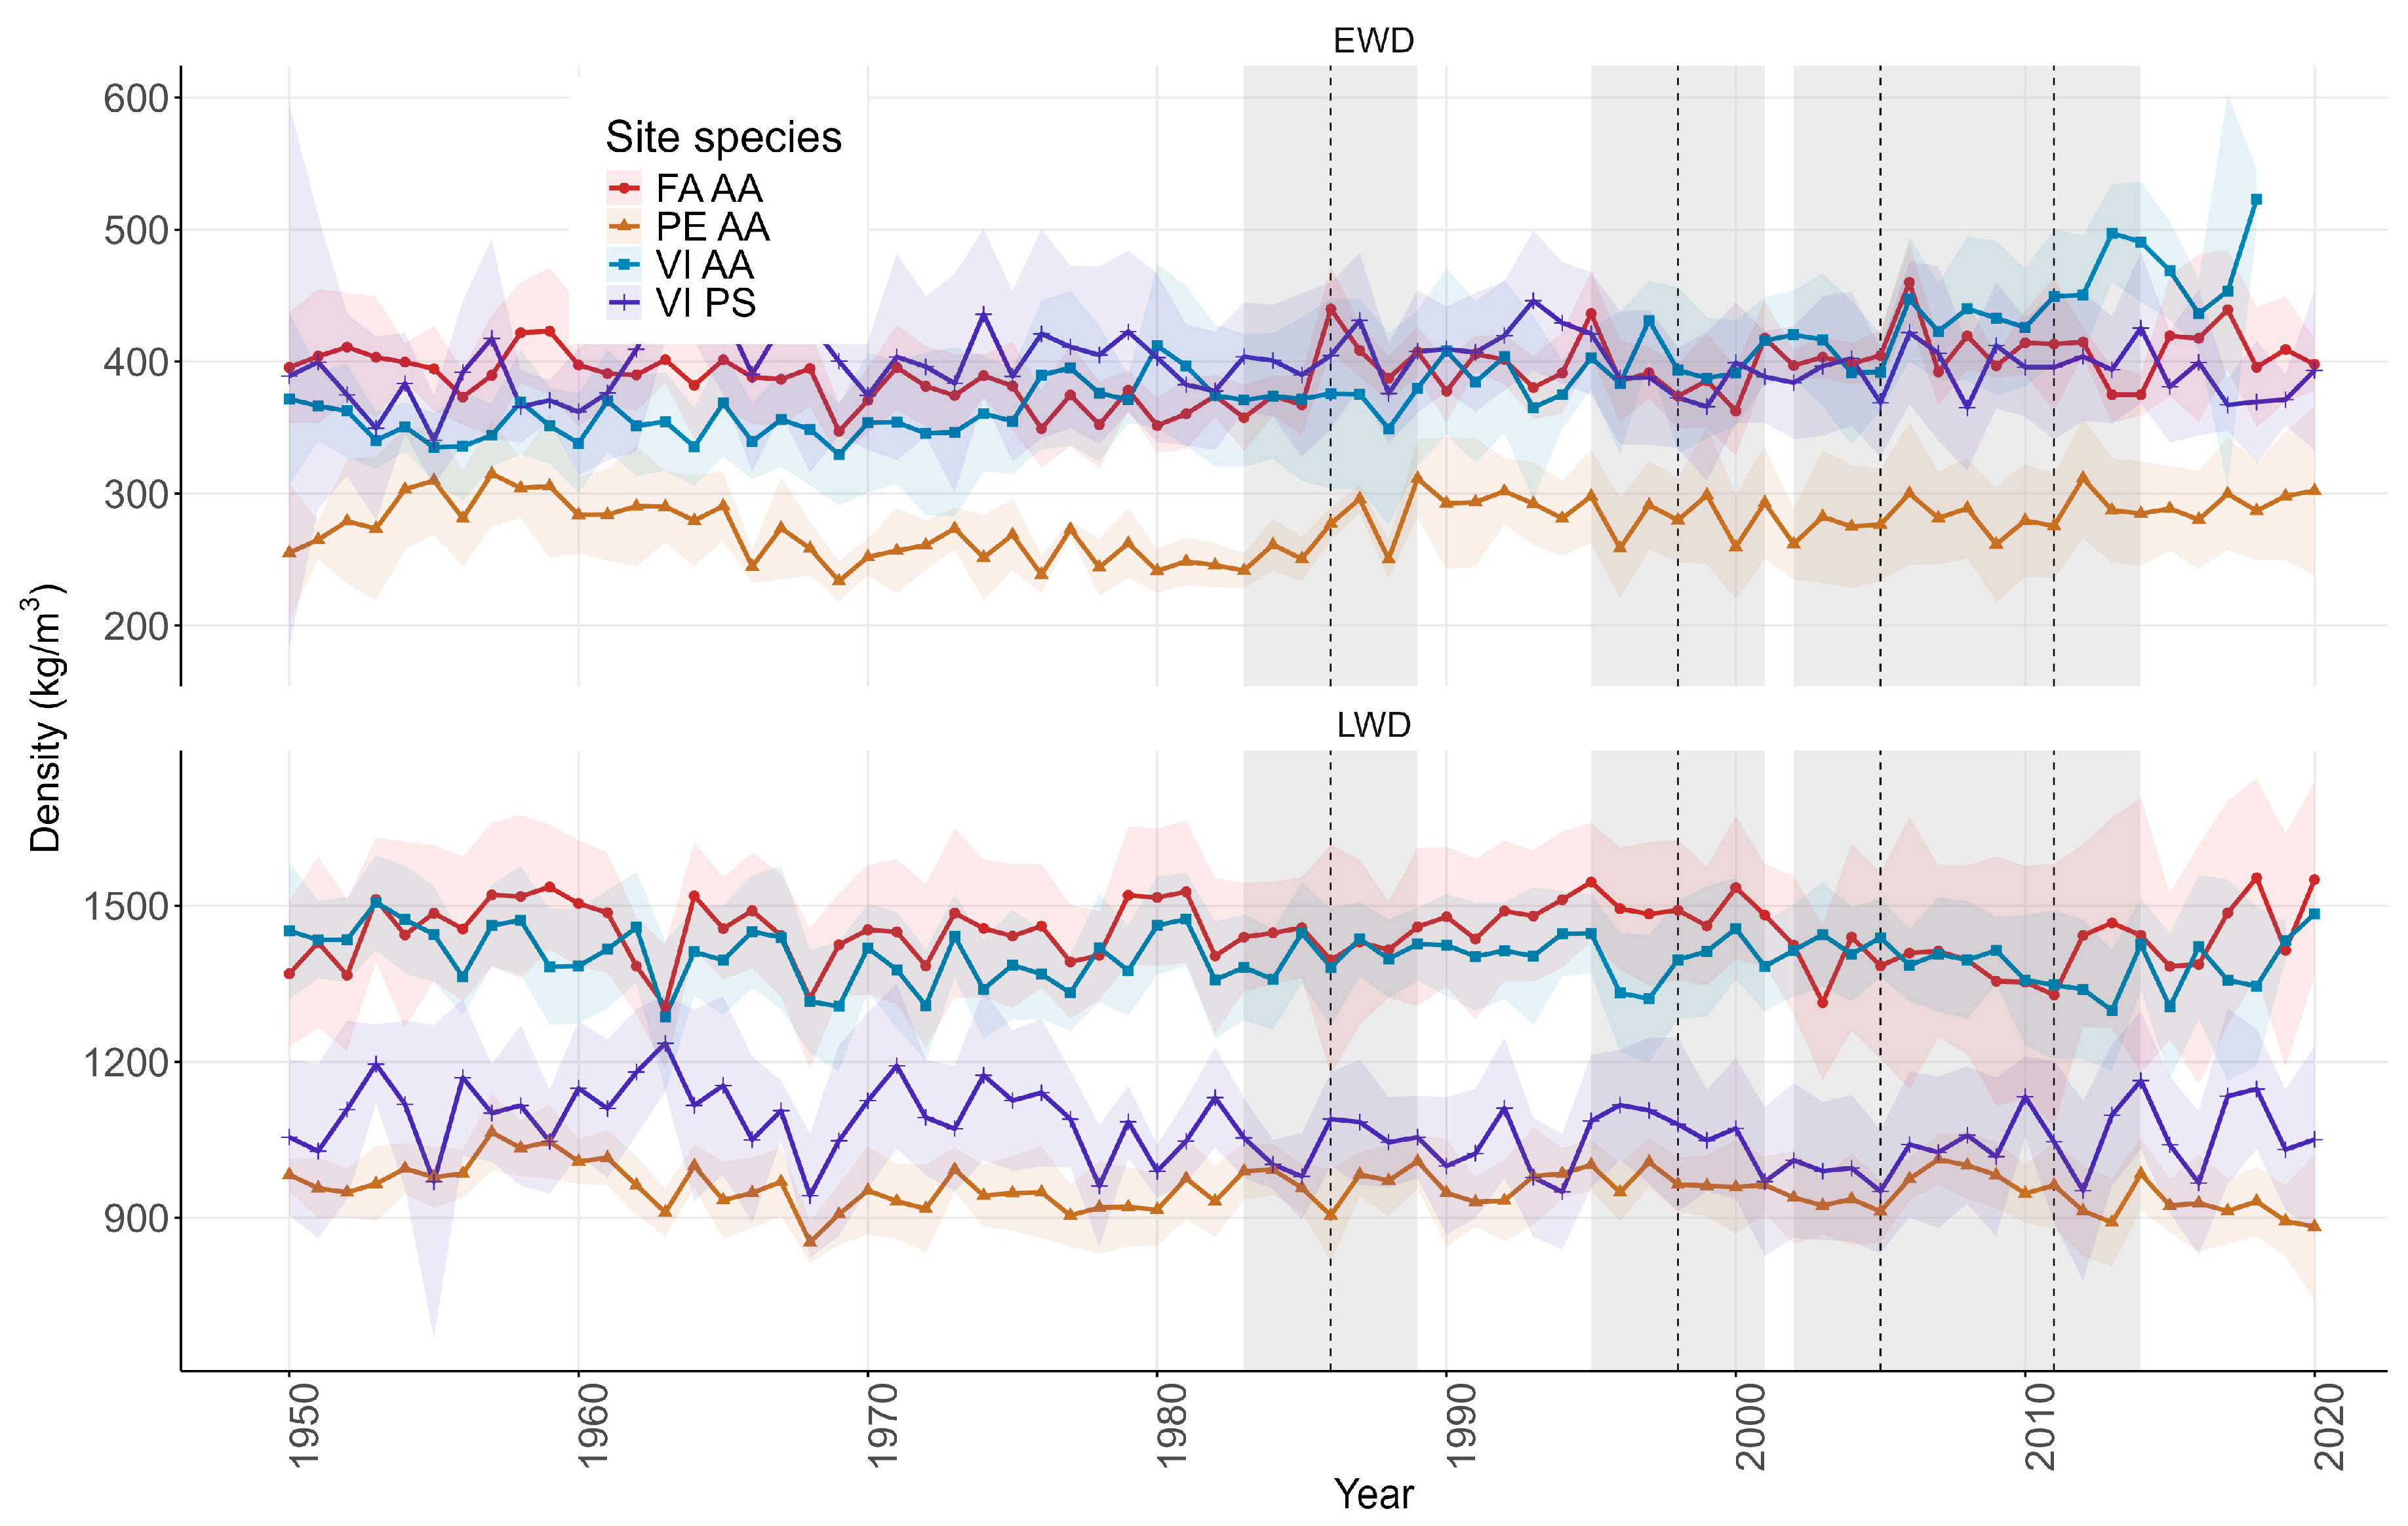
3.2. Growth and Wood Density Data

The site–species comparisons revealed noteworthy differences across variables (Table 3). Tree diameter varied significantly among sites, with FA and VI silver fir trees showing larger diameters than PE silver firs and Scots pine in site VI. Tree age also differed, with older individuals corresponding to silver fir in PE and VI trees, while younger trees were silver fir from the FA site and Scots pine in site VI.
Growth (BAI), EWD, and LWD showed substantial differences between site–species combinations and across periods (Table 3 and Table S2; Figures S2–S19). During 1981–2000, BAI was highest in the FA silver fir site, intermediate in VI Scots pines and firs, and lowest in PE silver firs (Figure 3; Table 3). In contrast, during 2001–2020, BAI remained constant in FA, increased in PE and VI silver firs, but slightly decreased in the case of VI Scots pines (Figure 3).
The EWD values were consistently lower in silver firs from PE (Table 3, Figure 4). For FA, PE, and VI silver firs, EWD showed a relative increase, while Scots pine in VI showed a decrease. In the case of LWD, silver firs from PE systematically presented the lowest LWD, FA and VI (silver firs) maintained the highest values, whereas and the Scots pines from VI showed mid-LWD values (Table 3). LWD showed a general but insignificant decrease in all site species (Figure 4).
Pearson correlation analyses between BAI and EWD indicated negative relationships for silver fir stands in FA (r = −0.30, p < 0.01) and PE (r = −0.26, p < 0.05) and a positive relationship in VI (r = 0.56, p < 0.01). Regarding LWD, negative correlations with BAI were found in silver fir PE (r = −0.40, p < 0.01) and VI (r = −0.42, p < 0.01) stands (Figure S20).

3.3. Growth and Wood Density Sensitivity to Climate

The climate–growth/density relationships showed different correlations among species and sites. Growth indices showed positive correlations with the P-PET from May to August in silver fir (FA and PE sites) and Scots pine (VI site). Correlations peaked for June–July P-PET at FA and for May–June P-PET at PE. Silver fir growth responded negatively to warm temperatures during early and late summer, and the stronger response, in absolute terms, was found for the previous September Tmax in PE. In contrast, Scots pine growth negatively responded to the elevated Tmax and Tmin of the previous November (Figure 5).
Regarding EWDi, it showed negative correlations with winter P-PET (silver fir: December at FA and February at PE; Scots pine, December–January at VI). The FA silver fir site also showed negative correlations in May and the previous September. The strongest effect was found in May P-PET at this site. We found positive responses of EWDi to warm temperatures in May (silver fir FA site), February–March (silver fir PE site), and March (silver fir VI site). Scots pine at VI showed negative EWDi responses to prior winter P-PET and to April Tmax (Figure 5).
Finally, the LWDi positively responded to winter Tmax in silver fir sites FA and PE. In the VI silver fir site, LWDi showed a positive correlation with winter–spring and late summer temperatures, but negative correlations with summer water balance. In this site LWDi correlations with Tmax peaked in August. However, Scots pine LWDi showed positive correlations with June-to-August water balance and negative correlations with June Tmax.

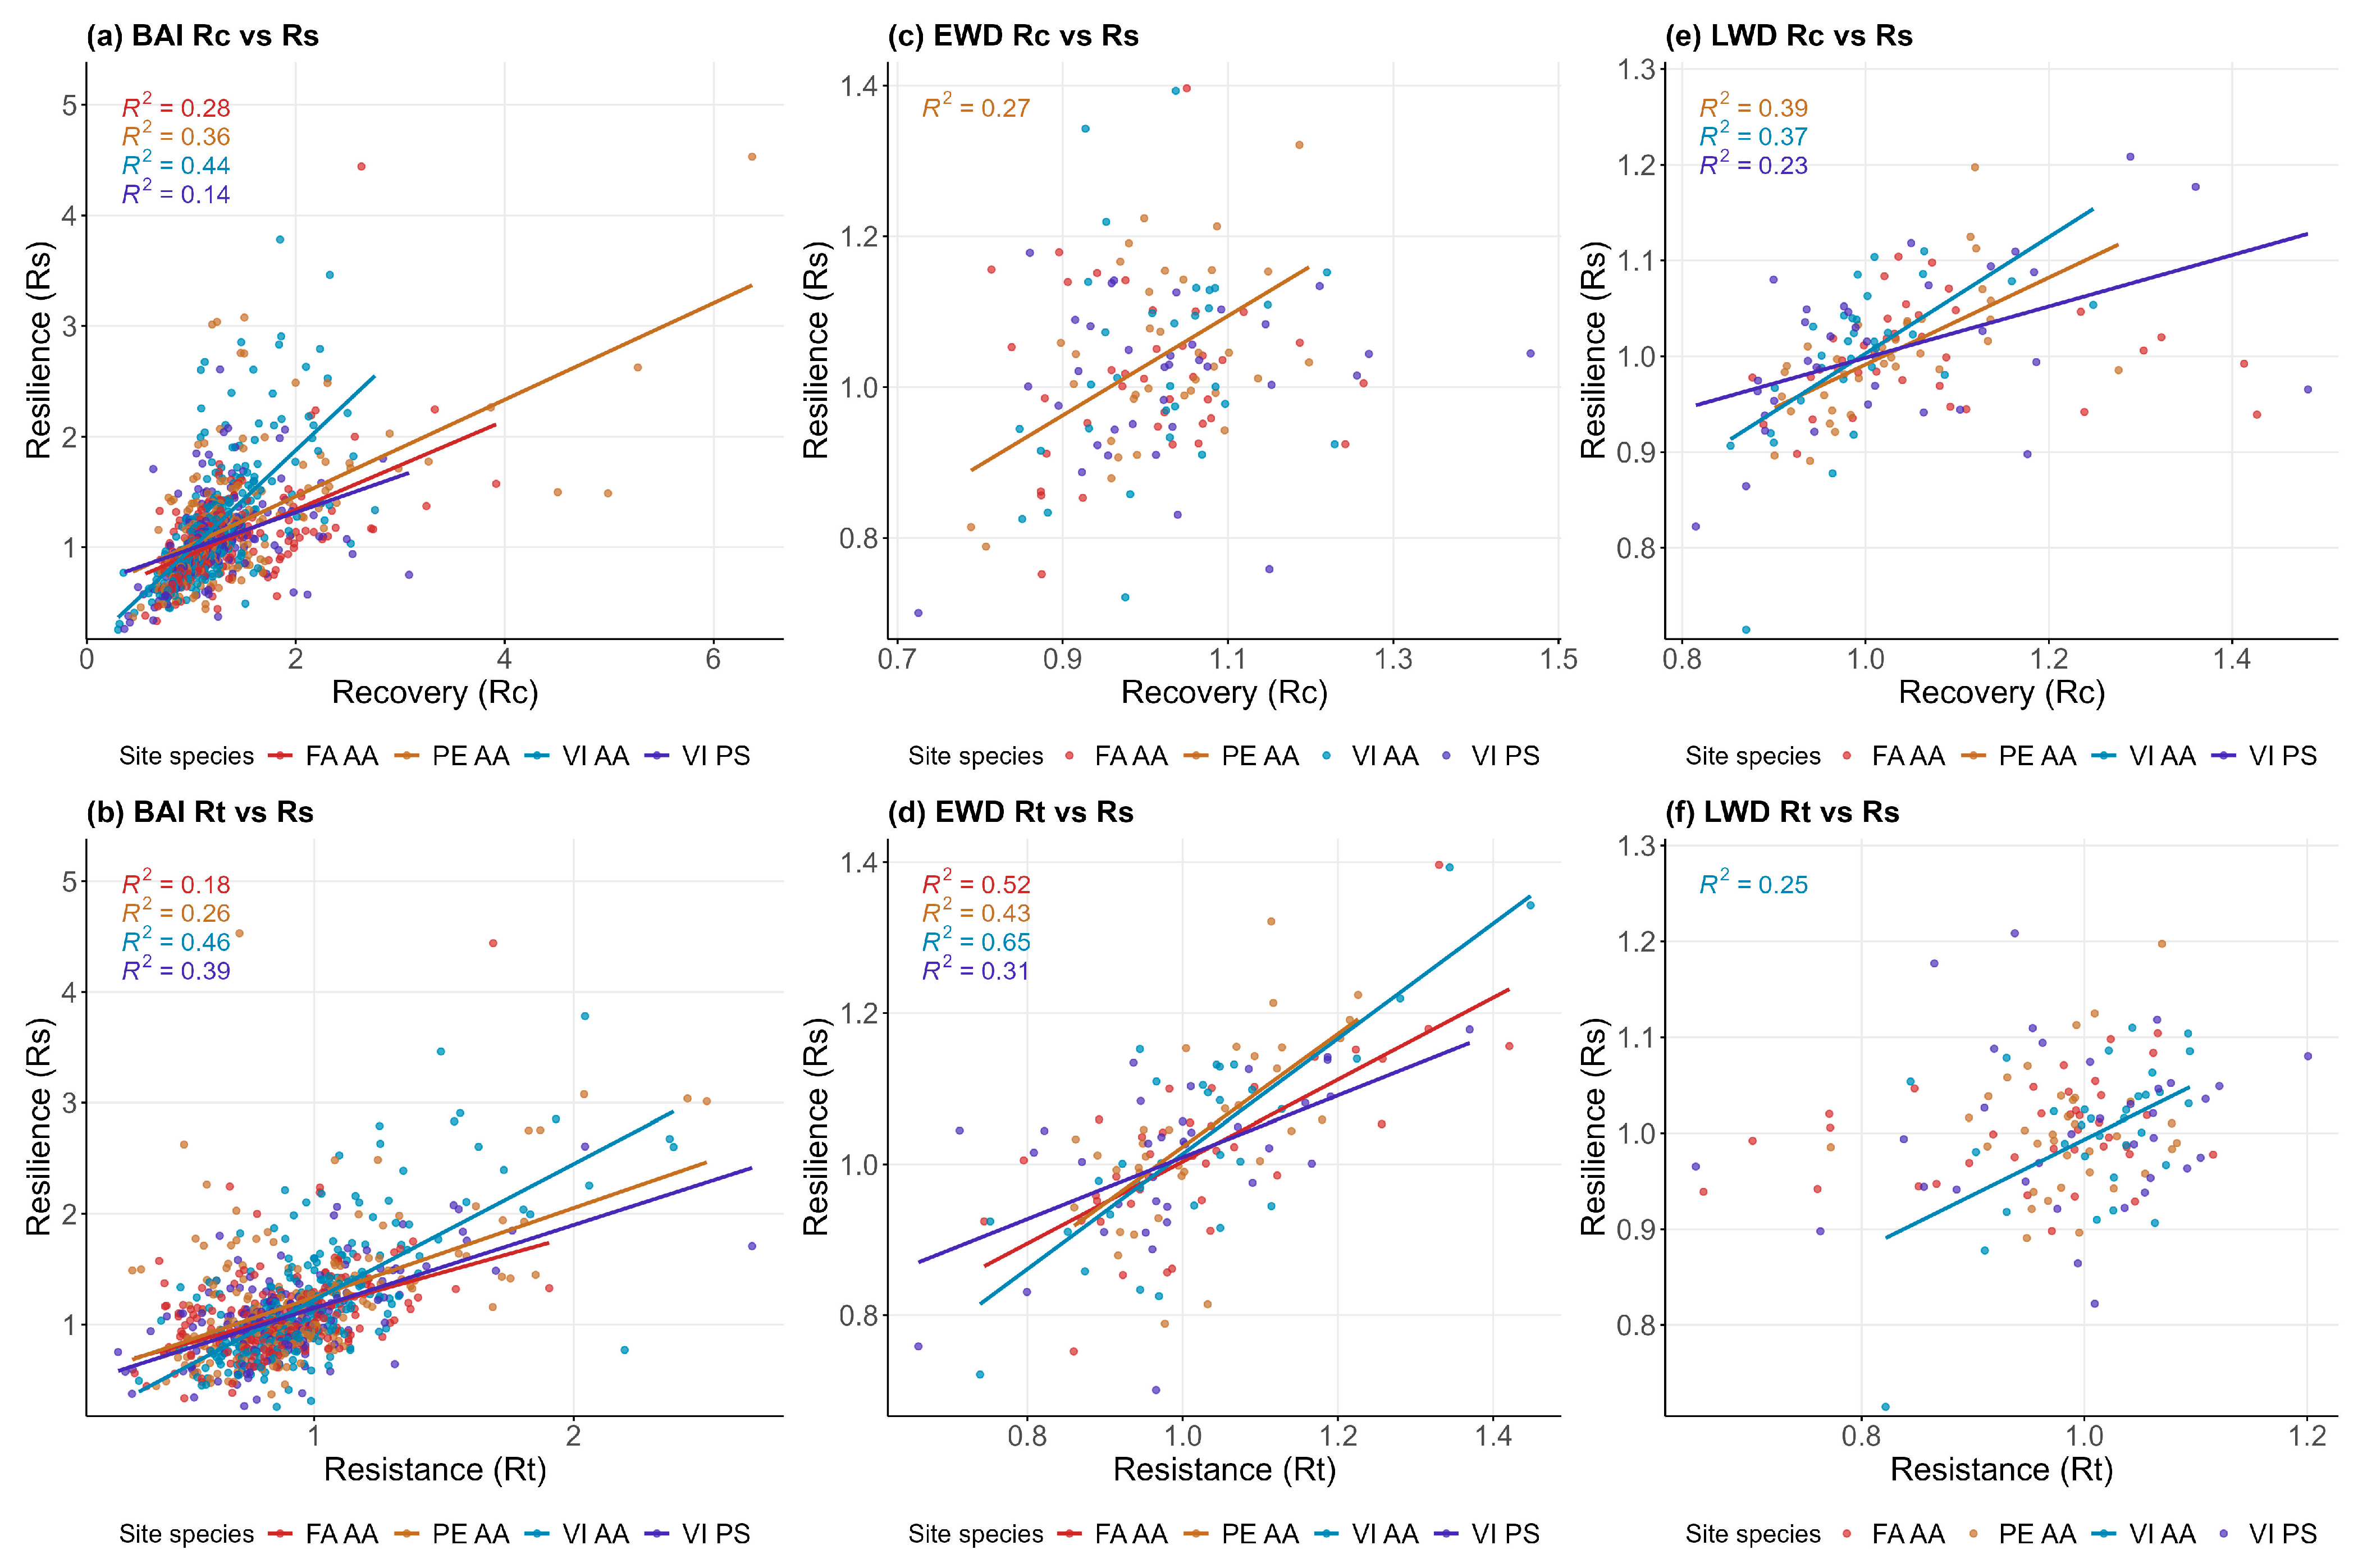
3.4. Resilience Indices

Across the four dry years (1986, 1998, 2005, and 2011), resistance (Rt), recovery (Rc), and resilience (Rs) indices showed similar distributions among study sites and species (Figures S9–S11; Table S3). BAI-based indices showed that only Rt indices differed between site species, being higher in VI-AA site and not different between VI PS, FA AA, and PE AA. Rc and Rs indices did not differ between sites or species. The resilience indices of EWD and LWD showed similar distributions among study sites without significant differences.
For BAI, the Rs indices were positively related to Rt and Rc indices in all sites (Figure 6a,b); Rt showed steeper slopes (e.g., site silver fir VI site), indicating that resilience is more sensitive to changes in resistance, whereas Rc showed shallower slopes. In the wettest site (VI), Rt and Rc of silver fir contributed similarly to resilience (R2 = 0.46 for Rt vs. R2 = 0.44 for Rc, p < 0.001 in btoh cases). In contrast, in the drier sites, FA and PE, we found a higher Rc-driven variance (R2 = 0.28 and R2 = 0.36 for Rc vs. R2 = 0.18 and R2 = 0.26 for Rt, respectively). Scots pine at VI resembled the silver fir pattern, with a stronger Rs (R2 = 0.39, p < 0.001) than Rc effect (R2 = 0.14).
For EWD, Rt showed a clear positive relationship with Rs across all populations, highlighting its consistent contribution to resilience (Figure 6d). In contrast, Rc was linked with Rs only in the silver fir PE site (R2 = 0.27, p < 0.05) (Figure 6c). For LWD, Rs showed site- and species-specific relationships. Rc was significantly associated with Rs in silver fir from PE (R2 = 0.39, p < 0.001) and VI stands (R2 = 0.37, p < 0.001) and also in the Scots pine VI stand (R2 = 0.23, p < 0.05; Figure 6e). Rt was positively correlated with Rs only in the silver fir VI site (R2 = 0.25, p < 0.05; Figure 6f).

4. Discussion

This study aimed to disentangle the growth and hydraulic strategies of two coexisting conifers, silver fir and Scots pine, across a climatic gradient in the Pyrenees. We compared growth (BAI) and complementary wood traits, such as earlywood density (EWD) and latewood density (LWD). In addition, we evaluated their temporal trends of trait-specific climatic sensitivity and quantified their resilience to extreme drought events. Our analyses highlight the role of species-specific strategies and local site conditions in shaping tree responses to drought. Importantly, due to limitations in sample availability, EWD and LWD series were only obtained for declining or recently dead silver fir and living Scots pine individuals, which should be considered when interpreting patterns in wood density and resilience. Additionally, BAI and EWD may be more informative for evaluating hydraulic strategies in this context than LWD. Unlike EWD, LWD forms later in the growing season and is influenced by a broader set of internal and external factors, including carbon allocation dynamics, phenology, and post-drought, making it a more complex but potentially informative trait [34,35]. Accordingly, the strong signal of the August water balance and Tmax recorded by LWD in the wet VI silver fir population suggests that this variable not only records the impact of warm late-summer conditions on lignification and wall thickness as has been found in cold conifer forests [36].

4.1. Relationships Between Growth and Wood Density

Mean growth and wood density values differed across populations and species, revealing contrasting long-term strategies shaped by environmental conditions. Among silver fir populations, FA exhibited the highest BAI, PE showed the lowest, and VI displayed intermediate values. This agrees with the chronic situation of silver fir in site PE, where dieback and mortality have been recorded since the 1980s [19]. Silver fir BAI in sites PE and VI increased over the last two decades (2001–2020), while it remained stable in site FA. In contrast, Scots pine in VI experienced a notable growth decline over the last two decades, which suggests future dieback processes affecting this species (Figure 3 and Table 3).
Regarding EWD, which in the case of silver fir was measured in declining or recently dead individuals, trees from VI presented the highest values and PE trees showed the lowest EWD. These results are contrary to our expectations because dieback in PE silver firs is manifested as growth decline and the formation of tracheids with narrow lumens [37] corresponding to high EWD values. The decoupling between density and growth rates observed in both study species implies that other physiological mechanisms may mediate drought responses. For instance, Scots pine might avoid hydraulic failure through early stomatal closure and growth cessation, limiting carbon assimilation [17,38], In contrast, silver fir may be prone to hydraulic failure and atmospheric drought due to its high sensitivity to elevated vapor pressure deficit [39].
Over time, EWD increased in all silver populations suggesting an anatomical adjustment toward greater hydraulic safety (smaller lumen area), possibly in response to regional warming and drought intensification [2,8,40], or tapering as trees become taller and older [41]. In contrast, VI Scots pine showed a slight decrease in EWD; however, it showed no significant correlation between EWD and BAI, and its BAI declined despite relatively stable or decreasing EWD. This further supports our assumptions that other physiological mechanisms may be mediating the response of Scots pine to drought, like early stomatal closure, which halts water transport but drastically limits CO2 assimilation [17]. In addition, a limited capacity for osmotic adjustment and for reallocating starch reserves in roots and stems may further reduce survival under severe water shortages [4,38].
The relationship between BAI and EWD was negative in FA (r = −0.30) and PE (r = −0.26) (Figure S20), consistent with the hypothesis that increased hydraulic safety, via denser wood, may come at the cost of radial growth under drier conditions [7,8]. In contrast, silver fir VI displayed a positive relationship between BAI and EWD (r = 0.56), suggesting that under favorable moisture conditions, growth and safety investments are not mutually exclusive. This is further supported by the increase in both traits from 2001 to 2020.
These patterns support the view that earlywood density and growth are tightly linked traits, but their interplay is modulated by environmental context and species-specific strategies [19]. Despite the fact that both species are constrained by drought, silver fir responds through xylem reinforcement, whereas Scots pine may be limited by carbon availability.

4.2. Climatic Sensitivity of Radial Growth and Wood Density

Across all silver fir populations, EWD increased in response to warmer spring temperatures, which confirms that silver fir tends to form higher-density earlywood following spring droughts [42]. This dense earlywood would correspond to tracheids with reduced lumen size and wide cell walls contributing to hydraulically safer xylem [7,8]. Such adjustments reinforce the conservative hydraulic strategy, where growth is sacrificed to maintain xylem function under climatic stress, mainly in drier sites (FA and PE). However, if growth rates are low and EWD does not increase, this reduces total sapwood hydraulic conductivity and triggers irreversible growth decline and tree death. These wood-anatomical responses to climate were not uniform across silver fir sites. For instance, while the wet, cool VI site showed more conservative adjustments, silver fir individuals from the dry, warm FA site exhibited more remarkable plasticity, reducing EWD in response to increased winter water balance, as Scots pine did, suggesting that earlywood density responds to interannual variations in water availability in both species. Interestingly, despite being climatically similar to FA, the PE silver fir site did not show this strong EWD sensitivity to winter–spring drought, implying that local microclimatic or edaphic conditions may modulate hydraulic strategies beyond regional climatic variables. This is a plausible explanation given that FA is located on a shaded valley bottom with deeper soils. In contrast, PE is situated in a more exposed mid-slope position with shallower and more stressful site conditions. Alternatively, the chronic dieback processes observed in site PE may make silver fir individuals less responsive to climate variability.
Analogously, drier conditions lead to earlywood tracheids with smaller lumens and thinner walls in Great Basin conifers (SW USA) compared to wetter conditions [43]. Our findings extend this evidence to silver fir, highlighting that hydraulic strategies may vary depending on site conditions. In contrast, Scots pine showed an opposite trend for spring temperatures, with decreasing EWD under warmer spring temperatures. This reflects a possible opportunistic strategy, prioritizing hydraulic efficiency over safety, characterized by wider conduits and reduced investment in cell wall reinforcement [8,44]. Moreover, drought has been shown to shorten the period of wood formation in Scots pine, indicating a phenological constraint that further limits growth despite anatomical adjustments [45]. These traits may underlie the weak or non-significant correlations between BAI and EWD observed in Scots pine from the wet, cool VI site (Figure S20), suggesting that hydraulic adjustments do not drive growth responses in this population.
Although no substantial long-term trend in precipitation was observed in the study area (Figure S1), the increasing temperature raises evaporative demand and creates more frequent periods of climatic water deficit [46]. This suggests that Scots pine exhibits a more vulnerable anatomical strategy under ongoing climate warming. However, field-based indicators of forest dieback (e.g., defoliation, mortality) are more frequently observed in silver fir populations such as FA and PE [19]. This apparent contradiction can be better understood by species-specific early warning signals of drought-induced mortality. While silver fir shows increased growth variability and autocorrelation prior to death, Scots pine reveals long-term declines in growth and shifts in carbon allocation patterns well before mortality occurs. In addition, the study silver fir sites are located near the xeric southern margin of the species range in Europe, where climatic conditions are becoming warmer and drier, i.e., leading to increased atmospheric drought (higher vapor pressure deficit), while Scots pine displays a higher ecological tolerance to such rising evaporative demand.

4.3. Resilience Indices: Differences Between Growth and Wood Density

Our results demonstrate that the relative contribution of Rt and Rc to Rs varies depending on the species, trait, and environmental context. For BAI, Rs was positively associated with both Rt and Rc across all populations (Figure 6a,d), but the strength of these relationships, as indicated by the regression slopes, varied notably. In silver fir populations, Rt consistently showed steeper slopes than Rc, especially in the wetter site VI, suggesting that resilience is more sensitive to resistance under favorable climatic conditions. In contrast, in the drier FA and PE sites, Rc had shallower slopes, yet slightly higher R2 values (0.277 and 0.359 for Rc vs. 0.177 and 0.259 for Rt), indicating that resistance exerts a stronger marginal effect, while recovery accounts for more variance across individuals. This pattern reflects site-specific trade-offs in resilience strategies.
Unlike growth, EWD resilience (based on declining or recently dead silver fir and non-declining Scots pine) was systematically and strongly influenced by Rt across all sites and species. Rt explained over 50% of the variance in Rs in silver firs from FA and VI sites, and remained the dominant predictor in all cases, even where Rc was also significant (e.g., site PE). This pattern suggests that EWD is a structurally constrained trait, with limited capacity for plastic recovery. Trees exhibiting higher EWD resilience could maintain high EWD values during drought, reinforcing the view of wood density as a reliable proxy of hydraulic safety.
Finally, we note that wood density data were obtained only for declining or recently dead silver fir and for living Scots pine individuals. We acknowledge that, despite this constraint limits the broad applicability of our study, the presented findings provide valuable insights into the anatomical and hydraulic processes underlying species- and site-specific tree responses to drought.

5. Conclusions

Our findings reveal distinct strategies of drought response between sites and within species. Silver fir shows a more conservative hydraulic strategy, characterized by structurally reinforced tissues and resilience patterns dominated by resistance (Rt), particularly in EWD. Scots pine, on the other hand, exhibits greater variability in growth and a more recovery-based resilience in certain traits and sites, possibly reflecting physiological adjustments unrelated to wood density. The divergence between Rt and Rc across traits and species underscores the multidimensional nature of drought resilience, which is explained by several factors such as tissue turnover and enlargement (growth), carbon fixation (wood density), and hydraulic conductivity (lumen area and wood density). These results reinforce the need to consider multiple wood traits and temporal scales when assessing vulnerability to climate change even in temperate, cool mountain forests.

Supplementary Materials

The following supporting information can be downloaded at https://www.mdpi.com/article/10.3390/f16060921/s1. Table S1. Post hoc Dunn test results for pairwise comparisons of climatic variables between populations (1952–2021) at FA, PE. and VI; Table S2. Detrending statistics (mean ± SE) for standard and residual chronologies of tree-ring width (TRW), earlywood density (EWD), and latewood density (LWD) for Abies alba (AA) and Pinus sylvestris (PS) at FA, PE, and VI; Table S3. Independent contributions of recovery (Rc) and resistance (Rt) indices explaining resilience (Rs) across wood traits; Figure S1. Climate trends at the three sites (FA, PE, and VI); Figure S2. Detrended series of tree-ring width index (TRWi), earlywood density index (EWDi), and latewood density index (LWDi) for AA and PS at FA, PE, and VI; Figures S3–S6. Standardized TRWi chronologies for AA at FA (S3), AA at PE (S4), AA at VI (S5), and PS at VI (S6); Figures S7–S10. EWDi chronologies for AA at FA (S7), AA at PE (S8), AA at VI (S9), and PS at VI (S10); Figures S11–S14. LWDi chronologies for AA at FA (S11), AA at PE (S12), AA at VI (S13), and PS at VI (S14); Figure S15. Diameter at breast height (DBH) violin plots for AA and PS at FA, PE, and VI; Figure S16. Age at core height (ACH) violin plots for AA and PS at FA, PE, and VI; Figure S17. Basal area increment (BAI) violin plots for AA and PS at FA, PE, and VI in full series, 1981–2000 and 2001–2020; Figure S18. EWD violin plots for AA and PS at FA, PE, and VI in full series, 1981–2000 and 2001–2020; Figure S19. LWD violin plots for AA and PS at FA, PE, and VI in full series, 1981–2000 and 2001–2020; Figure S20. Pearson correlation matrix between site-species growth (BAI) and standardized wood density (EWDi, LWDi); Figure S21. BAI resistance (Rt), recovery (Rc), and resilience (Rs) violin plots for AA and PS at FA, PE, and VI; Figure S22. EWDi resistance, recovery, and resilience violin plots for AA and PS at FA, PE, and VI; Figure S23. LWDi resistance, recovery, and resilience violin plots for AA and PS at FA, PE, and VI.

Author Contributions

Conceptualization, J.J.C. and J.C.L.; investigation, J.P.C.-A., J.D. and J.A.; formal analysis, J.P.C.-A.; resources, E.G.d.A., C.V., Á.R.-C., J.D. and J.A.; data curation, J.D., J.A., E.G.d.A. and C.V., writing—original draft preparation, J.P.C.-A.; writing—review and editing, J.C.L. and J.J.C.; project administration, A.G.; funding acquisition, A.G., J.C.L. and J.J.C. All authors have read and agreed to the published version of the manuscript.

Funding

This research was funded by the Spanish Science and Innovation Ministry (grant numbers PID2021-123675OB-C43 and TED2021-129770B-C21), the Long-Term Research Development Project No. RVO 67985939 of the Czech Academy of Sciences, and Estonian Research Council, grant PSG1044.

Data Availability Statement

The dataset is available on request from the corresponding author.

Acknowledgments

We thank Eva Navratova and Vitek Pejcha, the technicians of the Institute of Botany, Czech Academy of Sciences, for their helpful and efficient work on density analysis.

Conflicts of Interest

The authors declare no conflicts of interest.

References

  1. Rebollo, P.; Moreno-Fernández, D.; Cruz-Alonso, V.; Gazol, A.; Rodríguez-Rey, M.; Astigarraga, J.; Zavala, M.A.; Gómez-Aparicio, L.; Andivia, E.; Miguel-Romero, S.; et al. Recent Increase in Tree Damage and Mortality and Their Spatial Dependence on Drought Intensity in Mediterranean Forests. Landsc. Ecol. 2024, 39, 38. [Google Scholar] [CrossRef]
  2. Allen, C.D.; Breshears, D.D.; McDowell, N.G. On Underestimation of Global Vulnerability to Tree Mortality and Forest Die-off from Hotter Drought in the Anthropocene. Ecosphere 2015, 6, 1–55. [Google Scholar] [CrossRef]
  3. Hammond, W.M.; Williams, A.P.; Abatzoglou, J.T.; Adams, H.D.; Klein, T.; López, R.; Sáenz-Romero, C.; Hartmann, H.; Breshears, D.D.; Allen, C.D. Global Field Observations of Tree Die-off Reveal Hotter-Drought Fingerprint for Earth’s Forests. Nat. Commun. 2022, 13, 1761. [Google Scholar] [CrossRef] [PubMed]
  4. McDowell, N.; Pockman, W.T.; Allen, C.D.; Breshears, D.D.; Cobb, N.; Kolb, T.; Plaut, J.; Sperry, J.; West, A.; Williams, D.G.; et al. Mechanisms of Plant Survival and Mortality during Drought: Why Do Some Plants Survive While Others Succumb to Drought? New Phytol. 2008, 178, 719–739. [Google Scholar] [CrossRef]
  5. Adams, H.D.; Zeppel, M.J.B.; Anderegg, W.R.L.; Hartmann, H.; Landhäusser, S.M.; Tissue, D.T.; Huxman, T.E.; Hudson, P.J.; Franz, T.E.; Allen, C.D.; et al. A Multi-Species Synthesis of Physiological Mechanisms in Drought-Induced Tree Mortality. Nat. Ecol. Evol. 2017, 1, 1285–1291. [Google Scholar] [CrossRef] [PubMed]
  6. Arend, M.; Link, R.M.; Patthey, R.; Hoch, G.; Schuldt, B.; Kahmen, A. Rapid Hydraulic Collapse as Cause of Drought-Induced Mortality in Conifers. Proc. Natl. Acad. Sci. USA 2021, 118, e2025251118. [Google Scholar] [CrossRef]
  7. Björklund, J.; Von Arx, G.; Fonti, P.; Stridbeck, P.; De Mil, T.; Neycken, A.; Seftigen, K. The Utility of Bulk Wood Density for Tree-Ring Research. Dendrochronologia 2021, 69, 125880. [Google Scholar] [CrossRef]
  8. Hacke, U.G.; Sperry, J.S.; Pockman, W.T.; Davis, S.D.; McCulloh, K.A. Trends in Wood Density and Structure Are Linked to Prevention of Xylem Implosion by Negative Pressure. Oecologia 2001, 126, 457–461. [Google Scholar] [CrossRef]
  9. Olano, J.M.; Eugenio, M.; García-Cervigón, A.I.; Folch, M.; Rozas, V. Quantitative Tracheid Anatomy Reveals a Complex Environmental Control of Wood Structure in Continental Mediterranean Climate. Int. J. Plant Sci. 2012, 173, 137–149. [Google Scholar] [CrossRef]
  10. Schwarz, J.; Skiadaresis, G.; Reinhart, A.-L.; Bauhus, J. Increased Drought Mortality in Fast-Growing Silver Fir Trees in the Black Forest. For. Ecol. Manag. 2025, 578, 122441. [Google Scholar] [CrossRef]
  11. Bigler, C.; Bugmann, H. Growth-Dependent Tree Mortality Models Based on Tree Rings. Can. J. For. Res. 2003, 33, 210–221. [Google Scholar] [CrossRef]
  12. O’Brien, M.J.; Engelbrecht, B.M.J.; Joswig, J.; Pereyra, G.; Schuldt, B.; Jansen, S.; Kattge, J.; Landhäusser, S.M.; Levick, S.R.; Preisler, Y.; et al. A Synthesis of Tree Functional Traits Related to Drought-induced Mortality in Forests across Climatic Zones. J. Appl. Ecol. 2017, 54, 1669–1686. [Google Scholar] [CrossRef]
  13. DeSoto, L.; De La Cruz, M.; Fonti, P. Intra-Annual Patterns of Tracheid Size in the Mediterranean Tree Juniperus Thurifera as an Indicator of Seasonal Water Stress. Can. J. For. Res. 2011, 41, 1280–1294. [Google Scholar] [CrossRef]
  14. Camarero, J.J.; Fernández-Pérez, L.; Kirdyanov, A.V.; Shestakova, T.A.; Knorre, A.A.; Kukarskih, V.V.; Voltas, J. Minimum Wood Density of Conifers Portrays Changes in Early Season Precipitation at Dry and Cold Eurasian Regions. Trees Struct. Funct. 2017, 31, 1423–1437. [Google Scholar] [CrossRef]
  15. George, J.-P.; Schueler, S.; Karanitsch-Ackerl, S.; Mayer, K.; Klumpp, R.T.; Grabner, M. Inter- and Intra-Specific Variation in Drought Sensitivity in Abies spec. and Its Relation to Wood Density and Growth Traits. Agric. For. Meteorol. 2015, 214–215, 430–443. [Google Scholar] [CrossRef] [PubMed]
  16. Bose, A.K.; Rigling, A.; Gessler, A.; Hagedorn, F.; Brunner, I.; Feichtinger, L.; Bigler, C.; Egli, S.; Etzold, S.; Gossner, M.M.; et al. Lessons Learned from a Long-term Irrigation Experiment in a Dry Scots Pine Forest: Impacts on Traits and Functioning. Ecol. Monogr. 2022, 92, e1507. [Google Scholar] [CrossRef]
  17. Bose, A.K.; Gessler, A.; Büntgen, U.; Rigling, A. Tamm Review: Drought-Induced Scots Pine Mortality—Trends, Contributing Factors, and Mechanisms. For. Ecol. Manag. 2024, 561, 121873. [Google Scholar] [CrossRef]
  18. Gazol, A.; Camarero, J.J.; Gutiérrez, E.; Popa, I.; Andreu-Hayles, L.; Motta, R.; Nola, P.; Ribas, M.; Sangüesa-Barreda, G.; Urbinati, C.; et al. Distinct Effects of Climate Warming on Populations of Silver Fir (Abies alba) across Europe. J. Biogeogr. 2015, 42, 1150–1162. [Google Scholar] [CrossRef]
  19. Camarero, J.J.; Gazol, A.; Sangüesa-Barreda, G.; Oliva, J.; Vicente-Serrano, S.M. To die or not to die: Early-warning signals of dieback in response to a severe drought. J. Ecol. 2015, 103, 44–57. [Google Scholar] [CrossRef]
  20. Lloret, F.; Keeling, E.G.; Sala, A. Components of Tree Resilience: Effects of Successive Low-Growth Episodes in Old Ponderosa Pine Forests. Oikos 2011, 120, 1909–1920. [Google Scholar] [CrossRef]
  21. González De Andrés, E.; Gazol, A.; Querejeta, J.I.; Colangelo, M.; Camarero, J.J. Mistletoe-Induced Carbon, Water and Nutrient Imbalances Are Imprinted on Tree Rings. Tree Physiol. 2024, 44, tpae106. [Google Scholar] [CrossRef] [PubMed]
  22. Caudullo, G. Chorological Data for the Main European Woody Species. 2024. Available online: https://doi.org/10.17632/HR5H2HCGG4.18 (accessed on 31 March 2025).
  23. Abatzoglou, J.T.; Dobrowski, S.Z.; Parks, S.A.; Hegewisch, K.C. TerraClimate, a High-Resolution Global Dataset of Monthly Climate and Climatic Water Balance from 1958–2015. Sci. Data 2018, 5, 170191. [Google Scholar] [CrossRef] [PubMed]
  24. Fritts, H.C. Tree Rings and Climate; Academic Press: London, UK; New York, NY, USA, 1976. [Google Scholar]
  25. Cottam, G.; Curtis, J.T. The Use of Distance Measures in Phytosociological Sampling. Ecology 1956, 37, 451–460. [Google Scholar] [CrossRef]
  26. Larsson, L. CDendro & CooRecorder Program Package. 2022. Available online: https://www.cybis.se/forfun/dendro (accessed on 31 March 2025).
  27. Holmes, R.L. Computer-Assisted Quality Control in Tree-Ring Dating and Measurement. Tree-Ring Bull. 1983, 43, 69–78. [Google Scholar]
  28. Biondi, F.; Qeadan, F. A Theory-Driven Approach to Tree-Ring Standardization: Defining the Biological Trend from Expected Basal Area Increment. Tree-Ring Res. 2008, 64, 81–96. [Google Scholar] [CrossRef]
  29. Bunn, A.; Korpela, M.; Biondi, F.; Campelo, F.; Klesse, S.; Mérian, P.; Qeadan, F.; Zang, C.; Buras, A.; Cecile, A.; et al. dplR: Dendrochronology Program Library in R. 2025. Available online: https://cran.r-project.org/web/packages/dplR/index.html (accessed on 25 March 2025).
  30. R Core Team. R: A Language and Environment for Statistical Computing. 2024. Available online: https://www.R-project.org/ (accessed on 31 March 2025).
  31. Kasambara, A. Rstatix: Pipe-Friendly Framework for Basic Statistical Tests. 2023. Available online: https://rpkgs.datanovia.com/rstatix/ (accessed on 31 March 2025).
  32. Patil, I. Visualizations with Statistical Details: The “ggstatsplot” Approach. J. Open Source Softw. 2021, 6, 3167. [Google Scholar] [CrossRef]
  33. Zang, C.; Biondi, F. Treeclim: An R Package for the Numerical Calibration of Proxy-Climate Relationships. Ecography 2015, 38, 431–436. [Google Scholar] [CrossRef]
  34. Fonti, P.; Von Arx, G.; García-González, I.; Eilmann, B.; Sass-Klaassen, U.; Gärtner, H.; Eckstein, D. Studying Global Change through Investigation of the Plastic Responses of Xylem Anatomy in Tree Rings. New Phytol. 2010, 185, 42–53. [Google Scholar] [CrossRef]
  35. De Micco, V.; Campelo, F.; De Luis, M.; Bräuning, A.; Grabner, M.; Battipaglia, G.; Cherubini, P. Intraannual density fluctuations in tree rings: How, when, where, and why? IAWA J. 2016, 37, 232–259. [Google Scholar] [CrossRef]
  36. Gindl, W.; Grabner, M.; Wimmer, R. The Influence of Temperature on Latewood Lignin Content in Treeline Norway Spruce Compared with Maximum Density and Ring Width. Trees Struct. Funct. 2000, 14, 409–414. [Google Scholar] [CrossRef]
  37. Pellizzari, E.; Camarero, J.J.; Gazol, A.; Sangüesa-Barreda, G.; Carrer, M. Wood Anatomy and Carbon-isotope Discrimination Support Long-term Hydraulic Deterioration as a Major Cause of Drought-induced Dieback. Glob. Chang. Biol. 2016, 22, 2125–2137. [Google Scholar] [CrossRef]
  38. Irvine, J.; Perks, M.P.; Magnani, F.; Grace, J. The Response of Pinus sylvestris to Drought: Stomatal Control of Transpiration and Hydraulic Conductance. Tree Physiol. 1998, 18, 393–402. [Google Scholar] [CrossRef]
  39. Aussenac, G. Ecology and Ecophysiology of Circum-Mediterranean Firsin the Context of Climate Change. Ann. For. Sci. 2002, 59, 823–832. [Google Scholar] [CrossRef]
  40. Domec, J.-C.; Warren, J.M.; Meinzer, F.C.; Lachenbruch, B. Safety Factors for Xylem Failure by Implosion and Air-Seeding Within Roots, Trunks and Branches of Young and Old Conifer Trees. IAWA J. 2009, 30, 101–120. [Google Scholar] [CrossRef]
  41. Olson, M.E.; Soriano, D.; Rosell, J.A.; Anfodillo, T.; Donoghue, M.J.; Edwards, E.J.; León-Gómez, C.; Dawson, T.; Camarero Martínez, J.J.; Castorena, M.; et al. Plant Height and Hydraulic Vulnerability to Drought and Cold. Proc. Natl. Acad. Sci. USA 2018, 115, 7551–7556. [Google Scholar] [CrossRef]
  42. Camarero, J.J.; Gutiérrez, E. Wood Density of Silver Fir Reflects Drought and Cold Stress across Climatic and Biogeographic Gradients. Dendrochronologia 2017, 45, 101–112. [Google Scholar] [CrossRef]
  43. Ziaco, E.; Biondi, F.; Rossi, S.; Deslauriers, A. Climatic Influences on Wood Anatomy and Tree-ring Features of Great Basin Conifers at a New Mountain Observatory. Appl. Plant Sci. 2014, 2, 1400054. [Google Scholar] [CrossRef]
  44. Martin-Benito, D.; Beeckman, H.; Cañellas, I. Influence of Drought on Tree Rings and Tracheid Features of Pinus nigra and Pinus sylvestris in a Mesic Mediterranean Forest. Eur. J. Forest Res. 2013, 132, 33–45. [Google Scholar] [CrossRef]
  45. Eilmann, B.; Zweifel, R.; Buchmann, N.; Fonti, P.; Rigling, A. Drought-Induced Adaptation of the Xylem in Scots Pine and Pubescent Oak. Tree Physiol. 2009, 29, 1011–1020. [Google Scholar] [CrossRef]
  46. Vicente-Serrano, S.M.; Lopez-Moreno, J.-I.; Beguería, S.; Lorenzo-Lacruz, J.; Sanchez-Lorenzo, A.; García-Ruiz, J.M.; Azorin-Molina, C.; Morán-Tejeda, E.; Revuelto, J.; Trigo, R.; et al. Evidence of Increasing Drought Severity Caused by Temperature Rise in Southern Europe. Environ. Res. Lett. 2014, 9, 044001. [Google Scholar] [CrossRef]
Figure 2. Annual climate water balance (mm) calculated in the three Pyrenean sites: FA (Fago), PE (Paco Ezpela), and VI (Villanúa). Vertical dashed lines indicate studied drought years (1986, 1998, 2005, 2011), and gray shaded areas correspond to the three years before and after each drought year used to calculate resistance, recovery, and resilience indices.
Forests 16 00921 g002
Figure 3. Basal area increment (BAI) for silver fir (AA) and Scots pine (PS) trees in the three study sites: FA (Fago), PE (Paco Ezpela), and VI (Villanúa). Vertical dashed lines indicate drought years (1986, 1998, 2005, and 2011). Gray shaded areas correspond to the three years before and after each drought year used to calculate resistance, recovery, and resilience indices. Shaded ribbons indicate the 95% confidence interval of the mean BAI.
Forests 16 00921 g003
Figure 4. Earlywood (EWD) and latewood (LWD) density for silver fir (AA) and Scots pine (PS) trees in the three study sites: FA (Fago), PE (Paco Ezpela), and VI (Villanúa). Vertical dashed lines indicate drought years (1986, 1998, 2005, and 2011). gray shaded areas correspond to the three years before and after each drought year used to calculate resistance, recovery, and resilience indices. Shaded ribbons indicate the 95% confidence interval of the mean EWD/LWD.
Forests 16 00921 g004
Figure 5. Correlations between monthly climate variables and tree-ring width (TRWi), earlywood density (EWDi), and latewood density (LWDi) indices of silver fir (AA) and Scots pine (PS) in the study sites: FA (Fago), PE (Paco Ezpela), and VI (Villanúa). Black points indicate statistically significant correlations (p < 0.05). Vertical dotted lines indicate seasons from previous fall to the current summer. Months of the previous and current years are indicated by lowercase and uppercase letters, respectively.
Forests 16 00921 g005
Figure 6. Relationship between resistance (Rt), recovery (Rc), and resilience (Rs) indices considering basal area increment (BAI, plots (a,b)), earlywood (EWD, plots (c,d)), and latewood density (LWD, plots (e,f)) indices for silver fir (AA) and Scots pine (PS) study sites: FA (Fago), PE (Paco Ezpela), and VI (Villanúa). Each point represents an individual tree and drought year, and lines represent the fitted linear regressions per site and species with r2 noted. Represented slopes are statistically significant (p < 0.05).
Forests 16 00921 g006
Table 1. List of abbreviations.
AbbreviationDefinitionAbbreviationDefinitionAbbreviationDefinition
TRWTree-Ring WidthBAIBasal Area IncrementCWDClimatic Water Deficit
TRWiTree-Ring Width IndexPPrecipitationRtResistance Index
EWDEarlywood DensityTmaxMaximum TemperatureRcRecovery Index
EWDiEarlywood Density
Index
TminMinimum TemperatureRsResilience Index
LWDLatewood DensityTmeanMean TemperatureFAFago (site code)
LWDiLatewood Density IndexPETPotential
Evapotranspiration
PEPaco Ezpela (site code)
DBHDiameter at Breast HeightP-PETClimatic Water Balance (P minus PET)VIVillanúa (site code)
Table 2. Location and climatic characteristics of sampled sites (mean ± SE).
SiteSpeciesLatitude N
(°)
Longitude W (°)Elevation
(m a.s.l.)
Temperature (°C)Precipitation (mm)
Fago (FA)Abies alba (AA)42°43′34″ N0°52′41″ W91510.3 ± 0.11248 ± 25
Paco Ezpela (PE)Abies alba (AA)42°49′45″ N0°42′15″ W128510.1 ± 0.11302 ± 26
Villanúa (VI)Abies alba (AA)42°42′36″ N0°38′51″ W13206.1 ± 0.11580 ± 40
Villanúa (VI)Pinus sylvestris (PS)42°41′11″ N0°31′18″ W11407.3 ± 0.11465 ± 34
Table 3. Site and species growth and wood density characteristics (mean ± SE) across periods. Letters refers to post hoc pairwise comparisons between sites.
VariableFago (FA)Paco Ezpela (PE)Villanúa (VI)
Silver Fir (AA)Silver Fir (AA)Silver Fir (AA)Scots Pine (PS)
DBH (cm)36.7 ± 1.9 a25.5 ± 0.7 b33.1 ± 1.2 a25.6 ± 1.33 b
Tree age (years) *82.9 ± 5.5 b102 ± 5.2 a106 ± 4.0 a69.1 ± 2.3 b
BAI (cm2 × year−1)13.6 ± 0.2 a5.1 ± 0.1 c8.6 ± 0.1 b8.0 ± 0.1 b
BAI 1981–2000 (cm2 × year−1)14.6 ± 0.3 a6.6 ± 0.2 c9.7 ± 0.3 b9.2 ± 0.2 b
BAI 2001–2020 (cm2 × year−1)14.0 ± 0.4 a11.2 ± 0.2 b12.3 ± 0.3 ab6.5 ± 0.2 c
EWD (kg × m−3) **393.16 ± 1.81 a284.94 ± 1.95 c378.58 ± 2.42 b398.57 ± 3.15 a
EWD 1981–2000 (kg × m−3)388.27 ± 3.35 a275.00 ± 3.64 b384.00 ± 6.32 a401.00 ± 5.34 a
EWD 2001–2020 (kg × m−3)408.29 ± 3.66 b285.00 ± 4.62 c437.06 ± 6.14 a392.76 ± 5.39 b
LWD (kg × m−3) **1423.27 ± 7.33 a954.85 ± 3.67 c1423.21 ± 5.11 a1060.40 ± 7.93 b
LWD 1981–2000 (kg × m−3)1469.77 ± 14.5 a966.57 ± 7.47 d1405.74 ± 11.2 b1052.41 ± 12.8 c
LWD 2001–2020 (kg × m−3)1415.86 ± 21.0 a942.34 ± 8.15 c1386.51 ± 12.8 a1040.23 ± 15.9 b
Notes: * tree age corresponds to the age estimated at 1.3 m, ** calculated for the full span period. Details of post hoc pairwise comparisons can be found in the Supplementary Materials, Figures S3–S7.
Disclaimer/Publisher’s Note: The statements, opinions and data contained in all publications are solely those of the individual author(s) and contributor(s) and not of MDPI and/or the editor(s). MDPI and/or the editor(s) disclaim responsibility for any injury to people or property resulting from any ideas, methods, instructions or products referred to in the content.

