Article

Vegetation Net Primary Productivity Dynamics over the Past Three Decades and Elevation–Climate Synergistic Driving Mechanism in Southwest China’s Mountains

1
PowerChina Kunming Engineering Corporation Limited, Kunming 650000, China
2
State Key Laboratory of Estuarine and Coastal Research, East China Normal University, Shanghai 200241, China
3
Department of Land Surveying and Geo-Informatics, The Hong Kong Polytechnic University, Kowloon, Hong Kong, China
4
The National Key Laboratory of Water Disaster Prevention, Hohai University, Nanjing 210098, China
5
College of Agronomy and Life Sciences, Kunming University, Kunming 650214, China
6
College of Landscape Architecture and Horticulture Science, Southwest Forestry University, Kunming 650224, China
*
Authors to whom correspondence should be addressed.
These authors contributed equally to this work.
Forests 2025, 16(6), 919; https://doi.org/10.3390/f16060919
Submission received: 14 April 2025 / Revised: 20 May 2025 / Accepted: 21 May 2025 / Published: 30 May 2025
(This article belongs to the Topic Responses of Trees and Forests to Climate Change)

Abstract

Mountain forests in biodiversity hotspots show complex responses to climate and topographic gradients. However, the effect of synergistic controls of elevation and climate on Net Primary Productivity (NPP) dynamics remain insufficiently quantified in complex mountains. Southwest China’s mountains are Asia’s most biodiverse temperate region with pronounced vertical ecosystem stratification, representing a critical continental carbon sink. This study investigated the spatiotemporal dynamics and driving mechanisms of NPP in Southwest China’s typical mountain ecosystems over the past three decades using a high-resolution modeling framework integrated with relative importance analysis, a Geodetector, and an elevation-dependent model. The results showed that (1) NPP revealed a significant increasing trend, rising from 634 ± 325 to 748 ± 348 g C m−2 yr−1 (mean rate 4 g C m−2 yr−1) from 1990 to 2018. Spatially, the most rapid increases occurred in eastern regions. (2) Rising CO2 and climate warming (dominate 17% regions) drove interannual NPP growth, with elevation thresholds dictating driver dominance. The CO2 governed low elevation, while temperature controlled higher elevation (>4800 m). (3) The elevation-dependent model revealed a more complex and nonlinear relationship between NPP and elevation, identifying three distinct phases: the saturation phase (<500 m) with negligible decay of NPP; the transition phase (500–3500 m) with linear decline (NPP loss of 29 g C m⁻2 yr⁻1 per 100 m); and the collapse phase (>3500 m) with continuously attenuated NPP losses (NPP average loss of 10.5 g C m⁻2 yr⁻1 per 100 m) reflecting high-elevation vegetation adaptation to extreme conditions. (4) Land cover dominated NPP spatial heterogeneity and was amplified by interactions with elevation and temperature, highlighting a vegetation–climate–topography coupling mechanism that critically shapes productivity patterns. Biodiversity-rich widespread mixed forests underpinned the region’s high productivity. Mountain protection should focus on protecting existing evergreen forests from fragmentation, while forestation should prioritize the establishment of biodiversity-rich mixed forest. These findings established a comprehensive framework for spatiotemporal analysis of driving mechanisms and enhanced the understanding of NPP dynamics in complex mountain ecosystems, informing sustainable management priorities in mountain regions.

1. Introduction

Net Primary Productivity (NPP), a cornerstone of terrestrial carbon cycling, quantifies photosynthetic carbon assimilation by vegetation and serves as a critical indicator of ecosystem carbon-sink capacity [1,2]. Global NPP has increased significantly in recent decades due to human activities, vegetation greening, rising CO2, and climatic change [3,4,5]. However, the magnitude and drivers of these changes show substantial regional variation, shaped by disparities in human activities, climate conditions, and vegetation types [3,6]. While extensive research has examined NPP on global and continental scales, regional analyses remain underrepresented [3,7]. Global-trajectory mask critical regional divergences, particularly in biodiversity hotspots where complex topography mediates climate–vegetation interactions.
This knowledge gap in complex mountain regions arises from the inherent spatiotemporal heterogeneity of vegetation cover and the intricate interactions among biological processes, climatic factors, and soil properties that influence plant growth and decomposition [4]. The multifaceted nature of these interactions under variable topography renders accurate NPP simulation and identification of their driving mechanisms particularly challenging [7,8,9]. These challenges are particularly pronounced in biodiversity-rich mountain regions, where complex habitat structures and high spatial heterogeneity necessitate finer-scale analytical rigor. Approximately 65% of China’s terrestrial area comprises mountainous terrain that functions as a vital net CO2 sink [10,11]. Southwest China’s Mountain Realm constitutes Asia’s most biodiverse temperate zone and is a critical carbon sink for the continent. As its ecological core, Yunnan Province exhibits the dramatic vertical ecosystem stratification, ranging from hyper-diverse tropical rainforests (<100 m) to climate-sensitive alpine meadows (>5000 m), which create microclimate refugia for 19,000 plant species [12]. However, regional studies frequently rely on coarse-resolution NPP datasets (often >5 km spatial resolution) that fail to capture the fine-scale heterogeneity of the microclimate (where 1 km2 may encompass 800 m elevational gradients) in Southwest China’s mountains [13]. Oversimplified driver attribution neglects CO2-climate synergies observed in different terrains and latitude, thereby hindering the development of spatially targeted carbon-management strategies [2,7]. Therefore, there is an urgent need for a high-resolution modeling framework to assess the trends and drivers of NPP more accurately in biodiversity-rich mountain regions. These efforts would significantly reduce uncertainties in regional carbon-budget assessments and would provide actionable insights for enhancing climate-change mitigation efforts in biodiversity hotspots.
This study aimed to unravel the synergistic effects of CO2, climate, and elevation on NPP trends and patterns in Southwest China’s typical mountain ecosystems (1990–2018) using an integrated analytical framework. Specifically, we addressed three key research questions: (1) What are the dominant drivers controlling spatiotemporal NPP dynamics in Southwest China’s mountains?, (2) How does elevation modulate NPP responses to climate change?, and (3) How do vegetation–climate–topography interactions shape the spatial heterogeneity of NPP in Southwest China’s mountains? In this study, Boreal Ecosystem Productivity Simulator (BEPS) was employed at 300 m resolution to resolve fine-scale NPP heterogeneity in topographically complex terrains with steep elevational gradients. Driver attribution was then performed using relative importance analysis to quantify the contributions of CO2, temperature, precipitation, radiation, human activities, and land-cover changes, complemented by Geodetector-based spatial stratified heterogeneity analysis to identify the dominant drivers of NPP and their interactions. Third, nonlinear elevation-dependency modeling was developed to detect threshold responses of NPP across elevational zones. By integrating these methodological advances, we elucidated the mechanisms underlying observed NPP dynamics, redefined conservation priorities based on elevational vulnerability, and established a scalable framework for spatial–temporal analysis of driving mechanisms in complex ecosystems.

2. Materials and Methods
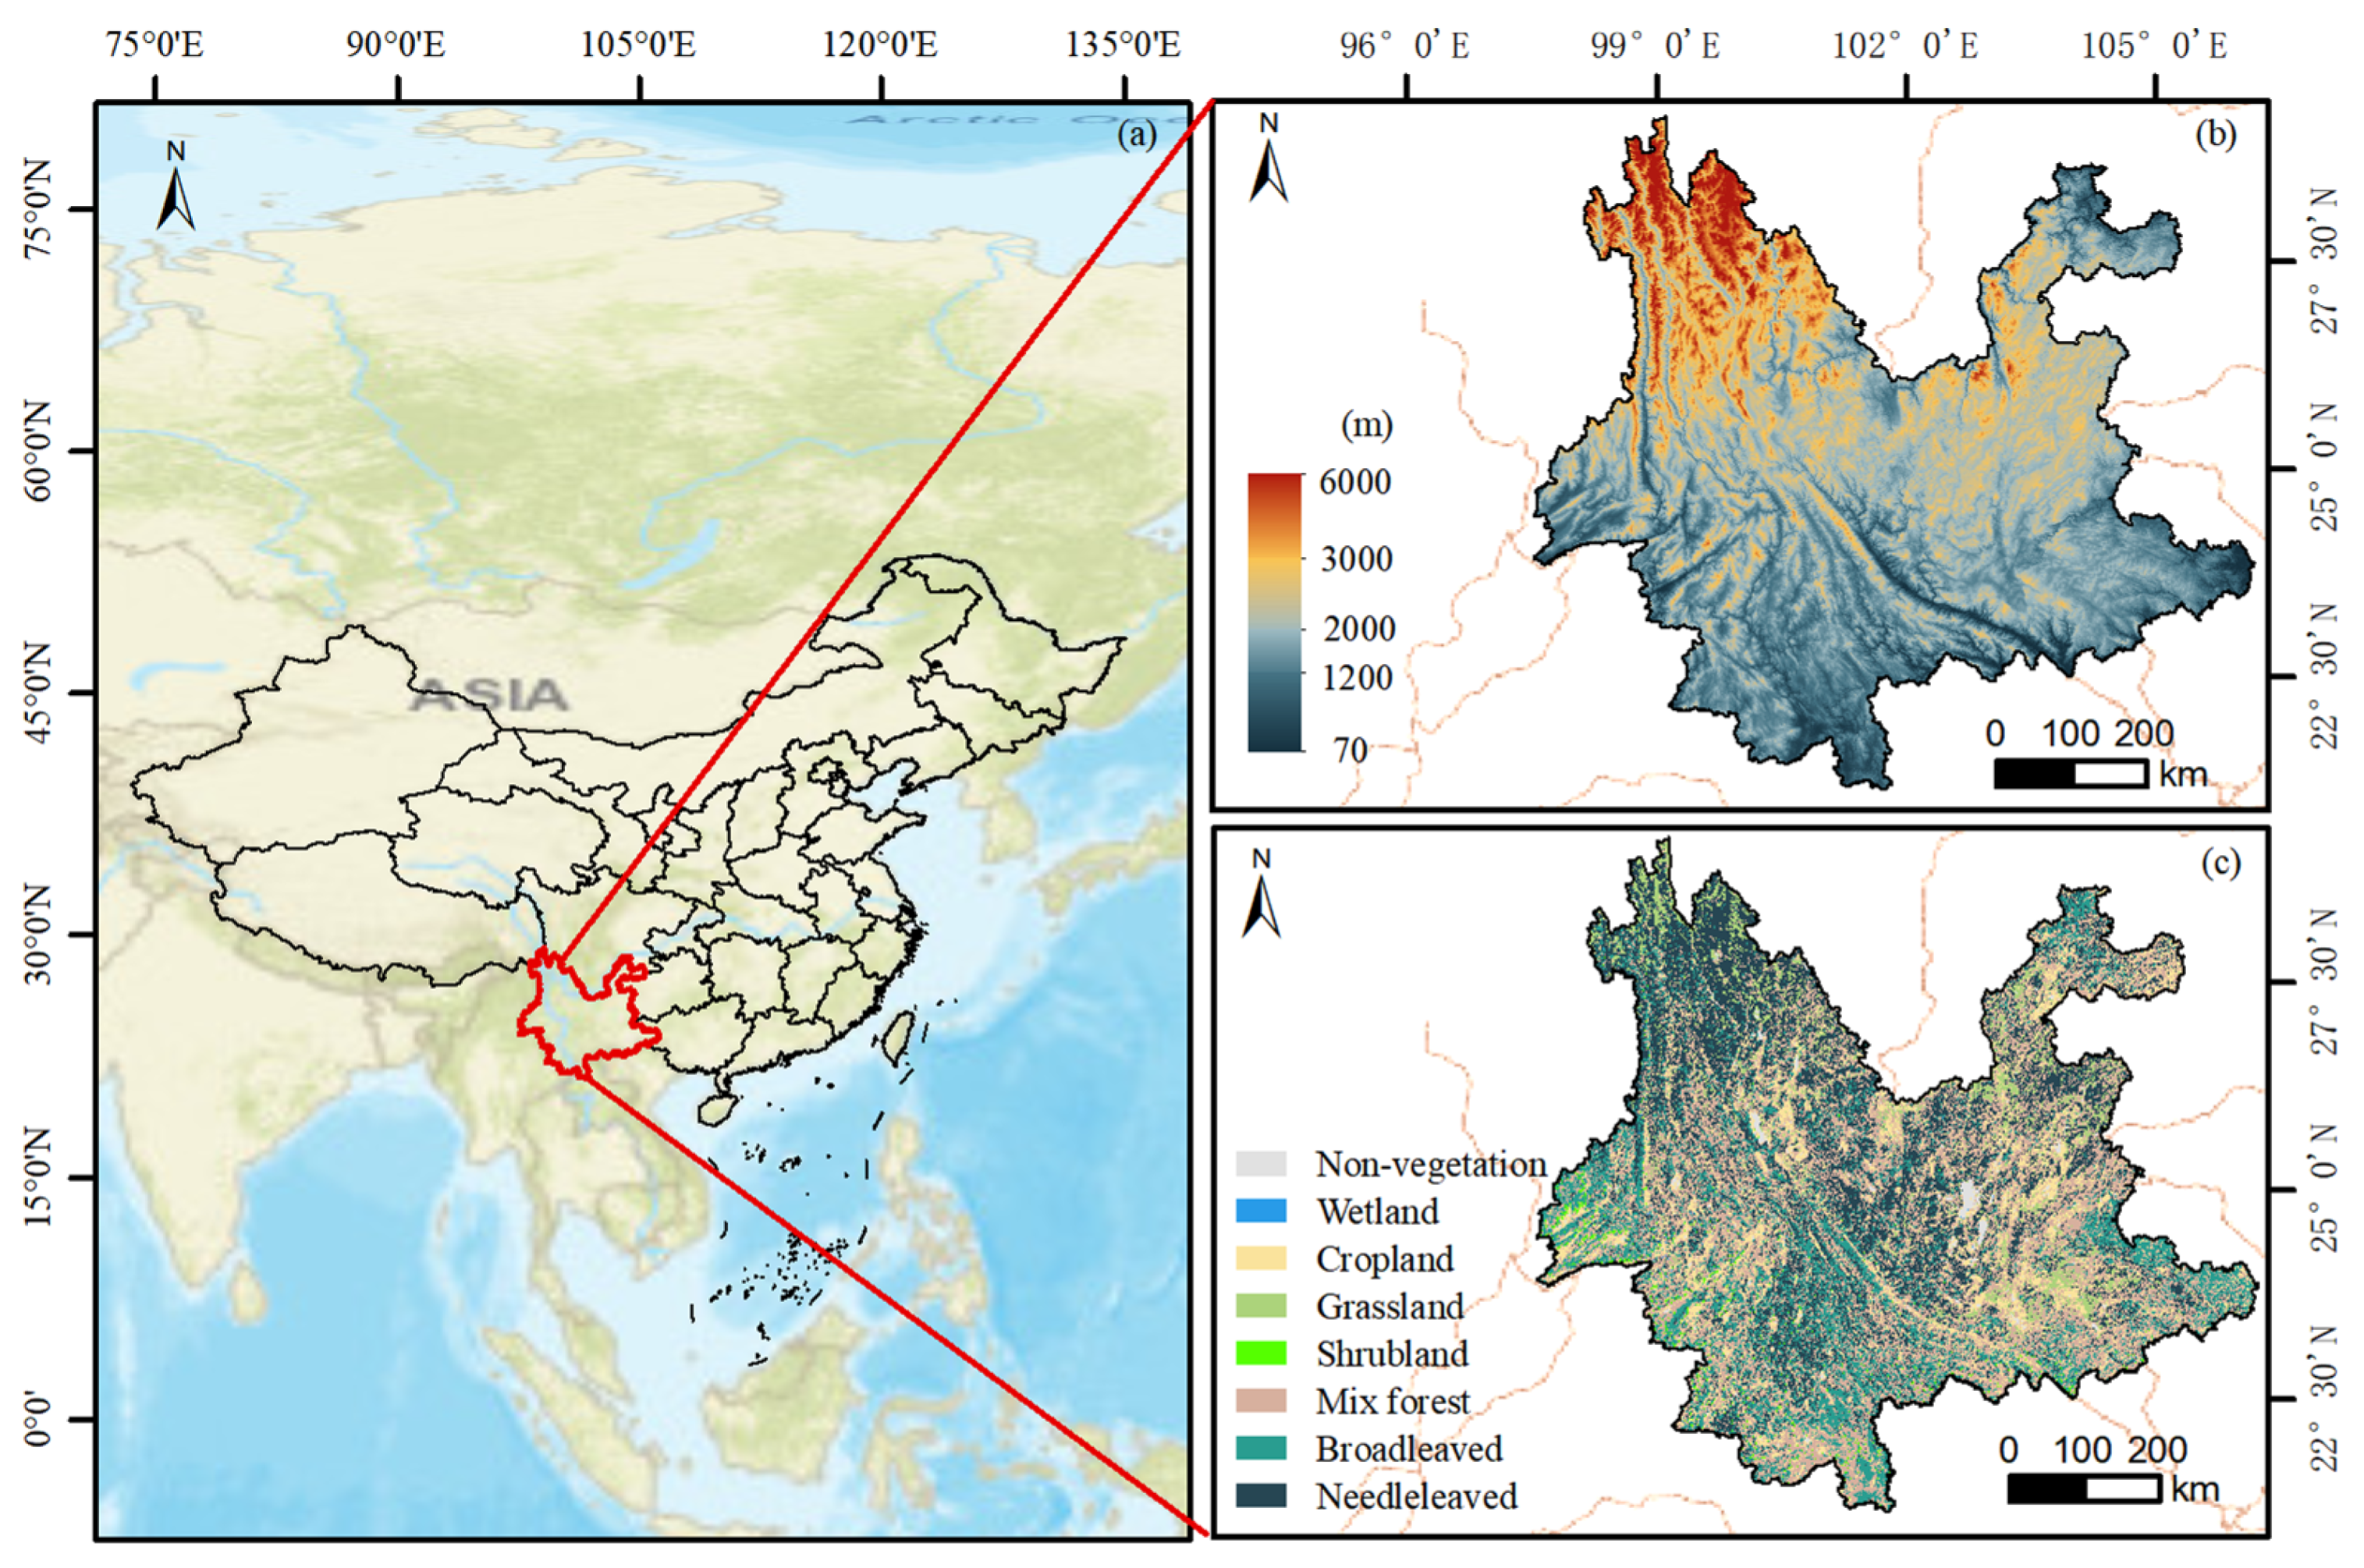
2.1. Study Area

Yunnan Province (21°8′–29°15′ N, 97°31′–106°11′ E, total area 39.4 × 10⁴ km2) is the ecological core and pivotal biogeographic corridor of Southwest China’s mountains (Figure 1) and is characterized by complex topography, diversified ecosystems, and distinctive microclimates. The terrain (Figure 1b) slopes from northwest to southeast, with an elevation range from 76 m in the southeastern lowlands to over 6700 m in the northwestern mountainous regions, yielding a stepped geomorphology dominated by mountains and plateaus [14]. The regional climate comprises tropical monsoons, subtropical monsoons, and alpine mountain climates [15]. The average annual temperature ranges from 15 to 18 °C, increasing from northwest to south. Seasonal thermal contrasts manifest in July (maxima 19–20 °C) versus January (minima 6–8 °C). Annual total precipitation is 1416 mm with marked spatiotemporal variability in Yunnan, and 75% of this precipitation occurs in the rainy wet season (May–September) [16,17].
The wide elevational gradient and climate heterogeneity work together to form rich habitat-types distribution, supporting diverse ecosystems, including tropical rainforests, subtropical evergreen forests, temperate forests, wetlands, grasslands, and alpine meadows [18]. The diversity and integrity of these ecosystem types makes Yunnan an important region for mountain ecosystems. The simplified classification is graphically clarified in Figure 1c. Land cover data (Figure 2) showed forest as the dominant vegetation type (>70% coverage), with broadleaved evergreen forests prevailing in southern lowlands (15%) and needleleaved evergreen forests in central/northwestern mountains (28%). These evergreen forests have increased significantly in thirty years. Mixed forests (29%) show transitional distribution and are more abundant in the southwest regions. Grasslands (5%) are more distributed in the northwestern alpine regions. Croplands (18%) are more distributed in the eastern basin. Shrubland declined markedly due to afforestation policies and natural succession. Scarce wetlands (<0.1%) cluster around plateau lakes like Dianchi. These dynamic vegetation baselines provide critical context for interpreting NPP variations in subsequent analyses.

2.2. NPP Modeling Methods

Among the carbon cycle models, process models integrate and formalize various physiological vegetation processes, generating simulation results that are based on a mechanistic understanding to a larger degree than other kinds of models [19]. The Boreal Ecosystem Productivity Simulator (BEPS) model employed in this study represents a robust process-based diagnostic framework [4,19]. The BSPS incorporates multiple vegetation parameters derived from remote sensing, including the leaf area index (LAI), canopy clumping index (CI), and land cover (LC) type, as well as meteorological and soil data [4]. It simulates photosynthesis, energy balance, and hydrological and soil biogeochemical processes at hourly time steps [19]. It also simulates the dynamics of carbon pools beyond GPP based on estimated autotrophic respiration (AR) and heterotrophic respiration [4,19]. Therefore, BEPS is suitable for ascribing land carbon sinks to various drivers, which has been extensively validated across diverse global ecosystems including boreal forests, temperate forests, tropical rainforests, grasslands, and temperate croplands [4,19,20]. For GPP simulation, BEPS uses the leaf-level biochemical model [21] with a two-leaf upscaling scheme from leaf to canopy. Then, NPP is calculated as the difference between Gross Primary Productivity (GPP) and autotrophic respiration [4,19]. In the model, the NPP of four vegetation carbon pools on hourly basis was updated using NPP allocation ratios and conversion rates set based on vegetation types. The main formulations for NPP calculation are
N P P = G P P R p l a n t
G P P = A s u n L A I s u n + A s h a d e d   L A I s h a d e d
L A I s u n = 2 cos 1 e x p ( 0.5 · C i · L A I / cos θ )
L A I s h a d e d = L A I L A I s u n
where Rplant is the autotrophic respiration rate, including growth respiration and maintenance respiration. Asun and Ashaded are the canopy photosynthetic rates of sun and shaded leaves calculated from the biochemical model. LAIsun and LAIshaded are the LAI of sun and shaded leaves. Ci is the canopy CI. θ is the sun zenith angle.
In this study, the model was executed over a duration spanning from 1990 to 2018 (high-quality driver datasets cover these years), conducting simulations at five-year intervals. Simulations utilized three hourly time steps and a 300 m spatial resolution. (The land cover dataset has a 300 m resolution. Other driver datasets were resampled to a 300 m resolution using the nearest-neighbor algorithm to match the resolution of land cover.)

2.3. Driving Data

This study integrated multi-source datasets for NPP modeling and driver attribution analysis. All datasets were resampled to 300 m for BEPS-based NPP estimation, followed by trend analysis, relative importance analysis, Geodetector-based spatial heterogeneity evaluation, and Elevation-dependent modeling (Figure 3).

2.3.1. LAI Data

LAI is a key input into the BEPS model. Two LAI time series, Reprocessed MODIS Version 6.1 and GLASS, were used in this study.
The reprocessed MODIS Version 6.1 LAI product was used as the basis for our simulations. Its LAI data were generated by reprocessing MODIS C6.1 LAI products using the updated integrated two-step method over the period from 2000 to 2018 [22]. The Reprocessed LAI dataset integrates updated algorithms and temporal smoothing to minimize noise, demonstrating superior accuracy over raw MODIS LAI products [22]. The LAI product created boasted an 8-day temporal resolution and a 500 m (15 s) spatial resolution, offers continuous and consistent data, ideal for land surface and climate modeling, characterized by strong temporal and spatial consistency [22].
The GLASS LAI product offered vital Supplementary Data for simulations spanning from 1990 to 2000 [23]. The LAI was calculated using General Regression Neural Networks (GRNNs) based on fused time-series reflectance data [23]. These GRNNs were meticulously trained on the combined time-series LAI values derived from both the MODIS and CYCLOPES LAI products [24], as well as the reprocessed reflectance data from MODIS/AVHRR [25]. Moreover, the spatial patterns generated by GLASS are reasonable and consistent with high-quality MODIS product. It has an 8-day temporal resolution and a 5 km spatial resolution [23].

2.3.2. CI Data

The vegetation CI is critical for simulating canopy radiation transfer of land-surface processes in the BEPS. It is used to determine the spatial distribution of vegetation canopy to optimize photosynthetic calculations [26]. Previous simulations usually did not consider the variation in CI and treated the CI for each vegetation type as a constant value. The CI data were sourced from the LIS-CI-A1 product, which provides a global long-time series dataset at daily temporal and 500 m spatial resolution, spanning 2001 to 2019 [27]. This dataset was generated using a bidirectional reflectance distribution function model alongside configurations of solar zenith angles [26,27]. Additionally, pre-2001 CI values were extrapolated from 2001 baselines due to the lack of alternative datasets.

2.3.3. LC and Meteorological Data

The LC dataset is a global annual land-cover map produced by the European Space Agency (ESA) at a 300 m spatial resolution, spanning 1992 to 2020 [28]. The classification is determined using the internationally recognized UN Land Cover Classification System (LCCS).
The plant types that drive the model are broadleaved evergreen trees, broadleaved deciduous trees, needleleaved evergreen trees, needleleaved deciduous trees, shrubland, grassland, cropland, mixed forests, and wetland. Original ESA CCI land cover classes were reclassified to align with the BEPS model input requirements based on dominant vegetation structure, canopy-cover thresholds, and ecological function. Specifically, mosaic vegetation cover was categorized as mixed forest. Croplands, complete forests, and shrublands retained their original classifications due to their structural distinctiveness. Grasslands included mosaic herbaceous vegetation with more than 50% herbaceous cover and sparse herbaceous areas. The vegetation type accompanied by flooding was classified as wetlands. Additionally, the LC data in 1990 actually used the data from 1992 due to the minimal changes in land use during the initial years.
The meteorological data for the BEPS model included hourly photosynthetically active radiation (PAR), temperatures, relative humidity, wind speed, and precipitation. These data of temperatures, relative humidity, wind speed, and precipitation were obtained from the CMFD dataset (3-hourly, 0.1° × 0.1°), which is a high spatiotemporal resolution gridded near-surface meteorological dataset developed specifically for studies of land-surface processes in China [29].
The PAR data were obtained from a high-resolution global gridded dataset (3-hourly, 10 km) utilizing an effective physical-based model [30]. Primary inputs included the latest International Satellite Cloud Climatology Project (ISCCP) H-series cloud products, MERRA-2 aerosol data, ERA5 surface routine variables, and albedo products from MODIS and CLARRA-2 [30].

2.3.4. Soil Data

Fractions of clay, silt, and sand were retrieved from a high-resolution (1 km × 1 km) China multi-layer soil particle-size distribution (i.e., sand, silt and clay content) dataset and were used to determine soil physical parameters, including wilting point, field capacity, porosity, hydrological conductance, exponent of the moisture release equation, and so on [31].
Two soil-moisture datasets, SMCI1.0 and CCI, were utilized in this study. SMCI1.0 served as the foundation for our simulations, providing a 1 km resolution long-term soil moisture dataset for China for the period 2000 to 2020 [32]. The CCI dataset offers key Supplementary Data in simulations work from 1990 to 2000 [33]. It is a global satellite soil moisture product with a 0.25° spatial resolution and daily temporal resolution [33].

2.3.5. Topographic Data

Topographic data are usually described by the digital elevation model (DEM). A public Copernicus DEM called GLO-30 was used to identify elevation in our study, which provides worldwide DEM at a 30 m resolution [34]. Slope gradient data were calculated from the DEM to quantify terrain steepness.

2.3.6. Nighttime Light Data

The nighttime light (NTL) data represent nighttime surface brightness and are a reliable indicator of human-activity intensity [35]. NTL data have been widely adopted in ecological studies as a proxy for human activities at regional and global scales in recent years [36,37]. The NTL data were sourced from the SVNL dataset, which provides global annual NPP-VIIRS-like nighttime light data from 1992 to 2023 with a spatial resolution of 15 arc-seconds (about 500 m) [35]. This dataset offers harmonized and continuous high-resolution nighttime light data by bridging DMSP-OLS (1992–2013) and NPP-VIIRS (2012–2023) through an innovative deep-learning approach using a Nighttime Light U-Net super-resolution network.

2.4. Driving Factor Evaluation

2.4.1. Trend Analysis

This study investigated the linear trends of NPP using generated long-term NPP products from the past three decades. The spatial patterns of temporal trends in NPP were computed using Theil-Sen Median linear regression for each grid cell. All trend calculations were performed in R (version 4.3.1; R Foundation for Statistical Computing, Vienna, Austria). The non-parametric Mann–Kendall trend test was applied to assess the significance of interannual NPP variability. The threshold for statistical significance was set at p < 0.05 to ensure the robust identification of meaningful trends.

2.4.2. Relative Importance Analysis

To quantify the contributions of various factors (including precipitation, temperature, PAR, CO2, LC, and human activities) to the changes in NPP within each grid cell, a relative importance analysis was conducted. In particular, the temperature and rainfall were the annual average, and PAR was the annual radiation content in the analysis. LC was represented in the analysis using the maximum carboxylation rate (Vcmax) specific to each vegetation type.
Our relative importance analysis decomposed the R2 of a multiple linear regression (NPP = b0  +  b1 × precipitation + b2 × temperature + b3 × PAR + b4 × CO2 + b5 × LC + b6 × NTL +  ε) [38], where ε represents other drivers that were not considered but which may contribute to NPP variation. The importance of each factor was quantified as its proportional contribution to the total explained variance (R2). Its algorithm was performed using the ‘relaimpo’ package in R, which is based on variance decomposition for multiple linear regression models [38]. Specifically, the ‘LMG’ method in the ‘relaimpo’ package was employed, a computationally intensive and widely used approach for relative importance analysis, which allows for the differentiation of contributions from correlated regressors in multiple linear regression and normalizes their sum to 1. Subsequently, the relative contribution of each factor was calculated for each grid cell, and the factor that made the greatest contribution to the NPP variation was identified as the dominant driver. These factors were standardized prior to the multiple regression analysis.

2.4.3. Geodetector Spatial Analysis

To quantify the contributions of various factors (including precipitation, temperature, PAR, CO2, LC, DEM, Slope, and human activities) to NPP spatial stratified heterogeneity, a spatial stratified heterogeneity analysis was conducted using the Geodetector tool. Specifically, the temperature and rainfall were the annual average, and PAR was the annual radiation content in analysis. LC was represented in analysis using Vcmax specific to each vegetation type. The Geodetector can measure and identity spatially stratified heterogeneity among data by effective spatial stratification minimizing intra-strata variance while maximizing inter-strata divergence [39]. Its algorithm was performed using the ‘GD’ package in R, which was specifically developed by the original author team of the Geodetector model. The two modules of Geodetector, namely factor and interaction detectors, were selected to explore the dominant drivers of spatial heterogeneity in regional NPP. Specifically, Factor detection was employed to identify the dominant drivers of NPP through variance decomposition, supplemented by interaction detection to elucidate synergistic effects between the covariates. The results were expressed as q-values, which can be used to measure the contribution of factors.

2.4.4. Elevation-Dependent Model

The elevation gradient has long been known to be vital in shaping the structure and function of terrestrial ecosystems. We developed an elevation-dependent model using the Logistic equation to quantify the non-linear response of NPP and elevation in Southwest China’s mountainous regions. The Logistic equation has been used to model many diverse biological population laws in resource-constrained ecosystems [38]:
N P P = K 1 + exp r h h 0
where K represents the maximum NPP, and r defines the rate of NPP change with elevation. h is the elevation. h0 indicates the inflection-point elevation corresponding to peak productivity. The model parameters K, r, and h0, were calculated through nonlinear least-squares fitting. Subsequently, the elevation-zoning method involved dividing the study area into 240 m vertical belts at 25 intervals, with NPP means calculated for each discrete elevation zone. Simultaneously, pixel-level NPP-elevation relationships were preserved for fine-scale assessment. The model performance was evaluated using the coefficient of determination (R2). Environmental gradients induce a significant reduction in ecosystem functional, potentially signaling ecological-regime shifts. In this study, we simply consider that a decline rate lower than the observed mean rate indicates a transition between phases.

3. Results

3.1. NPP Changes in the Past Three Decades

The simulation results at a 300 m resolution revealed a steady and significant increase in the NPP over the past three decades in Southwest China’s mountain ecosystems (Figure 4). The overall distribution of NPP in the study area was higher in the southern part than in the northern part, with the highest levels in the southwestern region and the lowest in the northwestern region (Figure 5). Specifically, NPP increased significantly from 634 ± 325 g C m−2 yr−1 in 1990 to 748 ± 348 g C m−2 yr−1 in 2018, with an increase rate of 4.17 g C m−2 yr−1. Concurrently, the annual total NPP increased from 252 Tg C yr−1 in 1990 to 296 Tg C yr −1 in 2018. Spatial variation revealed that the NPP showed a significant increasing trend in the study area, with an increase rate of 2 Tg C yr−1. The most rapid increases were observed in the eastern regions (exceeding 30 g C m−2 yr−1), while slower or even negative trends were recorded in the northwestern plateau regions, as well as in areas adjacent to the western and southern borders (Figure 6).

3.2. NPP Changes in Different Vegetation Types

The simulation results indicated that the NPP of grassland and wetland remained relatively stable, while other vegetation types showed a marked upward trend over the years (Figure 7a). Notably, wetland demonstrated a robust carbon sequestration capacity, with a multi-year average NPP of 1787 ± 11 g C m−2 yr−1, approximately 1.4 to 4.4 times higher than that of other vegetation types. Changes in NPP among other vegetation types are presented in descending order as follows (g C m−2 yr−1): shrubland increased from 1051 ± 237 to 1247 ± 202, cropland increased from 953 ± 355 to 1061 ± 340, broadleaved evergreen forest increased from 782 ± 211 to 966 ± 216, mixed forests increased from 662 ± 210 to 838 ± 238, broadleaved deciduous forest increased from 504 ± 129 to 611 ± 169, needleleaved evergreen forest increased from 359 ± 101 to 452 ± 137, and grassland changes were not significant, with a multi-year average NPP of 245 ± 17.
The simulation results revealed that the annual total NPP of broadleaved deciduous forests, grasslands, croplands, and wetlands remained relatively stable (Figure 7b). In contrast, the annual total NPP of shrublands decreased slightly, while other forest types showed an upward trend. Changes in annual total NPP among various vegetation types are presented in descending order as follows (Tg C yr−1): mixed forests increased from 78 to 95, cropland changes were not significant with 70, broadleaved evergreen forest increased from 41 to 57, needleleaved evergreen forest increased from 37 to 51, broadleaved deciduous forest and grassland did not show significance with 6.11 ± 0.39 and 6.26 ± 0.40, and shrubland decreased from 16 to 5. The annual total NPP of wetland, constrained by its limited spatial extent, was merely 0.24 ± 0.01 Tg C yr−1 (Figure 7b), which is significantly lower than that observed in other vegetation types. Meanwhile, the results indicated that mixed and evergreen forests (broadleaved and needleleaved evergreen forests) and cropland showed significantly higher annual total NPP than other vegetation types with strong NPP, primarily due to their extensive distribution (Figure 7). NPP in forest ecosystems has increased significantly since 2000, possibly as a result of enhanced forest-protection measures in China. Notably, the annual total NPP of shrublands exhibited a significant decline (p < 0.05) while NPP increased. This contrasting pattern suggested that the observed total NPP reduction may stem from a loss of shrubland coverage (Figure 2) rather than diminished productivity. The large-scale vegetation transition appears driven by the interacting factors of natural succession dynamics and regional afforestation policies.

3.3. The Attribution of NPP Interannual Changes

A relative importance algorithm was applied to attribute the interannual change in NPP during 1990 to 2018 to its drivers, elucidating dominant contributors to carbon-sink capacity in Southwest China’s mountains. Contributions of individual drivers were quantified per grid cell (Figure 8), and the factor exerting the greatest influence on interannual NPP variation was identified as the dominant driver (Figure 9). The results indicated that rising CO2 was a dominant driving factor for the enhanced NPP on Southwest China’s mountain scale. Additionally, the dominant drivers of NPP changes showed variation with latitude. Specifically, approximately 58% of the area experiencing variations in NPP was attributable to changes in atmospheric CO2 concentrations, followed by temperature changes (17%), precipitation changes (12%), PAR fluctuations (8%), and land-cover alterations (4%). Moreover, NTL showed negligible explanatory power (<1% areas), implying limited human-disturbance impacts on the NPP trend. CO2 was the primary driver of NPP changes in most regions. These factors were also the primary explanatory factors along the longitudinal and latitudinal gradient (Figure 9b,c). In higher latitudes, changes in NPP were predominantly influenced by temperature. As latitude decreased, CO2 became the dominant factor. Across longitudes, CO2 consistently appeared as the leading influence on variations in NPP. Nevertheless, temperature was observed to play a significant role in certain western regions of the study area, likely attributable to their high elevation. Our study results showed that temperature was the dominant factor driving changes in NPP in areas above 4800 m in Southwest China’s mountains (Figure 10).

3.4. The Attribution and Elevation Dependence of NPP Spatial Change

The Geodetector quantification revealed pronounced stratified heterogeneity in NPP drivers (Figure 11a), with LC emerging as the dominant contributor (q = 0.63), explaining 63% of spatial variance. The prominent contribution of LC indicated that the distribution of vegetation type in Southwest China’s mountains was important for NPP, which was consistent with our results emphasizing the high productivity of mixed forests. Topographic controls demonstrated secondary influence through elevation (q = 0.38) and slope gradient (q = 0.04), collectively accounting for 42% of the observed variability. Climatic parameters showed differential forcing, where temperature (q = 0.34) surpassed precipitation (q = 0.25) in modulation efficacy. CO2 explanatory power (q = 0.22) was close to precipitation, showing a relatively weak spatial control. Notably, NTL showed negligible explanatory power (q < 0.01), implying limited human-disturbance impacts on NPP patterns.
The interaction detector revealed nonlinear amplification effects surpassing individual factor impacts (Figure 11b), with land cover (LC) demonstrating synergistic dominance through coupling with DEM (qLC&DEM = 0.77), temperature (qLC&Tem = 0.79), and CO2 (qLC&co2 = 0.72). Notably, the amplified influence of elevation on temperature (QDEM&Tem = 0.44), precipitation (qDEM&Prec = 0.41), CO2 (qDEM&co2 = 0.41), and PAR (qDEM&PAR = 0.40) suggests heightened climatic sensitivity to elevational gradients.
We further analyzed the elevation-dependent pattern of NPP. Results showed a nonlinear negative elevation-dependent pattern between NPP and elevation across the studied elevation transect (0–5586 m). NPP showed an initial stability at lower elevations, followed by a progressive decline at a higher elevation (Figure 12). Complementing this nonlinear pattern, the elevation-dependent logistic model (Figure 12) initially captured threshold-driven NPP responses (R2 = 0.32, p < 0.001). Its predictive power showed significant enhancement (R2 = 0.99, p < 0.001) when validated with elevation-zoning-derived NPP means. This disparity highlights the role of fine-scale heterogeneity in masking macroscale trends, with aggregation resolving stochastic noise at local sampling resolutions. The logistic model further identified two inflection points (500 m and 3500 m) demarcating three distinct productivity regimes: (1) the saturation phase (<500 m) with negligible decay of NPP; (2) the transition phase (500–3500 m) comprising the linear depletion zone showing consistent losses with 29 g C m−2 yr−1 per 100 m of NPP loss; and (3) the collapse phase (>3500) continuously attenuating decay as NPP approaches an environmental carrying capacity minimum of 10.5 g C m−2 yr−1 per 100 m of NPP average loss. The mean NPP of saturation phase was 1180 g C m−2 yr−1, the NPP during the transition phase decreased from 1135 to 280 g C m−2 yr−1, and the mean NPP of the collapse phase was 140 g C m−2 yr−1.

4. Discussion

4.1. Enhanced NPP Induced by CO2 Fertilization and Climate Warming

As a key indicator of the terrestrial vegetation carbon-sink capacity, NPP is influenced by multiple drivers, particularly CO2 fertilization, climate change dominated by warming, and human-induced land cover [3,4]. Our study demonstrated that rising atmospheric CO2 was the dominant driving factor of NPP enhancement in Southwest China’s typical mountains, accounting for 58% of the observed variations regions during 1990–2018. This finding aligns with global studies emphasizing the significant role of CO2 in promoting vegetation growth [40,41]. The mechanism studies on global vegetation dynamics indicate that global-vegetation growth peaks are increasing with rising CO2 [3]. The evidence of satellite and ground-based data also point to an atmospheric CO2-induced increase in terrestrial photosynthesis [2,42]. The CO2 fertilization effect, characterized by increased vegetation photosynthetic activity under elevated CO2 levels, has been widely referenced and documented [41]. Long-term studies suggest that CO2 fertilization has enhanced global photosynthesis approximately 30% since 1990, contributing to a 20%–60% increase in gross primary production (GPP) [43,44].
In addition to CO2 fertilization, climate warming constitutes another significant driver of NPP increases [44], influencing 37% of the study-area variations. Temperature emerged as the dominant climatic factor, particularly in northwestern and west-central Yunnan, which are topographically complex transition zones between the Hengduan and Ailao mountain systems. The region exhibits substantial topographic variation, which leads to significant microclimatic heterogeneity. This spatial pattern supports our finding that temperature gradients play a critical role in regulating vegetation productivity in mountainous regions. Notably, temperature emerged as the dominant driver of NPP enhancement in high-elevation areas, likely due to the vegetation’s heightened sensitivity to temperature fluctuations in these regions. Similarly, previous research has shown that increased summer temperatures enhance alpine vegetation respiration, thereby reducing productivity and also increasing evapotranspiration and drought risk [45].
These findings highlight the synergistic effects of CO2 fertilization and climate warming on terrestrial carbon sequestration. The potential for CO2 absorption in Southwest China’s mountains may be greater than previously estimated, particularly given the additional growth benefits induced by these factors. However, critical knowledge gaps remain regarding the potential saturation of the CO2 fertilization effect and the long-term impacts of climate change on vegetation productivity, warranting further investigation.

4.2. Vegetation-Specific NPP Enhancement and Biodiversity Synergy

Our Geodetector analysis revealed a hierarchical control system governing NPP spatial heterogeneity in Southwest China’s mountain ecosystems, where biogeographic factors dominate over climatic and anthropogenic influences. The LC demonstrated the highest explanatory power for NPP variability contrasts with prevailing mountain studies that prioritize altitudinal gradients and climatic drivers as primary regulators of productivity dynamics [11,46]. CO2 emerged as a secondary determinant of NPP spatial heterogeneity, despite its established dominance in driving interannual productivity variations. The unexpectedly weak anthropogenic signal contrasts with lowland agricultural systems, suggesting these high-elevation ecosystems retain functional integrity despite peripheral urbanization. This dominance likely stems from the diverse vegetation types and their superior biodiversity in the core area of Southwest China’s mountains, particularly evident in our observed high-productivity ecotones [47]. Among the vegetation types, wetlands showed the highest NPP. This finding is consistent with previous studies highlighting the robust carbon-sink potential of wetland ecosystems [48]. Shrublands, croplands, broadleaved evergreen forests, and mixed forests also demonstrated strong carbon sequestration capacities. Grasslands and wetlands exhibited relatively stable NPP over time. This pattern likely reflects the dominance of herbaceous vegetation, which has short life cycles and which recovers quickly from disturbances. Forests primarily store carbon in long-lived woody biomass. In contrast, grasslands and wetlands sequester carbon mainly in the soil. This occurs through continuous root turnover in grasslands and peat accumulation in wetlands. The observed stability in NPP does not indicate a low carbon sequestration sink. Instead, it suggests a consistent contribution to belowground long-term carbon storage. The NPP values of Southwest China’s mountain vegetation exceeds the national average, highlighting its unique ecological status in regional carbon cycling [49]. This dominance may be attributed to biodiversity and the warm climate of Southwest China’s typical mountains, where multi-layered canopies and extended growing seasons enhance productivity. The annual total NPP of shrubland exhibited a significant decline due to a 60% loss of area, although NPP increased. Large-scale vegetation transition appears driven by interacting factors of natural succession dynamics and regional afforestation policies. This shows that policy-driven land cover changes can override climatic effects on productivity. Future studies should prioritize disentangling the synergistic and antagonistic interactions between climate variability and anthropogenic land-use regimes.
Notably, mixed forests showed a high annual total NPP, which may be attributed to their large distribution area and rich biodiversity. Global studies on the biodiversity–ecosystem functioning relationship suggest that ecosystems with higher species diversity tend to produce more biomass due to complementarity effects (niche differentiation among species) [50,51]. Global and regional observational studies have consistently documented the positive effect of biodiversity on ecosystem productivity [52], and our results further support this trend.

4.3. Elevation-Dependence of NPP Spatial Patterns

The nonlinear amplification of driver interactions challenges the conventional additive models of ecosystem productivity [46]. The LC and DEM synergy unveils a topographic mediation mechanism: elevation gradients create microhabitats that amplify vegetation-type effects through thermal stratification and hydrological partitioning. This coupling explains why single climatic factors show weaker individual impacts compared to their synergistic capacities, which underscores a crucial limitation in current climate modeling frameworks that fail to account for terrain–climate–vegetation coupling mechanisms.
Traditional studies have reported a linear negative elevation-dependent pattern between NPP and elevation [11]. However, our high-resolution analysis reveals a more complex, nonlinear relationship that follows an elevation-dependent model of NPP based on the Logistic equation. This logistic model identifies two critical inflection points (500 m and 3500 m) that partition the elevational gradient into three distinct productivity regimes: (1) the saturation phase suggests that low-elevation ecosystems operate near their biophysical optimum, where environmental conditions are sufficient to maintain stable productivity despite elevational change; (2) the transition phase aligns more closely with traditional linear relation, reflecting a consistent decline in NPP with increasing elevation; and (3) in the collapse phase, the attenuation of NPP loss rates indicates that productivity declines are slower than the linear relationship. This deceleration reflects the adaptability of high-elevation species to resource-limited environments [53]. Linear models neglecting these adaptations may underestimate high-elevation ecosystems’ carbon-sequestration potential. These findings highlighted the transition phase as a climate-sensitive vulnerability zone and high-elevation ecosystems as potential refugia, emphasizing the need for elevation-specific conservation strategies to sustain mountain carbon sinks under global change.
To mitigate topographic heterogeneity and observe large-scale elevational adaptation, elevation was stratified into 240 m vertical intervals with NPP means calculated for each zone. While pixel-level analysis captured fine-scale variability (R2 = 0.32), it also introduced noise from microtopographic effects. The zonal average filtered out these localized perturbations, allowing the logistic model to explain the variation of NPP in the elevation gradient with greater fidelity (R2 = 0.99). The analysis results showed that elevational binning improved fit goodness in modeling the NPP-elevation relationship, which underscored the importance of appropriate spatial aggregation in interpreting elevational patterns in NPP.

4.4. Implications for Carbon-Sink Management and Climate Policy

The significant increase in NPP observed in Southwest China’s typical mountains over the past three decades holds critical implications for mitigating global warming, particularly under continued CO2 fertilization and climate warming. The sustainability of this warming mitigation potential hinges on the interplay of land-use practices, climate-change mitigation efforts, and long-term ecosystem adaptability. The sustained carbon-sink trend is also closely tied to long-term ecological policies. Since the late 1990s, initiatives such as the Natural Forest Protection Program and the Grain-to-Green Program have driven large-scale reforestation [54]. The widespread establishment of nature reserves with zoned management has safeguarded key ecosystems in the southwest mountains [55]. Forest management has been proven to be a critical lever for enhancing sequestration, especially in aging or space-limited mountain forests [56]. In recent years, emerging carbon-trading schemes are also incentivizing forest carbon retention in Yunnan regions [57]. These efforts have also improved biodiversity in western China, highlighting the dual benefits of integrated conservation strategies [58]. To enhance mountains’ carbon-sink capacity, conservation and restoration efforts should prioritize high-productivity ecosystems, particularly forests and wetlands. Evergreen forests (including broadleaved, needle leaved, and evergreen mixed types) constitute the primary carbon sink in Southwest China’s typical mountains, accounting for the majority of the annual total NPP. They are well-adapted to the region’s warm climate, which supports year-round photosynthetic activity. Conservation efforts should focus on protecting existing evergreen forests from logging and fragmentation, while forestation efforts should prioritize the establishment of biodiversity-rich mixed forests. Mixed forests that integrate different native species can replicate the ecological benefits of natural ecosystems to enhance the forestation effect [52,59]. These suggest that forestation at the right time with the right species can generate persistent carbon benefits in China [60].
Wetlands showed the highest per-unit-area carbon sink among all vegetation types although their spatial extent was limited. The protection and restoration of Yunnan’s wetlands, especially the nine major plateau lakes, should be a priority in the core area of Southwest China’s mountains. Key measures include reestablishing native wetland vegetation, implementing dynamic hydrological management, and adopting sustainable land-use practices to prevent further degradation [61,62].
Broader policy measures are also important to enhance carbon-sink potential. Specific measures include expanding protected areas to cover carbon-rich ecosystems, promoting sustainable land-use practices to minimize emissions, and establishing long-term monitoring programs to track carbon sinks and stock changes. These measures can enhance carbon sinks and mitigate climate change, supporting international goals for sustainable development.

5. Conclusions

This study revealed the spatiotemporal dynamics and driving mechanisms of NPP in Southwest China’s mountain ecosystems over the past three decades using a high-resolution modeling framework integrated with relative importance analysis, Geodetector, and elevation-dependent modeling. These findings established a comprehensive framework for the spatiotemporal analysis of driving mechanisms and enhanced the understanding of NPP dynamics in complex mountain ecosystems, informing sustainable management priorities in mountain regions. The key conclusions are summarized as follows:
(1)
NPP in the study area showed a significant increase, rising from 634 ± 325 to 748 ± 348 g C m−2 yr−1 (mean rate 4 g C m−2 yr−1), while the annual total NPP surged from 252 to 296 Tg C yr−1 (mean rate 2 Tg C yr−1). Spatially, the most rapid increases occurred in the eastern regions, contrasting with slower or negative trends in the northwestern plateau and peripheral western/southern border areas;
(2)
Rising CO2 (dominating 58% regions) and climate warming (dominating 17% regions) drove interannual NPP growth, with elevation thresholds dictating driver dominance. The CO2 governed low elevation, while temperature controlled higher elevation (>4800 m);
(3)
Our elevation-dependent model revealed a more complex, nonlinear relationship between NPP and elevation, refining traditional linear studies. Three distinct phases were identified by the nonlinear model: the saturation phase (<500 m) with stable NPP; the transition phase (500–3500 m) with linear decline (NPP loss of 29 g C m⁻2 yr⁻1 per 100 m); and the collapse phase (>3500 m) with continuously attenuated NPP losses reflecting high-elevation vegetation adaptation to extreme conditions;
(4)
The Geodetector analysis revealed that land cover dominated NPP spatial heterogeneity. Land cover synergistically amplified its influence through interactions with elevation and temperature, highlighting a vegetation–climate–topography coupling mechanism that critically shapes productivity patterns. Biodiversity-rich widespread mixed forests underpinned the region’s high productivity. Conservation programs should focus on protecting existing evergreen forests from logging and fragmentation, while forestation efforts should prioritize the establishment of biodiversity-rich mixed forests.

Author Contributions

Conceptualization, Y.L. (Yang Li), S.Z., Y.H. (Yongping Hou) and L.Y.; Data curation, S.Z. and Y.L. (Ying Liu); Formal analysis, Y.L. (Yang Li) and B.Q.; Investigation, S.Z., B.Q., Y.L. (Ying Liu) and C.W.; Methodology, Y.L. (Yang Li), L.Y., Y.H. (Yuekai Hu), Y.L. (Yuanyuan Liu), Y.L. (Ying Liu), C.Y. and Y.S.; Project administration, Y.H. (Yongping Hou), Y.L. (Yuanyuan Liu) and C.Y.; Resources, L.Y. and H.C.; Software, Y.L. (Yang Li), C.Y. and C.W.; Supervision, Y.H. (Yongping Hou), L.Y. and Y.L. (Yuanyuan Liu); Validation, S.Z. and C.Y.; Writing—original draft, Y.L. (Yang Li) and S.Z.; Writing—review & editing, Y.L. (Yang Li), C.C., (Yuekai Hu), L.Y., H.C. and Y.S. All authors have read and agreed to the published version of the manuscript.

Funding

This work was supported by the National Natural Science Foundation of China (42141016), the Scientific Research Project of PowerChina (DJ-ZDXM-2023-29), the Science and Technology Talents and Platform Plan: Technology Innovation Cente of Yunnan Province for Digital Water Engineering (202305AK340003), and the Scientific Research Project of Shanghai & Technology Commission (22DZ1202700). YY. Liu is supported by the Yunnan Founding Program for Excellent Talent. HB. C. is supported by the Jiangsu Founding Program for Excellent Postdoctoral Talent. C. W. is supported by the Youth Talent Program of Yunnan Ten-thousand Talents Program (YNWR-QNBJ-2020-099).

Data Availability Statement

The Reprocessed MODIS LAI data are available from http://globalchange.bnu.edu.cn/research/laiv6 (accessed on 7 May 2025). The GLASS LAI data are available from https://www.glass.hku.hk/download.html (accessed on 7 May 2025). The canopy clumping data are available from https://doi.pangaea.de/10.1594/PANGAEA.884994 (accessed on 7 May 2025). The land cover data are available from https://www.esa-landcover-cci.org (accessed on 7 May 2025). The meteorological data are available from https://data.tpdc.ac.cn/en/data/8028b944-daaa-4511-8769-965612652c49 (accessed on 7 May 2025). The soil particle data are available from http://globalchange.bnu.edu.cn/research/soilw (accessed on 7 May 2025). The soil moisture data are available from https://www.tpdc.ac.cn/home (accessed on 7 May 2025). The DEM data are available from https://doi.org/10.5270/ESA-c5d3d65 (accessed on 7 May 2025). The nighttime light data are available from https://doi.org/10.6084/m9.figshare.22262545.v8 (accessed on 7 May 2025). The data generated in this study can be obtained from the corresponding author.

Acknowledgments

We thank the members of PowerChina Kunming Engineering Corporation Limited and the State Key Laboratory of Estuarine and Coastal Research (SKLEC) for their help in NPP simulation work.

Conflicts of Interest

Authors Yang Li, Shaokun Zhou, Yongping Hou, Yuanyuan Liu, Bintian Qian, Ying Liu and Chuhui Yang were employed by the company PowerChina Kunming Engineering Corporation Limited. The remaining authors declare that the research was conducted in the absence of any commercial or financial relationships that could be construed as a potential conflict of interest.

Abbreviations

The following abbreviations are used in this manuscript:
NPPNet Primary Productivity
GPPGross Primary Productivity
BEPSBoreal Ecosystem Productivity Simulator
LAILeaf area index
CICanopy clumping index
PARPhotosynthetically active radiation
LCLand cover
NTLNighttime light
DEMDigital elevation models
LCCSLand Cover Classification System
GRNNsGeneral Regression Neural Networks
ESAEuropean Space Agency

References

  1. Pan, S.F.; Tian, H.Q.; Dangal, S.R.S.; Ouyang, Z.Y.; Tao, B.; Ren, W.; Lu, C.Q.; Running, S. Modeling and Monitoring Terrestrial Primary Production in a Changing Global Environment: Toward a Multiscale Synthesis of Observation and Simulation. Adv. Meteorol. 2014, 2014, 965936. [Google Scholar] [CrossRef]
  2. Sha, Z.Y.; Bai, Y.F.; Li, R.R.; Lan, H.; Zhang, X.L.; Li, J.; Liu, X.F.; Chang, S.J.; Xie, Y.C. The global carbon sink potential of terrestrial vegetation can be increased substantially by optimal land management. Commun. Earth Environ. 2022, 3, 8. [Google Scholar] [CrossRef]
  3. Huang, K.; Xia, J.Y.; Wang, Y.P.; Ahlström, A.; Chen, J.; Cook, R.B.; Cui, E.; Fang, Y.Y.; Fisher, J.B.; Huntzinger, D.N.; et al. Enhanced peak growth of global vegetation and its key mechanisms. Nat. Ecol. Evol. 2018, 2, 1897–1905. [Google Scholar] [CrossRef]
  4. Chen, J.M.; Ju, W.M.; Ciais, P.; Viovy, N.; Liu, R.G.; Liu, Y.; Lu, X.H. Vegetation structural change since 1981 significantly enhanced the terrestrial carbon sink. Nat. Commun. 2019, 10, 4259. [Google Scholar] [CrossRef]
  5. He, N.P.; Yan, P.; Liu, C.C.; Xu, L.; Li, M.X.; Van Meerbeek, K.; Zhou, G.; Zhou, G.; Liu, S.O.; Zhou, X.H.; et al. Predicting ecosystem productivity based on plant community traits. Trends Plant Sci. 2023, 28, 43–53. [Google Scholar] [CrossRef]
  6. Zhu, Z.C.; Piao, S.L.; Myneni, R.B.; Huang, M.T.; Zeng, Z.H.; Canadell, J.G.; Ciais, P.; Sitch, S.; Friedlingstein, P.; Arneth, A.; et al. Greening of the Earth and its drivers. Nat. Clim. Change 2016, 6, 791–795. [Google Scholar] [CrossRef]
  7. Piao, S.L.; Liu, Q.; Chen, A.P.; Janssens, I.A.; Fu, Y.S.; Dai, J.H.; Liu, L.L.; Lian, X.; Shen, M.G.; Zhu, X.L. Plant phenology and global climate change: Current progresses and challenges. Glob. Change Biol. 2019, 25, 1922–1940. [Google Scholar] [CrossRef]
  8. Zhu, P.F.; Liu, G.; He, J. Spatio-temporal variation and impacting factors of NPP from 2001 to 2020 in Sanjiangyuan region, China: A deep neural network-based quantitative estimation approach. Ecol. Inform. 2023, 78, 102345. [Google Scholar] [CrossRef]
  9. Perry, D.A.; Oetter, D.R. Thirty years of forest productivity in a mountainous landscape: The Yin and Yang of topography. Ecosphere 2024, 15, e4865. [Google Scholar] [CrossRef]
  10. Wen, A.B.; Tang, Q.; Ouyang, C.J.; Zhu, B.; Wang, Y.K.; Li, A.N.; Li, S.; Zhu, W.Z.; Liu, L.J. Mountain Protection and Mountain Development in China: Review and Prospect. Bull. Chin. Acad. Sci. 2023, 38, 376–384. [Google Scholar]
  11. Wei, D.; Tao, J.; Wang, Z.; Zhao, H.; Zhao, W.; Wang, X. Elevation-dependent pattern of net CO2 uptake across China. Nat. Commun. 2024, 15, 2489. [Google Scholar] [CrossRef] [PubMed]
  12. Qian, L.; Chen, J.; Deng, T.; Sun, H. Plant diversity in Yunnan: Current status and future directions. Plant Divers. 2020, 42, 281–291. [Google Scholar] [CrossRef] [PubMed]
  13. Sun, Q.L.; Feng, X.F.; Ge, Y.; Li, B.L. Topographical effects of climate data and their impacts on the estimation of net primary productivity in complex terrain: A case study in Wuling mountainous area, China. Ecol. Inform. 2015, 27, 44–54. [Google Scholar]
  14. Sun, T.; Tong, W.J.; Chang, N.J.; Deng, A.X.; Lin, Z.L.; Feng, X.B.; Li, J.Y.; Song, Z.W. Estimation of soil organic carbon stock and its controlling factors in cropland of Yunnan Province, China. J. Integr. Agric. 2022, 21, 1475–1487. [Google Scholar] [CrossRef]
  15. Bi, C.Y.; Yang, K.; Zhang, S.H.; Zeng, W.X.; Liu, J.; Rao, Y.; Ma, Y.; Yang, X.F. Simulation and analysis of afforestation potential areas under different development scenarios in Yunnan Province, China. Ecol. Indic. 2024, 167, 112695. [Google Scholar] [CrossRef]
  16. Chen, X.; Zhang, Y.P. Impacts of climate, phenology, elevation and their interactions on the net primary productivity of vegetation in Yunnan, China under global warming. Ecol. Indic. 2023, 154, 110533. [Google Scholar] [CrossRef]
  17. Fang, Y.; Wan, L.; Tong, J.; Li, G.J.; Pang, J.; Chang, E.; Chen, L.L.; Shi, Z.X. Hydrothermal conditions dominated sensitivity and lag effect of grassland productivity in Yunnan Province, China: Implications for climate change. Agric. Water Manag. 2025, 308, 109293. [Google Scholar] [CrossRef]
  18. Ye, H.; Bai, D.; Wang, J.L.; Tan, S.C.; Liu, S.Y.; Wu, X.P. Landscape ecological risk assessment study of the Yunnan section of the Tropic of Cancer. Ecol. Indic. 2024, 158, 111517. [Google Scholar]
  19. Xing, X.; Wu, M.; Zhu, H.; Duan, W.; Ju, W.; Wang, X.; Ran, Y.; Zhang, Y.; Jiang, F. Optimized Gross Primary Productivity Over the Croplands Within the BEPS Particle Filtering Data Assimilation System (BEPS_PF v1.0). J. Adv. Model. Earth Syst. 2025, 17, e2024MS004412. [Google Scholar]
  20. Xu, M.; Chen, J.M.; Liu, Y.; Wang, R.; Shang, R.; Leng, J.; Shu, L.; Liu, J.; Liu, R.; Liu, Y.; et al. Comparative assessment of leaf photosynthetic capacity datasets for estimating terrestrial gross primary productivity. Sci. Total Environ. 2024, 926, 171400. [Google Scholar] [CrossRef]
  21. Farquhar, G.D.; von Caemmerer, S.; Berry, J.A. A biochemical model of photosynthetic CO2 assimilation in leaves of C3 species. Planta 1980, 149, 78–90. [Google Scholar] [CrossRef]
  22. Lin, W.Y.; Yuan, H.; Dong, W.Z.; Zhang, S.P.; Liu, S.F.; Wei, N.; Lu, X.J.; Wei, Z.W.; Hu, Y.; Dai, Y.J. Reprocessed MODIS Version 6.1 Leaf Area Index Dataset and Its Evaluation for Land Surface and Climate Modeling. Remote Sens. 2023, 15, 2072–4292. [Google Scholar] [CrossRef]
  23. Liang, S.L.; Cheng, J.; Jia, K.; Jiang, B.; Liu, Q.; Xiao, Z.Q.; Yao, Y.J.; Yuan, W.P.; Zhang, X.T.; Zhao, X.; et al. The Global Land Surface Satellite (GLASS) Product Suite. Bull. Amer. Meteorol. Soc. 2021, 102, E323–E337. [Google Scholar] [CrossRef]
  24. Baret, F.; Hagolle, O.; Geiger, B.; Bicheron, P.; Miras, B.; Huc, M.; Berthelot, B.; Niño, F.; Weiss, M.; Samain, O.; et al. LAI, fAPAR and fCover CYCLOPES global products derived from VEGETATION: Part 1: Principles of the algorithm. Remote Sens. Environ. 2007, 110, 275–286. [Google Scholar] [CrossRef]
  25. Jia, K.; Yang, L.Q.; Liang, S.; Xiao, Z.Q.; Zhao, X.; Yao, Y.; Zhang, X.; Jiang, B.; Liu, D. Long-Term Global Land Surface Satellite (GLASS) Fractional Vegetation Cover Product Derived from MODIS and AVHRR Data. IEEE J. Sel. Top. Appl. Earth Observ. Remote Sens. 2019, 12, 508–518. [Google Scholar] [CrossRef]
  26. Wei, S.S.; Fang, H.L. Estimation of canopy clumping index from MISR and MODIS sensors using the normalized difference hotspot and darkspot (NDHD) method: The influence of BRDF models and solar zenith angle. Remote Sens. Environ. 2016, 187, 476–491. [Google Scholar] [CrossRef]
  27. Wei, S.S.; Fang, H.L.; Schaaf, C.B.; He, L.M.; Chen, J.M. Global 500 m clumping index product derived from MODIS BRDF data (2001–2017). Remote Sens. Environ. 2019, 232, 111296. [Google Scholar] [CrossRef]
  28. ESA. Land Cover CCI Product User Guide Version 2. Tech. Rep. 2017. Available online: https://maps.elie.ucl.ac.be/CCI/viewer/download/ESACCI-LC-Ph2-PUGv2_2.0.pdf (accessed on 7 May 2025).
  29. He, J.; Yang, K.; Tang, W.J.; Lu, H.; Qin, J.; Chen, Y.Y.; Li, X. The first high-resolution meteorological forcing dataset for land process studies over China. Sci. Data 2020, 7, 25. [Google Scholar] [CrossRef]
  30. Tang, W.; Qin, J.; Yang, K.; Jiang, Y.; Pan, W. Mapping long-term and high-resolution global gridded photosynthetically active radiation using the ISCCP H-series cloud product and reanalysis data. Earth Syst. Sci. Data 2022, 14, 2007–2019. [Google Scholar] [CrossRef]
  31. Shangguan, W.; Dai, Y.J.; Liu, B.Y.; Ye, A.Z.; Yuan, H. A soil particle-size distribution dataset for regional land and climate modelling in China. Geoderma 2012, 171–172, 85–91. [Google Scholar] [CrossRef]
  32. Li, Q.; Shi, G.; Shangguan, W.; Nourani, V.; Li, J.; Li, L.; Huang, F.; Zhang, Y.; Wang, C.; Wang, D.; et al. A 1 km daily soil moisture dataset over China using in situ measurement and machine learning. Earth Syst. Sci. Data 2022, 14, 5267–5286. [Google Scholar] [CrossRef]
  33. Hu, Y.F.; Wang, G.J.; Wei, X.K.; Zhou, F.H.; Kattel, G.; Amankwah, S.O.Y.; Hagan, D.F.T.; Duan, Z. Reconstructing long-term global satellite-based soil moisture data using deep learning method. Front. Earth Sci. 2023, 11, 1130853. [Google Scholar] [CrossRef]
  34. ESA. Copernicus DEM-Global and European Digital Elevation Model. Eur. Space Agency 2019. [CrossRef]
  35. Chen, X.; Wang, Z.; Zhang, F.; Shen, G.; Chen, Q. A global annual simulated VIIRS nighttime light dataset from 1992 to 2023. Sci. Data 2024, 11, 1380. [Google Scholar] [CrossRef] [PubMed]
  36. Zhou, L.; Dong, Q.; Pan, Y.; Yang, F.; He, M.; Huang, X.; Xu, J. Spatiotemporal variations and driving forces of regional-scale NPP based on a multi-method integration: A case study in the Beibu Gulf Economic Zone. Ecol. Indic. 2025, 174, 113453. [Google Scholar] [CrossRef]
  37. Yang, S.; Yang, X.; Gao, X.; Zhang, J. Spatial and temporal distribution characteristics of carbon emissions and their drivers in shrinking cities in China: Empirical evidence based on the NPP/VIIRS nighttime lighting index. J. Environ. Manag. 2022, 322, 116082. [Google Scholar] [CrossRef]
  38. Groemping, U. Relative Importance for Linear Regression in R: The Package relaimpo. J. Stat. Softw. 2006, 17, 1–27. [Google Scholar]
  39. Ren, D.F.; Cao, A.H. Analysis of the heterogeneity of landscape risk evolution and driving factors based on a combined GeoDa and Geodetector model. Ecol. Indic. 2022, 144, 109568. [Google Scholar] [CrossRef]
  40. Forkel, M.; Carvalhais, N.; Rödenbeck, C.; Keeling, R.; Heimann, M.; Thonicke, K.; Zaehle, S.; Reichstein, M. Enhanced seasonal CO2 exchange caused by amplified plant productivity in northern ecosystems. Science 2016, 351, 696–699. [Google Scholar] [CrossRef]
  41. Wang, S.H.; Zhang, Y.G.; Ju, W.M.; Chen, J.M.; Ciais, P.; Cescatti, A.; Sardans, J.; Janssens, I.A.; Wu, M.S.; Berry, J.A.; et al. Recent global decline of CO2 fertilization effects on vegetation photosynthesis. Science 2020, 370, 1295–1300. [Google Scholar] [CrossRef]
  42. Piao, S.L.; Yin, G.D.; Tan, J.G.; Cheng, L.; Huang, M.T.; Li, Y.; Liu, R.G.; Mao, J.F.; Myneni, R.B.; Peng, S.S.; et al. Detection and attribution of vegetation greening trend in China over the last 30 years. Glob. Change Biol. 2015, 21, 1601–1609. [Google Scholar] [CrossRef]
  43. Wenzel, S.; Cox, P.M.; Eyring, V.; Friedlingstein, P. Projected land photosynthesis constrained by changes in the seasonal cycle of atmospheric CO2. Nature 2016, 538, 499–501. [Google Scholar] [CrossRef] [PubMed]
  44. Haverd, V.; Smith, B.; Canadell, J.G.; Cuntz, M.; Mikaloff-Fletcher, S.; Farquhar, G.; Woodgate, W.; Briggs, P.R.; Trudinger, C.M. Higher than expected CO2 fertilization inferred from leaf to global observations. Glob. Change Biol. 2020, 26, 2390–2402. [Google Scholar] [CrossRef] [PubMed]
  45. He, Y.L.; Yan, W.B.; Cai, Y.; Deng, F.Y.; Qu, X.X.; Cui, X.L. How does the Net primary productivity respond to the extreme climate under elevation constraints in mountainous areas of Yunnan, China? Ecol. Indic. 2022, 138, 108817. [Google Scholar] [CrossRef]
  46. Xu, Y.; Lu, Y.G.; Zou, B.; Xu, M.; Feng, Y. Unraveling the enigma of NPP variation in Chinese vegetation ecosystems: The interplay of climate change and land use change. Sci. Total Environ. 2024, 912, 169023. [Google Scholar] [CrossRef]
  47. Reader, M.O.; Eppinga, M.B.; de Boer, H.J.; Damm, A.; Petchey, O.L.; Santos, M.J. Biodiversity mediates relationships between anthropogenic drivers and ecosystem services across global mountain, island and delta systems. Glob. Environ. Change-Hum. Policy Dimens. 2023, 78, 102612. [Google Scholar] [CrossRef]
  48. Xiao, D.O.; Deng, L.; Kim, D.; Huang, C.B.; Tian, K. Carbon budgets of wetland ecosystems in China. Glob. Change Biol. 2019, 25, 2061–2076. [Google Scholar] [CrossRef]
  49. Xu, H.Y.; Guli, J.; Yu, T.; Li, X.; Chen, B.J.; Abdalla, S. Analysis of spatio-temporal variation characteristics and influencing factors of net primary productivity in terrestrial ecosystems of China. Acta Ecol. Sin. 2023, 43, 1219–1233. [Google Scholar]
  50. Tilman, D.; Isbell, F.; Cowles, J.M. Biodiversity and Ecosystem Functioning. Annu. Rev. Ecol. Evol. Syst. 2014, 45, 471–493. [Google Scholar] [CrossRef]
  51. Feng, Y.H.; Schmid, B.; Loreau, M.; Forrester, D.I.; Fei, S.L.; Zhu, J.X.; Tang, Z.Y.; Zhu, J.L.; Hong, P.B.; Ji, C.J.; et al. Multispecies forest plantations outyield monocultures across a broad range of conditions. Science 2022, 376, 865–868. [Google Scholar] [CrossRef]
  52. Fei, S.L.; Jo, I.; Guo, Q.F.; Wardle, D.A.; Fang, J.Y.; Chen, A.P.; Oswalt, C.M.; Brockerhoff, E.G. Impacts of climate on the biodiversity-productivity relationship in natural forests. Nat. Commun. 2018, 9, 5436. [Google Scholar] [CrossRef]
  53. Shao, J.; Diao, Y.; Zhang, Q.; Wang, J. Optimizing conservation planning: An integrated approach to cost-effective biodiversity and carbon sequestration management in Yunnan Province, China. Glob. Ecol. Conserv. 2024, 56, e03336. [Google Scholar] [CrossRef]
  54. Li, W.; Wang, W.; Chen, J.; Zhang, Z. Assessing effects of the Returning Farmland to Forest Program on vegetation cover changes at multiple spatial scales: The case of northwest Yunnan, China. J. Environ. Manag. 2022, 304, 114303. [Google Scholar] [CrossRef]
  55. Liu, F.; Feng, C.; Zhou, Y.; Zhang, L.; Du, J.; Huang, W.; Luo, J.; Wang, W. Effectiveness of functional zones in National Nature Reserves for the protection of forest ecosystems in China. J. Environ. Manag. 2022, 308, 114593. [Google Scholar] [CrossRef] [PubMed]
  56. Zhu, M.; Zhou, Z.; Wu, X.; Wan, J.; Wang, J.; Zheng, J.; Liu, R.; Li, F. Prediction and spillover effects of forest expansion and management to increase carbon sinks in karst mountainous areas: A case study in Guizhou, China. Land Use Policy 2025, 151, 107491. [Google Scholar] [CrossRef]
  57. Adams, E.A.; Kuusaana, E.D.; Ahmed, A.; Campion, B.B. Land dispossessions and water appropriations: Political ecology of land and water grabs in Ghana. Land Use Policy 2019, 87, 104068. [Google Scholar] [CrossRef]
  58. Zhao, J.; Fu, X.; Sa, N.; Kou, X.; He, X.; Zheng, S.; Lu, Z.; Wu, G.; Sang, W. Forest eco-function restoration and its positive effects on biodiversity improvement in China’s ecological conservation programs. Ecol. Eng. 2025, 212, 107530. [Google Scholar] [CrossRef]
  59. Chen, C.; Xiao, W.Y.; Chen, H.Y.H. Meta-analysis reveals global variations in plant diversity effects on productivity. Nature 2025, 638, 435–440. [Google Scholar] [CrossRef]
  60. Xu, H.; Yue, C.; Zhang, Y.; Liu, D.; Piao, S.L. Forestation at the right time with the right species can generate persistent carbon benefits in China. Proc. Natl. Acad. Sci. USA 2023, 120, e2304988120. [Google Scholar] [CrossRef]
  61. Rodrigo, M.A. Wetland Restoration with Hydrophytes: A Review. Plants 2021, 10, 1035. [Google Scholar] [CrossRef]
  62. Tammeorg, O.; Chorus, I.; Spears, B.; Nõges, P.; Nürnberg, G.K.; Tammeorg, P.; Søndergaard, M.; Jeppesen, E.; Paerl, H.; Huser, B.; et al. Sustainable lake restoration: From challenges to solutions. WIREs Water 2024, 11, e1689. [Google Scholar] [CrossRef]
Figure 1. Location (a), topography distribution (b), and land cover in 2018 (c) of study area.
Forests 16 00919 g001
Figure 2. The vegetation area changes from 1990 to 2018 in study area. The wetland area is less than 1% and is not clearly displayed.
Forests 16 00919 g002
Figure 3. The data flow diagram.
Forests 16 00919 g003
Figure 4. Annual time series of simulated NPP (red line) and accumulated annual total NPP in study area province (blue bar) for 1990–2018.
Forests 16 00919 g004
Figure 5. Spatial distribution of NPP in study area from 1990 to 2018.
Forests 16 00919 g005
Figure 6. Spatial patterns of the annual change rate of NPP. It shows significant change (p < 0.05) regions.
Forests 16 00919 g006
Figure 7. NPP (a) and annual total NPP (b) of different vegetation types in study area for 1990–2018. The * indicates significant annual variation (p < 0.05).
Forests 16 00919 g007
Figure 8. Contributions of temperature (a), precipitation (b), PAR (c), CO2 concentration (d), and land cover (e) to the interannual changes in NPP (NTL not mapped due to dominant contribution areas < 0.5%). In each grid cell, the sum of contribution values was normalized to 1 by relative importance analysis.
Forests 16 00919 g008
Figure 9. The dominant factor influencing variations in NPP, defined as the driving factor that contributes (%) the most to the increase (or decrease) in NPP, was indicated in each grid cell (a). The five driving factors include incoming annual precipitation (Prec), annual average air temperature (Temp), annual photosynthetically active radiation (PAR), rising CO2, and alternating land cover (LC). (b,c) show the contributions of the five driving factors in longitude and latitude bands. (d) shows the area fractions of lands dominated by each factor. NTL not mapped due to dominant contribution areas < 0.5%.
Forests 16 00919 g009
Figure 10. The contributions (%) of driving factors influencing variations in NPP across different elevations. The five driving factors include incoming annual precipitation (Prec), annual average air temperature (Temp), annual photosynthetically active radiation (PAR), rising CO2, and alternating land cover (LC). NTL not mapped due to dominant contribution areas < 0.5%.
Forests 16 00919 g010
Figure 11. The contribution of driving factors to spatial heterogeneity (a) and interaction detection between driving factors (b) in NPP. The driving factors include incoming annual precipitation (Prec), annual average air temperature (Temp), annual photosynthetically active radiation (PAR), CO2, land cover (LC), elevation (dem), and slope angle (Slope).
Forests 16 00919 g011
Figure 12. Response of NPP to altitudinal gradient. The blue background point is NPP for each pixel, the black point is mean NPP with standard deviation for each elevation gradient, the red line indicates the logistic fit between NPP and elevation.
Forests 16 00919 g012
Disclaimer/Publisher’s Note: The statements, opinions and data contained in all publications are solely those of the individual author(s) and contributor(s) and not of MDPI and/or the editor(s). MDPI and/or the editor(s) disclaim responsibility for any injury to people or property resulting from any ideas, methods, instructions or products referred to in the content.

