Abstract
A thorough understanding of forest resources and development trends is based on quick and accurate forest inventories. Because of its flexibility and localized independence, mobile laser scanning (MLS) based on simultaneous localization and mapping (SLAM) is the best option for forest inventories. The gap in the review studies in this field is filled by this study, which offers the first comprehensive review of SLAM-based MLS in forest inventory. This synthesis includes methods, research progress, challenges, and future perspectives of SLAM-based MLS in forest inventory. The precision and efficiency of SLAM-based MLS in forest inventories have benefited from improvements in data collection techniques and the ongoing development of algorithms, especially the application of deep learning. Based on evaluating the research progress of SLAM-based MLS in forest inventory, this paper provides new insights into the development of automation in this field. The main challenges of the current research are complex forest environments, localized bias, and limitations of the algorithms. To achieve accurate, real-time, and applicable forest inventories, researchers should develop SLAM technology dedicated to forest environments in the future so as to perform path planning, localization, autonomous navigation, obstacle avoidance, and point cloud recognition. In addition, researchers should develop algorithms specialized for different forest environments and improve the information processing capability of the algorithms to generate forest maps capable of extracting tree attributes automatically and in real time.
1. Introduction
Forests play a very important role in protecting the ecological environment and maintaining biodiversity [1,2]. Accurate and rapid forest inventory can help researchers to gain a comprehensive understanding of forest resources and systematically analyze the patterns of forest development so as to scientifically manage and protect forest resources [3,4]. The contents of forest inventory mainly include the number, position, diameter at breast height (DBH), tree height, canopy dimensions, tree species distribution, stem curve, wood volume, and above-ground biomass (AGB) of trees. Traditionally, tools such as calipers and hypsometers are generally used to manually measure the DBH and tree height [5,6], visually inspect tree growth, and spot-check the distribution of tree species. These methods are labor-intensive, and it is difficult to achieve the desired measurement precision and efficiency. With the rapid development of laser detection and ranging (LiDAR) technology, laser scanning technology is gradually being widely used in various fields of forest inventory, which can flexibly and rapidly obtain various parameters of the forest under various terrain conditions. Moreover, it has a high degree of automation, precision, and efficiency [7], which makes it easier to modernize forest inventory.
Laser scanning technology not only automatically determines information such as the number of trees, tree position, DBH, tree height, canopy dimensions, species, and stem curve but also enables 3D reconstruction of the forest environment for estimating the wood stock and AGB of trees. Laser scanning in forest inventories has evolved from terrestrial laser scanning (TLS) to mobile laser scanning (MLS), enabling multiple platforms to collect point cloud data. The development of laser scanning technology has benefited from the advancement of LiDAR technology and the improvement of computing capability, which has effectively improved the efficiency of information collection and the precision of data processing. The general working mode of laser scanning technology is to scan a large area of forest scenes using a laser scanner, estimate tree attribute information, and construct a 3D forest model by collecting point cloud data, localizing trees, separating ground points, optimizing the backend algorithm, and performing closed-loop detection.
Simultaneous localization and mapping (SLAM)-based mobile laser scanning (MLS) for forests has been developed on the basis of mobile laser scanning technology, and its application provides new opportunities for forest inventory. A typical MLS system consists of two main components: a laser scanner and an inertial measurement unit (IMU)/inertial navigation system (INS) for orientation system. The main types of LiDAR sensors typically used in MLS are VLP-16, FARO Focus 3D S120, RIEGL VUX-1, Ouster OSO, Wildcat, and Leica BLK2GO. Based on the development of LiDAR sensors, several models of MLS systems are used in forest inventory, including ZEB1, ZEB-Revo, ZEB-Revo-Rt, and ZEB-Horizon (GeoSLAM Ltd., Nottingham, UK), Emesent Hovermap (Emesent Pty Ltd., Milton, Australia), Kinect (Microsoft Co., Redmond, WA, USA), Google Tango (Google Inc., Menlo Park, CA, USA), HERON-Lite (Gexcel, Brescia, Italy), and Stencil-1/2 (Kaarta, Pittsburgh, PA, USA). In the early days of MLS applications, the location of trees was generally determined by an auxiliary component, such as a global navigation satellite system (GNSS) receiver [8,9]. However, GNSS signals obtained under the canopy are unstable during forest inventories [10], and sometimes it is not possible to determine the geographic position of the measuring trees, which reduces the precision of the measurements [11]. SLAM technology solves this problem exactly. In unknown environments, SLAM-based MLS can determine the position of individual trees without GNSS signals [12], which in turn obtains 3D point cloud data of the forest scenes and improves the precision of forest inventory [13].
When selecting a carrier to carry a laser scanner for a specific measurement task in a forest inventory, the applicability determines the method of data collection via the laser scanner. Applicability has two main aspects: task requirements and the forest environment. The task of forest inventories ranges from attribute measurements such as DBH, tree height, canopy dimensions, species, and stem curve at the individual tree level to wood volume and AGB measurements at the stand-wide level, as well as measurement precision and measurement efficiency requirements. Forests have a variety of types, including not only planted forests and urban forests with flat, well-organized terrain but also natural forests with undulating, brushy undergrowth terrain and even mountainous forests with steep, gully-strewn terrain. Different tasks and forest environments require the selection of different measurement methods in order to achieve the desired measurement results.
Although researchers have made significant progress in forest inventory using SLAM-based MLS, no paper reviewing the related studies has yet been published. To address the review research gap, this paper provides a thorough screening of SLAM-based MLS applications in forest inventory. Firstly, a structured approach was adopted for the literature search, which was conducted across three databases: Google Scholar, Scopus, and Web of Science. Keywords searched were determined based on the review subject, which included “forest inventory”, “tree inventory”, “forest measurement”, “tree measurement”, “SLAM”, and “mobile laser scanning”. The applicable literature ranges from 2015 to 2024. A total of 326 studies were identified as a result of the initial search. Following manual screening of each article, 116 papers were identified as matching the subject of this review. Secondly, the literature tracing method was used to screen articles that could provide valuable information on the subject of the review. That is, the search was progressively broadened by tracing the references to these papers when reviewing them. This approach helps to track down earlier research papers and provides a comprehensive screening of the important and relevant literature in the field. These two methodologies enabled the identification of a total of 129 original research articles in the field.
This research review aims to evaluate the application of SLAM-based MLS in forest inventory and to identify associated challenges. The rest of the paper is organized into five sections. Section 2 reviews forest inventory methods to identify challenges and areas of future potential. Section 3 provides an in-depth review of all the major applications of SLAM-based MLS in forest inventories, reviews the data collection platforms and algorithms chosen for each application, and provides an in-depth discussion of measurement precision. Section 4 discusses the challenges faced by SLAM-based MLS in forest inventory. Section 5 proposes future directions for SLAM-based MLS in forest inventories. The conclusions are summarized in Section 6. This review covers SLAM-based MLS for all platforms, including vehicle-based laser scanning (VLS), unmanned aerial vehicle laser scanning (ULS), backpack laser scanning (BLS), handheld laser scanning (HLS), and smartphone scanning.
2. Methods of SLAM-Based MLS in Forest Inventory
The application of SLAM-based MLS in forest inventory is of great significance in promoting the automation, intelligence, and digitization of forest inventory. The main goals of forest inventories are accuracy, real-time, and applicability, with laser data collection methods and algorithms being the most significant influencing factors. Due to the special requirements of forest inventories, which are more complex than other fields, forest inventories require the development of specialized platforms and algorithms. For example, laser scanning in fields such as autonomous driving and robotics have the primary task of localization and mapping, whereas the primary task of forest inventories requires not only localization and mapping but also the measurement of various attributes of trees.
2.1. Platforms
To overcome the limitations of traditional forest inventory methods, laser detection and ranging (LIDAR) technology has been introduced for measurement. LIDAR is an active remote sensing technology based on laser reflection consisting of an emitting system, a receiving system, and an information processing system. The laser pulses are emitted from the emitter of LIDAR and reflected back to the receiver after reaching the surface of the object, and the backend processor estimates spatial information such as orientation, size, shape, and distance of the object based on the propagation time of the laser [14]. With the development of remote sensing technology, the resolution of sensor scanning is becoming higher and higher, reaching millimeter-level precision [15]. Terrestrial laser scanning (TLS) is the earliest laser scanning method to be applied to forest inventory. The high density of the 3D point clouds scanned by TLS enables precise measurements of various tree attributes and also allows accurate 3D reconstruction of the forest. However, the limitations of TLS are also evident, such as trees being easily occluded [16,17], small scanning area, and the need for georeferencing to obtain accurate tree positions.
With the development of the miniaturization of laser scanners, mobile laser scanning (MLS) is beginning to be used to forest inventories. Compared to TLS, MLS can collect data quickly and widely [18], scanning trees in all directions by moving to avoid the occlusion effect. Because of the instability of GNSS signals under the canopy, the application of SLAM technology makes MLS really suitable for forest inventory. SLAM-based MLS is localized by SLAM, which enables MLS to collect point cloud data and perform 3D reconstruction more flexibly and more quickly over a larger scale in forest inventories [9]. The scan results are usually referenced with manual measurements or TLS data. SLAM-based MLS for collecting point cloud data has evolved from vehicle-based MLS to backpack, handheld MLS, and under-canopy unmanned aircraft MLS [19], which have achieved a full range of forest scanning capabilities (Figure 1). Different platforms of MLS are suitable for different forest inventory needs and forest environments. During the forest inventory process, the researcher can select the appropriate data collection platform based on the specific forest environment and task requirements.
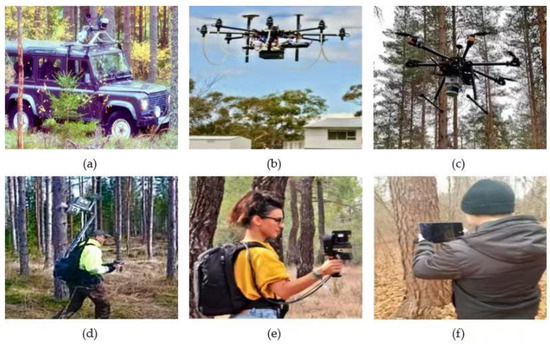
Figure 1.
Data collection platforms of simultaneous localization and mapping (SLAM)-based mobile laser scanning (MLS) for forest inventories. (a) shows vehicle-based MLS [20]; (b) demonstrates above-canopy unmanned aerial vehicle (UAV) laser scanning (ULS) [21]; (c) shows under-canopy ULS [22]; (d) shows backpack laser scanning (BLS) [23]; (e) shows handheld laser scanning (HLS) [24]; (f) depicts smartphone scanning [25].
2.1.1. Vehicle-Based Laser Scanning
Vehicle-based laser scanning is a scanning method in which a vehicle (or logging machine, all-terrain-vehicle robot) is used as a carrier to collect point cloud data from trees. The advantages of vehicle-based laser scanning are fast scanning speed, high-density point clouds, the ability to locate and collect information on trees and understory vegetation accurately, and the estimation of attribute information such as tree DBH, tree height, species, stem curve, and wood volume. For instance, Nevalainen et al. [26] installed a SLAM-based laser scanner on a logging machine with a localized error of 0.5 m per 100 m drift, which allowed for the production of comprehensive tree maps containing tree position and DBH. The limitations of vehicle-based laser scanning mainly manifest in two aspects: Firstly, due to the scanning angle and canopy shading, it is difficult for the laser to reach the treetops, which reduces the precision of tree height estimation. Secondly, it is difficult for vehicle-based MLS to penetrate through dense branches and bushes or in high and low undulating terrain conditions. To reduce terrain constraints, researchers have developed an all-terrain vehicle MLS, which expands the application of vehicle-based MLS.
Vehicle-based MLS has a limited field of view in the forest and often encounters obstacles in close proximity, thus affecting the precision of localization and forest inventory. To solve this problem, Li et al. [27] achieved accurate tree localization through SLAM-based laser scanning for autonomous robots. This system enables real-time localization and tree identification by matching with pre-registered tree maps. This localized method can be used for logging machines, representing another step toward automatic localization, obstacle avoidance, measuring, mapping, and logging. However, logging machines need to go back and forth regularly while working, so a more specialized forest SLAM technology needs to be developed.
2.1.2. Unmanned Aerial Vehicle (UAV) Laser Scanning
UAV laser scanning (ULS) is a scanning method that uses a UAV (or airplane) as a carrier to collect point cloud data from trees. ULS dramatically increases the ability to collect data on forest resources over large areas and is the fastest way to collect point cloud data. ULS has a wide range of applications, because it is less affected by the terrain and can collect information about forests with rugged and inaccessible terrain. ULS can be categorized into above-canopy ULS and under-canopy ULS according to whether the UAV flies above or under the canopy.
In the early stages of ULS application, the UAV scanned above the treetops at 30–50 m above the ground. Above-canopy ULS integrates a laser scanner with a GNSS-IMU/INS for localization and orientation, which is capable of providing submeter positioning accuracy [28]. The performance of above-canopy ULS is stable in terms of tree height measurement [29]. The higher the tree, the higher the precision of tree height estimation [30]. However, the precision of above-canopy ULS estimation of suppressed trees is lower [31]. And the above-canopy ULS lacks sufficient penetration to scan low trees, leading to omission. In addition, because of the significant distance between the above-canopy ULS and the stem, the scanned 3D point cloud of the stem is too sparse, thus making it impossible to accurately measure detailed information such as the DBH of the tree [12,23,32]. This is the main limitation of above-canopy ULS for forest inventories.
To solve the problems of above-canopy ULS in forest inventory, researchers developed SLAM-based under-canopy ULS. This scanner is based on a micro-UAV equipped with a SLAM-based laser scanner that can accurately localize without the assistance of GNSS. The under-canopy ULS can accurately estimate not only tree height and canopy dimensions but also attributes such as DBH, stem curve, and stem volume with high precision, as well as calculate AGB in combination with tree density. It has been shown that the under-canopy ULS can collect high-density point cloud data, and the precision of tree height and canopy dimensions estimation can be comparable to that of the above-canopy ULS; the precision of DBH, stem curve, and stem volume estimation is comparable to that of other MLS methods and even comparable to that of the combination of under-canopy MLS and above-canopy ULS point cloud data [22].
2.1.3. Personal Laser Scanning (PLS)
With the further development of mobile laser scanners, the personalization of forest inventories became a reality. Personal laser scanning (PLS) is a scanning method in which tree point cloud data are collected by a single person using SLAM-based MLS. PLS began with a single-person backpack laser scanner and is also known as backpack laser scanning (BLS). The combination of PLS and SLAM enables efficient and convenient localization and forest inventory [33]. PLS is lightweight, inexpensive, easy to maneuver, highly mobile, and can scan in forested environments that can be walked through. PLS can quickly collect point cloud data and scan a forest scene in multiple directions at a normal walking pace. In addition to tree height and canopy dimensions, PLS is capable of estimating other attributes of trees with high precision [34]. For example, Cabo et al. [24] found that PLS performed as well as TLS in measuring DBH.
Handheld laser scanning (HLS) is a recently developed method of forest inventory. HLS and BLS each have advantages in forest inventory. The advantage of BLS is that the researcher walks smoothly along a straight line while scanning, ensuring a consistent field of view and high efficiency in forests with flat terrain. The advantage of HLS is that the researcher can easily change the scanning perspective by holding the scanner. HLS is more flexible in forests with uneven terrain, allowing both large areas of forest to be scanned and targets of interest to be scanned multiple times, minimizing the occlusion effect. HLS can obtain 3D point cloud data of a forest scene in a complex forest environment and automatically locate and map them. Furthermore, HLS can capture more details of the terrain and understory vegetation, and accurate measurements can be obtained in complex natural forests. A limitation of HLS is the poor precision of tree height estimation, especially for large trees over 25 m [35]. In addition, HLS has a big error in estimating the DBH for small trees. For instance, Ryding et al. [36] used a ZEB1 instrument to measure the DBH in large trees (DBH > 10 cm), with a root mean square error (RMSE) of 1.5 cm compared to 3.9 cm for small trees (DBH < 10 cm); the RMSE for the overall estimate was 2.9 cm.
It should be noted that the walking path is an important factor that affects the precision of PLS scanning. The walking path was planned based on the principle of covering all the trees in a sample plot and obtaining a high density of point cloud data. Moreover, SLAM technology requires that the scan start and end at the same place, ensuring closed-loop scanning. To determine the optimal scanning path, Del Perugia et al. [37] investigated the effect of different scanning paths on the precision of tree attribute estimation and found that scanning along paths 10 m apart produces the most adequate point clouds. To avoid drift in SLAM-based MLS, a single scan time should be not more than 20 min [33].
In forest inventory applications, vehicle-based laser scanning, ULS, and PLS have different advantages and limitations for measuring different forest scenes and tree attributes. The laser scanning perspective is an important factor in affecting the quantity and quality of the point cloud. Above-canopy ULS collects information above the canopy, so it can provide high-density canopy point cloud data and low-density stem point cloud data. In contrast, vehicle-based MLS, BLS, HLS, smartphone, or under-canopy ULS scans under the canopy, so it can provide more under-canopy information. For example, Oveland et al. [38] found that BLS measured the DBH with the smallest RMSE and detected the largest number of trees by comparing scans from backpack, handheld, and above-canopy UAV LiDAR. In the study by Donager et al. [39], HLS outperformed above-canopy ULS on tree attribute measurements such as single-tree detection rate and DBH, while above-canopy ULS provided the best estimates for volume, AGB, and canopy cover. In addition, the scanning distance, resolution of the laser scanner, and forest environment are factors to consider. Therefore, when conducting forest inventory, the most appropriate data collection platforms should be selected according to the task requirements and the forest environment. Based on this, multi-platform point cloud data should be integrated to reduce the occlusion effects of trees and improve the efficiency and precision of forest inventories.
2.2. Algorithms
The large amount of point cloud data from laser scanning is a major challenge for forest inventories. In order to achieve high precision and real-time forest inventory, researchers have continuously improved the algorithms to enhance the ability to process point cloud data. The forest inventory targets a tree with individual characteristics and requires accurate estimation of attributes such as DBH, tree height, canopy dimensions, stem curve, species, wood volume, and AGB so that the algorithms for the forest inventory are unique and specific. Overall, the algorithms for forest inventory mainly include point cloud segmentation and three-dimensional reconstruction.
2.2.1. Instance Segmentation
When conducting a forest inventory, the 3D point cloud needs to be segmented into individual tree point clouds, which is a prerequisite for extracting other tree features from the point cloud data. There are four main methods for single-tree instance segmentation: methods based on the canopy height model (CHM), point density methods, graph-based methods, and deep learning methods.
The canopy height model (CHM) is a two-dimensional model that represents the height of vegetation canopies in a forest. A canopy height model is generated by identifying the highest point in the point cloud of each tree in the sample plot and combining all the highest points to create the CHM dataset. The CHM is not only the basis for determining tree canopy dimensions but also an important indicator for studying forest species diversity and vegetation characteristics [13,40]. After establishing the CHM, the canopy is generally delineated using the watershed segmentation method [41,42]. This segmentation method is mainly divided into two different directions: One direction is to identify the treetops before segmenting the canopy, and the other direction is to segment the canopy before identifying the treetops. After determining the canopy, the trees were then delineated using the region-growth algorithm [43]. The CHM-based segmentation method is very accurate in segmenting coniferous forests but less accurate in deciduous forests with irregular canopy shapes. The algorithm developed by Li et al. [44] also used the highest point of the point cloud as a seed point and then added the other points of this tree in a top-down manner following a rule. After the first tree has been segmented, the process was repeated for the other point clouds until all trees were segmented. The precision of this algorithm is affected by forest density, terrain, and canopy shape.
The basic assumption of the point density method is that the density of the laser-scanned point cloud corresponds to the center of the tree. In the lower part of the trunk, the stem is detected based on the local maximum point cloud density. In the canopy portion of the tree, the point cloud density is high for branches in the center of the canopy and decreases toward the edge of the canopy. Trees can be segmented with high precision based on their point cloud density. It has been shown that this algorithm not only has high segmentation precision in coniferous forests but also in deciduous forests [45,46]. Point cloud clustering is crucial in the process of segmenting trees using the point density methods. Firstly, the point cloud is normalized in order to achieve voxelization of the point cloud. Then, the resulting voxels are clustered by Euclidean distance using the density-based spatial clustering of applications with noise (DBSCAN) algorithm [47]. With the improvement of computing capability, researchers have developed several software packages, such as RayCoudTools and 3DFin [48,49,50], which achieved automatic segmentation of individual trees and improved the efficiency and accuracy of instance segmentation. For example, Tockner et al. [48] developed a new methodology for automated individual tree segmentation applicable to PLS point cloud data that achieved an overall accuracy of 87.02% in dense forests with medium complex structure.
Graph-based methods assume that every part of the tree is connected to the stem and root system via a specific path, which can segment the stem, branches, and leaves of the tree based on the geometric structure of the point cloud maps. Graph-based methods can achieve highly accurate segmentation effects [51]. Carpenter et al. [52] developed a graph-based instance segmentation method and proposed an unsupervised canopy-to-root pathing (UCRP) tree segmentation algorithm, which utilizes a least-cost routing method from the canopy to the root to determine the stem position and segment a single-tree point cloud. This improves the precision of unsupervised forest segmentation. The main disadvantage of this algorithm is that the stems of some conifers are full of branches from top to bottom, and the laser-scanned point cloud is difficult to differentiate between branches and stems during segmentation, which can easily lead to errors and split a tree into two or more trees. This error also occurs with deciduous trees where small trees or weeds grow around the stem and become attached to the branches above.
The PointDMM framework is an end-to-end deep learning method dedicated to point cloud semantic segmentation for forest LIDAR. Semantic segmentation is an instance segmentation method that consists of three steps. Firstly, we establish semantic models of the stem, branch, canopy, ground, dead branch, understory vegetation, etc. Then, we extract the semantic features of each model. Finally, we use deep learning to categorize each point in the point cloud, thereby completing semantic segmentation. Semantic segmentation is the application of deep learning in instance segmentation that improves the effect of instance segmentation. Forests are typically dynamic and unstructured environments with problems such as large scale, irregularity, complex terrain, and severe occlusion, which make point cloud labeling prone to errors. To solve these problems, Li et al. [13] first developed a point cloud data annotation method based on single-tree localization, which can finely annotate forest point clouds. This annotation generates datasets that include ground, trees, shrubs, and other categories that are finely labeled DMM datasets. Then, the point cloud is optimized on the basis of the DMM dataset, and further semantic segmentation is performed using PointNet. The algorithm is capable of analyzing point cloud data quickly and accurately for instance segmentation. The algorithm is significantly effective in segmentation, and the results of the study using the BLS system achieved 93% precision in identifying standing trees, demonstrating an improvement of 21% over the previous algorithm [13]. However, this algorithm has some limitations. When the understory environment is complex, with debris, dead wood, and other items, manual labeling of the point cloud may result in errors. Wielgosz et al. [53] combined deep learning with a graph-based method that used Pointnet++ to employ semantic segmentation. Using this as a basis, they proposed Point2Tree, a high-performance tree segmentation framework. This study explored a novel direction for the use of deep learning for instance segmentation.
2.2.2. Three-Dimensional Reconstruction
LiDAR-based 3D reconstruction involves the use of 3D reconstruction algorithms to reproduce the forest structure and reconstruct a 3D model of the forest that reflects the position, color, shape, and size of the trees. Forest 3D modeling represents important significance for displaying forest scenes in detail, accurately extracting tree attributes to help us understand forest ecosystems [54]. A quantitative structural model (QSM) is a reconstructing 3D model of trees based on laser-scanned point cloud data, from which tree attributes such as number of trees, DBH, height, canopy dimensions, species, stem curve, and volume of trees can be extracted and combined with the density information of the tree to estimate the AGB.
A quantitative structural model (QSM) is a shape-fitting method that constructs a three-dimensional model of trees in a hierarchical order. Most of the shape-fitting methods use cylinders as the basic building blocks. The basic procedure of this method is to first divide the point cloud into small patches that conform to the surface of the tree, then assemble the point cloud patches into branches like building blocks, the branches into sub-branches, and finally 3D reconstruction using the shape-fitting method. It has been shown that the 3D model reconstructed using cylinders is highly robust, with an error of less than 10%, and is capable of quickly and accurately reconstructing forests in large areas [55]. When extracting information such as DBH and tree height, good estimation precision can be obtained for inclined trees because the cylinder fitting axis can be inclined. Algorithms for QSM-based 3D reconstruction of trees mainly include the TreeQSM algorithm, the PypeTree algorithm, the SimpleTree algorithm, and the AdQSM algorithm (Figure 2).
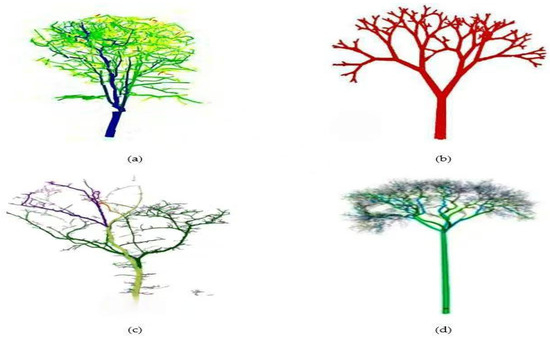
Figure 2.
Tree model reconstructed by quantitative structural model (QSM) algorithms. (a) Tree model reconstructed by TreeQSM [56]. (b) Tree model reconstructed by PypeTree [57]. (c) Tree model reconstructed by SimpleTree [58]. (d) Tree model reconstructed by AdQSM [59].
Raumonen et al. [60] developed a method for the 3D reconstruction of individual trees and construction of a quantitative structural model (QSM) using the TreeQSM algorithm. This method requires scanning a tree from multiple angles using LiDAR technology to obtain high-quality point clouds. The specific procedure of the TreeQSM algorithm is as follows: Firstly, the point clouds of the tree are segmented into stems and branches, and the topological branching structure of the tree is determined. Then, a 3D model of the tree is built by fitting cylinders. The use of accurate tree model enables the estimation of the volume of all stems and branches of a single tree directly from the point cloud, and the AGB can be calculated with high precision based on the volume and basic density information of the tree, which is highly consistent with the AGB of destructive sampling [56,61].
The PypeTree algorithm [57] is an open-source modeling environment derived from the skeletal extraction algorithm. This algorithm not only constructs a QSM of a tree with high precision but also is well suited for studying the volume of the tree canopy, the volume of the tree branches, and the tree growth conditions. Reconstruction errors using the PypeTree algorithm were only 5.1% and 1.8% in terms of automatic and semi-automatic 3D tree reconstruction, respectively. PypeTree can perform not only tree branches reconstruction but also accurate reconstruction of small trees and isolated branches.
SimpleTree [58] is also an open-source tool, which is capable of reconstructing highly accurate cylindrical tree models from point clouds. The SimpleTree method performs 3D reconstruction of all the branches and optimizes the cylinders via the nonlinear least squares (NLS) method to generate a QSM of the branch structure. The cylinder model fitted via the SimpleTree method can extend to the end twigs, so it is possible to generate a QSM of the entire tree and directly measure the AGB of the tree. The SimpleTree method is capable of automatically estimating the AGB of a large number of trees, particularly conifers. The concordance correlation coefficient (CCC) between the conifer AGB estimated by SimpleTree and the reference value from destructive sampling was 0.95, so this reconstruction method is more suitable for conifers. More importantly, researchers can modify the SimpleTree program according to the forest type to reconstruct QSMs of various forests with high precision.
The advanced quantitative structure model (AdQSM) reconstructs a 3D model of a tree by considering the tree as a closed and complete convex hull polyhedron, firstly extracting the skeleton from a 3D point cloud using the minimum spanning tree (MST) algorithm, then estimating the trunk and branch shapes by fitting cylinders, and optimizing the cylinders by using the nonlinear least squares method. The AdQSM is capable of reconstructing a 3D model of a tree from a laser-scanned point cloud to accurately and in detail estimate the tree’s DBH, tree height, trunk volume, branch volume, and AGB [59]. The AGB was calculated from the volume and destructively sampled wood density estimated by the AdQSM, with an RMSE of 20.37%. The precision of tree volumes estimated by the AdQSM was in high agreement with TreeQSM; the concordance correlation coefficient (CCC) between the tree volumes estimated by the AdQSM and TreeQSM and the reference values from destructive sampling were 0.97 and 0.96, respectively. In another study by Fan et al. [62], 3D reconstruction of trees was first performed by the AdQSM, and then the DBH, tree height, and tree volume were extracted by the convex hull polyhedral algorithm. The results showed that the RMSE of the DBH estimate was 1.28 cm, the RMSE of the tree height estimate was 1.21 m, and the RMSE of the tree volume estimate was 0.03498 m3, proving the accuracy of the 3D reconstruction using the AdQSM algorithm. A limitation of the AdQSM is its inability to reconstruct tiny branches, leaves, and fruits, which affects the precision of tree volume and AGB estimation. The overall reconstruction of trees should be further developed in the future to improve the estimation precision of AdQSM estimations.
In addition to QSM-based algorithms, Li et al. [63] recently proposed a new voxel-based method for 3D modeling of forest scenes. This method uses the point cloud data collected by TLS as a reference and the point cloud data collected by ULS as the structural information of each tree. The algorithm provides highly accurate 3D reconstruction of forests over large areas (more than 1 ha) by voxelization based on integration of TLS and ULS point clouds.
When conducting inventories in various forest environments, the parameter settings for laser scanning are fixed for various platforms, the algorithms for estimating tree attributes based on point cloud data are fixed, and the scanning methods and algorithms are consistent across different platforms, so researchers and operators can complete measurements without problems. Data collection platforms and algorithms are key factors affecting the precision, efficiency, and applicability of forest inventories. Most of the previous studies chose one data collection platform to collect the point cloud information of the trees and one algorithm to estimate the tree properties. This method can reduce the precision of tree attribute estimation due to factors such as occlusion and distance. Recently, several studies have attempted to collect point cloud information about forests using two or more data collection platforms to perform forest inventories through point cloud fusion algorithms. For example, Wang et al. [64] proposed a highly robust NDT-VGICP algorithm to achieve point cloud registration and fusion of above-canopy ULS and HLS data at the stand scale, which is capable of estimating tree height with high precision.
These studies provide some useful insights. In future research, on the one hand, researchers should select appropriate data collection platforms according to the forest environment and task requirements, as well as select appropriate algorithms according to the amount of point cloud data and time requirements. On the other hand, they should strengthen the research on the combination of multiple data collection platforms, and actively explore the algorithms for point cloud fusion, in order to improve the efficiency and accuracy of forest inventory.
3. Research Progress of SLAM-Based MLS in Forest Inventory
SLAM-based MLS is mainly used for precise measurements of reference plots, the outcomes of which are an important basis for interpreting measurement data for the entire forest area. In the forest inventory process, aerospace remote sensing data are the primary source of data on forests, but the precision of aerospace remote sensing data is poor. To improve the accuracy of the forest inventory, researchers randomly select reference plots that can represent the characteristics of the entire forest and use the relationship between the tree data of the reference plots and the remote sensing data to establish a prediction model so as to improve the precision of the entire forest inventory [23]. Therefore, to accurately grasp the detailed information of the whole forest, it is necessary for SLAM-based MLS to continuously improve the measurement precision on the tree attributes of the sample plots.
3.1. Tree Position
The tree position is the center of the circle of the DBH, which is one of the key parameters of forest inventory measurements [65,66]. The tree position can be estimated by algorithms such as circle fitting [67]. The only way to accurately distinguish each tree is to locate it precisely, and in this way the point cloud information can be successfully registered. Accurate positioning is the basis for measuring other tree attributes [68]. SLAM-based MLS has significant advantages in determining tree positions. Due to the instability of GNSS signals under the canopy [69], the continuity and accuracy of positioning cannot be guaranteed. However, SLAM technology can automatically locate and generate local maps in unknown environments and then georeference the local maps to the global map to determine the exact positions of the trees. A study employing SLAM-based MLS by Tang et al. [70] found that SLAM-based MLS improved the precision of tree positioning by 38% compared to a combined GNSS and IMU/INS positioning system. The positioning precision of trees is affected by several factors, among which forest density and tree species are important factors affecting the positioning precision [71]. This is because of the lack of matching features in sparse forests and the irregular shape of deciduous tree stems.
Tree location in forest inventories is one of the most widely studied attributes. Most of the SLAM technologies used by researchers are designed for urban environments, and although these technologies can meet the needs of forest inventories, the precision of positioning using SLAM alone is low, with an RMSE of 17.33–28.4 cm for tree positioning [33,71,72]. These findings were measured using SLAM-based PLS or HLS, while the RMSE for estimating tree position using SLAM-based smartphones was 9–12 cm [73,74]. This is because a smartphone scans fewer trees and scans them in more detail, which improves the estimation precision.
To improve the precision of tree localization, researchers have explored two directions. Firstly, SLAM technology was fused with GNSS-IMU/INS to assist SLAM positioning utilizing the heading angle and velocity information provided by the GNSS-IMU/INS, and the RMSE of tree positioning was improved to 6 cm, which significantly improved the positioning precision by 86% [28,75,76]. The second was the development of SLAM technology specifically for forest inventory. There are fewer studies in this area, but the positioning results are significant. For example, Wang et al. [77] developed a SLAM technology specifically for forest environments and scanned forests of varying complexity (easy, medium, and difficult) using SLAM-based PLS. The results showed that the RMSE for tree localization was 5 cm. Yang et al. [78] developed Se-LOAM, a SLAM technology based on semantic segmentation, which also achieved good results using a SLAM-based automatic rubber-cutting robot for localization. The research results of SLAM-based MLS for tree location estimation are shown in Table 1.

Table 1.
Summary of SLAM-based MLS for the precision of tree position estimation.
3.2. Diameter at Breast Height (DBH)
The DBH of a tree is the diameter of the stem cross-section, which is an important parameter in forest inventories and is widely used in forest inventories to estimate tree AGB and tree age [79]. Researchers have been able to detect the growth rate and health of trees by regularly measuring their DBHs. The DBH is commonly measured at a height of 1.3 m from the ground [65]. With the development of LiDAR technology and computing power, SLAM-based MLS can quickly and precisely measure the DBH estimates of trees. The general method for measuring tree DBH utilizing LiDAR is to slice the point cloud horizontally at the DBH location of the tree and estimate the DBH of the tree via the algorithms of circle fit [20], ellipse fit [80], cylinder fit [33,81], spline fit [80], sphere fit [19], and random sample consensus (RANSAC) fit [82] (Figure 3).
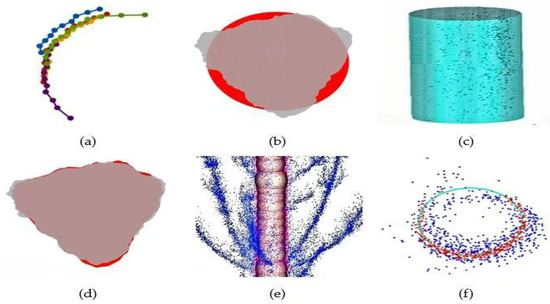
Figure 3.
DBH fitting algorithms of forest inventories: (a) circle fit [20]; (b) ellipse fit [80]; (c) cylinder fit [33]; (d) spline fit [80]; (e) sphere fit [19]; (f) random sample consensus (RANSAC) algorithm fit [82].
The DBH is one of the most frequently measured tree attributes in forest inventory studies, and researchers have measured it at both the individual tree and the stand levels. At the tree level, researchers have estimated the tree DBH utilizing different data collection methods such as SLAM-based on-vehicle MLS [20,83], above-canopy ULS combined with PLS [19], above-canopy and under-canopy ULS combined [84], PLS [12,33,85], BLS [86], and HLS [9,35,82]. The highest estimation precision was achieved by combining the above-canopy and under-canopy ULS, with an RMSE of 0.6 cm for DBH estimates in sparse forests and 0.92 cm for DBH estimates in dense forests, which are at the millimeter level. The lowest estimation precision was for the vehicle-based MLS, with an RMSE of 3.2–3.7 cm for DBH estimates. The reason for this is that positioning errors result in a noisy scanned point cloud, which affects the estimation precision. The RMSE of the DBH estimated via the personal scanning method was 0.7–2.32 cm, which had higher estimation precision. At the stand level, researchers scanned large areas of complex forests utilizing personal scanning methods as well as in combination with above-canopy ULS. The results of the studies showed that the RMSE of the DBH estimates was 0.73–7 cm [24,31,81,87,88], which proved the feasibility of estimating large complex forests. We have summarized the research results of SLAM-based MLS for DBH estimation in Table 2. These studies have shown that different data collection methods scan in different orientations and distances, so different point cloud densities are collected. The method of data collection affects the precision of DBH estimation and shows different applicability.
Table 2.
Summary of SLAM-based MLS for the precision of DBH estimation.
In addition to the data collection method, the circle fitting algorithm, the tree size, and tree species are also important factors that affect the precision of DBH estimation [89,90]. There are differences in the precision of DBH estimation between different circle fitting methods [91]. For instance, Liu et al. [92] compared three methods of circle fitting in both planted and natural secondary forests: the Hough-transform method, the linear least squares circle fitting method, and the nonlinear least squares circle fitting method. The results showed that the linear least squares circle fitting algorithm had the highest fitting precision in natural secondary forests, and the nonlinear least squares circle fitting algorithm had the highest fitting precision in planted forests. One study by Witzmann et al. [80] also compared the estimation precision of the circle fitting method, ellipse fitting method, and spline regression method. It was found that the spline regression method outperformed the circle fitting method and ellipse fitting method in modeling stem cross-sections and was especially more suitable for measuring the irregular cross-section of the lower part of the stem.
Tree size is an important factor contributing to the bias in DBH measurements [9,12,36], as small trees are scanned with low point cloud density and are easily omitted or overestimated. The precision of DBH estimation was reduced when Gollob et al. [12] measured small trees together with large trees. Therefore, the size difference of trees should be considered when measuring the DBH, and different correction functions should be set according to different measurement objects [93]. The effect of the tree species on the precision of DBH estimation is mainly affect by the eccentricity of the stem. There are differences in stem shape between conifers and deciduous trees, with deciduous trees mostly having irregular stem shapes and higher eccentricity. The eccentricity of the tree cross-section is an important factor affecting the precision of DBH measurements, especially when using the circle fitting algorithm [80]. For cases where the shape of the stem cross-section is irregular and more eccentric, ellipse fitting is more flexible and advantageous. Of course, the clustering and removal of outlier points are key factors in ensuring the accuracy of ellipse fitting.
3.3. Tree Height
Tree height is defined as the vertical distance from the ground to the highest point of the tree [94], where the ground is estimated using a digital terrain model (DTM) [95]. Tree height is an important parameter of tree growth condition and one of the most important tree attributes in forest inventory. Tree height, along with basic attributes such as DBH and tree species, is an important indicator for indirect estimation of wood volume, AGB, and carbon storage [96]. Tree height can be estimated by the point cloud slicing (PCS) method, which is obtained by calculating the difference between the lowest point cloud slice and the highest point cloud slice. Above-canopy ULS has a clear advantage in tree height estimation [30] because ULS can easily scan the treetops of dominant trees above the canopy. However, for small trees adjacent to and shaded by large trees, it is difficult for above-canopy ULS to scan the complete tree height information. Under-canopy ULS shows more flexibility, being able to scan the tops of small trees. For example, Hyyppä et al. [22] used SLAM-based under-canopy ULS to collect point cloud information. Tree height estimation is highly accurate because the equipped rotating laser scanner is capable of scanning in all directions. The RMSE for tree height estimates was 0.45 m in sparse forests and 1.2 m in obstructed forests.
Except for under-canopy ULS, the improvement in estimation precision of other SLAM-based MLS over tree height is due to the development of laser scanners. In the early stages of application, the estimation precision of trees larger than 10 m was low due to the limited scanning range of the laser scanners (such as ZEB-REVO, a lightweight mobile laser scanner initially developed, with an outdoor scanning range of 0.6–15 m) [24]. With the development of laser scanning technology, the scanning distance of laser scanners has now been significantly improved (such as the new laser scanner Hovermap, with an outdoor scanning range of 0.5–300 m), which has completely transformed the situation, with an RMSE of 0.42–1.9 m for tree height estimation [86,97], and high precision has been maintained in large areas of forest inventory [87]. Additionally, tree species is an important factor affecting the precision of tree height estimates. Some deciduous trees (such as oaks) have irregular crown shapes that make it difficult to identify the treetops and make them generally overestimated, while others are generally underestimated [94]. The research results of SLAM-based MLS for tree height estimation are shown in Table 3.
Table 3.
Summary of SLAM-based MLS for the precision of tree height estimation.
3.4. Tree Canopy Dimensions
The canopy is the main part of photosynthesis and carbon storage in trees and is an important indicator of tree growth and AGB [98]. There are fewer studies on tree canopies because the focus of researchers has been mainly on stems and rarely on twigs and leaves. Measurements of the tree canopy dimensions are based on the canopy height model (CHM). After establishing the CHM, the watershed segmentation method was used to divide the canopy, and then the area and volume of the canopy were measured [41], thus obtaining high estimation precision. For instance, Vandendaele et al. [87] utilized a SLAM-based MLS system to inventory a large area (1 ha) of hardwood forest and generated a highly accurate 3D point cloud. The results of the study showed that the RMSE for canopy projection area was 3.23 m2 (5.75%), and the RMSE for canopy volume was 71.4 m3 (23.38%), using destructive field measurements and TLS data as reference. Wang et al. [99] collected point cloud information of an orchard by a tracked robot and estimated the canopy volume by the k-nearest neighbor (KNN) algorithm with an RMSE of 1.5738 m3. Canopy shape and forest density are important factors affecting the precision of canopy dimensions measurements. This is because there are significant differences in the shape of the canopy between coniferous and deciduous trees, and canopy overlap in dense forests can lead to the underestimation of canopy area and volume [100].
3.5. Tree Species Identification
Tree species represent an important parameter for measuring AGB [101] because different tree species differ in growth rate, stem density, and branch shape. Canopy characteristics are the main basis for species identification, and the greater the variation in canopy height, the greater the variety of trees [40]. Tree species characteristics are mainly reflected in canopy shape, canopy height, foliage density, foliage pattern, and foliage texture [101], as well as tree bark texture [102]. Of these, upper-canopy intensity values and geometric ratios are the most important predictors of tree species identification [103]. Identifying tree species using LiDAR is a major challenge. Early studies on tree species identification were based on a single feature, which made it difficult to achieve the desired identification effect because of the similarity of tree features. Currently, researchers are using two main algorithms to identify tree species, which improve the precision of tree species identification. The first algorithm uses traditional machine learning classifiers for tree species identification. Two studies used random forest (RF) and RF in combination with decision rules, with identification accuracies of 85.9% [104] and 89.8% [103], respectively. The other two studies used support vector machine (SVM), with identification accuracies of 84.09% [105] and 94.68% [106], respectively, because of the different identification features chosen.
The second algorithm uses deep learning methodologies for tree species identification. Apart from one study that used a deep Boltzmann machine (DBM), which yielded a low identification precision (86.1% identification accuracy) [107], several other studies used the deep learning networks PointNet++ [108], LayerNet [109], and the point cloud tree species classification network (PCTSCN) [110], and the accuracy of the tree species identification was 92%–98.26%, demonstrating significant advantages. We have summarized the research results of SLAM-based MLS for tree species identification in Table 4. These studies have shown that deep learning approaches based on scanning high-quality point clouds enable highly accurate tree species identification. It is important to note that deep learning training requires the selection of typical features that favor tree species identification. In future research, on the one hand, researchers should utilize multi-platform data collection methods to scan high-quality point cloud information as comprehensively as possible; on the other hand, researchers should develop deep learning algorithms and adopt a combination of multiple deep learning methods to improve the accuracy of tree species identification.
Table 4.
Summary of SLAM-based MLS for the precision of tree species identification.
3.6. Stem Curve
The stem curve is the rate of change of stem diameter with stem height and is an important indicator for inferring the growth rate, stem volume, and stem mass of a tree [7,84]. In order to accurately measure the stem curves of trees, researchers collected the point cloud information of trees using vehicle-based MLS [83], above-canopy ULS [111], above-canopy and under-canopy ULS combined [84], BLS [97], and HLS [112]. The results of the studies showed that the precision of the vehicle-based MLS estimation was the lowest (RMSE of 3.6 cm), while the precision of the BLS and HLS estimations was the highest (RMSE of 1.2–1.26 cm). Muhojoki et al. [113] also found that HLS had the highest precision in estimating the stem curve by comparing the scan effects of above-canopy ULS, under-canopy ULS, and HLS.
Regarding the measurement results obtained using UAVs, the under-canopy ULS approach performed well, with an RMSE of 1.2 cm for stem curve estimates in a sparse forest and an RMSE of 1.4 cm for stem curve estimates in an obstructed forest [84]. Above-canopy ULS provided stem curve estimates close to the precision of under-canopy ULS, with an RMSE of 1.7–2.6 cm for stem curve estimates in sparse forests and 2.2–2.9 cm in dense forests [111]. Highly accurate measurement results were obtained because this study used a high-resolution scanner to collect high-density point clouds, and algorithms designed to tolerate moderate drifts of the laser scanner trajectory were used to directly estimate the stem curves in trees. The research results of SLAM-based MLS for stem curve estimation are shown in Table 5.
Table 5.
Summary of SLAM-based MLS for the precision of stem curve estimation.
3.7. Wood Volume and Above-Ground Biomass (AGB)
Both wood volume and AGB are important indicators for estimating forest ecosystem productivity [114] and carbon storage [115]. Wood volume and AGB are closely related, with wood volume being the basis for estimating AGB [116] and AGB being the product of wood volume and wood density.
Wood volume is the sum of the total stand volume available in a forest. Previously, the volume or AGB of a tree was estimated using an allometric volume model based on the DBH and tree height [117]. Allometric volume modeling works well when measuring the volume of a single tree species [87,118]. With the development of laser scanning technology, tree volumes are now estimated mainly based on LiDAR point cloud data, which are more accurate than the results calculated by the allometric volume model [97]. There are three main methods for estimating tree volume from LiDAR point cloud data. The first method estimates tree volume based on aggregated stacked point cloud slices, and the estimated stem volume had an RMSE of 0.21 m3 (10.16%) in a research study, which is comparable in accuracy to destructive measurements [19]. The second method, which calculates stem volume based on stem curves and tree heights estimated from LiDAR point cloud data [22,84,97,111], has also yielded good results. For example, Hyyppä et al. [84] estimated an RMSE of 0.063 m3 (10.1%) for stem volume utilizing stem curves measured by under-canopy ULS and tree heights measured by above-canopy ULS. The third method is to estimate the forest volume via 3D reconstruction of the forest, which can obtain highly accurate estimation results [56,87]. For instance, Vandendaele et al. [87] utilized a SLAM-based MLS system to measure a large area (1 ha) of hardwood forest and used a quantitative structure model (QSM) to estimate the volume of harvestable timber, with an RMSE of 0.39 m3 (18.57%) found for their estimates. Hardwood species are more difficult to estimate in terms of tree volume than softwood because the canopy of hardwood trees covers most of the tree volume. The research results of SLAM-based MLS for stem volume estimation are shown in Table 6.
Table 6.
Summary of SLAM-based MLS for the precision of stem volume estimation.
The current study primarily estimated stem volume and did not include twigs and leaves. This affects the accuracy of wood volume and AGB estimates. In future research, on the one hand, appropriate data collection platforms should be selected according to the task requirements and forest environment, or multi-platform point clouds should be co-registered to collect high-quality point cloud data [18]. For instance, Zhang et al. [119] discovered that HLS was more accurate than BLS for tree AGB estimation by comparing the scanning effectiveness of BLS and HLS. On the other hand, algorithms for estimating tree volume and AGB should be developed to estimate stems, twigs, and leaves together to improve the precision of wood volume and AGB estimates.
In forest inventory studies, the researchers have made significant progress in tree position, DBH, tree height, canopy dimensions, species identification, stem curve, wood volume, and AGB using SLAM-based MLS. These studies were mainly conducted in mature or natural stands, with only a few studies involving young stands. The inventory objective for young stands is unique in that it predicts growth trends by estimating tree attributes such as DBH, tree height, and canopy dimensions. In young stands, the localizing precision of individual trees is high due to the sparseness of the trees, low canopy closure, less shading, and regular stem shape. However, the branches of young stands (especially coniferous forests) are close to the ground, which is covered with shrubs and weeds. The point cloud data of young stands scanned by SLAM-based MLS contain more noise and are less accurate for estimating tree height than data from mature stands [64]. In terms of DBH measurements, the RMSE of DBH estimates for small trees (DBH < 10 cm) was 3.9 cm, which is lower than the RMSE of 1.5 cm for big trees (DBH > 10 cm) [36] and is prone to overestimation [12]. Because the surface area of young trees is smaller, SLAM-based MLS scans less point cloud information and more noise. In future studies, young stands of all types should be inventoried in detail to accurately predict growth trends in young stands.
4. Challenges of SLAM-Based MLS in Forest Inventory
4.1. Environment
Forests are typically unstructured environments, full of vegetation, bushes, and straggling branches, with rugged ground. The forest environment is the biggest challenge when it comes to laser scanning. Due to the undergrowth, weeds, and branches, laser scanning of trees produces a large number of outlying point clouds that affect the accuracy of forest inventories. Some canopies have staggered and overlapping edges that are difficult to divide and estimate. Some trees have inconsistent shapes in the upper and lower parts of the stem, with the upper part of the stem being closer to a round shape and the lower part of the stem being somewhat irregular [120], which can bias the estimation of DBH and volume. In addition, because of the topographical complexity and vast area of the forest, there is lack of known maps and databases. Researchers are unable to accurately pre-plan based on limited forest information, which affects localization, path planning, obstacle avoidance, and point cloud identification.
The dynamic nature of the forest environment is another obstacle to accurate LIDAR scanning. Wind has a significant effect on the precision of MLS measurements [121]. In windy weather, the stems of large trees are generally static, but branches, leaves, small trees, and understory plants will continue to sway. This can affect point cloud collection and increase the noise of the point cloud data collected. Falling leaves are also a dynamic factor that affect laser scanning. In deciduous forests, shadows caused by falling leaves can affect the quality of point clouds during the leaf-fall period. Ko et al. [122] demonstrated that the point cloud quality of BLS scans was higher during the leaf-fall period when there were no leaves. Therefore, weather and seasons should be considered when utilizing MLS to reduce the impact of the dynamic environment.
The occlusion effect is a key factor affecting the quality of LiDAR point clouds. Due to the high density of trees in the forest, it is easy for the point cloud to be missed due to occlusion, thus failing to collect complete point cloud data. Dense vegetation, shrubs, and branches in the understory can increase shadows, thus creating an occlusion effect [36] that affects the precision of tree attribute estimates. The problem of partial occlusion of trees can be solved using deep learning [123], but further research is needed. Natural forests contain a wide variety of tree species that are distributed vertically in the vertical structure. When using above-canopy ULS, the canopy of the dominant tree occludes the canopy of the suppressed tree, whereas when using under-canopy MLS, the canopy of the suppressed tree occludes the canopy of the dominant tree. This occlusion affects the accuracy of the canopy point cloud data, thereby underestimating canopy base height (CBH), canopy area (CA), and canopy volume (CV). Therefore, in the process of forest inventory, researchers should try to utilize multiple data collection platforms to collect point cloud information in all directions and improve the quality of point cloud data.
4.2. Localization
Accurate tree localization is the basis for measuring other attributes in the forest inventory process. Due to the complexity of forest environments and the absence of SLAM technology specifically designed for forest environments, localizing precision is one of the biggest challenges for researchers. Forests are typically unstructured environments [124], with branches, vegetation, shrubs, and jumbled rocks scattered under the canopy. The positions of trees are rather haphazard, especially in natural forests. In this environment, accurate localization becomes very difficult, and the tree localized error increases as the scanning area increases. The unevenness of the terrain is also an important factor that affects the precision of SLAM positioning. An excessive pitch angle of the SLAM (more than 20 degrees) may affect the scanning range and lead to a loss of tracking, thus reducing the localizing precision [70]. Additionally, SLAM can function properly in dense forests; however, in sparse forests, SLAM is prone to drift because of the lack of matching features [125].
Although SLAM technology can solve the problem of unstable GNSS signals under the canopy, accurate tree localization is still somewhat difficult. This is because the tree position is not a definitive point but estimate based on the appearance of the tree. The irregular appearance of some trees also adds to the difficulty of localization. Most of the SLAM technologies used in forest inventories nowadays are designed for urban environments, and although they can meet the needs of forest inventories, they struggle to perform automated localization and point cloud recognition. Not only is real-time localization and measurement not possible now, but there is also lack of post-processing systems for non-real-time, high-quality forest maps [83].
4.3. Algorithms
LiDAR scans a large amount of point cloud information because the forest environment is complex. These point clouds, in turn, are missing or generate noise due to vegetation, shrubs, and tree branches producing occluding. How to localize, segment, attribute, extract, and estimate the complex and large amount of 3D point cloud data accurately and quickly has become another challenge for researchers. The complexity of the forest environment and measuring content determines the complexity of the algorithm. The forest inventory includes attributes such as DBH, tree height, canopy dimensions, stem curve, species identification, wood volume, and AGB, which are measured at both the individual tree and stand levels. Researchers have limitations in improving measurement precision and efficiency.
Firstly, during the forest inventory process, researchers have developed many algorithms on single-tree segmentation and 3D reconstruction and obtained highly accurate measurements, but they still face challenges in reconstructing twigs and leaves. Some special cases also require improved measurement precision. For instance, the distance from the laser scanner to the tree is an important factor in scanning accuracy, and the density of the scanned point cloud gradually decreases with increasing distance [126]. How to correct this is an issue that needs to be addressed. Secondly, because of the large amount of forest LiDAR point cloud data, few studies have achieved real-time measurements. And providing real-time estimation results can help researchers identify problems and solve them in time. Thirdly, deep learning is now widely used in forest inventories. Researchers have used deep learning to process tree information in 3D point clouds, achieving good results on small areas of forest point cloud datasets. However, more efficient algorithms need to be developed on large regional datasets because of the substantial amount of computation involved in training and processing.
5. Future Perspectives of SLAM-Based MLS in Forest Inventory
The best way to accomplish forest inventory is to reconstruct a 3D model of the forest scene based on the collected point cloud information and to automatically generate information about the forest environment and tree attributes in real time. Based on this, the main objectives of forest inventories are accuracy, real-time information acquisition, and applicability. To achieve these three goals, researchers need to address the challenges faced by refining localization and data collection methods, developing algorithms further, and mapping accurate forest environments.
Due to the unstructured nature of the forest environment, it is very difficult to localize and measure accurately in the forest environment. Researchers should enhance integration in several ways to improve the competence of information collection and localization. Firstly, the combination of different data collection platforms can reduce occlusion effects and improve the completeness of point cloud data in complex forest environments. Above-canopy ULS and under-canopy MLS are both dominant [127]. Above-canopy ULS is more suitable for collecting canopy information, while under-canopy MLS is more suitable for collecting stem information. A combination of the two or employing more data collection platforms can provide more comprehensive collection of point cloud information about the forest. Secondly, SLAM and GNSS-IMU/INS positioning methods are fused. SLAM technology localizes well in dense forests but tends to drift in sparse forests due to a lack of matching features. However, stronger GNSS signals can be received in sparse forests. Therefore, fused SLAM technology and GNSS-IMU/INS positional methods can complement each other to improve positional precision. Thirdly, SLAM technologies should be developed specifically for forest environments. Most of the existing SLAM localization methods are designed for urban environments, and few are specifically designed for forest environments [77]. There is a clear distinction between forest environments and urban environments. According to the structure and characteristics of forests, SLAM technologies suitable for forests should be developed to improve the accuracy of forest localization. Pierzchała et al. [128] and Zhou et al. [129] have conducted preliminary research in this area.
After researchers collect forest point cloud information via SLAM-based MLS, algorithms are a key step in achieving measurement accuracy and real-time performance. In order to address the challenges encountered in forest inventories, researchers need to develop algorithms in several areas. Firstly, researchers should develop algorithms to improve point cloud segmentation and 3D reconstruction of forests. High precision has been obtained regarding point cloud segmentation and 3D reconstruction of forests, but there are still obstacles in the segmentation of occluded trees and reconstruction of twigs and leaves. Researchers should further develop algorithms, especially develop deep learning algorithms, that are suitable for forest scenes to construct complete and accurate 3D models of forests. Secondly, researchers should develop algorithms for real-time positioning and measurement in forest inventory. Improvements in algorithm performance are key to achieving real-time positioning and measurement. Current algorithms do not allow for real-time localization and measurement, which affects the automation of localization, path planning, navigation, obstacle avoidance, and measurement. Researchers should develop algorithms for real-time localization and measurement based on different data collection platforms to facilitate the development of automation in forest inventories. Thirdly, specific algorithms should be developed for different forest environments. Previous studies faced challenges in measuring mixed forests, small trees, and trees with irregular stems. Researchers should develop different algorithms for different forest types, data collection platforms, and measurement objects to improve information processing abilities and increase the precision and efficiency of forest inventories.
6. Conclusions
Due to the instability of GNSS signals under tree canopies, SLAM-based MLS is increasingly being applied to forest inventories and has made significant progress. The forest environments and task requirements determine the selection of LIDAR data collection platforms. Tree height, canopy area, and volume estimation are more suited for above-canopy ULS, whereas tree position, DBH, and stem curve estimation are more suited for under-canopy MLS. Tree species identification, wood volume, and AGB estimation require co-registration of the point clouds from both the above-canopy ULS and the under-canopy MLS scans. The combined utilization of multi-platform data collection methods allows for scanning the forest in all directions, reducing the occlusion effect prevalent in forests and collecting complete point cloud information. This is a major future development trend. Point cloud segmentation and 3D reconstruction algorithms are backend processing systems that improve the precision and efficiency of forest inventories. The advantage of 3D reconstruction is that every attribute of the forest inventory can be extracted directly from the 3D model. Therefore, the quality of point clouds and accuracy of the 3D forest model determine the precision of forest inventory, while the number of point clouds and processing power of algorithms determine the efficiency of forest inventory. With the application of deep learning in forest inventory, the precision of forest inventory has gained significant improvement, and it has become possible to process point cloud data automatically and in real time.
In this review study, the current state of SLAM-based MLS study in forest inventories involves in-depth evaluation, and new insights are provided into the development of automation in this field. SLAM-based MLS has been used to measure attributes such as tree position, DBH, tree height, canopy dimensions, species identification, stem curve, wood volume, and AGB with highly accurate study outcomes. Among them, tree position, DBH, and tree height have been widely studied as the most fundamental research objects. In contrast, attributes such as canopy dimensions, species identification, stem curve, wood volume, and AGB are more challenging to measure, and research results are less readily available. Most of these studies have measured from the tree level, and only a few have explored from the forest stand level, already showing great potential based on hardware facilities such as laser scanners and algorithmic developments such as deep learning.
This review demonstrates that SLAM-based MLS, while having significant results in forest inventories, still has limitations. The challenges include complex forest environments, localized bias, and algorithmic limitations. In future studies, the researchers should develop SLAM technology applicable to forest structures and develop algorithms applicable to different forest environments so as to perform path planning, localization, autonomous navigation, and obstacle avoidance automatically and in real time, as well as generate forest maps capable of extracting tree attributes. With the development of automation in forest inventory, SLAM-based MLS will play an increasingly important role in helping us to understand the growth of trees, forest carbon storage, and the evolution of forest ecosystems in real time, accurately, and conveniently.
Author Contributions
Conceptualization, M.L., Y.W. and Y.M.; methodology, M.L., S.Z. and Y.W.; formal analysis, Y.W., Y.M. and Y.Z.; resources, Y.W., Y.M. and Y.Z.; writing—original draft preparation, Y.W., Y.M. and Y.Z.; writing—review and editing, M.L., S.Z., Y.W. and Y.M.; supervision, M.L. All authors have read and agreed to the published version of the manuscript.
Funding
This research was funded in part by the Key Laboratory of Space Ocean Remote Sensing and Application, MNR, 2023CFO015; the National Natural Science Foundation of China under grants 41976173, 61971455, and 41976168; and the Shandong Provincial Natural Science Foundation, China, under grants ZR2019MD016, ZR2020MD095, and ZR201910290171.
Data Availability Statement
The datasets relevant to our paper are available online.
Conflicts of Interest
The authors declare no conflicts of interest.
References
- Xiang, B.; Wielgosz, M.; Kontogianni, T.; Peters, T.; Puliti, S.; Astrup, R.; Schindler, K. Automated forest inventory: Analysis of high-density airborne LiDAR point clouds with 3D deep learning. Remote Sens. Environ. 2024, 305, 114078. [Google Scholar] [CrossRef]
- Maes, J.; Bruzón, A.G.; Barredo, J.I.; Vallecillo, S.; Vogt, P.; Rivero, I.M.; Santos-Martín, F. Accounting for forest condition in Europe based on an international statistical standard. Nat. Commun. 2023, 14, 3723. [Google Scholar] [CrossRef] [PubMed]
- Wulder, M.A.; Bater, C.W.; Coops, N.; Hilker, T.; White, J. The role of LiDAR in sustainable forest management. For. Chron. 2008, 84, 807–826. [Google Scholar] [CrossRef]
- Aijazi, A.K.; Checchin, P.; Malaterre, L.; Trassoudaine, L. Automatic Detection and Parameter Estimation of Trees for Forest Inventory Applications Using 3D Terrestrial LiDAR. Remote Sens. 2017, 9, 946. [Google Scholar] [CrossRef]
- Ojoatre, S.; Zhang, C.; Hussin, Y.A.; Kloosterman, H.E.; Hasmadi Ismail, M. Assessing the Uncertainty of Tree Height and Aboveground Biomass From Terrestrial Laser Scanner and Hypsometer Using Airborne LiDAR Data in Tropical Rainforests. IEEE J. Sel. Top. Appl. Earth Obs. Remote Sens. 2019, 12, 4149–4159. [Google Scholar] [CrossRef]
- Božić, M.; Čavlović, J.; Lukić, N.; Teslak, K.; Kos, D. Efficiency of ultrasonic Vertex III hypsometer compared to the most commonly used hypsometers in Croatian forestry. Croat. J. For. Eng. 2005, 26, 91–99. [Google Scholar]
- Liang, X.; Kukko, A.; Hyyppa, J.; Lehtomaki, M.; Pyorala, J.; Yu, X.; Kaartinen, H.; Jaakkola, A.; Wang, Y. In-situ measurements from mobile platforms: An emerging approach to address the old challenges associated with forest inventories. ISPRS J. Photogramm. Remote Sens. 2018, 143, 97–107. [Google Scholar] [CrossRef]
- Kukko, A.; Kaartinen, H.; Hyyppä, J.; Chen, Y. Multiplatform Mobile Laser Scanning: Usability and Performance. Sensors 2012, 12, 11712–11733. [Google Scholar] [CrossRef]
- Bauwens, S.; Bartholomeus, H.; Calders, K.; Lejeune, P. Forest Inventory with Terrestrial LiDAR: A Comparison of Static and Hand-Held Mobile Laser Scanning. Forests 2016, 7, 127. [Google Scholar] [CrossRef]
- Lin, Y.; Holopainen, M.; Kankare, V.; Hyyppa, J. Validation of Mobile Laser Scanning for Understory Tree Characterization in Urban Forest. IEEE J. Sel. Top. Appl. Earth Obs. Remote Sens. 2014, 7, 3167–3173. [Google Scholar] [CrossRef]
- Brach, M.; Zasada, M. The effect of mounting height on GNSS receiver positioning accuracy in forest conditions. Croat. J. For. Eng. 2014, 35, 245–253. [Google Scholar]
- Gollob, C.; Ritter, T.; Nothdurft, A. Forest Inventory with Long Range and High-Speed Personal Laser Scanning (PLS) and Simultaneous Localization and Mapping (SLAM) Technology. Remote Sens. 2020, 12, 1509. [Google Scholar] [CrossRef]
- Li, J.; Liu, J.; Huang, Q. PointDMM: A Deep-Learning-Based Semantic Segmentation Method for Point Clouds in Complex Forest Environments. Forests 2023, 14, 2276. [Google Scholar] [CrossRef]
- Dubayah, R.O.; Drake, J.B. Lidar remote sensing for forestry. J. Forest. 2000, 98, 44–46. [Google Scholar] [CrossRef]
- Liang, X.; Kankare, V.; Hyyppa, J.; Wang, Y.; Kukko, A.; Haggren, H.; Yu, X.; Kaartinen, H.; Jaakkola, A.; Guan, F.; et al. Terrestrial laser scanning in forest inventories. ISPRS J. Photogramm. Remote Sens. 2016, 115, 63–77. [Google Scholar] [CrossRef]
- Kuronen, M.; Henttonen, H.M.; Myllymäki, M. Correcting for nondetection in estimating forest characteristics from single-scan terrestrial laser measurements. Can. J. For. Res. 2019, 49, 96–103. [Google Scholar] [CrossRef]
- Fekry, R.; Yao, W.; Cao, L.; Shen, X. Ground-based/UAV-LiDAR data fusion for quantitative structure modeling and tree parameter retrieval in subtropical planted forest. For. Ecosyst. 2022, 9, 100065. [Google Scholar] [CrossRef]
- Liang, X.; Kukko, A.; Kaartinen, H.; Hyyppa, J.; Yu, X.; Jaakkola, A.; Wang, Y. Possibilities of a Personal Laser Scanning System for Forest Mapping and Ecosystem Services. Sensors 2014, 14, 1228–1248. [Google Scholar] [CrossRef]
- Hartley, R.J.L.; Jayathunga, S.; Massam, P.D.; De Silva, D.; Estarija, H.J.; Davidson, S.J.; Wuraola, A.; Pearse, G.D. Assessing the Potential of Backpack-Mounted Mobile Laser Scanning Systems for Tree Phenotyping. Remote Sens. 2022, 14, 3344. [Google Scholar] [CrossRef]
- Forsman, M.; Holmgren, J.; Olofsson, K. Tree Stem Diameter Estimation from Mobile Laser Scanning Using Line-Wise Intensity-Based Clustering. Forests 2016, 7, 206. [Google Scholar] [CrossRef]
- Wallace, L.; Lucieer, A.; Watson, C.; Turner, D. Development of a UAV-LiDAR System with Application to Forest Inventory. Remote Sens. 2012, 4, 1519–1543. [Google Scholar] [CrossRef]
- Hyyppa, J.; Yu, X.; Hakala, T.; Kaartinen, H.; Kukko, A.; Hyyti, H.; Muhojoki, J.; Hyyppa, E. Under-Canopy UAV Laser Scanning Providing Canopy Height and Stem Volume Accurately. Forests 2021, 12, 856. [Google Scholar] [CrossRef]
- Hyyppa, E.; Yu, X.; Kaartinen, H.; Hakala, T.; Kukko, A.; Vastaranta, M.; Hyyppa, J. Comparison of Backpack, Handheld, Under-Canopy UAV, and Above-Canopy UAV Laser Scanning for Field Reference Data Collection in Boreal Forests. Remote Sens. 2020, 12, 3327. [Google Scholar] [CrossRef]
- Cabo, C.; Del Pozo, S.; Rodriguez-Gonzalvez, P.; Ordonez, C.; Gonzalez-Aguilera, D. Comparing Terrestrial Laser Scanning (TLS) and Wearable Laser Scanning (WLS) for Individual Tree Modeling at Plot Level. Remote Sens. 2018, 10, 540. [Google Scholar] [CrossRef]
- Gollob, C.; Ritter, T.; Krassnitzer, R.; Tockner, A.; Nothdurft, A. Measurement of Forest Inventory Parameters with Apple iPad Pro and Integrated LiDAR Technology. Remote Sens. 2021, 13, 3129. [Google Scholar] [CrossRef]
- Nevalainen, P.; Li, Q.; Melkas, T.; Riekki, K.; Westerlund, T.; Heikkonen, J. Navigation and Mapping in Forest Environment Using Sparse Point Clouds. Remote Sens. 2020, 12, 4088. [Google Scholar] [CrossRef]
- Li, Q.; Nevalainen, P.; Queralta, J.P.; Heikkonen, J.; Westerlund, T. Localization in Unstructured Environments: Towards Autonomous Robots in Forests with Delaunay Triangulation. Remote Sens. 2020, 12, 1870. [Google Scholar] [CrossRef]
- Qian, C.; Liu, H.; Tang, J.; Chen, Y.; Kaartinen, H.; Kukko, A.; Zhu, L.; Liang, X.; Chen, L.; Hyyppa, J. An Integrated GNSS/INS/LiDAR-SLAM Positioning Method for Highly Accurate Forest Stem Mapping. Remote Sens. 2017, 9, 3. [Google Scholar] [CrossRef]
- Liang, X.; Wang, Y.; Pyorala, J.; Lehtomaki, M.; Yu, X.; Kaartinen, H.; Kukko, A.; Honkavaara, E.; Issaoui, A.E.I.; Nevalainen, O.; et al. Forest in situ observations using unmanned aerial vehicle as an alternative of terrestrial measurements. For. Ecosyst. 2019, 6, 1–16. [Google Scholar] [CrossRef]
- Jurjevic, L.; Liang, X.; Gasparovic, M.; Balenovic, I. Is field-measured tree height as reliable as believed—Part II, A comparison study of tree height estimates from conventional field measurement and low-cost close-range remote sensing in a deciduous forest. ISPRS J. Photogramm. Remote Sens. 2020, 169, 227–241. [Google Scholar] [CrossRef]
- Jaakkola, A.; Hyyppä, J.; Yu, X.; Kukko, A.; Kaartinen, H.; Liang, X.; Hyyppä, H.; Wang, Y. Autonomous collection of forest field reference—The outlook and a first step with UAV laser scanning. Remote Sens. 2017, 9, 785. [Google Scholar] [CrossRef]
- Wieser, M.; Mandlburger, G.; Hollaus, M.; Otepka, J.; Glira, P.; Pfeifer, N. A Case Study of UAS Borne Laser Scanning for Measurement of Tree Stem Diameter. Remote Sens. 2017, 9, 1154. [Google Scholar] [CrossRef]
- Chen, S.; Liu, H.; Feng, Z.; Shen, C.; Chen, P. Applicability of personal laser scanning in forestry inventory. PLoS ONE 2019, 14, e0211392. [Google Scholar] [CrossRef] [PubMed]
- Vatandaslar, C.; Zeybek, M. Application of handheld laser scanning technology for forest inventory purposes in the NE Turkey. Turkish J. Agric. For. 2020, 44, 229–242. [Google Scholar] [CrossRef]
- Guan, T.; Shen, Y.; Wang, Y.; Zhang, P.; Wang, R.; Yan, F. Advancing Forest Plot Surveys: A Comparative Study of Visual vs. LiDAR SLAM Technologies. Forests 2024, 15, 2083. [Google Scholar] [CrossRef]
- Ryding, J.; Williams, E.; Smith, M.J.; Eichhorn, M.P. Assessing Handheld Mobile Laser Scanners for Forest Surveys. Remote Sens. 2015, 7, 1095–1111. [Google Scholar] [CrossRef]
- Del Perugia, B.; Giannetti, F.; Chirici, G.; Travaglini, D. Influence of Scan Density on the Estimation of Single-Tree Attributes by Hand-Held Mobile Laser Scanning. Forests 2019, 10, 277. [Google Scholar] [CrossRef]
- Oveland, I.; Hauglin, M.; Giannetti, F.; Kjorsvik, N.S.; Gobakken, T. Comparing Three Different Ground Based Laser Scanning Methods for Tree Stem Detection. Remote Sens. 2018, 10, 538. [Google Scholar] [CrossRef]
- Donager, J.J.; Meador, A.J.S.; Blackburn, R.C. Adjudicating Perspectives on Forest Structure: How Do Airborne, Terrestrial, and Mobile Lidar-Derived Estimates Compare? Remote Sens. 2021, 13, 2297. [Google Scholar] [CrossRef]
- Torresani, M.; Rocchini, D.; Sonnenschein, R.; Zebisch, M.; Hauffe, H.C.; Heym, M.; Pretzsch, H.; Tonon, G. Height variation hypothesis: A new approach for estimating forest species diversity with CHM LiDAR data. Ecol. Indic. 2020, 117, 106520. [Google Scholar] [CrossRef]
- Hirata, Y.; Furuya, N.; Suzuki, M.; Yamamoto, H. Airborne laser scanning in forest management: Individual tree identification and laser pulse penetration in a stand with different levels of thinning. For. Ecol. Manag. 2009, 258, 752–760. [Google Scholar] [CrossRef]
- Jakubowski, M.K.; Li, W.; Guo, Q.; Kelly, M. Delineating Individual Trees from Lidar Data: A Comparison of Vector- and Raster-based Segmentation Approaches. Remote Sens. 2013, 5, 4163–4186. [Google Scholar] [CrossRef]
- Zhao, D.; Pang, Y.; Li, Z.; Liu, L. Isolating individual trees in a closed coniferous forest using small footprint lidar data. Int. J. Remote Sens. 2014, 35, 7199–7218. [Google Scholar] [CrossRef]
- Li, W.; Guo, Q.; Jakubowski, M.K.; Kelly, M. A New Method for Segmenting Individual Trees from the Lidar Point Cloud. Photogramm. Eng. Remote Sens. 2012, 78, 75–84. [Google Scholar] [CrossRef]
- Kuzelka, K.; Slavik, M.; Surovy, P. Very High Density Point Clouds from UAV Laser Scanning for Automatic Tree Stem Detection and Direct Diameter Measurement. Remote Sens. 2020, 12, 1236. [Google Scholar] [CrossRef]
- Latella, M.; Sola, F.; Camporeale, C. A Density-Based Algorithm for the Detection of Individual Trees from LiDAR Data. Remote Sens. 2021, 13, 322. [Google Scholar] [CrossRef]
- Ester, M.; Kriegel, H.-P.; Sander, J.; Xu, X. A density-based algorithm for discovering clusters in large spatial databases with noise. In Proceedings of the KDD, Munich, Germany, 2–4 August 1996; pp. 226–231. [Google Scholar]
- Tockner, A.; Gollob, C.; Kraßnitzer, R.; Ritter, T.; Nothdurft, A. Automatic tree crown segmentation using dense forest point clouds from Personal Laser Scanning (PLS). Int. J. Appl. Earth Obs. Geoinf. 2022, 114, 103025. [Google Scholar] [CrossRef]
- Lowe, T.D.; Stepanas, K. Raycloudtools: A concise interface for analysis and manipulation of ray clouds. IEEE Access 2021, 9, 79712–79724. [Google Scholar] [CrossRef]
- Laino, D.; Cabo, C.; Prendes, C.; Janvier, R.; Ordonez, C.; Nikonovas, T.; Doerr, S.; Santin, C. 3DFin: A software for automated 3D forest inventories from terrestrial point clouds. For. An. Int. J. For. Res. 2024, 97, 479–496. [Google Scholar] [CrossRef]
- Wang, D. Unsupervised semantic and instance segmentation of forest point clouds. ISPRS J. Photogramm. Remote Sens. 2020, 165, 86–97. [Google Scholar] [CrossRef]
- Carpenter, J.; Jung, J.; Oh, S.; Hardiman, B.; Fei, S. An Unsupervised Canopy-to-Root Pathing (UCRP) Tree Segmentation Algorithm for Automatic Forest Mapping. Remote Sens. 2022, 14, 4274. [Google Scholar] [CrossRef]
- Wielgosz, M.; Puliti, S.; Wilkes, P.; Astrup, R. Point2Tree (P2T)—Framework for Parameter Tuning of Semantic and Instance Segmentation Used with Mobile Laser Scanning Data in Coniferous Forest. Remote Sens. 2023, 15, 3737. [Google Scholar] [CrossRef]
- Kukenbrink, D.; Gardi, O.; Morsdorf, F.; Thurig, E.; Schellenberger, A.; Mathys, L. Above-ground biomass references for urban trees from terrestrial laser scanning data. Ann. Bot. 2021, 128, 709–724. [Google Scholar] [CrossRef]
- Akerblom, M.; Raumonen, P.; Kaasalainen, M.; Casella, E. Analysis of Geometric Primitives in Quantitative Structure Models of Tree Stems. Remote Sens. 2015, 7, 4581–4603. [Google Scholar]
- Brede, B.; Calders, K.; Lau, A.; Raumonen, P.; Bartholomeus, H.M.; Herold, M.; Kooistra, L. Non-destructive tree volume estimation through quantitative structure modelling: Comparing UAV laser scanning with terrestrial LIDAR. Remote Sens. Environ. 2019, 233, 111355. [Google Scholar] [CrossRef]
- Delagrange, S.; Jauvin, C.; Rochon, P. PypeTree: A Tool for Reconstructing Tree Perennial Tissues from Point Clouds. Sensors 2014, 14, 4271–4289. [Google Scholar] [CrossRef] [PubMed]
- Hackenberg, J.; Spiecker, H.; Calders, K.; Disney, M.; Raumonen, P. SimpleTree—An Efficient Open Source Tool to Build Tree Models from TLS Clouds. Forests 2015, 6, 4245–4294. [Google Scholar] [CrossRef]
- Fan, G.; Nan, L.; Dong, Y.; Su, X.; Chen, F. AdQSM: A New Method for Estimating Above-Ground Biomass from TLS Point Clouds. Remote Sens. 2020, 12, 3089. [Google Scholar] [CrossRef]
- Raumonen, P.; Kaasalainen, M.; Akerblom, M.; Kaasalainen, S.; Kaartinen, H.; Vastaranta, M.; Holopainen, M.; Disney, M.; Lewis, P. Fast Automatic Precision Tree Models from Terrestrial Laser Scanner Data. Remote Sens. 2013, 5, 491–520. [Google Scholar] [CrossRef]
- Calders, K.; Newnham, G.; Burt, A.; Murphy, S.; Raumonen, P.; Herold, M.; Culvenor, D.; Avitabile, V.; Disney, M.; Armston, J.; et al. Nondestructive estimates of above-ground biomass using terrestrial laser scanning. Methods Ecol. Evol. 2015, 6, 198–208. [Google Scholar] [CrossRef]
- Fan, G.; Nan, L.; Chen, F.; Dong, Y.; Wang, Z.; Li, H.; Chen, D. A New Quantitative Approach to Tree Attributes Estimation Based on LiDAR Point Clouds. Remote Sens. 2020, 12, 1779. [Google Scholar] [CrossRef]
- Li, W.; Hu, X.; Su, Y.; Tao, S.; Ma, Q.; Guo, Q. A new method for voxel-based modelling of three-dimensional forest scenes with integration of terrestrial and airborne LiDAR data. Methods Ecol. Evol. 2024, 15, 569–582. [Google Scholar] [CrossRef]
- Wang, F.; Wang, J.; Wu, Y.; Xue, Z.; Tan, X.; Yang, Y.; Lin, S. A Method Coupling NDT and VGICP for Registering UAV-LiDAR and LiDAR-SLAM Point Clouds in Plantation Forest Plots. Forests 2024, 15, 2186. [Google Scholar] [CrossRef]
- Liang, X.; Hyyppa, J.; Kaartinen, H.; Lehtomaki, M.; Pyorala, J.; Pfeifer, N.; Holopainen, M.; Brolly, G.; Pirotti, F.; Hackenberg, J.; et al. International benchmarking of terrestrial laser scanning approaches for forest inventories. ISPRS J. Photogramm. Remote Sens. 2018, 144, 137–179. [Google Scholar] [CrossRef]
- Yuan, F.; Chen, S.; Fang, L.; Zheng, S.; Liu, Y.; Ren, J. A Method to Locate Tree Positions Using Ultrawideband Technology. J. Sens. 2021, 2021, 5539302. [Google Scholar] [CrossRef]
- Koren, M.; Mokros, M.; Bucha, T. Accuracy of tree diameter estimation from terrestrial laser scanning by circle-fitting methods. Int. J. Appl. Earth Obs. Geoinf. 2017, 63, 122–128. [Google Scholar]
- Fan, G.; Dong, Y.; Chen, D.; Chen, F. New Method for Forest Resource Data Collection Based on Smartphone Fusion with Multiple Sensors. Mob. Inf. Syst. 2020, 2020, 5736978. [Google Scholar] [CrossRef]
- Yang, S.; Xing, Y.; Xing, T.; Deng, H.; Xi, Z. Multisensors Fusion SLAM-Aided Forest Plot Mapping with Backpack Dual-LiDAR System. IEEE J. Sel. Top. Appl. Earth Obs. Remote Sens. 2024, 17, 16051–16070. [Google Scholar] [CrossRef]
- Tang, J.; Chen, Y.; Kukko, A.; Kaartinen, H.; Jaakkola, A.; Khoramshahi, E.; Hakala, T.; Hyyppa, J.; Holopainen, M.; Hyyppa, H. SLAM-Aided Stem Mapping for Forest Inventory with Small-Footprint Mobile LiDAR. Forests 2015, 6, 4588–4606. [Google Scholar] [CrossRef]
- Chuda, J.; Vybostok, J.; Tomastik, J.; Chudy, F.; Tunak, D.; Skladan, M.; Tucek, J.; Mokros, M. Prompt Mapping Tree Positions with Handheld Mobile Scanners Based on SLAM Technology. Land 2024, 13, 93. [Google Scholar] [CrossRef]
- Chudá, J.; Hunčaga, M.; Tuček, J.; Mokroš, M. The Handheld Mobile Laser Scanners as a Tool for Accurate Positioning under Forest Canopy. Int. Arch. Photogramm. Remote Sens. Spatial Inf. Sci. 2020, XLIII-B1-2020, 211–218. [Google Scholar] [CrossRef]
- Fan, Y.; Feng, Z.; Shen, C.; Khan, T.U.; Mannan, A.; Gao, X.; Chen, P.; Saeed, S. A trunk-based SLAM backend for smartphones with online SLAM in large-scale forest inventories. ISPRS J. Photogramm. Remote Sens. 2020, 162, 41–49. [Google Scholar] [CrossRef]
- Fan, Y.; Feng, Z.; Mannan, A.; Khan, T.U.; Shen, C.; Saeed, S. Estimating Tree Position, Diameter at Breast Height, and Tree Height in Real-Time Using a Mobile Phone with RGB-D SLAM. Remote Sens. 2018, 10, 1845. [Google Scholar] [CrossRef]
- Muhojoki, J.; Hakala, T.; Kukko, A.; Kaartinen, H.; Hyyppä, J. Comparing positioning accuracy of mobile laser scanning systems under a forest canopy. Sci. Remote Sens. 2024, 9, 100121. [Google Scholar] [CrossRef]
- Kukko, A.; Kaijaluoto, R.; Kaartinen, H.; Lehtola, V.V.; Jaakkola, A.; Hyyppa, J. Graph SLAM correction for single scanner MLS forest data under boreal forest canopy. ISPRS J. Photogramm. Remote Sens. 2017, 132, 199–209. [Google Scholar] [CrossRef]
- Wang, X.; Liang, X.; Campos, M.; Zhang, J.; Wang, Y. Benchmarking of Laser-Based Simultaneous Localization and Mapping Methods in Forest Environments. IEEE Trans. Geosci. Remote Sens. 2024, 62, 5706221. [Google Scholar] [CrossRef]
- Yang, H.; Chen, Y.; Liu, J.; Zhang, Z.; Zhang, X. A 3D Lidar SLAM System Based on Semantic Segmentation for Rubber-Tapping Robot. Forests 2023, 14, 1856. [Google Scholar] [CrossRef]
- Chave, J.; Rejou-Mechain, M.; Burquez, A.; Chidumayo, E.; Colgan, M.S.; Delitti, W.B.; Duque, A.; Eid, T.; Fearnside, P.M.; Goodman, R.C.; et al. Improved allometric models to estimate the aboveground biomass of tropical trees. Glob. Change Biol. 2014, 20, 3177–3190. [Google Scholar] [CrossRef]
- Witzmann, S.; Matitz, L.; Gollob, C.; Ritter, T.; Krassnitzer, R.; Tockner, A.; Stampfer, K.; Nothdurft, A. Accuracy and Precision of Stem Cross-Section Modeling in 3D Point Clouds from TLS and Caliper Measurements for Basal Area Estimation. Remote Sens. 2022, 14, 1923. [Google Scholar] [CrossRef]
- Proudman, A.; Ramezani, M.; Digumarti, S.T.; Chebrolu, N.; Fallon, M. Towards real-time forest inventory using handheld LiDAR. Robot. Auton. Syst. 2022, 157, 104240. [Google Scholar] [CrossRef]
- Zhou, S.; Kang, F.; Li, W.; Kan, J.; Zheng, Y.; He, G. Extracting Diameter at Breast Height with a Handheld Mobile LiDAR System in an Outdoor Environment. Sensors 2019, 19, 3212. [Google Scholar] [CrossRef]
- Faitli, T.; Hyyppa, E.; Hyyti, H.; Hakala, T.; Kaartinen, H.; Kukko, A.; Muhojoki, J.; Hyyppa, J. Integration of a Mobile Laser Scanning System with a Forest Harvester for Accurate Localization and Tree Stem Measurements. Remote Sens. 2024, 16, 3292. [Google Scholar] [CrossRef]
- Hyyppa, E.; Hyyppa, J.; Hakala, T.; Kukko, A.; Wulder, M.A.; White, J.C.; Pyorala, J.; Yu, X.; Wang, Y.; Virtanen, J.-P.; et al. Under-canopy UAV laser scanning for accurate forest field measurements. ISPRS J. Photogramm. Remote Sens. 2020, 164, 41–60. [Google Scholar] [CrossRef]
- Holmgren, J.; Tulldahl, M.; Nordlof, J.; Willen, E.; Olsson, H. Mobile Laser Scanning for Estimating Tree Stem Diameter Using Segmentation and Tree Spine Calibration. Remote Sens. 2019, 11, 2781. [Google Scholar] [CrossRef]
- Su, Y.; Guo, Q.; Jin, S.; Guan, H.; Sun, X.; Ma, Q.; Hu, T.; Wang, R.; Li, Y. The Development and Evaluation of a Backpack LiDAR System for Accurate and Efficient Forest Inventory. IEEE Geosci. Remote Sens. Lett. 2020, 18, 1660–1664. [Google Scholar] [CrossRef]
- Vandendaele, B.; Martin-Ducup, O.; Fournier, R.A.; Pelletier, G. Evaluation of mobile laser scanning acquisition scenarios for automated wood volume estimation in a temperate hardwood forest using quantitative structural models. Can. J. For. Res. 2024, 54, 774–792. [Google Scholar] [CrossRef]
- Xie, Y.; Yang, T.; Wang, X.; Chen, X.; Pang, S.; Hu, J.; Wang, A.; Chen, L.; Shen, Z. Applying a Portable Backpack Lidar to Measure and Locate Trees in a Nature Forest Plot: Accuracy and Error Analyses. Remote Sens. 2022, 14, 1806. [Google Scholar] [CrossRef]
- Kuzelka, K.; Surovy, P. Mapping Forest Structure Using UAS inside Flight Capabilities. Sensors 2018, 18, 2245. [Google Scholar] [CrossRef]
- Tupinamba-Simoes, F.; Pascual, A.; Guerra-Hernandez, J.; Ordonez, C.; de Conto, T.; Bravo, F. Assessing the Performance of a Handheld Laser Scanning System for Individual Tree Mapping-A Mixed Forests Showcase in Spain. Remote Sens. 2023, 15, 1169. [Google Scholar] [CrossRef]
- Čerňava, J.; Tuček, J.; Koreň, M.; Mokroš, M. Estimation of diameter at breast height from mobile laser scanning data collected under a heavy forest canopy. J. For. Sci. 2017, 63, 433–441. [Google Scholar] [CrossRef]
- Liu, C.; Xing, Y.; Duanmu, J.; Tian, X. Evaluating Different Methods for Estimating Diameter at Breast Height from Terrestrial Laser Scanning. Remote Sens. 2018, 10, 513. [Google Scholar] [CrossRef]
- Kuzelka, K.; Surovy, P. Noise Analysis for Unbiased Tree Diameter Estimation from Personal Laser Scanning Data. Remote Sens. 2024, 16, 1261. [Google Scholar] [CrossRef]
- Sterenczak, K.; Mielcarek, M.; Wertz, B.; Bronisz, K.; Zajaczkowski, G.; Jagodzinski, A.M.; Ochal, W.; Skorupski, M. Factors influencing the accuracy of ground-based tree-height measurements for major European tree species. J. Environ. Manag. 2019, 231, 1284–1292. [Google Scholar] [CrossRef]
- Kraus, K.; Pfeifer, N. Determination of terrain models in wooded areas with airborne laser scanner data. ISPRS J. Photogramm. Remote Sens. 1998, 53, 193–203. [Google Scholar] [CrossRef]
- Wang, Y.; Lehtomaki, M.; Liang, X.; Pyorala, J.; Kukko, A.; Jaakkola, A.; Liu, J.; Feng, Z.; Chen, R.; Hyyppa, J. Is field-measured tree height as reliable as believed A comparison study of tree height estimates from field measurement, airborne laser scanning and terrestrial laser scanning in a boreal forest. ISPRS J. Photogramm. Remote Sens. 2019, 147, 132–145. [Google Scholar] [CrossRef]
- Hyyppa, E.; Kukko, A.; Kaijaluoto, R.; White, J.C.; Wulder, M.A.; Pyorala, J.; Liang, X.; Yu, X.; Wang, Y.; Kaartinen, H.; et al. Accurate derivation of stem curve and volume using backpack mobile laser scanning. ISPRS J. Photogramm. Remote Sens. 2020, 161, 246–262. [Google Scholar] [CrossRef]
- Kato, A.; Moskal, L.M.; Schiess, P.; Swanson, M.E.; Calhoun, D.; Stuetzle, W. Capturing tree crown formation through implicit surface reconstruction using airborne lidar data. Remote Sens. Environ. 2009, 113, 1148–1162. [Google Scholar] [CrossRef]
- Wang, K.; Zhou, J.; Zhang, W.; Zhang, B. Mobile LiDAR Scanning System Combined with Canopy Morphology Extracting Methods for Tree Crown Parameters Evaluation in Orchards. Sensors 2021, 21, 339. [Google Scholar] [CrossRef]
- Jung, S.-E.; Kwak, D.-A.; Park, T.; Lee, W.-K.; Yoo, S. Estimating Crown Variables of Individual Trees Using Airborne and Terrestrial Laser Scanners. Remote Sens. 2011, 3, 2346–2363. [Google Scholar] [CrossRef]
- Hamraz, H.; Jacobs, N.B.; Contreras, M.A.; Clark, C.H. Deep learning for conifer/deciduous classification of airborne LiDAR 3D point clouds representing individual trees. ISPRS J. Photogramm. Remote Sens. 2019, 158, 219–230. [Google Scholar] [CrossRef]
- Mizoguchi, T.; Ishii, A.; Nakamura, H.; Inoue, T.; Takamatsu, H. Lidar-based Individual Tree Species Classification using Convolutional Neural Network. Videometr. Range Imaging Appl. XIV 2017, 10332, 193–199. [Google Scholar]
- Tockner, A.; Kraßnitzer, R.; Gollob, C.; Witzmann, S.; Ritter, T.; Nothdurft, A. Tree species classification using intensity patterns from individual tree point clouds. Int. J. Appl. Earth Obs. Geoinf. 2025, 139, 104502. [Google Scholar] [CrossRef]
- Yu, X.; Hyyppa, J.; Litkey, P.; Kaartinen, H.; Vastaranta, M.; Holopainen, M. Single-Sensor Solution to Tree Species Classification Using Multispectral Airborne Laser Scanning. Remote Sens. 2017, 9, 108. [Google Scholar] [CrossRef]
- Wang, M.; Wong, M.S.; Abbas, S. Tropical Species Classification with Structural Traits Using Handheld Laser Scanning Data. Remote Sens. 2022, 14, 1948. [Google Scholar] [CrossRef]
- Wu, Y.; Zhang, X. Object-Based Tree Species Classification Using Airborne Hyperspectral Images and LiDAR Data. Forests 2020, 11, 32. [Google Scholar] [CrossRef]
- Guan, H.; Yu, Y.; Ji, Z.; Li, J.; Zhang, Q. Deep learning-based tree classification using mobile LiDAR data. Remote Sens. Lett. 2015, 6, 864–873. [Google Scholar] [CrossRef]
- Liu, B.; Chen, S.; Huang, H.; Tian, X. Tree Species Classification of Backpack Laser Scanning Data Using the PointNet plus plus Point Cloud Deep Learning Method. Remote Sens. 2022, 14, 3809. [Google Scholar] [CrossRef]
- Liu, M.; Han, Z.; Chen, Y.; Liu, Z.; Han, Y. Tree species classification of LiDAR data based on 3D deep learning. Measurement 2021, 177, 109301. [Google Scholar] [CrossRef]
- Chen, J.; Chen, Y.; Liu, Z. Classification of Typical Tree Species in Laser Point Cloud Based on Deep Learning. Remote Sens. 2021, 13, 4750. [Google Scholar] [CrossRef]
- Hyyppä, E.; Kukko, A.; Kaartinen, H.; Yu, X.; Muhojoki, J.; Hakala, T.; Hyyppä, J. Direct and Automatic Measurements of Stem Curve and Volume Using a High-resolution Airborne Laser Scanning System. Sci. Remote Sens. 2022, 5, 100050. [Google Scholar] [CrossRef]
- Huncaga, M.; Chuda, J.; Tomastik, J.; Slamova, M.; Koren, M.; Chudy, F. The Comparison of Stem Curve Accuracy Determined from Point Clouds Acquired by Different Terrestrial Remote Sensing Methods. Remote Sens. 2020, 12, 2739. [Google Scholar] [CrossRef]
- Muhojoki, J.; Tavi, D.; Hyyppa, E.; Lehtomaki, M.; Faitli, T.; Kaartinen, H.; Kukko, A.; Hakala, T.; Hyyppa, J. Benchmarking Under- and Above-Canopy Laser Scanning Solutions for Deriving Stem Curve and Volume in Easy and Difficult Boreal Forest Conditions. Remote Sens. 2024, 16, 1721. [Google Scholar] [CrossRef]
- Huang, H.; Liu, C.; Wang, X.; Zhou, X.; Gong, P. Integration of multi-resource remotely sensed data and allometric models for forest aboveground biomass estimation in China. Remote Sens. Environ. 2019, 221, 225–234. [Google Scholar] [CrossRef]
- Nelson, R.; Gobakken, T.; Næsset, E.; Gregoire, T.; Ståhl, G.; Holm, S.; Flewelling, J. Lidar sampling—Using an airborne profiler to estimate forest biomass in Hedmark County, Norway. Remote Sens. Environ. 2012, 123, 563–578. [Google Scholar] [CrossRef]
- Puliti, S.; Breidenbach, J.; Astrup, R. Estimation of Forest Growing Stock Volume with UAV Laser Scanning Data: Can It Be Done without Field Data? Remote Sens. 2020, 12, 1245. [Google Scholar] [CrossRef]
- Zhao, Y.; Ma, Y.; Quackenbush, L.J.; Zhen, Z. Estimation of Individual Tree Biomass in Natural Secondary Forests Based on ALS Data and WorldView-3 Imagery. Remote Sens. 2022, 14, 271. [Google Scholar] [CrossRef]
- Kenzo, T.; Furutani, R.; Hattori, D.; Kendawang, J.J.; Tanaka, S.; Sakurai, K.; Ninomiya, I. Allometric equations for accurate estimation of above-ground biomass in logged-over tropical rainforests in Sarawak, Malaysia. J. For. Res. 2009, 14, 365–372. [Google Scholar] [CrossRef]
- Zhang, Y.; Xue, S.; Liu, S.; Li, X.; Fan, Q.; Xiong, N.; Wang, J. Comparative Study of Single-Wood Biomass Model at Plot Level Based on Multi-Source LiDAR. Forests 2024, 15, 795. [Google Scholar] [CrossRef]
- Wang, D.; Hollaus, M.; Puttonen, E.; Pfeifer, N. Fast and robust stem reconstruction in complex environments using terrestrial laser scanning. Int. Arch. Photogramm. Remote Sens. Spat. Inf. Sci. 2016, 41, 411–417. [Google Scholar] [CrossRef]
- Vaaja, M.T.; Virtanen, J.P.; Kurkela, M.; Lehtola, V.; Hyyppä, J.; Hyyppä, H. The Effect of Wind on Tree Stem Parameter Estimation Using Terrestrial Laser Scanning. ISPRS Ann. Photogramm. Remote Sens. Spat. Inf. Sci. 2016, 3, 117–122. [Google Scholar]
- Ko, C.; Kang, J.; Park, J.; Lee, M. Assessing Forest Resources with Terrestrial and Backpack LiDAR: A Case Study on Leaf-On and Leaf-Off Conditions in Gari Mountain, Hongcheon, Republic of Korea. Forests 2024, 15, 2230. [Google Scholar] [CrossRef]
- Windrim, L.; Bryson, M. Detection, Segmentation, and Model Fitting of Individual Tree Stems from Airborne Laser Scanning of Forests Using Deep Learning. Remote Sens. 2020, 12, 1469. [Google Scholar] [CrossRef]
- Faitli, T.; Hakala, T.; Kaartinen, H.; Hyyppä, J.; Kukko, A. Real-time Lidar-inertial Positioning and Mapping for Forestry Automation. Int. Arch. Photogramm. Remote Sens. Spatial Inf. Sci. 2023, XLVIII-1/W1-2023, 145–150. [Google Scholar] [CrossRef]
- Cernava, J.; Mokros, M.; Tucek, J.; Antal, M.; Slatkovska, Z. Processing Chain for Estimation of Tree Diameter from GNSS-IMU-Based Mobile Laser Scanning Data. Remote Sens. 2019, 11, 615. [Google Scholar] [CrossRef]
- Abegg, M.; Boesch, R.; Schaepman, M.E.; Morsdorf, F. Impact of Beam Diameter and Scanning Approach on Point Cloud Quality of Terrestrial Laser Scanning in Forests. IEEE Trans. Geosci. Remote Sens. 2021, 59, 8153–8167. [Google Scholar] [CrossRef]
- Polewski, P.; Yao, W.; Cao, L.; Gao, S. Marker-free coregistration of UAV and backpack LiDAR point clouds in forested areas. ISPRS J. Photogramm. Remote Sens. 2019, 147, 307–318. [Google Scholar] [CrossRef]
- Pierzchala, M.; Giguere, P.; Astrup, R. Mapping forests using an unmanned ground vehicle with 3D LiDAR and graph-SLAM. Comput. Electron. Agric. 2018, 145, 217–225. [Google Scholar] [CrossRef]
- Zhou, T.; Zhao, C.; Wingren, C.P.; Fei, S.; Habib, A. Forest feature LiDAR SLAM (F2-LSLAM) for backpack systems. ISPRS J. Photogramm. Remote Sens. 2024, 212, 96–121. [Google Scholar] [CrossRef]
Disclaimer/Publisher’s Note: The statements, opinions and data contained in all publications are solely those of the individual author(s) and contributor(s) and not of MDPI and/or the editor(s). MDPI and/or the editor(s) disclaim responsibility for any injury to people or property resulting from any ideas, methods, instructions or products referred to in the content. |
© 2025 by the authors. Licensee MDPI, Basel, Switzerland. This article is an open access article distributed under the terms and conditions of the Creative Commons Attribution (CC BY) license (https://creativecommons.org/licenses/by/4.0/).