Article

Research on Tree Point Cloud Enhancement Based on Deep Learning

1
College of Mechanical and Electrical Engineering, Northeast Forestry University, Harbin 150040, China
2
College of Agriculture, Shihezi University, Shihezi 832003, China
*
Author to whom correspondence should be addressed.
Forests 2025, 16(6), 915; https://doi.org/10.3390/f16060915
Submission received: 1 May 2025 / Revised: 26 May 2025 / Accepted: 28 May 2025 / Published: 29 May 2025

Abstract

:
The acquisition of high-quality tree point cloud datasets facilitates research in various forestry fields, including tree species classification, diversity monitoring, and biomass estimation. However, due to limitations in sensor performance and occlusion between trees, tree point clouds acquired using LiDAR scanners often exhibit missing data. This not only degrades the quality of the point clouds, but also significantly reduces the number of usable samples. Therefore, this study proposed a tree point cloud enhancement system, which included the completion network and the sample augmentation network. The point cloud completion network utilized a transformer-based improved module to predict missing point clouds and combined up-sampling processing to progressively complete the point clouds from coarse to fine. This could improve the subsequent model decisions and performance through data balancing. On the other hand, the sample augmentation network, based on an adversarial learning strategy, separately constructed the generator and the classifier. By applying shape transformations, point displacements, and point drop to complete point cloud samples, the learnable parameters in the generator and the classifier were alternately optimized. This process enhanced both the quality and the quantity of the tree point cloud dataset. In addition, this study introduced a multi-head attention pooling layer, which further enhanced the joint network’s ability to learn and extract tree structural features. The experimental results showed that the completion network successfully restored missing tree point clouds of various types, achieving an average Chamfer Distance of 4.84 and an average F-score of 0.90. The experiments also demonstrated the effectiveness and robustness of the sample augmentation network, which improved classification accuracy by approximately 2.9% compared to the original dataset.

1. Introduction

The rapid development of the LiDAR (light detection and ranging) technology has provided new avenues for forest surveys. As an active remote sensing technology, LiDAR can capture vertical structural information of forests, providing strong support for accurate tree segmentation and parameter extraction [1,2]. However, due to limitations such as the acquisition environment and occlusion between trees, the forest point cloud data often suffer from structural deficiencies and sparse point sets, leading to degraded quality [3,4]. Additionally, low-quality point clouds may lead to an insufficient number of training samples, negatively impacting subsequent tree species classification and biomass estimation results. Unlike 2D images and videos or 2.5D data (e.g., digital elevation models), 3D point clouds can provide complete spatial coordinates and rich attribute information in volumetric space. They exhibit unordered and discontinuous characteristics. This means that traditional data augmentation methods cannot be directly applied to process them. Therefore, accurately and efficiently implementing point cloud data augmentation has become an urgent issue that needs to be addressed.
Point cloud quality enhancement mainly involves two aspects: point cloud completion and point cloud up-sampling [5]. Point cloud completion refers to the process of recovering the full point cloud information. Point cloud up-sampling, on the other hand, reconstructs high-resolution point clouds from input low-resolution data [6,7,8]. Traditional methods for point cloud quality enhancement heavily rely on prior knowledge of the point cloud’s structure. These methods can only process data with ground truth templates or point clouds that have accurately calibrated normal vectors [9,10]. “Ground truth” refers to the standardized data obtained through manual annotation or reliable measurements, which serve as the benchmark for evaluating model prediction results. However, recent studies have achieved better point cloud quality enhancement performance by leveraging the powerful feature extraction capabilities of deep learning networks. In point cloud completion, Yuan et al. [11] proposed PCN, which processes raw point clouds without structural assumptions. Huang et al. [12] introduced PF-Net, an encoder–decoder network that captures multi-resolution data for reconstruction. Compared to convolutional neural networks (CNNs), transformers with attention mechanisms have demonstrated advantages in capturing information from long-distance interactions. PoinTr [13] uses self-attention to learn local/global structures, while Skeleton-Detail Transformer [14] refines shapes through coarse-to-fine correlation. For point cloud up-sampling, Yu et al. [15] developed PU-Net (based on PointNet++), which expands multi-level features but struggles with local details. PU-GAN [16,17] employs adversarial training, where a generator produces up-sampled clouds and a discriminator optimizes realism. Similarly, transformers have also shown promise in point cloud up-sampling. PU-Transformer [18] enhances channel interactions via multi-head attention, and PU-CRN [19] combines up-sampling/refinement networks with transformer modules for higher-quality outputs. Although point cloud quality enhancement techniques have made significant progress, their application to tree point clouds still requires further validation.
On the other hand, point cloud data augmentation refers to the use of geometric transformation methods—such as rotation, translation, jittering, flipping, and random scaling—to generate new data samples based on the original dataset [8,20]. This can enhance the training of neural network models by improving data diversity and volume. With the rapid development of deep learning, research on point cloud data augmentation techniques has expanded. Li et al. [21] proposed a deep learning network framework named PointAugment for point cloud classification. It used an adversarial learning strategy to jointly optimize the enhancer and classifier networks for automatic sample data augmentation. Chen et al. [22] introduced the PointMixup augmentation network based on shortest-path interpolation, which creatively performed automatic mixing of object point clouds to generate new sample instances. However, this process can result in the loss of local semantic information. The PA-AUG network proposed by Jaeseok [23] divides objects into multiple partitions. By randomly applying several augmentation methods to each local region, the network greatly increases the diversity of the newly generated samples. The limitation of this approach is that there should not be excessive overlap between objects. Xiao et al. [24] introduced two augmentation techniques in their PolarMix model: scene-level and object-level. The scene-level technique achieves data augmentation by swapping regions within the scene point cloud. The object-level technique achieves data augmentation by inserting object point clouds into the scene on a large scale. Zheng et al. [25] demonstrated the effectiveness of mixing techniques through their SA–DA algorithm, which augments vehicle point clouds via discard, swap, and sparsification operations. However, the structure of tree point clouds is irregular, and transformation methods suitable for regular objects may not be applicable to tree point clouds. Therefore, developing suitable augmentation methods for tree point clouds remains a significant challenge.
In summary, the development of 3D point cloud data augmentation techniques has enhanced the robustness and generalization capabilities of data processing models, while also providing new insights for optimizing 3D point cloud algorithms. Although these advanced data augmentation techniques have yielded significant results, their applications are mainly limited to man-made objects, such as airplanes, cars, and furniture. These objects typically have regular shapes, flat surfaces, and symmetric structures [
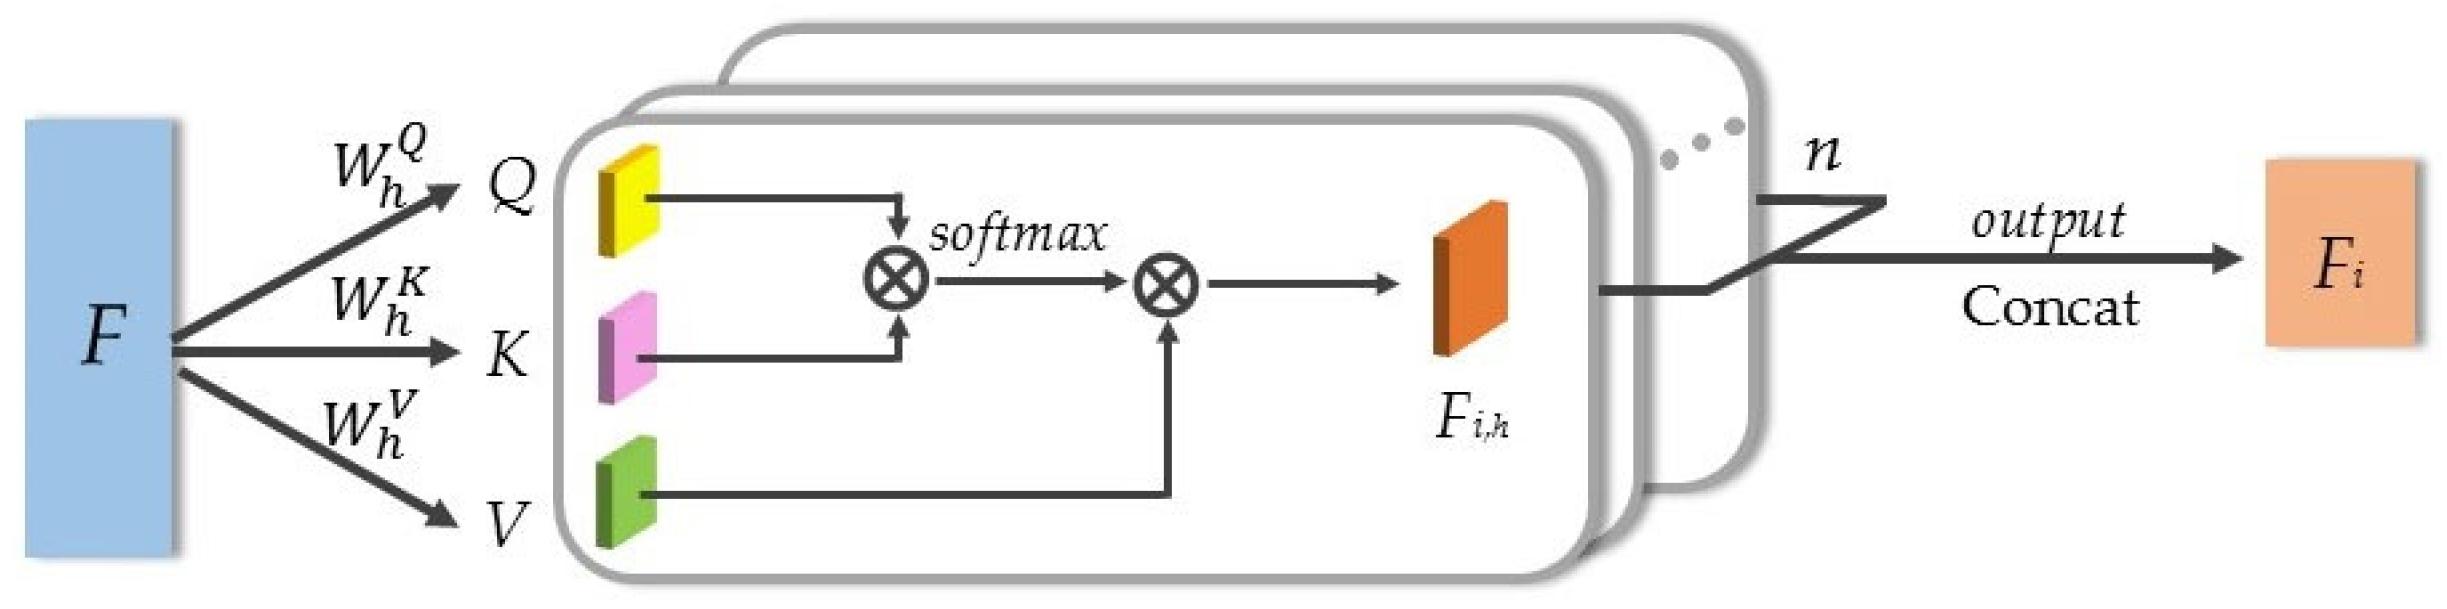
7]. In contrast, tree point clouds have more complex structures with specific regional characteristics, which impose higher demands on augmentation networks. This study selected the Experimental Forest of the Northeast Forestry University in Harbin, Heilongjiang Province, China, as the research area, and proposed a system for tree point cloud enhancement to address the aforementioned issues, which included point cloud completion and sample augmentation networks. The contributions of this study are as follows. (1) To handle the complex structure of tree point clouds, the completion network used a multi-head attention mechanism to extract features and predict missing parts. The sample augmentation network combined several transformation methods suitable for tree point clouds and used an adversarial learning strategy for data augmentation. (2) To address the potential loss of feature information in traditional pooling processes, this study improved the pooling layer with a multi-head self-attention mechanism, enhancing the ability to extract and propagate information. (3) The experimental results demonstrated that the combined network employed in this study can effectively enhance complex tree point clouds, with overall performance surpassing that of other mainstream point cloud augmentation networks.

2. Materials

2.1. Overview of the Study Area and Data Acquisition

The study area is located in the urban forestry demonstration base of the Northeast Forestry University, with geographic coordinates ranging from 127°35′ E to 127°39′ E and from 45°42′ N to 45°44′ N, at an elevation of 136–140 m. It is situated in the central urban area of Harbin, Heilongjiang Province, covering an area of 44 ha [26]. The vegetation types within the demonstration base are primarily cold-temperate coniferous forests and temperate mixed conifer–broadleaf forests, which serve as a gene bank for valuable, rare, and economically significant tree species in northern China. The demonstration base is planted with various tree species, including Larix gmelini Rupr., Pinus sylvestris var. mongolica Litv., Betula platyphylla Suk., Quercus mongolica Fisch. ex Ledeb., Fraxinus mandschurica Rupr., and Pinus tabuliformis var. mukdensis [27]. The geographic location and plot setup of the study area are shown in Figure 1.
In this study, point cloud data were collected using the UAV-based LiDAR system. This system offers several advantages, including low cost, high efficiency, and the ability to quickly acquire high-precision tree point clouds over large areas, making it superior to LiDAR systems mounted on other platforms. The UAV platform used a Jingwei M300 RTK equipped with a DJI Zenmuse L1, which integrated a Livox LiDAR module, a high-precision inertial navigation system (INS), a survey-grade camera, and a three-axis gimbal. The equipment was manufactured by DJI (Shenzhen, China) and leased from Heilongjiang Jingzhen Science & Technology Development Co., Ltd. (Harbin, China). These features enabled all-weather, high-efficiency real-time 3D data acquisition and high-precision post-processing in complex environments. Data collection was conducted on 4 May 2021, with the UAV flying at an altitude of 100 m, a speed of 5 m/s, a lateral overlap of 50%, and a sampling frequency of 160 kHz. The point cloud dataset contained 187 million points, with an average point density of 200 points per square meter. The field measurement data collection began the following day, during which all dominant tree species within each plot were measured, and their basic information was recorded. Furthermore, tree coordinates were measured using a handheld RTK.

2.2. Preparation of the Original Dataset

This study used Visual Studio 2017 (Microsoft, Redmond, WA, USA) for data preprocessing. First, the isolated point algorithm [28] was used to remove individual noise points. In this study, the search radius was set to 6 m, and the number of neighboring points was set to 4. Subsequently, the progressive TIN densification algorithm [29] was used to separate ground points from tree points. After comparing the results of different parameter settings, it was found that the best separation of ground points occurred when the iteration angle was set to 8 degrees and the iteration distance to 1.5 m. Then, the watershed algorithm based on markers, proposed by Chen et al. [30], was applied to segment individual trees. To obtain more accurate ground truth data of tree point clouds, we employed meticulous manual annotation to replace automated algorithms for editing over-segmented and under-segmented point clouds. The reason for this approach was that automated algorithms were more prone to misjudgment when processing incorrectly segmented trees. Then, the segmented point cloud data were matched with the RTK positioning data obtained from the field survey to ensure that the segmentation results accurately represented the real trees. In total, 1415 individual tree point clouds were collected, including 284 Larix gmelini, 237 Pinus sylvestris, 185 Pinus tabuliformis, 209 Fraxinus mandschurica, 307 Quercus mongolica, and 193 Betula platyphylla.

3. Methods

This study proposed a system for tree point cloud enhancement to address potential issues such as missing canopy point clouds and insufficient sample size in the constructed individual tree point cloud dataset. The system consisted of two parts: (1) point cloud completion network, which completed the missing canopy data of individual trees and performed up-sampling to improve the quality of the individual tree point clouds, and (2) sample augmentation network. After the generator produced new samples, its learnable parameters were updated by computing the generator’s loss. While keeping the generator’s parameters fixed, both the original and newly generated samples were then fed into the discriminator. The discriminator’s learnable parameters were subsequently updated based on its loss calculation, thereby achieving alternating optimization of the augmentation network. The overall architecture is described in Figure 2.

3.1. Point Cloud Completion Network

The structure of the point cloud completion network is shown in Figure 3. The network consisted of two main components: (1) the coarse point cloud generation network used the seed point generator to produce the rough skeleton point cloud, and the Upsample Transformer module was applied to complete the missing parts of the skeleton shape (the inclusion of this module helped improve the extraction of global features); and (2) the fine point cloud generation network. Following the coarse-to-fine strategy, multiple up-sampling layers were designed to progressively transform the rough skeleton point cloud into the fine and complete point cloud.

3.1.1. Network for Generating Coarse Point Clouds

The original point cloud of the input skeleton-generating network was marked as P = {pi|i = 1, 2,…, N} ∈ RN×3, where N was the total number of points and pi had (x, y, z) coordinate information. First, feature extraction was conducted on the incomplete tree point cloud by setting up multiple abstraction layers [31]. During the extraction process, the number of points gradually decreased and the point density progressively decreased, ultimately yielding both the feature matrix Fp ∈ RNp×Cp (Cp represents the number of channels), representing the local structural characteristics of the point cloud, and the corresponding centroid coordinates Pp ∈ RNp×3. At the same time, the global feature Fg of the tree was extracted using shared MLP and pooling layers. Since the extracted features were inherently incomplete, this study introduced the Upsample Transformer module to complete the missing points in the cloud [32]. Given the patch feature Fp and center coordinates Pp, the Upsample Transformer module generated the set of new seed point features Fs (Equation (1)). Then, the MLP was applied to the combined features of Fs and Fg to generate the corresponding seed points. In summary, the primary function of this module was to predict the complete point cloud by combining neighborhood point features with global features, thereby generating a set of sparse seed point clouds.
F s = U p T r a n s F p , P p = f i i = 1 N s R N s × C s
The Upsample Transformer module was designed based on the Point Transformer architecture [33], exhibiting robust feature extraction and computational capabilities, as shown in Figure 4. The core of this design lies in the query (Q), key (K), and value (V) vectors that drive the attention mechanism, along with positional encoding δ that captures spatial relationships. The process begins with seed generation where low-resolution point clouds and their corresponding seed features are processed through shared MLPs to generate per-point query vectors Q, while key vectors K are derived from the previous layer’s features to preserve geometric context. Value vectors V are then produced by transforming concatenated Q and K features, enriched with learnable positional encoding δ to enhance local geometric awareness. In the seed point cloud, S and Fs represent the semantic information within local regions. The generation of new point clouds can be interpreted as the result of self-attention weighted averaging of point features within local regions. However, using the normalization function softmax would constrain the attention weights of Upsample Transformer to the range of (0, 1), which may limit the generative scope of new points. Therefore, we opted to disable softmax in this module, enabling more effective generation of high-quality seed points [32].

3.1.2. Network for Generating Fine Point Clouds

Point cloud up-sampling was essentially the process of transforming the point cloud from coarse to fine resolution. As shown in Figure 3, this process consisted of multiple up-sampling layers, where each layer output the denser point cloud sample Pi (i = 1, 2, 3,…). The initial input point cloud P0 was generated by merging the seed points S with the input point cloud P based on farthest point sampling (FPS) [31], with the aim of preserving the structural information of the original input point cloud. Additionally, integrating the seed point features into each up-sampling layer provided regional semantic information. For the given input point cloud Pi ∈ RNi×3, the seed features were propagated by interpolation in the point-by-point neighborhood, and the corresponding interpolation features s = {si|i = 1, 2, 3,… n}. The interpolated features were calculated based on the inverse distance weighted average method [21].
The Upsample Transformer module can also be applied in the up-sampling layers, as shown in Figure 4. For the input point cloud Pi and the corresponding interpolated features s, they were concatenated and passed through the shared MLP to form the query Q = {Qi|i = 1, 2, 3,… n}. Then, the output features from the previous up-sampling layer were used as the key K = {Ki|i = 1, 2, 3,… n} in Upsample Transformer, which helped retain the learned feature information from the input point cloud. The values V = {Vi|i = 1, 2, 3,… n} were obtained by applying an MLP to the concatenated Q and K. Local geometric structure information was learned by applying the self-attention mechanism to the features extracted from V. These features were combined across all kernels to construct the up-sampled output, serving dual purposes as both the enhanced point features and the keys Kn+1 for subsequent layers. The final point cloud reconstruction predicted displacement offsets ΔPi through additional MLPs, refining the existing points while generating new ones through coordinate adjustment. Throughout this process, skip connections maintained multi-scale feature consistency, and the entire architecture emphasized geometric sensitivity through explicit spatial encoding and adaptive local attention, enabling high-fidelity point cloud generation and completion tasks. To normalize the computed weights to a balanced scale, the module used the softmax normalization function. This caused the up-sampling layer to generate a denser point cloud within the neighborhood of the seed points.

3.1.3. Loss Function of the Point Cloud Completion Network

Chamfer distance (CD) was introduced by Barrow et al. [34] in 1977 and was commonly used as a loss function in 3D reconstruction. In point cloud completion, the similarity between two point clouds is quantified by computing the average summed distance between each point in one cloud and its nearest neighbor in the other cloud. If A is the completed point cloud, B is the corresponding ground truth point cloud, and x and y are arbitrary points in A and B, respectively, then the CD is calculated as follows:
C D A , B = 1 A min x y 2 + 1 B min y x 2
As the CD value decreases, the predicted complete point cloud from the completion network becomes closer to the ground truth, and vice versa. Therefore, the ground truth point cloud is down-sampled using FPS to match the number of points in the seed point cloud and the input point clouds of each up-sampling layer. The CD loss between the ground truth and the corresponding network input point clouds is calculated and denoted as Ls and Li (i = 1, 2, 3,… n). Thus, the total loss function of the completion network is defined as follows:
L = L s + i = 1 i L i

3.2. Sample Augmentation Network

In the augmentation of tree point cloud samples, this study introduced and improved the PointAugment framework [21]. The framework of this study adopted an adversarial network strategy, consisting of a generator and a classifier as two deep learning components, as shown in Figure 5. Given an input training dataset T, where each sample has N points, before the classifier was trained with T, we fed T first to the generator to generate an augmented sample T′. Then, T and T′ were separately input into the classifier for training, and we further took the classifier’s results as feedback to guide the training of the generator. This adversarial training approach can effectively enhance the network’s performance and efficiency. Additionally, considering the characteristics of tree point clouds, shape transformations (including rotation, scaling, and their combinations), point displacement, and point drop were applied in this study during sample augmentation. However, augmentation methods similar to mix-up may significantly alter the structural features and attributes of the tree point clouds, which could adversely affect subsequent tree species classification studies [8,22].

3.2.1. Network of the Generator

The design structure of the generator is shown in Figure 5. Firstly, a series of MLPs were employed to extract per-point features F ∈ RN×C, followed by max pooling to obtain the per-shape feature vector G ∈ R1×C. Then, this study used three independent modules to augment the input sample T based on PointAugment: (1) the shape regression to generate transformation S ∈ R3×3, (2) the point direction regression to generate displacement D, and (3) the mask-based method to generate point drop M. Here, S was a linear matrix in three-dimensional space, primarily combining rotation and scaling transformations. For the update of S, a C-dimension noise vector was generated based on a Gaussian distribution and concatenated with G, after which MLPs were utilized to obtain S; D performed point-wise translation and jittering. For the update of D, N copies of G were concatenated with F, together with an N × C noise matrix whose values were randomly and independently generated based on a Gaussian distribution. Finally, MLPs were employed to obtain D; and M was a 0–1 vector generated by binarizing the threshold function f. N copies of G were concatenated with F. Then, MLPs were employed to obtain M (N × 1). Finally, the original sample T was transformed into a new sample T1′ through matrix multiplication with M. This occurred since the point features were extracted in a point-wise manner, and deleting the point feature was equivalent to removing the corresponding point. On the other hand, the application of variable parameters in the threshold function provided diversified choices for the mask vector M. The specific formula is as follows:
K ( m i , t ) = 1 m i t 0 m i < t
In the equation, mi represents the values of the elements in the initial mask vector before binarization and t is the variable parameter. When mit, the output value is 1, indicating that the point feature can be retained; when mi < t, the output value is 0, indicating that the point feature should be deleted.
In summary, multiplying the point features by the mask M resulted in sparse features, effectively achieving point drop. In summary, S, D, and M were used to generate the augmented sample T′ = (T·S + D, T·M).

3.2.2. Network of the Classifier

The classifier design approach was to use the original dataset T and the augmented samples T′ as inputs, extract the global features using the classification network, and then predict the category labels based on the fully connected layers. This study used PointNet++, which is widely applied in point cloud classification, as the main component. Figure 5 shows the structure of the classifier based on the PointNet++ network. Each level of abstraction included a sampling layer, a grouping layer, and a PointNet layer. T, T1′, and T2′ were taken as inputs in three separate rounds, with corresponding class labels being predicted. The hierarchical feature extraction was performed through three cascaded Set Abstraction modules (SA 1 to SA 3) integrated with the PointNet architecture, yielding a 1 × C′ dimensional feature representation. These features were then processed by fully connected layers to produce final 1 × K dimensional class scores, completing the end-to-end computation from raw point clouds to classification results. The model used metric space distances to extract local features from the input point cloud data in neighborhoods at different scales, constructing local region sets by identifying neighboring points around each group’s center point. The local region patterns were encoded as feature vectors, which were pooled to generate global features. The classification was ultimately achieved based on the combination of local and global features. Additionally, since the density distribution of the original tree point clouds obtained using ULS was uneven, the PointNet++ network adopted the multi-scale grouping (MSG) method. MSG concatenated feature data at different scales in a simple yet effective manner to form multi-scale features [31].

3.2.3. Loss Function of Sample Augmentation Network

To further enhance the learning performance of the network, the augmented sample T′ should satisfy the following: (1) the loss of T′ should be greater than the loss of T, i.e., L(T′) > L(T); (2) the shape of T′ should be unique, but this uniqueness must be constrained within an acceptable range. Therefore, the generator’s loss function is as follows:
L A = L T + λ 1 exp L T ρ L T
ρ = max ( 1 , exp c = 1 K y ^ c y c )
In the equation, ρ is a variable hyperparameter, with a value greater than or equal to 1, and yc represents the predicted probability. During the early stages of training, the prediction is more challenging, so the value of ρ is relatively small. As the prediction capability of the classifier improves with training, the value of ρ increases to provide more challenging augmented samples. λ is a fixed hyperparameter used to control the importance of each term. When λ is small, the augmentation of the original sample T is minor, and vice versa (in this experiment, λ = 1).
The task of the classifier is to correctly predict T and T′. Meanwhile, it also needs to accurately reflect the differences between T and T′. Therefore, the classifier loss LC is expressed as follows:
L C = L T + L T + γ F g F g 2
In the equation, γ is a hyperparameter set to 10.0, used to balance the importance of different terms. The term F g F g 2 captures the feature differences between the augmented samples and the original samples, providing feedback to improve the augmentation process. After generating augmented samples, the loss of the generator was calculated to update its learnable parameters. Subsequently, while keeping the parameters of the generator unchanged, both the original and the augmented samples were fed into the classifier. The loss of the classifier was used to update its learnable parameters. Therefore, this iterative process enabled the generator and the classifier in the point cloud augmentation network to be optimized alternately.

3.3. Optimization Module of Multi-Head Self-Attention Pooling

Compared to other terrestrial point clouds, tree point clouds typically exhibit irregular morphological structures. This means that tree point clouds lack prominent local features. Therefore, a critical challenge is how to effectively aggregate these local features to generate representative global features. On the other hand, in point cloud completion networks and augmentation networks, max pooling is typically used to aggregate neighborhood features and generate fixed-length global features. However, the effectiveness of max pooling is limited by the size of the pooling window. During down-sampling, only the maximum point features are preserved, while other features are discarded, leading to significant information loss. To overcome these limitations, this study introduced the multi-head self-attention mechanism (MHSA) [35,36,37] during the pooling stage to optimize the process and enhance the ability of the network model to capture significant local features. In traditional attention mechanisms, the dimensions of the parameter matrix are limited, making single-pass learning of input information prone to feature extraction ambiguity. In contrast, the multi-head mechanism employs multiple parameter matrices, each mapping input information into distinct vector spaces through linear transformations, and integrates these diverse outputs. In addition, the self-attention mechanism focuses on the interactions between individual elements within a sequence, enabling it to more comprehensively capture the latent contextual relationships within the input information. The specific structural diagram is shown in Figure 6.
The feature expression after the final pooling is as follows:
M P F i = h = 1 h ( F i 1 , F i 2 , , F i h ) H i
In the equation, (…) represents the summation of information Fih learned from different attention mechanisms, which is fused with parameters Hi learned from the network to output global features. Here, W h Q , W h K , and W h V are the linear mapping weight matrices of the hth subspace of matrix F, and headh is the feature matrix generated for the hth subspace through the self-attention mechanism. Compared to the method of max pooling, which retains only dominant features, the multi-head self-attention pooling not only enhances the ability to extract point cloud features, but also significantly reduces the loss of sample features during information transmission.

4. Experiments and Results

4.1. Implementation Details

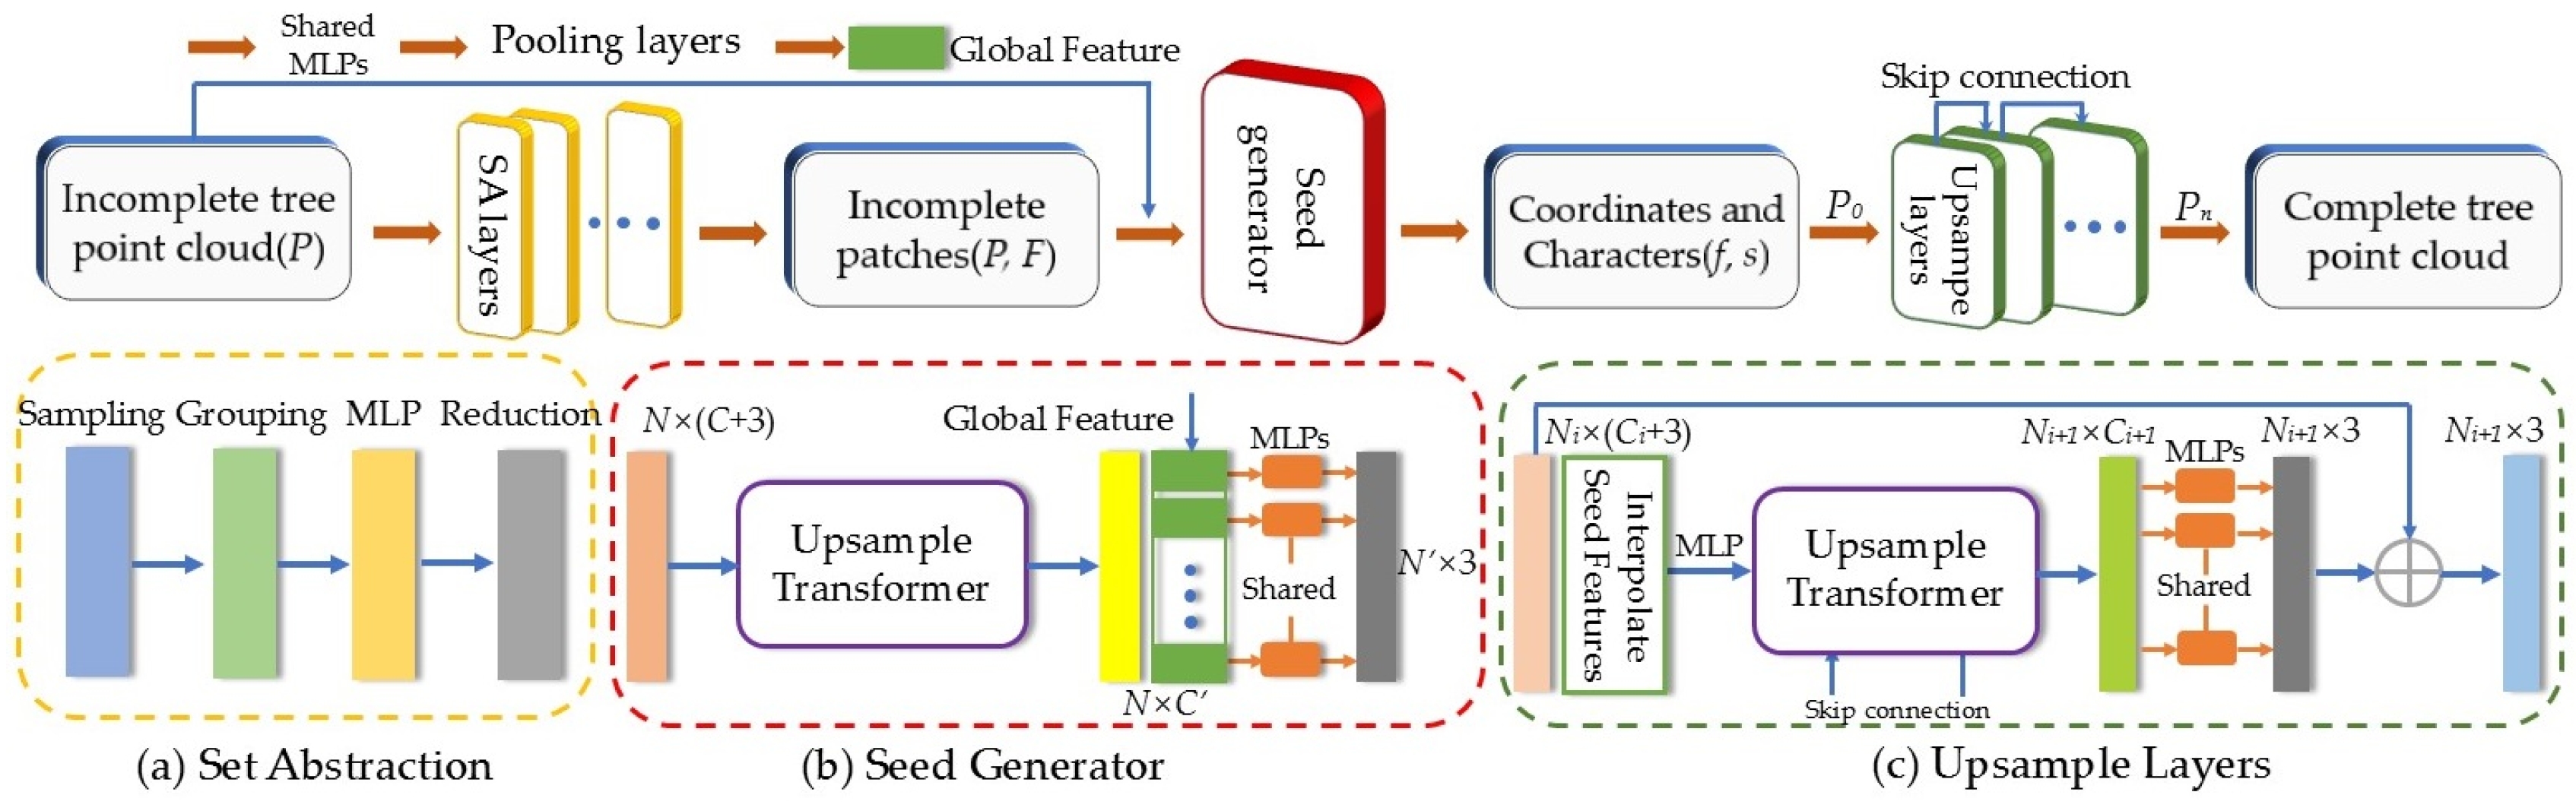
In this study, all deep learning-based networks were implemented using PyTorch 1.11.0 on a Windows operating system, with Python 3.6 as the programming language. For the point cloud completion network, the coarse point cloud generation network included 3 sets of integrated abstraction layers, while the fine point cloud generation network utilized 3 up-sampling layers. The batch size was set to 8, with 300 epochs per batch. The Adam optimizer was used with an initial learning rate of 0.001. On the other hand, the point cloud augmentation network was trained for 250 epochs with a batch size of 8, also using the Adam optimizer with an initial learning rate of 0.001. Furthermore, all experiments were carried out on a Dell Precision 7550 workstation equipped with an Intel Core i9-10885H CPU processor (Intel Inc., Santa Clara, CA, USA) and an NVIDIA Quadro RTX 4000 GPU (16 GB). The complete training time for the network was approximately 34.2 h, with the completion network training taking about 18.7 h and the augmentation network training taking about 15.5 h. The system exhibited a memory footprint of 12.8 Gb.
For dataset preparation, the 1415 collected original tree point cloud samples were divided into two groups: coniferous and broadleaf. The coniferous group consisted of Pinus sylvestris, Larix gmelinii, and Pinus tabuliformis, while the broadleaf group consisted of Betula platyphylla, Fraxinus mandshurica, and Quercus mongolica. To test the point cloud completion network, uniform sampling was used to extract 12,288 points as the complete ground truth data. Subsequently, partial sampling of the ground truth data was performed to generate inputs of 3072, 6144, and 9216 points, representing varying levels of difficulty. For testing the sample augmentation network, the tree point clouds were reconstructed following the ModelNet10 dataset standard as the initial sample point clouds. The training and test sets were then divided according to the configuration used in PointNet++.

4.2. Tree Point Cloud Completion Results

This study compared several mainstream point cloud completion networks, including PCN [11], GRNet [38], PointTr [13], and SnowflakeNet [39]. These methods were trained on the tree point cloud dataset using the default configurations provided in the original source code. 
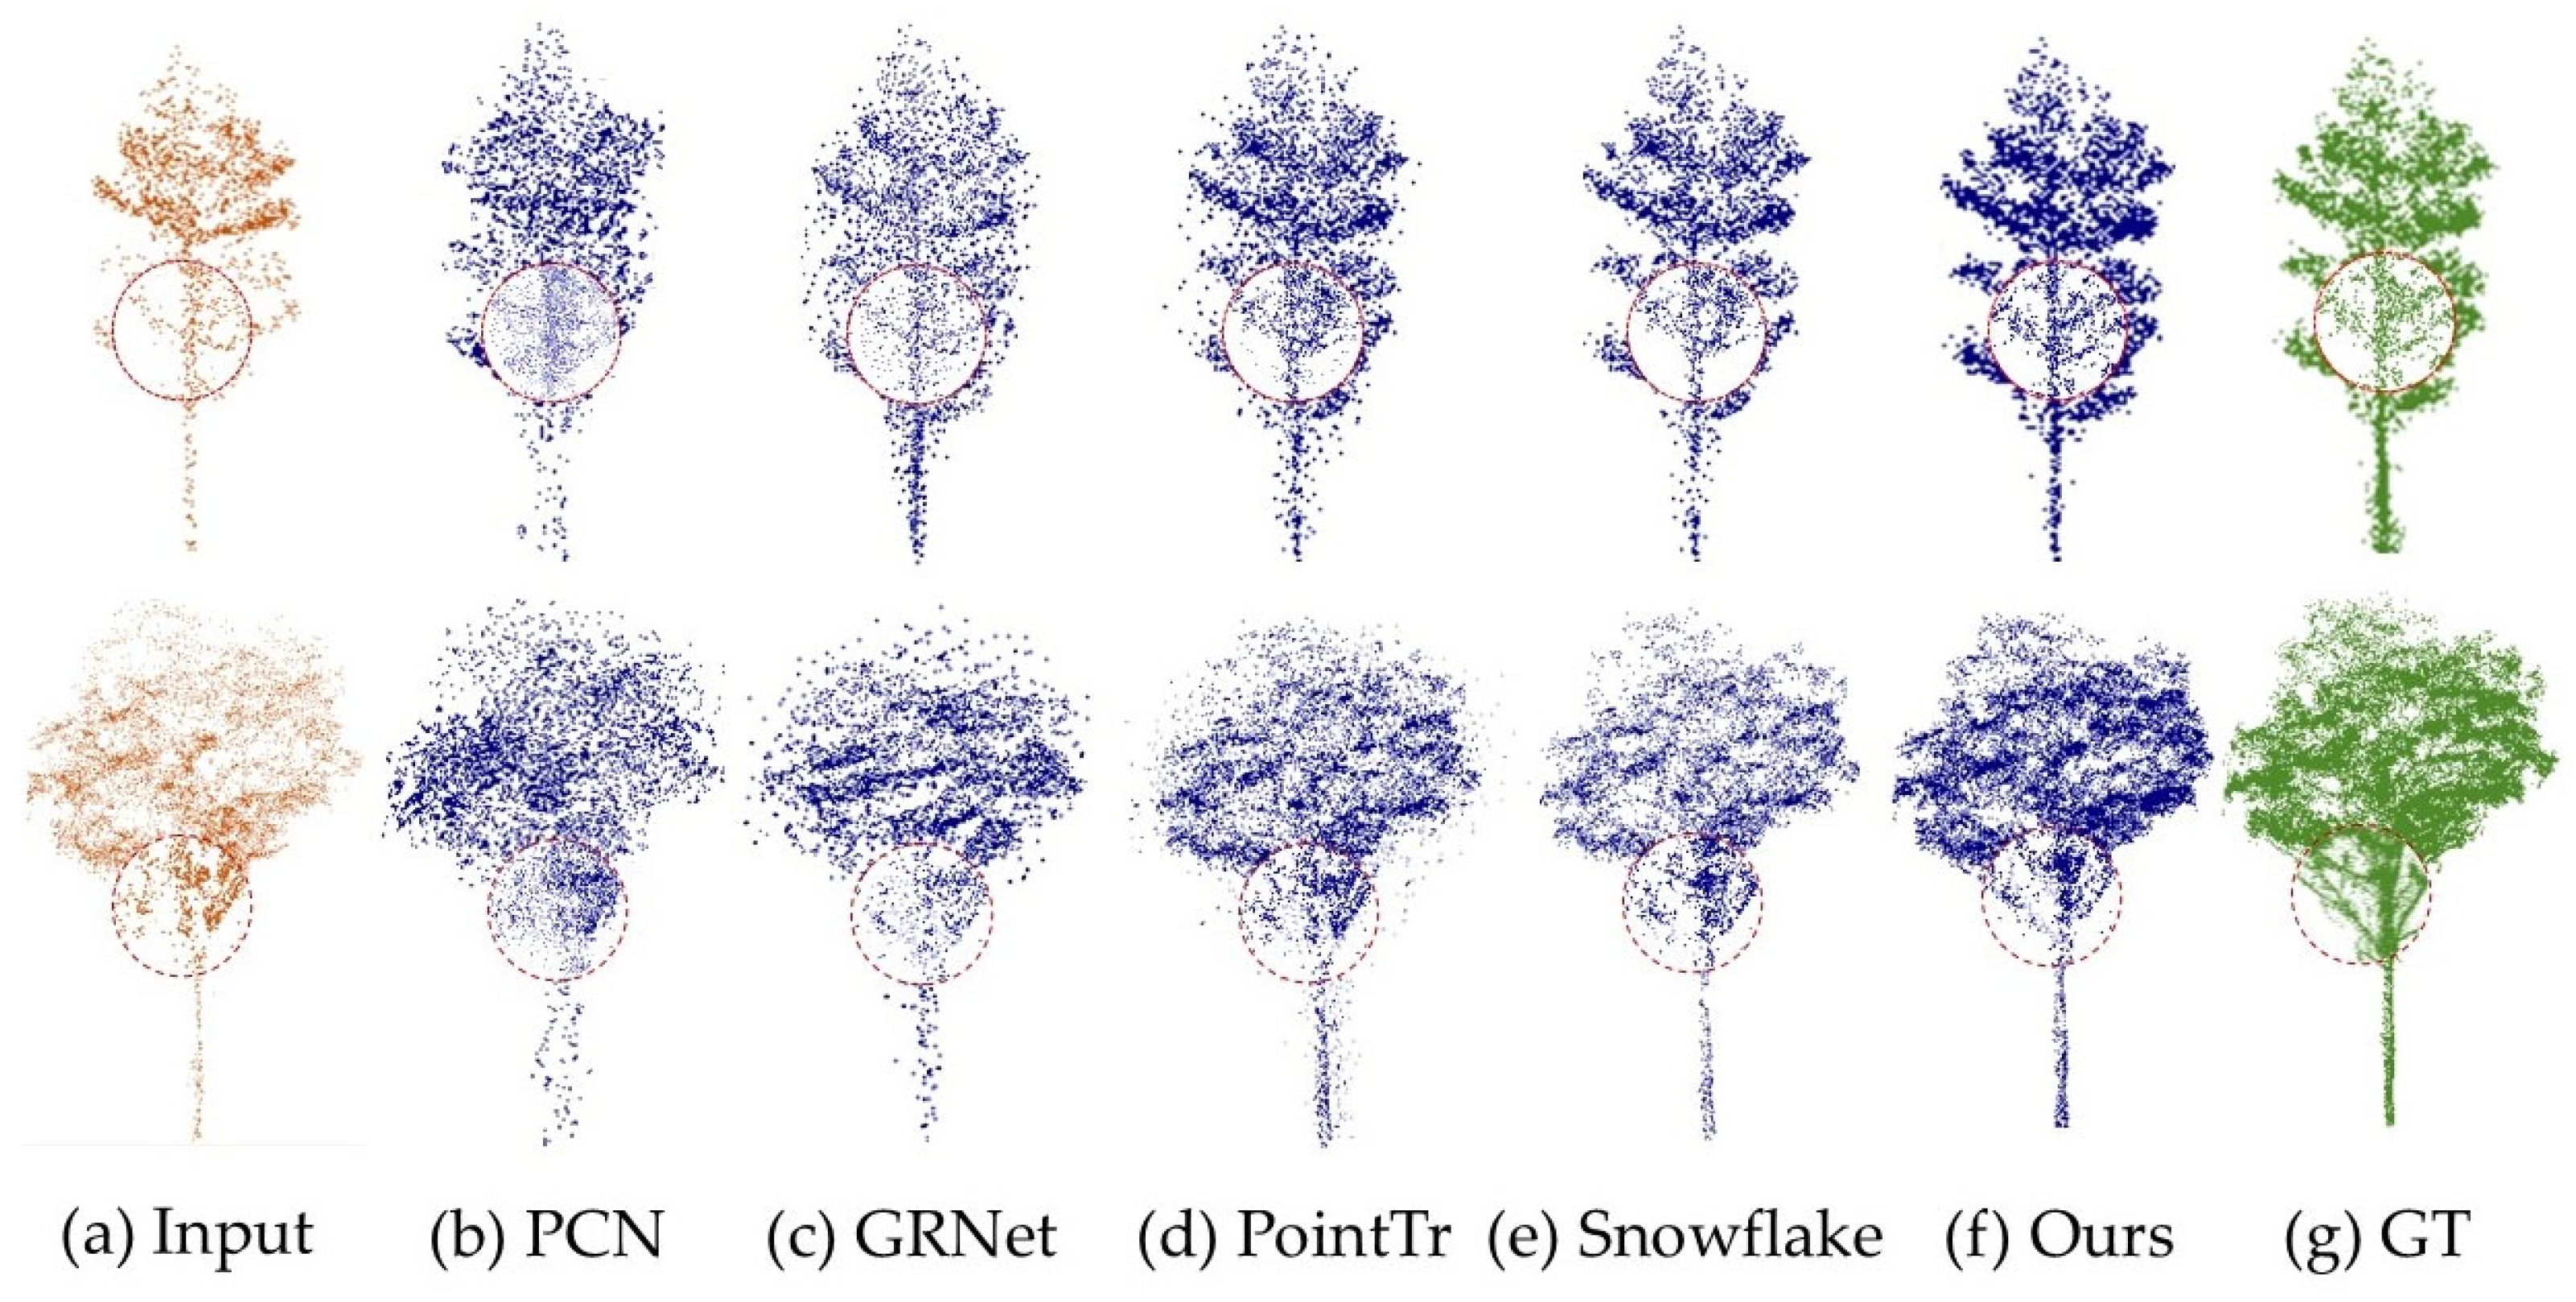
Figure 7 showed the completion results of the different networks. In addition, the similarity between the generated completed point clouds and the ground truth was evaluated using the CD and F-score. The comparison results are shown in Table 1, where the CD was multiplied by 1000. As shown, the point cloud completed by the network in this study was more complete, compact, and closer to the ground truth, with fewer random noise points. The quantitative results also demonstrated the strong performance of the network, with the average CD of 4.84 and the average F-score of 0.90. In contrast, the completion results of PCN were nearly unrecognizable in terms of tree details. Although GRNet restored the geometry of the trunk and branches to some extent, it generated a significant amount of noise. The completion results of SnowflakeNet and PointTr were relatively complete in the overall structure, but their restoration of tree details was not as accurate as those of the network used in this study.
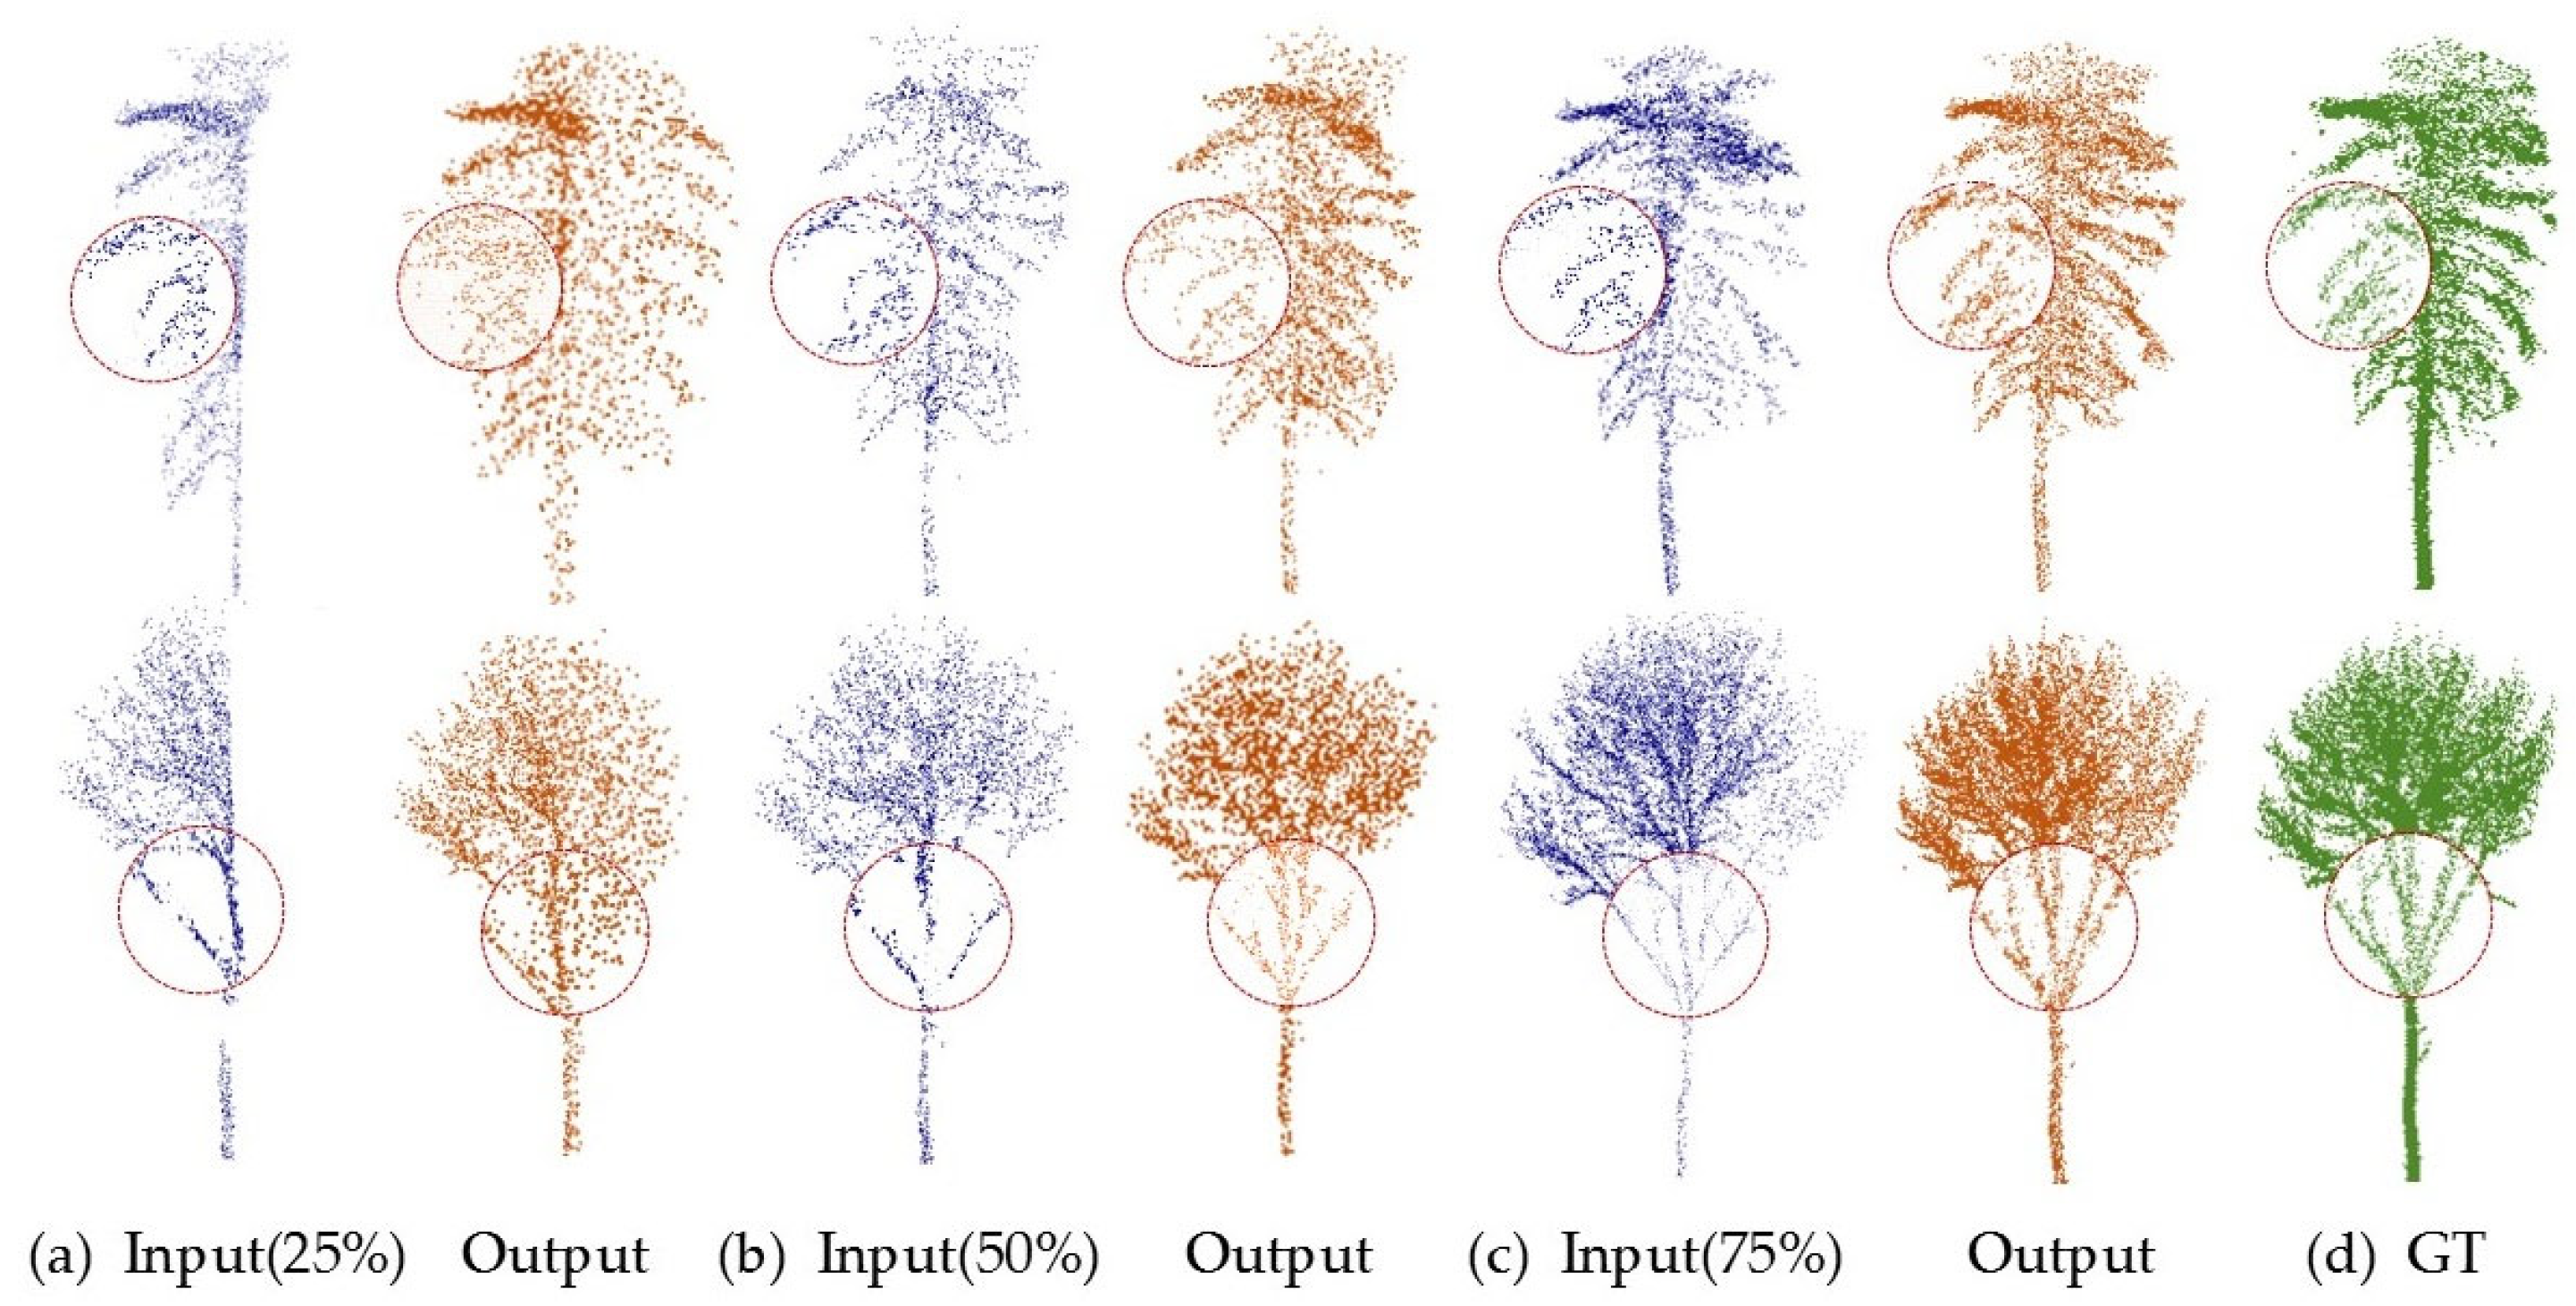
To further assess the robustness of the point cloud completion network in handling incomplete tree point clouds, this study conducted experiments with varying levels of missing data. The input point clouds were divided into three levels of missingness: mild (25%), moderate (50%), and severe (75%), corresponding to 3072, 6144, and 9216 points, respectively. Figure 8 presents the visualization results of point cloud completion under different levels of missing data. Table 2 presents the quantitative evaluation results of point cloud completion at different missingness levels. The best completion performance occurred with mild point cloud missingness, where the avgCD was 4.05. With moderate missingness, the completed canopy showed minimal deformation, and the overall tree structure was well-restored, with an avgCD of 4.84. At the 75% severe missingness level, although the completion of the canopy showed significant degradation, the basic tree structure was still maintained, with an avgCD of 6.31. These results demonstrated that the completion network exhibited strong robustness on the tree point cloud dataset, effectively completing point clouds with varying levels of missingness. From the perspective of tree species, coniferous trees generally performed better in completion than broadleaf trees: at the 25% missingness level, avgCDconiferous = 4.15 < avgCDbroadleaf = 4.94; at the 50% missingness level, avgCDconiferous = 4.44 < avgCDbroadleaf = 5.23; at the 75% level, avgCDconiferous = 5.89 < avgCDbroadleaf = 6.73. This difference is mainly attributed to the simpler morphological structure of coniferous trees. In contrast, broadleaf trees generally had larger and more diverse canopies, which posed a challenge to the completion performance of the network. Notably, Betula platyphylla exhibited the best completion performance among the broadleaf trees (CD25% = 4.15; CD50% = 4.94; CD75% = 6.18). This was mainly due to the smaller canopy size of Betula platyphylla compared to other broadleaf trees, which reduced the deformation during the completion process.
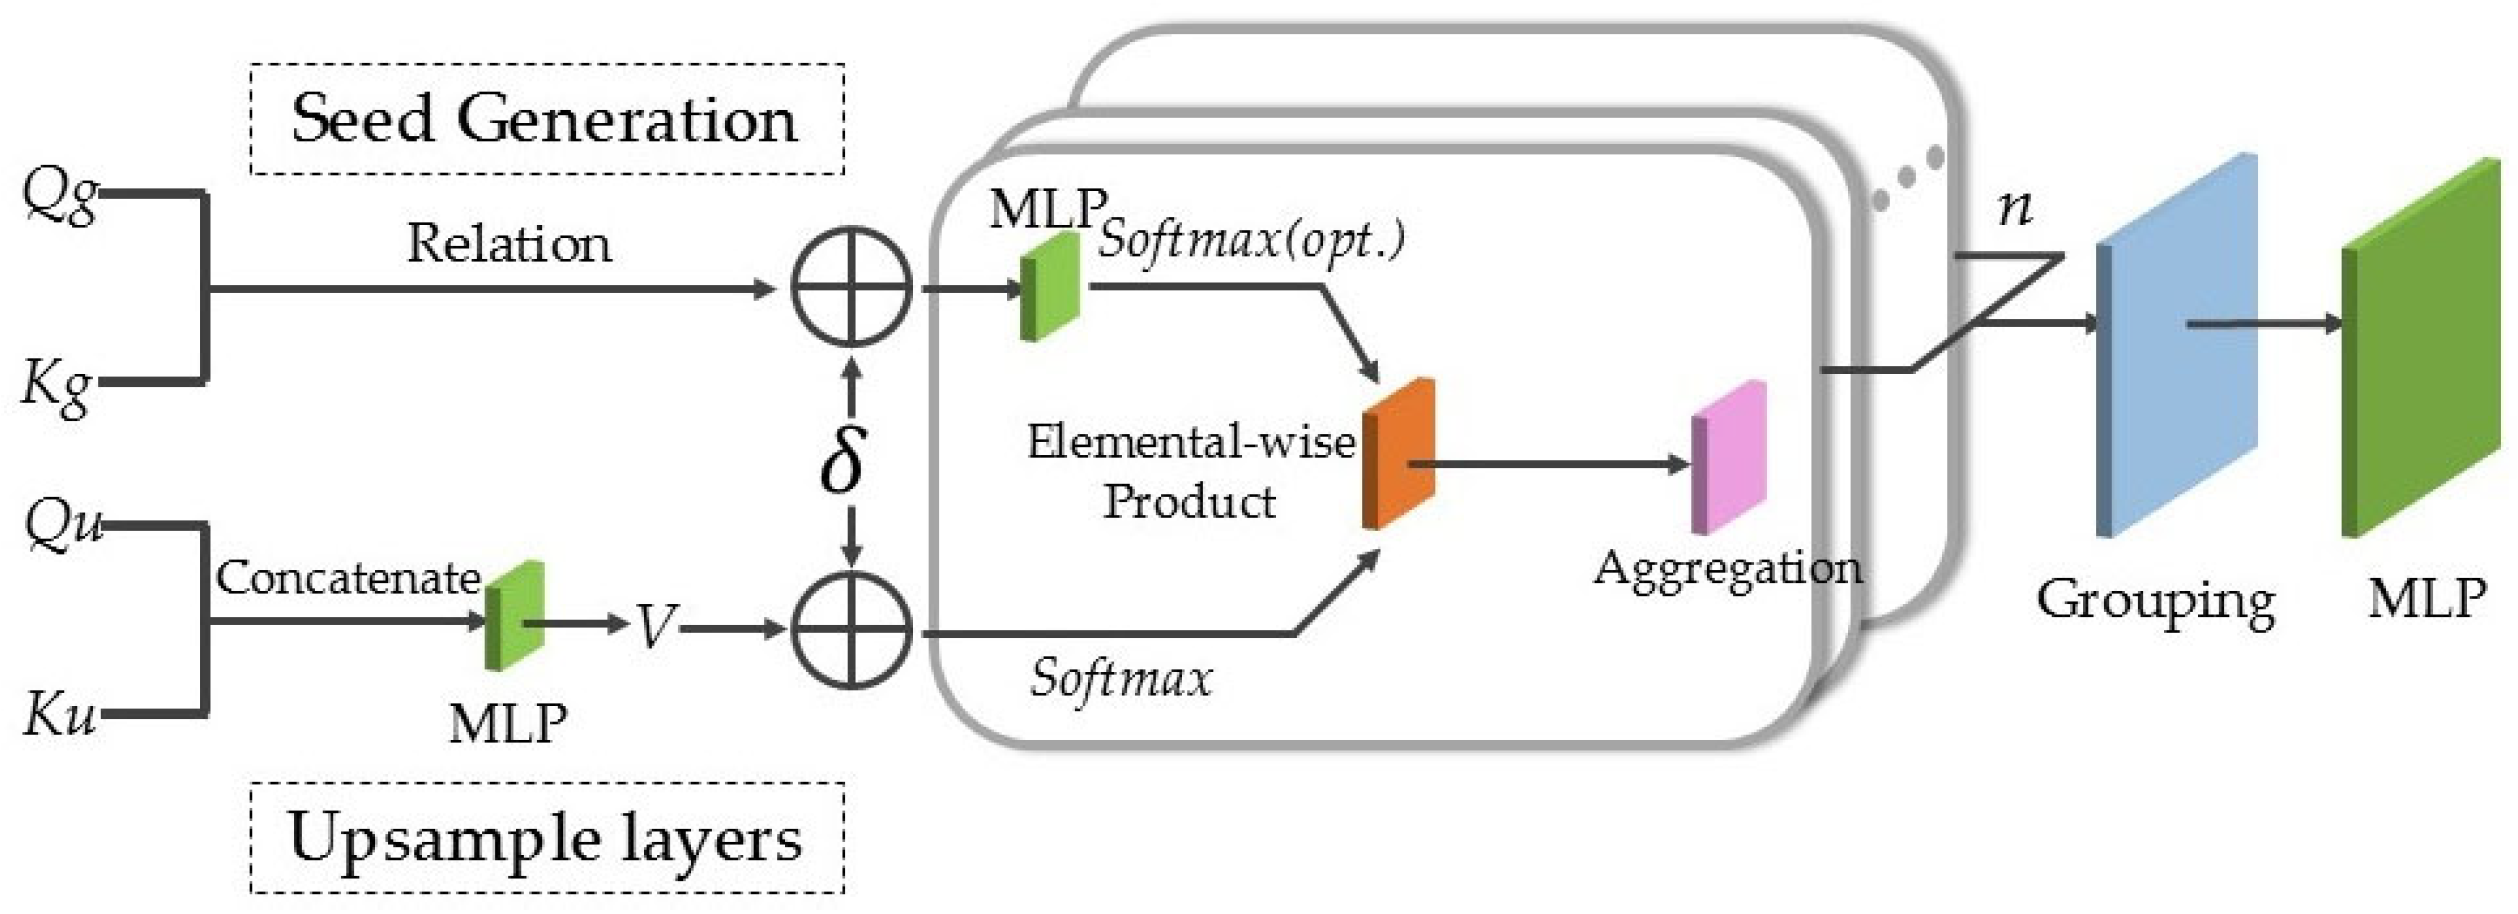
To validate the reliability of Upsample Transformer in point cloud completion networks, this study conducted comparative experiments with other point cloud generation methods, including the mainstream folding and deconvolution processing. In the ablation study, the Upsample Transformer modules in both the seed generator and the up-sampling layers were replaced with folding and deconvolution modules while maintaining identical network architectures (the point cloud missing ratio was set to 50%). As shown in Table 3, the Upsample Transformer module demonstrated superior point cloud completion performance compared to the other methods. Among them, the folding operation failed to accurately represent complex structures or model semantic relationships due to its global parameterization, while deconvolution suffered from detail loss owing to the inherent conflict between regular convolution kernels and the irregular nature of point clouds. In contrast, Upsample Transformer employed local attention mechanisms and geometric encoding to achieve semantic-aware feature aggregation and adaptive receptive fields, significantly improving completion accuracy while maintaining computational efficiency.

4.3. Tree Point Cloud Augmentation Results

To evaluate the augmentation effect of the sample augmentation network, this study set up three experimental datasets: samples without augmentation, samples augmented using traditional methods, and samples augmented using the point cloud augmentation network. The traditional augmentation methods involved random rotation, scaling, jittering, and point dropout to increase the training samples [31]. It was important to note that the number of augmented samples in the traditional method was kept consistent with that produced by the point cloud augmentation network. The effectiveness of the augmentation was assessed based on the average classification accuracy. The quantitative evaluation results are shown in Table 4.
As shown in Table 4, the dataset augmented using the sample augmentation network achieved the highest classification accuracy (avgAP = 90.1%). This represented a 2.9% improvement over the original dataset and a 2% improvement over the dataset augmented using traditional point cloud methods. Furthermore, from the perspective of tree species, the classification accuracy of broadleaf tree samples showed a more significant improvement after network augmentation. The average improvement over the original broadleaf samples was 3.4%. Additionally, there was considerable variation in the augmentation effects among different broadleaf species, with Fraxinus mandshurica showing the largest improvement in classification accuracy, increasing by 3.9%. These differences were mainly attributed to the diversity in tree morphology. Generally, tree species with more complex canopy structures exhibit greater morphological diversity. Augmenting such species may result in more challenging samples.
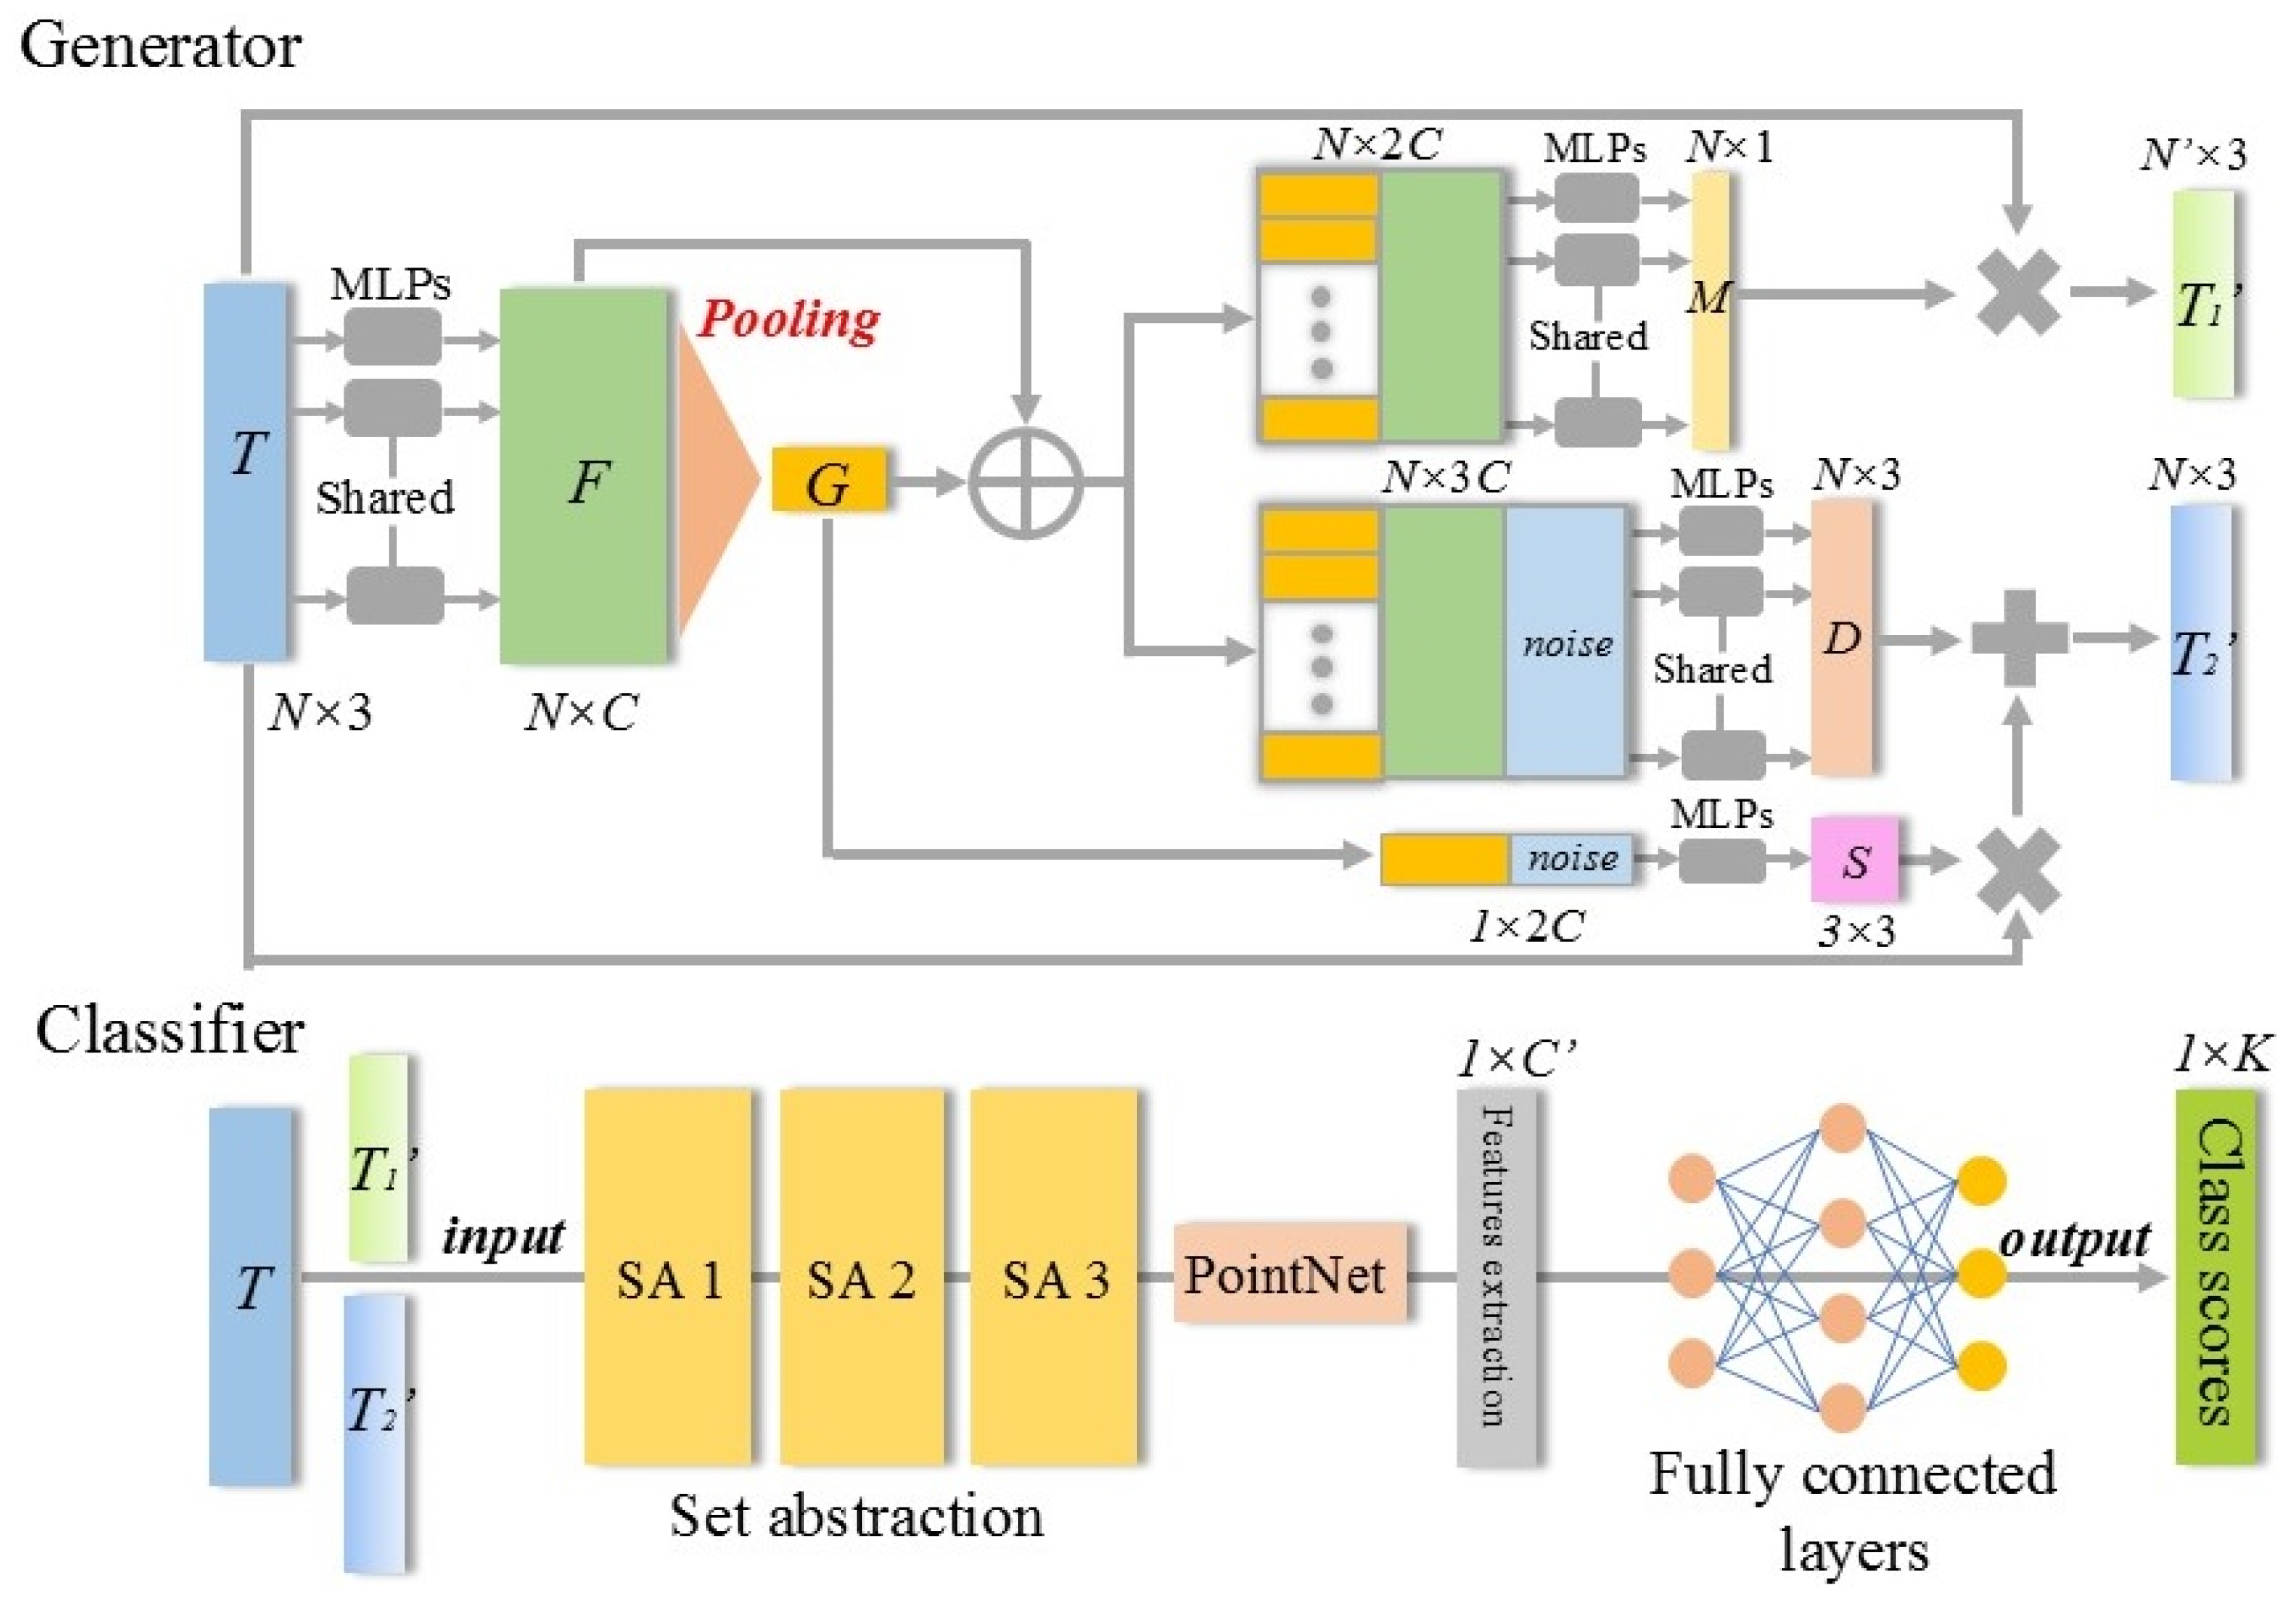
To further evaluate the impact of different augmentation methods on classification accuracy, this study conducted ablation experiments, as shown in Table 5. Model 1 represented the original PointNet++ without the generator structure, with a baseline classification accuracy of 87.2%. Then, models 2, 3, and 4 were constructed by retaining only point displacement (D), shape transformation (S), and point drop (M), respectively. Models 5, 6, and 7 combined any two of these augmentation methods (average accuracy). For tree point clouds, each augmentation method contributed to generating more effective augmented samples. Among them, shape transformation may introduce significant variability, while point displacement and point drop can steadily improve sample classification accuracy.
Additionally, to evaluate the stability of the generated point cloud data, this study simulated real-world tree point cloud acquisition scenarios by introducing natural noise, occlusions, and pose variations. The specific configurations were as follows: (1) random jittering with Gaussian noise within the range of [−1.0, 1.0]; (2) random point removal at a ratio of 0.8; and (3) rotation of ±30° along the central axis. For each type of perturbation, three data augmentation strategies were compared: without data augmentation, conventional data augmentation, and the sample augmentation network in this study.
Table 6 presents the comparative results, including the original test accuracy (without perturbations) as a reference. The results demonstrated that under all perturbation conditions, the sample augmentation network significantly outperformed traditional random augmentation methods. Notably, when compared to the original test accuracy, the proposed network exhibited lower sensitivity to data perturbations, with an average accuracy drop of only 2%. This outcome confirmed the network’s strong robustness in handling real-world data variations.

4.4. Experimental Results of Multi-Head Self-Attention Pooling

In the architectural improvements of this study, we specifically optimized the multi-head self-attention pooling layers in the feature extraction modules of both the point cloud completion network and the point cloud augmentation network. To evaluate the contribution of the multi-head self-attention pooling layers to model performance, this study designed a systematic ablation experimental protocol. While maintaining the original configurations of the network architecture, loss function design, and other critical hyperparameters unchanged, modifications were exclusively made to the pooling layers within the feature extraction modules: (1) replacing the multi-head self-attention pooling layer with a max pooling layer; (2) replacing the multi-head self-attention pooling layer with an average pooling layer; (3) replacing the multi-head self-attention pooling layer with a self-attention pooling layer. Additionally, the point cloud completion network used the dataset with 50% missing points, and performance was evaluated using the CD and F-score. The sample augmentation network was tested with a mixture of the original and augmented samples, evaluated based on classification accuracy and F-score. The results of the multi-head self-attention pooling ablation experiments are presented in Table 7.
The results indicated that the point cloud completion network based on multi-head self-attention pooling achieved the highest accuracy, with the CD of 4.84. Similarly, the point cloud augmentation network with multi-head self-attention pooling also achieved the highest classification accuracy, at 90.1%. However, replacing the multi-head self-attention pooling layer with max pooling, average pooling, or self-attention pooling resulted in decreased accuracy. The main reason was that max pooling only selected prominent features, leading to the loss of some key information. Average pooling computed the mean of the feature data, but still struggled to focus on specific regions of interest. Compared to multi-head self-attention, self-attention alone cannot simultaneously focus on different features from multiple perspectives. It was also more susceptible to noise and outliers in the input data. Therefore, multi-head self-attention pooling provided stronger feature extraction capabilities than traditional pooling methods, enhancing the expressive power of the network.

5. Limitations and Conclusions

5.1. Limitations and Future Work

During point cloud completion, the test dataset inadequately simulates potential occlusion and overlapping phenomena in trees. This may lead to performance fluctuations in the completion network, so it is necessary to collect more comprehensive data to support robust network stability testing. In the point cloud augmentation network, the sample generation process may introduce augmentation artifacts, which could lead to biased learning outcomes in the network. In subsequent research, we will impose constraints on the new sample generation using morphological feature parameters and growth orientation metrics across diverse tree species. Additionally, future research will focus on combining point cloud completion and augmentation networks to address additional challenges, such as noise removal, plot-level semantic segmentation, and scene object detection. It is important to note that different tasks may require specific network architectures for optimal performance. For example, in plot-level semantic segmentation, the entire study area will be treated as scene-scale data and employ a semantic segmentation network to classify point clouds into distinct categories: tree points, ground points, object points, and potential aerial noise. Specifically for coniferous and broadleaf tree point cloud clusters within the plots, secondary semantic segmentation will be performed. By integrating point cloud completion networks and point cloud augmentation networks, the precise construction of differentiated tree datasets will be ultimately achieved.
On the other hand, due to limitations in the study area and the available aerial data, the dataset of trees employed in this research exhibits constrained sample size. Future research will focus on evaluating the robustness and transferability of the completion and augmentation networks across diverse tree species, forest types, and LiDAR scanning data. Moreover, the current research on field-collected tree point cloud datasets and their corresponding data-processing networks remains limited, and significant variations exist in tree morphological structures and growth states across different geographical regions. Consequently, the findings of this study cannot represent the optimal performance achievable by deep learning networks in tree point cloud enhancement. Therefore, it is essential to combine more advanced network frameworks, perform comparative analysis of different ability to process high-dimensional feature data, and increase experimental testing of feedback loops.

5.2. Conclusions

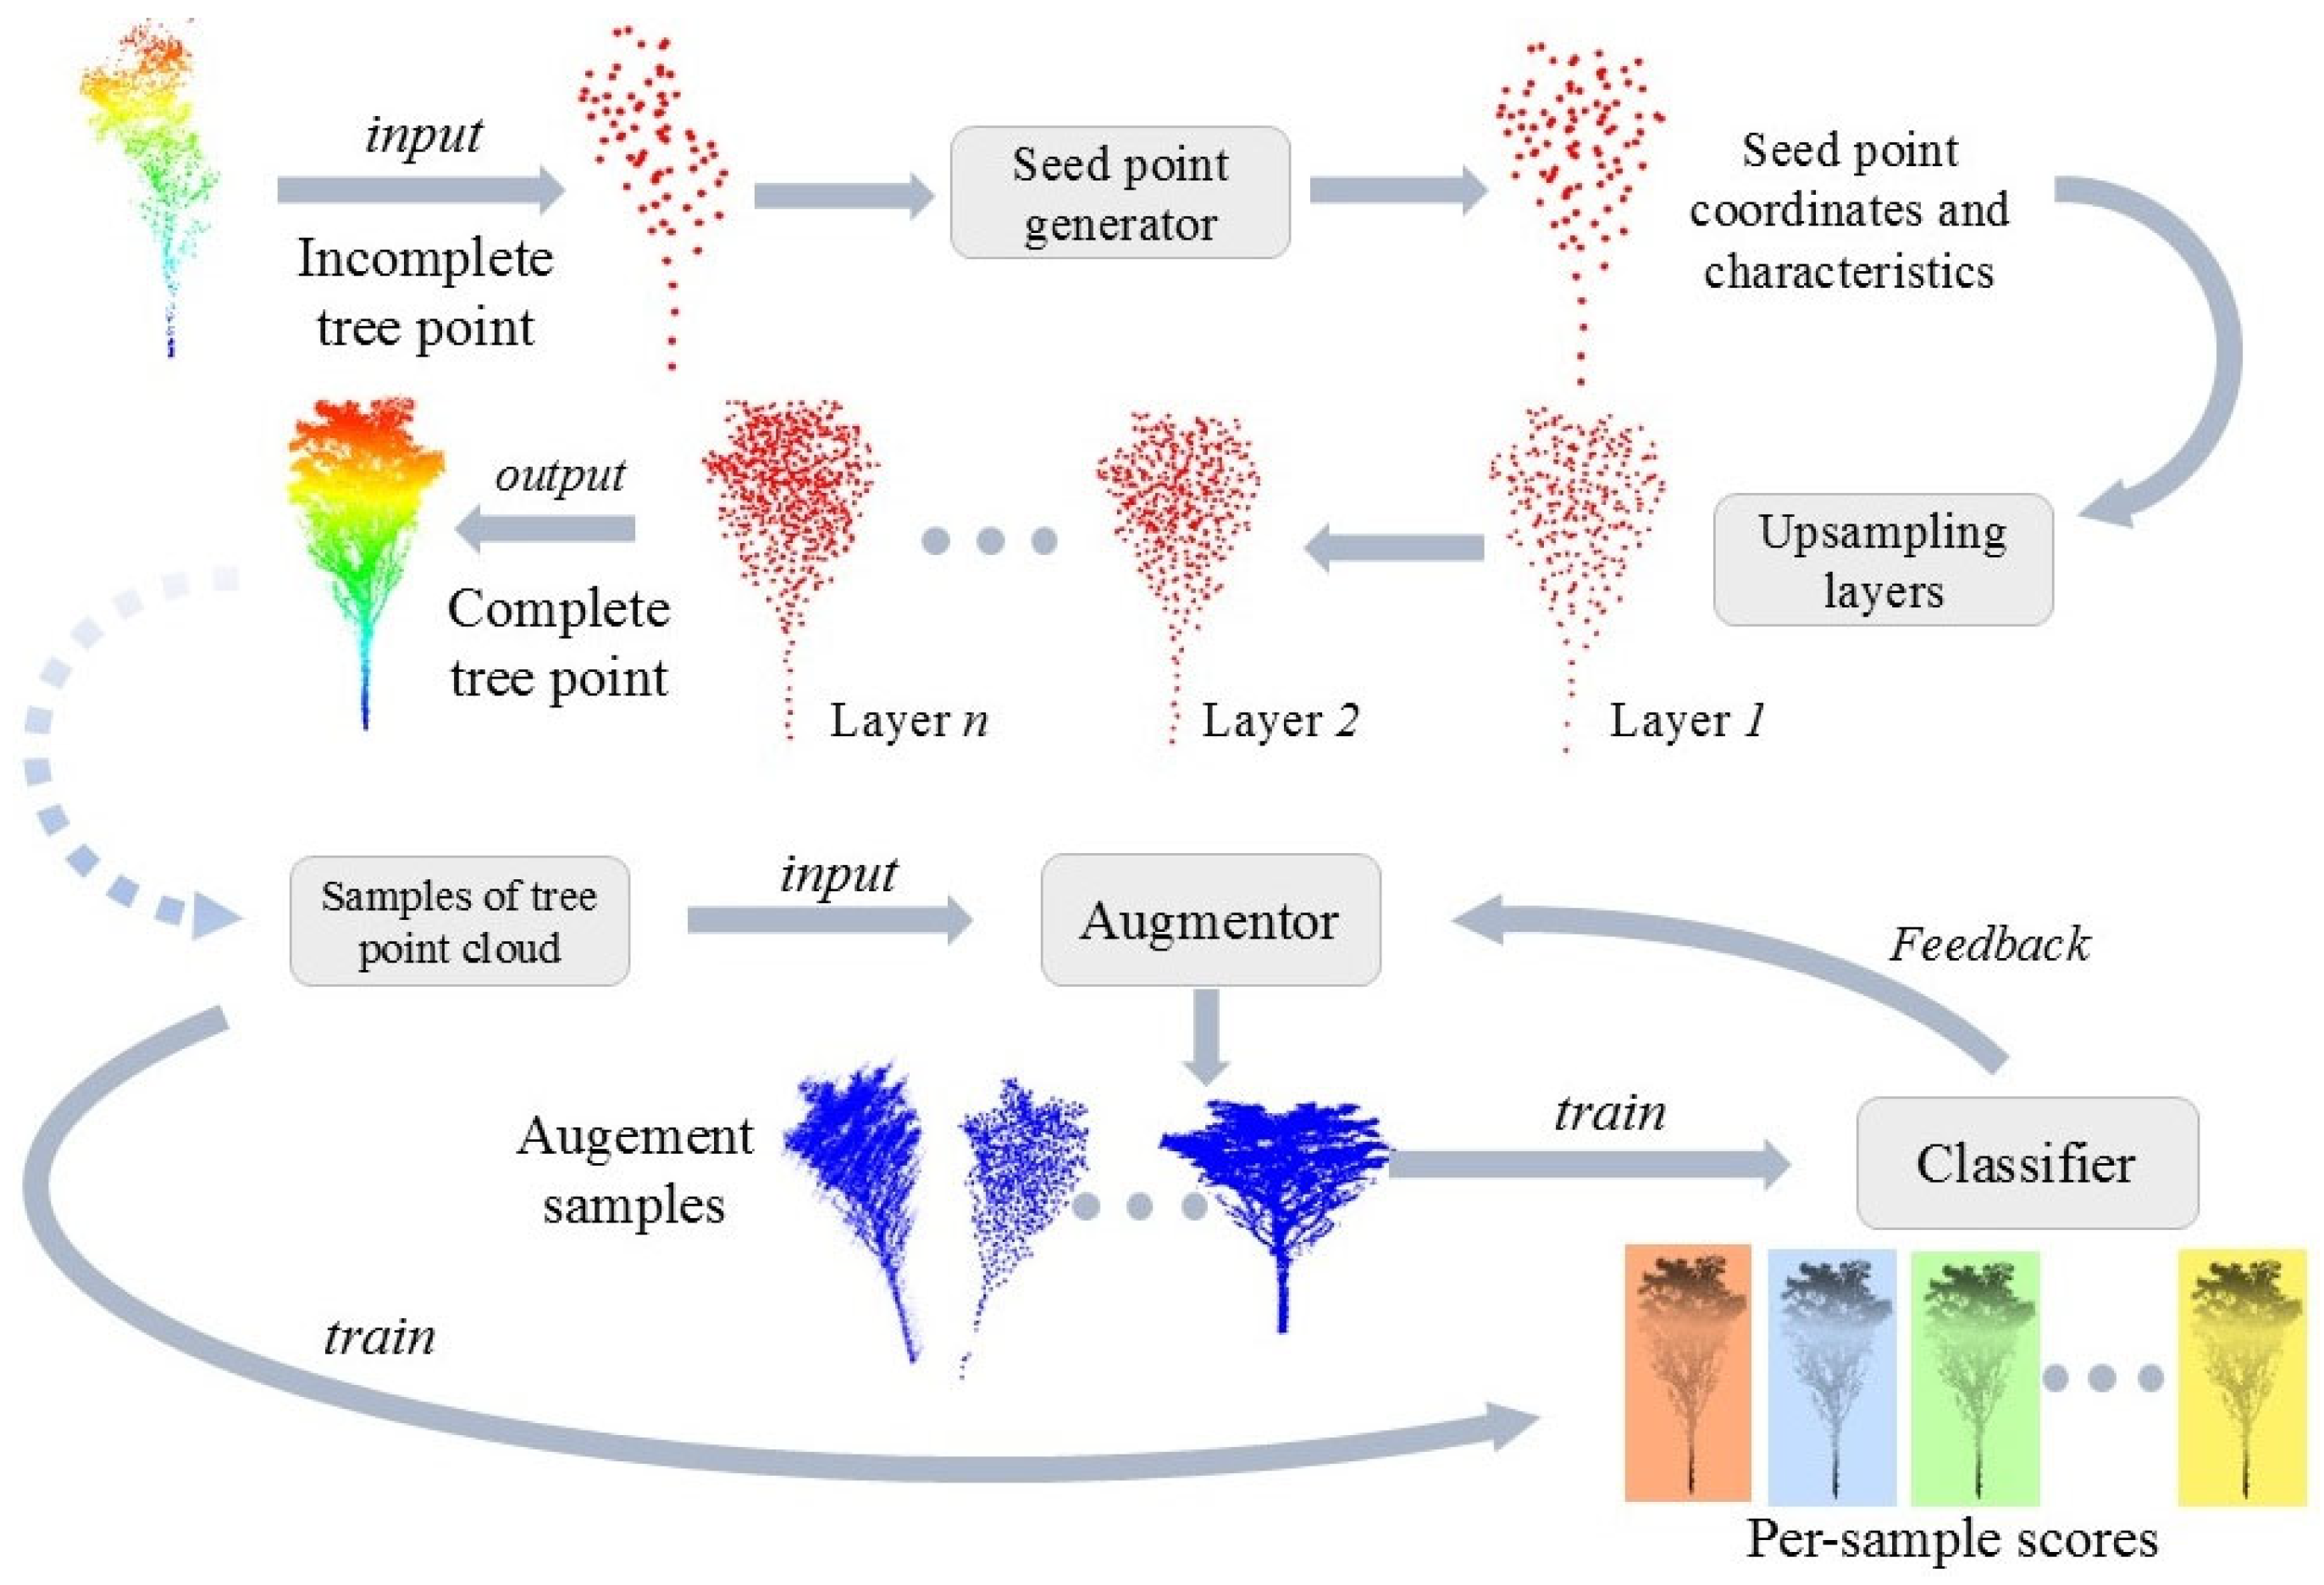
This study proposed a joint network for tree point cloud augmentation, consisting of the point cloud completion network and the sample augmentation network. The completion network improved the quality of incomplete tree point clouds, providing sufficient sample sources for the augmentation network. Then, the original samples were applied to the augmentation network to obtain more high-quality tree point clouds. Moreover, the augmented point clouds could be fed back into the joint network, facilitating alternating optimization through the update of learnable parameters. The point cloud completion network adopted a coarse-to-fine point cloud generation strategy. By introducing the Upsample Transformer module to extract seed point coordinates and features from tree point clouds, the network was able to capture the key regional features effectively, which provided the foundation for subsequent point cloud up-sampling. On the other hand, the sample augmentation network used the end-to-end framework, where the generator could be improved based on feedback from the classifier, and the classifier could learn to process a wider range of training samples. The generator processed point cloud samples using three distinct modules: shape transformation, point direction displacement, and point drop, significantly enhancing the efficiency and diversity of point cloud augmentation. Furthermore, this study replaced the traditional max pooling layer in the joint network with the multi-head self-attention-based pooling layer, ensuring the maximum retention of feature information from different sample points. This method effectively enhanced the ability of the network to learn the features of various sample categories in complex scenes.

Author Contributions

Conceptualization, H.L.; methodology, H.L.; software, H.L. and G.X.; validation, H.L., H.Z., G.X. and P.Z.; formal analysis, H.L. and P.Z.; investigation, H.L. and H.Z.; resources, H.L. and H.Z.; data curation, H.L.; writing—original draft preparation, H.L.; writing—review and editing, H.L., G.X. and P.Z.; visualization, H.L.; supervision, G.X. and P.Z.; project administration, H.Z.; funding acquisition, H.Z. All authors have read and agreed to the published version of the manuscript.

Funding

This research was funded by the Fundamental Research Funds for the Central Universities (2572021AW49) and the Innovation Foundation for the Doctoral Program of Forestry Engineering of the Northeast Forestry University (LYGC202114).

Data Availability Statement

Data are contained within the article.

Acknowledgments

We gratefully acknowledge the assistance of Heilongjiang Jingzhen Science & Technology Development Co., Ltd. in preparing the UAV laser scanning point cloud data. We also thank Lin and Wu for their guidance on the manuscript.

Conflicts of Interest

The authors declare no conflicts of interest.

References

  1. Guo, Q.; Liu, J.; Tao, S.; Xue, B.; Li, L.; Xu, G.; Li, W.; Wu, F.; Li, Y.; Chen, L.; et al. Perspectives and Prospects of LiDAR in Forest Ecosystem Monitoring and Modeling. Chin. Sci. Bull. 2014, 59, 459–478. [Google Scholar]
  2. Wallace, L.; Lucieer, A.; Watson, C.; Turner, D. Development of a UAV-LiDAR System with Application to Forest Inventory. Remote Sens. 2012, 4, 1519–1543. [Google Scholar] [CrossRef]
  3. Wen, X.; Li, T.; Han, Z.; Liu, Y.S. Point Cloud Completion by Skip-attention Network with Hierarchical Folding. In Proceedings of the IEEE/CVF Conference on Computer Vision and Pattern Recognition, Seattle, WA, USA, 13–19 June 2020; pp. 1939–1948. [Google Scholar]
  4. Wen, X.; Xiang, P.; Han, Z.; Cao, Y.P.; Wan, P.; Zheng, W.; Liu, Y.S. PMP-net: Point Cloud Completion by Learning Multi-step Point Moving Paths. In Proceedings of the IEEE/CVF Conference on Computer Vision and Pattern Recognition, Nashville, TN, USA, 19–25 June 2021; pp. 7443–7452. [Google Scholar]
  5. Chen, J.W.; Zhao, L.L.; Ren, L.C.; Sun, Z.Q.; Zhang, X.F.; Ma, S.W. Deep Learning-based Quality Enhancement for 3D Point Clouds: A survey. J. Image Graph. 2023, 28, 3295–3319. [Google Scholar]
  6. Lin, F.; Xu, Y.; Zhang, Z.; Gao, C.; Yamada, K.D. Cosmos Propagation Network: Deep Learning Model for Point Cloud Completion. Neurocomputing 2022, 507, 221–234. [Google Scholar] [CrossRef]
  7. You, L.; Sun, Y.A.; Chang, X.S.; Du, L.M. Tree Point Cloud Completion Network based on Attention Mechanism. J. Comput.-Aided Des. Comput. Graph. 2024, 5, 1–10. [Google Scholar]
  8. Zhu, Q.; Fan, L.; Weng, N. Advancements in Point Cloud Data Augmentation for Deep Learning: A Survey. Pattern Recognit. 2024, 153, 110532. [Google Scholar] [CrossRef]
  9. Mitra, N.J.; Guibas, L.J.; Pauly, M. Partial and Approximate Symmetry Detection for 3D Geometry. ACM Trans. Graph. 2006, 25, 560–568. [Google Scholar] [CrossRef]
  10. Huang, H.; Wu, S.; Gong, M.; Cohen-Or, D.; Ascher, U.; Zhang, H. Edge-aware Point Set Resampling. ACM Trans. Graph. 2013, 32, 1–12. [Google Scholar] [CrossRef]
  11. Yuan, W.; Khot, T.; Held, D.; Mertz, C.; Hebert, M. Pcn: Point Completion Network. In Proceedings of the 2018 International Conference on 3D Vision (3DV), Verona, Italy, 5–8 September 2018; pp. 728–737. [Google Scholar]
  12. Huang, Z.; Yu, Y.; Xu, J.; Ni, F.; Le, X. PF-net: Point Fractal Network for 3d Point Cloud Completion. In Proceedings of the IEEE/CVF Conference on Computer Vision and Pattern Recognition, Seattle, Washington, USA, 14–19 June 2020; pp. 7662–7670. [Google Scholar]
  13. An, L.; Zhou, P.; Zhou, M.; Wang, Y.; Zhang, Q. PointTr: Low-overlap Point Cloud Registration with Transformer. IEEE Sens. J. 2024, 24, 12795–12805. [Google Scholar] [CrossRef]
  14. Zhang, W.; Zhou, H.; Dong, Z.; Liu, J.; Yan, Q.; Xiao, C. Point Cloud Completion via Skeleton-detail Transformer. IEEE Trans. Vis. Comput. Graph. 2022, 29, 4229–4242. [Google Scholar] [CrossRef]
  15. Yu, L.; Li, X.; Fu, C.W.; Cohen-Or, D.; Heng, P.A. Pu-net: Point Cloud Upsampling Network. In Proceedings of the IEEE Conference on Computer Vision and Pattern Recognition, Salt Lake City, UT, USA, 18–23 June 2018; pp. 2790–2799. [Google Scholar]
  16. Li, R.; Li, X.; Fu, C.W.; Cohen-Or, D.; Heng, P.A. Pu-gan: A Point Cloud Upsampling Adversarial Network. In Proceedings of the IEEE/CVF International Conference on Computer Vision, Seoul, Republic of Korea, 27 October–2 November 2019; pp. 7203–7212. [Google Scholar]
  17. Goodfellow, I.; Pouget-Abadie, J.; Mirza, M.; Xu, B.; Warde-Farley, D.; Ozair, S.; Courville, A.; Bengio, Y. Generative adversarial networks. Commun. ACM 2020, 63, 139–144. [Google Scholar] [CrossRef]
  18. Qiu, S.; Anwar, S.; Barnes, N. Pu-transformer: Point Cloud Upsampling Transformer. In Proceedings of the Asian Conference on Computer Vision, Macau, China, 4–8 December 2022; pp. 2475–2493. [Google Scholar]
  19. Du, H.; Yan, X.; Wang, J.; Xie, D.; Pu, S. Point Cloud Upsampling via Cascaded Refinement Network. In Proceedings of the Asian Conference on Computer Vision, Macau, China, 4–8 December 2022; pp. 586–601. [Google Scholar]
  20. Zhang, C. Research on Data Enhancement for 3D Point Cloud Deep Learning. Master’s Thesis, Qinghai Normal University, Xining, China, 2024. [Google Scholar]
  21. Li, R.; Li, X.; Heng, P.A.; Fu, C.W. Pointaugment: An Auto-augmentation Framework for Point Cloud Classification. In Proceedings of the IEEE/CVF Conference on Computer Vision and Pattern Recognition, Seattle, WA, USA, 14–19 June 2020; pp. 6378–6387. [Google Scholar]
  22. Chen, Y.; Hu, V.T.; Gavves, E.; Mensink, T.; Mettes, P.; Yang, P.; Snoek, C.G. Pointmixup: Augmentation for Point Clouds. In Computer Vision–ECCV 2020, Proceedings of the 16th European Conference, Glasgow, UK, August 23–28, 2020, Proceedings, Part III 16; Springer International Publishing: Berlin/Heidelberg, Germany, 2020; pp. 330–345. [Google Scholar]
  23. Choi, J.; Song, Y.; Kwak, N. Part-aware Data Augmentation for 3D Object Detection in Point Cloud. In Proceedings of the 2021 IEEE/RSJ International Conference on Intelligent Robots and Systems (IROS), Prague, Czech Republic, 27 September–1 October 2021; pp. 3391–3397. [Google Scholar]
  24. Xiao, A.; Huang, J.; Guan, D.; Cui, K.; Lu, S.; Shao, L. Polarmix: A General Data Augmentation Technique for Lidar Point Clouds. Adv. Neural Inf. Process. Syst. 2022, 35, 11035–11048. [Google Scholar]
  25. Zheng, W.; Tang, W.; Jiang, L.; Fu, C.W. SE-SSD: Self-ensembling Single-stage Object Detector from Point Cloud. In Proceedings of the IEEE/CVF Conference on Computer Vision and Pattern Recognition, Nashville, TN, USA, 20–25 June 2021; pp. 14494–14503. [Google Scholar]
  26. Fan, W.; Liu, H.; Xu, Y.; Lin, W. Comparison of Extraction Precision of Individual Tree Structure Parameters Based on Terrestrial Laser Scanning and Hand-held Mobile laser Scanning. J. Cent. South Univ. For. Technol. 2020, 40, 63–74. [Google Scholar]
  27. Yang, X.; Wu, J.; Liu, H.; Lin, W. Estimation on Canopy Closure for Plantation Forests Based on UAV-LiDAR. Sci. Silvae Sin. 2023, 59, 12–21. [Google Scholar]
  28. Angiulli, F.; Basta, S.; Lodi, S.; Sartori, C. Distributed Strategies for Mining Outliers in Large Data Sets. IEEE Trans. Knowl. Data Eng. 2012, 25, 1520–1532. [Google Scholar] [CrossRef]
  29. Zhao, X.; Guo, Q.; Su, Y.; Xue, B. Improved Progressive TIN Densification Filtering Algorithm for Airborne LiDAR Data in Forested Areas. ISPRS J. Photogramm. Remote Sens. 2016, 117, 79–91. [Google Scholar] [CrossRef]
  30. Chen, Q.; Baldocchi, D.; Gong, P.; Kelly, M. Isolating Individual Trees in A Savanna Woodland Using Small Footprint Lidar Data. Photogramm. Eng. Remote Sens. 2006, 72, 923–932. [Google Scholar] [CrossRef]
  31. Qi, C.R.; Yi, L.; Su, H.; Guibas, L.J. Pointnet++: Deep hierarchical feature learning on point sets in a metric space. In Proceedings of the Neural Information Processing Systems (NIPS 2017), Long Beach, CA, USA, 4–9 December 2017; pp. 4–7. [Google Scholar]
  32. Zhou, H.; Cao, Y.; Chu, W.; Zhu, J.; Lu, T.; Tai, Y.; Wang, C. Seedformer: Patch Seeds Based Point Cloud Completion with Upsample Transformer. In European Conference on Computer Vision, Proceedings of the 17th European Conference, Tel Aviv, Israel, 23–27 October 2022; Springer Nature Switzerland: Cham, Switzerland, 2022; pp. 416–432. [Google Scholar]
  33. Guo, M.H.; Cai, J.X.; Liu, Z.N.; Mu, T.J.; Martin, R.R.; Hu, S.M. Pct: Point Cloud Transformer. Comput. Vis. Media 2021, 7, 187–199. [Google Scholar] [CrossRef]
  34. Barrow, H.G.; Tenenbaum, J.M.; Bolles, R.C.; Wolf, H.C. Parametric Correspondence and Chamfer Matching: Two New Techniques for Image Matching. In Proceedings of the Workshop—Image Understanding, Minneapolis, MN, USA, 20 April 1977; Science Applications, Inc.: Reston, VA, USA, 1977; pp. 21–27. [Google Scholar]
  35. Yan, S.; Wang, J.; Liu, X.; Cui, Y.; Tao, Z.; Zhang, X. Microblog Sentiment Analysis with Multi-Head Self-Attention Pooling and Multi-Granularity Feature Interaction Fusion. Data Anal. Knowl. Discov. 2023, 7, 32–45. [Google Scholar]
  36. Wang, J.; Cui, Y.; Guo, D.; Li, J.; Liu, Q.; Shen, C. Pointattn: You Only Need Attention for Point Cloud Completion. Proc. AAAI Conf. Artif. Intell. 2024, 38, 5472–5480. [Google Scholar] [CrossRef]
  37. Wu, M.; Yan, R.; Sun, Z.; Zhao, H.; He, Q. 3D Point Cloud Dual Completion Network. Comput. Eng. Appl. 2025, 61, 297–305. [Google Scholar]
  38. Xie, H.; Yao, H.; Zhou, S.; Mao, J.; Zhang, S.; Sun, W. Grnet: Gridding Residual Network for Dense Point Cloud Completion. In Proceedings of the European Conference on Computer Vision, Glasgow, UK, 23–28 August 2020; pp. 365–381. [Google Scholar]
  39. Xiang, P.; Wen, X.; Liu, Y.S.; Cao, Y.P.; Wan, P.; Zheng, W.; Han, Z. Snowflakenet: Point Cloud Completion by Snowflake Point Deconvolution with Skiptransformer. In Proceedings of the IEEE/CVF International Conference on Computer Vision, Montreal, QC, Canada, 10–17 October 2021; pp. 5499–5509. [Google Scholar]
Figure 1. Location of the study area.
Forests 16 00915 g001
Figure 2. An overview of the tree point cloud enhancement system.
Forests 16 00915 g002
Figure 3. Overall architecture of the point cloud completion network.
Forests 16 00915 g003
Figure 4. Overall architecture of Upsample Transformer. Q, K, and V represent the query vector, the key vector, and the value vector, respectively; δ is a positional encoding vector to learn spatial relations.
Forests 16 00915 g004
Figure 5. Illustrations of the generator and the classifier. The generator generates augmented sample T′ from T, and the classifier predicts the class label given T′ or T as inputs.
Forests 16 00915 g005
Figure 6. Structure of multi-head self-attention pooling.
Forests 16 00915 g006
Figure 7. Visual comparisons on a dataset of the tree point cloud (taking Pinus sylvestris and Betula platyphylla as examples). The dashed circular outline denotes an enlarged detail view of the tree point cloud.
Forests 16 00915 g007
Figure 8. Visual comparisons on a dataset of the tree point cloud (taking Pinus tabuliformis and Quercus mongolica as examples). The dashed circular outline denotes an enlarged detail view of the tree point cloud.
Forests 16 00915 g008
Table 1. Completion results of point clouds for different networks evaluated as CD × 1000 (the lower the better) and F-score (the higher the better).
MethodsPCNGRNetPointTrSnowflakeNetOurs
Tree SpeciesCDF1CDF1CDF1CDF1CDF1
Larix gmelinii9.490.568.040.645.620.845.710.834.120.94
Pinus tabuliformis10.070.518.950.596.670.775.920.814.850.90
Pinus sylvestris9.770.548.270.635.770.835.530.844.360.93
Quercus mongolica10.360.499.520.557.010.726.310.795.270.87
Fraxinus mandshurica10.680.479.880.527.240.706.840.755.480.86
Betula platyphylla9.930.538.820.606.380.796.030.814.940.90
Table 2. Completion results of the tree point cloud with different deletion degrees evaluated as CD × 1000 (the lower the better) and F-score (the higher the better).
Degree25%50%75%
Tree SpeciesCDF1CDF1CDF1
Larix gmelinii3.670.954.120.945.790.83
Pinus tabuliformis4.020.944.850.906.330.79
Pinus sylvestris3.590.964.360.935.550.84
Quercus mongolica4.370.935.270.876.910.74
Fraxinus mandshurica4.520.925.480.867.100.72
Betula platyphylla4.150.944.940.906.180.81
Table 3. Completion results of the tree point cloud with different generator designs evaluated as CD × 1000 (the lower the better).
ModulesCDAvg
Folding operation6.26
Deconvolution5.91
Upsample Transformer4.84
Table 4. Comparison of the augmentation results on the tree point dataset (the statistical data is classification accuracy).
Tree SpeciesOriginalConventional DAOurs
Larix gmelinii90.9%91.6%93.1%
Pinus tabuliformis86.9%87.8%89.6%
Pinus sylvestris90.3%90.9%92.5%
Quercus mongolica85.1%86.2%88.5%
Fraxinus mandshurica82.8%84.1%86.7%
Betula platyphylla87.3%88.2%90.2%
Avg87.2%88.1%90.1%
Table 5. Ablation study of the point cloud augmentation network. D: point-wise displacement, S: shape-wise transformation, M: point drop.
ModelDSMAccuracyChange
model_1 87.2
model_2 88.71.5
model_3 88.31.1
model_4 88.41.2
model_5 89.42.2
model_6 89.01.8
model_7 89.22.0
ours90.12.9
Note: ‘√’ indicates the component is enabled.
Table 6. Robustness test of the generated point cloud (the statistical data is classification accuracy).
MethodsOriginal AccuracyRandom Jitter80% Random Point DropoutRotation of ±30°
Without data augmentation87.2%83.8%84.8%79.3%
Conventional data augmentation88.1%85.6%86.1%84.7%
Ours90.1%88.4%89.2%87.6%
Table 7. Performance of ablation experiments of multi-head self-attention pooling.
Pooling MethodComplete NetworkAugmented Network
CD/10−3F1/%Acc/%F1/%
Max pooling5.210.8787.80.87
Average pooling5.390.8687.60.87
Self-attention pooling5.010.8988.70.88
Ours4.840.9090.10.89
Disclaimer/Publisher’s Note: The statements, opinions and data contained in all publications are solely those of the individual author(s) and contributor(s) and not of MDPI and/or the editor(s). MDPI and/or the editor(s) disclaim responsibility for any injury to people or property resulting from any ideas, methods, instructions or products referred to in the content.

