Article

Effects of Stand Structure on Aboveground Biomass in Mixed Moso Bamboo Forests in Tianbaoyan National Nature Reserve, Fujian, China

1
Key Laboratory of National Forestry and Grassland Administration on Bamboo & Rattan Science and Technology, International Centre for Bamboo and Rattan, Beijing 100102, China
2
Yong’an Observation and Research Station for Bamboo Forest Ecosystem, Yong’an 366000, China
3
Tianbaoyan National Nature Reserve Administration Bureau, Yong’an 366000, China
*
Authors to whom correspondence should be addressed.
Forests 2025, 16(6), 905; https://doi.org/10.3390/f16060905
Submission received: 24 April 2025 / Revised: 21 May 2025 / Accepted: 27 May 2025 / Published: 28 May 2025

Abstract

Forest aboveground biomass (AGB) serves as a crucial indicator of productivity and carbon storage capacity. While the impact of stand structure on AGB is well-documented for pure moso bamboo stands, the specific structural factors influencing AGB and the mechanisms driving these effects in mixed moso bamboo forests, characterized by species diversity and structural complexity, require further elucidation. This study analyzed 9453 bamboos and arbor trees within the TianBao MetaPlot, which were tessellated into 108 standard plots in Tianbaoyan National Nature Reserve, Fujian, China. Using a multi-method voting approach, we identified the key structural factors influencing stand AGB and employed Partial Least Squares Path Modeling (PLS-PM) to assess their direct and indirect effects. We found that the stand density, moso bamboo mixing ratio, Shannon’s index, Simpson’s index, mean tree height, openness, and tree size variation coefficient were the key structural factors influencing the stand AGB. The PLS-PM analysis showed that stand density had a negative effect on stand AGB, which can be explicitly decomposed through a direct negative effect and an indirect negative effect. Tree diversity showed a strong positive effect, supporting the niche complementarity theory. The stand mean tree height and stand tree size variation had positive effects on stand AGB, while stand openness had a negative effect. The direct effects of tree diversity, stand mean tree height, and stand openness were stronger than the indirect effects on stand AGB, while the indirect effect of stand density was greater than the aforementioned effects. These results highlight the complex interactions between stand structure and stand AGB in mixed moso bamboo forests. The negative effect of stand density on stand AGB is in contrast with previous findings on arbor forests, wherein a higher stand density often promotes AGB, highlighting the unique structural characteristics of mixed moso bamboo forests. To promote biomass accumulation and enhance carbon sequestration in mixed moso bamboo stands, it is recommended to increase the tree size variability, enhance the tree species diversity, and apply rational thinning of moso bamboo, based on site-specific conditions.

1. Introduction

Moso bamboo (Phyllostachys edulis) forests, a distinctive component of China’s forest ecosystems, have gained increasing recognition for their exceptional carbon sequestration capacity, owing to their rapid growth rates and short harvesting cycles [1,2]. In central Fujian Province, these bamboo formations predominantly exist as mixed-species stands, characterized by structural complexity, resulting from the spreading growth patterns of bamboo [3,4]. Due to the diversified species composition and the high survey costs related to mixed moso bamboo forests, the progress made by studies that look into the relationship between stand structure and stand aboveground biomass (AGB) is rather slow. Previous investigations have revealed a positive correlation between bamboo density and AGB in monotypic bamboo stands [5,6], suggesting the existence of density-dependent biomass accumulation mechanisms. However, this relationship becomes decoupled in mixed moso bamboo forests, wherein moso bamboo expansion has been shown to significantly reduce the species and number of trees through competitive exclusion [7], ultimately leading to the diminished biomass of the overall stand, despite an increase in the bamboo density. This apparent paradox highlights the critical role of stand structural complexity in maintaining ecosystem services, a fundamental principle in forest ecology that has gained renewed emphasis in recent decades [8]. Although stand structure has been extensively studied as a determinant of AGB across local to global scales in arborescent forests, researchers still debate how this connection works in various ecosystems [9].
One mechanism that reveals the relationship between stand structural complexity and ecosystem functioning is the ecological niche complementarity effect [10]. The ecological niche complementarity hypothesis [11] postulates that increased forest functioning is due to a higher diversity of species and functional traits achieved due to coexisting species in the community through the efficient utilization of resources [12]. Individual tree size variations and stand density are important for improving canopy packing and stratification in forests, which may enable greater packing densities of different tree canopy heights to be achieved and may promote aboveground light capture and, thus, increase the AGB [13,14]. Based on this understanding, species diversity, individual tree size variations, and stand density will enhance the ecological niche complementarity by efficiently capturing and utilizing light and other resources [15,16], and, as such, there should be a strong positive correlation between these aspects and AGB.
However, asymmetric competition could explain the effects of the stand structure on the AGB from another perspective. For example, light is limited in the sub-stratum strata, and sub-stratum species co-exist by adopting complementary strategies to utilize the limited available light. In contrast, in the upper strata, where large trees have been freed from competition for light, complementarity in regard to light use becomes less important [17]. This may result in the light capture efficiency of large trees or trees in the stand not being sufficient to compensate for the loss of light capture from smaller trees in the stand or from the understorey [8]. Asymmetric competition for light and water by trees of different sizes may result in a negligible or even negative relationship between individual tree size variations, species richness, and AGB [9,18,19].
This study aims to reveal the joint influences of the stand spatial structure (distance-related to the stand structure) and non-spatial structure (distance-independent stand structure) on stand AGB in mixed moso bamboo forests in Tianbaoyan National Nature Reserve, Fujian, China. Due to the significant variability in stand structures within Tianbaoyan National Nature Reserve, including differences in the spatial and non-spatial attributes, as well as the AGB, the reserve supports a diverse array of moso bamboo mixed forest types. We ask the following research questions to explore the relationships among the stand spatial structure and non-spatial structure and stand AGB: (1) Which stand structure indicators are the main drivers of AGB in mixed moso bamboo forests? We hypothesize that stand density, stand tree size variations, and stand openness are key determinants contributing to variations in AGB. (2) How do stand structural attributes influence stand AGB through direct and indirect effects in mixed moso bamboo forests? We aim to disentangle the direct and indirect pathways through which these structural factors affect AGB, providing a more comprehensive understanding of their role in biomass accumulation.

2. Materials and Methods

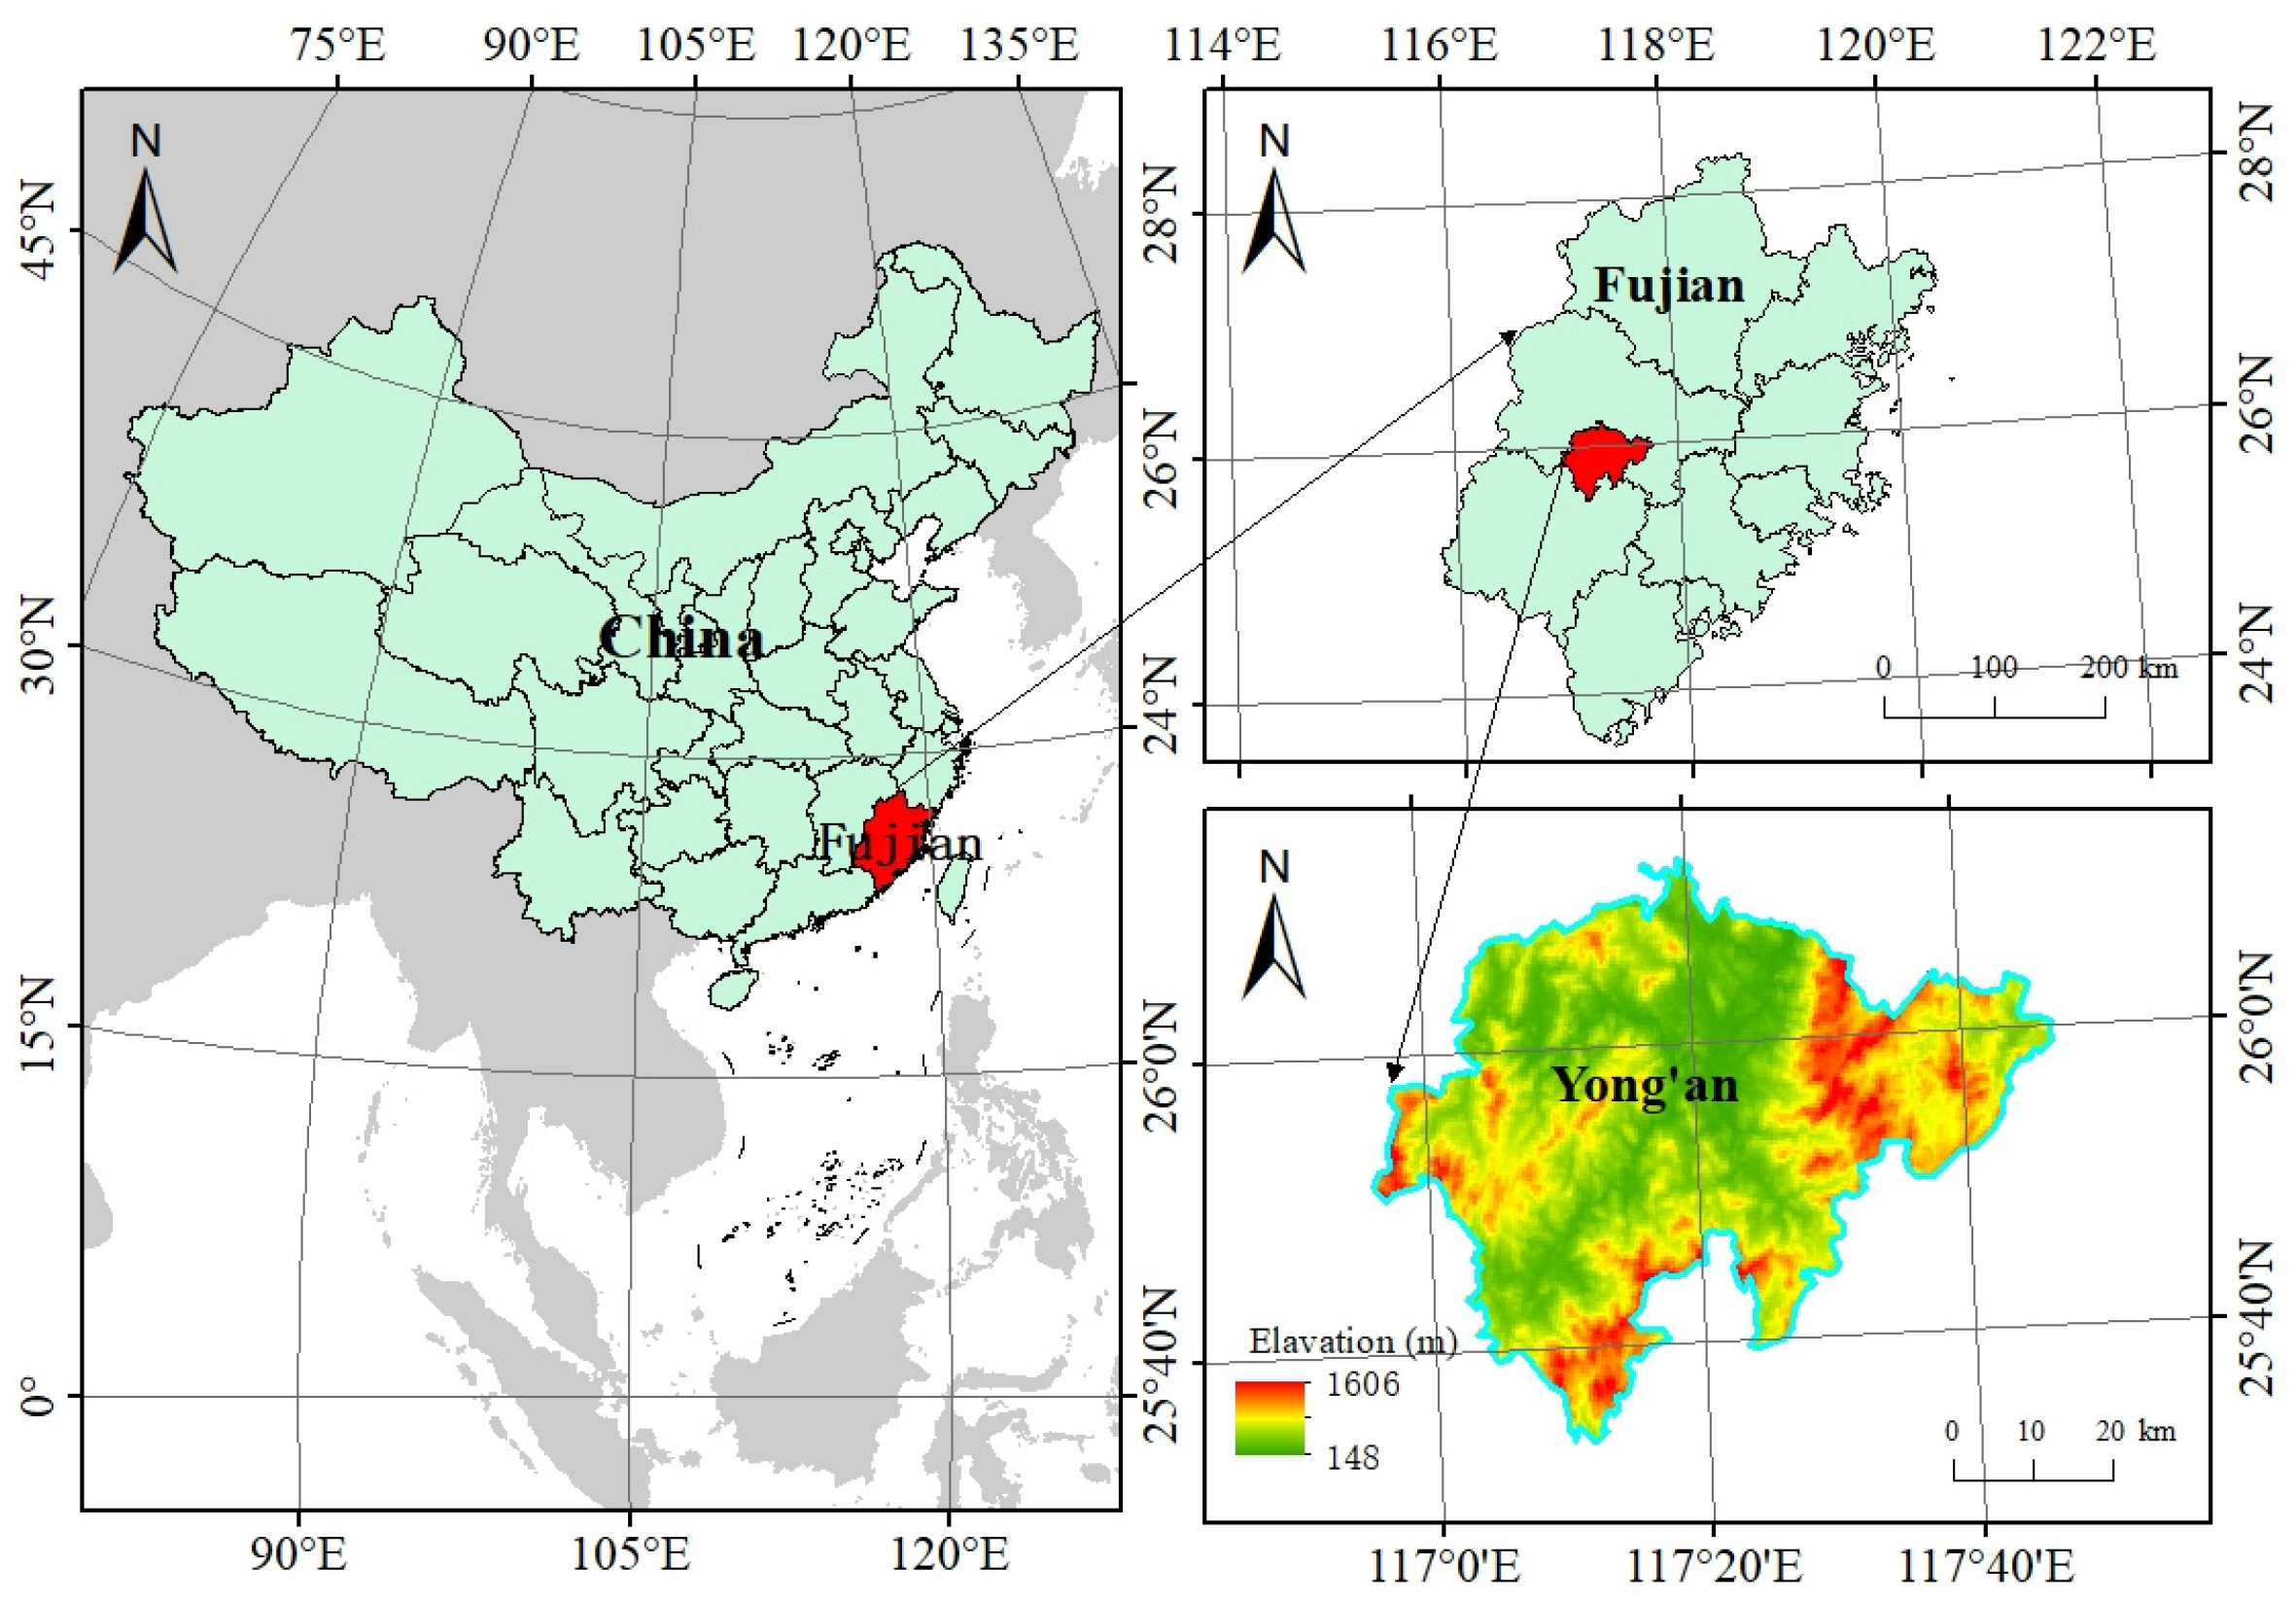
2.1. Study Area and Plots

The current study was carried out in the Tianbaoyan National Nature Reserve, Yong’an City, Fujian Province (geographic coordinates 117°28′3″–117°35′28″ E, 25°50′51″–26°1′20″ N, Figure 1). It is situated in the remnants of the Daiyun Mountains and features typical low-to-mid mountainous geomorphology, with elevations ranging from 580 to 1604.7 m. As a forest ecological nature reserve, it has a forest coverage rate of 96.8%. The study area belongs to the Central Subtropical Oceanic Monsoon Climate Zone, characterized by a warm and humid climate, with four distinct seasons. The average annual temperature is 16 °C, and the annual relative humidity exceeds 80%. Precipitation is seasonally distributed, with the majority occurring from May to September. The sufficient water and heat conditions, along with abundant light resources, provide an excellent growing environment for the forest ecosystem. In general, the dominant species (based on relative abundance) are Phyllostachys edulis, followed by Castanopsis carlesii, Castanopsis hystrix, Castanopsis eyre, Schima superba, Cunninghamia lanceolata, and Triadica cochinchinensis.
During 2022 to 2023, a representative mixed moso bamboo and arbor forest, named the TianBao MetaPlot, was selected within the Tianbaoyan National Nature Reserve. Based on approximate site conditions, such as the elevation, gradient, and slope, a rectangular sample plot covering an area of 4.32 ha (with dimensions of 120 m in length and 360 m in width) was established and was further tessellated into 108 standard sample plots, with a division criteria of 20 m × 20 m. The actual plot radius was determined by using a slope correction factor, which was based on the slope percentage. In each plot, all the individual woody trees with a diameter at breast height (DBH) ≥ 5 cm were measured and identified at the species level. A diameter tape was used to measure the DBH of the trees. Species identification was conducted based on both the opinion of botanical experts and the Chinese Flora present. For the tree height measurement, the DBH distribution was plotted in 2 cm intervals by species. The tree closest to the mean DBH within each interval was selected, and its height was measured using a scalable altimeter (up to 30 m). The positioning and elevation of the sample plots and individual trees were measured using the Qianxun Network Real-Time Kinematic (RTK), which provides a horizontal accuracy of 5 cm and a vertical accuracy of 10 cm for single-point positioning.

2.2. Quantification of the Variables Used in the Analyses

2.2.1. Quantification of Aboveground Biomass

To quantify stand AGB, we estimated the AGB of each tree within the plot using species- and region-specific allometric equations. The individual estimates were then summed up to determine the total AGB per plot, which was subsequently divided by the plot area to calculate the biomass density (t/ha). For species with more than 200 individuals, the AGB was calculated using species-specific allometric equations, developed by previous authors for Fujian and the neighboring regions. For species with fewer individuals (i.e., less than 200; the maximum count in our dataset was 79), they were categorized into three groups, based on their biological characteristics: broad-leaved evergreen species, broad-leaved deciduous species, and coniferous species. The AGB for these groups was calculated using the corresponding allometric equations developed for China. The formulas used to calculate the AGB of individual trees for each tree category are presented in Table 1, where Wi represents the AGB of individual trees and DBHi represents the DBH of individual trees.

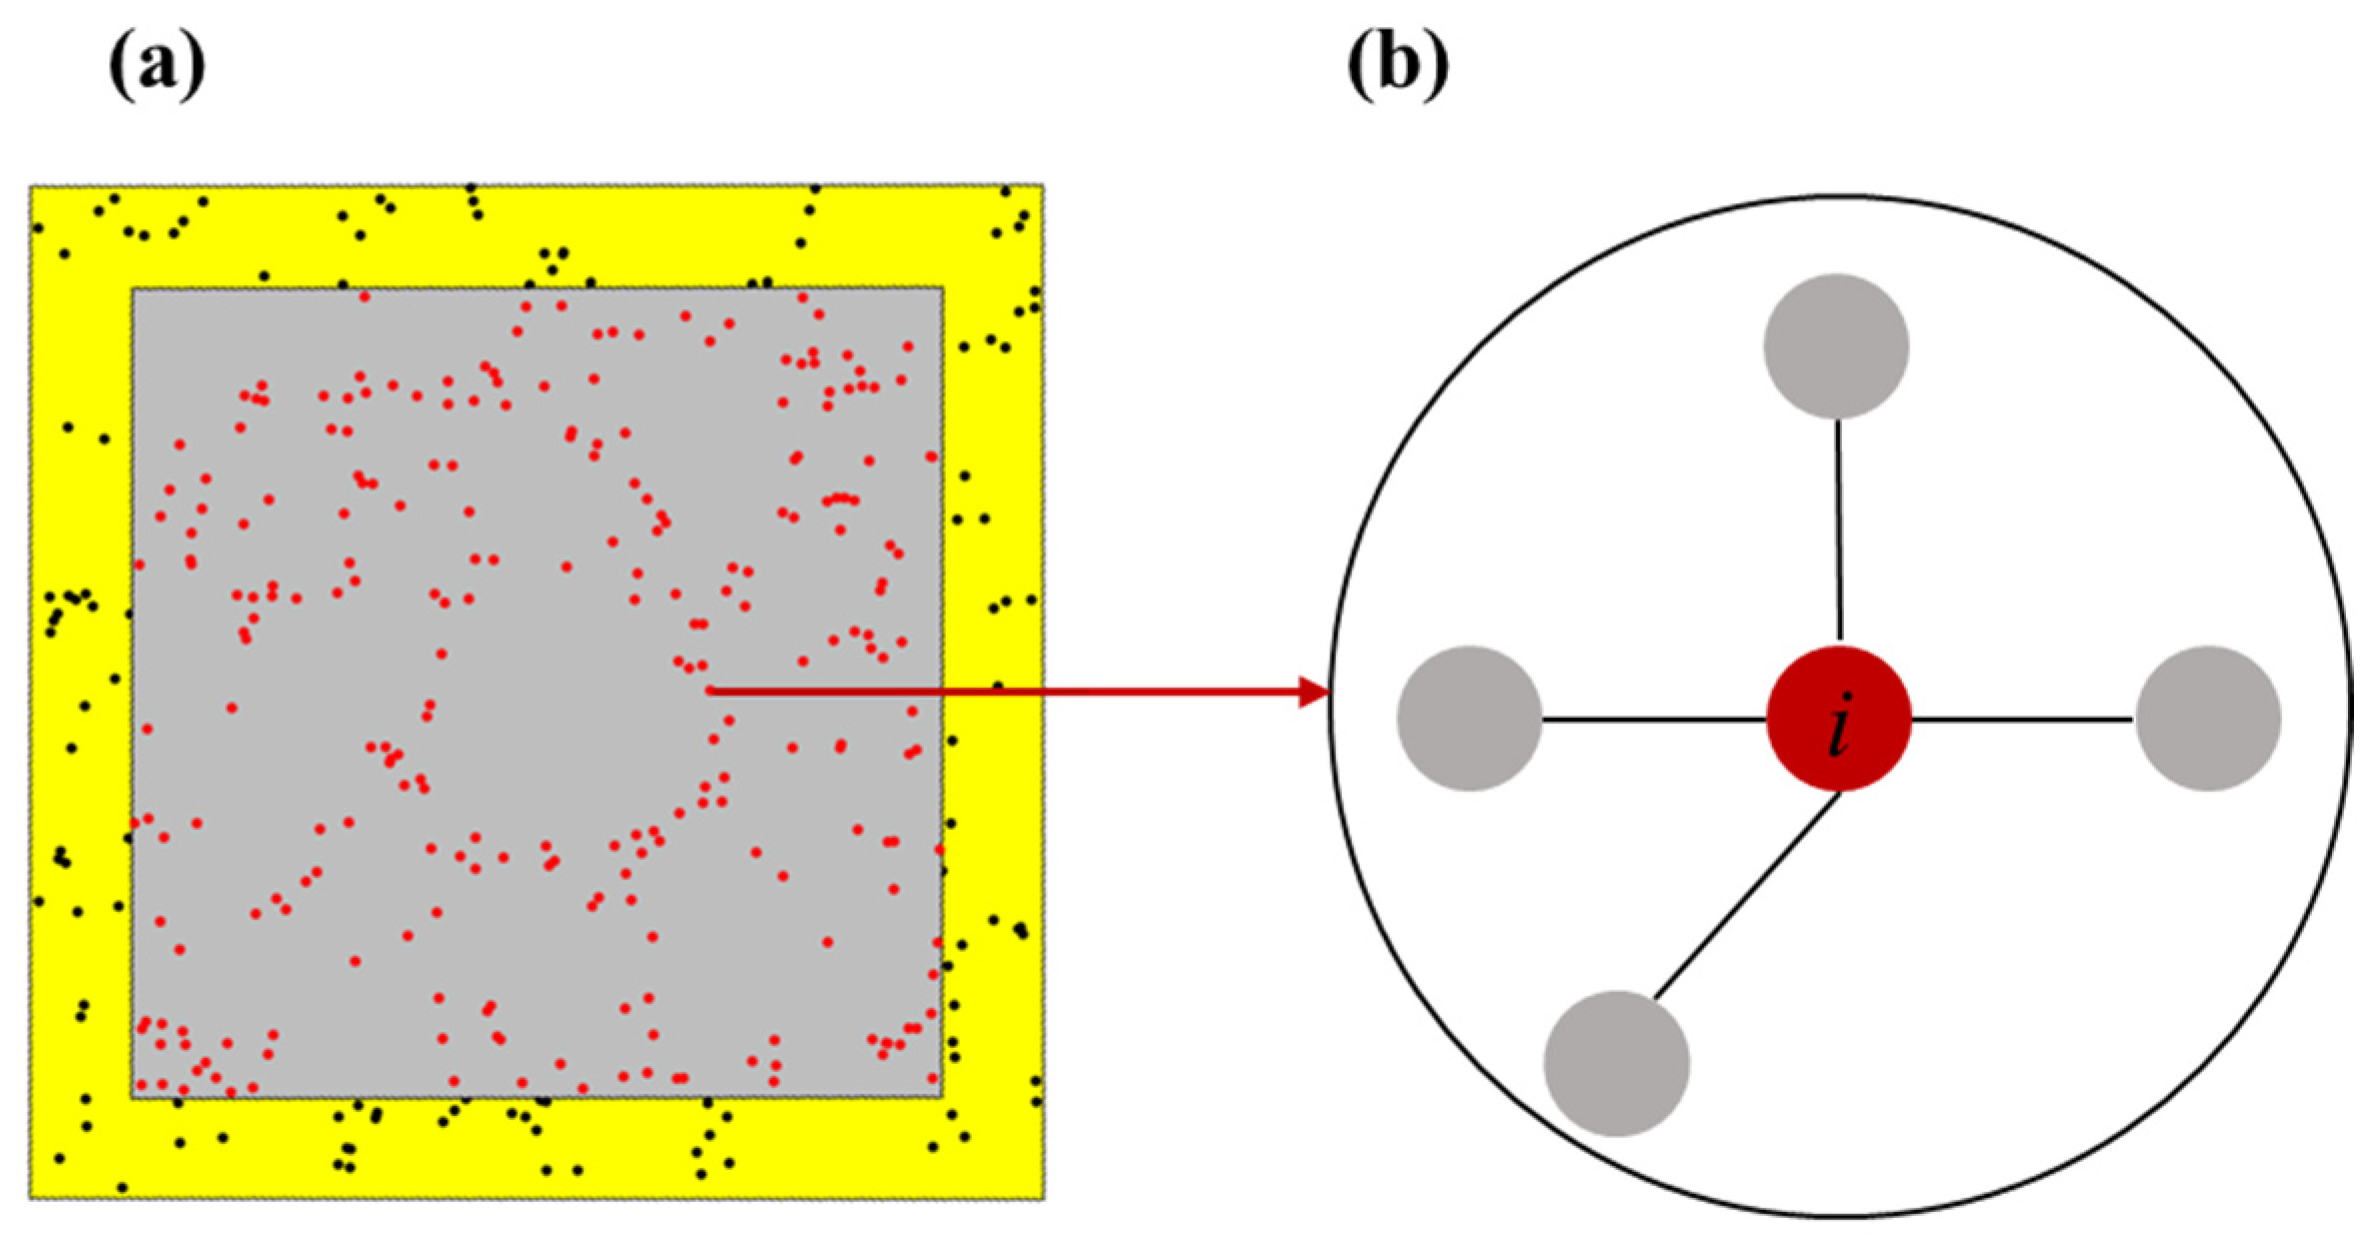
2.2.2. Quantification of Stand Structure Indicators

The stand structure indicators were divided into spatial structure indicators and non-spatial structure indicators. The spatial structure indicators included the stand mingling index (M), stand openness (K), the stand layer index (S), the stand size ratio (U), the stand competition index based on the intersection angle (UCI), and the stand uniform angle index (W). The non-spatial structure indicators included stand density (N), stand tree size variation (CV_DHB), stand mean tree height (Mean_H), stand bamboo mixing ratio (MR), Shannon’s index, and Simpson’s index. Indeed, we selected these factors because they reflect habitat quality, as well as the biophysical conditions of existing forests, and, hence, could act as the initial drivers of stand AGB [29,30].
The four-neighbor method was employed to calculate the spatial structure indices of the mixed moso bamboo forest, allowing for a deeper analysis of its spatial structure. To reduce the edge effect, a 2 m wide buffer zone was established around the sample plot, using the sf package in the R software (version 4.2.2). After correction, all the trees within the 16 m × 16 m core sample plot were analyzed both as reference trees and adjacent trees, while trees in the buffer zone were used exclusively as adjacent trees (as shown in Figure 2). Based on the sample plot survey data, the stand structure indicators were calculated, and the formulas for each indicator are presented in Table 2. The horizontal distance was calculated using R software, based on the X and Y coordinates of each single tree collected by the RTK. The average height of the 50 tallest trees within the entire plot was taken as the dominant height of the stand. Stand stratification was performed, according to the stratification criteria defined by the International Union of Forest Research Organizations (IUFRO).

2.3. Statistical Analyses

To answer question 1 as to which stand structure indicators serve as the main drivers of AGB in mixed moso bamboo forests, we employed a multi-method approach to identify the key forest structural variables influencing the stand AGB in mixed moso bamboo forests. (1) Spearman’s correlation analysis: We employed Spearman’s rank correlation coefficients to assess the monotonic relationships between various stand structural indicators and stand AGB. This analysis was conducted using the “psych” package in R. (2) Random forest model: We applied the random forest algorithm, which constructs multiple decision trees with random subsets of data and variables, to analyze the relationships between forest structural indicators and stand AGB. The analysis was performed using R software, utilizing the “randomForest” and “rfPermute” packages. (3) Multiple linear stepwise regression: To address heteroscedasticity, we applied a logarithmic transformation to the stand AGB. We then performed a stepwise regression to select a subset of stand structural variables that significantly influence the transformed stand AGB, aiming to develop a predictive model, with optimal explanatory power. The multicollinearity among the predictors was assessed using Variance Inflation Factors (VIFs), ensuring all the values were below 5. (4) Voting score method: We aggregated the results from the three methods using a voting score system, selecting the variables that received at least two votes as key stand structural factors affecting stand AGB.
To answer question 2 on how stand structural attributes influence stand AGB through direct and indirect effects in mixed moso bamboo forests, we employed Partial Least Squares Path Modeling (PLS-PM). This method was chosen because it enables the analysis of both direct and indirect impacts of individual stand structures on AGB, as well as the exploration of interrelationships between the structures. Furthermore, PLS-PM does not require strict assumptions, such as in regard to normality, and is capable of addressing multicollinearity issues among the variables in the model. In this study, we used R software, utilizing the “plspm” package, to examine the interactions between the stand structure indicators and stand AGB [39]. In constructing the PLS-PM model, we used the coefficient of determination (R2) and the overall Goodness of Fit (GoF) to assess the structural model. R2 quantifies the model’s explanatory power regarding the latent variables, while the GoF provides an overall measure of the model’s fit. Additionally, path coefficients indicate the direction and strength of the interactions between the variables, as well as their statistical significance.

3. Results

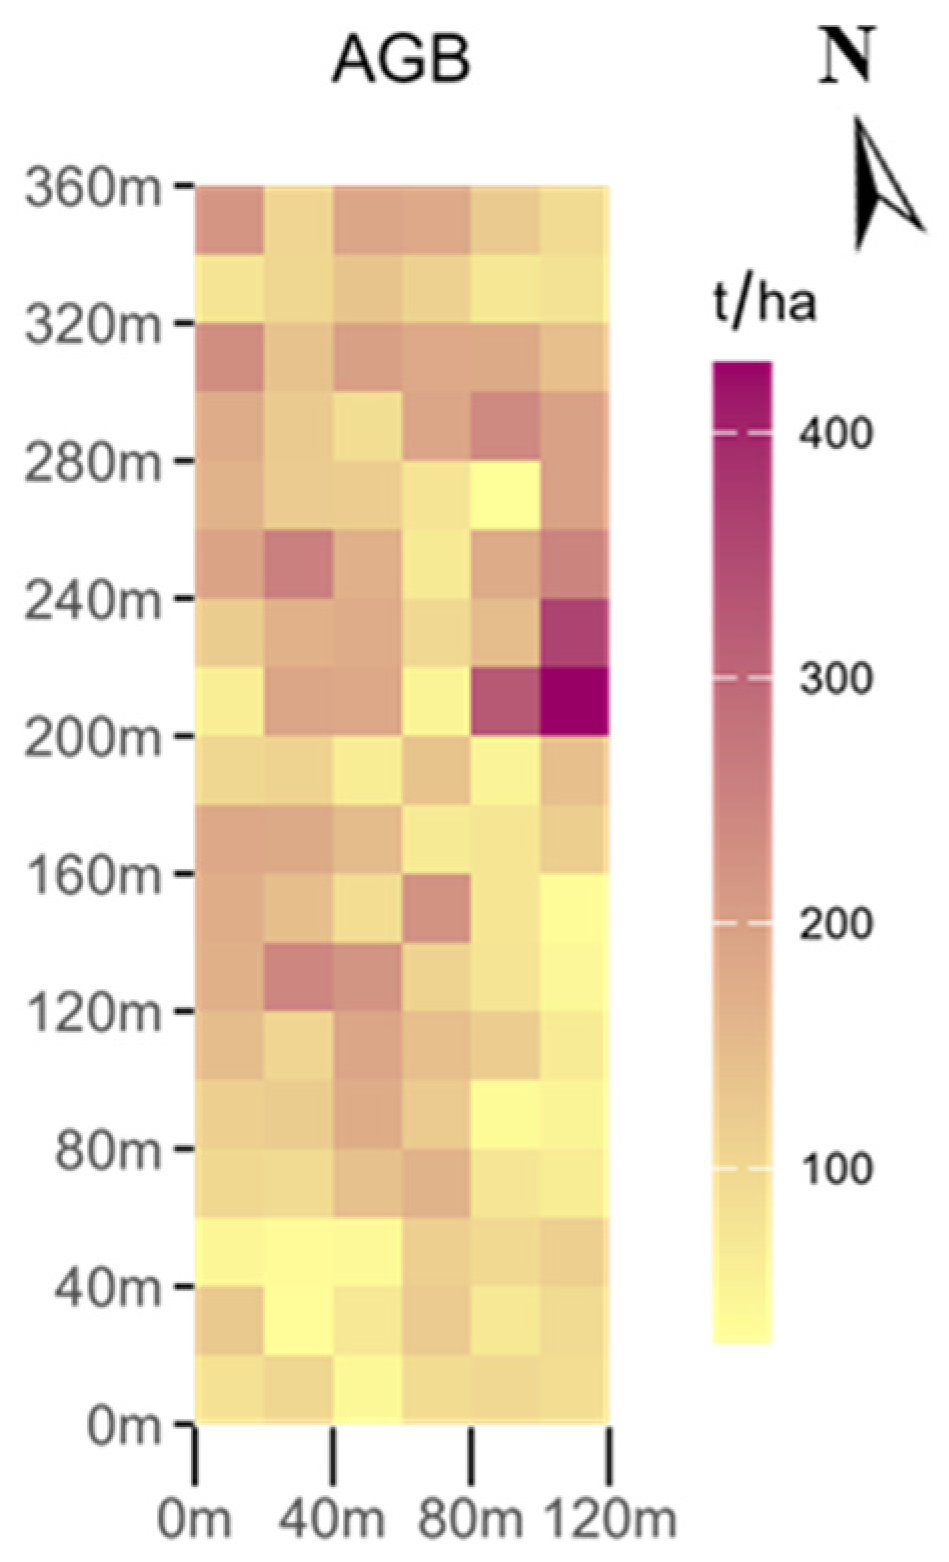
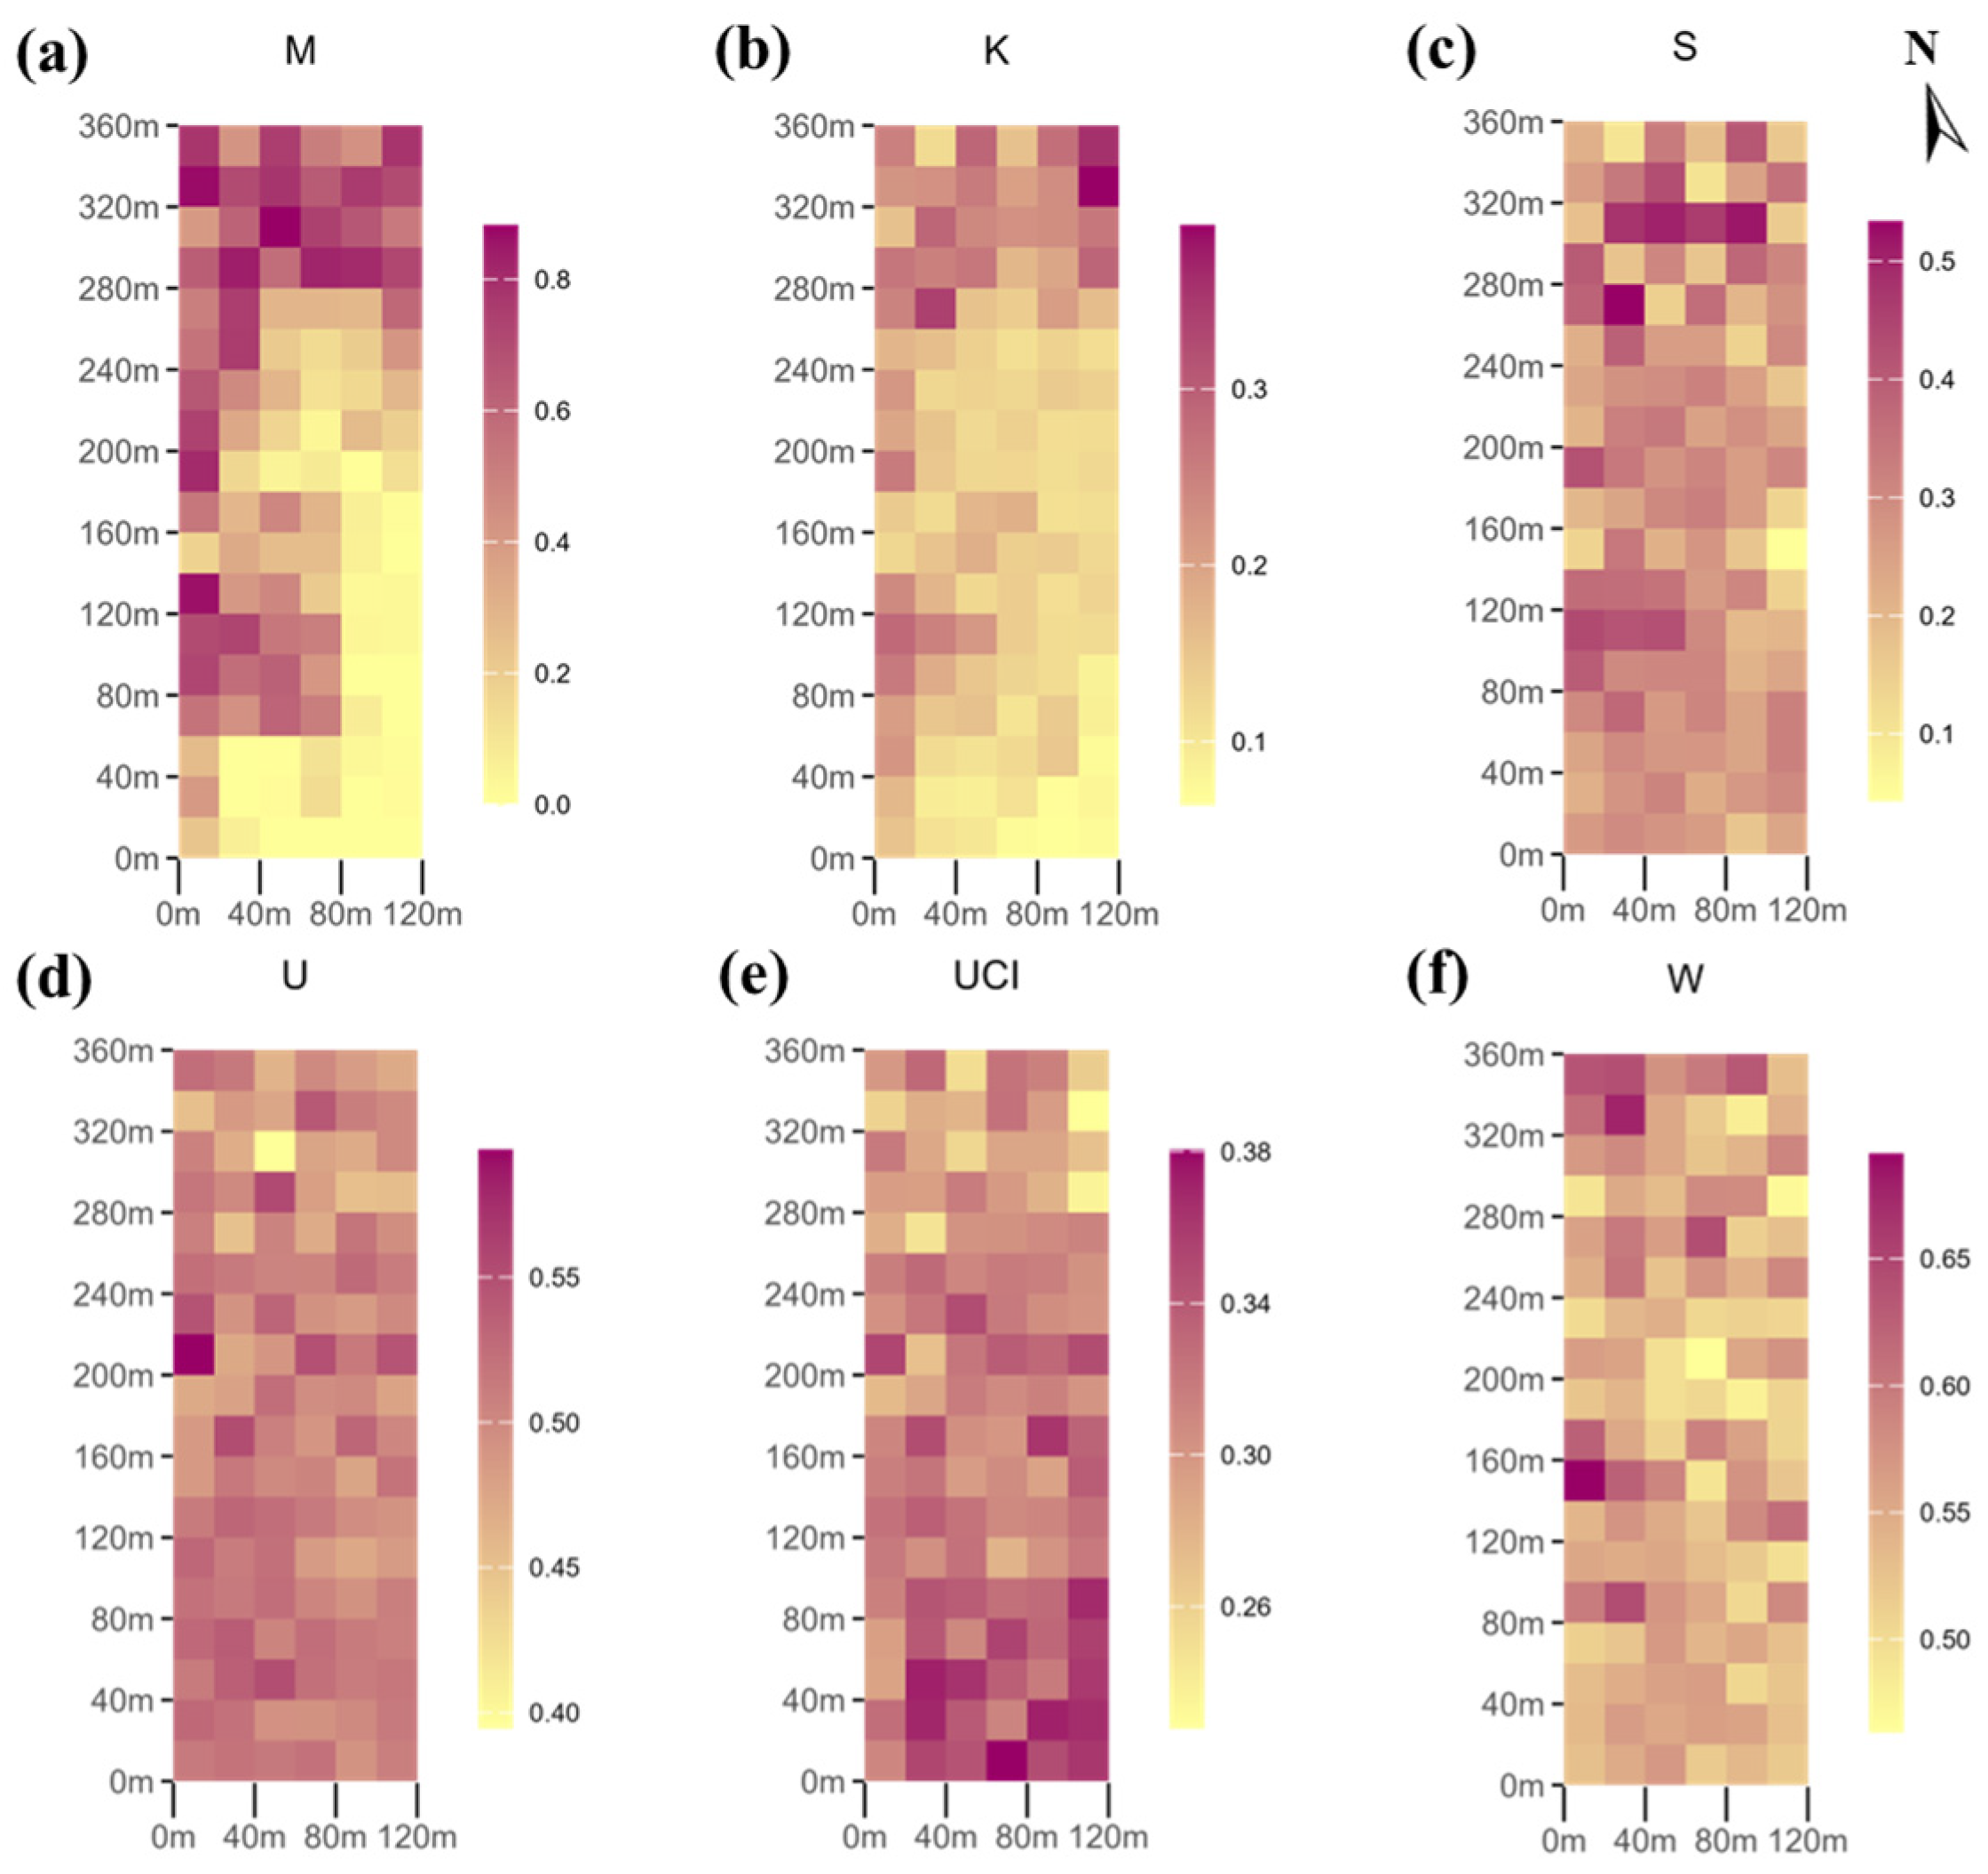
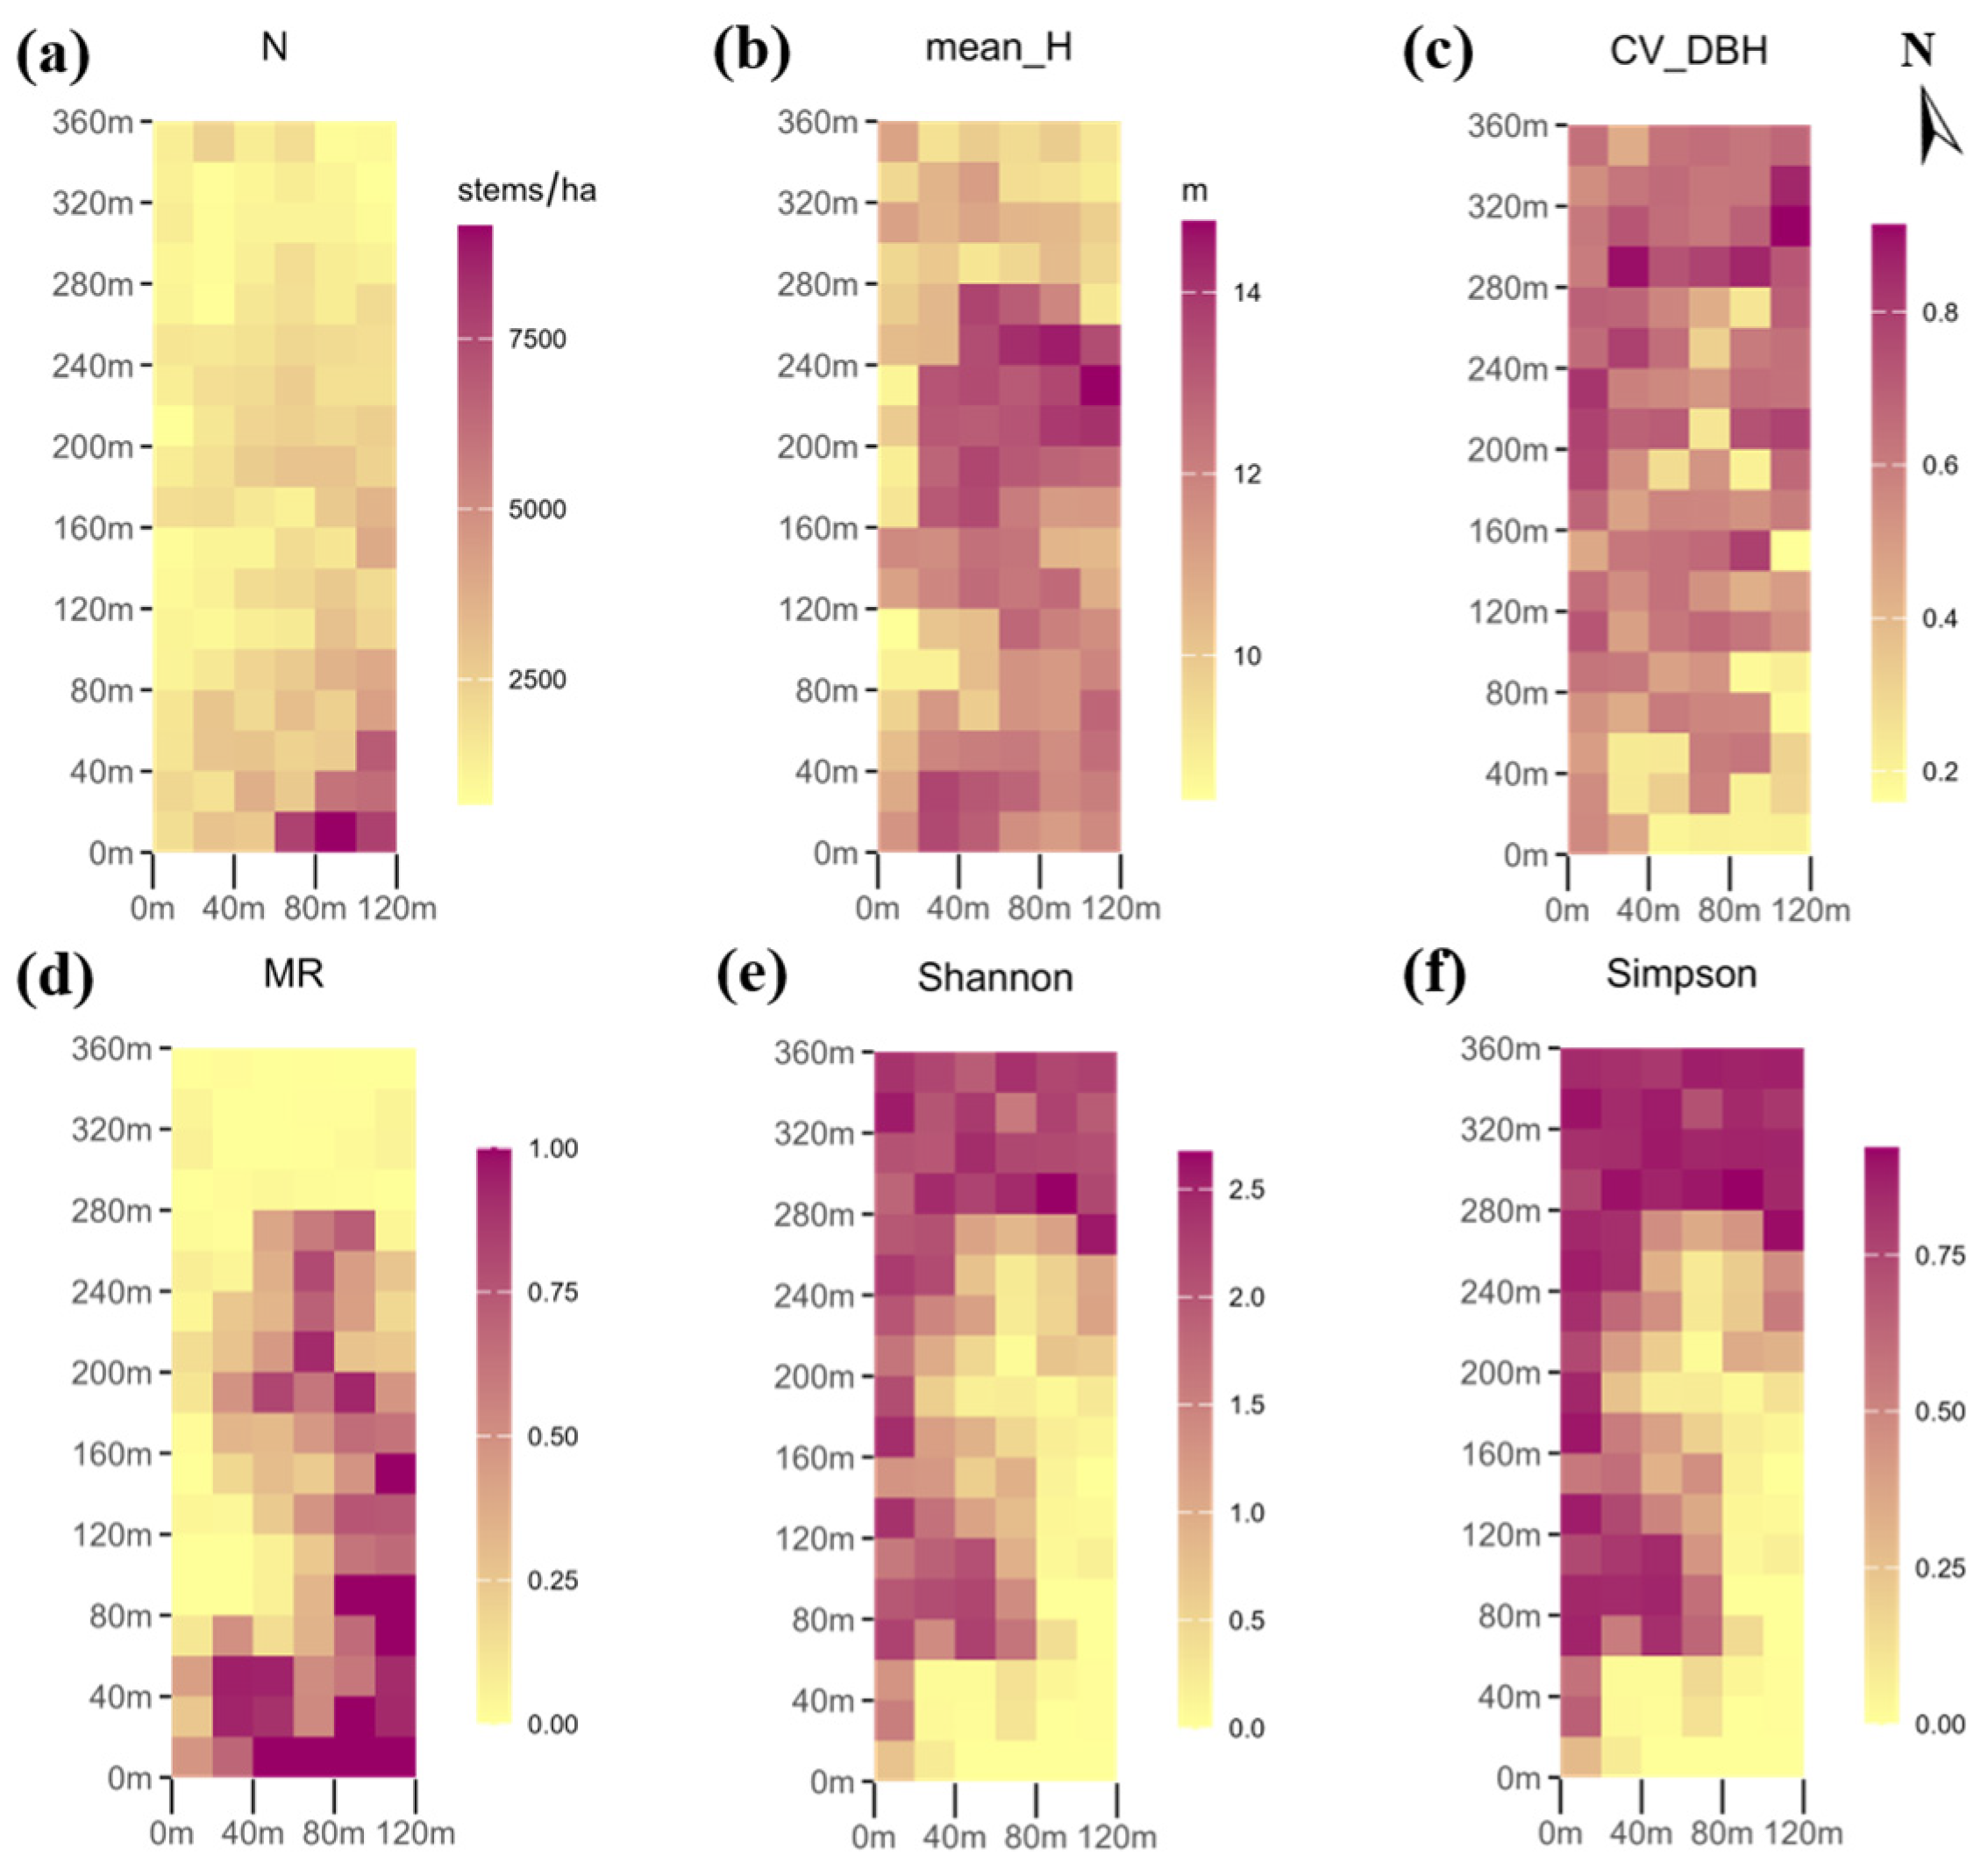
3.1. Characteristics of Stand Structure and Stand AGB in Mixed Moso Bamboo Forests

The basic characteristics of the structure and AGB in mixed moso bamboo forests are presented in Table 3. The AGB in mixed moso bamboo forests ranged from 29.334 to 428.292 t/ha, with a mean value of 131.210 t/ha. The significant variation was indicated by a coefficient of variation of 52.93%. In regard to the non-spatial structure, the coefficients of variation for stand density, the stand bamboo mixing ratio, Shannon’s index, and Simpson’s index were all greater than 60%, indicating substantial variability. In regard to the spatial structure, the stand mingling index, stand openness, and the stand layer index all exhibited high variability, with coefficients of variation exceeding 40%.
As can be seen from Figure 3, there was no obvious difference in the spatial regional distribution of stand AGB. From Figure 4, it can be seen that the stand mingling index and stand openness had a trend of increasing gradually from the southeast to the northwest, while the trends in terms of the other spatial structures were not obvious. As shown in Figure 5, the stand mean tree height, stand bamboo mixing ratio, Shannon’s index, and Simpson’s index exhibited spatial distribution trends, while the stand mean tree height and stand bamboo mixing ratio were lower in the northwest direction than in the southeast direction, and Shannon’s index and Simpson’s index were higher in the northwest direction than in the southeast direction. In addition, the stand density and stand tree size variation showed a gradual change from the southeast to the northwest direction.

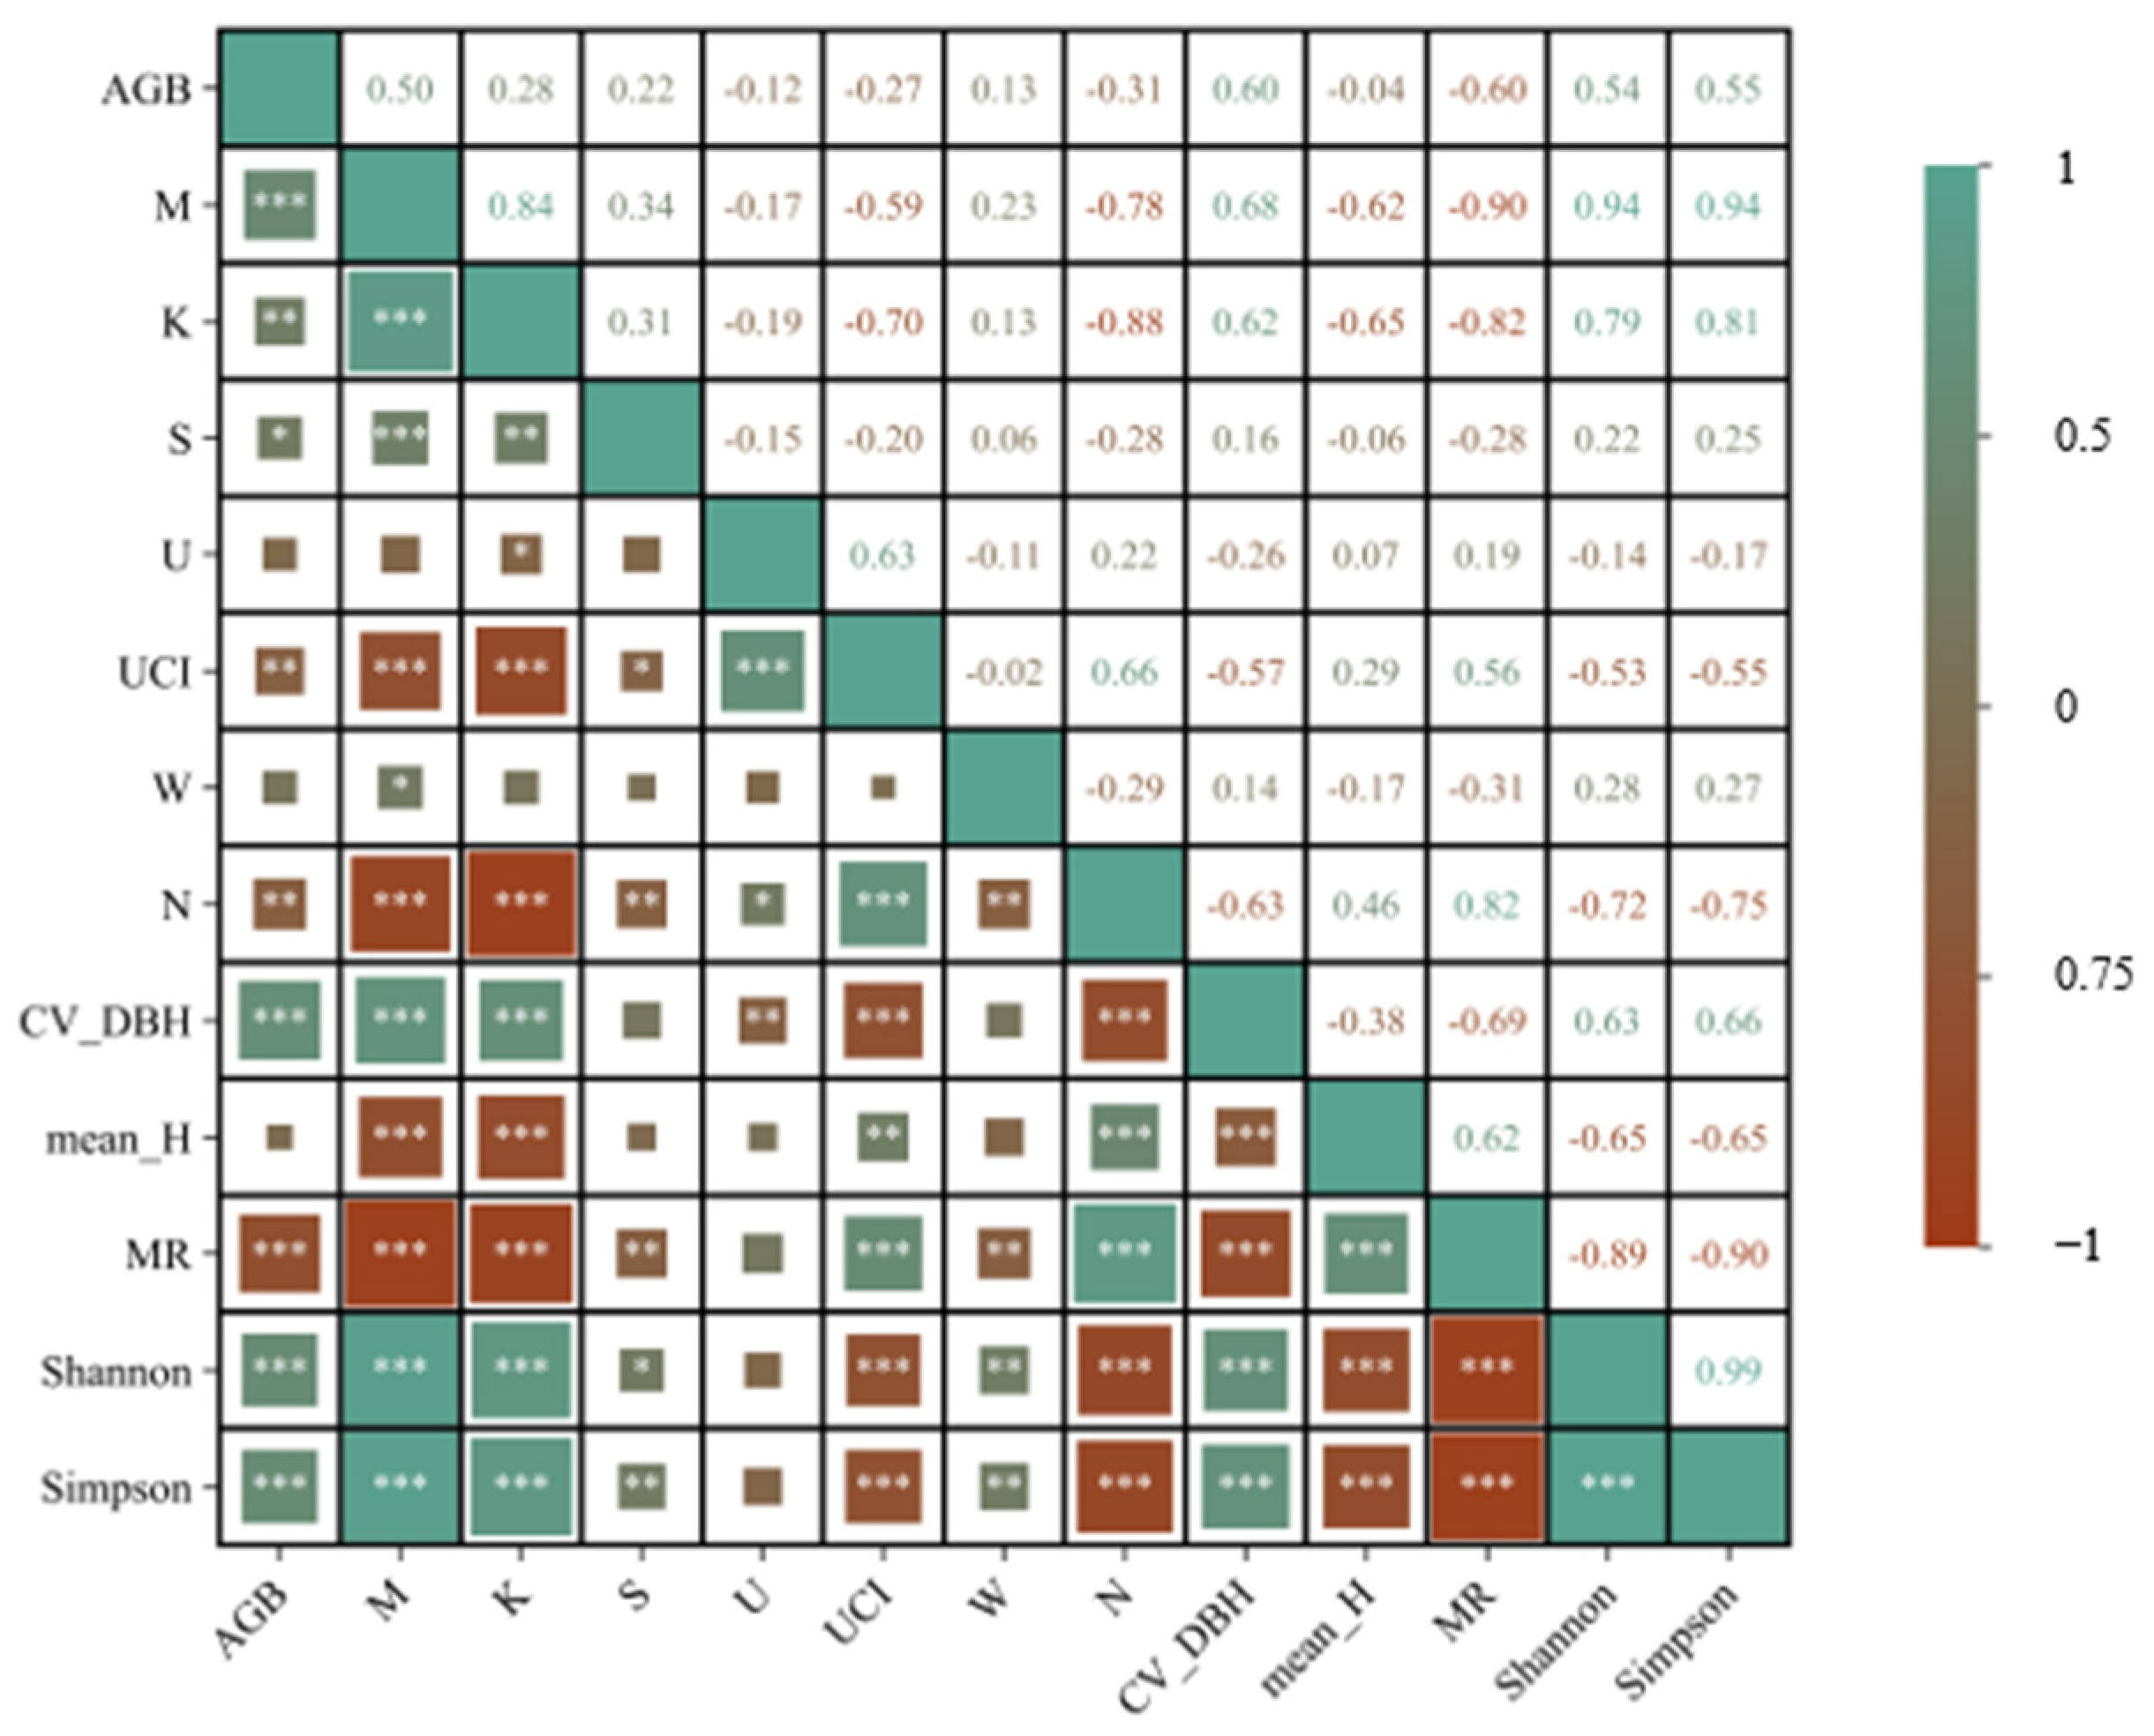
3.2. Screening of Stand Structure Affecting Stand AGB in Mixed Moso Bamboo Forests

Spearman’s correlation analysis between the stand structure and stand AGB (Figure 6) revealed that the stand AGB was significantly correlated with several stand structure indicators, including the stand mingling index, openness, layer index, competition index based on the intersection angle, stand density, stand tree size variation, stand bamboo mixing ratio, Shannon’s index, and Simpson’s index. Notably, several indicators exhibited strong multicollinearity. In particular, the stand mingling index, stand bamboo mixing ratio, Shannon’s index, and Simpson’s index were highly intercorrelated, with their pairwise correlation coefficients exceeding 0.85.
The random forest model (Figure 7) explained 57.32% of the variation in the biomass. In terms of spatial structure, stand openness had the highest importance (IncMSE = 12.00%, p < 0.01), indicating a highly significant effect on stand AGB, while other spatial variables were not statistically significant. For the non-spatial structure, six factors significantly influenced stand AGB: stand mean tree height (IncMSE = 14.49%, p < 0.01), stand bamboo mixing ratio (IncMSE = 13.65%, p < 0.01), stand tree size variation (IncMSE = 12.59%, p < 0.05), stand density (IncMSE = 10.5%, p < 0.01), Simpson’s index (IncMSE = 8.89%, p < 0.05), and Shannon’s index (IncMSE = 7.61%, p < 0.05).
The results of the multiple linear stepwise regression analysis (Table 4) identified five independent factors influencing the log-transformed stand AGB in mixed moso bamboo forests: stand mingling index, stand openness, stand density, stand tree size variation, and stand mean tree height. The model demonstrated strong explanatory power, with an adjusted_R2 of 0.656, indicating that these structural indicators explained 65.6% of the variance in the log-transformed stand AGB. The RMSE was 0.312, further confirming the model’s reliability.
Combining the analysis results of Spearman’s correlation, the random forest model, and the multiple linear regression model, voting was used to select the key stand structures affecting the stand AGB in mixed moso bamboo forests. The stand structures with more than two votes were selected, which were the stand mingling index, stand openness, stand density, stand tree size variation, stand mean tree height, stand bamboo mixing ratio, Shannon’s index, and Simpson’s index.

3.3. Key Structural Factors Influencing Biomass in Mixed Moso Bamboo Stands

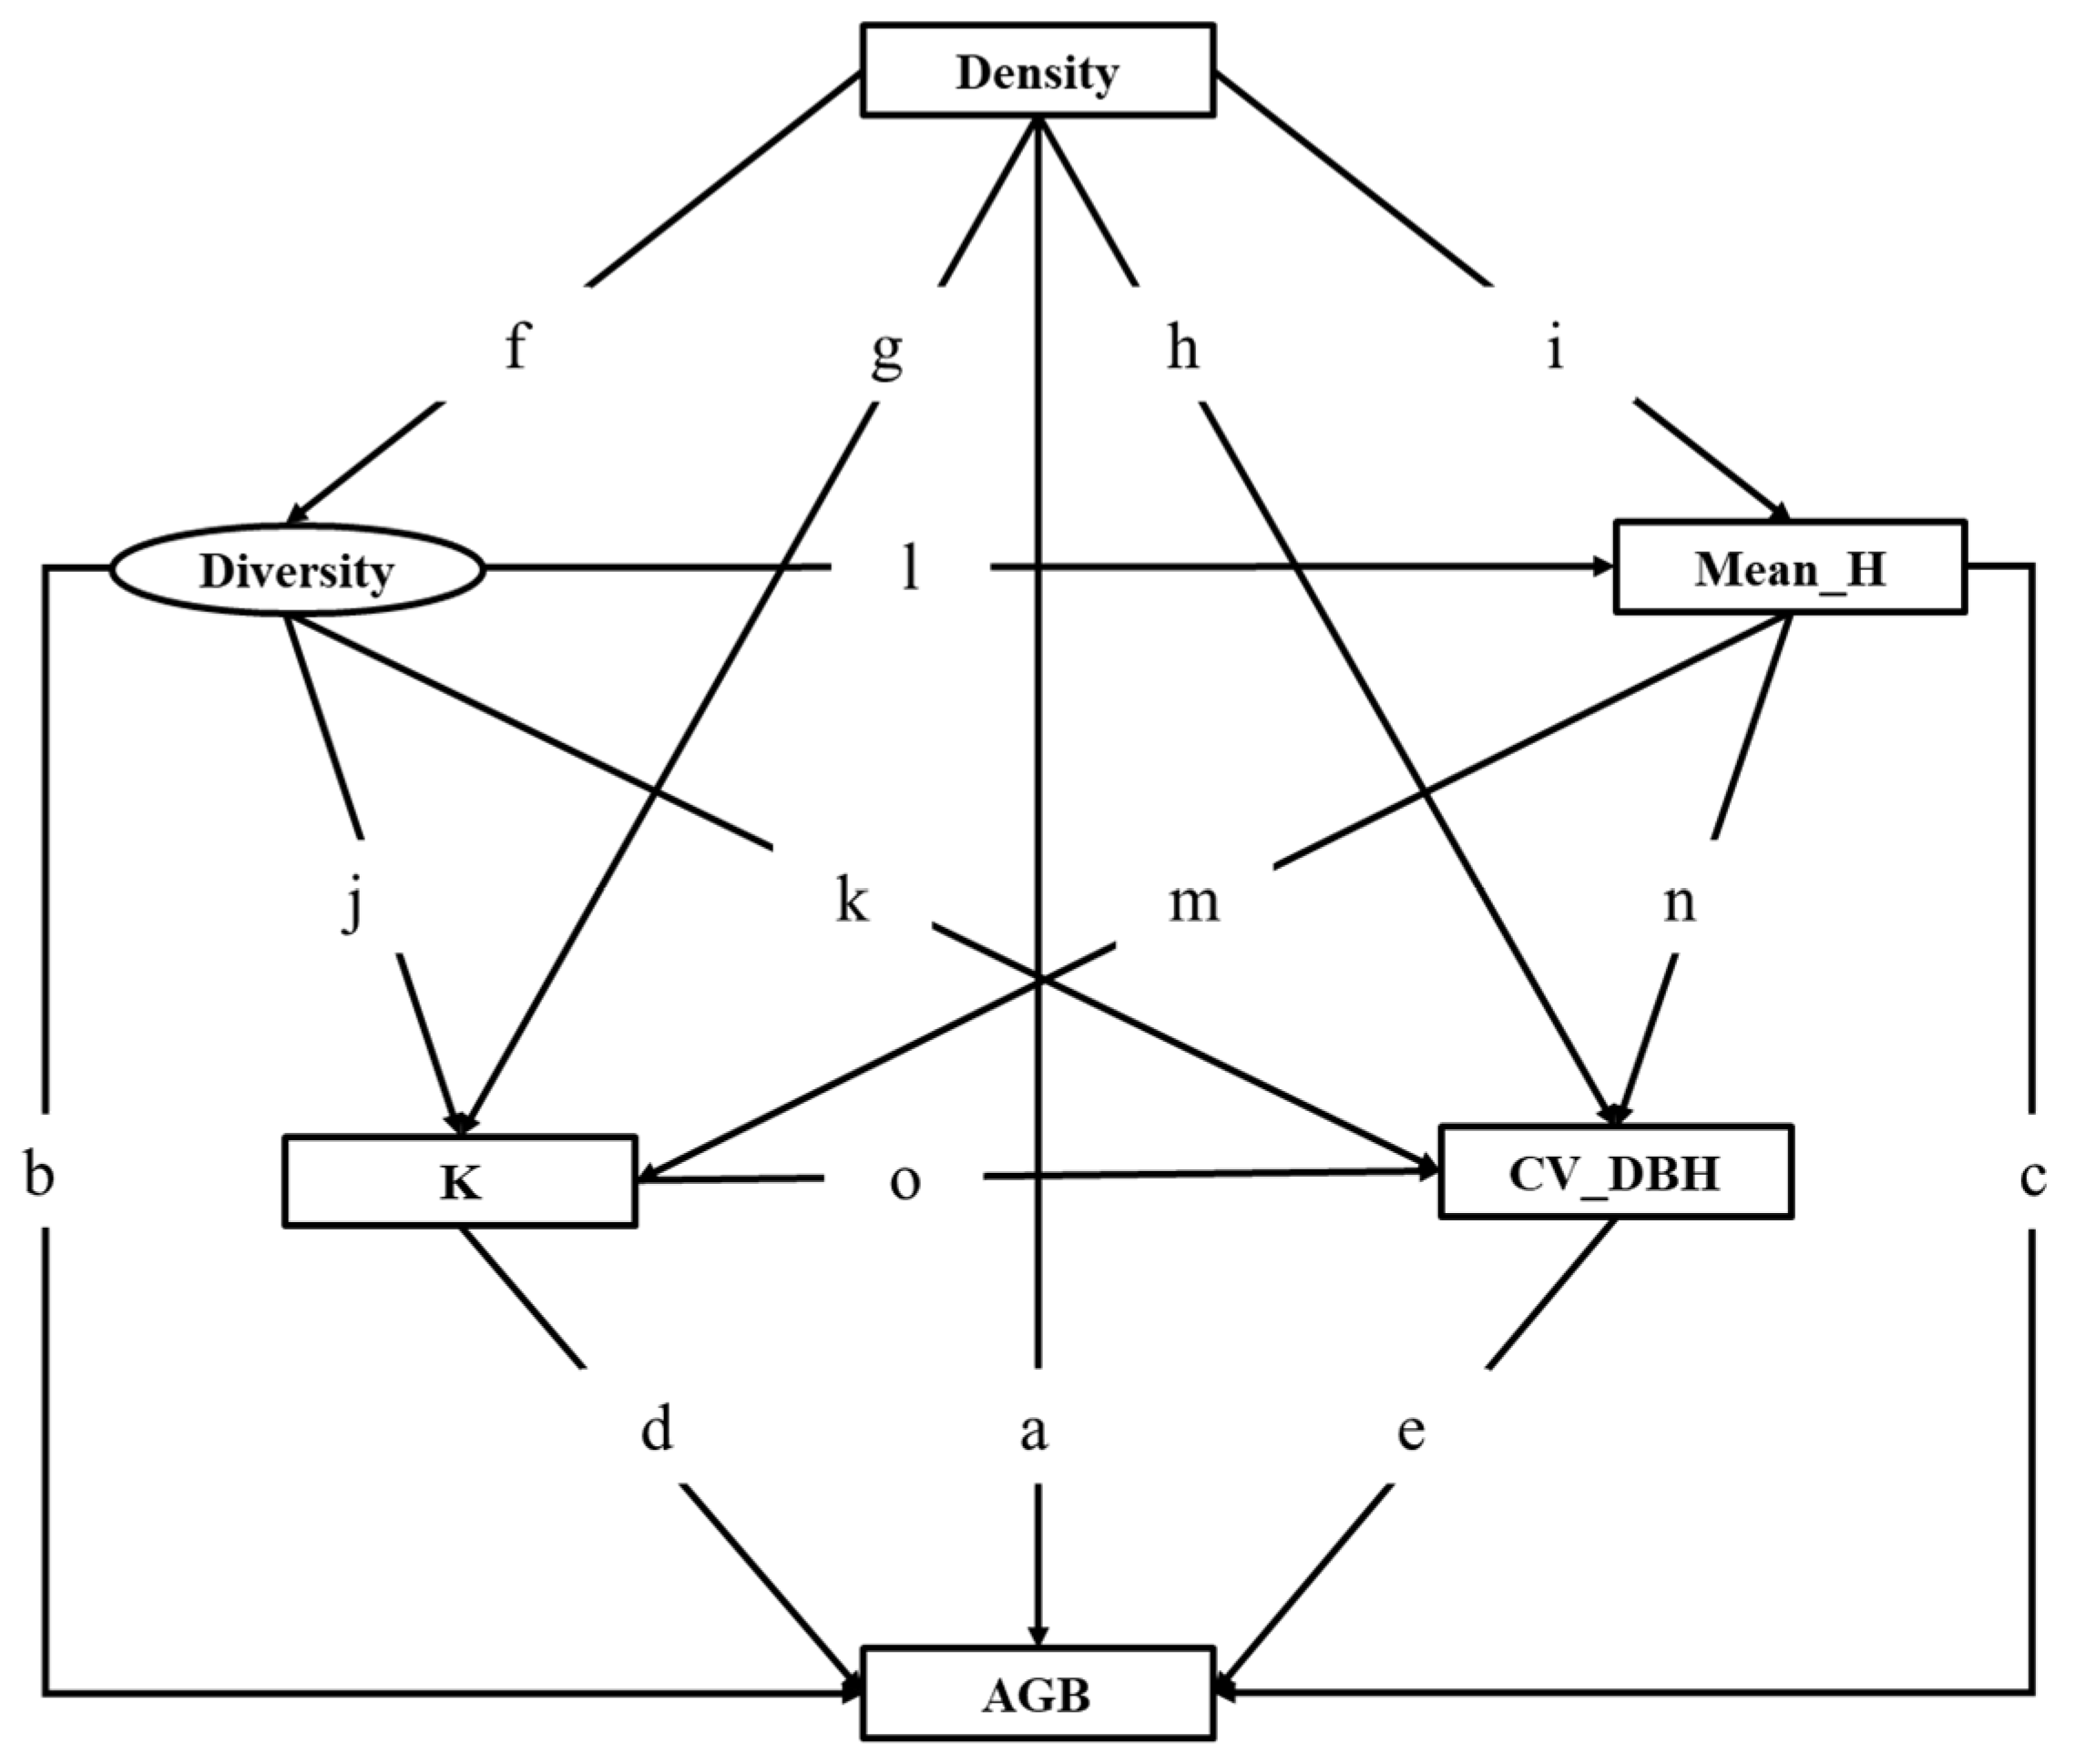
3.3.1. Conceptual Modeling of Structural Equations on the Structure and Biomass in Mixed Moso Bamboo Forests

Before applying PLS-PM to analyze how different stand structural attributes affect stand AGB, it is crucial to first develop a conceptual model. This model should be primarily guided by theoretical frameworks and further refined through the use of empirical data analysis, ensuring a balance between theoretical reasoning and empirical validation. The stand bamboo mixing ratio is mainly reflected in the abundance of moso bamboo in the stand, while tree species diversity reflects the coexistence of multiple species. To quantify tree species diversity, we employed Shannon’s index, Simpson’s index, and the stand mingling index as reflective latent variables (Figure 8).
The model incorporates the following key pathway hypotheses: The stand density, stand tree size variation, stand mean tree height, species diversity, and stand openness were hypothesized to have significant direct effects on stand AGB [40], leading to the establishment of paths a through to e. Increasing the stand density is associated with reductions in stand openness and tree size variation [41], which can alter the species composition and, consequently, species diversity and indirectly influence stand AGB [29,42]. Elevated stand density increases competition, which is not conducive to the growth of the stand mean tree height, so paths f~i were established. Higher species diversity may lead to variations in the mean tree height, stand openness, and tree size variation, supporting the definition of paths j through to l. Given that the tree height is a key factor in calculating stand openness, the mean tree height is posited to influence stand openness, and both may be related to tree size variation, leading to the inclusion of paths m and n. Spearman’s correlation analysis showed a significant correlation between stand openness and stand tree size variation, so path o was preset.

3.3.2. Structural and Biomass Structural Equation Modeling in Mixed Moso Bamboo Forests

The PLS-PM model explained 65.1% of the variance in the increase in the stand AGB in the mixed moso bamboo forest, indicating a good model fit. The results of the PLS-PM model fit analysis (Figure 9 and Table 5) revealed that the stand density, tree diversity, stand mean tree height, and the stand tree size variation had significant positive direct effects on the stand AGB. In contrast, stand openness had a significant negative direct effect on the stand AGB. Stand density and tree diversity exerted negative indirect effects on the stand AGB, whereas the stand mean tree height and stand openness exerted positive indirect effects. Regarding the total effects, the total effects of the stand mean tree height, the stand tree size variation, and tree diversity on stand AGB were positive, while the total effects of the stand density and stand openness were negative.

4. Discussion

4.1. Influence of Stand Spatial Structure on AGB in Forest Stands

It was found that stand openness was significantly negatively correlated with the stand AGB in mixed moso bamboo forests. In most studies of tree stands, stand openness has a significant positive direct effect on stand volume growth [43]. These differences may be related to the unique growth characteristics of moso bamboo and the structure in mixed moso bamboo forests. As a typical clonal plant, moso bamboo exhibits characteristics of clonal propagation and rapid growth. The horizontal distribution patterns in mixed moso bamboo forests are predominantly clustered or nearly clustered [44], leading to a compact stand structure, shorter distances between trees and their neighbors, and reduced openness. Additionally, the physiological traits of moso bamboo confer a significant advantage in regard to resource acquisition, which may determine or alter competitive relationships between plants [18,45]. For example, moso bamboo can efficiently allocate occupancy among moso bamboo within the limited space and resources of the community, thus reducing the mutual influence of asymmetric competition among conspecific individuals [46]. In summary, the relationship between spatial structure and AGB in mixed moso bamboo forests exhibits distinct patterns compared to conventional arborvitae forests. Moso bamboo’s unique growth strategy, characterized by dense clonal propagation and rapid resource acquisition, enables effective biomass accumulation in closed-canopy conditions, contrasting with the openness preference observed in most arborescent ecosystems.

4.2. Influence of Stand Non-Spatial Structure on AGB in Forest Stands

Tree diversity had a significant positive correlation with stand AGB in mixed moso bamboo forests, which is consistent with the results for temperate forest types [30,47] and grassland ecosystems [13]. Ecological niche complementarity theory suggests that different tree species and trees reduce competition and increase resource efficiency through differential resource utilization [12]. Studies have shown that the root system of moso bamboo tends to be distributed in the shallow soil layer during its expansion, and its fine root biomass is significantly higher than that of other trees [48]. This root distribution not only enables moso bamboo to efficiently absorb surface water, thereby increasing the utilization of shallow soil moisture in the stand during the growing season, but also promotes other tree species to adjust their root distribution in response to competition. For example, the root systems of broad-leaved trees gradually extend deeper into the soil to absorb mid-layer soil moisture, thereby increasing the utilization efficiency of mid-layer soil moisture in arboraceous species [49]. Therefore, the increase in tree species diversity can promote the accumulation of AGB in mixed moso bamboo forests by enhancing the utilization efficiency of water and other resources.
In this study, the PLS-PM indicated that the total effect of the stand density on the AGB in mixed moso bamboo forests was negative. The average stand density in this study was 2188 stems/ha, with a maximum of 9150 stems/ha, which was much higher than the stand density reported in most other studies. Research has shown that the density of moso bamboo in the stand increases significantly during the expansion process [50], and moso bamboo is the primary species contributing to the increased stand density in mixed moso bamboo forests. In contrast to typical trees, moso bamboo is taxonomically a perennial grass rather than a true tree species [51] and its culms achieve their full height and diameter within 2 months after shoot emergence in spring. Subsequently, due to the limited presence of secondary cambium, these dimensions remain constant, with the culms gradually accumulating dry matter over time [52,53]. Additionally, moso bamboo culms are hollow and have an average lifespan of about a decade [54]. While their hollow structure contributes to their lightweight form, it also limits their capacity to store biomass. These traits mean that the biomass accumulation of moso bamboo relies heavily on the number and age composition of culms, not on continuous size increments like in trees. These factors suggest that the rapid sprouting of new shoots and the limited biomass potential of individual culms may lead to a reduction in biomass accumulation in mixed moso bamboo stands at higher stand densities. Currently, there are relatively few studies on the effects of stand density on stand AGB in mixed moso bamboo forests. This study enriches the understanding of how stand density influences stand AGB in mixed moso bamboo forests.
In this study, both the stand density and species richness indirectly affect the AGB in mixed moso bamboo forests. In regard to other studies on general mixed forests, it was found that stand density indirectly affects biomass and carbon stock through positively influencing species richness [29,30,55], while the opposite is true in this study. The special characteristics of moso bamboo lead to its gradual expansion to arborvitae forests, and the increase in the stand density year by year may lead to the withdrawal of some tree species from the community [49], which changes the species composition, and, thus, reduces the diversity of tree species in the forest stand [4]. In addition, some studies have also found that stand density indirectly affects carbon stock due to trunk diameter class variations, stand stability, and stand vertical structure [29,30], which is consistent with the finding in this study that the stand density indirectly affects the AGB in mixed moso bamboo forests through affecting the stand tree size variation.

4.3. Implications for Multifunctional Forest Management in Mixed Moso Bamboo Stands

Maintaining an excellent stand spatial structure is a key prerequisite for ensuring the proper functioning of forest ecosystems. The essence of structured forest management lies in analyzing the direct and indirect effects of the stand spatial structure on ecosystem functions, and then proposing an ideal stand spatial structure to achieve multifunctional forest management goals [56]. Consequently, effective AGB management in mixed moso bamboo forests necessitates moving beyond single-structure optimization to incorporate synergistic interactions among multiple structural attributes. Specifically, the strategic regulation of moso bamboo-to-tree ratios, coupled with density control through selective thinning and targeted promotion of stand tree size variations, emerges as critical for structural optimization and resource use efficiency enhancement in both existing and newly established stands.

5. Conclusions

Our study identified stand density, the stand moso bamboo mixing ratio, Shannon’s index, Simpson’s index, stand mean tree height, stand openness, and the stand tree size variation as key structural factors influencing the stand AGB in mixed moso bamboo forests. These findings highlight the complex and multifaceted effects of the stand structure on stand AGB and further enrich the understanding on how stand density and tree diversity affect biomass accumulation in these types of forests. Specifically, stand density had an overall negative total effect on stand AGB, despite its direct positive influence. This negative outcome resulted from the stronger indirect negative effects through its impact on other structural variables. This outcome is in contrast with previous findings in arbor forests, where a higher stand density often promoted AGB. Tree diversity exhibited a strong positive total effect on stand AGB, supporting the niche complementarity theory and helping to address the limitations of pure moso bamboo forests, which lack species diversity and, therefore, cannot benefit from biodiversity-related effects on biomass. Additionally, the stand mean tree height and stand tree size variation had significant positive total effects on stand AGB in mixed moso bamboo forests, whereas stand openness had a negative total effect. The direct impacts of the variables on stand AGB are generally more significant in magnitude than the indirect impacts, with stand density having a larger indirect impact. To enhance the stand AGB in mixed moso bamboo forests we recommend the following management measures: increasing tree size variability, promoting tree species diversity, and applying rational thinning of moso bamboo, based on site-specific conditions.

Author Contributions

Conceptualization, Z.D., Q.X. and S.F.; methodology, Z.D. and Q.X.; software, Z.D. and Q.X.; writing—original draft preparation, Z.D.; writing—reviewing and editing, Q.X., S.F., G.L. and S.W.; investigation, Z.L.; resources, C.C. All authors have read and agreed to the published version of the manuscript.

Funding

This study was funded by the National Key R&D Program of China of the 14th Five-Year Plan (Grant No. 2023YFD2201203) and the International Centre for Bamboo and Rattan Fundamental Research Fund Special Project (Grant No. 1632020029, Grant No. 1632021024 and Grant No. 1632022024).

Data Availability Statement

The original contributions presented in this study are included in the article. Further inquiries can be directed to the corresponding author.

Conflicts of Interest

The authors declare that there are no conflicts of interest.

Abbreviations

The following abbreviations are used in this manuscript:
AGBAboveground biomass
MMingling index
KOpenness
SLayer index
USize ratio
UCICompetition index based on intersection angle
WUniform angle index
NDensity
CV_DBHTree size variation
Mean_HMean tree height
MRMoso bamboo mixing ratio

References

  1. Xu, L.; Shi, Y.; Zhou, G.; Xu, X.; Liu, E.; Zhou, Y.; Zhang, F.; Li, C.; Fang, H.; Chen, L. Structural development and carbon dynamics of Moso bamboo forests in Zhejiang Province, China. For. Ecol. Manag. 2018, 409, 479–488. [Google Scholar] [CrossRef]
  2. Jiang, Z. Bamboo and Rattan in the World; Liaoning Science and Technology Press: Shenyang, China, 2002; pp. 23–68. [Google Scholar]
  3. Ouyang, M.; Eziz, A.; Xiao, S.; Fang, W.; Cai, Q.; Ma, S.; Zhu, J.; Yang, Q.; Hu, J.; Tang, Z. Effects of bamboo invasion on forest structures and diameter–height allometries. For. Ecosyst. 2025, 12, 100256. [Google Scholar] [CrossRef]
  4. Xu, Q.; Liang, C.; Chen, J. Rapid bamboo invasion (expansion) and its effects on biodiversity and soil processes+. Glob. Ecol. Conserv. 2020, 21, e00787. [Google Scholar] [CrossRef]
  5. Fan, Y. Effects of Site Factors and Stand Structure on Biomass of Moso Bamboo Forest. Master’s Thesis, Zhejiang Agriculture and Forestry University, Hangzhou, China, 2020. [Google Scholar]
  6. Xu, Y. Research on Community Structure and Carbon Accumulation of Moso Bamboo Forest. Ph.D. Thesis, Zhejiang University, Hangzhou, China, 2011. [Google Scholar]
  7. Lima, R.A.; Rother, D.C.; Muler, A.E.; Lepsch, I.F.; Rodrigues, R.R. Bamboo overabundance alters forest structure and dynamics in the Atlantic Forest hotspot. Biol. Conserv. 2012, 147, 32–39. [Google Scholar] [CrossRef]
  8. Buongiorno, J.; Dahir, S.; Lu, H.-C.; Lin, C.-R. Tree size diversity and economic returns in uneven-aged forest stands. For. Sci. 1994, 40, 83–103. [Google Scholar] [CrossRef]
  9. Ali, A. Forest stand structure and functioning: Current knowledge and future challenges. Ecol. Indic. 2019, 98, 665–677. [Google Scholar] [CrossRef]
  10. Naeem, S. Ecosystem consequences of biodiversity loss: The evolution of a paradigm. Ecology 2002, 83, 1537–1552. [Google Scholar] [CrossRef]
  11. Tilman, D. The ecological consequences of changes in biodiversity: A search for general principles. Ecology 1999, 80, 1455–1474. [Google Scholar] [CrossRef]
  12. Tilman, D.; Knops, J.; Wedin, D.; Reich, P.; Ritchie, M.; Siemann, E. The Influence of Functional Diversity and Composition on Ecosystem Processes. Science 1997, 277, 1300–1302. [Google Scholar] [CrossRef]
  13. Shigeo, Y.; Michel, L. Does complementary resource use enhance ecosystem functioning? A model of light competition in plant communities. Ecol. Lett. 2007, 10, 54–62. [Google Scholar] [CrossRef]
  14. Zhang, Y.; Chen, H.Y. Individual size inequality links forest diversity and above-ground biomass. J. Ecol. 2015, 103, 1245–1252. [Google Scholar] [CrossRef]
  15. Ali, A.; Yan, E.-R.; Chen, H.Y.; Chang, S.X.; Zhao, Y.-T.; Yang, X.-D.; Xu, M.-S. Stand structural diversity rather than species diversity enhances aboveground carbon storage in secondary subtropical forests in Eastern China. Biogeosciences 2016, 13, 4627–4635. [Google Scholar] [CrossRef]
  16. Wang, W.; Lei, X.; Ma, Z.; Kneeshaw, D.D.; Peng, C. Positive relationship between aboveground carbon stocks and structural diversity in spruce-dominated forest stands in New Brunswick, Canada. For. Sci. 2011, 57, 506–515. [Google Scholar] [CrossRef]
  17. Ali, A.; Lohbeck, M.; Yan, E.-R. Forest strata-dependent functional evenness explains whole-community aboveground biomass through opposing mechanisms. For. Ecol. Manag. 2018, 424, 439–447. [Google Scholar] [CrossRef]
  18. Schwinning, S.; Weiner, J. Mechanisms determining the degree of size asymmetry in competition among plants. Oecologia 1998, 113, 447–455. [Google Scholar] [CrossRef] [PubMed]
  19. Potvin, C.; Dutilleul, P. Neighborhood effects and size-asymmetric competition in a tree plantation varying in diversity. Ecology 2009, 90, 321–327. [Google Scholar] [CrossRef] [PubMed]
  20. Chen, H.; Hong, W.; Lan, B.; Zheng, Y.; He, D. Study on biomass and productivity of Phyllostachys Heterocycla CV.Pubescens forest in the north of Fujian. Sci. Silvae Sin. 1998, 34, 60–64. [Google Scholar] [CrossRef]
  21. Lin, K. Research and analysis on biomass allometric equations of subtropical broad-leaved forest. J. Cent. South Univ. For. Technol. 2017, 37, 115–120, 126. [Google Scholar] [CrossRef]
  22. Liu, E. Carbon Storage of Typical Plantations in South Sub-Tropical Area; Chinese Academy of Forestry: Beijing, China, 2012. [Google Scholar]
  23. Ding, Z. Biomass and growth models of four major tree species in subtropical evergreen broad-leaved forest in Anhui Chinese Full Text. J. Anhui Agric. Univ. 2014, 41, 859–865. [Google Scholar] [CrossRef]
  24. Yu, C.; Hong, W.; Wu, C.; Qi, X. Distribution Characters of Schima superba Aboveground Biomass and Its Produdtivity. Chin. J. Appl. Environ. Biol. 2009, 15, 318–322. [Google Scholar] [CrossRef]
  25. NFGA. Stumpage Biomass Modelling and Carbon Measurement Parameters for Major Tree Species; Standard Press of China: Beijing, China, 2024. [Google Scholar]
  26. Li, G. Aboveground Biomass of Three Secondary Evergreen Forests at the Xiaokeng of Nanling Mountain, Southern China; Chinese Academy of Forestry: Beijing, China, 2011. [Google Scholar]
  27. Liu, J. Modeling Study of Generic Allometric Biomass Equations for Common Tree Species in China; Zhejiang Normal University: Jinhua, China, 2021. [Google Scholar]
  28. Liu, J.; Ni, J. Comparison of general allometric equations of biomass estimation for major tree species types in China. Quat. Sci. 2021, 41, 1169–1180. [Google Scholar]
  29. Ma, Y.; Zhang, X.; Jiang, R.; Jiang, M.; Ju, J. Effects of Stand Structural Characteristics, Diversity, and Stability on Carbon Storage Across Different Densities in Natural Forests: A Case Study in the Xiaolong Mountains, China. Forests 2025, 16, 71. [Google Scholar] [CrossRef]
  30. Ullah, F.; Gilani, H.; Sanaei, A.; Hussain, K.; Ali, A. Stand structure determines aboveground biomass across temperate forest types and species mixture along a local-scale elevational gradient. For. Ecol. Manag. 2021, 486, 118984. [Google Scholar] [CrossRef]
  31. Hui, G.; Hu, Y. Measuring Species Spatial Isolation in Mixed Forests. Sci. Silvae Sin. 2001, 14, 23–27. [Google Scholar]
  32. Luo, Y.; Chen, Q.; Zhang, P. The spatial pattern of coniferous forest in XinglongShan mountain and its strategies in using sun light energy. Acta Ecol. Sin. 1984, 4, 10–20. [Google Scholar]
  33. Lv, Y.; Zang, H.; Wan, X.; Deng, Z.; Li, J. Storey Structure Study of Cyclobalanopsis myrsinaefolia Mixed Stand Based on Storey Index. For. Grassl. Resour. Res. 2012, 3, 81–84. [Google Scholar] [CrossRef]
  34. Hui, G.; Gadow, K.V.; Albert, M. A New Parameter for Stand Spatial Structure Neighbourhood Comparison. Sci. Silvae Sin. 1999, 12, 4–9. [Google Scholar]
  35. Hui, G.; Hu, Y.; Zhao, Z.; Yuan, S.; Liu, W. A Forest Competition Index Based on Intersection Angle. Sci. Silvae Sin. 2013, 49, 68–73. [Google Scholar] [CrossRef]
  36. Hui, G. The neighbourhood pattern—A new structure parameter for describing distribution of forest tree position. Sci. Silvae Sin. 1999, 35, 37–42. [Google Scholar]
  37. Li, J.; Li, X.Y.; Cao, J.; Tan, L.Z.; Zhao, X.H. Community structure and dynamics of secondary coniferous and broad-leaved mixed forest in Changbai Mountains. Acta Ecol. Sin. 2020, 40, 1195–1206. [Google Scholar] [CrossRef]
  38. Singh, M.; Singh, M.P. Assessment of plant diversity indices of gomati riparian corridors in district Jaunpur, India. Ecoprint Int. J. Ecol. 2014, 20, 71–76. [Google Scholar] [CrossRef]
  39. Jung, S.; Park, J. Consistent partial least squares path modeling via regularization. Front. Psychol. 2018, 9, 174. [Google Scholar] [CrossRef] [PubMed]
  40. Liu, M. Spatial Structure Characteristics and Their Influence on Productivity of Typical Natural Forest in Lingkong Mountain, Shanxi Province; Beijing Forestry of University: Beijing, China, 2021. [Google Scholar]
  41. Zhao, M. Effect of Stand Density on Structure, Functions, and Community Stability of Robinia pseudoacacia Plantations; Northwest A&F University: Xi’an, China, 2024. [Google Scholar]
  42. Steege, H.T.; Pitman, N.C.A.; Amaral, I.L.d.; Coelho, L.d.S.; Matos, F.D.d.A.; Filho, D.d.A.L.; Salomão, R.P.; Wittmann, F.; Castilho, C.V. Mapping density, diversity and species-richness of the Amazon tree flora. Commun. Biol. 2023, 6, 1130. [Google Scholar] [CrossRef]
  43. Li, X.; Yang, Z.; He, H.; Qiu, Z.; Zhu, G. Study on the Influence of Stand Structure on Stand Growth of Oak Natural Forest in Hunan Province Based on Structural Equation Model. For. Grassl. Resour. Res. 2022, 4, 164–171. [Google Scholar] [CrossRef]
  44. Zhou, Y. Study on the Effect of Mixed Proportion on the Interspecific Relationship of Bamboo-Broadleaf Mixed Forest. Ph.D. Thesis, Chinese Academy of Forestry, Beijing, China, 2017. [Google Scholar]
  45. Li, R.; Werger, M.; De Kroon, H.; During, H.; Zhong, Z. Interactions between shoot age structure, nutrient availability and physiological integration in the giant bamboo Phyllostachys pubescens. Plant Biol. 2000, 2, 437–446. [Google Scholar] [CrossRef]
  46. Haonan, Z. Study on the Spatial Distribution Pattern and Competitive Relationship of Dominant Tree Species in Chishui Subtropical Forest. Ph.D. Thesis, Nanjing Forestry University, Nanjing, China, 2019. [Google Scholar]
  47. Gao, W.; Liang, M.; Xiang, W.; Fu, L.; Guo, H.; He, X.; Sharma, R.P.; Chen, Z.; Li, Y.; Zhou, M. Development stage-dependent effects of biodiversity on aboveground biomass of temperate forests. Ecography 2025, 2025, e07414. [Google Scholar] [CrossRef]
  48. Liu, J.; Yang, Q.P.; Song, Q.N.; Yu, D.K.; Yang, G.Y.; Qi, H.Y.; Shi, J.M. Strategy of fine root expansion of Phyllostachys pubescens population into evergreen broad- leaved forest. Chin. J. Plant Ecol. 2013, 37, 230–238. [Google Scholar] [CrossRef]
  49. Xiaoxia, Z. The impact of Phyllostachys Edulis Expansion on the Tree Growth, the Short-Term Effects After Bamboo Removal and Water Physiology Mechanisms. Ph.D. Thesis, Jiangxi Agricultural University, Nanchang, China, 2024. [Google Scholar]
  50. Shumao, R. Stand Structure and Carbon Storage Characteristics of Moso Bamboo in the Process of Expansion to Coniferous and Broad-Leaved Forest. Master’s Thesis, Zhejiang Agriculture and Forestry University, Hangzhou, China, 2022. [Google Scholar]
  51. Scurlock, J.M.; Dayton, D.C.; Hames, B. Bamboo: An overlooked biomass resource? Biomass Bioenergy 2000, 19, 229–244. [Google Scholar] [CrossRef]
  52. Song, X.; Peng, C.; Zhou, G.; Gu, H.; Li, Q.; Zhang, C. Dynamic allocation and transfer of non-structural carbohydrates, a possible mechanism for the explosive growth of Moso bamboo (Phyllostachys heterocycla). Sci. Rep. 2016, 6, 25908. [Google Scholar] [CrossRef]
  53. Zhou, G.; Jiang, P.; Xu, Q. Carbon fixing and transition in the ecosystem of bamboo stands. Bot. Rev. 2011, 77, 262–270. [Google Scholar] [CrossRef]
  54. Liese, W.; Weiner, G. Ageing of bamboo culms. A review. Wood Sci. Technol. 1996, 30, 77–89. [Google Scholar] [CrossRef]
  55. Ojha, S.K.; Dimov, L.D. Linking hypothesized causal factors to aboveground biomass growth in forests of Alabama and the eastern United States. For. Syst. 2017, 26, e016. [Google Scholar] [CrossRef]
  56. Chen, M.; Hui, G.; Hu, Y.; Zhang, G.; Zhang, G.; Liu, R.; Yang, A.; Zhao, Z.; Wang, H. Impacts of structure-based forest management on forest quality of broadleaved Korean pine forests in northeastern China. J. Beijing For. Univ. 2019, 41, 19–30. [Google Scholar] [CrossRef]
Figure 1. Geographic location of the study area in Yong’an City, Fujian Province, China.
Forests 16 00905 g001
Figure 2. This figure illustrates the plot division and basic structural unit used in regard to the four-neighbor method. In part (a), the grey area represents the core plot, while the yellow area denotes the buffer zone. The red points indicate trees within the core plot, which may serve as either reference or adjacent trees, while the black points represent trees in the buffer zone, serving only as adjacent trees. Part (b) shows a basic structural unit centered on a reference tree (i) in red, with the four adjacent trees shown in grey.
Forests 16 00905 g002
Figure 6. The figure illustrates Spearman’s correlation matrix among various forest stand metrics. The colors range from teal green (negative correlation) to dark red (positive correlation), representing correlation coefficients from −1 to 1. Asterisks (*) denote statistical significance levels: * p < 0.05; ** p < 0.01; *** p < 0.001.
Forests 16 00905 g006
Figure 7. The figure shows the significance scores for stand structures according to stand AGB in mixed moso bamboo forests, with significance levels indicated as follows: pink, ** p < 0.01; green, * p < 0.05; and grey indicates no significant relationship at these levels.
Forests 16 00905 g007
Figure 8. Conceptual model of PLS-PM of stand structures and stand AGB in mixed moso bamboo forests. Density represents stand density, diversity represents stand tree diversity, mean_H represents stand mean tree height, K represents stand openness, and CV_DHB represents stand tree size variation.
Forests 16 00905 g008
Figure 9. Fitting results from the structural equation model between stand structures and stand AGB in mixed moso bamboo forests. Values on the paths denote path-standardized coefficients (* p < 0.05; ** p < 0.01; *** p < 0.001), and R2 values indicate the proportion of variance explained in regard to the response variables. Red indicates a positive effect, green indicates a negative effect, and the line width is proportional to the magnitude of the standardized coefficient, with the solid line indicating a significant level and the dotted line indicating a non-significant level.
Forests 16 00905 g009
Figure 3. The figure illustrates the distribution of stand AGB in mixed moso bamboo forests, with the colors ranging from yellow to purple indicating low to high biomass values.
Forests 16 00905 g003
Figure 4. The figure illustrates the distribution of spatial structures in mixed moso bamboo forests, with the colors ranging from yellow to purple indicating a change in value from low to high: (a) represents stand mingling index (M), (b) represents stand openness (K), (c) represents stand layer index (S), (d) represents stand size ratio (U), (e) represents stand competition index based on intersection angle (UCI), and (f) represents stand uniform angle index (W).
Forests 16 00905 g004
Figure 5. The figure illustrates the distribution of non-spatial structures in mixed moso bamboo forests, with the colors ranging from yellow to purple indicating a change in value from low to high: (a) represents stand density (N), (b) represents stand mean tree height (mean_H), (c) represents stand tree size variation (CV_DHB), (d) represents stand moso bamboo mixing ratio (MR), (e) represents Shannon’s index, and (f) represents Simpson’s index.
Forests 16 00905 g005
Table 1. Models for AGB of individual trees by species type.
SpeciesModels for AGB of Individual Tree
Phyllostachys edulis [20] W i = 386.4951 × D B H i 1.657   9
Castanopsis carlesii [21] ln ( W i ) = 1.982 + 1.209 × ln ( D B H i 2 )
Castanopsis hystrix [22] lg ( W i ) = 1.035 + 2.547 × lg ( D B H i )
Castanopsis eyre [23] W i = 0.030   38 × ( D B H i 2 H ) 1.023   31
Schima superba [24] W i = 0.062   7 × D B H i 2.680   5
Cunninghamia lanceolate [25] W i = 0.043   63 × D B H i 2.545   89
Triadica cochinchinensis [26] W i = 0.108 × D B H i 2.392
Broad-leaved evergreen species [27] W i = 0.132 × D B H i 2.364
Broad-leaved deciduous species [28] W i = 0.851   1 × D B H i 1.751   6
Coniferous species [27] W i = 0.117   1 × D B H i 2.348   3
Table 2. Formulas for calculating stand structure indicators.
Index TypesStand IndexesFormulas and Description
Spatial structure indicatorsStand mingling index [31] M = 1 4 N i = 1 N j = 1 4 v i j
where vij = 1 if the reference tree i (RTi) is of the same species as the adjacent tree j (ATi), otherwise vij = 0. N is the number of all the reference trees in the stand.
Stand openness [32] K = 1 4 N i = 1 N j = 1 4 D i j H i j
where Dij is the horizontal distance between RTi and ATj, amd Hij is the height of ATj.
Stand layer index [33] S = z i 3 × 4 N i = 1 N j = 1 4 s i j
where zi is the number of forest layers in the spatial structure unit where RTi is located, sij = 1 when RTi and ATj do not belong to the same forest layer, otherwise sij = 0.
Stand size ratio [34] U = 1 4 N i = 1 N j = 1 4 k i j
where kij is the result of the DBH size comparison between RTi and ATj, kij = 0 when the DBH of RTi is larger than that of ATj, otherwise kij = 1.
Stand competition index based on intersection angle [35] U C I = U i 180 ° × 4 N i = 1 N j = 1 4 α 1 + α 2
When the height of ATj, Hj, is greater than the height of RTi, α1 = arctan(Hi/dij) × 180°/π and α2 = arctan((HjHi)/dij) × 180°/π, otherwise α1 = arctan(Hj/dij) × 180°/π and α2 = 0.
Stand uniform angle index [36] W = 1 4 N i = 1 N j = 1 4 t i j
If the jth α angle is smaller than the standard angle α0 (72°), tij = 1, otherwise tij = 0.
Spatial structure indicatorsStand density where A is the area of the stand, and n is the number of all the trees in the stand.
Stand tree size variation [37] C V = σ μ × 100 %
where σ is the standard deviation of stand DBH, and μ is the mean DBH of the stand.
Stand mean tree height M e a n _ H = 1 n i = 1 n H i
where Hi is the height of the tree i in the stand, and n is the number of all the trees in the stand.
Stand bamboo mixing ratio M R = B _ B A T _ B A + B _ B A
where B_BA is the sum of the breast height break area of moso bamboo in the forest stand, and T_BA is the sum of the breast height break area of the other trees in the stand.
Shannon’s index [38] H = i = 1 s p i ln p i
where pi is the relative frequency of the tree i species in the stand, and s is the total number of tree species in the stand.
Simpson’s index [38] D = 1 i = 1 s p i 2
where pi is the relative frequency of the tree i species in the stand, and s is the total number of tree species in the stand.
Table 3. Statistics on the basic characteristics of AGB and stand structure indicators.
Index TypesStand IndexesMeanSEMedianMinMaxSDCV (%)
AGBAGB (t/ha)131.2106.683119.01529.334428.29269.45352.93
Spatial structure indicatorsM0.3650.0280.3160.0000.8820.28678.57
K0.1660.0070.1440.0640.3930.06840.95
S0.2830.0090.2800.0440.5330.09232.351
U0.5040.0030.5070.3950.5940.0275.342
UCI0.3150.0030.3160.2280.3800.0309.645
W0.5510.0040.5490.4640.6910.0437.82
Non-spatial structure indicatorsN (stems/ha)2188144.095190067591501497.48468.44
CV_DBH0.5550.0180.6060.1610.9140.18232.78
Mean_H (m)11.4360.15211.4858.42014.7781.57813.80
MR0.3650.0340.2680.0001.0000.35095.84
Shannon 1.1740.0871.1170.0002.6720.90076.65
Simpson 0.4730.0340.4910.0000.9210.34873.66
Table 4. Multiple linear regression models of log-transformed stand AGB in mixed moso bamboo forests.
VariablesUnstandardized
Coefs
Beta Coefsp ValueAdj_R2RMSE
Intercept1.288-0.0100.6560.312
M1.3230.692<0.001
K−2.280−0.2830.011
N0.00010.367<0.001
CV_DBH2.2900.762<0.001
mean_H0.1560.449<0.001
Table 5. Direct, indirect, and total effects of stand structure on aboveground biomass in mixed moso bamboo forests.
VariablesDirect ImpactIndirect ImpactTotal Impact
Stand density0.355−0.588−0.233
Tree diversity0.874−0.4610.413
Stand mean tree height0.6520.1240.776
Stand openness−0.2820.025−0.258
Stand tree size variation0.61500.615
Disclaimer/Publisher’s Note: The statements, opinions and data contained in all publications are solely those of the individual author(s) and contributor(s) and not of MDPI and/or the editor(s). MDPI and/or the editor(s) disclaim responsibility for any injury to people or property resulting from any ideas, methods, instructions or products referred to in the content.

