Article

Comparison of Canopy–Vegetation Parameters from Interior Parts to Edge of Multi-Story Grove Forest Patch and Meadow Field Within Rural Landscape for Soil Temperature and Moisture

1
Division of Landscape Techniques, Department of Landscape Architecture, Faculty of Engineering, Architecture and Design, Bartın University, Room No: 314, Ağdacı Campus, 74110 Bartın, Türkiye
2
Division of Soil Science and Ecology, Department of Forest Engineering, Faculty of Forestry, Bartın University, 74110 Bartın, Türkiye
3
Division of Watershed Management, Department of Forest Engineering, Faculty of Forestry, Bartın University, 74110 Bartın, Türkiye
*
Author to whom correspondence should be addressed.
Forests 2025, 16(6), 904; https://doi.org/10.3390/f16060904
Submission received: 18 March 2025 / Revised: 14 May 2025 / Accepted: 23 May 2025 / Published: 28 May 2025
(This article belongs to the Section Forest Soil)

Abstract

:
Soil temperature and soil moisture are significant interactive parameters that influence many ecological and hydrological processes within forest ecosystems. Furthermore, they are affected by the above canopy characteristics, which determine the amount of sunlight penetration. These canopy characteristics spatially vary within isolated or narrowed forest patches, which include interior parts and edges. On the other hand, forest patches display different effects on the soil temperature and moisture than agricultural meadows within rural landscapes. This study aimed to analyze and evaluate the influences of interior–edge canopies and meadow cover on soil temperature and moisture. Hence, the mutual responses of canopy phenology and physiology, along with the soil temperature and moisture beneath, were analyzed and determined on a temporal basis throughout one year. For this purpose, the air–soil temperature and precipitation data of close meteorological stations were utilized. In addition, soil temperature and moisture parameters were analyzed using an on-site measuring device. Furthermore, canopy parameters—namely LAI, LT, CO, and GF—were determined using a hemispherical photographing procedure and image processing–analysis methodology. Moreover, the LAI of the meadow cover was determined using an on-site analysis device. The maximum LAI, with mean values of 3.69 m2 m−2 and 2.54 m2 m−2, occurred in late May (DOY: 142) within the forest canopies of the interior parts and the patch edge, respectively. On the other hand, the maximum LAI with a mean value of 2.77 m2 m−2 occurred again in late May within the meadow field. On the contrary, during the same period, the lowest percentages were observed for LT and CO, each at 5%, and for GF with 0.5% within the interior parts of the forest patch. However, their lowest percentages were 23% and 16%, respectively, within the forest patch edge. For that late May period, the mean soil temperatures were 17.2, 26.0, and 21.0 °C under the forest canopies of the interior parts, the patch edge, and the meadow field, respectively. Meanwhile, their mean soil moistures were 56.4%, 51.6%, and 32.9% when the mean air temperature was 16.2 °C. Definite correlation did not exist between the canopy–vegetation parameters and the soil temperature–moisture values for all the interior parts, for the edge of the multi-story grove forest patch, and for the meadow field. Based on the overall results of this study, there were apparent differences amongst the interior parts, the edge of the forest patch, and the meadow field in terms of both the canopy–vegetation parameters and the soil temperature–moisture values. The multi-story structure of the interior parts and the edge of the forest patch determined the temporal patterns of their canopy–vegetation parameters. This study elucidated ecology, hydrology, and therefore management of narrow forest patches between agricultural areas within rural landscapes.

1. Introduction

Soil moisture is significant in terms of not only surface–subsurface hydrology but also the ecology of forests. Soil moisture is a key factor for seed germination [1], soil microbial activity [2], the movement and uptake of nutrients [3], root and stem growth [4], the decay and decomposition of forest litters [5], and the regeneration and health of forests [6]. Soil temperature and rainfall are two main meteorological parameters that influence the moisture of forest soil [7]. Associated directly with air temperature, soil temperature affects the amount of actual evaporation from soil moisture, which is replenished by rainfall [8]. Hence, these two closely interacting soil parameters—namely temperature and moisture—significantly influence forest ecology and hydrology. They drive, regulate, and determine the succession, growth, and development processes within forest ecosystems [9]. On the other hand, the structure and physiology of both the overstory and understory canopies of forests define the percentage of sunlight transmitted through their gaps and reaching the soil beneath them [10]. Thus, the openness and closure of these canopies play a crucial role in warming or cooling the soil beneath. Accordingly, they determine the preservation or loss of soil moisture by evaporation within forested landscapes [11]. Therefore, monitoring and analyzing soil moisture and temperature, together with canopy phenology and the physiology of forests, support effective ecological and hydrological management.
Forest patches frequently occur due to the gradual shrinkage of forest ecosystems that have been exposed to the urban or agricultural sprawl. They mostly emerge in the form of isolated remnants, fragmented habitats, and narrowed corridors within rural landscapes [12]. The forest patches surrounded by agricultural areas have a specific ecosystem structure that is distinct from completely forested lands. Eventually, they possess edges adjacent to farms, gardens, and meadows [13]. Thus, the edges of these forest patches have different characteristics compared to their interior parts. Differences in soil temperature, moisture, and organic carbon are some of their distinct characteristics compared to the interior parts [14]. Moreover, the temperature and moisture values of forest patch edges are also different from those within meadows. Canopy openness and closure are definitive of the differentiation of those temperature and moisture values between the interior parts and the edges of forest patches. Also, the ground coverage of meadows influences their soil temperature and moisture. As such, periodic comparisons across the interior parts and edges of forest patches and meadows are necessary to monitor changes in their soil temperature and moisture. In addition, analyzing their canopy and ground-coverage parameters not only elucidates the ecosystem structure of these fragile forest patches but also reveals the overall ecology of the rural landscape [15].
Although certain methods for analyzing soil temperature and moisture parameters under the forest canopies have been described within the scientific literature, the canopy parameters that thoroughly indicate their openness and closure are still relatively limited. Also, the current methods for analyzing these canopy parameters vary considerably. Among these limited parameters, leaf area index (LAI), light transmission (LT), gap fraction (GF), and canopy openness (CO) are the most prominent, collectively determining canopy openness, closure, and coverage concerning forest and meadow grounds. LAI (m2 m−2) is a canopy parameter that indicates a one-sided area of the overall leaves of a canopy over its projection area. LAI defines many major ecological and hydrological processes within forests, emphasizing its role in forest management proposals [16]. LT is the amount of light that penetrates through a canopy [17]; it is directly associated with the percentage of CO. GF is the proportion of openness over the projection of that canopy [18,19]. Consequently, analyzing these canopy parameters on a temporal basis over one year, using the temperature and moisture data of the soil beneath will help to determine the mutual responses of the canopy phenology and physiology, along with the soil temperature and moisture beneath. Moreover, on a spatial basis, analyzing them will enable us to investigate their mutual responses within both the interior parts and edges of forest patches, as well as within meadow fields.
In this study, the temporal and spatial patterns of these two significant soil parameters—namely temperature and moisture—are monitored and analyzed within a rural landscape, primarily composed of a deciduous forest patch and a meadow field. The forest patch is narrowed by the meadow field and comprises an edge and interior parts. Thus, the main purpose of this study is to draw a comparison, particularly between the interior parts and the edge of the multi-story grove forest patch, in terms of the aforementioned canopy parameters. For this purpose, sample canopy points are defined, together with the soil temperature and moisture values beneath these canopy points. Nevertheless, comparing the LAI values of these canopy points with those of the meadow field in terms of their soil temperature and moisture values, constitutes another purpose of this study. Hence, the scope of this study covers the temporal–spatial monitoring and analyses of canopy–vegetation parameters and evaluates them in relation to soil temperature and moisture. This will contribute to a deeper understanding of their roles in the ecosystem structures of the forest patch and meadow field within the overall rural landscape. It will also shed light on climatology and hydrology of the forest patch, which has been proposed to be managed for climate conservation by the Regional Forestry Administration [20].

2. Materials and Methodology

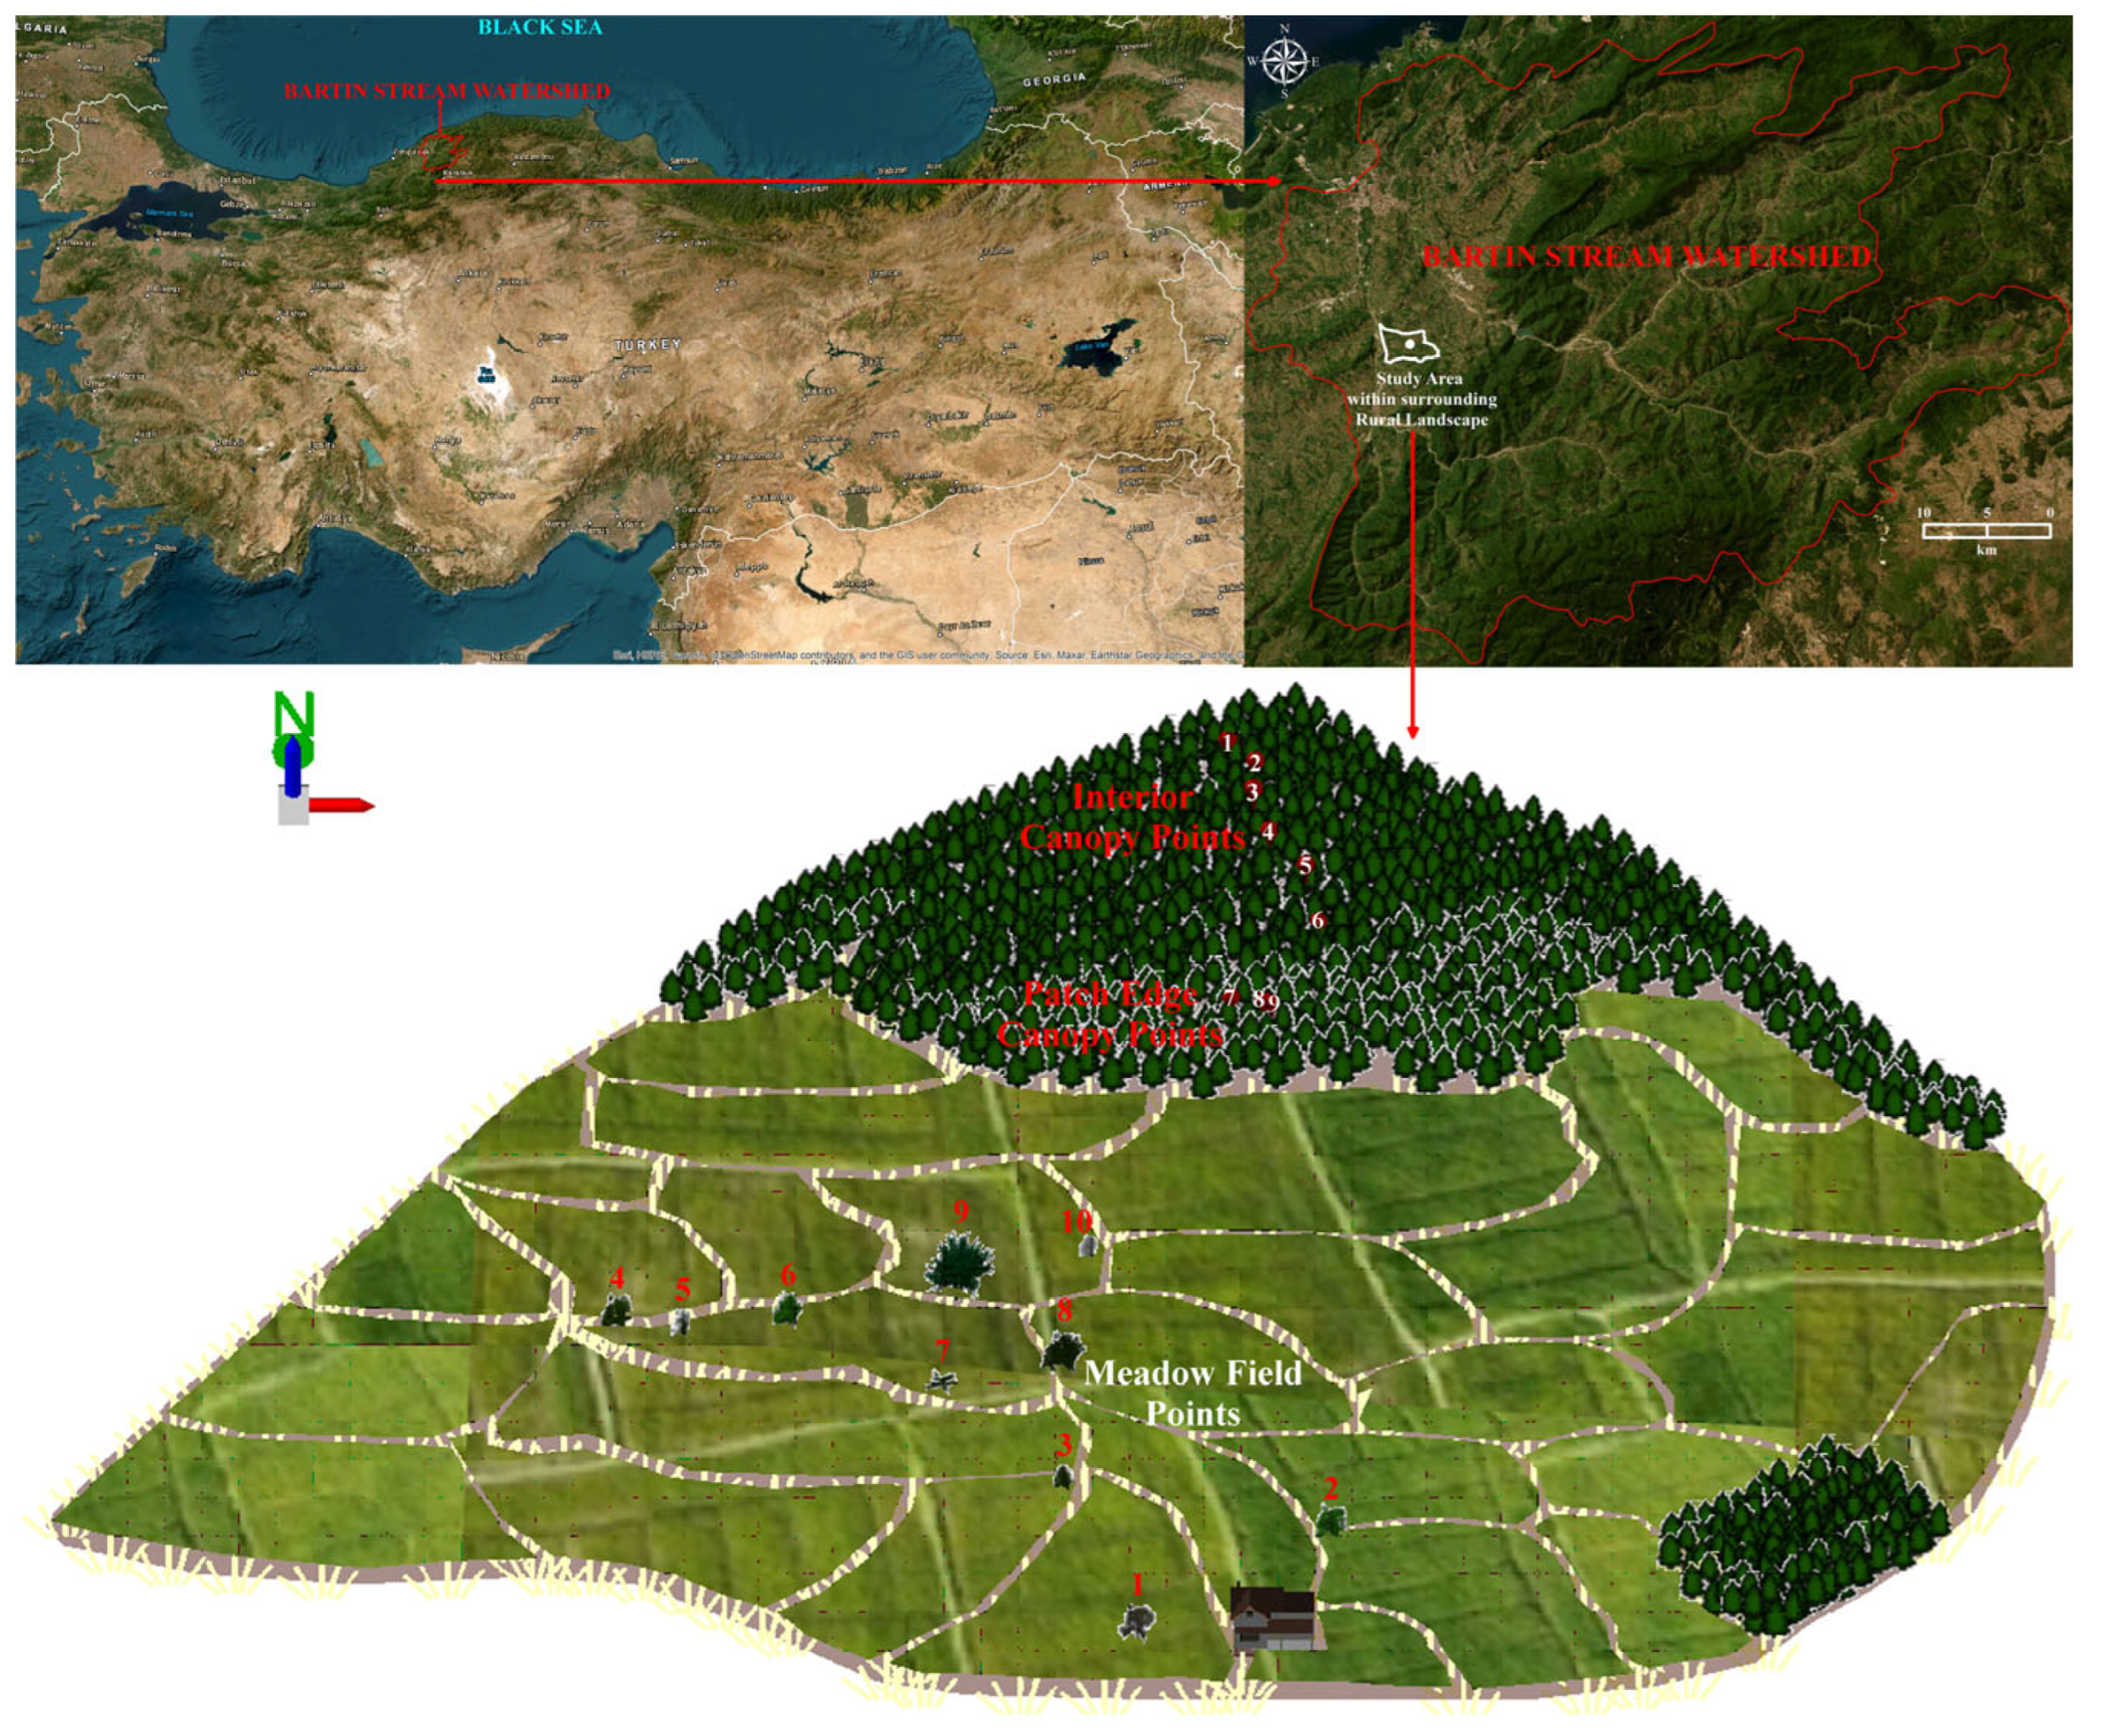
2.1. Location, Topography, Parent Material, Soil, and Climate

The overall study area covers approximately 1.6 ha, with a 497 m perimeter. It is located between the 41°31′26″ and 41°31′31″ northern latitudes and the 32°22′18″ and 32°22′25″ eastern longitudes, within the rural landscape of the Bartın Stream Watershed in the Western Black Sea Region of Türkiye, as shown in Figure 1. The average altitude of the study area is about 90 m asl., typically ranging between 85 and 100 m asl. The slope is approximately 8°, and the study area is towards the northeast (Figure 1). The whole study field is dominated by limeless brown forest soils, ultisols [21], with a clayey, deep (>1 m) profile, which may be suitable for agriculture if the slope and heavy-textured soil characteristics are overcome. These limeless brown forest soils, ultisols, have formed on Eocene-origin sandstone–mudstone geological formations [22]. According to in situ soil measurements, the average soil salinity are 183 μS cm−1 and 190 μS cm−1 for the forest patch and meadow field, respectively, indicating almost non-salinity for both [23].
According to the long-term data of the Bartın meteorological station, which is about 11 km away from the study area, the average annual total precipitation is 1080 mm [24]. The wettest month is December, with an average total precipitation of 132 mm, whereas August is the driest month, with an average total precipitation of only 54 mm [24]. The average annual air and soil temperatures are 14.6 °C and 15.6 °C, respectively. The hottest and coldest months are August and January, with average air–soil temperatures of 23.5–25.6 °C and 4.8–5.0 °C, respectively [24]. Therefore, the region falls into the humid mesothermal climate regime [25]. Moreover, dominant winds blow from the Black Sea in the northeastern and northwestern directions of the region [24].
There is no immediate meteorological station within the study area to measure and compare soil temperature values. The nearest meteorological station in Kozcağız (4 km away) can only measure air temperature. Therefore, soil temperature data from the Bartın meteorological station (11 km away) are used. According to correlation analyses between these two meteorological stations—Kozcağız and Bartın—based on their air temperature data, a significantly high correlation (r = 0.99; p < 0.001) was determined. Based on this consistency, the air temperature data of the nearest one are used.

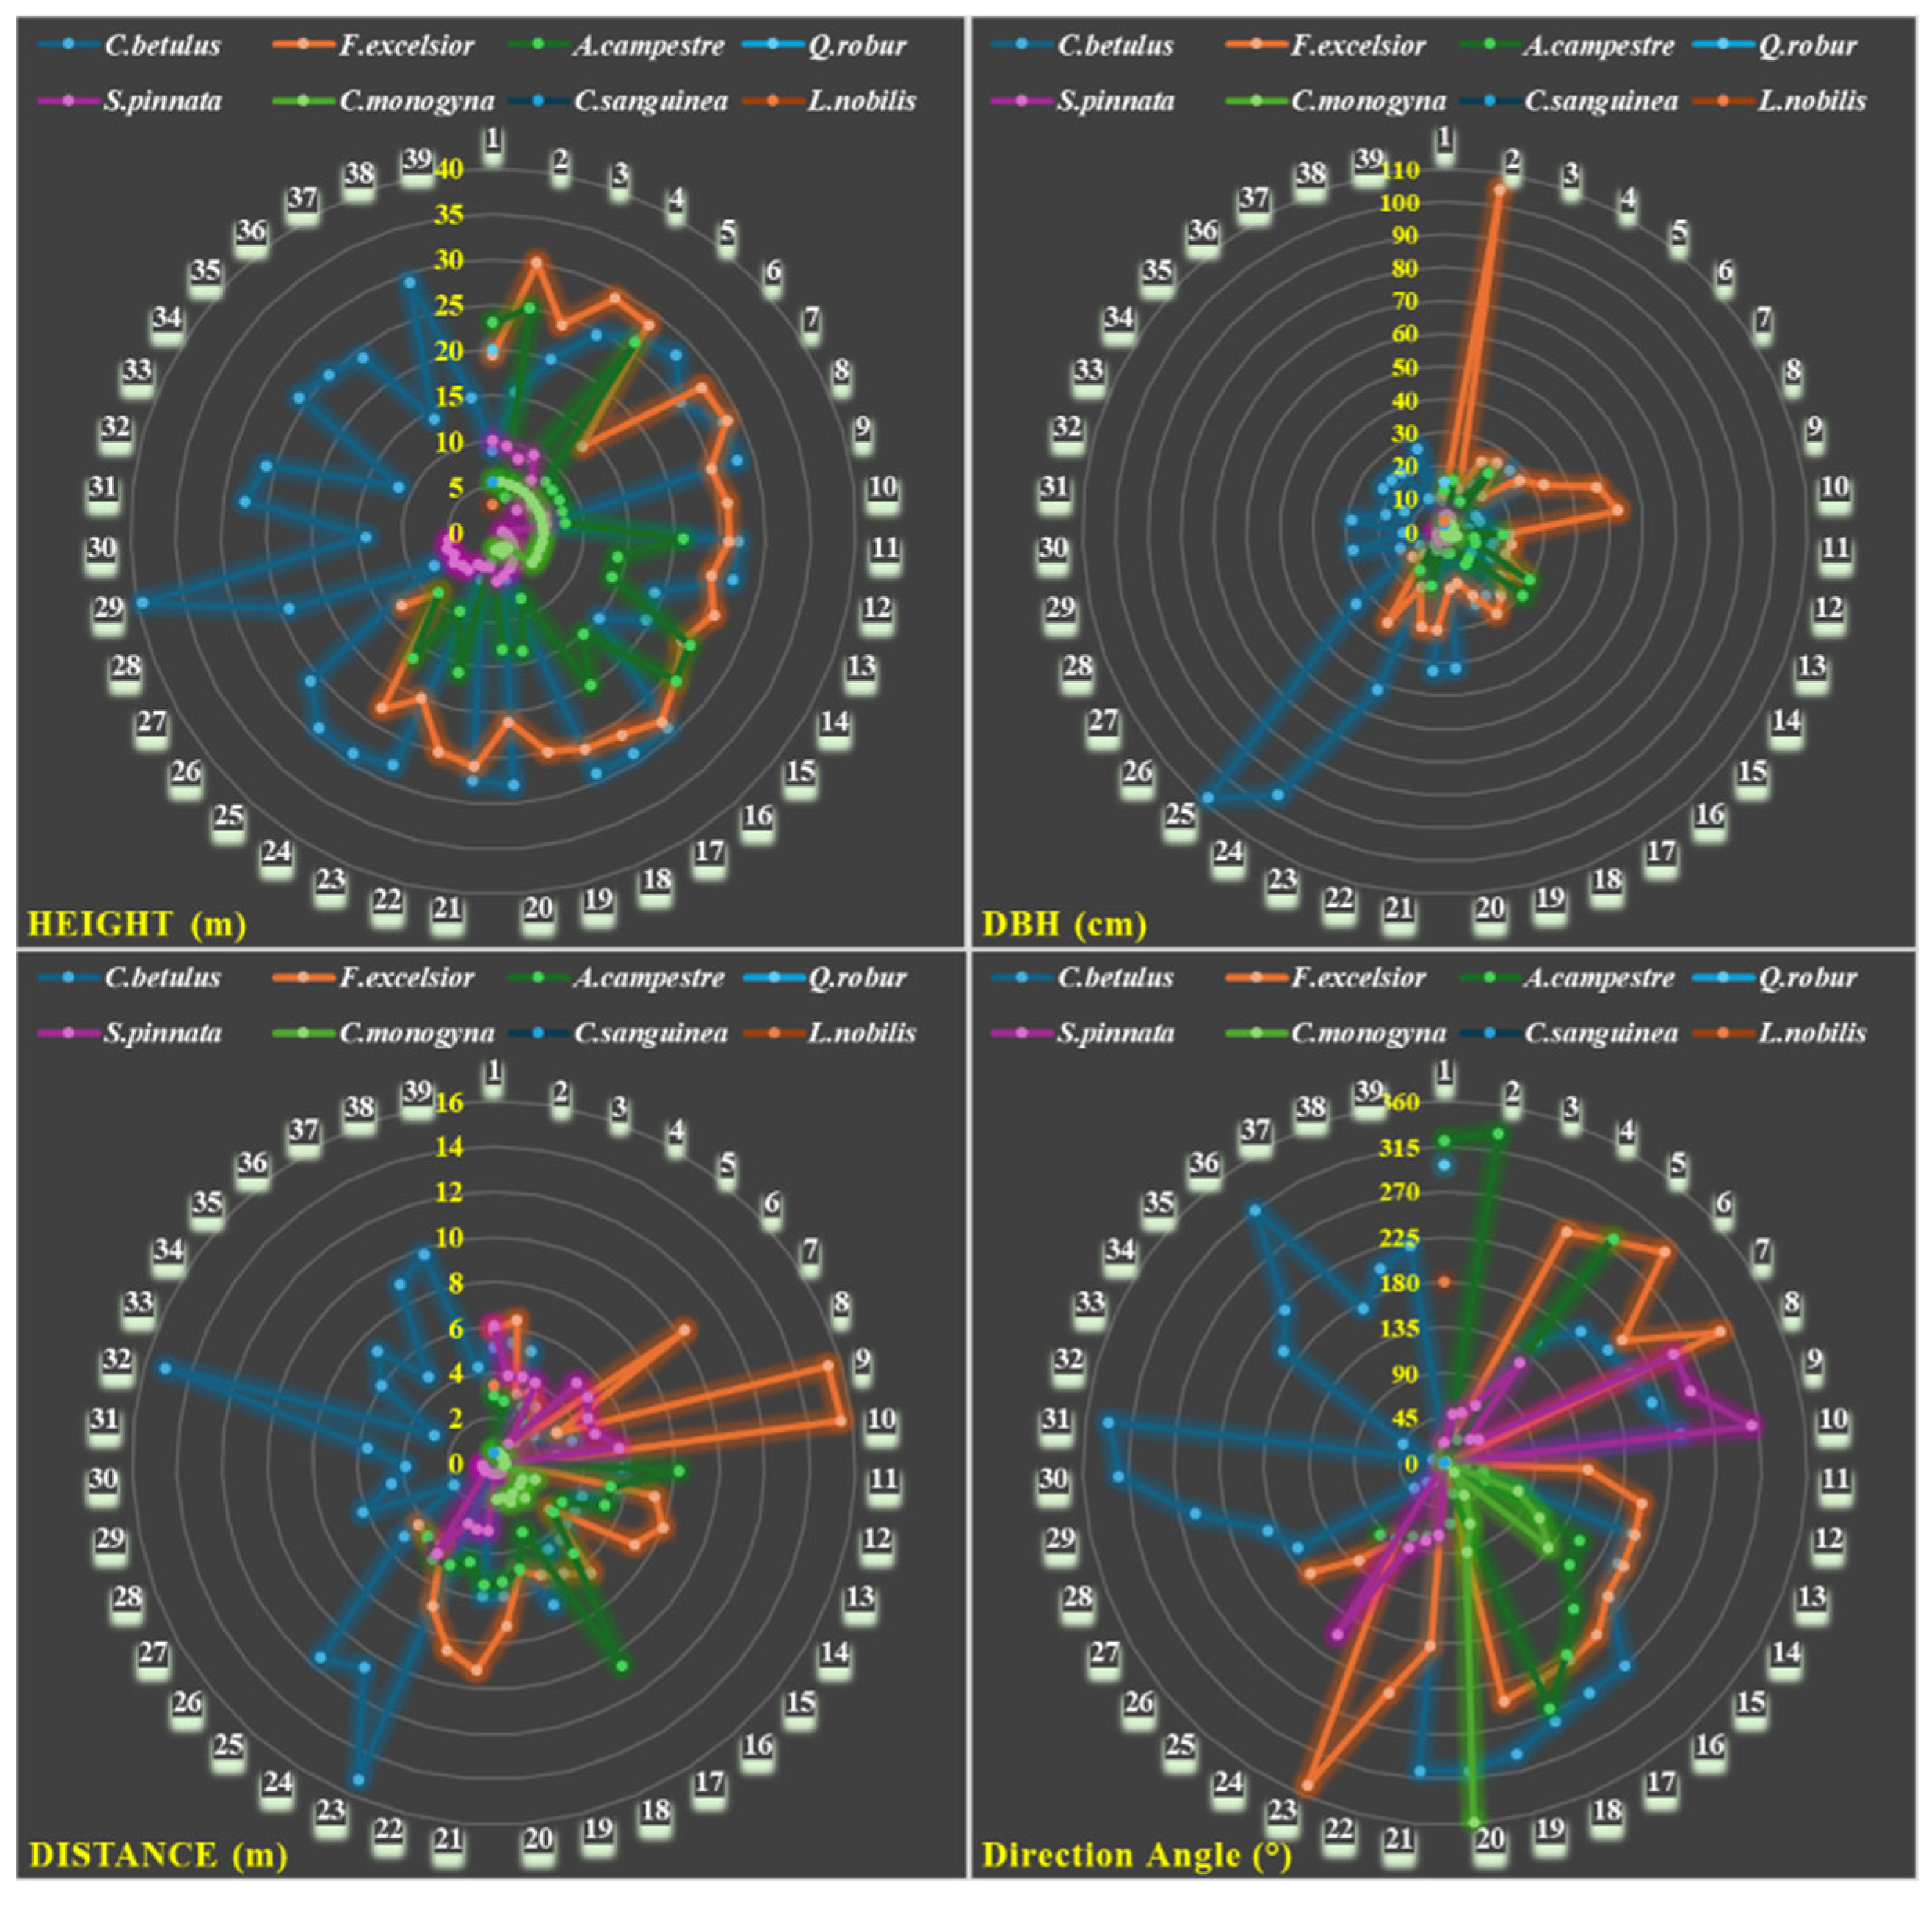
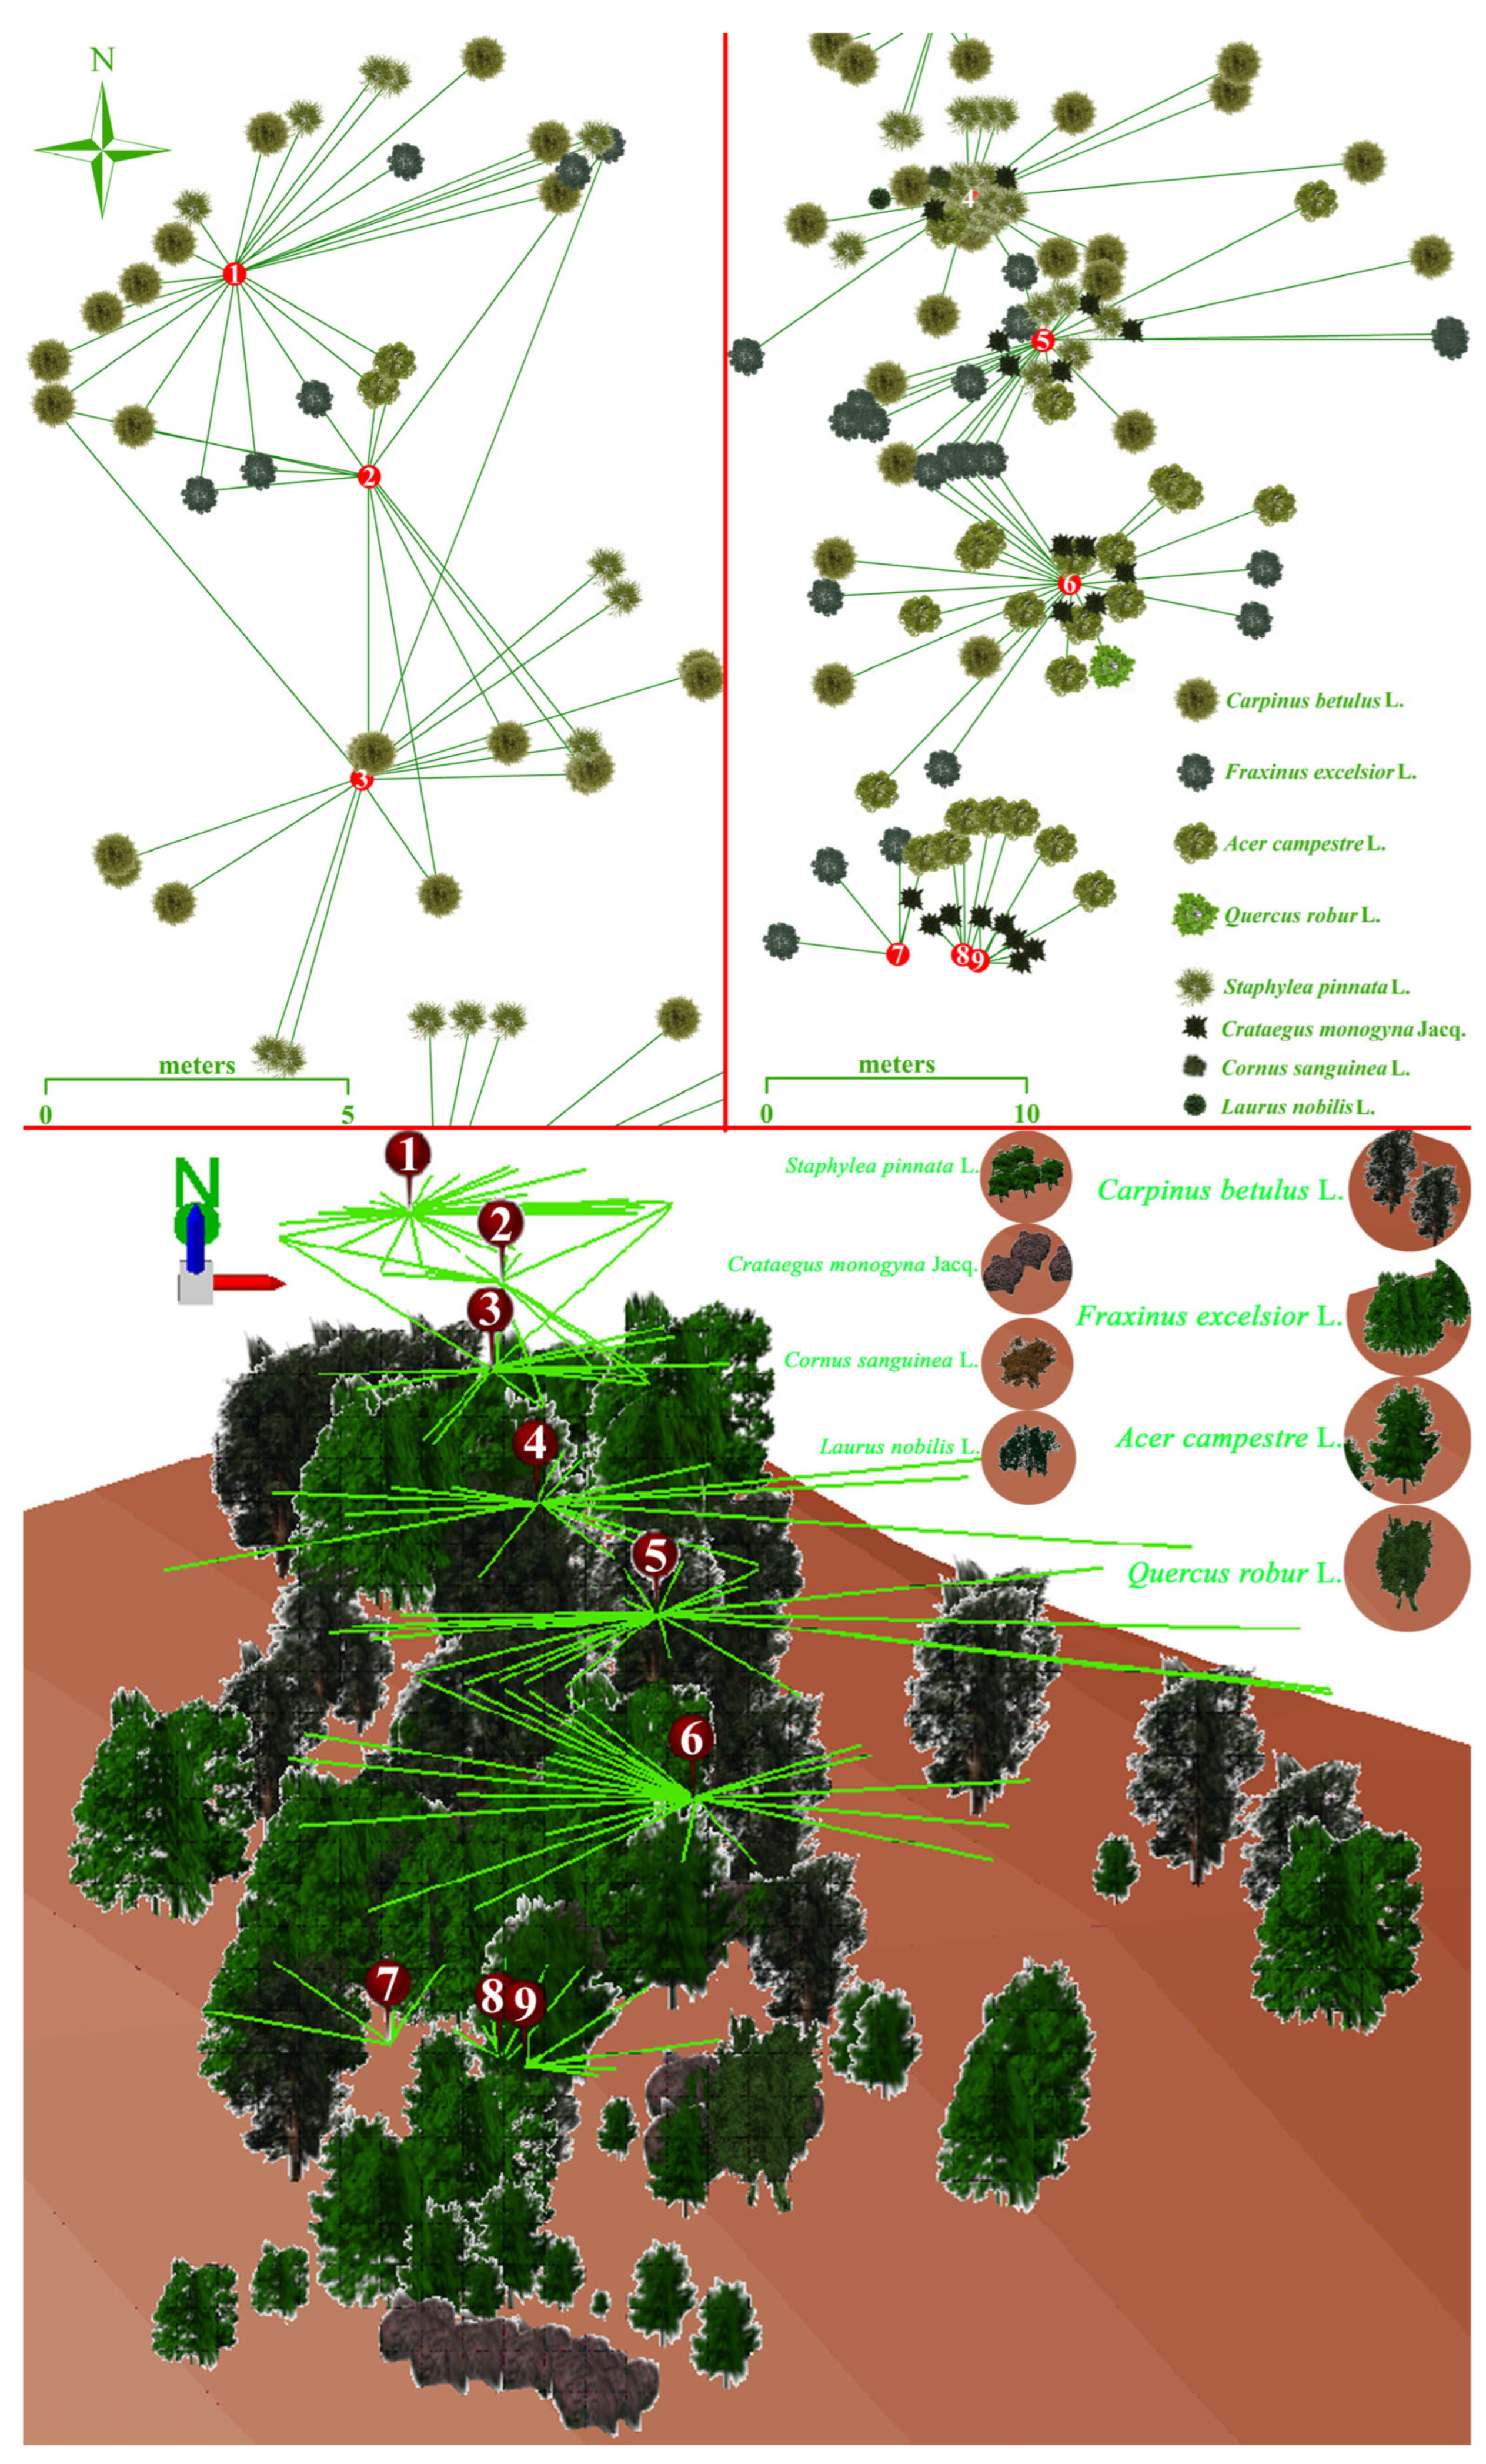
2.2. Forest Patch and Meadow Field

The forest patch, which constitutes approximately 1/5 (0.32 ha) of the overall study area, is largely composed of deciduous tree and shrub species under grove management [20]. These species are stated within Figure 2, along with their basic physiological characteristics (height and DBH) and their distances with direction angles from their associated canopy points. According to the management plan by the Regional Forestry Administration for this study, this forest patch has been proposed to be managed for climate conservation [20]. The botanical composition of the forest patch within the study area consists almost entirely of deciduous trees and shrubs. These deciduous trees include Carpinus betulus L. (European hornbeam), with an average height and DBH of 22 m and 23 cm, Fraxinus excelsior L. (common ash; avg. 24 m H and 27 cm DBH), Acer campestre L. (field maple; avg. 14 m H and 10 cm DBH), and Quercus robur L. (pedunculate oak; avg. 20 m H and 15 cm DBH), with respect to their prevalence within the forest patch (Figure 2). In addition, the shrubs include Staphylea pinnata L. (European bladdernut; avg. 5.0 m H and 2.6 cm DBH), Crataegus monogyna Jacq. (common hawthorn; avg. 4.8 m H and 2.3 cm DBH), Cornus sanguinea L. (bloody dogwood; avg. 5.5 m H and 2.0 cm DBH), and Laurus nobilis L. (bay laurel; avg. 3.0 m H and 3.0 cm DBH), respectively (Figure 2). Thus, for both the overstory trees and the understory tree–shrub saplings, there are no evergreen species except for bay laurel within the forest patch. During the selection of canopy points within the interior parts and the edge of the forest patch, the ones that best represent its multi-story structure are chosen. However, alternative points of the canopies with the same multi-story structure are more numerous within the interior parts than within the patch edge (Figure 1). Therefore, the forest patch involves six canopy points (1 to 6) within its interior parts and three canopy points (7 to 9) within its edge (Figure 1). They were determined to monitor the above-canopy parameters and analyze the soil temperature and moisture beneath (Figure 1).
The meadow field constitutes approximately 4/5 (1.28 ha) of the overall study area. It is mostly covered with herbaceous vegetation during a short period in spring, which is eventually cut down for cattle feed. When selecting analysis points within the meadow field, those with variable herbaceous vegetation compositions, along with a solitary tree or shrub sapling on top, were chosen (Figure 1). Hence, 10 different points were determined within the meadow field for the analyses of a vegetation parameter, LAI, and the measurement of soil temperature and moisture beneath the herbaceous vegetation. This meadow field is composed of herbaceous Vicia sativa L. (common vetch), Medicago sativa L. (alfalfa), Taraxacum officinale (common dandelion), and Dactylis glomerata L. (orchard grass), with respect to their prevalence (Figure 1). However, the solitary trees and shrub saplings stand over the various herbaceous vegetation areas within the meadow field include Diospyros kaki L. (oriental persimmon; avg. 2.2 m H and 2.3 cm DBH), Fraxinus excelsior L. (common ash; avg. 7.5 m H and 8.0 cm DBH), Juglans regia L. (common walnut; avg. 2.2 m H and 2.5 cm DBH), Ficus carica L. (common fig; avg. 4.0 m H and 3.5 cm DBH), Cydonia oblonga Miller (quince; avg. 3.8 m H and 8.0 cm DBH), Malus domestica Borkh. (apple tree; avg. 3.7 m H and 7.5 cm DBH), Corylus avellana L. (common hazel; avg. 1.5 m H and 1.0 cm DBH), Prunus domestica L. (plum tree; avg. 3.8 m H and 7.0 cm DBH), Morus alba L. (mulberry tree; avg. 5.9 m H and 7.8 cm DBH), and Pyrus communis L. (common pear; avg. 2.8 m H and 3.5 cm DBH) (Figure 1).

2.3. LAI, LT, CO, GF, Physiology, and Soil Temperature and Moisture Analyses

In addition to remote sensing technologies [26] and an automated hemispherical scanning methodology [27], hemispherical photographing procedure is another preferred indirect methodology for the monitoring and analysis of LAI [28]. The canopy parameters, LAI, LT, CO, and GF, were temporally monitored by frequently capturing hemispherical photographs beneath the canopies, at six points within the interior parts and at three points within the edge of the forest patch, as shown in Figure 3. During the nine field visits—11 November 2023 (except for the forest patch edge); 13 March 2024; 4, 24, and 30 April 2024; 10 and 21 May 2024; 29 July 2024; and 7 October 2024—a total of 78 hemispherical photographs were taken. They were captured using a fisheye (8 mm) objective (Sigma F3.5 EX DG Circular Fisheye-Sigma Corporation, Aizu, Japan) mounted on a digital camera (Canon EOS 5D SLR-Canon Inc., Tokyo, Japan). These 78 hemispherical photographs were analyzed to obtain the canopy parameters of interest using an image processing technique performed with Hemisfer Version 3.3 (Swiss Federal Institute for Forest, Snow and Landscape Research [29]). During the analysis of these parameters, the methodology described by the authors of [30] was used for automatic thresholding, whereas an integrated methodology—incorporating the ones described by [29,31]—was employed for the correction procedure. To ensure compatibility with the LAI analyses for the meadow field, the LAI-2000 methodology was necessarily chosen for the analysis of LAI in the forest patch. Given the short growth period for the herbaceous vegetation within the meadow field, the analysis period for the LAI and soil temperature and moisture was correspondingly short, including only 24 and 30 April 2024, and 10 and 21 May 2024. In situ LAI values were acquired using an LAI-2200C Plant Canopy Analyzer Instrument (LI-COR Biosciences Inc., Lincoln, NE, USA), which enables its optical sensor to penetrate under the herbaceous vegetation.
Basic physiology parameters—height and DBH of trees and shrubs—within the coverage area around the canopy points of the interior parts and the edge of the forest patch were measured using a Blume-Leiss ALTIMeter Model BL6 (Carl Leiss Slope and Tree Height Measuring Device, Berlin, Germany) and a tree caliper, respectively. Additionally, these height and DBH measurements were also performed for the tree and shrub saplings within the meadow field. Eight field visits were conducted for the analysis of soil temperature and moisture beneath all the canopies within the interior parts and the edge of the forest patch. These eight field visits took place on 24 and 30 April 2024; 10 and 21 May 2024; 29 July 2024; 24 September 2024; and 7 and 26 October 2024. During these eight field visits, the actual soil temperature (°C) and soil moisture (%), as well as the soil electrical conductivity (μS cm−1), were measured using the WET-2 Sensor in situ device (DELTA-T Devices Ltd., Cambridge, UK). Furthermore, all the necessary correlation analyses and significance tests were performed (i.e., Pearson correlation) using version 22.0 of the SPSS software (SPSS Inc., Chicago, IL, USA) [32].

3. Results

3.1. Correlation of Referred and Measured Meteorological Data

To test for temperature consistency between the two meteorological stations close to the study site, Pearson correlation analysis was conducted using their air temperature data over a one-year period—between 1 November 2023 and 31 October 2024. Based on this comparison of the air temperature data from the Kozcağız and Bartın meteorological stations, there was a high and significant correlation (r = 0.99; p < 0.001) between them. Their almost completely overlapping mean annual temperatures were 15.2 °C and 15.4 °C, respectively. A correlation analysis was also conducted between the annual air and soil (−10 cm) temperature data from the latter meteorological station for the relevant period. Again, a high and significant correlation (r = 0.96; p < 0.001) was identified. The difference between their means was only 0.7 °C, and the mean annual soil (−10 cm) temperature was 16.1 °C for the relevant period. It can be deduced that the air temperature data from the closest meteorological station and the soil temperature data from the more distant latter station—which solely measured them—can be referenced in the evaluation of the overall results of this study (Figure 4). On the other hand, the correlation between the referenced data from the meteorological station and the measured soil temperature data was also high and significant (r = 0.96; p < 0.001) for the period between late April and late October (DOYs: 115 to 300) (Figure 4). Furthermore, there was high and significant correlation (r = 0.87; p < 0.001) between the former and latter meteorological stations based on the annual precipitation data collected over the relevant one-year period. The total annual precipitation was 1059 mm for the relevant period, according to the closest meteorological station, which was subsequently used within this study (Figure 4).

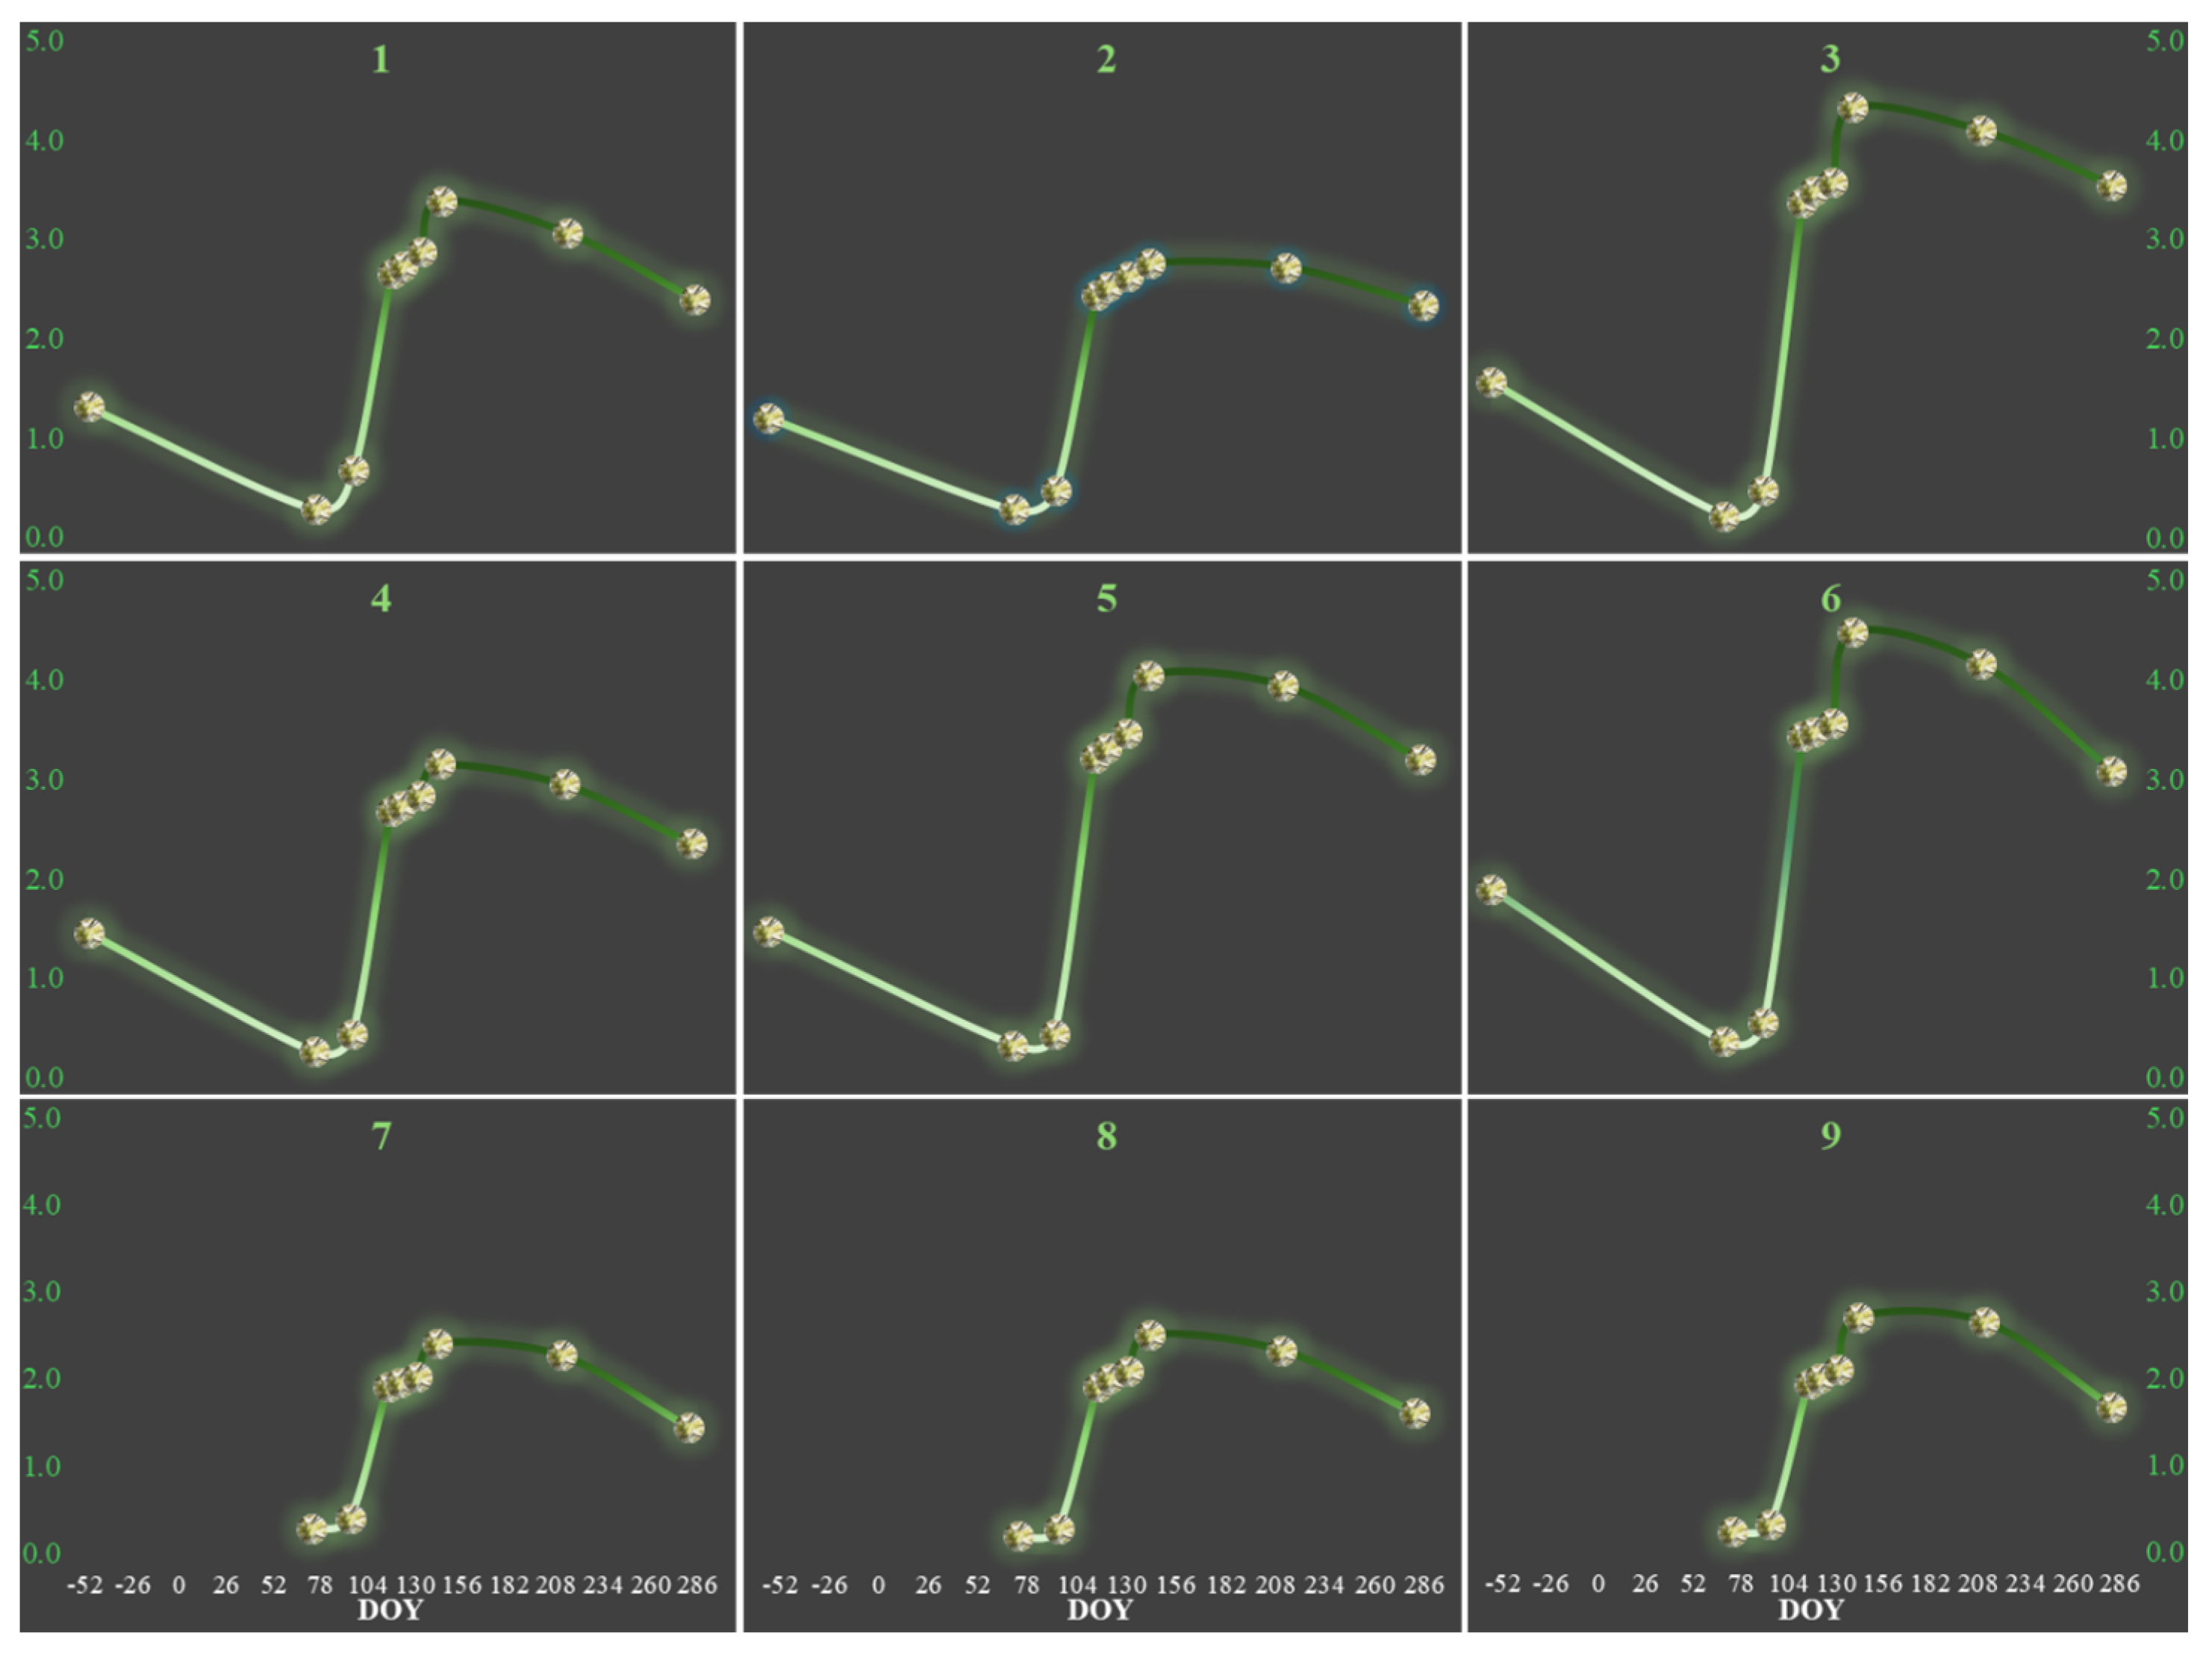
3.2. Leaf Senescence Periods (2023 and 2024)

At the beginning of the monitoring periods (DOY: −52 according to 2024; 314 according to 2023), the leaves of the trees were in their senescence phase. The mean LAI of the canopy points within the interior forest patch was 1.49 m2 m−2, ranging between 1.20 m2 m−2 (Canopy 2) and 1.90 m2 m−2 (Canopy 6) (Figure 5). Conversely, their mean LT and CO percentages were both about 29%, ranging between 20% (Canopy 6) and 37% (Canopy 2), indicating moderate canopy closure (Figure 6). Similarly, the mean GF was 5%, ranging between 2% (Canopy 6) and 9% (Canopy 2) within the interior forest patch (Figure 6). Higher canopy coverage, stratified with overstory trees and understory tree saplings and shrubs (Figure 2 and Figure 3), led to higher LAI values at those canopy points (Figure 5). Conversely, lower LT, CO, and GF percentages occurred during their senescence period (Figure 6). The mean air and soil (−10 cm) temperatures were 16.3 °C and 15.6 °C, respectively, which were close to their annual averages (15.2 and 16.1 °C) for that monitoring year (1 November 2023–31 October 2024) (Figure 4).
The following year’s (2024) senescence began approximately at the end of July (DOY: 211), when the mean air and soil (−10 cm) temperatures were 24.3 °C and 26.6 °C, respectively (Figure 4). However, the mean air temperature was approximately 1 °C higher throughout the whole of July (Figure 4). At the beginning of the senescence period, the mean LAI dropped to 3.49 m2 m−2, decreasing by 0.20 m2 m−2 compared to the value from two months ago (DOY: 142), within the interior forest patch (Figure 5). Their mean LT and CO percentages were both around 6%, increasing by approximately 1% compared to DOY 142. They ranged between 3% (Canopy 6) and 10% (Canopy 2), whereas the mean GF was only 0.5%, ranging between 0.2% (Canopy 5) and 1.1% (Canopy 2) (Figure 6). During that time (DOY: 211), the mean soil temperature and moisture were 26.2 °C and 33.5%, respectively, within the interior forest patch (Figure 7). Furthermore, they were 35.0 °C and 43.0% within the patch edge (Figure 7), signaling the beginning of a dry period. During the onset of the leaf senescence period, however, the mean LAI dropped to 2.42 m2 m−2, decreasing by 0.12 m2 m−2 compared to the value from two months ago (DOY: 142), within the forest patch edge (Figure 5). In addition, two months later in September (DOY: 268), the mean soil temperature and moisture were 21.7 °C and 27.5%, respectively, within the interior forest patch (Figure 7). Notably, they were 27.4 °C and 46.9% within the patch edge (Figure 7), emphasizing the continuation of the previous dry period.
After 71 days of this senescence period (2024; DOY: 281), the mean LAI of the canopy points within the interior forest patch reached 2.82 m2 m−2, decreasing by 0.67 m2 m−2 (Figure 5), and ranged between 2.34 m2 m−2 (Canopy 2) and 3.09 m2 m−2 (Canopy 6) (Figure 5). Conversely, their mean LT and CO percentages were both about 10%, increasing by approximately 4%, and ranged between 5% (Canopy 3) and 14% (Canopy 2) (Figure 6). The mean GF was only 1% and ranged between 0.4% (Canopies 3 and 6) and 2.1% (Canopy 2) (Figure 6). The mean LAI of the canopy points within the edge of the forest patch was only 1.58 m2 m−2, decreasing by 0.67 m2 m−2 compared to DOY 211 (Figure 5), and ranged between 1.45 m2 m−2 (Canopy 7) and 1.67 m2 m−2 (Canopy 9) (Figure 5). Conversely, their mean LT and CO percentages both increased to around 40%, increasing approximately 17% compared to DOY 211 (Figure 6), and ranged between 37% (Canopy 9) and 44% (Canopy 7). The mean GF rose to about 30%, and ranged between 27% (Canopy 9) and 35% (Canopy 7) (Figure 6). Within this region, the mean air and soil (−10 cm) temperatures declined to 17.4 °C and 17.7 °C, respectively, both decreasing by about 7 °C within the initial 71 days (DOYs: 211 to 281) of the leaf senescence period (Figure 4). This temperature decline had led to diminished LAI values and increased LT, CO, GF percentages within both the interior parts and the edge of the forest patch (Figure 5 and Figure 6). Within the interior forest patch, the mean soil temperature and moisture were 22.0 °C and 37.1%, respectively, whereas within the patch edge, they were 23.9 °C and 48.9% (Figure 7). These values indicate that the forest patch became more humid on this day (DOY: 281). The increased canopy closure within the interior forest patch resulted in drier soil compared to the patch edge, due to reduced rainfall caused by interception and evaporation. Moreover, approximately three weeks later in October (DOY: 300), the mean soil temperature and moisture were 14.9 °C and 42.5%, respectively, within the interior forest patch (Figure 7). They were 19.9 °C and 54.5% within the patch edge (Figure 7), indicating relatively seasonal cooling and the rainfall-induced wetting of the forest patch soil.

3.3. Leaf Budburst and Onset

At the beginning of the leaf budburst dates (DOY: 73), the mean LAI values of the canopy points were only 0.29 m2 m−2 (ranging between 0.22 m2 m−2 for Canopy 3 and 0.37 m2 m−2 for Canopy 6) and 0.24 m2 m−2 for the interior forest patch and the patch edge, respectively. This indicated an almost leafless situation for those canopies within the overall forest patch (Figure 5). For the interior forest patch, the mean LT, CO, and GF were 77% (71%–82% for Canopies 6 and 3), 78% (72%–82% for Canopies 6 and 3), and 12% (5%–15% for Canopies 6 and 2–4), respectively (Figure 6). For the patch edge, the mean LT, CO, and GF were 83% (80%–85% for Canopies 7 and 8), 83% (81%–85% for Canopies 7 and 8), and 52% (47%–58% for Canopies 9 and 8), respectively (Figure 6). During the week prior to this monitoring date (DOY: 67–73), the mean air and soil (−10 cm) temperatures were 8.3 °C and 9.1 °C, respectively (Figure 4). Their leaf buds then swelled and burst after three weeks (DOY: 94), when the mean LAI of the canopy points within the interior forest patch reached 0.51 m2 m−2 (0.44%–0.56 m2 m−2 for Canopies 4–6) (Figure 5). The mean LT, CO, and GF decreased to 64% (57%–68% for Canopies 1 and 4), 65% (57%–69% for Canopies 1 and 4), and 15% (10%–23% for Canopies 6 and 3), respectively (Figure 6). These values and percentages indicate the first appearance of fresh leaves. For the patch edge, the mean LAI of the canopy points was still 0.33 m2 m−2 (0.28%–0.40 m2 m−2 for Canopies 8 and 7) (Figure 5). The mean LT, CO, and GF were 78% (74%–71% for Canopies 7 and 8), 79% (74%–82% for Canopies 7 and 8), and 51% (46%–58% for Canopies 7 and 8), respectively (Figure 6).

3.4. Leaf Unfolding and Stable Full-Leaf Periods

As indicated by the values and percentages, the leaf buds of the canopy points emerged within the forest patch edge; however, they were not as apparent as those within the interior forest patch (Figure 5 and Figure 6). They became more apparent during the following three weeks (DOY: 94–115), even for the canopy points in the patch edge. The mean LAI was 1.92 m2 m−2 (1.91–1.93 m2 m−2 for Canopies 7–9) (Figure 5), and the mean LT, CO, and GF were 38% (35%–40% for Canopies 8 and 7), 38% (36%–40% for Canopies 8 and 7), and 31% (27%–35% for Canopies 8 and 7), respectively (Figure 6). During the next week (DOY: 115–121), when the mean soil temperature and moisture were 20.4 °C and 61.0% for the patch edge (Figure 7), the mean LAI increased to 1.99 m2 m−2 (Figure 5). The mean LT, CO, and GF percentages decreased to 35% (30%–39% for Canopies 9 and 7), 35% (31%–39% for Canopies 9 and 7), and 28% (22%–34% for Canopies 9 and 7), respectively, (Figure 6). In April 2024, the mean air and soil (−10 cm) temperatures were 14.9 °C and 16.0 °C, respectively, within the region (Figure 4). Thus, during that month, the mean LAI of the canopy points within the interior forest patch initially increased to 2.96 m2 m−2 (2.44–3.44 m2 m−2 for Canopies 2 and 6; DOY: 115) and then to 3.05 m2 m−2 (2.52–3.49 for m2 m−2 Canopies 2 and 3; DOY: 121) (Figure 5). The mean soil temperatures and moisture values were 20.2 °C and 51.6%, and then 16.6 °C and 63.5%, respectively (Figure 7). This situation indicates a conservative effect of the interior parts of the multi-story forest patch on both soil temperature and soil moisture (Figure 3).
By late April (DOY: 115–121), the mean LAI of the meadow field points increased from 1.43 to 2.24 m2 m−2, when their mean soil temperature and moisture changed from 22.3 °C and 38.6% (DOY: 115) to 18.1 °C and 55.4%, respectively (DOY: 121) (Figure 8). For this period in April, the soil temperature values of the meadow field points were closer to those of the forest patch edge rather than the interior parts (Figure 7 and Figure 8). During these dates in April, the LAI values of the meadow field and forest patch edge points were also close to each other (Figure 5). However, they were much lower than the interior parts of the forest patch, indicating the influence of vegetation cover on soil temperature. In addition, the soil moisture values of the meadow field points were much lower than the overall forest patch points (Figure 7 and Figure 8). This situation indicates the impact of increased moisture uptake by the roots of herbaceous vegetation compared to those of ligneous vegetation (Figure 3). It also demonstrates the higher soil moisture preservation potential of ligneous vegetation canopies compared to herbaceous vegetation cover (Figure 3).
In May, the mean air and soil (−10 cm) temperatures were 15.2 °C and 17.7 °C, respectively, within the region (Figure 4). During this period, the mean soil temperatures and moisture values were 17.6 °C and 61.6%, and 17.2 °C and 56.4%, respectively, for the interior parts (Figure 7). Due to their multi-story canopy structure (Figure 3), the mean LAI of the canopy points within the interior forest patch continued to increase, initially reaching 3.16 m2 m−2 (2.44–3.44 m2 m−2 for Canopies 2 and 6; DOY: 131) and then 3.69 m2 m−2 (2.76–4.48 m2 m−2 for Canopies 2 and 6; DOY: 142) (Figure 5). On the other hand, the mean LT of 7.3% (7–8% for Canopies 1 and 4), mean CO of 7.4%, and mean GF of 0.7% decreased to only 5.0%, 5.1%, and 0.5%, respectively (Figure 6). In May 2024, the mean soil temperatures and moisture values were 22.0 °C and 55.8% (DOY: 131), and 26.0 °C and 51.6% (DOY: 142), respectively within the canopy points of the forest patch edge (Figure 7). In addition, the mean LAIs were only 2.08 m2 m−2 (2.03–2.11 m2 m−2 for Canopies 7 and 9; DOY: 131) and 2.54 m2 m−2 (2.41–2.70 m2 m−2 for Canopies 7 and 9; DOY: 142) (Figure 5). During this period (DOY:131–142), their canopies could cover almost half of their projection, as indicated by their mean LT, CO, and GF of 32%–31%, 32%–31%, and 24%–26% (Figure 6), respectively. Their mean soil temperatures and moisture values were 17.6 °C and 61.6%, and 17.2 °C and 56.4%, respectively (Figure 7). Later in May 2024 (DOY: 131–142), the mean LAI of the meadow field points increased from 2.43 m2 m−2 (Figure 5), when their mean soil temperature and moisture were 20.5 °C and 35.5% (DOY: 131) (Figure 7), to 2.77 m2 m−2 (Figure 5), when their mean soil temperature were 21.0 °C and 32.9%, respectively (DOY: 142) (Figure 7). For the dates in May, the soil temperature values of the meadow field points were closer to those of the forest patch edge rather than the interior parts (Figure 7 and Figure 8). This situation depends upon the influence of the vegetative cover and the LAI on the soil temperature, as indicated for April (Figure 3). Moreover, during the dates in May, the soil moisture values of the meadow field points were again much lower than the overall forest patch points (Figure 7 and Figure 8). This is because of the increased moisture uptake potential of herbaceous vegetation roots—especially as they grow—and the higher soil moisture preservation potential of ligneous vegetation canopies (Figure 3).

4. Discussion

4.1. Leaf Senescence Period

The LAI values began to decrease, while the LT, CO, GF percentages began to increase at the end of July (DOY: 211), marking the onset of leaf senescence for the overall forest patch (Figure 5 and Figure 6). During this time, both the mean air and soil temperatures were around 25 °C, which was about their July averages and hence around the maximum annual temperature (Figure 4). The onset of leaf senescence around that date could not directly be attributed to the temperature change. Instead, it could be dependent upon the abundant recent rainfall after a long dry term, which had lasted at least one month (Figure 7). According to recent research on the initiation and progress of leaf senescence, this process is closely related not only to temperature but also to rainfall patterns. Moreover, the influence of rainfall seems to be particularly important after prolonged dry periods. Recent research by the authors of [33] showed that changes in rainfall regimes could alter the timing of leaf phenological events. A sudden increase in rainfall following a drought could compensate for physiological stress, leading to a rapid change in carbon allocation and initiating the senescence process. In their study within an urban forest patch close to our forest patch, the authors of [34] indicated similar dates for the onset of senescence of the European hornbeam leaves. However, their air and soil temperatures continued to increase slightly, a situation which they attributed to leaf shrinkage due to water scarcity. In contrast, after almost two months (DOY: 211–268), we found that both the mean air and soil temperatures dropped by 5–6 °C (Figure 4), relatively much lower for the interior parts compared to the forest patch edge (Figure 7). Moreover, 70 days later (DOY: 281), the mean LAIs of the interior parts and the edge of the forest patch decreased, respectively, by 0.7 and 0.8 m2 m−2. During this period, the soil temperature continued to drop by 3.5 °C within the forest patch edge, while remaining almost constant within the interior parts (Figure 5). In fact, in the study on the European beech within a forest in southern Germany, the authors of [35] determined almost the same dates and associated mean air temperatures as our study regarding the onset of the leaf senescence. They also noted leaf coloring in the overstory trees one month earlier than the understory trees. On the other hand, in our study, the soil temperature within the forest patch suddenly dropped over a three-week period (DOY: 300), reaching around the same levels (~15 °C) as in early November of the previous year’s (2023) (DOY: −52 according to 2024; 314 according to 2023) (Figure 7).

4.2. Leafless, Budburst, and Leaf Onset Period

During the leafless period before the leaf budburst (DOY: 0–73), when the mean air and soil (−10 cm) temperatures were 7.3 and 7.1 °C, the LAI could not even exceed 0.37 m2 m−2 (Canopy 6) (Figure 5), indicating that the trees and shrubs were almost without leaves. In addition, LT and CO were at least 71% (Canopy 6) (Figure 6). In a Slovak forest site consisting of some deciduous species common to our study, the authors of [36], based on NDVI and hemispherical image analyses, determined approximately the same DOY (before 98) for the leafless period before the first leaf onset. However, their average altitude was about 500 m higher than ours. This altitudinal difference corresponded to a 2.5–5.0 °C temperature difference for that forest site, where their GF percentages were close to ours, following almost the reverse pattern of the comparable LAI values. In our study, leaf buds were estimated to have burst at the beginning of April (DOY: 94), when the mean LAI almost doubled compared to the values from three weeks ago, both for the interior forest patch and for the patch edge (Figure 5). During this leaf budburst period (DOY: 73–94), the mean air and soil (−10 cm) temperatures climbed from 7.5–9.6 °C to 17.2–13.3 °C, respectively (Figure 4). Hence, both the LT and CO percentages decreased by 13% for the interior forest patch and by 10% for the patch edge (Figure 6). However, the authors of [37] reported a one-month budburst delay compared to our study, referring to mid-May for the budburst of cool-temperate forest tree canopies composed of oak and birch species. This delay was primarily due to the latitudinal difference and an altitudinal difference of approximately 1350 m.

4.3. Leaf Unfolding Period and Meadow Field

After the budburst and first onset of the leaves, the leaf unfolding period was estimated to have lasted for almost one month (from mid-April to mid-May). Leaf unfolding increased the LAI values from at least fourfold (Canopy 1) up to sevenfold (Canopies 3 and 5) (Figure 5). On the contrary, the LT, GF, and CO percentages experienced a much sharper decline for the canopies within the interior forest patch and a relatively gentle decline for the last three canopies (Canopies 7–9) at that patch edge (Figure 6). This was because a large portion of the hemispherical view at the top of their canopy points was already uncovered, allowing direct light to penetrate to the ground (Figure 3). However, canopies within almost half of the last three hemispherical views partially blocked sunlight (Figure 3). For another temperate deciduous forest in Germany, including similar overstory tree species, the authors of [38] indicated a decrease in the overlapping canopy gap fraction (from 0.60 to 0.14) in the interior forest, comparable to our study. Hence, they reported the same dates for the unfolding of their leaves.
However, during this leaf unfolding period, mean soil moisture differences between the interior forest patch and the patch edge were minimal (Figure 7), particularly due to the partial canopy closure at those canopy points. In addition, the existence of understory vegetation within the interior forest patch may have contributed to the usage of even a small amount of soil moisture (Figure 3 and Figure 7). During this period, mean soil temperature differences (1.6–8.8 °C higher for the edge) were observed between the interior and the edge of the forest patch. This was particularly due to the partial direct sunlight hitting and warming the ground by passing through the large gap fraction and canopy openness without any obstruction within the patch edge (Figure 3 and Figure 7). For their study on canopy gaps in a Slovenian experimental forest involving dominantly firs and beeches, the authors of [39] emphasized that differences in the average soil moisture percentage were small between the plot located at the gap edge with less sun exposure and the plot under the forest canopy.
During the approximately half-month period between late April and early May (DOY: 115–131), as leaf unfolding continued, the mean LAI rose by 1.0 m2 m−2 for the meadow field with sapling trees. This was particularly due to the growth of herbaceous vegetation rather than the leaf unfolding of the saplings (Figure 1), given that leaf unfolding only contributed 0.16 m2 m−2 to the mean LAI increment at the patch edge (Figure 5). During the growth of herbaceous vegetation, their coverage above and below ground increased, resulting in higher water usage and thus lowering soil moisture by evapotranspiration and cooling the soil temperature. In their study on a rice paddy site, the authors of [40] identified similar dates (DOY: 120–248) for the growing season of rice. In addition, using the same LAI-2200 instrument, they detected LAI values up to 6 m2 m−2 in mid-July. Given that the herbaceous vegetation within our meadow field was not cut down earlier, we could also have observed higher LAI values following the end of May. According to the study by [41], with increasing gap size, soil temperature differences could increase up to 3.6 °C within the patch clearcut compared to the soil beneath the uncut control site. Although they were not much greater than the interior forest patch, the mean soil temperatures of the forest patch edge were higher than those of the meadow field (0.2–4.9 °C higher for the edge) in our study (Figure 7). The mean soil moisture percentages were much lower (8.2%–23.4% lower) within the meadow field compared to the interior forest patch (Figure 7 and Figure 8). The primary reasons for these differences were likely the differences in LAI and the increased uptake of water by the herbaceous vegetation through their superficial roots within the meadow field. The study by [42] determined that the experimental opening of gaps within the Hungarian sessile oak–hornbeam forest did not lead to substantial changes in soil temperature. However, it had an increasing impact on the soil moisture, which, together with increased light, caused evaporative cooling and stabilized soil temperature.

4.4. Full-Leaf Stable Period

Although a relatively stable period started for the LAIs, LTs, GFs, and COs of all canopies after late April (after DOY: 115), the LAIs continued to increase slightly, whereas the LTs, GFs, and COs decreased slightly until mid-May (until DOY: 131). This was particularly due to the dimensional growth and increment in number of overstory tree leaves (Figure 3, Figure 5 and Figure 6). In their remote sensing study for deciduous temporal forest tree species, the authors of [43] indicated approximately similar mean threshold dates until mid-May for the maturity of the deciduous tree leaves. In our study, that relatively stable period was estimated to proceed after mid-May (after DOY: 131), principally when the overstory tree leaves reached their maximum sizes and numbers (Figure 3, Figure 5 and Figure 6). In an experimental study plot at 150 m asl. in southeastern Czechia, with vegetation characteristics similar to our study area, ground-based observations by [44] determined mean DOYs, 173, 192, and 193 for the full development of the European hornbeam, pedunculate oak, and narrow-leaved ash leaves, respectively. These mean DOYs were at least one month (up to two months) later than our study, where average annual precipitation was two-fold, and the average annual air temperature was about 3 °C higher than that of the study by the authors of [44]. However, after mid-May (DOY: 131), when the overstory tree leaves reached their maximum sizes and numbers, the LAIs spiked again until late May (until DOY: 142) (Figure 5 and Figure 6). This situation was most probably due to the delayed leaf unfolding of the understory trees and shrubs such that they could grow and tolerate the under-shade conditions. This delayed leaf unfolding occurred for all nine canopies, where at least one understory species exists (Figure 2, Figure 3, Figure 5 and Figure 6). The spike was particularly apparent for the canopy points—1, 3, 4, 5, 6, 7, 8, and 9—where both tree and shrub species appeared as understory vegetation cover (Figure 3, Figure 5 and Figure 6). On the other hand, for the first five canopies, European bladdernuts were included as common understory shrub, whereas common hawthorns were considered as understory shrubs of Canopies 4, 5, 6, 7, 8, and 9 (Figure 2, Figure 3, Figure 5 and Figure 6). However, bay laurels and bloody dogwoods were the only understory shrubs successfully established beneath Canopy 4 (Figure 2, Figure 3, Figure 5 and Figure 6).

4.5. LAI, LT, GF, CO and Soil Temperature

On the other hand, during this full-leaf stable period, the soil temperature values followed a pattern different from their LAIs, LTs, GFs, and COs, compatible with neither the full-leaf stable period (DOY: 115–131) nor the delayed leaf unfolding period (DOY: 131–142) (Figure 5, Figure 6 and Figure 7). However, soil temperatures beneath the canopy points at the forest patch edges were all higher than those beneath the canopy points at the interior forest patch. Also, this situation was observed for the entire monitoring period (Figure 5, Figure 6 and Figure 7). For the small fragments of Central European temperate forest surrounded by agricultural areas, which resemble our landscape, the authors of [45] determined that the soil temperature apparently and almost gradually declined from the edge to the interior parts of the forest.
In forest ecosystems, canopy structural parameters, LAI, LT, CO, and GF, play a critical role in determining understory microclimate conditions, particularly soil temperature. Higher LAI values and lower LT, CO, and GF percentages indicate dense canopy cover, which limits sunlight penetration to the forest floor. Consequently, this restricted light availability results in cooler and more stable soil temperature conditions. In summer, this shading effect of temperate broadleaf forests supports buffer microclimate extremes by reducing soil temperature fluctuations, as indicated in the study by the authors of [46]. Nonetheless, these parameters followed a similar pattern with that of air temperature, indicating that air temperature influenced soil temperature (Figure 4) more than increased canopy closure did. The LTs, GFs, and COs of the last three canopies at the forest edge were much higher than the first six canopies. For the European deciduous forests and forest patches, the authors of [47] determined cooler air and soil temperatures for these forests from their edges to their interior parts. In summer, they also determined that the average offsets between air and soil temperatures were, respectively, −2.8 and −2.3 °C at the forest edges compared to outside the forest. This indicates a significant influence of canopy closure as an important driver of that average difference. LAI is not solely or directly a parameter indicating soil temperature and moisture; LT, CO, and GF also serve as important indicators. For a study site in a mixed temperate broadleaved deciduous forest in northwestern England, dominated by tree species similar to those in our study, the authors of [48] found that larger gap sizes led to higher mean daily soil temperatures.

4.6. LAI, LT, GF, CO and Soil Moisture

Among the canopies, Canopy 6—with the highest LAI (4.48 m2 m−2) (Figure 5) and the lowest LT (2.30%), GF (0.20%), and CO (2.39%) (Figure 6)—was vertically the most stratified canopy point. At this canopy point, all the tree species with different heights were composed of numerous understory tree and shrub species (Figure 2 and Figure 3). With similar climate characteristics, a layered forest canopy structure, and some common tree genus, the authors of [49] indicated comparable dates (DOY: 110–140) to our study for leaf-out. However, a more prolonged stable full-leaf period (DOY: 140–280) took place in their study. They also determined that increasing the vertical canopy layers led to higher LAI and diminishing gap fractions with light intensity, which supported the temporal extension of the full-leaf development stage in sub-canopy layers, such as the understory trees and shrubs in our study. Among the canopies within an interior forest patch, during the full-leaf stable period (DOY: 142), Canopy 2—with the lowest LAI (2.76 m2 m−2) (Figure 5) and the highest LT (9.56%), GF (0.98%), CO (9.50%) (Figure 6)—was vertically the least stratified canopy, with few trees and shrubs (Figure 2 and Figure 3). In their study, the authors of [50] indicated the moderating role of canopy closure on soil temperature, where a higher LAI corresponded to higher moderation capacity, particularly in dry soils. However, despite reaching similar LAI values (2.41–2.70 m2 m−2) as Canopy 2 in the interior side of the forest patch (Figure 5), the last three canopies at that patch edge had comparatively much higher LT, GF, and CO percentages (Figure 6). A decrease in LAI and, conversely, an increase in LT, CO, and GF may result in more sunlight reaching the forest floor, leading to increased evaporation. However, this does not always lead to a decrease in soil moisture. In some cases, increased canopy openness can increase soil moisture by allowing rainfall to reach the soil surface directly. For example, in their study, the authors of [51] reported that increasing canopy openness had complex effects on soil moisture, and that this complex effect may vary depending on forest structure and environmental conditions. In fact, for a very similar forest area in the region, the authors of [52] identified no direct correlation between the LAI and GF. In our study, there was no definite difference between the interior forest patch and the patch edge in terms of soil moisture (Figure 7). This situation indicated a relatively lesser influence of canopy closure on soil moisture during this period. However, in their study estimating the GF and LAI in mature temperate forests across Switzerland, the authors of [53] associated open canopies with wetter sites.

4.7. Meadow Field, Soil Temperature, and Soil Moisture

During the approximately one-month leaf unfolding and full-leaf period, there was an almost inverse pattern between the soil temperature values and the soil moisture percentages of all meadow field points (Figure 8). However, this inverse pattern was more explicit during the period between late April and early May (DOY: 115–131) (Figure 8). During this period, the mean LAI values increased by 1.00 m2 m−2, indicating dimensional and numerical increments of both the herbs and sapling leaves (Figure 3 and Figure 8). The increase in soil moisture during late April (DOY: 121) was not only associated with precipitation but also with the preservation of soil water loss against evaporation by the canopies, as confirmed by the decrease in soil temperature (Figure 3 and Figure 8). However, the subsequent reduction in soil moisture was also a consequence of the collective impact of the rise in air and soil temperature, decrease in precipitation, and reduction in canopy closure (Figure 3 and Figure 8). Indeed, based on four years of monitoring a Eurasian meadow steppe, the authors of [54] revealed that the frequency and deficiency of precipitation led to higher and lower soil water contents, respectively. This was most probably influenced by the interrelated increases in air and soil temperature, LAI, and aboveground biomass during the growing seasons. In addition, it was emphasized in another study that the effects of soil temperature and soil moisture on soil respiration could be better understood by evaluating them together [55]. In our study, during late May (DOY: 142), the mean LAI slightly increased by 0.34 m2 m−2 compared to early May (DOY: 131), whereas both the soil temperature and moisture remained almost constant (Figure 8).

5. Conclusions

Overall, the findings of this study show clear variations between the interior parts and the edge of the forest patch in terms of vegetation parameters, namely, LAI, LT, CO, and GF. Accordingly, these interior parts and the patch edge also had variations in terms of soil temperature and moisture. In addition, the mean soil temperatures of the overall forest patch were lower than those of the meadow field in April and May. This situation could be directly attributed to the multi-story vegetation and canopy structure of the forest patch. However, throughout the temporal sequence of monitoring, no definite or significant correlation and pattern could be determined between the vegetation parameters and the measured soil temperatures and moisture. This was observed for all the interior parts and the edge of the forest patch. Moreover, no definite or significant correlation or pattern was observed between the LAIs and measured soil temperatures and moisture for the meadow field in April and May. This study highlights the edge effect of forest patches by comparing their edges to their interior parts in terms of vegetation and soil parameters. Also, by comparing the forest patch to the meadow field, the results of this study suggest the important role these forest patches play in preserving soil temperature and moisture within the overall rural landscape, emphasizing their significance in the context of landscape ecology. Furthermore, the results of this study confirm the ecological, hydrological, and climate conservation roles of forest patches, as proposed during the introduction, which aligns with the management proposals of the Regional Forestry Administration to a certain extent.
Forest patches in the region are the consequence of agricultural sprawl in the form of either village settlements and/or arable field intrusions into once completely established forest ecosystems. However, dependent upon the degree and type of human interventions, these forest ecosystems have fortunately formed corridors, somewhat retaining their ecological and structural continuity within the overall landscape. On the other hand, unfortunately, they have mostly become isolated fragments and patches, particularly due to road and trail constructions, land ownership differentiations, and irregular penetration of cultivation practices. Nevertheless, the regeneration and succession capabilities of these forest fragments and patches have since proceeded, seeking to reestablish forest ecosystems by expanding back into their former habitats. Given their moderating role on the temperature and moisture of both air and soil, forest patches within this rural landscape, have been proposed to be managed climate conservation by the Turkish General Directorate of Forestry. Thus, protecting, favoring, and supporting the regeneration, growth, and establishment of these forest patches will provide essential buffers against both current and future climate change phenomena.

Author Contributions

All the authors contributed to the study conception and design. On the other hand, all the field work and monitoring processes were conducted by M.Ö., İ.B., H.Ş. and K.Ç. The parameter and statistical analyses were performed by M.Ö. and İ.B. The data tabulation, graphics, and 3D modeling were carried out by M.Ö. and İ.B. All writing processes were completed by M.Ö., İ.B., H.Ş. and K.Ç. All authors have read and agreed to the published version of the manuscript.

Funding

Part of this study was supported by the TUBİTAK (The Scientific and Technological Research Council of Türkiye) with the grant number of 1002-A-123O787. The authors Hüseyin Şensoy, İlyas Bolat, and Kamil Çakıroğlu have received research support from the TUBİTAK.

Data Availability Statement

The data and material in this work have not been shared publicly elsewhere and therefore will only be available after the paper is published.

Acknowledgments

This study involves part of the report data from the Project titled “Determination of Individual and Integrated Effects of Litter and Vegetation Cover on Surface Runoff and Soil Loss” submitted to the TUBİTAK (The Scientific and Technological Research Council of Türkiye) and successfully completed with the number of 1002-A-123O787. As the authors of this study, we owe a debt of gratitude to TUBİTAK for all their financial support and encouragement. In addition, we would like to acknowledge Barbaros Yaman (Bartın University; Faculty of Forestry) for their assistance with the species analyses of some trees and shrubs, Research Assistant Esra Pulat (Bartın University; Faculty of Forestry) for their assistance with the species analyses of some herbaceous vegetation, and Research Assistant Eren Baş (Bartın University; Faculty of Forestry) for conducting the overall drone photography for the study. Moreover, Forest Engineer Metehan Ayvaz and Landscape Architecture students İbrahim Can Burhan and İbrahim Karabulut are gratefully acknowledged for their valuable support during the fieldwork of this study. In addition, we would like to credit the Turkish State Meteorological Service for providing the meteorological data and the Turkish General Directorate of Forestry for sharing the forest management plans and maps. Finally, we would like to appreciate Bartın University for continuously encouraging our studies with financial and moral support.

Conflicts of Interest

There is no competing interest with any party that could risk this study being involved in controversy. Therefore, the authors have no relevant financial or non-financial interests to disclose.

References

  1. Buck, J.R.; St. Clair, S.B. Stand composition, proximity to overstory trees and gradients of soil moisture influence patterns of subalpine fir seedling emergence and survival. Plant Soil 2014, 381, 61–70. [Google Scholar] [CrossRef]
  2. Brockett, B.F.T.; Prescott, C.E.; Grayston, S.J. Soil moisture is the major factor influencing microbial community structure and enzyme activities across seven biogeoclimatic zones in western Canada. Soil Biol. Biochem. 2012, 44, 9–20. [Google Scholar] [CrossRef]
  3. Xu, M.; Zhong, Z.; Sun, Z.; Han, X.; Ren, C.; Yang, G. Soil available phosphorus and moisture drive nutrient resorption patterns in plantations on the Loess Plateau. For. Ecol. Manag. 2020, 461, 117910. [Google Scholar] [CrossRef]
  4. Olesinski, J.; Lavigne, M.B.; Krasowski, M.J. Effects of soil moisture manipulations on fine root dynamics in a mature balsam fir (Abies balsamea L. Mill.) forest. Tree Physiol. 2011, 31, 339–348. [Google Scholar] [CrossRef]
  5. Petraglia, A.; Cacciatori, C.; Chelli, S.; Fenu, G.; Calderisi, G.; Gargano, D.; Abeli, T.; Orsenigo, S.; Carbognani, M. Litter decomposition: Effects of temperature driven by soil moisture and vegetation type. Plant Soil 2019, 435, 187–200. [Google Scholar] [CrossRef]
  6. Petrie, M.D.; Hubbard, R.M.; Bradford, J.B.; Kolb, T.E.; Noel, A.; Schlaepfer, D.R.; Bowen, M.A.; Fuller, L.R.; Moser, W.K. Widespread regeneration failure in ponderosa pine forests of the southwestern United States. For. Ecol. Manag. 2023, 545, 121208. [Google Scholar] [CrossRef]
  7. Bonan, G. Ecological Climatology: Concepts and Applications, 3rd ed.; Cambridge University Press: New York, NY, USA, 2016; 692p. [Google Scholar]
  8. Chang, M. Forest Hydrology: An Introduction to Water and Forests, 2nd ed.; CRC Press, Taylor and Francis Group: New York, NY, USA, 2006. [Google Scholar]
  9. Waring, R.H.; Running, S.W. Forest Ecosystems: Analysis at Multiple Scales, 3rd ed.; Elsevier Academic Press: London, UK, 2007. [Google Scholar]
  10. Perry, D.A.; Oren, R.; Hart, S.C. Forest Ecosystems, 2nd ed.; The Johns Hopkins University Press: Baltimore, MD, USA, 2008; 632p. [Google Scholar]
  11. Stickley, S.F.; Fraterrigo, J.M. Understory vegetation contributes to microclimatic buffering of near-surface temperatures in temperate deciduous forests. Landsc. Ecol. 2021, 36, 1197–1213. [Google Scholar] [CrossRef]
  12. Forman, R.T.T.; Godron, M. Landscape Ecology; John Wiley & Sons Inc.: Hoboken, NJ, USA, 1986; 648p. [Google Scholar]
  13. Turner, M.G.; Gardner, R.H. Landscape Ecology in Theory and Practice; Pattern and Process, 2nd ed.; Springer Science + Business Media LLC: New York, NY, USA, 2015; 482p. [Google Scholar]
  14. Bae, J.; Ryu, Y. The magnitude and causes of edge effects on soil organic carbon stocks within and across urban to rural forest patches. Landsc. Urban Plan. 2021, 215, 104223. [Google Scholar] [CrossRef]
  15. Zellweger, F.; Cooms, D.; Lenoir, J.; Depauw, L.; Maes, S.L.; Wulf, M.; Kirby, K.J.; Brunet, J.; Kopecký, M.; Máliš, F.; et al. Seasonal drivers of understorey temperature buffering in temperate deciduous forests across Europe. Glob. Ecol. Biogeogr. 2019, 28, 1774–1786. [Google Scholar] [CrossRef]
  16. Parker, G.G. Tamm review: Leaf Area Index (LAI) is both a determinant and a consequence of important processes in vegetation canopies. For. Ecol. Manag. 2020, 477, 118496. [Google Scholar] [CrossRef]
  17. Leblanc, S.G.; Fournier, R.A. Measurement of forest structure with hemispherical photography. In Hemispherical Photography in Forest Science: Theory, Methods, Applications; Fournier, R.A., Hall, R.J., Eds.; Springer Science+Business Media B.V.: Dordrecht, The Netherlands, 2017; pp. 53–83. [Google Scholar] [CrossRef]
  18. Thimonier, A.; Sedivy, I.; Schleppi, P. Estimating leaf area index in different types of mature forest stands in Switzerland: A comparison of methods. Eur. J. For. Res. 2010, 129, 543–562. [Google Scholar] [CrossRef]
  19. Brüllhardt, M.; Rotach, P.; Schleppi, P.; Bugmann, H. Vertical light transmission profiles in structured mixed deciduous forest canopies assessed by UAV-based hemispherical photography and photogrammetric vegetation height models. Agric. For. Meteorol. 2020, 281, 107843. [Google Scholar] [CrossRef]
  20. TGDF (Turkish General Directorate of Forestry). Forest Management Plans (2011) of Bartın-Kozcağız Sub-District of Bartın Forestry Administration Affiliated to the Zonguldak Regional Forest Directorate; TGDF: Ankara, Turkey, 2011. [Google Scholar]
  21. TMAF (Turkish Ministry of Agriculture and Forestry). Digital Soil Maps of Bartın Stream Watershed; TGDF: Ankara, Turkey, 2005. [Google Scholar]
  22. TGDMRE (Turkish General Directorate of Mineral Research and Exploration). Digital Geological Maps of Zonguldak E-29 Section; TGDMRE: Ankara, Turkey, 2007. [Google Scholar]
  23. Brady, N.C.; Weil, R.R. The Nature and Properties of Soils, 15th ed.; Pearson Education: Upper Saddle River, NJ, USA, 2016; 1104p. [Google Scholar]
  24. TSMS (Turkish State Meteorological Service). Meteorological Data of Bartın (17020) and Kozcağız (19007) (Turkey) Meteorology Stations; TSMS: Ankara, Turkey, 2024. [Google Scholar]
  25. Atalay, İ. Climate Atlas of Turkey; İnkılâp Bookstore Press: İstanbul, Turkey, 2011; 136p. (In Turkish) [Google Scholar]
  26. Liu, Y.; Liu, R.; Pisek, J.; Chen, J.M. Separating overstory and understory leaf area indices for global needleleaf and deciduous broadleaf forests by fusion of MODIS and MISR data. Biogeosciences 2017, 14, 1093–1110. [Google Scholar] [CrossRef]
  27. Wen, Y.; Zhuang, L.; Wang, H.; Hu, T.; Fan, W. An automated hemispherical scanner for monitoring the Leaf Area Index of forest canopies. Forests 2022, 13, 1355. [Google Scholar] [CrossRef]
  28. Mudi, S.; Paramanik, S.; Behera, M.D.; Prakash, A.J.; Deep, N.R.; Kale, M.P.; Kumar, S.; Sharma, N.; Pradhan, P.; Chavan, M.; et al. Moderate resolution LAI prediction using Sentinel–2 satellite data and indirect field measurements in Sikkim Himalaya. Environ. Monit. Assess. 2022, 194, 897. [Google Scholar] [CrossRef]
  29. Schleppi, P.; Conedera, M.; Sedivy, I.; Thimonier, A. Correcting non–linearity and slope effects in the estimation of the leaf area index of forests from hemispherical photographs. Agric. For. Meteorol. 2007, 144, 236–242. [Google Scholar] [CrossRef]
  30. Nobis, M.; Hunziker, U. Automatic thresholding for hemispherical canopy photographs based on edge detection. Agric. For. Meteorol. 2005, 128, 243–250. [Google Scholar] [CrossRef]
  31. Chen, J.M.; Cihlar, J. Quantifying the effect of canopy architecture on optical measurements of leaf area index using two gap size analysis methods. IEEE Trans. Geosci. Remote Sens. 1995, 33, 777–787. [Google Scholar] [CrossRef]
  32. Devore, J.; Farnum, N. Applied Statistics for Engineers and Scientists, 1st ed.; Duxbury Press: Belmont, CA, USA, 1999. [Google Scholar]
  33. Wang, J.; Liu, D.; Ciais, P.; Peñuelas, J. Decreasing rainfall frequency contributes to earlier leaf onset in northern ecosystems. Nat. Clim. Chang. 2022, 12, 386–392. [Google Scholar] [CrossRef]
  34. Öztürk, M.; Bolat, İ.; Ergün, A. Influence of air–soil temperature on leaf expansion and LAI of Carpinus betulus trees in a temperate urban forest patch. Agric. For. Meteorol. 2015, 200, 185–191. [Google Scholar] [CrossRef]
  35. Gressler, E.; Jochner, S.; Capdevielle-Vargas, R.M.; Morellato, L.P.C.; Menzel, A. Vertical variation in autumn leaf phenology of Fagus sylvatica L. in southern Germany. Agric. For. Meteorol. 2015, 201, 176–186. [Google Scholar] [CrossRef]
  36. Lukasová, V.; Lang, M.; Škvarenina, J. Seasonal changes in NDVI in relation to phenological phases, LAI and PAI of beech forests. Balt. For. 2014, 20, 248–262. [Google Scholar]
  37. Noda, H.M.; Muraoka, H.; Nasahara, K.N. Phenology of leaf optical properties and their relationship to mesophyll development in cool-temperate deciduous broad-leaf trees. Agric. For. Meteorol. 2021, 297, 108236. [Google Scholar] [CrossRef]
  38. Hase, N.; Doktor, D.; Rebmann, C.; Dechant, B.; Mollenhauer, H.; Cuntz, M. Identifying the main drivers of the seasonal decline of near-infrared reflectance of a temperate deciduous forest. Agric. For. Meteorol. 2022, 313, 108746. [Google Scholar] [CrossRef]
  39. Vilhar, U.; Roženbergar, D.; Simončič, P.; Diaci, J. Variation in irradiance, soil features and regeneration patterns in experimental forest canopy gaps. Ann. For. Sci. 2015, 72, 253–266. [Google Scholar] [CrossRef]
  40. Kim, J.; Ryu, Y.; Jiang, C.; Hwang, Y. Continuous observation of vegetation canopy dynamics using an integrated low-cost, near-surface remote sensing system. Agric. For. Meteorol. 2019, 264, 164–177. [Google Scholar] [CrossRef]
  41. Prévost, M.; Raymond, P. Effect of gap size, aspect and slope on available light and soil temperature after patch-selection cutting in yellow birch–conifer stands, Quebec, Canada. For. Ecol. Manag. 2012, 274, 210–221. [Google Scholar] [CrossRef]
  42. Horváth, C.V.; Kovács, B.; Tinya, F.; Locatelli, J.S.; Németh, C.; Crecco, L.; Illés, G.; Csépányi, P.; Ódor, P. A matter of size and shape: Microclimatic changes induced by experimental gap openings in a sessile oak–hornbeam forest. Sci. Total Environ. 2023, 873, 162302. [Google Scholar] [CrossRef]
  43. Klosterman, S.T.; Hufkens, K.; Gray, J.M.; Melaas, E.; Sonnentag, O.; Lavine, I.; Mitchell, L.; Norman, R.; Friedl, M.A.; Richardson, A.D. Evaluating remote sensing of deciduous forest phenology at multiple spatial scales using PhenoCam imagery. Biogeosciences 2014, 11, 4305–4320. [Google Scholar] [CrossRef]
  44. Nezval, O.; Krejza, J.; Světlík, J.; Šigut, L.; Horáček, P. Comparison of traditional ground-based observations and digital remote sensing of phenological transitions in a floodplain forest. Agric. For. Meteorol. 2020, 291, 108079. [Google Scholar] [CrossRef]
  45. Hofmeister, J.; Hošek, J.; Brabec, M.; Střalková, R.; Mýlová, P.; Bouda, M.; Pettit, J.L.; Rydval, M.; Svoboda, M. Microclimate edge effect in small fragments of temperate forests in the context of climate change. For. Ecol. Manag. 2019, 448, 48–56. [Google Scholar] [CrossRef]
  46. Greiser, C.; Hederová, L.; Vico, G.; Wild, J.; Macek, M.; Kopecký, M. Higher soil moisture increases microclimate temperature buffering in temperate broadleaf forests. Agric. For. Meteorol. 2024, 345, 109828. [Google Scholar] [CrossRef]
  47. Meeussen, C.; Govaert, S.; Vanneste, T.; Bollmann, K.; Brunet, J.; Calders, K.; Cousins, S.A.O.; De Pauw, K.; Diekmann, M.; Gasperini, C.; et al. Microclimatic edge-to-interior gradients of European deciduous forests. Agric. For. Meteorol. 2021, 311, 108699. [Google Scholar] [CrossRef]
  48. Abd Latif, Z.; Blackburn, G.A. The effects of gap size on some microclimate variables during late summer and autumn in a temperate broadleaved deciduous forest. Int. J. Biometeorol. 2010, 54, 119–129. [Google Scholar] [CrossRef]
  49. Song, Y.; Ryu, Y. Seasonal changes in vertical canopy structure in a temperate broadleaved forest in Korea. Ecol. Res. 2015, 30, 821–831. [Google Scholar] [CrossRef]
  50. von Arx, G.; Pannatier, E.G.; Thimonier, A.; Rebetez, M. Microclimate in forests with varying leaf area index and soil moisture: Potential implications for seedling establishment in a changing climate. J. Ecol. 2013, 101, 1201–1213. [Google Scholar] [CrossRef]
  51. Meijers, E.; Groenewoud, R.; de Vries, J.; van der Zee, J.; Nabuurs, G.J.; Vos, M.; Sterck, F. Canopy cover at the crown-scale best predicts spatial heterogeneity of soil moisture within a temperate Atlantic forest. Agric. For. Meteorol. 2025, 363, 110431. [Google Scholar] [CrossRef]
  52. Bolat, İ.; Kara, Ö.; Öztürk, M. Short-term changes of leaf area index, light transmission, and gap in a temperate mixed deciduous forest ecosystem in Bartın, Turkey. Turk. J. Agric. For. 2016, 40, 597–605. [Google Scholar] [CrossRef]
  53. Schleppi, P.; Thimonier, A.; Walthert, L. Estimating leaf area index of mature temperate forests using regressions on site and vegetation data. For. Ecol. Manag. 2011, 261, 601–610. [Google Scholar] [CrossRef]
  54. Chen, J.; Shao, C.; Jiang, S.; Qu, L.; Zhao, F.; Dong, G. Effects of changes in precipitation on energy and water balance in a Eurasian meadow steppe. Ecol. Process. 2019, 8, 17. [Google Scholar] [CrossRef]
  55. Wang, X.; Fan, K.; Yan, Y.; Chen, B.; Yan, R.; Xin, X.; Li, L. Controls of Seasonal and Interannual Variations on Soil Respiration in a Meadow Steppe in Eastern Inner Mongolia. Agronomy 2023, 13, 20. [Google Scholar] [CrossRef]
Figure 1. Location of study area (3D) with forest patch and meadow field in Bartın Stream Watershed, Türkiye.
Forests 16 00904 g001
Figure 2. Height and DBH of tree and shrub species, as well as their distances and direction angles from associated canopy points.
Forests 16 00904 g002
Figure 3. Above: Six canopy points within interior parts (left) and three canopy points within edge (right) of forest patch, along with their surrounding tree and shrub species and their distances and directions to these canopy projection points. Below: 3D view of all nine canopy points with representative 3D trees and shrubs, considering their scaled heights.
Forests 16 00904 g003
Figure 4. Air–soil (−10 cm) temperature and precipitation data from Kozcağız and Bartın meteorological stations over one year (between 1 November 2023 and 31 October 2024).
Forests 16 00904 g004
Figure 5. Intra-annual (between 11 November 2023 and 7 October 2024) patterns of LAI (m2 m−2) for each canopy point in interior parts (16) and edge (79) of forest patch.
Forests 16 00904 g005
Figure 6. Intra-annual (between 11 November 2023 and 7 October 2024) courses of mean LT, CO, and GF for interior parts (1–6) and edge (7–9) of forest patch.
Forests 16 00904 g006
Figure 7. Soil temperature, soil moisture, and precipitation courses for each canopy point in interior parts (1–6) and edge (7–9) of forest patch between 24 April and 26 October 2024.
Forests 16 00904 g007
Figure 8. Soil temperature and soil moisture patterns for 10 points in the meadow field between 24 April and 21 May 2024.
Forests 16 00904 g008
Disclaimer/Publisher’s Note: The statements, opinions and data contained in all publications are solely those of the individual author(s) and contributor(s) and not of MDPI and/or the editor(s). MDPI and/or the editor(s) disclaim responsibility for any injury to people or property resulting from any ideas, methods, instructions or products referred to in the content.

