Article

Assessing Climate Change Risks and Conservation Needs for Carpinus Species in China Using Ensemble Distribution Modeling

1
State Key Laboratory of Tree Genetics and Breeding, Co-Innovation Center for Sustainable Forestry in Southern China, College of Ecology and Environment, Nanjing Forestry University, Nanjing 210037, China
2
Key Laboratory of Bio-Resource and Eco-Environment of Ministry of Education, College of Life Sciences, Sichuan University, Chengdu 610065, China
*
Author to whom correspondence should be addressed.
These authors contributed equally to this work.
Forests 2025, 16(6), 888; https://doi.org/10.3390/f16060888 (registering DOI)
Submission received: 28 April 2025 / Revised: 21 May 2025 / Accepted: 23 May 2025 / Published: 24 May 2025
(This article belongs to the Section Forest Ecology and Management)

Abstract

:
Climate change is reshaping the distribution of forest species globally, yet its effects on the temperate tree genus Carpinus in China remain understudied. This study used an ensemble species distribution modeling framework to predict current and future suitable habitats for 32 Carpinus taxa under three shared socioeconomic pathway (SSP) climate scenarios for the 2090s. Five algorithms were integrated, and models with high predictive performance (AUC > 0.9) were used to generate ensemble forecasts. The ensemble models achieved AUC values no lower than 0.987 and TSS values no lower than 0.904. The results showed a clear trend of northwestward and upslope range shifts, with substantial habitat contractions under high-emission scenarios. Temperature seasonality and annual precipitation were identified as key environmental drivers. Two narrowly distributed species, C. omeiensis and C. londoniana var. lanceolata, are projected to lose all suitable habitats under SSP585, indicating a high extinction risk. These findings emphasize the importance of integrating climate-based risk assessments into conservation strategies and highlight the need to prioritize vulnerable species and high-elevation refugia to safeguard the long-term persistence of Carpinus diversity in China.

1. Introduction

Global climate change is expected to have profound impacts on biodiversity, altering the distribution of numerous plant species. As greenhouse gas emissions rise, the global climate continues to warm, with recent projections indicating a potential increase of 3–5 °C in average temperature by the end of this century under high-emission scenarios [1]. Such rapid warming is already driving shifts in species ranges, as many organisms migrate to higher latitudes and elevations to track suitable climates [2,3]. These distributional shifts can lead to habitat contraction and pose a heightened risk of extinction, particularly for species with limited dispersal abilities or narrow ecological requirements [4,5,6]. In response to these trends, ecologists are increasingly applying modeling approaches to predict how the suitable habitat ranges of species may change under future climate scenarios, thereby providing critical insights for biodiversity conservation and spatial planning in the context of climate change [7,8].
Species distribution models (SDMs) are widely recognized as essential tools for forecasting the ecological consequences of climate change [9]. By linking species occurrence records with environmental variables, these models can estimate both current and future habitat suitability, offering critical insights for biodiversity conservation and climate adaptation planning [10,11]. SDMs have been widely applied to model the distributions of rare and endangered species, invasive plants, and taxa sensitive to climate variability [12,13,14]. Traditionally, single-algorithm approaches such as MaxEnt have been widely used due to their accessibility and performance with limited data [15,16]. However, growing concerns about model uncertainty and algorithm-specific biases have led to increased adoption of ensemble modeling frameworks that integrate predictions from multiple algorithms [17,18]. Different SDM algorithms may produce inconsistent predictions due to their distinct assumptions and model structures. To address this, ensemble approaches allow researchers to compare and combine multiple models, thereby reducing algorithm-specific bias and improving prediction robustness [17,19]. These approaches have demonstrated greater robustness and generalizability, particularly under complex climate scenarios [20,21]. One widely used platform is the R package biomod2, which enables ensemble forecasting using methods such as random forests, MaxEnt, and neural networks [22,23]. By combining the strengths of diverse algorithms, ensemble models can reduce predictive uncertainty and enhance the reliability of species distribution projections under future environmental change [24,25].
The genus Carpinus L. (hornbeams, family Betulaceae) comprises deciduous hardwood trees that may be particularly vulnerable to the effects of ongoing climate change. It contains approximately 50 species worldwide, with 33 species recorded in China, of which 27 are considered endemic [26,27]. Species of Carpinus are broadly distributed across temperate and subtropical forest zones in China, with diversity hotspots located in montane regions [28]. Many species within the genus Carpinus have relatively narrow geographic distributions and are restricted to fragmented ecosystems, which makes them highly susceptible to environmental disturbances. In China, this vulnerability is particularly prominent because several species are confined to localized habitats and have small, isolated populations. For example, C. tientaiensis and C. putoensis are critically endangered, with extremely limited natural ranges and a high degree of habitat specificity [29,30,31]. Although the genus is ecologically important as a foundational component of forest ecosystems and as a source of both ornamental and timber resources, few studies have investigated how climate change may influence the distribution of these species under future scenarios. Most existing research has focused on individual species or regional scales [29,32,33,34], which results in a limited understanding of the potential distributional shifts of Carpinus across the full geographic extent of China.
In this study, we compiled occurrence records for 32 Carpinus taxa across China and extracted associated climate variables. We applied an ensemble species distribution modeling approach, integrating five algorithms, to achieve three primary objectives: (1) identify the key climatic variables shaping the current distributions of Carpinus taxa, (2) predict potential shifts in their suitable habitats under three future climate scenarios (SSP126, SSP370, and SSP585) for the 2090s, and (3) quantify geographic centroid displacement of each taxon to assess the magnitude and direction of their projected range shifts. Our results will provide scientific support for biodiversity conservation and sustainable forest management strategies for Carpinus species in the context of ongoing climate change.

2. Material and Methods

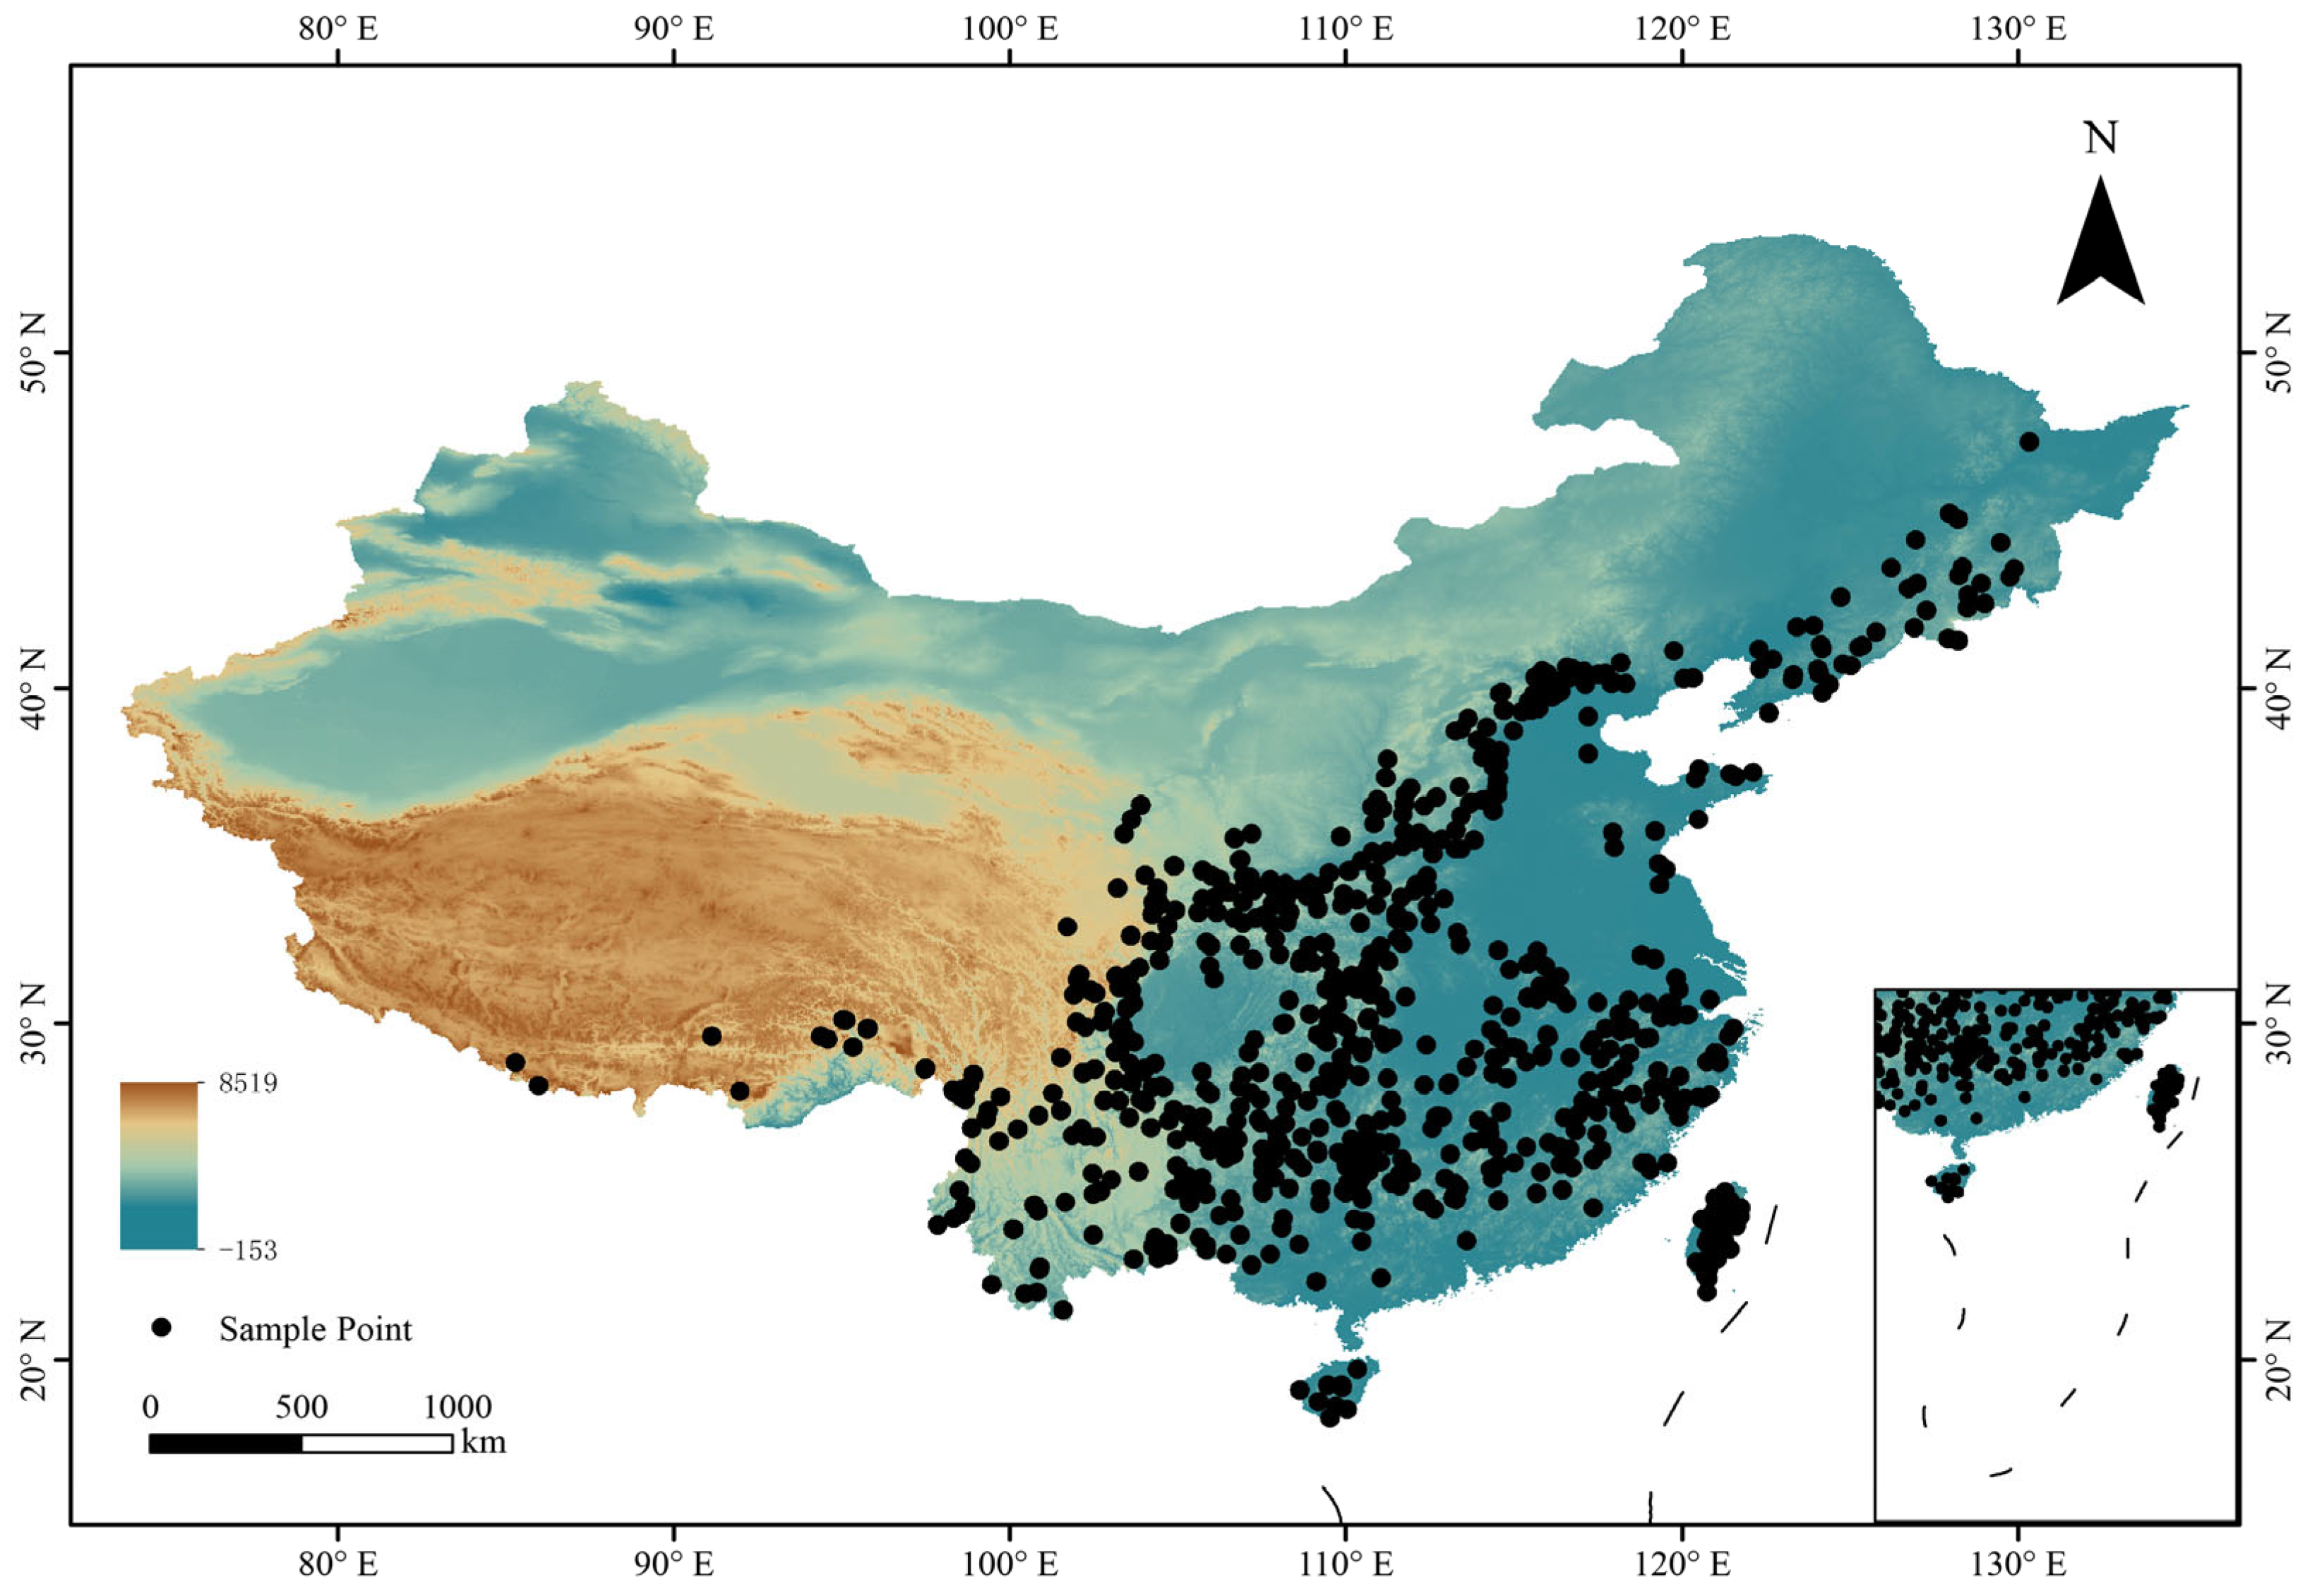
2.1. Species Distribution Data

In this study, all Carpinus species distributed in China were selected as the target taxa. Species occurrence data were obtained from the Global Biodiversity Information Facility (GBIF; https://www.gbif.org/, accessed on 25 February 2025). To improve data accuracy, we referenced the species distribution information provided in the Flora of China [26] and removed outlier records that clearly fell outside the known range. Duplicate records within a 2.5 arc-minutes grid cell were eliminated to reduce spatial autocorrelation. To minimize the effects of spatial sampling bias and reduce spatial autocorrelation among occurrence records, we performed spatial rarefaction prior to modeling. We used the R package “spThin” v0.2.0 to spatially rarefy the occurrence points of each species. A thinning distance of 10 km was applied, which corresponds approximately to the spatial resolution of the environmental variables (~2.5 arc-minutes). In addition, species with fewer than five valid occurrence records were excluded from the analysis. After data filtering, a total of 32 species were retained for modeling. The final species occurrence data are shown in Figure 1.

2.2. Environmental Variables

We downloaded 19 bioclimatic variables at a 2.5 arc-minutes resolution for the period of 1970–2000 as current environmental variables from the WorldClim 2.1 dataset (https://worldclim.org/, accessed on 25 February 2025) (Table S1) [35]. For future climate scenarios, we used the medium-resolution Beijing Climate Center Climate System Model (BCC-CSM2-MR) from WorldClim 2.1, which provides projections under three shared socioeconomic pathways (SSPs): SSP126, SSP370, and SSP585. Environmental variables for the 2090s (2081–2100) under the three climate scenarios were selected at a spatial resolution of 2.5 arc-minutes. This time frame was chosen to capture the long-term effects of climate change on the distribution of Carpinus species. Additionally, the magnitude of projected climatic changes during this period is greater than in mid-century projections, enabling a clearer assessment of potential habitat shifts.

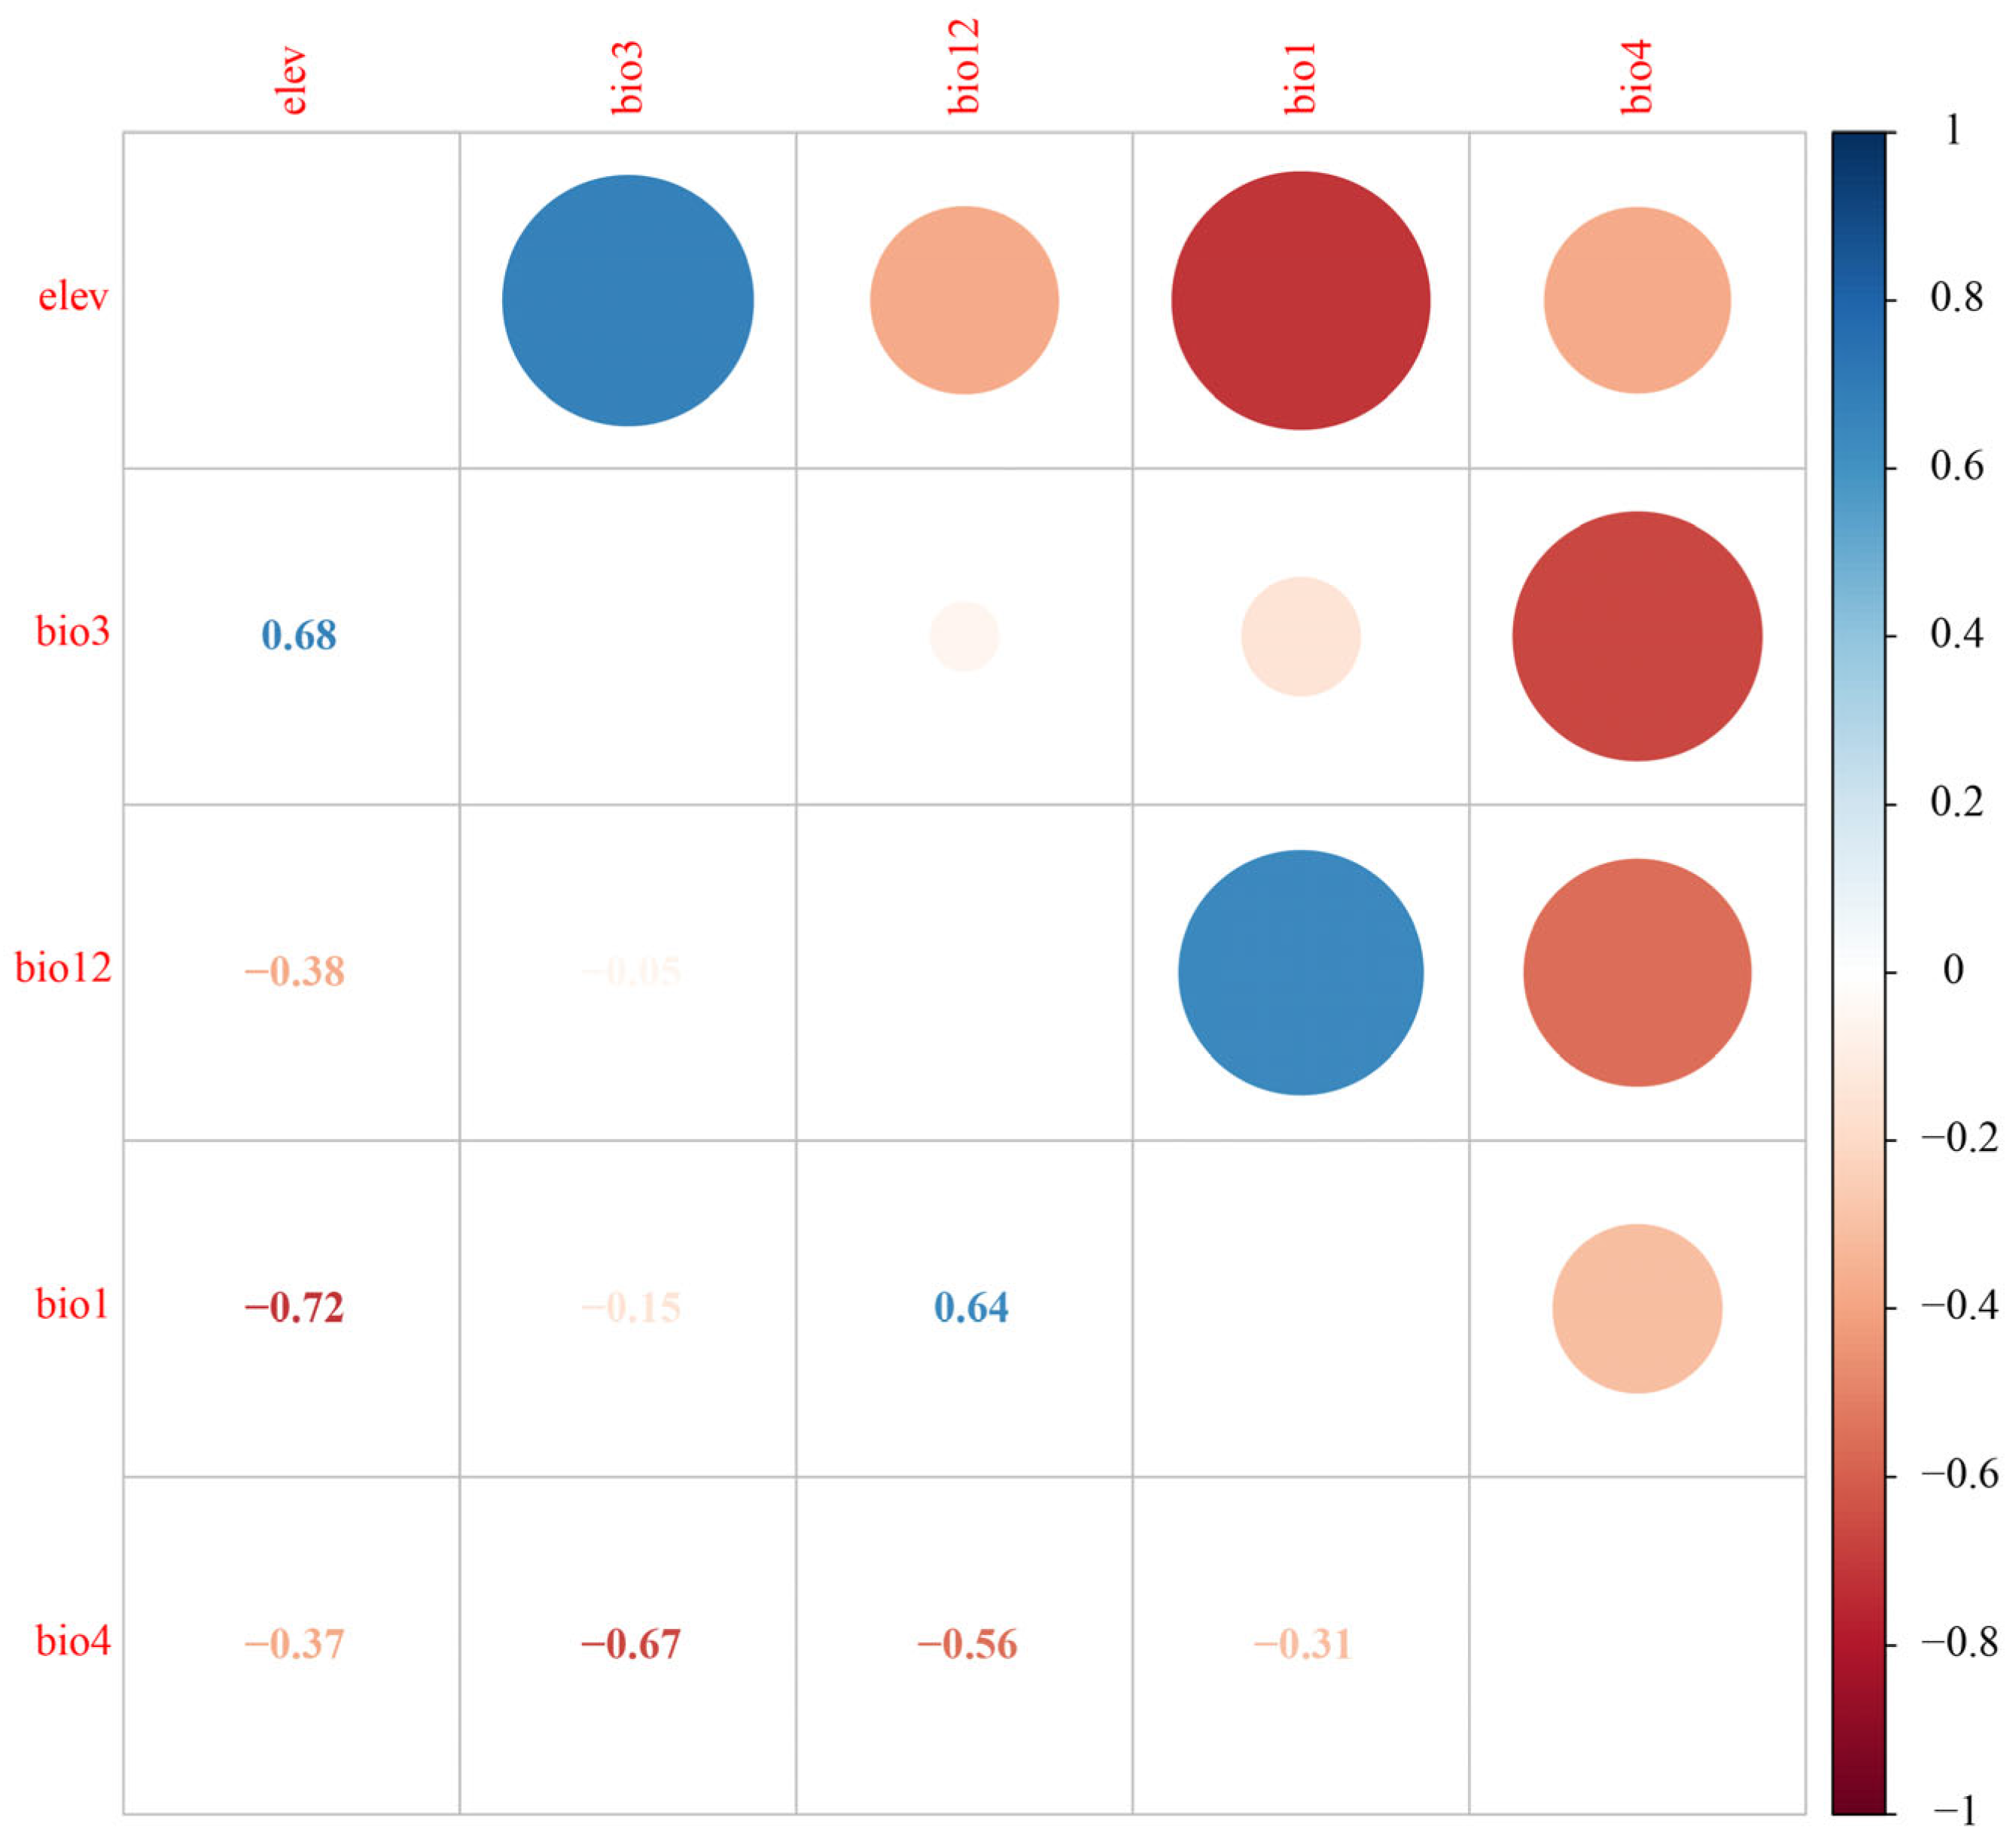
2.3. Key Environmental Variable Selection

To reduce the risk of overfitting and improve model generalizability, it is essential to avoid including strongly correlated environmental variables in species distribution modeling [36]. In this study, we selected a set of general environmental variables applicable across all taxa, considering the broad taxonomic scope. Pearson correlation coefficients were calculated to assess pairwise relationships among variables. When the absolute value of the correlation coefficient exceeded 0.8 (|r| > 0.8), one variable from each correlated pair was retained based on ecological relevance and interpretability (Figure S1). This correlation analysis was visualized using the R package “corrplot” v0.94. The final set of non-redundant environmental variables was used in the subsequent modeling (Table 1). AUCdiff is commonly used to assess model overfitting [37,38]. Here, we also used AUCdiff to assess whether the models constructed with the selected variables exhibited signs of overfitting.

2.4. Species Distribution Modeling

Species distribution models were constructed using the R package “biomod2” v4.2-5-2 [23]. Five algorithms were employed: artificial neural networks (ANN), multivariate adaptive regression splines (MARS), random forests (RF), maximum entropy (MAXENT), and extreme gradient boosting (XGBOOST). For each species, 80% of the occurrence data were randomly selected for training and the remaining 20% for testing. The modeling process was repeated five times to ensure robustness. Model performance was evaluated using the area under the receiver operating characteristic curve (AUC). Models with an average AUC score greater than 0.9 were retained and used for ensemble forecasting. The final ensemble model (EM) was built by integrating predictions from the retained algorithms for each species. These EMs were used to estimate both current and future potential distributions across different climate scenarios.

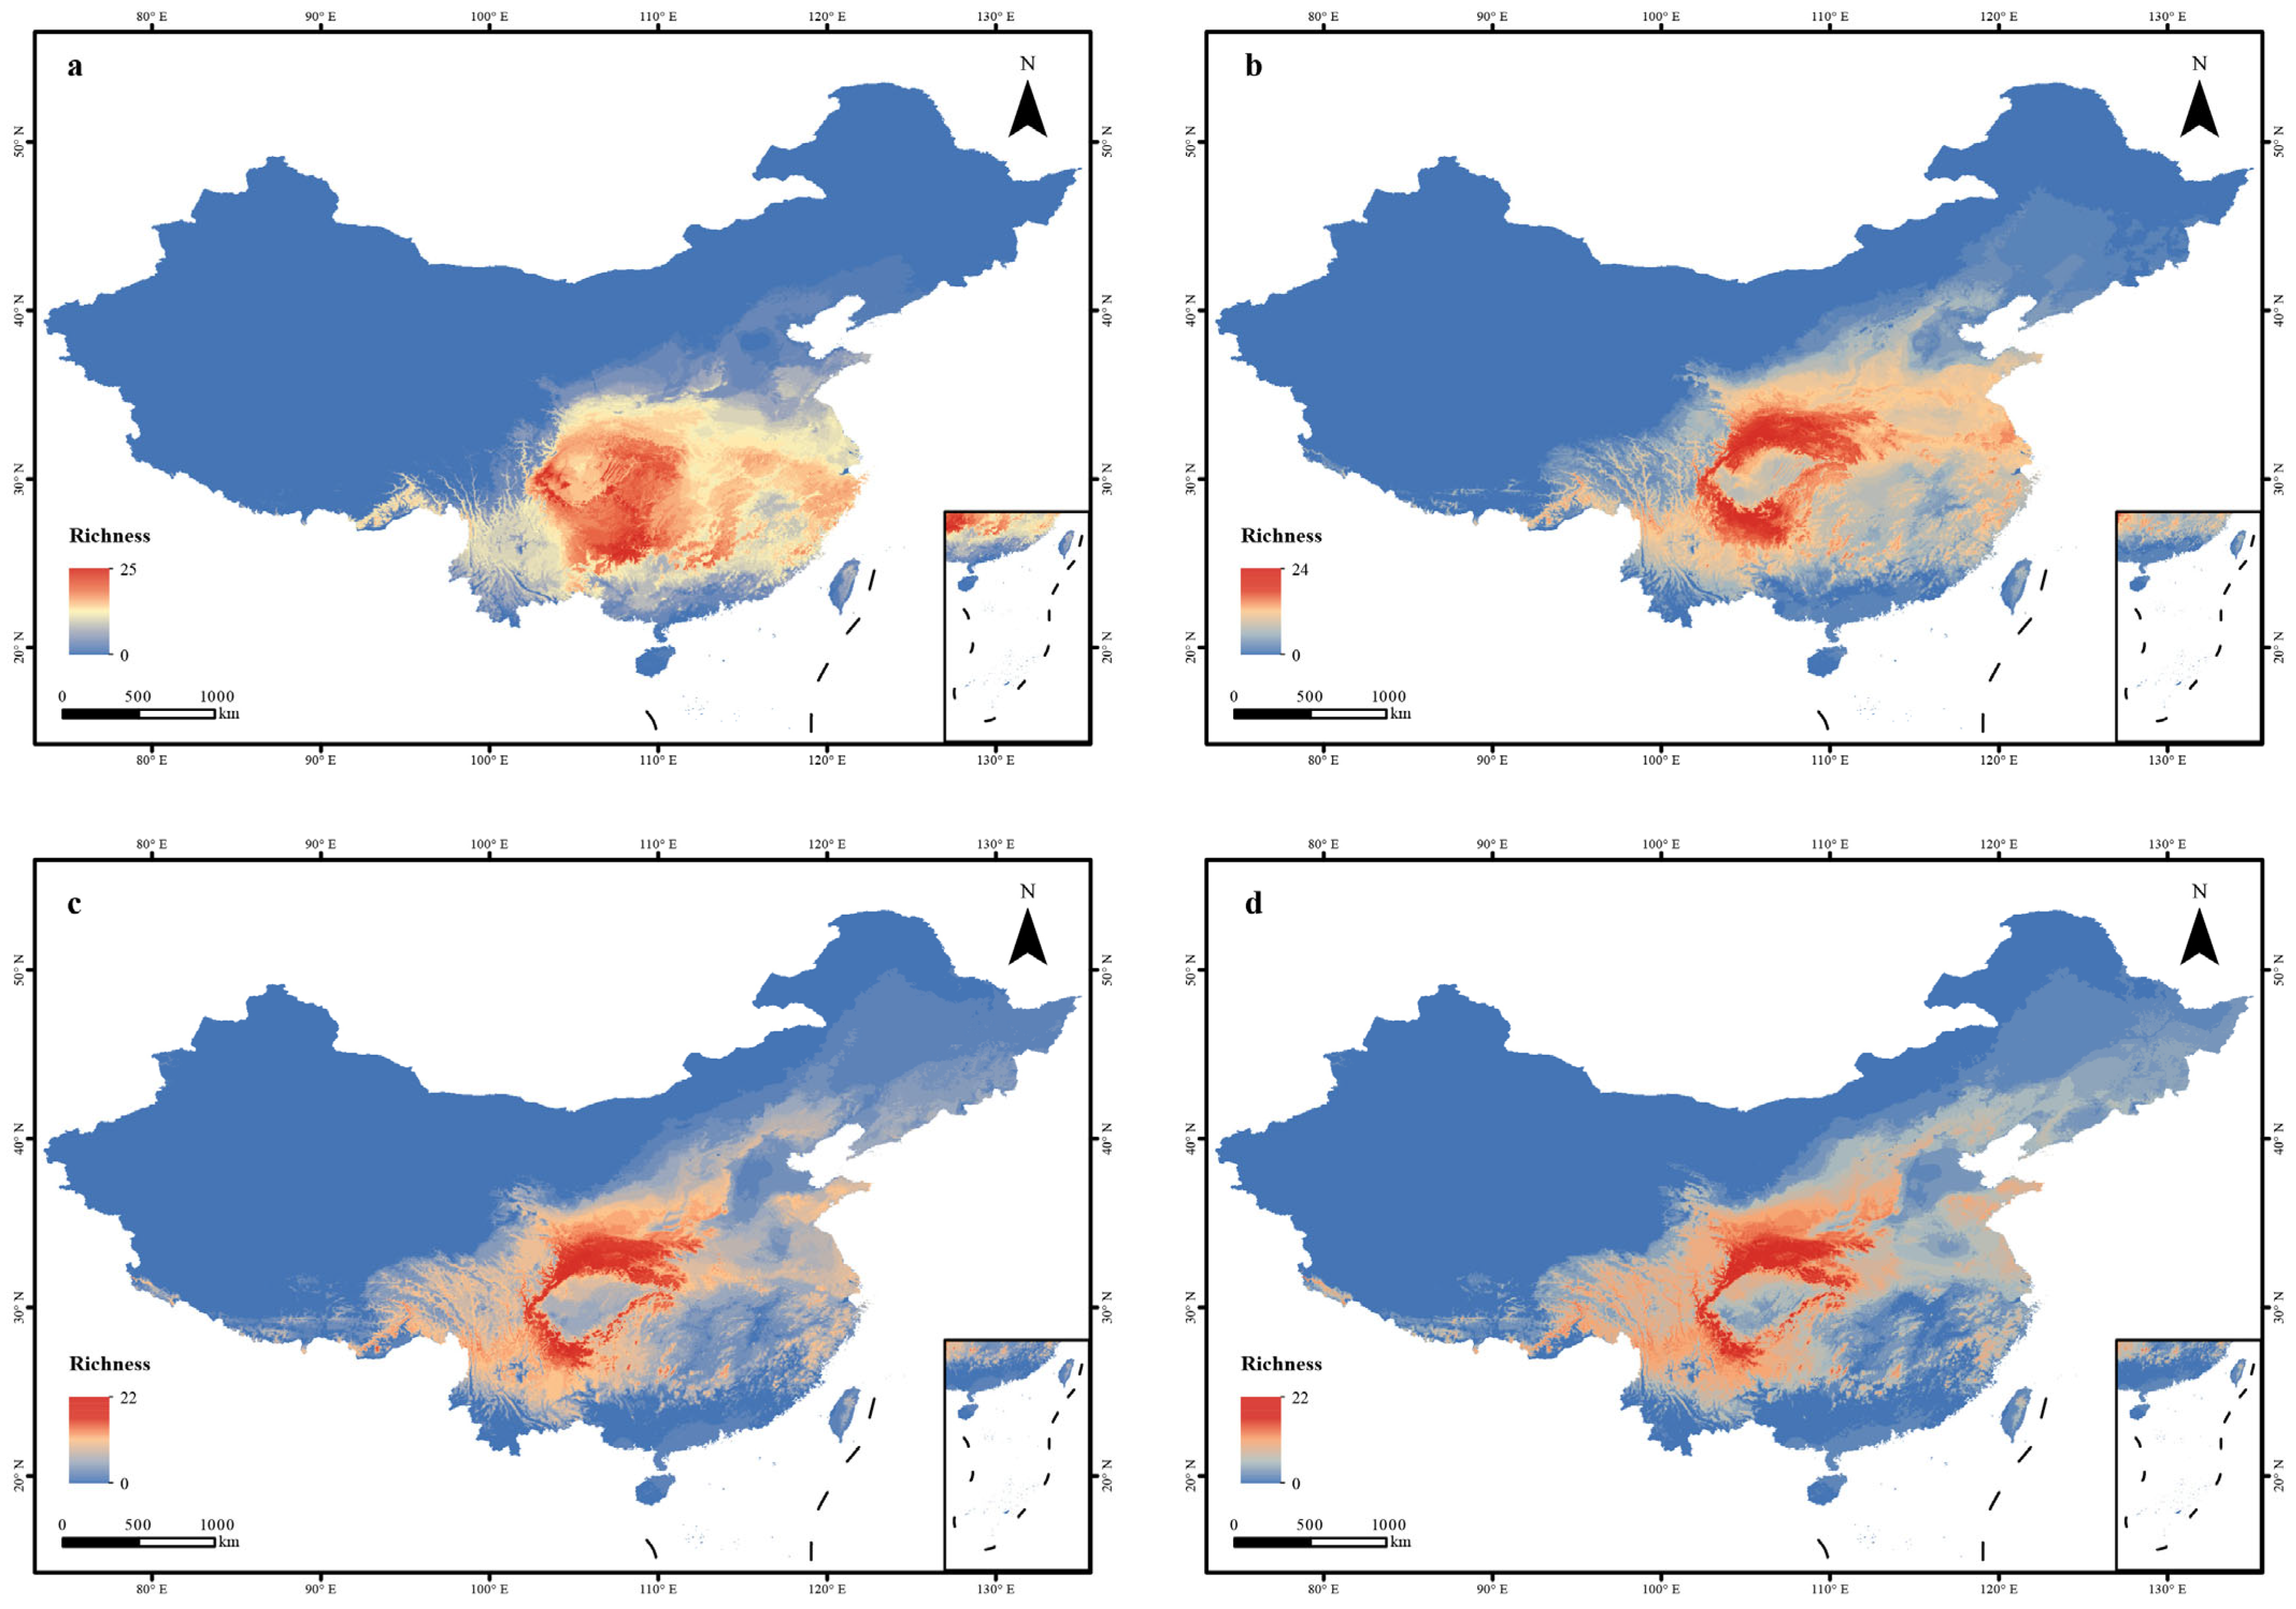
2.5. Species Richness Visualization

To visualize spatial patterns of Carpinus species richness, we first converted the continuous ensemble predictions into binary presence-absence maps. For each species, a threshold value was defined as the mean predicted suitability across known occurrence points minus one standard deviation. Grid cells with suitability values greater than this threshold were classified as suitable, while those below were treated as unsuitable. Binary distribution layers for all species were overlaid in ArcGIS v10.8 to generate multi-species richness maps under current and future scenarios (SSP126, SSP370, and SSP585). The resulting maps depict the number of Carpinus species predicted to coexist in each grid cell, allowing visualization of potential shifts in regional species accumulation patterns.

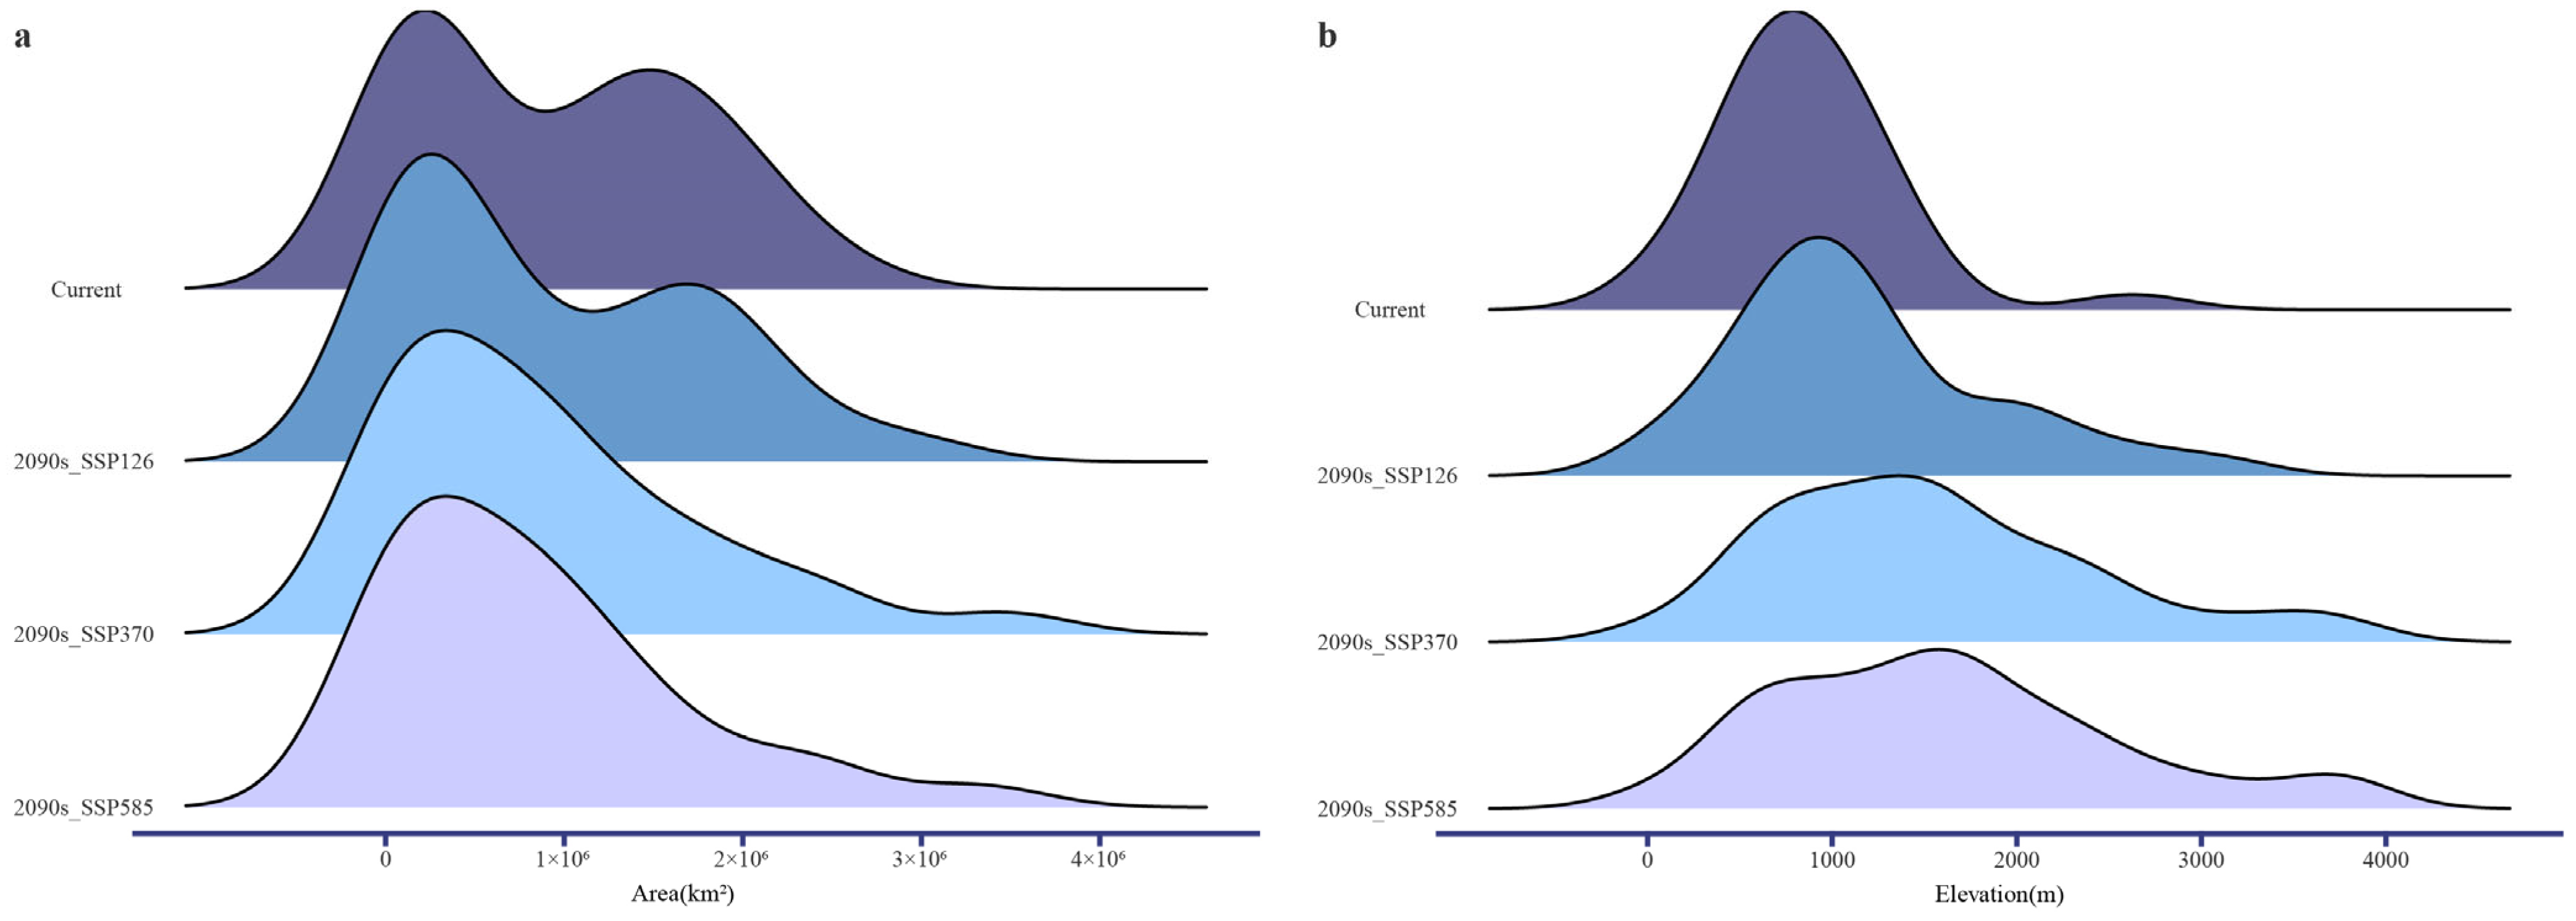
2.6. Analysis of Projected Range Area and Elevational Change

For each Carpinus species, we quantified the total area and mean elevation of suitable habitats under current and future climate scenarios (SSP126, SSP370, SSP585). These values were derived from the binary distribution maps based on ensemble model outputs. Grid cells predicted as suitable were identified, and the total area was computed by multiplying the number of these cells by the area represented by each grid (approximately 21.6 km² per 2.5 arc-minute cell). Elevation values were extracted from the WorldClim elevation dataset, and mean elevation was calculated by averaging values across all suitable grid cells for each species in each scenario.
To explore scenario-based differences, distributions of projected habitat area and elevation across all species were visualized using ridgeline plots. These plots were created in R v4.3.2 using the ggplot2 v3.5.1 and ggridges v0.5.6 packages. We also compared current and future values of suitable area and mean elevation to identify changes in range size and altitudinal distribution. For each species, habitat change was classified into expansion, contraction, or total loss, and elevational shifts were categorized as increases or decreases. These classifications were summarized by scenario for all species.

2.7. Centroid Shift Analysis

To assess spatial displacement in predicted species distributions, we calculated the centroid of suitable habitat for each Carpinus species under current and future climate scenarios. Centroid coordinates were computed as the arithmetic mean of the latitudes and longitudes of all grid cells classified as suitable in the binary maps.
The straight-line distance between current and future centroids of each species was calculated using the geosphere v1.5.18 and raster v3.6.26 packages in R. Additionally, directional shifts were derived based on changes in longitude and latitude coordinates. These results were further processed and visualized in ArcGIS v10.8 to display the magnitude and orientation of distributional movements.

3. Results

3.1. Model Accuracy and Key Environmental Variables

A total of 32 Carpinus taxa were selected for modeling based on filtered distribution records obtained from the Global Biodiversity Information Facility (GBIF). After removing duplicate points within 2.5 arc-minute grid cells and excluding taxa with fewer than five records, the final dataset covered a wide range of Carpinus diversity across China. The number of valid occurrence records per taxon ranged from 5 to 282 (Table 2), with distributions concentrated in central and southern China. A map of all occurrence records is shown in Figure 1.
Prior to model construction, we selected a set of five ecologically relevant variables using Pearson correlation analysis, with a threshold of |r| > 0.8 to reduce multicollinearity to eliminate highly correlated variables (Figure S1). Specifically, annual mean temperature (bio1), isothermality (bio3), temperature seasonality (bio4), annual precipitation (bio12), and elevation (elev) were retained for subsequent modeling (Figure 2, Table 2). These variables were used consistently across all species and algorithms. Meanwhile, models using the selected variables showed significantly lower AUCdiff values than those using all variables (p < 0.001), indicating a lower degree of overfitting (Figure S2).
To assess the predictive performance of the species distribution models, five algorithms were initially used for each taxon. Models with an area under the receiver operating characteristic curve (AUC) greater than 0.9 were retained and subsequently integrated into an ensemble model (EM). The ensemble models achieved AUC values no lower than 0.987 and TSS values no lower than 0.904. Due to variations in sample size and ecological characteristics, the models incorporated into the ensemble differed among species. However, the ensemble models consistently outperformed or matched the best individual models in terms of AUC and TSS scores, highlighting their predictive robustness and reduced algorithmic bias (Figure 3).

3.2. Predicted Changes in Species Distributions Under Future Climate Scenarios

The ensemble models were then used to project the potential distributions of all Carpinus taxa under three SSP climate scenarios for the 2090s. Model outputs revealed substantial changes in habitat suitability for most species under all scenarios (Figure 4). Projected distributions exhibit a clear northwestward shift, accompanied by upward elevational trends. Under SSP370 and SSP585, suitable habitats in lowland regions are largely lost, while areas in the Qilian Mountains and the Hengduan Mountains become critical refugia. These spatial shifts indicate a contraction in climatically suitable zones for many species, especially under high-emission scenarios.
The total area of suitable habitat declined under future conditions, with the most pronounced losses occurring under SSP585 (Figure 5). The average elevation also increased across most species, indicating upslope shifts. While several species maintained stable or slightly expanded ranges under SSP126, more than half experienced habitat contraction under SSP585. Notably, C. omeiensis and C. londoniana var. lanceolata were projected to lose all suitable habitats (Table 3), suggesting a particularly high extinction risk. Elevational shifts were widespread across species, with most showing upward movement in mean elevation under all scenarios (Table 4).
In addition, we analyzed the relative contributions of the five selected environmental variables to the distribution models. Temperature-related factors, particularly temperature seasonality (bio4), exhibited the highest contributions across species, followed by annual precipitation (bio12) (Figure 6). While other variables such as annual mean temperature (bio1), isothermality (bio3), and elevation also contributed to predictions, their importance was generally lower and more variable among species. These results suggest that both thermal and moisture-related factors are primary determinants of Carpinus distribution patterns under changing climate conditions.

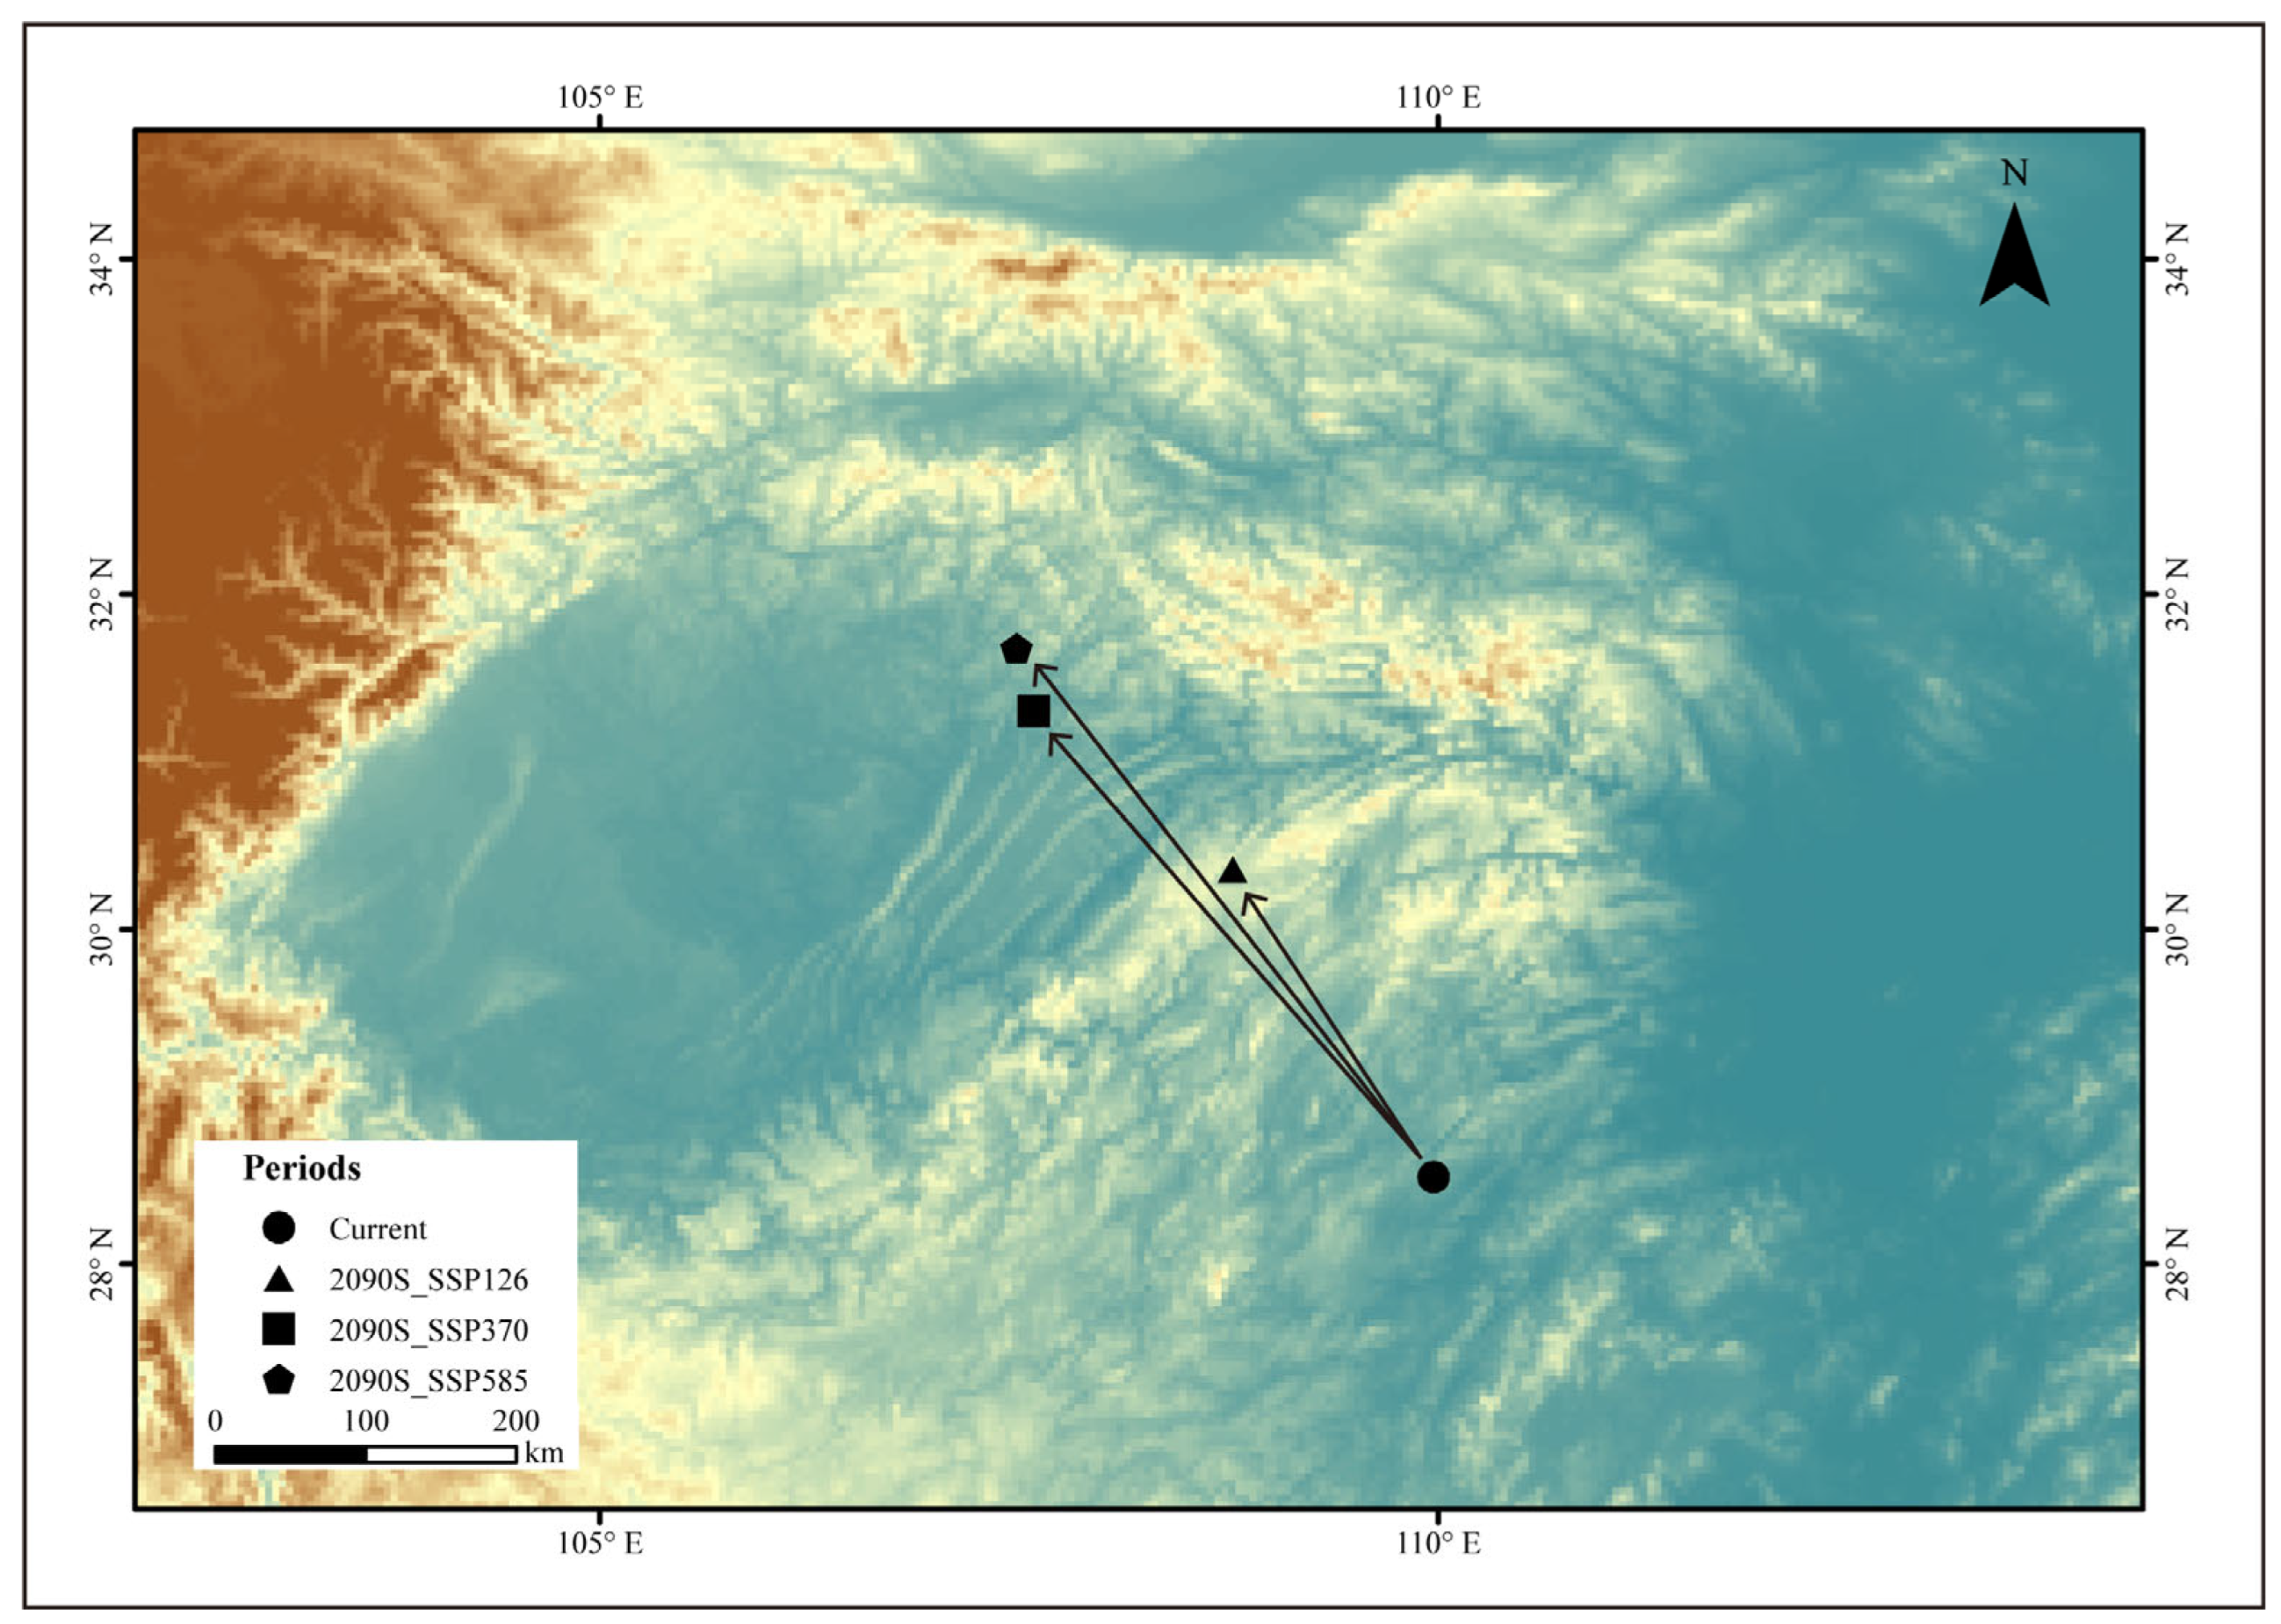
3.3. Centroid Shift Under Climatic Scenarios

To assess the spatial dynamics of Carpinus under future climate scenarios, we calculated the geographic centroid of suitable habitats across all species under current conditions and compared it to projections for the 2090s. A clear northwestward shift in the overall distribution centroid was observed, with the displacement magnitude increasing with emission intensity (Figure 7). The average centroid shift across all taxa reached approximately 234 km under SSP126, 385 km under SSP370, and exceeded 420 km under SSP585 (Table S2).
Species-specific differences in centroid movement were notable. For example, C. londoniana exhibited the greatest shift, with a projected displacement of over 1100 km under SSP585, reflecting both extensive habitat redistribution and a wide baseline distribution range. In contrast, C. kawakamii showed the smallest shift, with its centroid moving only about 239 km under the same scenario (Table S2).
These results indicate a spatial redistribution of suitable habitats for Carpinus species toward northwestern regions and higher elevations under intensified warming. The variation in both magnitude and direction of centroid displacement among species reflects differences in climatic sensitivity across members of the genus.

4. Discussion

This study provides a comprehensive assessment of the potential impacts of climate change on the geographic distribution of Carpinus species in China using ensemble species distribution models. Our results indicate that, under future climate scenarios, most Carpinus species are likely to experience reductions in suitable habitat area, upward shifts in elevational range, and spatial displacement toward the northwest. These patterns were especially pronounced under high-emission scenarios, suggesting a strong sensitivity of the genus to temperature and precipitation changes. By integrating species-level predictions across multiple climate scenarios, this study not only reveals consistent biogeographic trends but also identifies species at elevated risk of habitat loss or extinction. Moreover, our analysis highlights the dominant role of temperature seasonality and annual precipitation in shaping habitat suitability across the genus. Together, these findings provide an important scientific basis for understanding the future ecological trajectories of Carpinus and for informing conservation strategies under global climate change.

4.1. Model Performance and Advantages of Ensemble Modeling

The ensemble modeling framework employed in this study yielded robust predictive performance across the 32 Carpinus taxa. All models included in the ensemble met a high-performance threshold (AUC > 0.9), ensuring the reliability of the component algorithms. However, the ensemble model (EM) demonstrated advantages beyond individual model accuracy. Compared with single algorithms such as MaxEnt, EMs provided more consistent predictions and higher TSS values across species, indicating improved generalizability and reduced algorithm-specific bias (Figure 3). By combining multiple modeling algorithms including random forests, neural networks, MaxEnt, MARS, and XGBoost through the biomod2 platform, we leveraged the complementary strengths of different methods and produced more stable predictions [20,23].
Previous studies have shown that ensemble modeling approaches generally outperform single-model techniques in species distribution modeling, especially under conditions of limited data or high environmental variability [17,39,40]. By adopting a threshold-based selection of high-performing models (AUC > 0.9), this study further ensured the robustness of the ensemble outputs. The consistent performance of ensemble models across species in this study supports the validity of our predicted distributional changes and provides a solid foundation for interpreting potential climate-driven range shifts and conservation risks.

4.2. Climate-Driven Shifts in Suitable Habitat and Key Environmental Drivers

Our projections revealed that most Carpinus species are likely to experience habitat contraction and spatial redistribution under future climate scenarios, with suitable ranges shifting toward northwestern regions and higher elevations. These shifts are consistent with well-documented patterns of climate-driven range movement observed in temperate forest species worldwide, where rising temperatures and changing precipitation regimes have prompted many taxa to track suitable climate conditions along latitudinal and elevational gradients [41,42]. Elevational displacement was particularly evident, as most species showed upward shifts in mean elevation between current and future projections (Figure 5). This pattern may reflect the thermal sensitivity of Carpinus species, many of which are adapted to cool-temperate forest environments. As warming progresses, previously suitable lowland areas may become too warm or dry, forcing species to track cooler conditions at higher altitudes.
Environmental variable contribution analysis revealed that temperature seasonality (bio4) was the dominant factor shaping species distributions, followed by annual precipitation (bio12) (Figure 6). The high contribution of bio4 suggests that Carpinus species are more responsive to climatic variability than to absolute thermal values. This aligns with ecological niche theory, which posits that species distributions are constrained not only by average conditions but also by seasonal extremes [43,44]. Precipitation played a secondary but still important role, particularly in species occurring in transitional zones between humid subtropical and temperate climates. Other variables such as mean annual temperature (bio1), isothermality (bio3), and elevation made relatively minor contributions, and their influence varied across species. This heterogeneity may reflect differing ecological tolerances among the species, or the influence of local topography and microclimate buffering. Overall, the findings suggest that the spatial distribution of Carpinus species under climate change is primarily driven by seasonal temperature variability and precipitation availability, rather than static geographic constraints.

4.3. Climate-Associated Habitat Loss and Conservation Risk in Vulnerable Species

Substantial reductions in suitable habitat areas under future climate scenarios may significantly increase extinction risk for certain Carpinus species, particularly those with narrow ecological niches and restricted geographic distributions. Among the species examined, C. omeiensis and C. londoniana var. lanceolata are of particular concern, as they are projected to lose all suitable habitat by the 2090s under SSP585 (Table 3). Their limited distribution and confinement to high-elevation environments make them especially vulnerable to ongoing climate change. One key factor exacerbating this risk is the projected elevational displacement of suitable conditions. As Carpinus species shift toward higher altitudes to track favorable thermal environments, many may encounter spatial limitations due to topographic constraints. This phenomenon, often described as the “mountain-top extinction” effect, has been observed in a range of montane plant lineages under accelerated climate change [45,46]. For narrowly distributed species with limited upslope space, such as C. omeiensis, this pattern is particularly concerning.
These ecological patterns emphasize the need for conservation strategies that are both spatially explicit and species-specific. Future conservation planning should prioritize climatically stable regions that may serve as refugia, particularly in mountain ranges such as the Hengduan Mountains and Qilian Mountains, where model projections suggest persistent habitat suitability. In addition, integrating biological traits such as dispersal ability, reproductive timing, and habitat specialization can help identify which species are most vulnerable and provide a basis for more targeted conservation actions. In extreme cases where no suitable future habitat is predicted, conventional conservation measures may be inadequate. Assisted migration, ex situ preservation, and habitat manipulation could serve as complementary approaches to prevent irreversible biodiversity loss. Notably, some Carpinus species such as C. putoensis and C. tientaiensis have already been classified as critically endangered on national and international red lists due to their extremely limited distributions and small population sizes [8,31]. Our findings suggest that other species within the genus that share similar ecological characteristics, including narrow habitat ranges, high-elevation confinement, and projected habitat loss, should also be prioritized in future conservation planning. Incorporating climate-based risk assessments into formal conservation frameworks may help to pre-emptively safeguard these as yet unlisted but equally vulnerable species.

4.4. Limitations and Future Research Directions

Despite robust model performance, this study has several limitations that merit consideration. Species occurrence data for some taxa were limited in both spatial coverage and record density, which may influence predictive accuracy. Additionally, the modeling approach assumes climatic equilibrium and does not incorporate factors such as land use, microhabitat heterogeneity, or biotic interactions, all of which may affect species distributions. While ensemble modeling helped reduce algorithmic uncertainty, projections were based on a single climate model. Future research should incorporate additional data sources, multiple climate models, and ecological traits such as dispersal ability and demographic stability to improve predictive realism and support targeted conservation strategies.

5. Conclusions

This study assessed the potential impacts of climate change on the distribution of 32 Carpinus species in China using an ensemble modeling framework. We identified temperature seasonality and precipitation-related variables as the main environmental drivers of current distributions. Future projections under three SSP scenarios consistently showed northwestward and upslope range shifts, with substantial habitat contraction under high-emission scenarios. Notably, several narrowly distributed species such as C. omeiensis and C. londoniana var. lanceolata are projected to lose nearly all suitable habitats, indicating high extinction risk. These findings underscore the need to incorporate climate-based assessments into conservation planning and to prioritize vulnerable species and future refugia to safeguard the long-term survival of Carpinus diversity.

Supplementary Materials

The following supporting information can be downloaded at: https://www.mdpi.com/article/10.3390/f16060888/s1, Figure S1: Correlation plot of 19 bioclimatic variables with elevation; Figure S2: Effect of variable selection on model overfitting assessed by AUCdiff; Table S1: Names and definition of bioclimatic variables used in this study; Table S2: Shift distance and direction of species’ geographic centroids under different climate scenarios.

Author Contributions

Conceptualization, Z.W.; methodology, X.Y. and Q.H.; software, C.F.; investigation and validation, W.Y., C.F., Z.Z. and W.Z.; data curation, W.Y.; writing—original draft preparation, W.Y. and C.F.; writing—review and editing, Z.W.; visualization, W.Y. and C.F. All authors have read and agreed to the published version of the manuscript.

Funding

This research was funded equally by grants from the National Natural Science Foundation of China (NSFC) (32422053 and 32301411) and the Natural Science Foundation of Jiangsu Province, China (BK20230394).

Data Availability Statement

All data used in this work are contained within the article and Supplementary Materials.

Conflicts of Interest

The authors declare no conflicts of interest.

References

  1. Intergovernmental Panel On Climate Change (IPCC). Climate Change 2021—The Physical Science Basis: Working Group I Contribution to the Sixth Assessment Report of the Intergovernmental Panel on Climate Change, 1st ed.; Cambridge University Press: Cambridge, UK, 2023; ISBN 978-1-009-15789-6. [Google Scholar]
  2. Chen, I.-C.; Hill, J.K.; Ohlemüller, R.; Roy, D.B.; Thomas, C.D. Rapid Range Shifts of Species Associated with High Levels of Climate Warming. Science 2011, 333, 1024–1026. [Google Scholar] [CrossRef] [PubMed]
  3. Vitasse, Y.; Ursenbacher, S.; Klein, G.; Bohnenstengel, T.; Chittaro, Y.; Delestrade, A.; Monnerat, C.; Rebetez, M.; Rixen, C.; Strebel, N.; et al. Phenological and Elevational Shifts of Plants, Animals and Fungi under Climate Change in the European Alps. Biol. Rev. 2021, 96, 1816–1835. [Google Scholar] [CrossRef] [PubMed]
  4. Pacifici, M.; Foden, W.B.; Visconti, P.; Watson, J.E.M.; Butchart, S.H.M.; Kovacs, K.M.; Scheffers, B.R.; Hole, D.G.; Martin, T.G.; Akçakaya, H.R.; et al. Assessing Species Vulnerability to Climate Change. Nat. Clim. Change 2015, 5, 215–224. [Google Scholar] [CrossRef]
  5. He, F.; Zarfl, C.; Bremerich, V.; David, J.N.W.; Hogan, Z.; Kalinkat, G.; Tockner, K.; Jähnig, S.C. The Global Decline of Freshwater Megafauna. Glob. Change Biol. 2019, 25, 3883–3892. [Google Scholar] [CrossRef]
  6. Chichorro, F.; Urbano, F.; Teixeira, D.; Väre, H.; Pinto, T.; Brummitt, N.; He, X.; Hochkirch, A.; Hyvönen, J.; Kaila, L.; et al. Species Traits Predict Extinction Risk across the Tree of Life. bioRxiv 2020, bioRxiv:2020.07.01.183053. [Google Scholar]
  7. Wan, J.-N.; Mbari, N.J.; Wang, S.-W.; Liu, B.; Mwangi, B.N.; Rasoarahona, J.R.E.; Xin, H.-P.; Zhou, Y.-D.; Wang, Q.-F. Modeling Impacts of Climate Change on the Potential Distribution of Six Endemic Baobab Species in Madagascar. Plant Divers. 2021, 43, 117–124. [Google Scholar] [CrossRef]
  8. Zhang, H.; Wei, Y.; Yue, J.; Wang, Z.; Zou, H.; Ji, X.; Zhang, S.; Liu, Z. Prediction of Potential Suitable Areas and Priority Protection for Cupressus gigantea on the Tibetan Plateau. Plants 2024, 13, 896. [Google Scholar] [CrossRef]
  9. Hernandez, P.A.; Graham, C.H.; Master, L.L.; Albert, D.L. The Effect of Sample Size and Species Characteristics on Performance of Different Species Distribution Modeling Methods. Ecography 2006, 29, 773–785. [Google Scholar] [CrossRef]
  10. Franklin, J.; Miller, J.A. Mapping Species Distributions: Spatial Inference and Prediction, 5th ed.; Ecology, biodiversity and conservation; Cambridge University Press: Cambridge, UK, 2011; ISBN 978-0-521-70002-3. [Google Scholar]
  11. Araújo, M.B.; Peterson, A.T. Uses and Misuses of Bioclimatic Envelope Modeling. Ecology 2012, 93, 1527–1539. [Google Scholar] [CrossRef]
  12. Early, R.; Bradley, B.A.; Dukes, J.S.; Lawler, J.J.; Olden, J.D.; Blumenthal, D.M.; Gonzalez, P.; Grosholz, E.D.; Ibañez, I.; Miller, L.P.; et al. Global Threats from Invasive Alien Species in the Twenty-First Century and National Response Capacities. Nat. Commun. 2016, 7, 12485. [Google Scholar] [CrossRef]
  13. Raitsos, D.E.; Beaugrand, G.; Georgopoulos, D.; Zenetos, A.; Pancucci-Papadopoulou, A.M.; Theocharis, A.; Papathanassiou, E. Global Climate Change Amplifies the Entry of Tropical Species into the Eastern Mediterranean Sea. Limnol. Oceanogr. 2010, 55, 1478–1484. [Google Scholar] [CrossRef]
  14. Liu, Y.; Li, Y.; Wang, R.; Guo, L.; Ji, Y.; Chen, Y.; Hao, L.; Lin, K. Impacts of Human Activity and Climate Change on the Suitable Habitats for Xanthium Spinosum in China. Plants 2025, 14, 306. [Google Scholar] [CrossRef] [PubMed]
  15. Phillips, S.J.; Anderson, R.P.; Schapire, R.E. Maximum Entropy Modeling of Species Geographic Distributions. Ecol. Model. 2006, 190, 231–259. [Google Scholar] [CrossRef]
  16. Elith, J.; Phillips, S.J.; Hastie, T.; Dudík, M.; Chee, Y.E.; Yates, C.J. A Statistical Explanation of MaxEnt for Ecologists: Statistical Explanation of MaxEnt. Divers. Distrib. 2011, 17, 43–57. [Google Scholar] [CrossRef]
  17. Araújo, M.B.; New, M. Ensemble Forecasting of Species Distributions. Trends Ecol. Evol. 2007, 22, 42–47. [Google Scholar] [CrossRef]
  18. Lockwood, J.L.; Cassey, P.; Blackburn, T.M. The More You Introduce the More You Get: The Role of Colonization Pressure and Propagule Pressure in Invasion Ecology. Divers. Distrib. 2009, 15, 904–910. [Google Scholar] [CrossRef]
  19. Hao, T.; Elith, J.; Guillera-Arroita, G.; Lahoz-Monfort, J.J. A Review of Evidence about Use and Performance of Species Distribution Modelling Ensembles like BIOMOD. Divers. Distrib. 2019, 25, 839–852. [Google Scholar] [CrossRef]
  20. Hao, T.; Elith, J.; Lahoz-Monfort, J.J.; Guillera-Arroita, G. Testing Whether Ensemble Modelling Is Advantageous for Maximising Predictive Performance of Species Distribution Models. Ecography 2020, 43, 549–558. [Google Scholar] [CrossRef]
  21. Harris, J.; Pirtle, J.L.; Laman, E.A.; Siple, M.C.; Thorson, J.T. An Ensemble Approach to Species Distribution Modelling Reconciles Systematic Differences in Estimates of Habitat Utilization and Range Area. J. Appl. Ecol. 2024, 61, 351–364. [Google Scholar] [CrossRef]
  22. Yang, J.; Fu, Z.; Xiao, K.; Dong, H.; Zhou, Y.; Zhan, Q. Climate Change Potentially Leads to Habitat Expansion and Increases the Invasion Risk of Hydrocharis (Hydrocharitaceae). Plants 2023, 12, 4124. [Google Scholar] [CrossRef]
  23. Thuiller, W.; Lafourcade, B.; Engler, R.; Araújo, M.B. BIOMOD—A Platform for Ensemble Forecasting of Species Distributions. Ecography 2009, 32, 369–373. [Google Scholar] [CrossRef]
  24. Vasconcelos, R.N.; Cantillo-Pérez, T.; Franca Rocha, W.J.S.; Aguiar, W.M.; Mendes, D.T.; de Jesus, T.B.; de Santana, C.O.; de Santana, M.M.M.; Oliveira, R.P. Advances and Challenges in Species Ecological Niche Modeling: A Mixed Review. Earth 2024, 5, 963–989. [Google Scholar] [CrossRef]
  25. Cheng, J.; Xiao, J.; Song, N.; Saha, S.; Qin, J.; Nomura, H.; Panhwar, S.K.; Farooq, N.; Shao, K.; Gao, T. Molecular Phylogeny Reveals Cryptic Diversity and Swim Bladder Evolution of Sillaginidae Fishes (Perciformes) across the Indo-West Pacific Ocean. Divers. Distrib. 2021, 27, 82–94. [Google Scholar] [CrossRef]
  26. Li, P.C.; Skvortsov, A.K. Betulaceae. In Flora of China; Wu, Z.Y., Raven, P.H., Hong, D.Y., Eds.; Science Press & Missouri Botanical Garden Press: Beijing, China; St. Louis, MO, USA, 1999; Volume 4, pp. 289–300. [Google Scholar]
  27. Xue, L.; Jia, L.; Nam, G.; Huang, Y.; Zhang, S.; Wang, Y.; Zhou, Z.; Chen, Y. Involucre Fossils of Carpinus, a Northern Temperate Element, from the Miocene of China and the Evolution of Its Species Diversity in East Asia. Plant Divers. 2020, 42, 155–167. [Google Scholar] [CrossRef]
  28. Dong, C.; Lu, Z.; Zhang, H.; Liu, J.; Li, M. Delimiting 33 Carpinus (Betulaceae) Species with a Further Phylogenetic Inference. AoB Plants 2022, 14, plac006. [Google Scholar] [CrossRef]
  29. Zhao, R.; Chu, X.; He, Q.; Tang, Y.; Song, M.; Zhu, Z. Modeling Current and Future Potential Geographical Distribution of Carpinus tientaiensis, a Critically Endangered Species from China. Forests 2020, 11, 774. [Google Scholar] [CrossRef]
  30. Sheng, Q.; Song, M.; Zhu, Z.; Cao, F. Physiological and Biochemical Responses of Two Precious Carpinus Species to High-Concentration NO2 Stress and Their Natural Recovery. Sci. Rep. 2021, 11, 9500. [Google Scholar] [CrossRef] [PubMed]
  31. Yang, J.; Cai, L.; Liu, D.; Chen, G.; Gratzfeld, J.; Sun, W. China’s Conservation Program on Plant Species with Extremely Small Populations (PSESP): Progress and Perspectives. Biol. Conserv. 2020, 244, 108535. [Google Scholar] [CrossRef]
  32. He, Q.; Zhao, R.; Zhu, Z. Geographical Distribution Simulation and Comparative Analysis of Carpinus viminea and C. londoniana. Glob. Ecol. Conserv. 2020, 21, e00825. [Google Scholar] [CrossRef]
  33. Gülçin, D.; Arslan, E.S.; Örücü, Ö.K. Effects of Climate Change on the Ecological Niche of Common Hornbeam (Carpinus betulus L.). Ecol. Inform. 2021, 66, 101478. [Google Scholar] [CrossRef]
  34. Sun, J.; Feng, L.; Wang, T.; Tian, X.; He, X.; Xia, H.; Wang, W. Predicting the Potential Habitat of Three Endangered Species of Carpinus Genus under Climate Change and Human Activity. Forests 2021, 12, 1216. [Google Scholar] [CrossRef]
  35. Fick, S.E.; Hijmans, R.J. WorldClim 2: New 1-Km Spatial Resolution Climate Surfaces for Global Land Areas. Int. J. Climatol. 2017, 37, 4302–4315. [Google Scholar] [CrossRef]
  36. Dormann, C.F.; Elith, J.; Bacher, S.; Buchmann, C.; Carl, G.; Carré, G.; Marquéz, J.R.G.; Gruber, B.; Lafourcade, B.; Leitão, P.J.; et al. Collinearity: A Review of Methods to Deal with It and a Simulation Study Evaluating Their Performance. Ecography 2013, 36, 27–46. [Google Scholar] [CrossRef]
  37. Boria, R.A.; Olson, L.E.; Goodman, S.M.; Anderson, R.P. Spatial Filtering to Reduce Sampling Bias Can Improve the Performance of Ecological Niche Models. Ecol. Model. 2014, 275, 73–77. [Google Scholar] [CrossRef]
  38. Warren, D.L.; Seifert, S.N. Ecological Niche Modeling in Maxent: The Importance of Model Complexity and the Performance of Model Selection Criteria. Ecol. Appl. 2011, 21, 335–342. [Google Scholar] [CrossRef] [PubMed]
  39. Marmion, M.; Parviainen, M.; Luoto, M.; Heikkinen, R.K.; Thuiller, W. Evaluation of Consensus Methods in Predictive Species Distribution Modelling. Divers. Distrib. 2009, 15, 59–69. [Google Scholar] [CrossRef]
  40. El Alaoui, O.; Idri, A. Predicting the Potential Distribution of Wheatear Birds Using Stacked Generalization-Based Ensembles. Ecol. Inform. 2023, 75, 102084. [Google Scholar] [CrossRef]
  41. Lenoir, J.; Gégout, J.C.; Marquet, P.A.; de Ruffray, P.; Brisse, H. A Significant Upward Shift in Plant Species Optimum Elevation During the 20th Century. Science 2008, 320, 1768–1771. [Google Scholar] [CrossRef]
  42. Moran, E.V.; Thuiller, W.; Angert, A.L.; Benito Garzón, M. Editorial: Predicting and Managing Climate-Driven Range Shifts in Plants. Front. Ecol. Evol. 2022, 10, 856213. [Google Scholar] [CrossRef]
  43. Guisan, A.; Zimmermann, N.E. Predictive Habitat Distribution Models in Ecology. Ecol. Model. 2000, 135, 147–186. [Google Scholar] [CrossRef]
  44. Hirzel, A.H.; Le Lay, G. Habitat Suitability Modelling and Niche Theory. J. Appl. Ecol. 2008, 45, 1372–1381. [Google Scholar] [CrossRef]
  45. Freeman, B.G.; Scholer, M.N.; Ruiz-Gutierrez, V.; Fitzpatrick, J.W. Climate Change Causes Upslope Shifts and Mountaintop Extirpations in a Tropical Bird Community. Proc. Natl. Acad. Sci. USA 2018, 115, 11982–11987. [Google Scholar] [CrossRef] [PubMed]
  46. Steinbauer, M.J.; Grytnes, J.-A.; Jurasinski, G.; Kulonen, A.; Lenoir, J.; Pauli, H.; Rixen, C.; Winkler, M.; Bardy-Durchhalter, M.; Barni, E.; et al. Accelerated Increase in Plant Species Richness on Mountain Summits Is Linked to Warming. Nature 2018, 556, 231–234. [Google Scholar] [CrossRef] [PubMed]
Figure 1. Distribution records of the Carpinus taxa used in the modeling.
Forests 16 00888 g001
Figure 2. Correlation plot of the selected variables. Circle size represents the absolute value of the correlation coefficient.
Forests 16 00888 g002
Figure 3. Performance of the six models evaluated in this study. (a) AUC values of six models; (b) TSS values of six models.
Forests 16 00888 g003
Figure 4. Spatial distribution of Carpinus taxa richness under different climate scenarios: (a) current; (b) 2090s under the SSP126 scenario; (c) 2090s under the SSP370 scenario; (d) 2090s under the SSP585 scenario.
Forests 16 00888 g004
Figure 5. Ridgeline plots of projected distribution area and mean elevation for Carpinus under different climate scenarios: (a) shows the area, and (b) shows the average elevation.
Forests 16 00888 g005
Figure 6. The importance of environmental variables. Dots represent outliers beyond 1.5 times the interquartile range (IQR).
Forests 16 00888 g006
Figure 7. Distribution centroids of Carpinus species.
Forests 16 00888 g007
Table 1. Environment variables used in the modelling.
AbbreviationVariableUnit
bio1Annual mean temperature°C
bio3Isothermality
bio4Temperature seasonality
bio12Annual precipitationmm
elevElevationm
Table 2. Filtered taxa list and specimen counts.
TaxaNumberTaxaNumber
C. chuniana25C. monbeigiana41
C. cordata161C. oblongifolia5
C. cordata var. chinensis82C. omeiensis6
C. cordata var. mollis28C. polyneura85
C. dayongiana5C. polyneura var. sunpanensis9
C. fangiana66C. pubescens101
C. fargesiana96C. purpurinervis9
C. fargesiana var. hwai15C. rankanensis23
C. firmifolia5C. rupestris9
C. henryana40C. shensiensis14
C. hupeana41C. stipulata23
C. kawakamii77C. tsaiana10
C. kweichowensis64C. tschonoskii58
C. londoniana91C. turczaninovii229
C. londoniana var. lanceolata9C. viminea282
C. mollicoma8C. viminea var. chiukiangensis8
Table 3. Number of distributional area range changes of species under different climate scenarios.
SSP126SSP370SSP585
Expansion1287
Contraction202223
Extinction022
Table 4. Number of elevation changes of species under different climate scenarios.
SSP126SSP370SSP585
Increase292929
Decrease311
Extinction022
Disclaimer/Publisher’s Note: The statements, opinions and data contained in all publications are solely those of the individual author(s) and contributor(s) and not of MDPI and/or the editor(s). MDPI and/or the editor(s) disclaim responsibility for any injury to people or property resulting from any ideas, methods, instructions or products referred to in the content.

