Abstract
Forest ecosystems deliver ecosystem services (ESs) that are essential for the well-being of local communities. These services necessitate a clear understanding of their perception among community members in order to facilitate informed and sustainable forest management decisions. This study aimed to explore the relationship between forest ESs and local communities by identifying community preferences for key ESs and examining how socio-economic factors influence this perception. Data was collected through participatory methods, including focus group discussions, key informant interviews, and a household survey involving 453 respondents. The data was analyzed using descriptive statistics and binary logistic regression. We identified firewood, rainfall attraction, air quality, and wildlife habitat as the most acknowledged services in their respective ES categories. Land ownership, education level, Community Forest Association membership, and labor migration significantly influenced service recognition. These findings highlight critical areas for intervention, including livelihood enhancement, cultural heritage preservation, and improved community outreach programs. The outcomes of this research are expected to contribute to the sustainable management of forest ecosystems.
1. Introduction
Forests are known for the provision of both tangible and intangible benefits that are essential to human well-being and health [1]. These benefits, collectively referred to as ecosystem services (ESs), encompass a wide range of contributions that forests make to society [2]. According to the Millennium Ecosystem Assessment, the ESs are classified into four main categories [2]. Provisioning services refer to tangible benefits derived from forests, such as firewood, grazing grass, construction poles, and water. These resources are utilized to meet both the subsistence and commercial needs of households [3,4]. Regulating services are intangible benefits that result from the forest’s role in moderating ecosystem processes, including climate regulation, flood control, air purification, and pollination [5]. Supporting services are fundamental ecological processes necessary for the functioning of forest ecosystems, such as rainfall attraction [6]. Lastly, cultural services encompass non-material benefits that foster a sense of place and cultural identity within local communities. These include recreation, religious and spiritual values, and environmental education [7].
The community perception of ESs is crucial in shaping conservation behavior and fostering local stewardship. When communities recognize and value the benefits they derive from forests, they are more likely to engage in efforts to protect and conserve forest ecosystems [8]. Moreover, understanding community perception is essential for informing context-specific policy and management decisions [3], enhancing environmental education and outreach initiatives [9], promoting equity and inclusion [10], supporting trade-off assessments and conflict resolution processes [10], and strengthening the evaluation and monitoring of changes within forest ecosystems [11,12]. Accordingly, integrating community perspectives into forest policy and participatory forest management (PFM) frameworks has become a key strategy across the Global South, including Kenya.
At the same time, the socio-economic characteristics of communities are critical in understanding the perception of ESs. The characteristics help identify who benefits from these services, how they benefit, and why their valuation of ESs may differ. For example, community attributes such as income level, land ownership, and livestock holdings influence the degree to which households rely on services like grazing grass, firewood, and food provisioning [13,14,15]. Household-level factors, including age, length of residence, and education level, shape ES recognition, particularly for ESs related to cultural/spiritual values and environmental awareness. These ESs are often transmitted through traditional ecological knowledge [16]. Proximity to markets also affects livelihood strategies and, consequently, the use and perception of ESs [17]. Gender plays a significant role in ES awareness, as women—being the primary collectors of water and firewood—tend to have a greater awareness of provisioning services [16]. Membership in forest user associations enhances the understanding of ESs through access to extension services and participation in user groups [18]. Additionally, larger households typically have greater resource needs, leading to increased awareness and dependence on ESs [19]. Labor migration influences household economic priorities: for instance, remittances may allow families to purchase firewood instead of relying on forest collection, thereby altering ES utilization patterns [20].
The existing literature highlights community perceptions of ESs in relation to various factors. These factors include the diverse occupations of community members [19,21,22], affiliation with forest associations [18], proximity to forest areas [23,24], and membership in different socio-cultural groups [25]. The literature also highlights the influence of socio-economic characteristics on the acknowledgment of ESs. The examined factors include income [18,19], livestock ownership [23], level of education [13,26,27], age [26,28], land ownership [29], forest association membership [30], gender of the household head [31], length of residence [19], and distance to markets [32]. Despite these insights, significant knowledge gaps remain. Most existing studies analyze socio-economic drivers in isolation, often focusing on a single ES category. Furthermore, few have investigated the influence of labor migration—a growing phenomenon in rural Africa—on community perceptions of ESs [33]. Migration can shift household labor dynamics and resource needs, potentially reducing dependence on forest-based services through remittances or reshaping cultural ties to the land. Additionally, there is limited empirical evidence from western Kenya, particularly the Kakamega Forest Ecosystem (KFE), which presents a unique socio-ecological context.
The KFE is Kenya’s only remnant of the once-extensive Guineo-Congolian rainforest and is home to rich biodiversity and critical ESs. In recent years, however, forest access and use patterns have been significantly altered due to increasing population pressure [34], the installation of an electric fence [35], and the national charcoal ban [36]. At the same time, the implementation of PFM and the role of community forest associations (CFAs) in forest governance have introduced new socio-political dynamics, including issues of elite capture and uneven benefit distribution [37]. Additionally, Kakamega County has experienced high rates of migration. These dynamics directly or indirectly affect the ESs accessed and valued by local communities. The KFE is managed through a PFM approach [38], which involves collaboration between the Kenya Forest Service and local CFAs. These CFAs operate through various user groups granted rights to access specific resources, including honey harvesting, timber and firewood collection, grass harvesting and grazing, medicinal plant harvesting, sand harvesting, and ecotourism and leisure activities. These factors make Kakamega Forest a compelling site for investigating how socio-economic characteristics influence the recognition of diverse ESs [34,38].
In light of the identified knowledge gaps, this study investigates how socio-economic factors influence the acknowledgment of ESs among communities living around Kakamega Forest. Specifically, it aims to (1) identify the ecosystem services acknowledged by local communities and (2) examine how socio-economic variables (e.g., income, education, land ownership, length of residence, age, CFA membership, migration) influence ES recognition across provisioning, regulating, supporting, and cultural categories.
2. Materials and Methods
2.1. Study Area
The KFE is located in the western region of Kenya, situated between latitudes 0°15′ S and 0°21′ S and longitudes 34°40′ E and 34°57′ E [39]. The KFE encompasses a protected area of 133 km2, which includes near-natural forests, secondary forests, and planted forests [40]. The forest is home to 350 plant species, including some of the continent’s finest softwood and hardwood varieties [41]. The KFE is divided into four management zones to balance the needs of the surrounding community with visitor access while prioritizing conservation. These zones are the livelihood support zone, the potential utilization zone, the protection zone, and the core zone [42,43]. The local communities have access to the livelihood support zone and potential utilization zones, while the core zone and protected zones are near-natural forests with management activities aiming mainly at biodiversity conservation.
The forest is surrounded by a population of approximately half a million people, with an average household density of five people per household [44]. It spans several sub-counties in Kakamega County, namely Navakholo, Lurambi, Shinyalu, and Malava (see Figure 1). The communities living around the forest engage in a variety of livelihood activities, including livestock keeping, farming, small businesses, tea leaf picking, and tour guiding [34,45]. For the purposes of this research, all sub-counties surrounding the KFE were included.
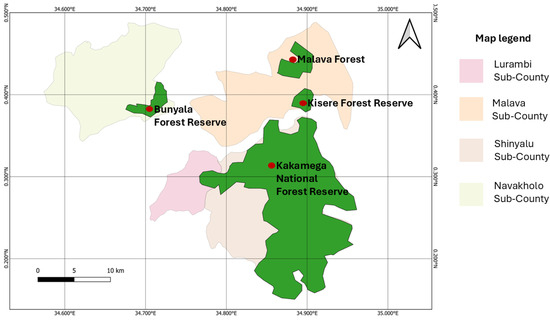
Figure 1.
Map of the study area.
2.2. Methods Utilized
Participatory approaches were utilized in this research as outlined below (see Figure 2). Informed consent was obtained from all individual participants included in the research. As this study is part of a PhD research project, ethical approval for the methodology was obtained from the PhD supervisory committee at the implementing university prior to the commencement of fieldwork. Participants were thoroughly informed about the purpose of the study, their right to withdraw at any point without consequence, and the assurance of confidentiality concerning their responses.

Figure 2.
Flow chart of the methodology used. *—data on the categories supported questionnaire development.
Focus group discussions (FGDs): Three FGDs were conducted in the sub-counties of Navakholo, Shinyalu, and Malava. Lurambi was excluded due to overlapping representation with Shinyalu within the CFA. Each FGD involved 8–10 participants, including both CFA and non-CFA members, ensuring gender balance through snowball sampling. The primary objective of the FGDs was to identify the ESs that participants derived from the forest. Discussions lasted between 45 and 90 min.
Key informant interviews (KIIs): Seventeen KIIs were conducted with key resource persons, including forest managers from Malava and Shinyalu, three executive members of the CFA, and three Kenya Forest Service rangers from each sub-county. All participants had more than three years of experience in their respective roles. The aim of the KIIs was to validate and supplement the ESs identified during the FGDs. The interviews lasted between 30 and 45 min.
Household survey: The questionnaire for the household survey was developed based on insights gathered from the FGDs and KIIs. It consisted primarily of closed-ended questions (see Appendix A.1). The survey was designed to be completed in approximately 15 min and was printed in both English and Kiswahili. For respondents who were not comfortable with these languages, research assistants provided support by translating into the local “Luyha” language. Research assistants were trained by the lead author on proper questionnaire administration. See Appendix B.1 for the socio-economic profile of the respondents.
Stratified sampling was used to select households for the survey. The sample size was calculated with a 5% margin of error and a 95% confidence level [46]. Households were selected using the transect method [47] across all four sub-counties using roads. According to the 2019 census report, the total number of households surrounding the KFE was 551,909 [44]. The required sample size was initially calculated as 384 households but was adjusted to 453 to ensure better representation. The head of each willing household was provided with a questionnaire, while unwilling households were skipped and replaced with the next willing participant.
2.3. Variable Selection and Conceptual Framework
The selection of variables was guided by the Murray–Rust conceptual framework for socio-ecological systems [48], FGDs and KIIs, and literature relevant to the research objectives. These variables have been shown to influence household resource use, decision-making, and livelihood outcomes, as documented in the previous literature. For example, income is a key determinant of household purchasing power and the ability to invest in improved livelihoods [27,31]. It serves as a critical indicator of economic well-being and affects households’ consumption choices regarding ESs. Education enhances access to information and improves households’ capacity to recognize and utilize regulating and cultural ESs [26]. The gender of the household head influences labor division and access to ESs, making this variable particularly important for understanding rural natural resource use [19]. Market proximity affects dependence on provisioning ESs, with remote households more likely to rely on tangible ESs such as firewood and grazing grass [3,13]. Household size is another important factor, as larger households generally have a greater demand for ESs, leading to a higher likelihood of ES acknowledgment [19]. Land and livestock ownership are indicators of wealth, influencing access to and dependence on provisioning ESs, particularly in rural settings [23]. Forest association membership increases exposure to ES-related discussions and is likely to influence the acknowledgment of ESs, as it provides greater access to forest management resources and information [18,49]. CFA refers to a legally recognized community-based organization formed by local forest-adjacent communities to participate in the co-management and conservation of forests under PFM [43]. CFA membership was operationalized as a categorical variable based on self-reported affiliation with CFA/forest user groups formally recognized under the Forest Conservation and Management Act (2016). Age and length of residence may impact traditional ecological knowledge and the level of experience with forest changes, thereby shaping perceptions of cultural ESs [7]. Finally, labor migration refers to the movement of people from Kakamega county to another region for employment. This influences both labor availability and household income, often leading to a reduced dependence on forest-based ESs, as remittances provide alternative sources of livelihood [50]. In our research, labor migration was operationalized as a numeric variable, calculated by dividing the number of household members working outside Kakamega County by the total number of working members (see Appendix A). The conceptual framework guiding the research is presented below in Figure 3.
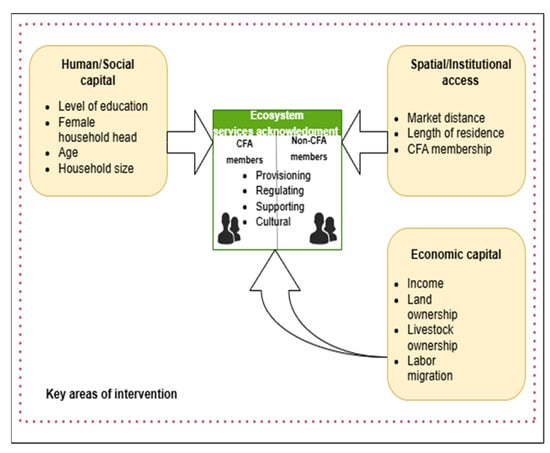
Figure 3.
Conceptual framework utilized in this research.
2.4. Data Analysis
Data from the FGDs and KIIs were analyzed using a qualitative grid incorporating ESs based on the MEA framework, alongside socio-economic factors that may influence community perceptions of ESs. The household questionnaire data were imputed into Microsoft Excel, where a binary coding system was applied: “1” was used for selected ESs and “0” for unselected services. Descriptive statistics, specifically percentages, were employed to summarize the acknowledged ESs. To assess the impact of various socio-economic factors on the likelihood of acknowledging different categories of ESs, binary logistic regression was performed in SPSS 22. The independent variables were coded as follows: categorical variables included the gender of the household’s head (1 = male, 2 = female), land ownership, CFA membership, and livestock ownership (1 = yes, 2 = no). Market distance was categorized as follows: 1 = 0–2 km, 2 = 2–4 km, 3 = 4–6 km, 4 = 6–8 km, 5 = 8–9 km, 6 = 9–10 km, 7 = >10 km. Household income was coded as 1 = 0–5000, 2 = 5001–10,000, 3 = 10,001–20,000, 4 = 20,001–30,000, 5 = 30,001–40,000, 6 = 40,001–50,000, 7 = 50,000–60,000, 8 = >60,001, and length of residence was coded as 1 = <20, 2 = 20–30, 3 = 30–40, 4 = 40–50, 5 = >50. Continuous variables such as age, household size, and labor migration were used in their natural numeric form. The dependent variables were the four ES categories: provisioning, supporting, regulating, and cultural services (coded as 1 for selected and 0 for not selected). The dependent variables were derived by categorizing all provisioning, regulating, and cultural ESs into four distinct variables (see Figure 4). These socio-economic factors were entered as covariates in the model. The Hosmer–Lemeshow test was used to evaluate the model fit. The selection of the socio-economic variables for the model was guided by prior empirical studies and theoretical frameworks relevant to ES recognition among forest-dependent communities (see Section 2.3). Variables (wealth categories) were excluded if they exhibited multicollinearity, indicated by a variance inflation factor greater than 5. Data visualization and analysis were conducted using Microsoft Excel and R Studio/2024.04.2+764. The results were presented in tables, with appropriate notations to clarify the relationships between variables.
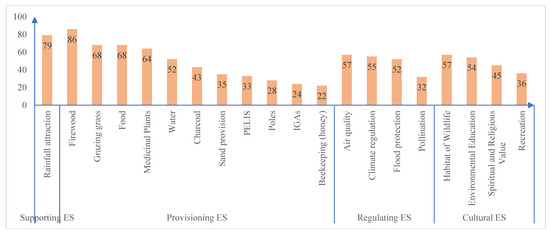
Figure 4.
Socio-economic factors and their influence on ES acknowledgment.
3. Results and Discussion
3.1. ES Acknowledgment
The FGD identified 11 provisioning ESs. The acknowledgment of these ESs was assessed through the questionnaires. Access to these provisioning services was found to be influenced by CFA membership, as the various user groups within the CFA regulate access to different resources [51]. Firewood was the most widely acknowledged provisioning ES, with the highest proportion of recognition (see Figure 4). This was likely due to its availability and convenience as a fuel source, a trend observed in other countries such as Vietnam and Bangladesh [3,52]. Grazing grass and food were the next most acknowledged services, with 68% of participants recognizing them. This may be attributed to land-use pressures in Kakamega, which necessitates that livestock owners use the forest for grazing. Indigenous vegetables, wild fruits, and mushrooms are commonly harvested by local communities to meet daily dietary needs [53]. Additionally, medicinal plants, such as the bark of Prunus africana, are used to treat ailments such as urological symptoms and prostate cancer, providing readily available relief to the local communities [54].
Charcoal received relatively low acknowledgment compared to firewood, likely due to the 2018 charcoal ban imposed in Kenya [36]. Interestingly, some provisioning ESs that could potentially enhance households’ livelihoods, such as PFM schemes (Plantation Establishment and Livelihood Improvement Scheme—PELIS), poles, income-generating activities (IGAs), and honey from beekeeping, are also poorly acknowledged. This could be attributed to the phenomenon of elite capture within the CFA in Kakamega. Research by Ongugo on CFAs in Kenya highlighted the presence of elite capture, where resource benefits are disproportionately directed to a few individuals, limiting broader community access [37]. The implications include inequitable access to forest resources, which undermines the fundamental objectives of community-based forest management and leads to a loss of trust and reduced participation in the CFA. A similar situation has been observed in Tanzanian PFM programs [55].
Regarding regulating ESs, air quality received the highest acknowledgment due to the forest’s role in filtering pollutants. The FGDs revealed that the natural forest acted as a filter for fine dust particles, which the local communities often inhale from the red soil (murram) roads. Climate regulation was also recognized, particularly for its contribution to temperature and weather stability, which indirectly supported agricultural production. Flood protection is moderately acknowledged, likely due to the heavy rains experienced in Kenya between March and May 2024. The forest helped prevent soil erosion and landslides, in contrast to other parts of the country, where similar rainfall caused significant damage [56]. Pollination is the least acknowledged regulating service, particularly in terms of enhancing the production of provisioning services such as honey. This could be linked to the low uptake of beekeeping by local communities, which may have otherwise increased their recognition of this service. This outcome contrasts with findings from the Omo biosphere, where local communities also demonstrated relatively low acknowledgment of regulating ESs [57].
Within the cultural ES category, wildlife habitat received the highest acknowledgment. This service is particularly valuable for ecotourism, with Kakamega Forest serving as a prime location for bird watching. Environmental education is the second most acknowledged cultural service, as it provides students from various schools across the country with opportunities to enhance their understanding of ESs. This finding contrasts with research in Benin, where environmental education received 84% acknowledgment [27]. Spiritual and religious value was acknowledged by 45% of households, recognizing the forest as a source of places for worship and sacred sites, particularly those used for rites such as circumcision. This outcome differs from that of Gouwakinnou’s study, where this service was acknowledged by 62% of respondents [27]. Recreation, the least acknowledged cultural service, was recognized for offering spaces for cultural activities, such as bull fighting on Saturdays in Shinyalu. In the supporting ES category, rainfall attraction was the only service acknowledged during the FGDs. This service is vital for the region’s agricultural lands, which rely heavily on rainfall. Given that the area is predominantly agricultural, households in the region are highly sensitive to this supporting service, further highlighting its importance for local livelihoods [45].
3.2. Socio-Economic Factors Influencing ES Acknowledgment
Figure 5, Figure 6, Figure 7, Figure 8 and Figure 9 present the ESs alongside their significant predictors, while Appendix C provides an overview of the ES categories and their corresponding predictors as well as separate tables for each of the four ES categories with their respective predictors.
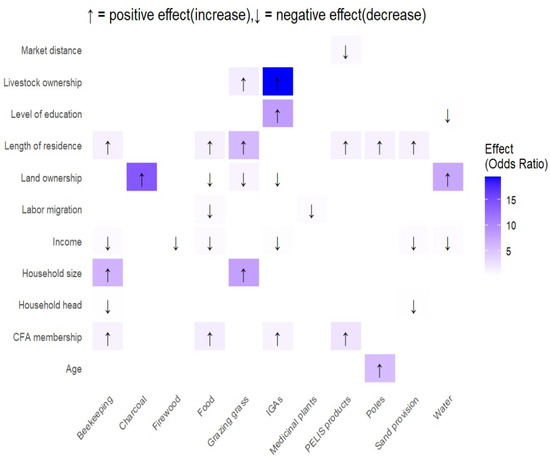
Figure 5.
Provisioning ESs with significant socio-economic predictors. (Purple color—strong correlation).
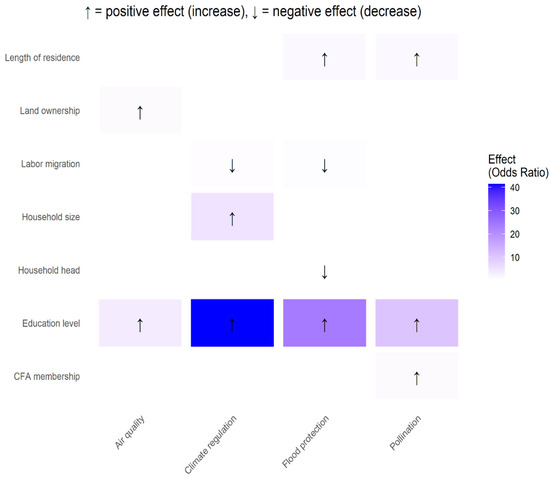
Figure 6.
Regulating ESs with significant socio-economic predictors. (Purple color—strong correlation).
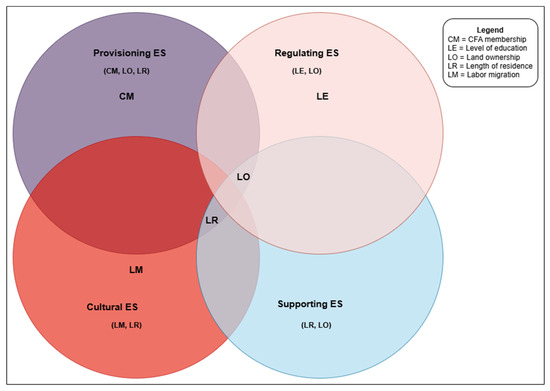
Figure 7.
Factors influencing ES acknowledgment.
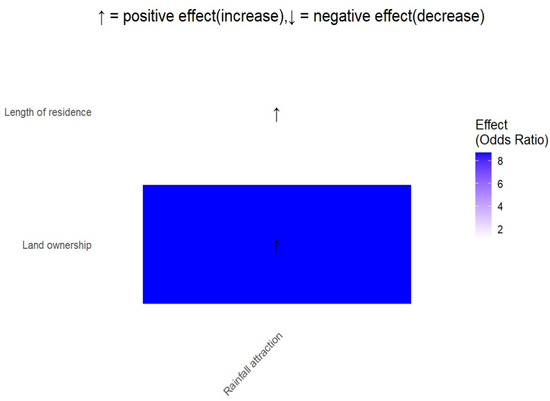
Figure 8.
Supporting ESs with significant socio-economic predictors. (Purple color—strong correlation).
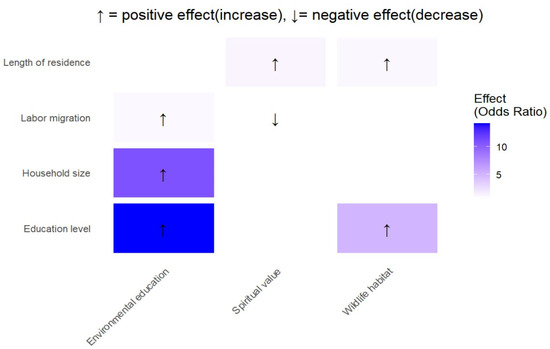
Figure 9.
Cultural ESs with significant socio-economic predictors. (Purple color—strong correlation).
3.2.1. Provisioning ESs
Overall, income was not found to be a significant predictor of provisioning ESs (see Appendix C.1). This finding is consistent with Nyangoko’s research in Tanzania, where household income was also not a significant predictor of provisioning ESs [31]. However, several specific provisioning services, including firewood, food, IGAs, sand provision, beekeeping, and water, showed a significant decrease in the likelihood of acknowledgment with the following odds ratios for a unit increase in income: 93%, 55%, 71%, 63%, 68%, and 68%, respectively (see Figure 5 and Appendix C.2). In contrast, charcoal had a significant 4.5-fold increase in the likelihood of acknowledgment. This outcome suggests that as income increases, households may reduce their dependence on forest resources, opting for charcoal, which, although more expensive than firewood, is often used to meet daily energy needs.
Land ownership was a significant predictor of provisioning ESs, with a 95% decrease in the likelihood of acknowledgment for a unit increase in the predictor (see Appendix C.2). Services such as grazing grass, food, PELIS, and IGAs showed significant decreases in acknowledgment, with odds ratios of 10%, 94%, 96%, and 97%, respectively. This trend could be attributed to households farming their land to meet both subsistence needs and income generation. Conversely, charcoal and water had a significant 14- and 7-fold increase in the likelihood of acknowledgment, likely to reflect the need for water to support farming activities on their land. These findings align with research in Bangladesh and Indonesia, where secure land ownership was found to increase acknowledgment of ESs such as water [23,58].
Livestock ownership was not a significant predictor of provisioning ESs. However, services such as grazing grass and IGAs showed significant increases in acknowledgment, with an odds ratio of 62% and a 19-fold increase, respectively. This could be attributed to the competing demands of land use as households balance their need for food and livestock fodder, often turning to the forest to meet these needs. This finding aligns with Li’s global research [59].
The level of education was not a significant predictor of provisioning ESs, aligning with findings from research in Benin [27]. However, IGAs exhibited an 8-fold increase in the likelihood of acknowledgment, while water showed a 78% decrease in the likelihood of acknowledgment. This outcome suggests that higher education levels often increased awareness of economic opportunities related to ESs, such as tree nursery establishment, which depends on piped water from harvested rain rather than natural river sources.
Regarding the household head, this variable was not a significant predictor of provisioning ESs, which contrasts with findings from Nyangoko’s study in Tanzania [19]. However, the household head was a significant predictor for specific services such as sand provision and beekeeping (honey), with decreasing likelihood odds of acknowledgment of 77% and 91% for a unit increase in the predictor. This may be due to sand harvesting being a physically labor-intensive activity that female-headed households may be less likely to engage in. Beekeeping, on the other hand, involves risky practices, such as working with volatile African bees and tree climbing, which may deter female-headed households from participating in this ES.
Market distance was not a significant predictor overall. However, PELIS products (maize and beans) showed a significant relationship, with increasing distance to markets leading to a 34% decrease in the likelihood of acknowledgment. This could be attributed to high transportation costs and poor road infrastructure, which reduce the economic viability of accessing these resources for households farther from the market.
Length of residence was a significant predictor of provisioning ESs, with a 4% increase in the likelihood of acknowledgment. This finding aligns with research from the Rufiji Delta [19]. Specific provisioning ESs such as grazing grass, food, PELIS, poles, sand provision, and beekeeping (honey) also showed significant increases in acknowledgment, with odds ratios of 6-fold, 22%, 18%, 19%, 21%, and 22%, respectively. This outcome can be attributed to long-term residents having a deeper understanding of forest resources, particularly those that are abundant for food and grazing grass. Additionally, longer residence allows for the establishment of social networks with local governing bodies (CFAs), which can help residents access opportunities for harvesting resources from plantations or utilizing PELIS lands when available.
CFA membership was also a significant predictor of provisioning ESs, with a 28% increase in the likelihood of acknowledgment (see Appendix C.2). CFA membership was a significant predictor for several provisioning services, including food, IGAs, beekeeping (honey), and PELIS, with an increase in likelihood odds of 57%, 12%, 6%, and a 2-fold increase, respectively. This could be attributed to the availability of user groups within the CFA structure, which provides members with access to various resources and income-generating opportunities related to ESs. These findings align with research conducted in Nepal and Ethiopia [60,61]. These research findings indicate that CFA membership has economically and nutritionally empowered participating households. However, this also presents the risk of excluding non-members from accessing forest benefits, potentially widening disparities between members and non-members and undermining equitable resource sharing. Another key implication relates to decentralized governance, with CFAs actively involved in the management and allocation of forest resources. Nonetheless, if the distribution of benefits is unequal, it raises concerns about accountability, representation, and the risk of elite capture—particularly if wealthy or influential households dominate decision-making processes and control access to PELIS plots or income-generating opportunities within the CFA. Interestingly, CFA membership was associated with a 51% decrease in the likelihood of acknowledgment of firewood, suggesting that non-CFA members might be more likely to engage in illegal firewood collection from the forest.
Overall, age was not a significant predictor for provisioning ESs, which is consistent with findings from research in Indonesia [23]. However, age was a significant predictor for poles, with a 5-fold increase in the likelihood of acknowledgment. This could be attributed to older household heads, who are often in positions of leadership or organization during harvesting activities due to their financial stability, thereby creating more opportunities for direct benefits.
Household size was generally not a significant predictor for provisioning ESs, which aligns with research from Tanzania [19]. However, grazing grass and beekeeping (honey) are exceptions, where household size was a significant predictor, showing an 8-fold and 6-fold increase in the likelihood of acknowledgment, respectively. This can be attributed to larger households requiring more resources to meet daily needs, resulting in more livestock and, consequently, a greater reliance on grazing. Larger households also have the necessary labor to herd livestock and harvest honey from the forest.
Labor migration as a predictor was not a significant factor for overall provisioning ESs, indicating a trend toward decreased likelihood of acknowledgment. However, it was significant for medicinal plants and food, with a 67% and 57% decrease in the likelihood of acknowledgment, respectively. This outcome can be explained by the increase in household income from remittances, which likely provides households with greater access to healthcare and market-based food options. These findings align with Shrestha’s research in Nepal, where remittances contributed to reduced dependence on provisioning ESs [50]. This outcome may result in the gradual exclusion of remittance-receiving households from traditional knowledge systems and communal access to resources. As their reliance on subsistence resources—such as forest food and medicinal plants—diminishes, their level of engagement in communal practices declines. As a result, these households may become less involved in the governance and decision-making processes of the CFA.
3.2.2. Regulating ESs
Income was not a significant predictor of overall regulating ESs, which aligns with findings from other tropical region studies [13,19]. However, it exhibited a general decreasing trend in the likelihood of ES acknowledgment. Similarly, income was not a significant predictor for any of the individual regulating ESs but consistently showed a negative association. This could be attributed to the intangible and long-term nature of regulating services—such as pollination and climate regulation—that are harder to quantify and monetize. As household income increases, families may prioritize short-term, tangible benefits (such as PELIS products, poles, or charcoal) over the less immediately visible advantages of regulating services.
Land ownership emerged as a significant predictor for overall regulating ESs, with a 6% increase in the likelihood of acknowledgment. This finding was in line with research conducted in Brazil [62]. Among the specific ESs, air quality was significantly influenced by land ownership, showing a 9% increase in the likelihood of acknowledgment. This may be due to larger landowners practicing agroforestry, where tree cover helps filter air pollutants, thereby improving air quality.
Livestock ownership was not a significant predictor of regulating ESs overall, although a positive trend was observed. At the individual ES level, it was not a significant predictor either. Interestingly, it showed a negative trend in relation to flood protection and air quality. This could stem from the fact that increased livestock numbers can lead to more intensive forest grazing, which in turn hampers forest regeneration and degrades regulating services like air filtration and soil stabilization. This outcome supports the findings from Li’s global meta-analysis on ESs [59].
Level of education was a significant predictor for regulating ESs overall (see Figure 7), with a fivefold increase in the likelihood of acknowledgment as education levels rose. This finding aligns with results from Lima’s study in Brazil [62]. Education significantly influences all four types of regulating ES: pollination—10-fold increased likelihood of acknowledgment; flood protection—24-fold; climate regulation—41-fold; air quality −4-fold. This strong association may be attributed to better-educated households being more likely to engage in environmental groups, access informational resources, and adopt sustainable land-use practices like agroforestry. These practices enhance their understanding and appreciation of ecosystem functions.
Gender of the household head was not a significant predictor of overall regulating ES acknowledgment, aligning with findings from other tropical studies [19]. However, a negative trend was observed, particularly in relation to flood protection. Female-headed households were 84% less likely to acknowledge flood protection ESs. This may reflect systemic gender disparities, where traditional norms in the region restrict women’s control over land-use decisions—particularly those that influence flood mitigation, such as terracing or buffer zone maintenance.
Market distance was also not a significant predictor for overall regulating ESs or for the individual ES categories. Nevertheless, a consistent negative trend was noted. This may indicate that households located closer to market centers exert greater pressure on forest resources and may rely less on natural regulating services. In contrast, households situated further from markets might depend more heavily on the forest-based regulation of natural processes, such as flood control, due to limited infrastructure and accessibility. These findings are in line with other regional studies [23]. The lack of statistical significance, however, may reflect the stronger influence of other predictors such as education.
Length of residence was not a statistically significant predictor of overall regulating ESs, but it did exhibit a positive trend with ES acknowledgment. This finding aligns with other research conducted in tropical contexts [19]. Notably, length of residence was a significant predictor for pollination and flood protection, with 28% and 30% increases in the likelihood of acknowledgment, respectively. This may be attributed to the greater ecological knowledge and seasonal familiarity possessed by long-term residents, who better understand the role of pollinators such as bees and butterflies and recognize how forest cover mitigates flooding risks.
CFA membership was also not a significant predictor for overall regulating ESs but similarly showed a positive trend in acknowledgment (see Appendix C.3). This outcome is consistent with Mengist’s findings in the Kaffa Biosphere Reserve [61]. CFA membership was a significant predictor for pollination, with a 13% increase in the likelihood of acknowledgment. This may be due to the influence of beekeeping user groups within the CFA structure, which enhances members’ awareness and appreciation of this specific ES. The outcome suggests a narrow governance focus, indicating that the CFAs may require capacity building to broaden their scope beyond provisioning and economic ESs toward a more inclusive and sustainable approach to governance that also prioritizes the management of regulating ecosystem functions.
Age was not a significant predictor of overall regulating ESs or of any of the individual ES categories, though a positive trend in acknowledgment was observed. This result corresponds with research from Brazil [62]. Interestingly, a negative trend was observed in relation to air quality. This may be due to older community members becoming desensitized to indoor air pollution—especially from traditional cooking with firewood—leading to lower acknowledgment of this ES. In contrast, the positive associations with other regulating services may reflect older individuals’ direct reliance on forest-regulated environmental stability, such as flood and temperature control.
Household size was not a statistically significant predictor for overall regulating ESs, though it demonstrated a positive association with acknowledgment of these services. This finding was consistent with Gouwakinnou’s research in Benin [27]. Notably, household size was a significant predictor for climate regulation, with a fivefold increase in the likelihood of acknowledgment. This may be attributed to the heightened vulnerability of larger households to climate-related shocks, particularly in regions reliant on rainfed agriculture, where more household members translate into greater food security demands.
Labor migration was also not a significant predictor of overall regulating ESs but showed a negative association with their acknowledgment. This outcome aligns with findings from Mexico [63]. Specifically, flood protection and climate regulation were significantly associated with labor migration, with 43% and 46% decreases in the likelihood of acknowledgment, respectively, for each unit increase in the predictor. This trend may reflect the behavioral shifts driven by remittances, such as the acquisition of household assets like livestock. Such assets can increase grazing pressure in forested areas, thereby diminishing the forest’s capacity to deliver regulating services. The research findings suggest a potential risk of elite capture within the CFA if asset-abundant households derive greater benefits from resources compared to less affluent households, thereby exacerbating existing inequalities and undermining equitable resource access.
3.2.3. Supporting ESs
Land ownership emerged as a significant predictor for supporting ESs, with an eightfold increase in the likelihood of acknowledgment for rainfall-related ESs with each unit increase in land ownership. This could be attributed to larger landowners’ reliance on rainfed agriculture and agroforestry practices to enhance their livelihoods. This finding aligns with similar outcomes reported in Bangladesh [58].
Conversely, livestock ownership was not a significant predictor of supporting ESs. This may be explained by the ecological degradation associated with overgrazing, which reduces plant biomass, hinders vegetation regrowth, and depletes soil quality—factors that disrupt the evapotranspiration cycle essential for rainfall generation. This observation supports Li’s findings, which linked livestock activities to soil degradation and reduced forest regeneration capacity [59].
Interestingly, the level of education did not significantly predict acknowledgment of supporting ESs. This may be due to limitations in educational curricula and extension services, which often emphasize biodiversity conservation, economic forestry products, and soil management rather than the ecological mechanisms behind supporting ESs such as rainfall generation. This outcome aligns with findings from similar studies conducted in the tropics [19,27].
Female-headed household structure was not a significant predictor of supporting ESs and exhibited a negative association with the acknowledgment of rainfall ESs. This could be attributed to the prioritization of immediate and tangible needs—such as water and food—by women, particularly in female-headed households, which may limit their engagement with more abstract or indirect services like rainfall regulation. This finding aligns with evidence from Ethiopia [61].
In contrast, the length of residence was a significant predictor of supporting ESs, with an 11% increase in the likelihood of acknowledging rainfall ESs per unit increase in years of residence (see Appendix C.1). This contrasts with findings from Benin [27]. The observed outcome may be due to long-term community residents possessing deeper ecological knowledge and longer observational histories, enabling them to more readily associate deforestation with declining rainfall patterns.
CFA membership was not a significant predictor of supporting ESs, contrasting with findings from the Kaffa Reserve in Ethiopia [61]. This could be attributed to the organizational focus of the CFA, which primarily supports provisioning ES user groups. While tree planting may occur within the CFA, rainfall regulation is not perceived as a direct or tangible benefit of membership, potentially reducing its influence on member acknowledgment of supporting ESs.
3.2.4. Cultural ES
Income and land ownership are not significant predictors of overall cultural ES or any of the four subcategories of cultural ESs. However, both variables demonstrate a negative association with cultural ESs. This may be attributed to the communal and culturally embedded nature of these services, which are often shared collectively and not dependent on wealth or private ownership. These findings are consistent with those of previous studies [13,19,28].
The level of education was also not a significant predictor of overall cultural ESs, although it shows a positive association. This outcome aligns with other research findings [28]. However, education level was a significant predictor for specific cultural ESs, namely wildlife habitat and environmental education, with 14-fold and 5-fold increases in the odds of acknowledgment, respectively. This could be explained by the tendency of more educated individuals to better understand and appreciate the long-term significance of such services, linking them to cultural heritage, biodiversity, and intergenerational well-being, despite their intangible nature.
Similarly, having a female-headed household was not a significant predictor of overall cultural ESs, though it indicated a positive association. This outcome aligns with findings from South Africa [13]. Notably, female-headed households showed a non-significant negative association with acknowledgment of wildlife habitat and environmental education. This may be due to the increased burden of childcare, farming responsibilities, domestic labor, and adult labor shortages, especially in cases where the husband is deceased. These constraints are likely to reduce the time and resources available to engage with non-material cultural ESs, shifting focus toward the household’s immediate and tangible needs.
Length of residence was a significant predictor for overall cultural ESs, with a 20% increase in the likelihood of ES acknowledgment (see Appendix C.4). This finding was consistent with Nyangoko’s research [19]. Additionally, the length of residence was a significant predictor for wildlife habitat and spiritual/religious value ESs, with 19% and 34% increases, respectively, in the likelihood ratio of acknowledgment. This may be attributed to the intergenerational transfer of traditional ecological knowledge. Additionally, long-term residents are more likely to inherit and preserve cultural and spiritual relationships with the forest, including knowledge of sacred sites and wildlife. These insights are supported by Were’s study in the KFE, which highlights the role of songs, stories, and rituals in conveying ecological and cultural knowledge [64].
Interestingly, CFA membership was not a significant predictor of overall cultural ESs, although it shows a positive association. This outcome contrasts with findings from Ethiopia [61]. CFA membership was also not a significant predictor for any of the four cultural ES subcategories. Moreover, the predictor exhibited a negative association with environmental education and spiritual and religious value ESs. This may be due to the CFA’s primary focus on provisioning ESs, which may lead members to place less emphasis on non-material and cultural dimensions of forest benefits.
Household size was not a significant predictor for overall cultural ESs but demonstrated a positive association with ES acknowledgment. This outcome aligns with previous research findings from Benin and Tanzania [27]. However, household size was a significant predictor for environmental education ESs, with a 10-fold increase in the odds of acknowledgment. This may be attributed to larger households having more school-aged children, who are likely to participate in educational trips to the KFE, thereby increasing their exposure and appreciation of this ES.
Labor migration, on the other hand, was a significant predictor for overall cultural ESs, with a 53% decrease in the likelihood ratio of acknowledgment for every unit increase in the predictor. This could be attributed to reduced physical presence and interaction with the forest among migrating household members, leading to weakened cultural ties and recognition of these ESs. Interestingly, labor migration was also a significant predictor for environmental education ESs, with a 14% increase in the odds of acknowledgment. This may be explained by the fact that remittances from migrants are often used to support education, including school excursions to the KFE. Conversely, labor migration was a significant negative predictor for spiritual and religious value ESs, with a 26% decrease in the likelihood odds of acknowledgment. This could reflect the erosion of generational and cultural knowledge, as younger migrants move to urban centers and disconnect from traditional practices and sacred forest sites, deepening the socio-cultural disparities. The mixed impacts of labor migration on cultural ESs highlights growing equity and governance challenges. While remittances can improve households’ welfare and access to education, they may also weaken spiritual connections to the forest, potentially undermining long-term stewardship, especially when migrant households are underrepresented in the CFAs. To address this, inclusive governance approaches are needed to effectively engage mobile populations and safeguard cultural ecosystem values as essential community benefits.
4. Conclusions and Recommendations
The aim of this research was to assess the relationship between ESs and local communities to support improved PFM. It explored the factors influencing the acknowledgment of various ESs in the KFE, underscoring the complex interplay between socio-economic factors, household dynamics, and environmental services.
Firewood emerged as the most widely acknowledged ecosystem service overall for supporting the energy needs of the households, and also as the leading provisioning ESs. Rainfall attraction was the most acknowledged supporting ESs for supporting agricultural production, mainly that of maize, beans, and sugarcane. Air quality was the most recognized regulating ESs for filtering the fine dust particles from the murram roads in Kakamega County. Wildlife habitat was the most acknowledged cultural ESs for holding recreational and educational value.
While economic factors like land ownership were influential in shaping the recognition of provisioning services, non-material values tied to cultural and regulating services were more strongly influenced by long-term residence and educational opportunities. These findings also highlight the importance of community-based forest management structures, like CFAs, in shaping access to and acknowledgment of forest resources, particularly provisioning services. Provisioning ES perception was influenced by land ownership and length of residence, with CFA membership playing a significant role in the acknowledgment of specific provisioning services under CFA user groups. For regulating ESs, education level emerged as a key predictor, with more educated households showing increased recognition of regulating ESs. When it comes to cultural ESs, length of residence emerged as a significant predictor, suggesting that households with a longer history in the area possess greater traditional ecological knowledge of resources such as medicinal plants, sacred groves, and spiritual significance. The perception of supporting ESs was influenced by the length of residence and land ownership. While some relationships were in line with previous studies, other outcomes revealed unique dynamics within the context of Kakamega Forest.
This study is among the first to empirically demonstrate the dual impact of labor migration on ecosystem service perception, suggesting that remittance economies may weaken traditional ecological knowledge while supporting formal education pathways.
CFA membership, length of residence, labor migration, and education emerged as the most consistent predictors across multiple ES categories, highlighting them as key leverage points for intervention. This indicates the following areas of intervention based on the results.
- Livelihood activities: creation of eco-based businesses (honey and medicinal plants) with a strong linkage to the market to ensure premium prices of the products, as well as the involvement of youths in these businesses to prevent outmigration.
- Preservation of cultural heritage: safeguarding cultural ESs through community programs such as forest walks and storytelling in schools to preserve cultural links.
- Enhance outreach programs: peer learning via CFA networks and involving long-term residents to create awareness of intangible ESs.
The study has certain limitations, including temporal constraints, as it provides only a snapshot in time. Socio-economic factors and perceptions of ESs may evolve with changes in policies, economic pressures, and climate. Also, a potential bias from CFA-dominated responses should be mentioned. Future research should consider conducting longitudinal studies on households (gendered impacts or the evolving role of CFAs under changing governance structures, integrating ecological data with perceptions studies, etc.). However, this research offers valuable insights into the socio-economic factors that influence ES perceptions, providing key areas of intervention for researchers and policymakers. It also paves the way for the community-informed sustainable management of the KFE and beyond. The findings highlight the nuanced influence of socio-economic factors—such as labor migration, education, and CFA membership—on the recognition and stewardship of all four ES categories. In regions across Africa and the Global South, where participatory dynamics are at play, these findings underscore the importance of developing inclusive forest policies that reflect the diverse socio-economic conditions of the local forest communities. Strengthening participatory governance structures to safeguard both tangible and intangible forest benefits is not only vital for local sustainability but also critical to achieving broader conservation and equity goals, as outlined in the Social Development Goals framework.
Author Contributions
Conceptualization, B.P. and I.O.; methodology, C.C., B.P. and I.O.; validation, C.C., A.-F.H., I.V.A. and B.P.; formal analysis, I.O. and E.O.O.; investigation, I.O., C.C. and B.P.; data curation, B.P. and I.O.; writing—original draft preparation, I.O.; writing—review and editing, C.C., A.-F.H., E.O.O., N.T., J.K.K., I.V.A., I.O. and B.P.; visualization, I.O.; supervision, B.P. and I.V.A.; project administration, B.P.; funding acquisition, I.V.A. All authors have read and agreed to the published version of the manuscript.
Funding
This research was funded by Transilvania University of Brasov, grant number DGRIAE-1445/III/8/CMJ/26.07.2022.
Data Availability Statement
The data presented in this study are available on request from the corresponding author.
Acknowledgments
This research was supported by the Kenya Forestry Research Institute through collaboration agreement REF: KEFRI/56/04/VOL.1(145) with Transilvania University of Brasov and Kenya Forest Service REF: RESEA/1/KFS/VOL.VIII/89.
Conflicts of Interest
The authors declare no conflicts of interest.
Abbreviations
The following abbreviations are used in this manuscript:
| ES | Ecosystem service |
| MEA | Millennium Ecosystem Assessment |
| CFA | Community forest association |
| PELIS | Plantation Establishment and Livelihood Improvement Scheme |
| KFE | Kakamega Forest Ecosystem |
| PFM | Participatory forest management |
| FGD | Focus group discussion |
| KII | Key informant interview |
| IGAs | Income-generating activities |
Appendix A
Appendix A.1. Questionnaire Used in Household Survey
- Section 1: Income and Wealth of the Households
- How much money do you make from your source(s) of income monthly (KES)?
- 0–5000 ☐ 5001–10,000 ☐ 10,001–20,000 ☐ 20,001–30,000 ☐ 30,001–40,000 ☐ 40,001–50,000 ☐ 50,001–60,000 ☐ >60,001 ☐
- 2.
- Do you own a piece of land?
- Yes ☐ No ☐
- 3.
- Do you own any livestock?
- Yes ☐ No ☐
- 4.
- Benefits of Kakamega Forest
| Identified | Select If You Acknowledge |
| Firewood | |
| Grazing grass | |
| Medicinal plants | |
| Food | |
| PELIS | |
| Rainfall | |
| Recreation | |
| IGAs | |
| Poles | |
| Charcoal | |
| Pollination | |
| Flood protection | |
| Wildlife habitat | |
| Sand provision | |
| Climate regulation | |
| Bee keeping | |
| Environmental education | |
| Air quality | |
| Spiritual and religious use | |
| Water |
- Section 2: Demographic Information
- 5.
- Gender
- Male ☐ Female ☐
- 6.
- Age _________
- 7.
- Level of education
- No formal education ☐ Primary education ☐ Secondary education ☐ College/tertiary education ☐ University (Bachelor/Master/PhD) ☐
- 8.
- What is the size of your household? ____________
- 9.
- How many members of the household work? ____________
- 10.
- Distance from the market.
- 0–2 km ☐ 2–4 km ☐ 4–6 km ☐ 6–8 km ☐ 8–9 km ☐ 9–10 km ☐ >10 km ☐
- 11.
- Length of residence (years).
- <20 ☐ 20–30 ☐ 30–40 ☐ 40–50 ☐ >50 ☐
- 12.
- How many members of the household work outside the town? _________
- 13.
- Do you belong to any CFA/forest user group?
- Yes ☐ No ☐
Appendix B
Appendix B.1. Socio-Economic Profile of the Respondents
| Attributes | Category | Respondent Percentage (Total) |
| Income (KES) (I euro = KES 135.57) | 0–5000 | 40.2 |
| 5001–10,000 | 25.2 | |
| 10,001–20,000 | 18.5 | |
| 20,001–30,000 | 7.1 | |
| 30,001–40,000 | 5.5 | |
| 40,001–50,000 | 2.9 | |
| 50,001–60,000 | 0.2 | |
| >60,000 | 0.4 | |
| Land ownership | Yes | 81.5 |
| No | 18.5 | |
| Livestock ownership | Yes | 84.3 |
| No | 15.7 | |
| CFA membership | Yes | 39.7 |
| No | 60.3 | |
| Level of education | No formal education | 8.2 |
| Primary education | 48.1 | |
| Secondary education | 30.5 | |
| College/tertiary education | 9.7 | |
| University education | 3.5 |
Appendix C. Socio-Economic Factors Influencing ES Acknowledgment
Appendix C.1. Overall Categories of ESs
| Provisioning ESs | Regulating ESs | Supporting ESs | Cultural ESs | |||||||||||||
| Variables | β | SE | Sig | Exp(β) | β | SE | Sig | Exp(β) | β | SE | Sig | Exp(β) | Β | SE | Sig | Exp(β) |
| Income | −0.27 | 0.68 | 0.7 | 0.77 | −0.82 | 0.72 | 0.26 | 0.44 | 0.85 | 0.57 | 0.14 | 2.33 | −0.43 | 0.6 | 0.48 | 0.53 |
| Land ownership | −3.05 | 0.32 | 0.01 * | 0.05 | 2.82 | 1.33 | 0.04 * | 1.06 | 4.35 | 1.06 | 0.001 * | 8.68 | −1.83 | 1.17 | 0.12 | 0.16 |
| Livestock ownership | 2.42 | 0.21 | 0.11 | 11.24 | 0.5 | 1.43 | 0.73 | 1.65 | 1.58 | 1.20 | 0.19 | 4.86 | 1.93 | 1.35 | 0.15 | 6.87 |
| Level of education | 1.72 | 0.99 | 0.09 | 5.6 | 1.72 | 1.1 | 0.01 * | 5.56 | 0.06 | 0.88 | 0.95 | 1.94 | 1.16 | 0.91 | 0.20 | 3.19 |
| Female household head (HH) | −1.71 | 0.05 | 0.1 | 0.18 | −0.12 | 1.2 | 0.92 | 0.89 | −1.13 | 0.93 | 0.23 | 0.32 | 0.52 | 1.04 | 0.62 | 1.68 |
| Market distance | −0.2 | 0.68 | 0.77 | 0.82 | −1.73 | 0.73 | 0.06 | 0.18 | 0.1 | 0.59 | 0.87 | 1.1 | −0.22 | 0.62 | 0.72 | 0.8 |
| Length of residence | 0.04 | 0.05 | 0.96 | 1.04 | 0.79 | 0.84 | 0.34 | 1.45 | 2.22 | 0.71 | 0.002 * | 1.11 | 1.6 | 0.72 | 0.03 * | 1.20 |
| CFA membership | 0.25 | 0.11 | 0.03 * | 1.28 | 0.63 | 1.1 | 0.56 | 1.88 | 1.2 | 0.86 | 0.16 | 3.3 | 0.21 | 0.91 | 0.81 | 1.24 |
| Age | −0.65 | 0.23 | 0.42 | 0.56 | 0.12 | 1.11 | 0.91 | 1.89 | 0.35 | 0.86 | 0.68 | 1.43 | 0.25 | 0.94 | 0.79 | 1.28 |
| Household size | 0.86 | 0.66 | 0.46 | 2.37 | 0.07 | 1.29 | 0.96 | 1.07 | 0.19 | 0.98 | 0.84 | 1.21 | 0.72 | 1.05 | 0.49 | 2.05 |
| Labor migration | −0.27 | 0.43 | 0.53 | 0.31 | −0.71 | 0.42 | 0.09 | 0.49 | 0.33 | 0.34 | 0.34 | 0.72 | −0.76 | 0.34 | 0.03 * | 0.47 |
| Constant | 1.50 | 0.74 | 0.04 | 4.5 | 2.78 | 0.86 | 0.001 | 16.08 | 2.0 | 0.67 | 0.003 | 7.41 | 1.58 | 0.69 | 0.02 | 4.86 |
| *—significant variable at p < 0.05. | ||||||||||||||||
Appendix C.2. Provisioning ESs
| Firewood | Grazing Grass | Medicinal Plants | Food | |||||||||||||
| Variables | β | SE | Sig | Exp(β) | β | SE | Sig | Exp(β) | β | SE | Sig | Exp(β) | Β | SE | Sig | Exp(β) |
| Income | −2.71 | 0.71 | <0.001 | 0.07 | −0.54 | 0.53 | 0.31 | 0.59 | 0.12 | 0.47 | 0.79 | 1.13 | −1.37 | 0.49 | 0.01 | 0.45 |
| Land ownership | 0.70 | 1.547 | 0.64 | 2.02 | −2.36 | 0.97 | 0.02 | 0.9 | −0.83 | 0.94 | 0.38 | 0.44 | −2.83 | 1.01 | 0.01 | 0.06 |
| Livestock ownership | −1.23 | 1.47 | 0.40 | 0.29 | 4.35 | 0.99 | <0.001 | 1.62 | 0.75 | 0.98 | 0.45 | 2.12 | 0.34 | 1.06 | 0.75 | 1.41 |
| Level of education | −2.06 | 1.21 | 0.09 | 0.13 | 0.32 | 0.82 | 0.7 | 1.37 | 1.38 | 0.74 | 0.06 | 3.96 | −1.04 | 0.8 | 0.2 | 0.36 |
| Female household head (HH) | 0.315 | 1.21 | 0.8 | 1.37 | −1.31 | 0.85 | 0.12 | 0.27 | −0.86 | 0.78 | 0.27 | 0.43 | −0.63 | 0.85 | 0.46 | 0.53 |
| Market distance | −0.74 | 0.7 | 0.3 | 0.48 | −0.94 | 0.52 | 0.07 | 0.39 | −0.43 | 0.48 | 0.37 | 0.65 | −0.42 | 0.52 | 0.42 | 0.66 |
| Length of residence | 0.68 | 0.75 | 0.37 | 1.98 | 1.76 | 0.58 | 0.01 | 5.83 | 0.07 | 0.53 | 0.89 | 1.93 | 1.52 | 0.59 | 0.01 | 1.22 |
| CFA membership | −0.71 | 1.02 | 0.48 | 0.49 | 2.21 | 0.8 | 0.27 | 1.11 | 0.99 | 0.71 | 0.16 | 2.69 | 0.45 | 0.74 | 0.05 | 1.57 |
| Age | 0.32 | 1.01 | 0.75 | 1.38 | −0.84 | 0.76 | 0.27 | 0.43 | 0.47 | 0.72 | 0.51 | 1.60 | 0.45 | 0.75 | 0.55 | 1.57 |
| Household size | 1.94 | 1.21 | 0.11 | 6.97 | 2.07 | 0.94 | 0.03 | 7.91 | 1.26 | 0.85 | 0.14 | 3.54 | 0.69 | 0.88 | 0.43 | 2.0 |
| Labor migration | −0.52 | 0.4 | 0.2 | 0.60 | −0.07 | 0.32 | 0.82 | 0.93 | −1.11 | 0.28 | <0.001 | 0.33 | −0.84 | 0.29 | 0.004 | 0.43 |
| Constant | 3.07 | 0.81 | <0.001 | 21.52 | 0.93 | 0.58 | 0.11 | 2.54 | −0.21 | 0.54 | 0.7 | 0.81 | 2.24 | 0.59 | <0.001 | 9.41 |
| Hosmer and Lemeshow Test | 0.08 | 0.40 | 0.06 | 0.38 | ||||||||||||
| PELIS | IGAs | Poles | Charcoal | |||||||||||||
| Variables | β | SE | Sig | Exp(β) | β | SE | Sig | Exp(β) | Β | SE | Sig | Exp(β) | Β | SE | Sig | Exp(β) |
| Income | −0.67 | 0.58 | 0.24 | 0.51 | −1.24 | 0.58 | 0.03 | 0.29 | −0.46 | 0.49 | 0.35 | 0.63 | 1.49 | 0.46 | 0.001 | 4.45 |
| Land ownership | −3.3 | 1.27 | 0.01 | 0.04 | −3.59 | 1.33 | 0.01 | 0.03 | −0.39 | 1.02 | 0.7 | 0.68 | 2.64 | 0.94 | 0.005 | 14.04 |
| Livestock ownership | −0.01 | 1.28 | 0.99 | 0.99 | 2.96 | 1.18 | 0.01 | 19.4 | −0.02 | 1.05 | 0.99 | 0.10 | −0.98 | 0.98 | 0.32 | 0.38 |
| Level of education | 0.99 | 0.94 | 0.29 | 2.7 | 2.11 | 0.98 | 0.03 | 8.27 | 0.58 | 0.79 | 0.47 | 1.78 | −0.88 | 0.72 | 0.22 | 0.42 |
| Female household head (HH) | −1.29 | 1.03 | 0.21 | 0.28 | −0.73 | 1.0 | 0.47 | 0.48 | −0.7 | 0.86 | 0.41 | 0.5 | 0.13 | 0.78 | 0.86 | 1.14 |
| Market distance | −0.41 | 0.61 | 0.05 | 0.66 | 0.45 | 0.6 | 0.45 | 1.57 | 0.12 | 0.51 | 0.82 | 1.12 | −0.59 | 0.04 | 0.21 | 0.55 |
| Length of residence | 1.7 | 0.67 | 0.01 | 1.18 | 0.92 | 0.66 | 0.17 | 1.04 | 1.7 | 0.55 | 0.002 | 1.19 | 0.34 | 0.52 | 0.51 | 1.71 |
| CFA membership | 9.33 | 0.89 | <0.001 | 2.33 | 6.28 | 0.9 | <0.001 | 1.12 | −1.21 | 0.73 | 0.1 | 0.3 | 1.23 | 0.69 | 0.8 | 3.43 |
| Age | 1.27 | 0.97 | 0.19 | 3.57 | 0.28 | 0.94 | 0.76 | 1.33 | 1.71 | 0.8 | 0.03 | 5.5 | 1.37 | 0.71 | 0.5 | 3.95 |
| Household size | 0.79 | 1.07 | 0.46 | 2.2 | 2.1 | 1.09 | 0.56 | 8.12 | 0.67 | 0.92 | 0.47 | 1.95 | −0.54 | 0.83 | 0.52 | 0.58 |
| Labor migration | −0.08 | 0.35 | 0.82 | 0.92 | −0.32 | 0.36 | 0.37 | 0.72 | 0.14 | 0.3 | 0.65 | 1.15 | 0.38 | 0.28 | 0.17 | 1.46 |
| Constant | 0.69 | 0.65 | 0.29 | 2.0 | −1.2 | 0.68 | 0.08 | 0.3 | −1.13 | 0.58 | 0.05 | 0.32 | −0.97 | 0.53 | 0.07 | 0.38 |
| Hosmer and Lemeshow Test | 0.49 | 0.15 | 0.16 | 0.7 | ||||||||||||
| Sand provision | Beekeeping (honey) | Water | ||||||||||||||
| Variables | β | SE | Sig | Exp(β) | β | SE | Sig | Exp(β) | Β | SE | Sig | Exp(β) | ||||
| Income | −1.0 | 0.47 | 0.03 | 0.37 | −1.14 | 0.57 | 0.047 | 0.32 | −1.13 | 0.45 | 0.01 | 0.32 | ||||
| Land ownership | −0.85 | 0.96 | 0.38 | 0.43 | 0.68 | 1.14 | 0.55 | 1.98 | 2.0 | 0.96 | 0.04 | 7.35 | ||||
| Livestock ownership | 0.68 | 0.97 | 0.49 | 1.97 | −1.87 | 1.33 | 0.16 | 0.15 | −0.41 | 0.96 | 0.67 | 0.67 | ||||
| Level of education | 0.98 | 0.76 | 0.2 | 2.67 | 1.22 | 0.92 | 0.19 | 3.39 | −1.53 | 0.73 | 0.04 | 0.22 | ||||
| Female household head (HH) | −1.47 | 0.83 | 0.04 | 0.23 | −2.4 | 1.08 | 0.03 | 0.09 | −1.0 | 0.78 | 0.21 | 0.37 | ||||
| Market distance | −0.22 | 0.49 | 0.65 | 0.8 | −0.42 | 0.6 | 0.48 | 0.66 | −0.78 | 0.47 | 0.09 | 0.46 | ||||
| Length of residence | 1.57 | 0.53 | 0.003 | 1.21 | 1.54 | 0.63 | 0.02 | 1.22 | 0.7 | 0.53 | 0.19 | 1.5 | ||||
| CFA membership | 1.24 | 0.71 | 0.08 | 1.29 | 2.76 | 0.86 | 0.001 | 1.06 | 0.67 | 0.69 | 0.33 | 1.95 | ||||
| Age | 0.93 | 0.73 | 0.21 | 2.53 | −0.71 | 0.86 | 0.41 | 0.49 | −0.04 | 0.71 | 0.96 | 0.96 | ||||
| Household size | 0.7 | 0.87 | 0.42 | 2.02 | 4.66 | 1.15 | <0.001 | 6.43 | 0.44 | 0.84 | 0.6 | 1.55 | ||||
| Labor migration | −0.38 | 0.29 | 0.2 | 0.69 | 0.85 | 0.33 | 0.01 | 2.34 | −0.15 | 0.28 | 0.6 | 0.86 | ||||
| Constant | −0.29 | 0.54 | 0.6 | 0.75 | −1.86 | 0.68 | 0.006 | 0.16 | 1.19 | 0.53 | 0.02 | 3.3 | ||||
| Hosmer and Lemeshow Test | 0.93 | 0.07 | 0.62 | |||||||||||||
Appendix C.3. Regulating ESs
| Pollination | Flood Protection | Climate Regulation | Air Quality | |||||||||||||
| Variables | β | SE | Sig | Exp(β) | β | SE | Sig | Exp(β) | β | SE | Sig | Exp(β) | Β | SE | Sig | Exp(β) |
| Income | −0.32 | 0.48 | 0.51 | 0.73 | −0.09 | 0.45 | 0.84 | 0.91 | −0.3 | 0.46 | 0.51 | 0.74 | −0.14 | 0.55 | 0.8 | 0.87 |
| Land ownership | 0.55 | 0.99 | 0.58 | 1.57 | 0.06 | 0.93 | 0.95 | 1.94 | 0.74 | 0.93 | 1.42 | 1.48 | 2.41 | 1.06 | 0.02 | 1.09 |
| Livestock ownership | 1.83 | 1.0 | 0.06 | 6.26 | −0.78 | 0.95 | 0.42 | 0.46 | 1.65 | 0.96 | 0.09 | 5.19 | −0.12 | 1.1 | 0.91 | 0.89 |
| Level of education | 2.36 | 0.82 | 0.004 | 10.6 | 3.16 | 0.76 | <0.001 | 23.7 | 3.72 | 0.78 | <0.01 | 41.4 | 1.29 | 0.86 | 0.13 | 3.64 |
| Female household head (HH) | −0.03 | 0.84 | 0.98 | 0.98 | −1.86 | 0.79 | 0.02 | 0.16 | 0.04 | 0.79 | 0.96 | 1.04 | 0.6 | 0.95 | 0.53 | 1.82 |
| Market distance | −0.96 | 0.51 | 0.06 | 0.38 | −0.29 | 0.47 | 0.54 | 0.75 | −0.79 | 0.47 | 0.09 | 0.45 | −0.34 | 0.57 | 0.55 | 0.71 |
| Length of residence | 1.29 | 0.55 | 0.02 | 1.28 | 1.21 | 0.53 | 0.02 | 1.3 | 0.5 | 0.53 | 0.35 | 1.61 | 0.71 | 0.63 | 0.26 | 1.49 |
| CFA membership | 2.07 | 0.72 | 0.004 | 1.13 | 0.15 | 0.7 | 0.84 | 1.16 | 0.34 | 0.7 | 0.62 | 1.71 | 0.77 | 0.82 | 0.35 | 2.16 |
| Age | 0.6 | 0.74 | 0.42 | 1.82 | 0.53 | 0.7 | 0.45 | 1.7 | 0.63 | 0.71 | 0.37 | 1.89 | −1.23 | 0.9 | 0.17 | 0.29 |
| Household size | 1.07 | 0.9 | 0.23 | 2.92 | 1.18 | 0.85 | 0.17 | 3.25 | 1.65 | 0.85 | 0.05 | 5.22 | 1.53 | 0.97 | 0.11 | 4.63 |
| Labor migration | −0.26 | 0.3 | 0.39 | 0.77 | −0.57 | 0.28 | 0.04 | 0.57 | −0.61 | 0.28 | 0.03 | 0.54 | −0.46 | 0.32 | 0.15 | 0.63 |
| Constant | −1.15 | 0.57 | 0.04 | 0.32 | −0.85 | 0.54 | 0.12 | 0.43 | −1.38 | 0.54 | 0.01 | 0.25 | 1.36 | 0.63 | 0.03 | 3.88 |
| Hosmer and Lemeshow Test | 0.16 | 0.90 | 0.21 | 0.07 | ||||||||||||
Appendix C.4. Cultural ESs
| Wildlife Habitat | Environmental Education | Spiritual and Religious Value | Recreation | |||||||||||||
| Variables | β | SE | Sig | Exp(β) | β | SE | Sig | Exp(β) | β | SE | Sig | Exp(β) | β | SE | Sig | Exp(β) |
| Income | −0.29 | 0.46 | 0.53 | 0.75 | −0.72 | 0.45 | 0.49 | 0.49 | −0.48 | 0.45 | 0.28 | 0.62 | −0.01 | 0.46 | 0.98 | 0.99 |
| Land ownership | −1.65 | 0.93 | 0.08 | 0.19 | −0.15 | 0.91 | 0.86 | 0.86 | −0.59 | 0.91 | 0.52 | 0.55 | −0.19 | 0.92 | 0.83 | 0.82 |
| Livestock ownership | 0.83 | 0.96 | 0.39 | 2.3 | −0.73 | 0.93 | 0.44 | 0.48 | −0.06 | 0.94 | 0.95 | 0.94 | 0.13 | 0.95 | 0.89 | 1.14 |
| Level of education | 2.65 | 0.75 | <0.001 | 14.2 | 1.62 | 0.72 | 0.03 | 5.05 | −1.35 | 0.72 | 0.06 | 0.26 | −0.17 | 0.73 | 0.82 | 0.85 |
| Female household head (HH) | −1.0 | 0.78 | 0.2 | 0.37 | −0.55 | 0.77 | 0.47 | 0.58 | 0.04 | 0.77 | 0.96 | 1.03 | 0.09 | 0.78 | 0.91 | 1.01 |
| Market distance | −0.32 | 0.47 | 0.5 | 0.73 | −0.84 | 0.46 | 0.07 | 0.43 | −0.23 | 0.46 | 0.62 | 0.79 | −0.4 | 0.48 | 0.4 | 0.67 |
| Length of residence | 1.65 | 0.54 | 0.002 | 1.19 | 0.76 | 0.52 | 0.14 | 1.47 | 1.09 | 0.52 | 0.04 | 1.34 | 0.83 | 0.52 | 0.11 | 1.44 |
| CFA membership | 1.26 | 0.7 | 0.07 | 3.54 | −0.75 | 0.68 | 0.27 | 0.47 | −1.17 | 0.68 | 0.80 | 0.84 | 0.37 | 0.7 | 0.6 | 1.44 |
| Age | 1.02 | 0.71 | 0.15 | 2.77 | 0.37 | 0.69 | 0.6 | 1.69 | 0.22 | 0.69 | 1.75 | 1.8 | 0.44 | 0.69 | 0.53 | 1.65 |
| Household size | −0.37 | 0.84 | 0.66 | 0.69 | 2.38 | 0.85 | 0.005 | 10.8 | 2.25 | 0.85 | 008 | 9.45 | 0.89 | 0.84 | 0.29 | 2.43 |
| Labor migration | −0.2 | 0.28 | 0.48 | 0.82 | 0.13 | 0.28 | 0.03 | 1.14 | −0.3 | 0.28 | 0.02 | 0.74 | −0.06 | 0.28 | 0.83 | 0.94 |
| Constant | −0.24 | 0.53 | 0.65 | 0.79 | −0.27 | 0.52 | 0.6 | 0.76 | 0.35 | 0.52 | 0.5 | 1.42 | −0.29 | 0.53 | 0.58 | 0.75 |
| Hosmer and Lemeshow Test | 0.08 | 0.61 | 0.81 | 0.73 | ||||||||||||
References
- Brockerhoff, E.G.; Barbaro, L.; Castagneyrol, B.; Forrester, D.I.; Gardiner, B.; González-Olabarria, J.R.; Lyver, P.O.B.; Meurisse, N.; Oxbrough, A.; Taki, H.; et al. Forest Biodiversity, Ecosystem Functioning and the Provision of Ecosystem Services. Biodivers. Conserv. 2017, 26, 3005–3035. [Google Scholar] [CrossRef]
- MEA, M. Ecosystem Assessment. In Ecosystems and Human Well-Being; Island Press: Washington, DC, USA, 2005; Volume 5. [Google Scholar]
- Ahammad, R.; Stacey, N.; Sunderland, T.C.H. Use and Perceived Importance of Forest Ecosystem Services in Rural Livelihoods of Chittagong Hill Tracts, Bangladesh. Ecosyst. Serv. 2019, 35, 87–98. [Google Scholar] [CrossRef]
- Osewe, E.O.; Popa, B.; Vacik, H.; Osewe, I.; Abrudan, I. V Review of Forest Ecosystem Services Evaluation Studies in East Africa. Front. Ecol. Evol. 2024, 12, 1385351. [Google Scholar] [CrossRef]
- Sutherland, I.J.; Villamagna, A.M.; Dallaire, C.O.; Bennett, E.M.; Chin, A.T.M.; Yeung, A.C.Y.; Lamothe, K.A.; Tomscha, S.A.; Cormier, R. Undervalued and under Pressure: A Plea for Greater Attention toward Regulating Ecosystem Services. Ecol. Indic. 2018, 94, 23–32. [Google Scholar] [CrossRef]
- Ellison, D.; Futter, M.N.; Bishop, K. On the Forest Cover–Water Yield Debate: From Demand- to Supply-Side Thinking. Glob. Change Biol. 2012, 18, 806–820. [Google Scholar] [CrossRef]
- Plieninger, T.; Dijks, S.; Oteros-Rozas, E.; Bieling, C. Assessing, Mapping, and Quantifying Cultural Ecosystem Services at Community Level. Land Use Policy 2013, 33, 118–129. [Google Scholar] [CrossRef]
- Wangchuk, J.; Choden, K.; Sears, R.R.; Baral, H.; Yoezer, D.; Tamang, K.T.D.; Choden, T.; Wangdi, N.; Dorji, S.; Dukpa, D.; et al. Community Perception of Ecosystem Services from Commercially Managed Forests in Bhutan. Ecosyst. Serv. 2021, 50, 101335. [Google Scholar] [CrossRef]
- Soe, K.T.; Yeo-Chang, Y.O.U.N. Perceptions of Forest-Dependent Communities toward Participation in Forest Conservation: A Case Study in Bago Yoma, South-Central Myanmar. For. Policy Econ. 2019, 100, 129–141. [Google Scholar] [CrossRef]
- Loft, L.; Le, D.N.; Pham, T.T.; Yang, A.L.; Tjajadi, J.S.; Wong, G.Y. Whose Equity Matters? National to Local Equity Perceptions in Vietnam’s Payments for Forest Ecosystem Services Scheme. Ecol. Econ. 2017, 135, 164–175. [Google Scholar] [CrossRef]
- Ouko, C.A.; Mulwa, R.; Kibugi, R.; Owuor, M.A.; Zaehringer, J.G.; Oguge, N.O. Community Perceptions of Ecosystem Services and the Management of Mt. Marsabit Forest in Northern Kenya. Environments 2018, 5, 121. [Google Scholar] [CrossRef]
- Osewe, I.; Hălălișan, A.-F.; Talpă, N.; Popa, B. Critical Analysis of Payments for Ecosystem Services: Case Studies in Kenya, Uganda and Tanzania. Forests 2023, 14, 1209. [Google Scholar] [CrossRef]
- Mensah, S.; Veldtman, R.; Assogbadjo, A.E.; Ham, C.; Glèlè Kakaï, R.; Seifert, T. Ecosystem Service Importance and Use Vary with Socio-Environmental Factors: A Study from Household-Surveys in Local Communities of South Africa. Ecosyst. Serv. 2017, 23, 1–8. [Google Scholar] [CrossRef]
- Nyathi, N.A.; Musakwa, W.; Azilagbetor, D.M.; Kuhn, N.J. Perceptions of Cultural and Provisioning Ecosystem Services and Human Wellbeing Indicators amongst Indigenous Communities Neighbouring the Greater Limpopo Transfrontier Conservation Area. Heliyon 2025, 11, e41448. [Google Scholar] [CrossRef]
- Tessema, S.B.; Nayak, D. Analyzing the Perceived Prioritized Forest Ecosystem Services under the Participatory Management: A Case of Maksegnit District, Amhara Regional State, Ethiopia. Trees For. People 2022, 9, 100318. [Google Scholar] [CrossRef]
- Hassen, A.; Zander, K.K.; Manes, S.; Meragiaw, M. Local People’s Perception of Forest Ecosystem Services, Traditional Conservation, and Management Approaches in North Wollo, Ethiopia. J. Environ. Manag. 2023, 330, 117118. [Google Scholar] [CrossRef]
- Mengist, W.; Soromessa, T.; Feyisa, G.L. A Global View of Regulatory Ecosystem Services: Existed Knowledge, Trends, and Research Gaps. Ecol. Process. 2020, 9, 40. [Google Scholar] [CrossRef]
- Lambini, C.K.; Nguyen, T.T. Impact of Community Based Conservation Associations on Forest Ecosystem Services and Household Income: Evidence from Nzoia Basin in Kenya. J. Sustain. For. 2022, 41, 440–460. [Google Scholar] [CrossRef]
- Nyangoko, B.P.; Berg, H.; Mangora, M.M.; Gullström, M.; Shalli, M.S. Community Perceptions of Mangrove Ecosystem Services and Their Determinants in the Rufiji Delta, Tanzania. Sustainability 2020, 13, 63. [Google Scholar] [CrossRef]
- Rasmussen, L.V.; Watkins, C.; Agrawal, A. Forest Contributions to Livelihoods in Changing Agriculture-Forest Landscapes. For. Policy Econ. 2017, 84, 1–8. [Google Scholar] [CrossRef]
- Dehghani Pour, M.; Barati, A.A.; Azadi, H.; Scheffran, J.; Shirkhani, M. Analyzing Forest Residents’ Perception and Knowledge of Forest Ecosystem Services to Guide Forest Management and Biodiversity Conservation. For. Policy Econ. 2023, 146, 102866. [Google Scholar] [CrossRef]
- Osewe, E.O.; Popa, B.; Kagombe, J.K.; Osewe, I.; Abrudan, I.V. Ecosystem Services Values for Local People in Participatory Forestry Context: The Case of Karura Urban Forest Reserve. Trees For. People 2025, 20, 100834. [Google Scholar] [CrossRef]
- Muhamad, D.; Okubo, S.; Harashina, K.; Parikesit; Gunawan, B.; Takeuchi, K. Living Close to Forests Enhances People’s Perception of Ecosystem Services in a Forest–Agricultural Landscape of West Java, Indonesia. Ecosyst. Serv. 2014, 8, 197–206. [Google Scholar] [CrossRef]
- Djagoun, C.A.M.S.; Zanvo, S.; Padonou, E.A.; Sogbohossou, E.; Sinsin, B. Perceptions of Ecosystem Services: A Comparison between Sacred and Non-Sacred Forests in Central Benin (West Africa). For. Ecol. Manag. 2022, 503, 119791. [Google Scholar] [CrossRef]
- Katsuda, K.; Ikuyo, S.; Kikuko, S.; Kamijo, T. Local Perception of Ecosystem Services Provided by Symbolic Wild Cherry Blossoms: Toward Community-Based Management of Traditional Forest Landscapes in Japan. Ecosyst. People 2022, 18, 275–288. [Google Scholar] [CrossRef]
- Lau, J.D.; Hicks, C.C.; Gurney, G.G.; Cinner, J.E. Disaggregating Ecosystem Service Values and Priorities by Wealth, Age, and Education. Ecosyst. Serv. 2018, 29, 91–98. [Google Scholar] [CrossRef]
- Gouwakinnou, G.N.; Biaou, S.; Vodouhe, F.G.; Tovihessi, M.S.; Awessou, B.K.; Biaou, H.S.S. Local Perceptions and Factors Determining Ecosystem Services Identification around Two Forest Reserves in Northern Benin. J. Ethnobiol. Ethnomed. 2019, 15, 61. [Google Scholar] [CrossRef]
- Shi, Q.; Chen, H.; Liang, X.; Zhang, H.; Liu, D. Cultural Ecosystem Services Valuation and Its Multilevel Drivers: A Case Study of Gaoqu Township in Shaanxi Province, China. Ecosyst. Serv. 2020, 41, 101052. [Google Scholar] [CrossRef]
- Benra, F.; Nahuelhual, L. A Trilogy of Inequalities: Land Ownership, Forest Cover and Ecosystem Services Distribution. Land Use Policy 2019, 82, 247–257. [Google Scholar] [CrossRef]
- Gilani, H.R.; Yoshida, T.; Innes, J.L. A Collaborative Forest Management User Group’s Perceptions and Expectations on REDD+ in Nepal. For. Policy Econ. 2017, 80, 27–33. [Google Scholar] [CrossRef]
- Nyangoko, B.P.; Shalli, M.S.; Mangora, M.M.; Gullström, M.; Berg, H. Socioeconomic Determinants of Mangrove Exploitation and Management in the Pangani River Estuary, Tanzania. Ecol. Soc. 2022, 27, 32. [Google Scholar] [CrossRef]
- Khan, S.U.; Khan, I.; Zhao, M.; Chien, H.; Lu, Q.; Ali, M.A.S.; Khan, A.A.; Fahad, S. Spatial Heterogeneity of Ecosystem Services: A Distance Decay Approach to Quantify Willingness to Pay for Improvements in Heihe River Basin Ecosystems. Environ. Sci. Pollut. Res. 2019, 26, 25247–25261. [Google Scholar] [CrossRef] [PubMed]
- Muyonga, M.K. Migration and Inequality in Kenya. Ph.D. Thesis, University of Nairobi, Nairobi, Kenya, 2023. [Google Scholar]
- Osewe, I.; Osewe, E.O.; Popa, B. Interconnection between Ecosystem Services and Local Communities: Knowledge Gap Identification in the Area of Kakamega Forest. Bull. Transilv. Univ. Bras. 2023, 16, 37–68. [Google Scholar] [CrossRef]
- UNDP KENYA Medium. UNDP Restoring the Jewel of Kakamega: Mission to UNDP Kenya FLARAK’s Fencing Project in Kakamega Forest. Available online: https://undp-kenya.medium.com/restoring-the-jewel-of-kakamega-mission-to-undp-kenya-flaraks-fencing-project-in-kakamega-forest-b176b5a3c626 (accessed on 17 July 2024).
- Wekesa, C.; Mutta, D.; Larwanou, M.; Kowero, G.; Roos, A. Effects of Charcoal Ban on Value Chains and Livelihoods in Kenyan Coast—Stakeholders’ Perceptions. Environ. Dev. 2023, 45, 100809. [Google Scholar] [CrossRef]
- Ongugo, P. Participatory Forest Management in Kenya: Is There Anything for the Poor? HimalDoc. Available online: https://lib.icimod.org/record/13228 (accessed on 1 August 2024).
- FAOLEX. GoK Forest Conservation and Management Act, 2016 (No. 34 of 2016). Available online: https://www.fao.org/faolex/results/details/en/c/LEX-FAOC160882/ (accessed on 1 August 2024).
- Esther, V.; Martha, K.; Harrison, T.; Lenard, O.; Charles, K.; Stella, W.; Humphrey, N. The Impacts of Human Activities on Tree Species Richness and Diversity in Kakamega Forest, Western Kenya. Int. J. Biodivers. Conserv. 2014, 6, 428–435. [Google Scholar] [CrossRef]
- Mitchell, N. Kakamega Forest Ecosystem: An Introduction to the Natural History and the Human Context. Ph.D. Thesis, Karlsruhe University of Applied Sciences, Karlsruhe, Germany, 2009. [Google Scholar]
- Fashing, P.J.; Forrestel, A.; Scully, C.; Cords, M. Long-Term Tree Population Dynamics and Their Implications for the Conservation of the Kakamega Forest, Kenya. Biodivers. Conserv. 2004, 13, 753–771. [Google Scholar] [CrossRef]
- Joram Kagombe, J.K.S.K. Kakamega Forest Strategic Ecosystem Management Plan 2015–2040. 2016. Available online: https://www.undp.org/sites/g/files/zskgke326/files/migration/ke/Nandi-Forests-Strategic-Plan-2015-2040.pdf (accessed on 21 April 2025).
- KWS Kakamega Forest Management Plan 2012–2022. 2012. Available online: https://www.kws.go.ke/sites/default/files/2019-11/Kakamega%20Forest%20Ecosystem%20Management%20Plan%20%282012-2022%29_0.pdf (accessed on 21 April 2025).
- KNBS 2019 Kenya Population and Housing Census Volume I: Population by County and Sub-County—Kenya National Bureau of Statistics. Available online: https://www.knbs.or.ke/reports/kenya-census-2019/ (accessed on 12 November 2024).
- Saalu, F.N.; Oriaso, S.; Gyampoh, B. Effects of a Changing Climate on Livelihoods of Forest Dependent Communities. Int. J. Clim. Change Strateg. Manag. 2020, 12, 1–21. [Google Scholar] [CrossRef]
- Siri, J.G.; Lindblade, K.A.; Rosen, D.H.; Onyango, B.; Vulule, J.M.; Slutsker, L.; Wilson, M.L. A Census-Weighted, Spatially-Stratified Household Sampling Strategy for Urban Malaria Epidemiology. Malar. J. 2008, 7, 39. [Google Scholar] [CrossRef]
- Awuah, R.; Douglass, R.; Agyepong, S.; Kuwornu, E. An Adaptive Household Sampling Method for Rural African Communities. Afr. J. Food Agric. Nutr. Dev. 2017, 17, 11477–11496. [Google Scholar] [CrossRef]
- Murray-Rust, D.; Dendoncker, N.; Dawson, T.P.; Acosta-Michlik, L.; Karali, E.; Guillem, E.; Rounsevell, M. Conceptualising the Analysis of Socio-Ecological Systems through Ecosystem Services and Agent-Based Modelling. J. Land Use Sci. 2011, 6, 83–99. [Google Scholar] [CrossRef]
- Musyoki, J.K.; Mugwe, J.; Mutundu, K.; Muchiri, M. Determinants of Household Decision to Join Community Forest Associations: A Case Study of Kenya. Int. Sch. Res. Not. 2013, 2013, 902325. [Google Scholar] [CrossRef]
- Shrestha, K.; Fisher, R. Labour Migration, the Remittance Economy and the Changing Context of Community Forestry in Nepal. In Community Forestry in Nepal: Adapting to a Changing World; Routledge: Oxfordshire, UK, 2017; pp. 171–192. [Google Scholar]
- Nyang’au, P.; Beatrice, M.; Rose, M.; John, B.; Nixon, O.; and Irungu, J. Effect of Participation in Commercial Production of Medicinal Plants through Community-Based Conservation Groups on Farm Income at Kakamega Forest, Kenya. J. Sustain. For. 2020, 39, 543–562. [Google Scholar] [CrossRef]
- Kim, L.T.T.; Nichols, J.D.; Brown, K. Firewood Extraction and Use in Rural Vietnam: A Household Model for Three Communes in Ha Tinh Province. Agrofor. Syst. 2017, 91, 649–661. [Google Scholar] [CrossRef]
- Onyango, C.M.; Kunyanga, C.N.; Ontita, E.G.; Narla, R.D.; Kimenju, J.W. Current Status on Production and Utilization of Spider Plant (Cleome Gynandra L.) an Underutilized Leafy Vegetable in Kenya. Genet. Resour. Crop. Evol. 2013, 60, 2183–2189. [Google Scholar] [CrossRef]
- Ojunga, S.O.; Langat, D.K.; Owange, K.; Otuoma, J.; Ayaga, G.; Muskiton, K.C.; Wanyiri, M.; Isack, M. The Medicinal Plants and Their Economic Value in Kakamega Forest Ecosystem: A Case Study of Sustainable Land/Forest Project in Western Kenya. J. Med. Herbs Ethnomed. 2023, 9, 18–25. [Google Scholar] [CrossRef]
- Mrema, J.P. Forest Resources and Local Elite Capture: Revisiting a Community-Based Forest Management “success Case” in Tanzania. In Corruption, Natural Resources and Development: From Resource Curse to Political Ecology; Edward Elgar Publishing: Cheltenham, UK, 2017; pp. 131–141. [Google Scholar] [CrossRef]
- OCHA. OCHA Kenya: Heavy Rains and Flooding Update—Flash Update #6 (17 May 2024). Available online: https://www.unocha.org/publications/report/kenya/kenya-heavy-rains-and-flooding-update-flash-update-6-17-may-2024 (accessed on 13 July 2024).
- Adeyemi, O.; Chirwa, P.W.; Babalola, F.D. Assessing Local People’s Perceptions and Preference for Ecosystem Services to Support Management Plan in Omo Biosphere Reserve, Nigeria. Environ. Dev. 2022, 43, 100738. [Google Scholar] [CrossRef]
- Ahammad, R.; Stacey, N.; Sunderland, T.; Sangha, K.K. Land Use Preference for Ecosystem Services and Well-Being in Chittagong Hill Tracts of Bangladesh. Forests 2022, 13, 2086. [Google Scholar] [CrossRef]
- Li, B.V.; Jiang, B. Responses of Forest Structure, Functions, and Biodiversity to Livestock Disturbances: A Global Meta-Analysis. Glob. Change Biol. 2021, 27, 4745–4757. [Google Scholar] [CrossRef]
- Adhikari, S.; Harada, K.; Dahal, N.K.; Gurung, R. Scientific Forest Management Practices in Nepal: Perceptions of Forest Users and the Impact on Their Livelihoods. J. For. Res. 2024, 29, 159–168. [Google Scholar] [CrossRef]
- Mengist, W.; Soromessa, T.; Feyisa, G.L.; Jenerette, G.D. Socio-Environmental Determinants of the Perceived Value of Moist Afromontane Forest Ecosystem Services in Kaffa Biosphere Reserve, Ethiopia. For. Policy Econ. 2022, 136, 102688. [Google Scholar] [CrossRef]
- Lima, F.P.; Bastos, R.P. Perceiving the Invisible: Formal Education Affects the Perception of Ecosystem Services Provided by Native Areas. Ecosyst. Serv. 2019, 40, 101029. [Google Scholar] [CrossRef]
- Schmook, B.; Radel, C. International Labor Migration from a Tropical Development Frontier: Globalizing Households and an Incipient Forest Transition: The Southern Yucatán Case. Hum. Ecol. 2008, 36, 891–908. [Google Scholar] [CrossRef]
- Were, L.; Kassilly, J.; Ahaya, O.L. The Indigenous Abaluhyia Worldview in Communicating Conservation of Kakamega Forest, Kenya. Afr. J. Empir. Res. 2024, 5, 94–106. [Google Scholar] [CrossRef]
Disclaimer/Publisher’s Note: The statements, opinions and data contained in all publications are solely those of the individual author(s) and contributor(s) and not of MDPI and/or the editor(s). MDPI and/or the editor(s) disclaim responsibility for any injury to people or property resulting from any ideas, methods, instructions or products referred to in the content. |
© 2025 by the authors. Licensee MDPI, Basel, Switzerland. This article is an open access article distributed under the terms and conditions of the Creative Commons Attribution (CC BY) license (https://creativecommons.org/licenses/by/4.0/).