
Nutrient Ratios in the Leaves and Stems of Eucalyptus and Corymbia Species Under High Soil Phosphate

 ,
, 


Abstract
:1. Introduction
2. Material and Methods
2.1. Experimental Design
2.2. Soil Sampling and Treatment
2.3. Plant Material
2.4. Photosynthesis-Related Parameters
2.5. Growth Parameters and Nutrient Analysis
2.6. Statistical Analysis
2.7. GenAI Usage
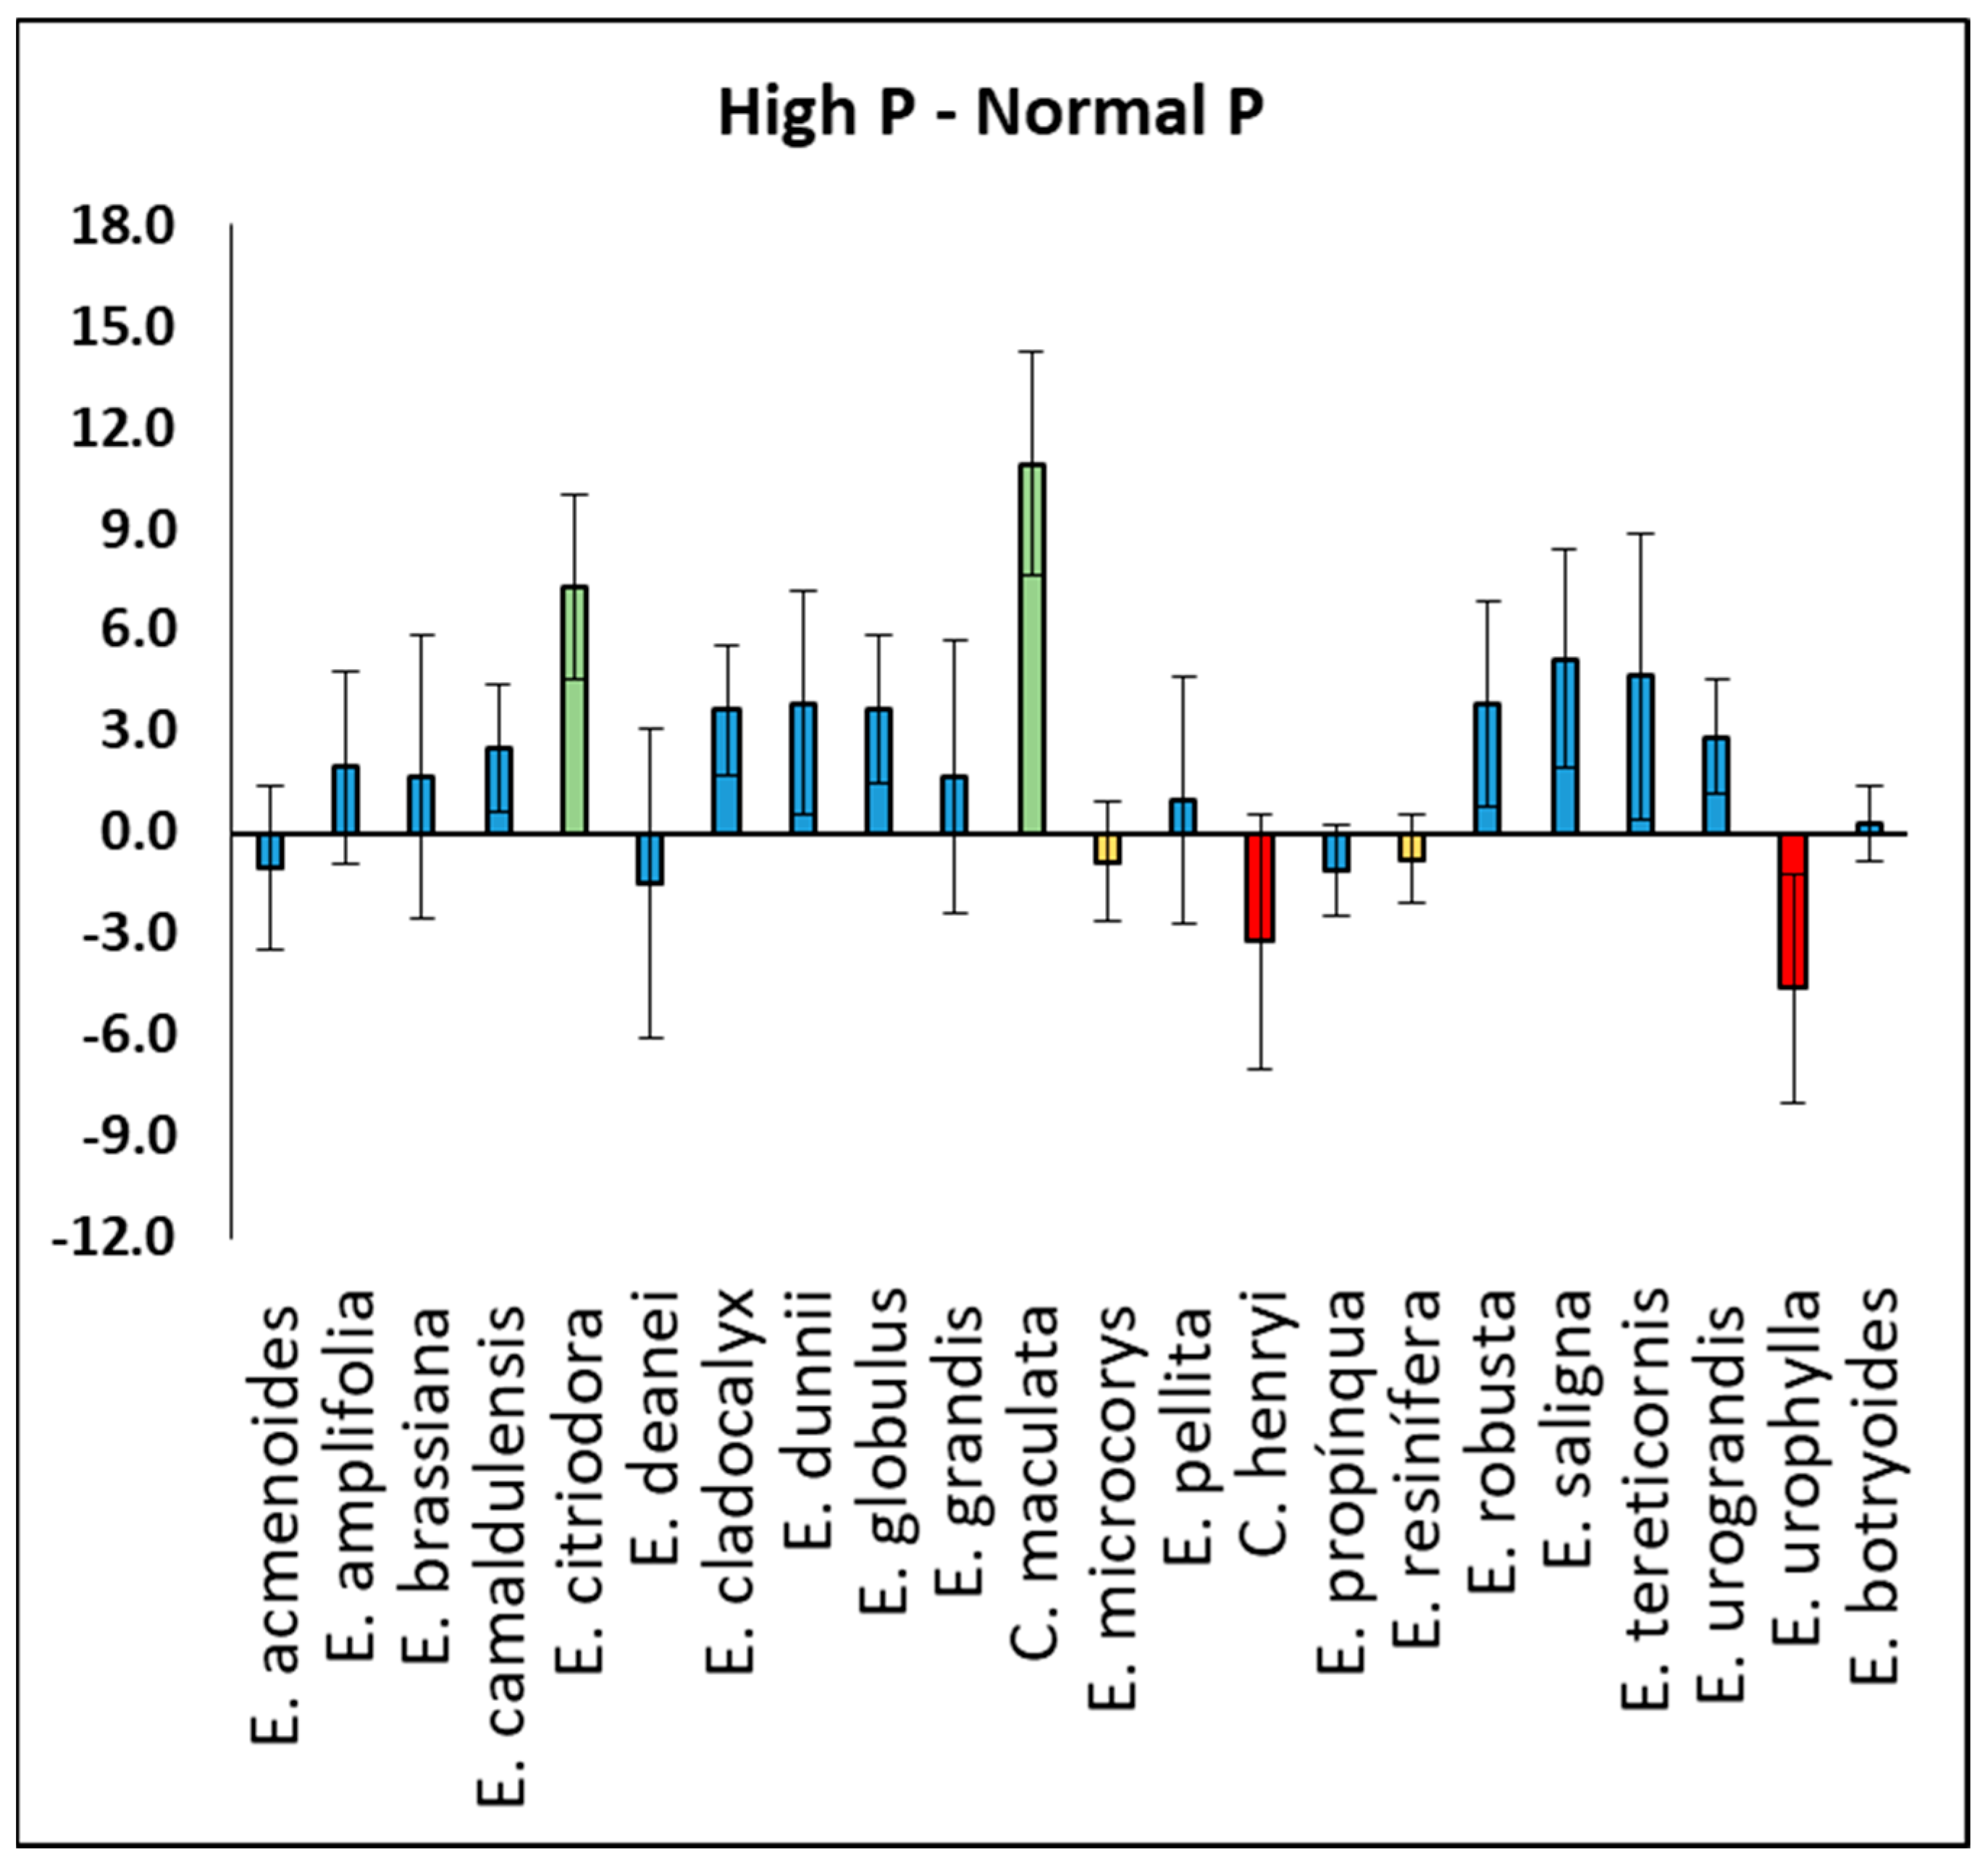
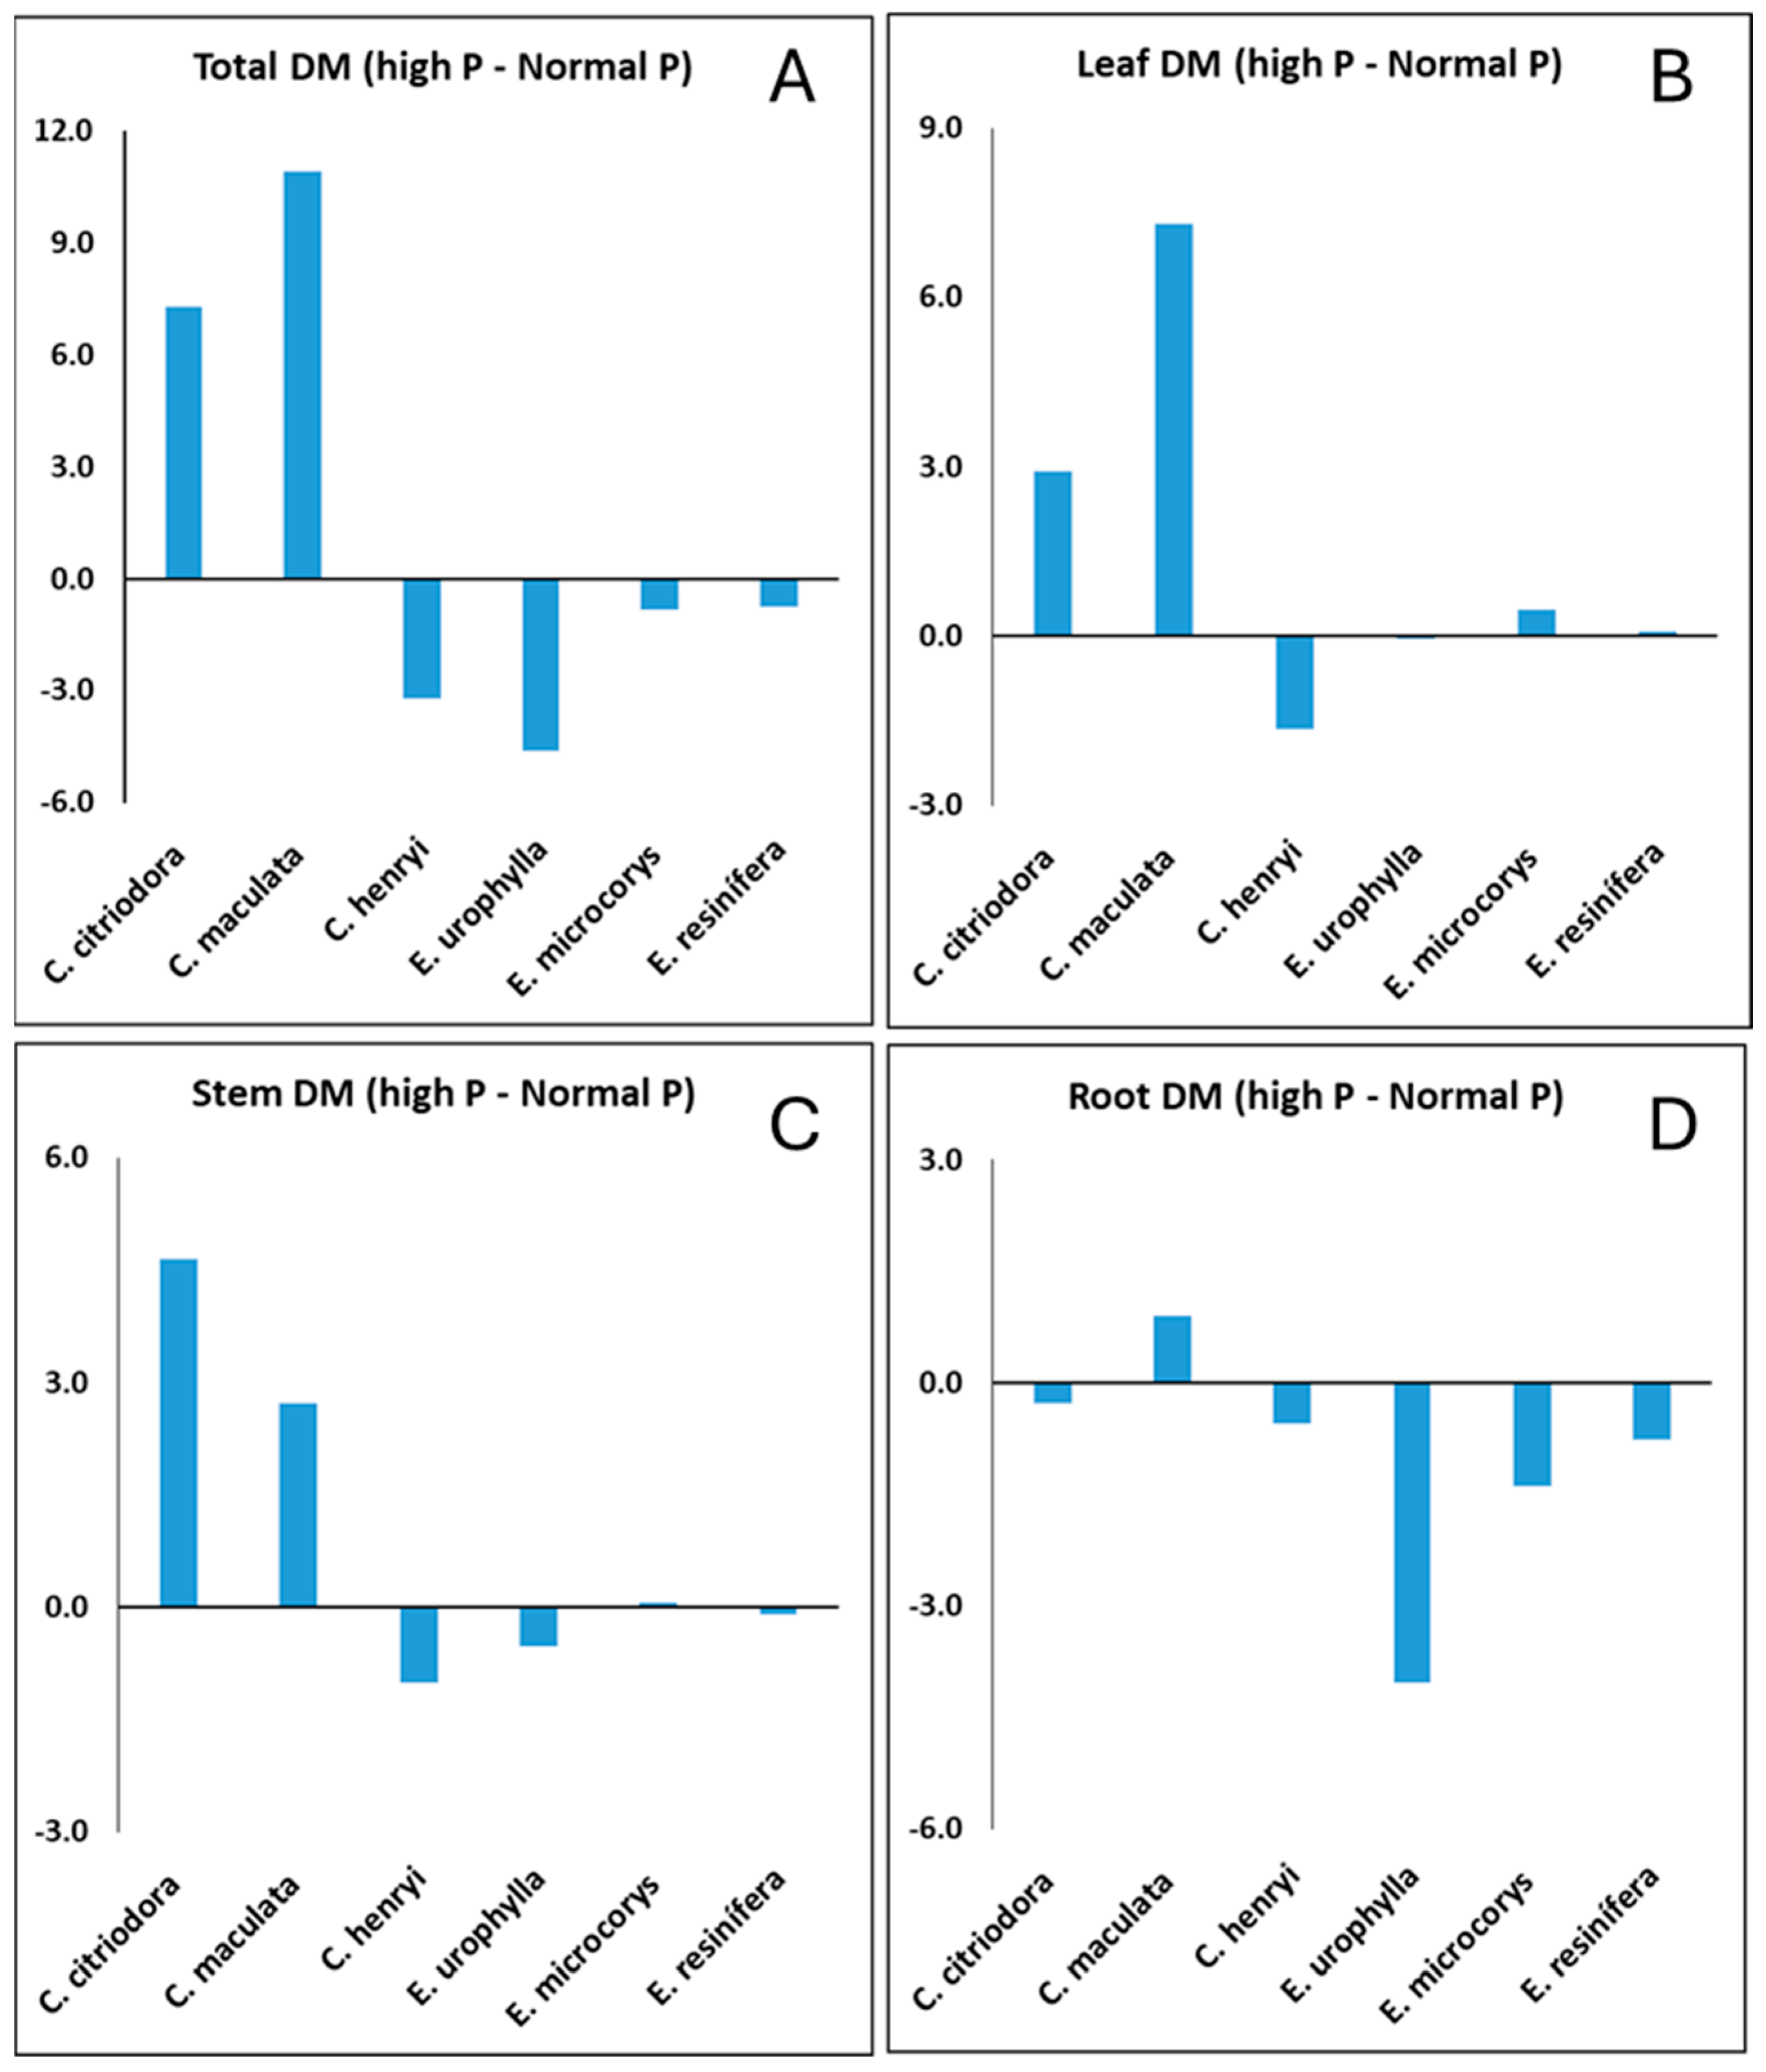
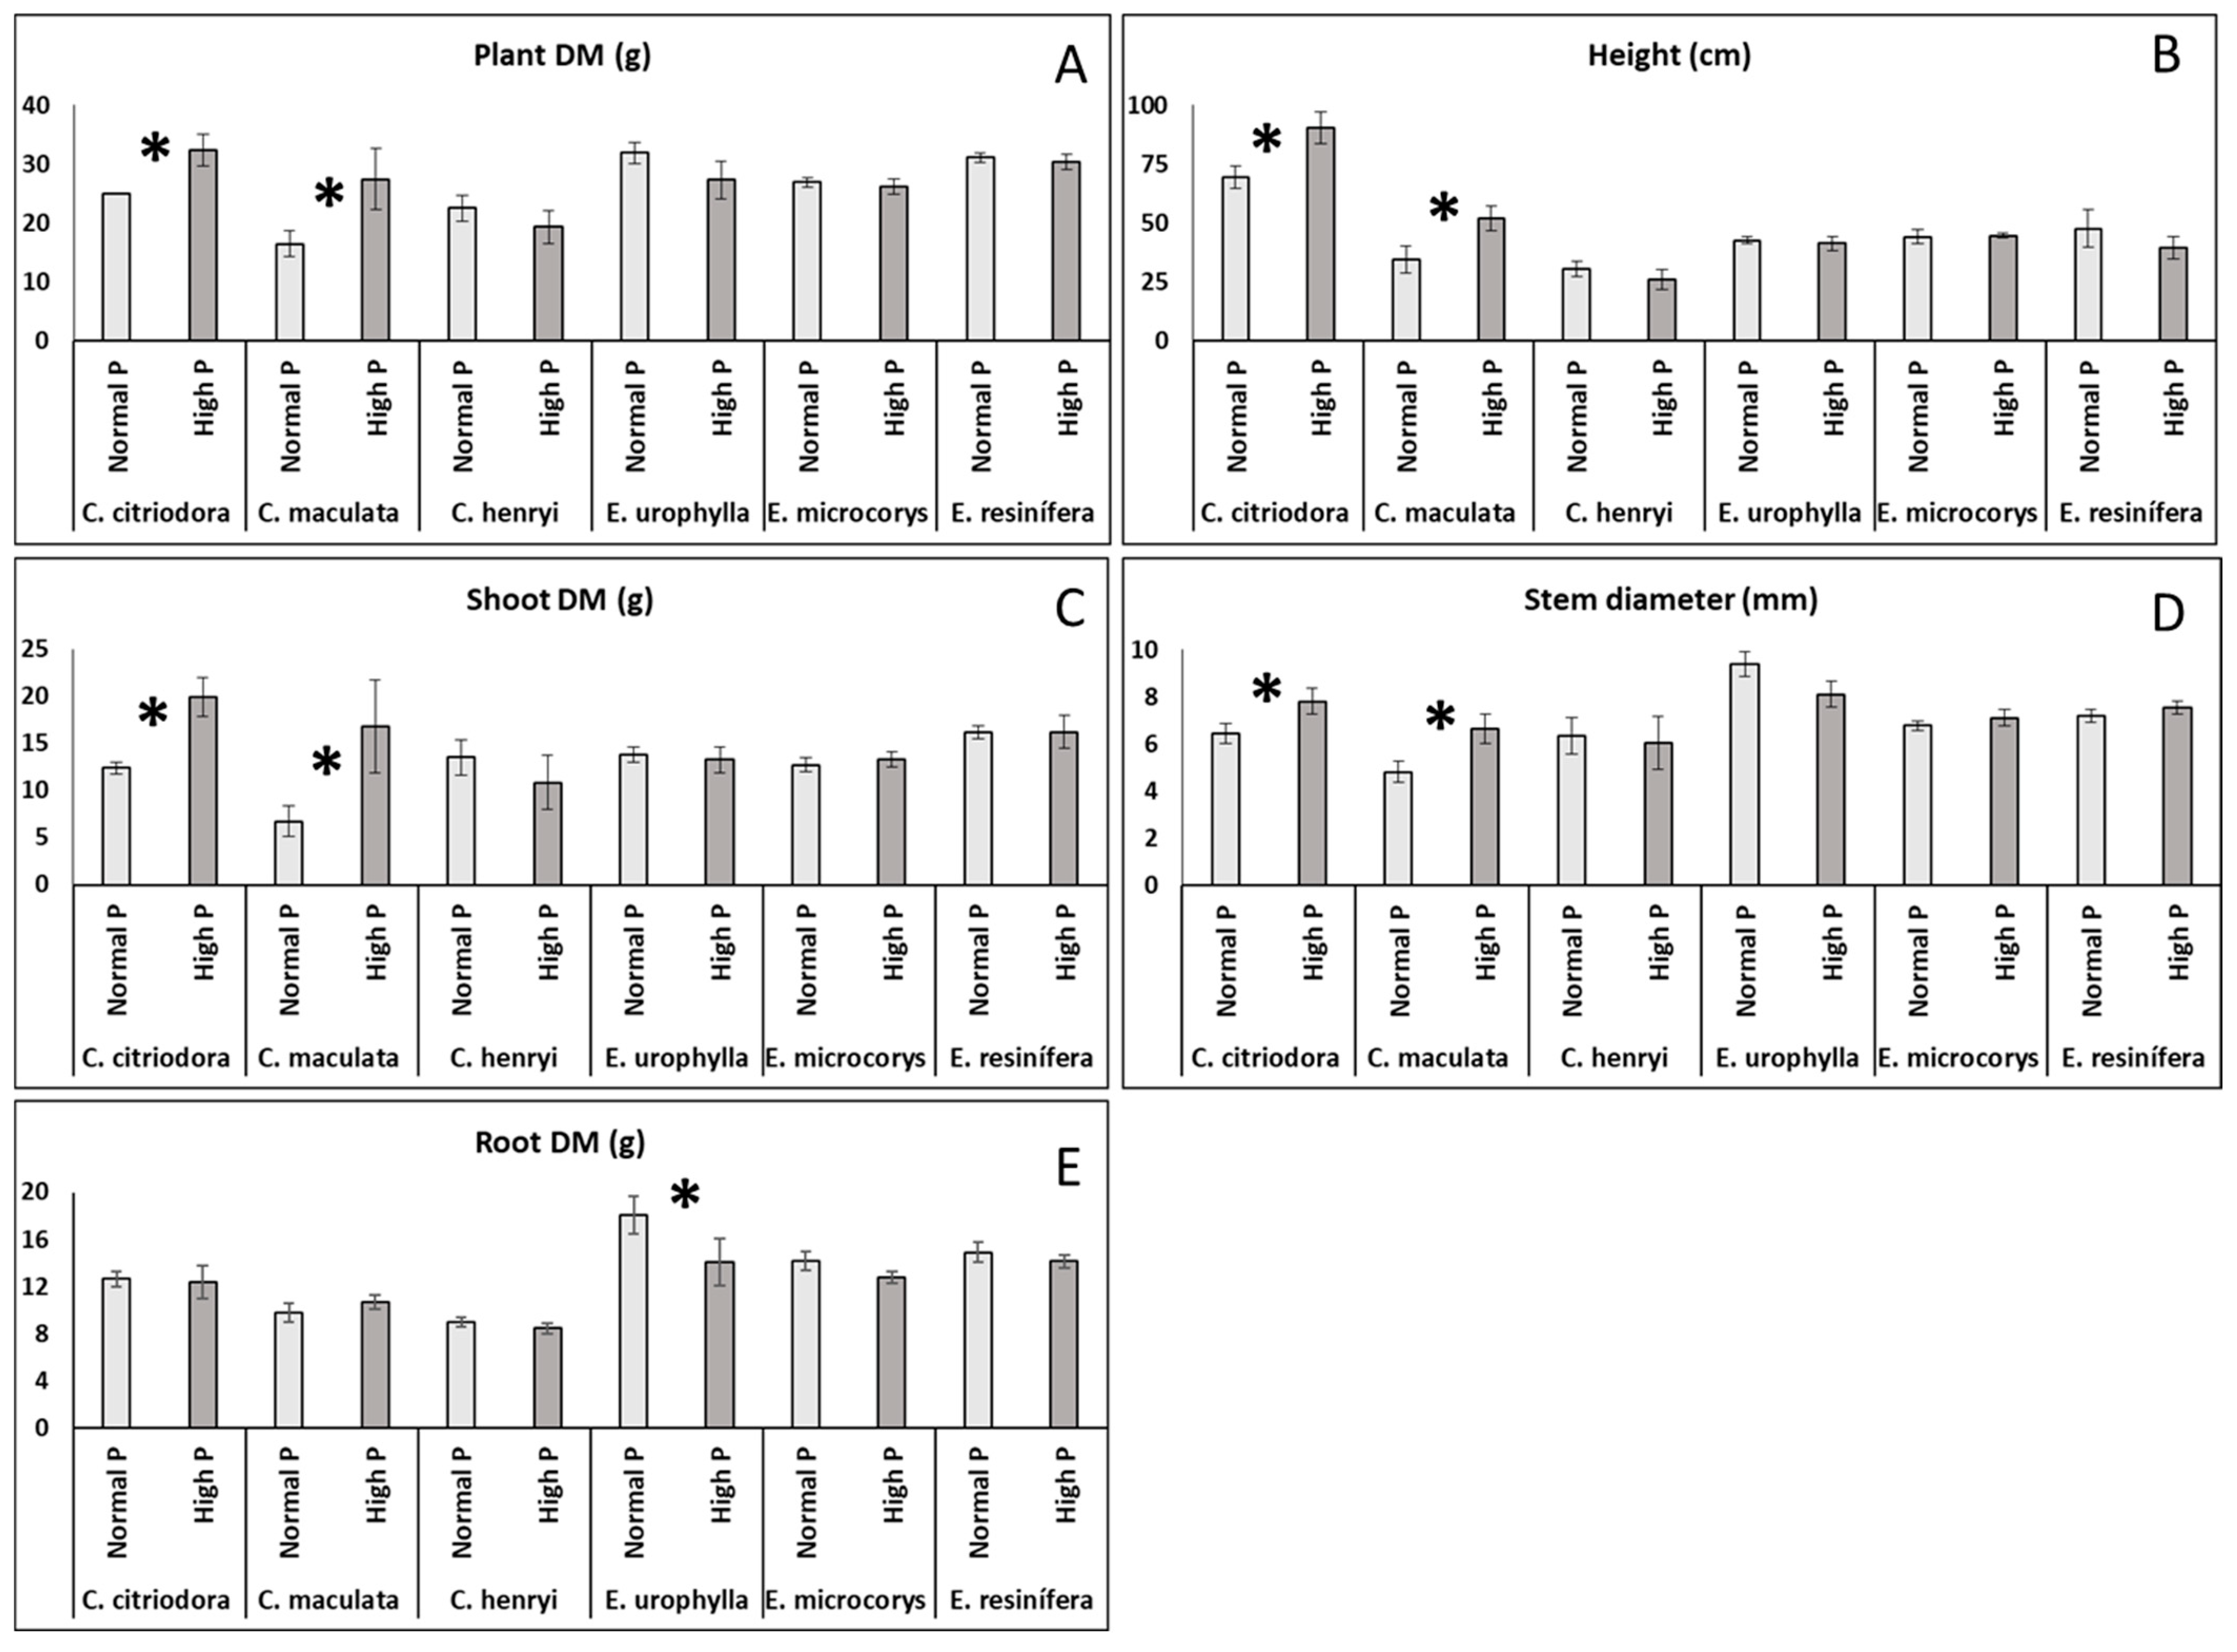
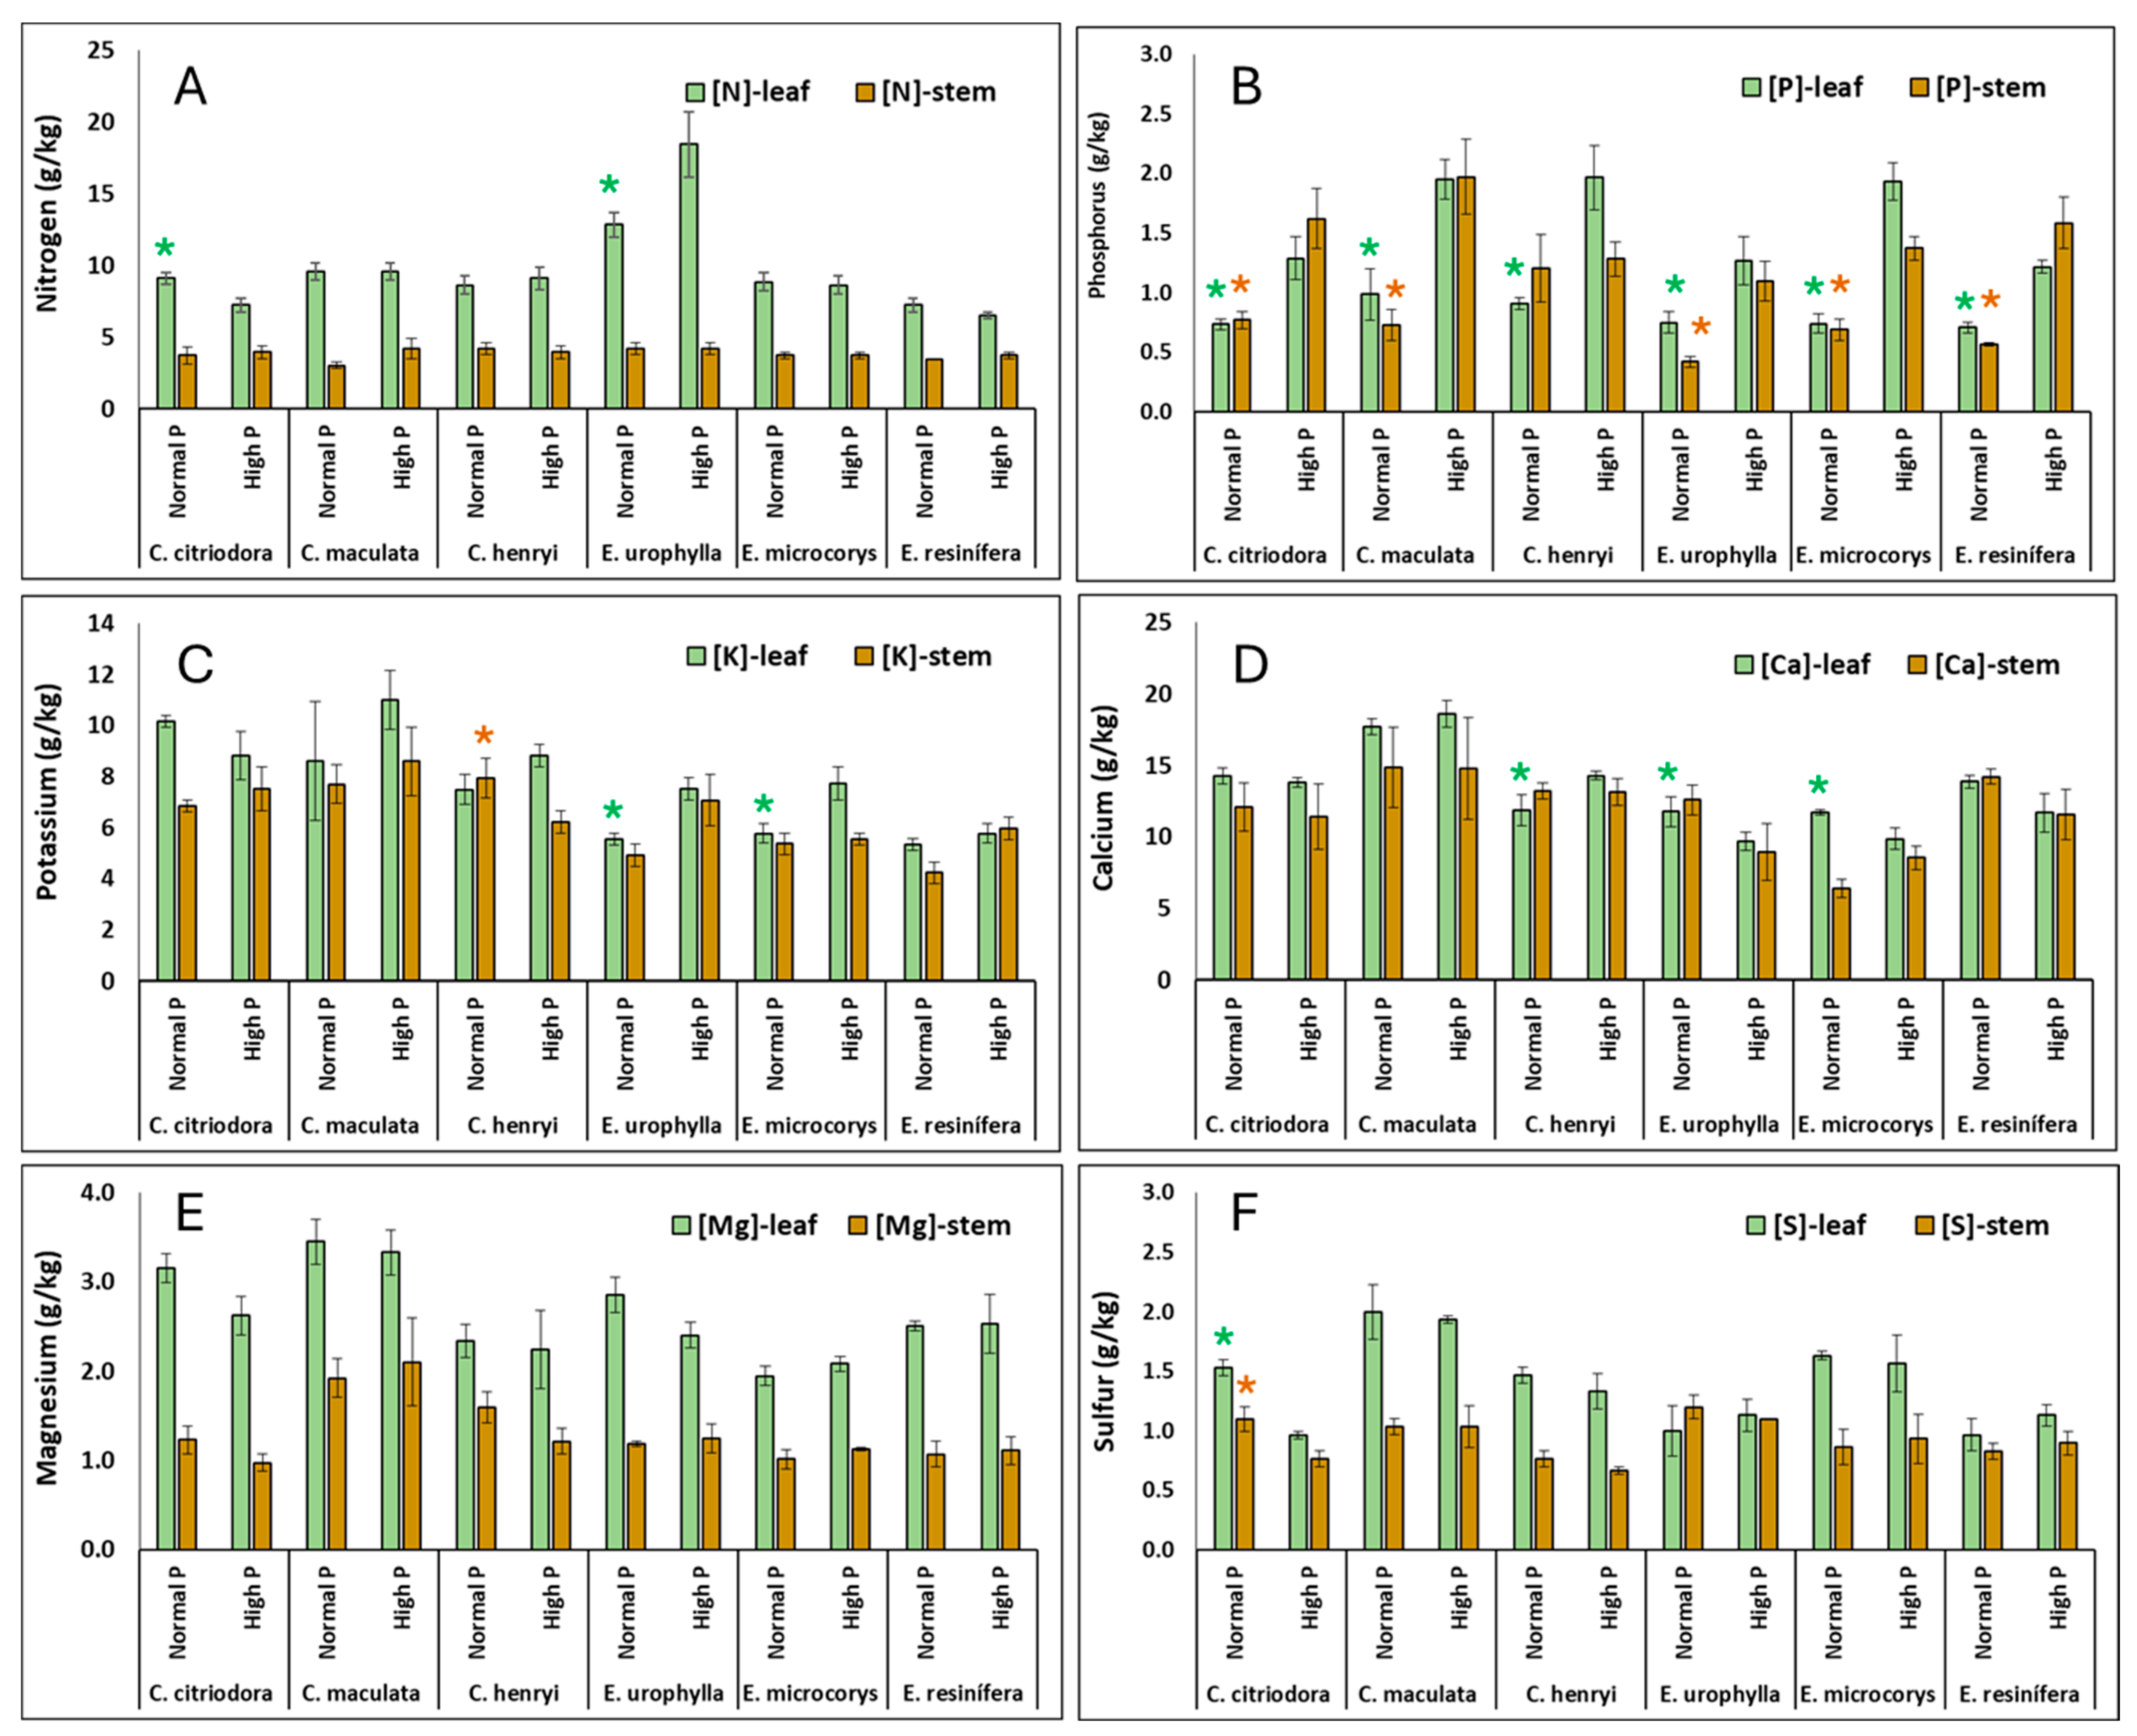
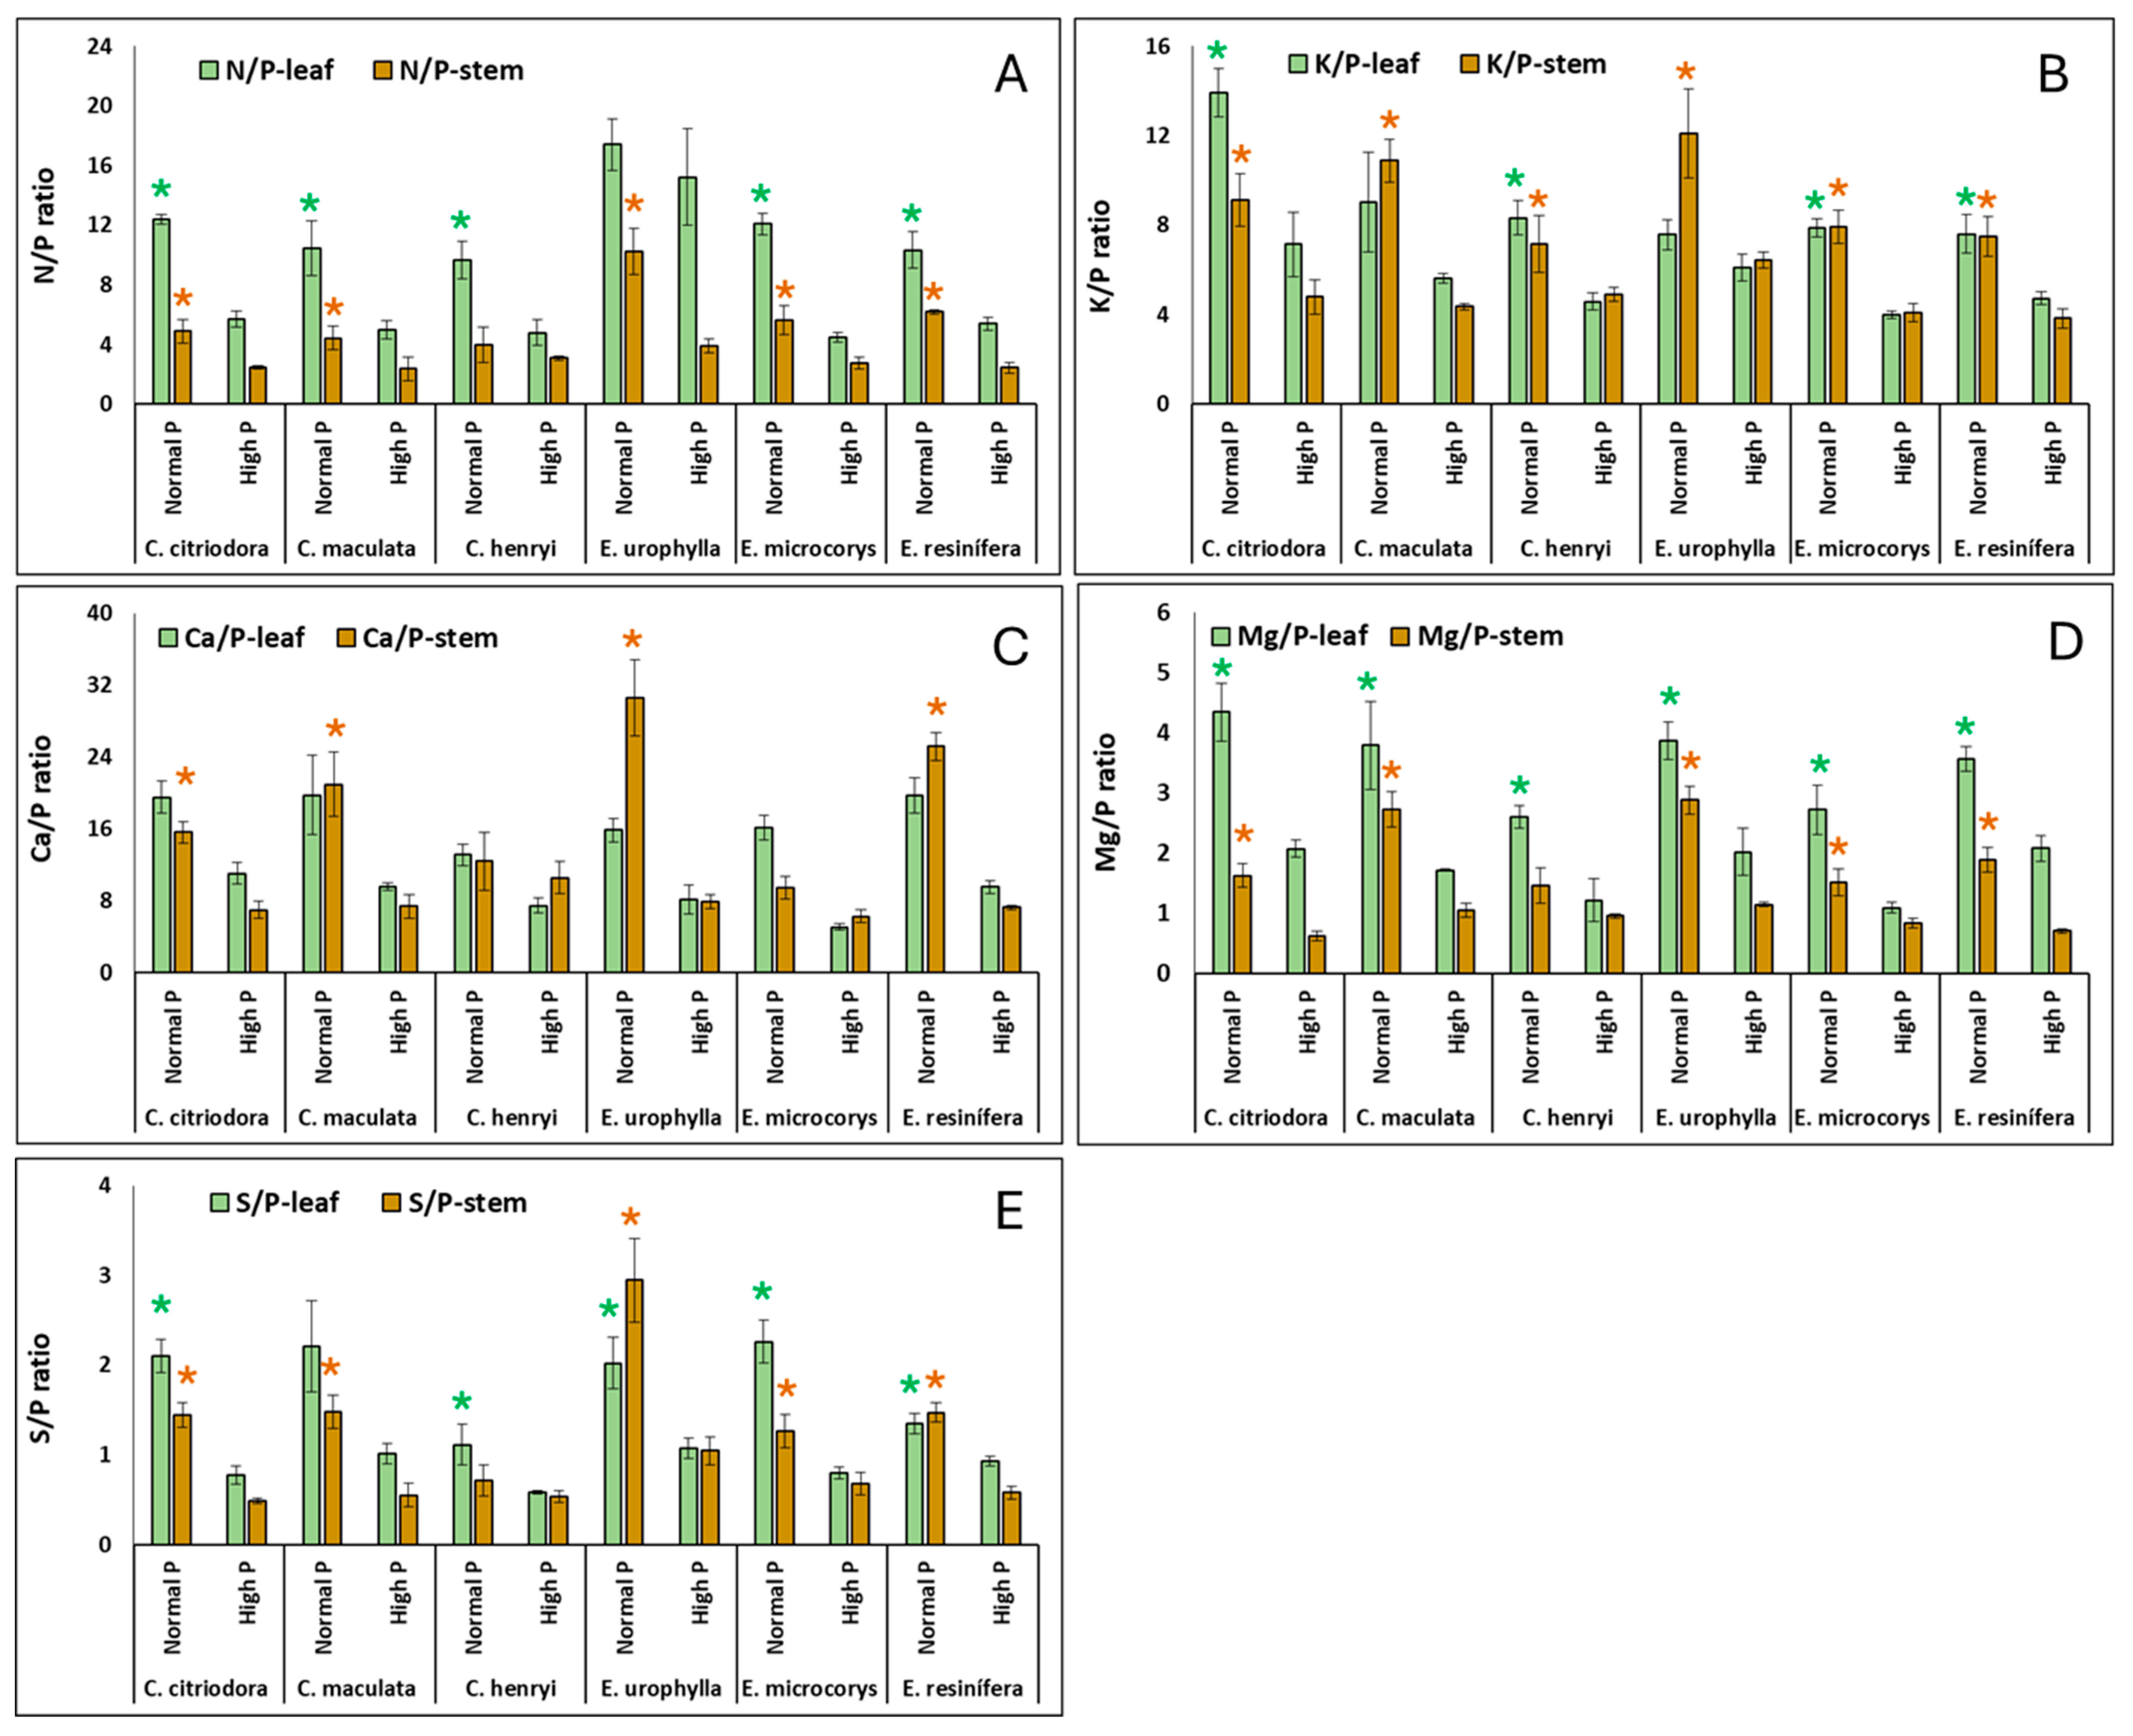
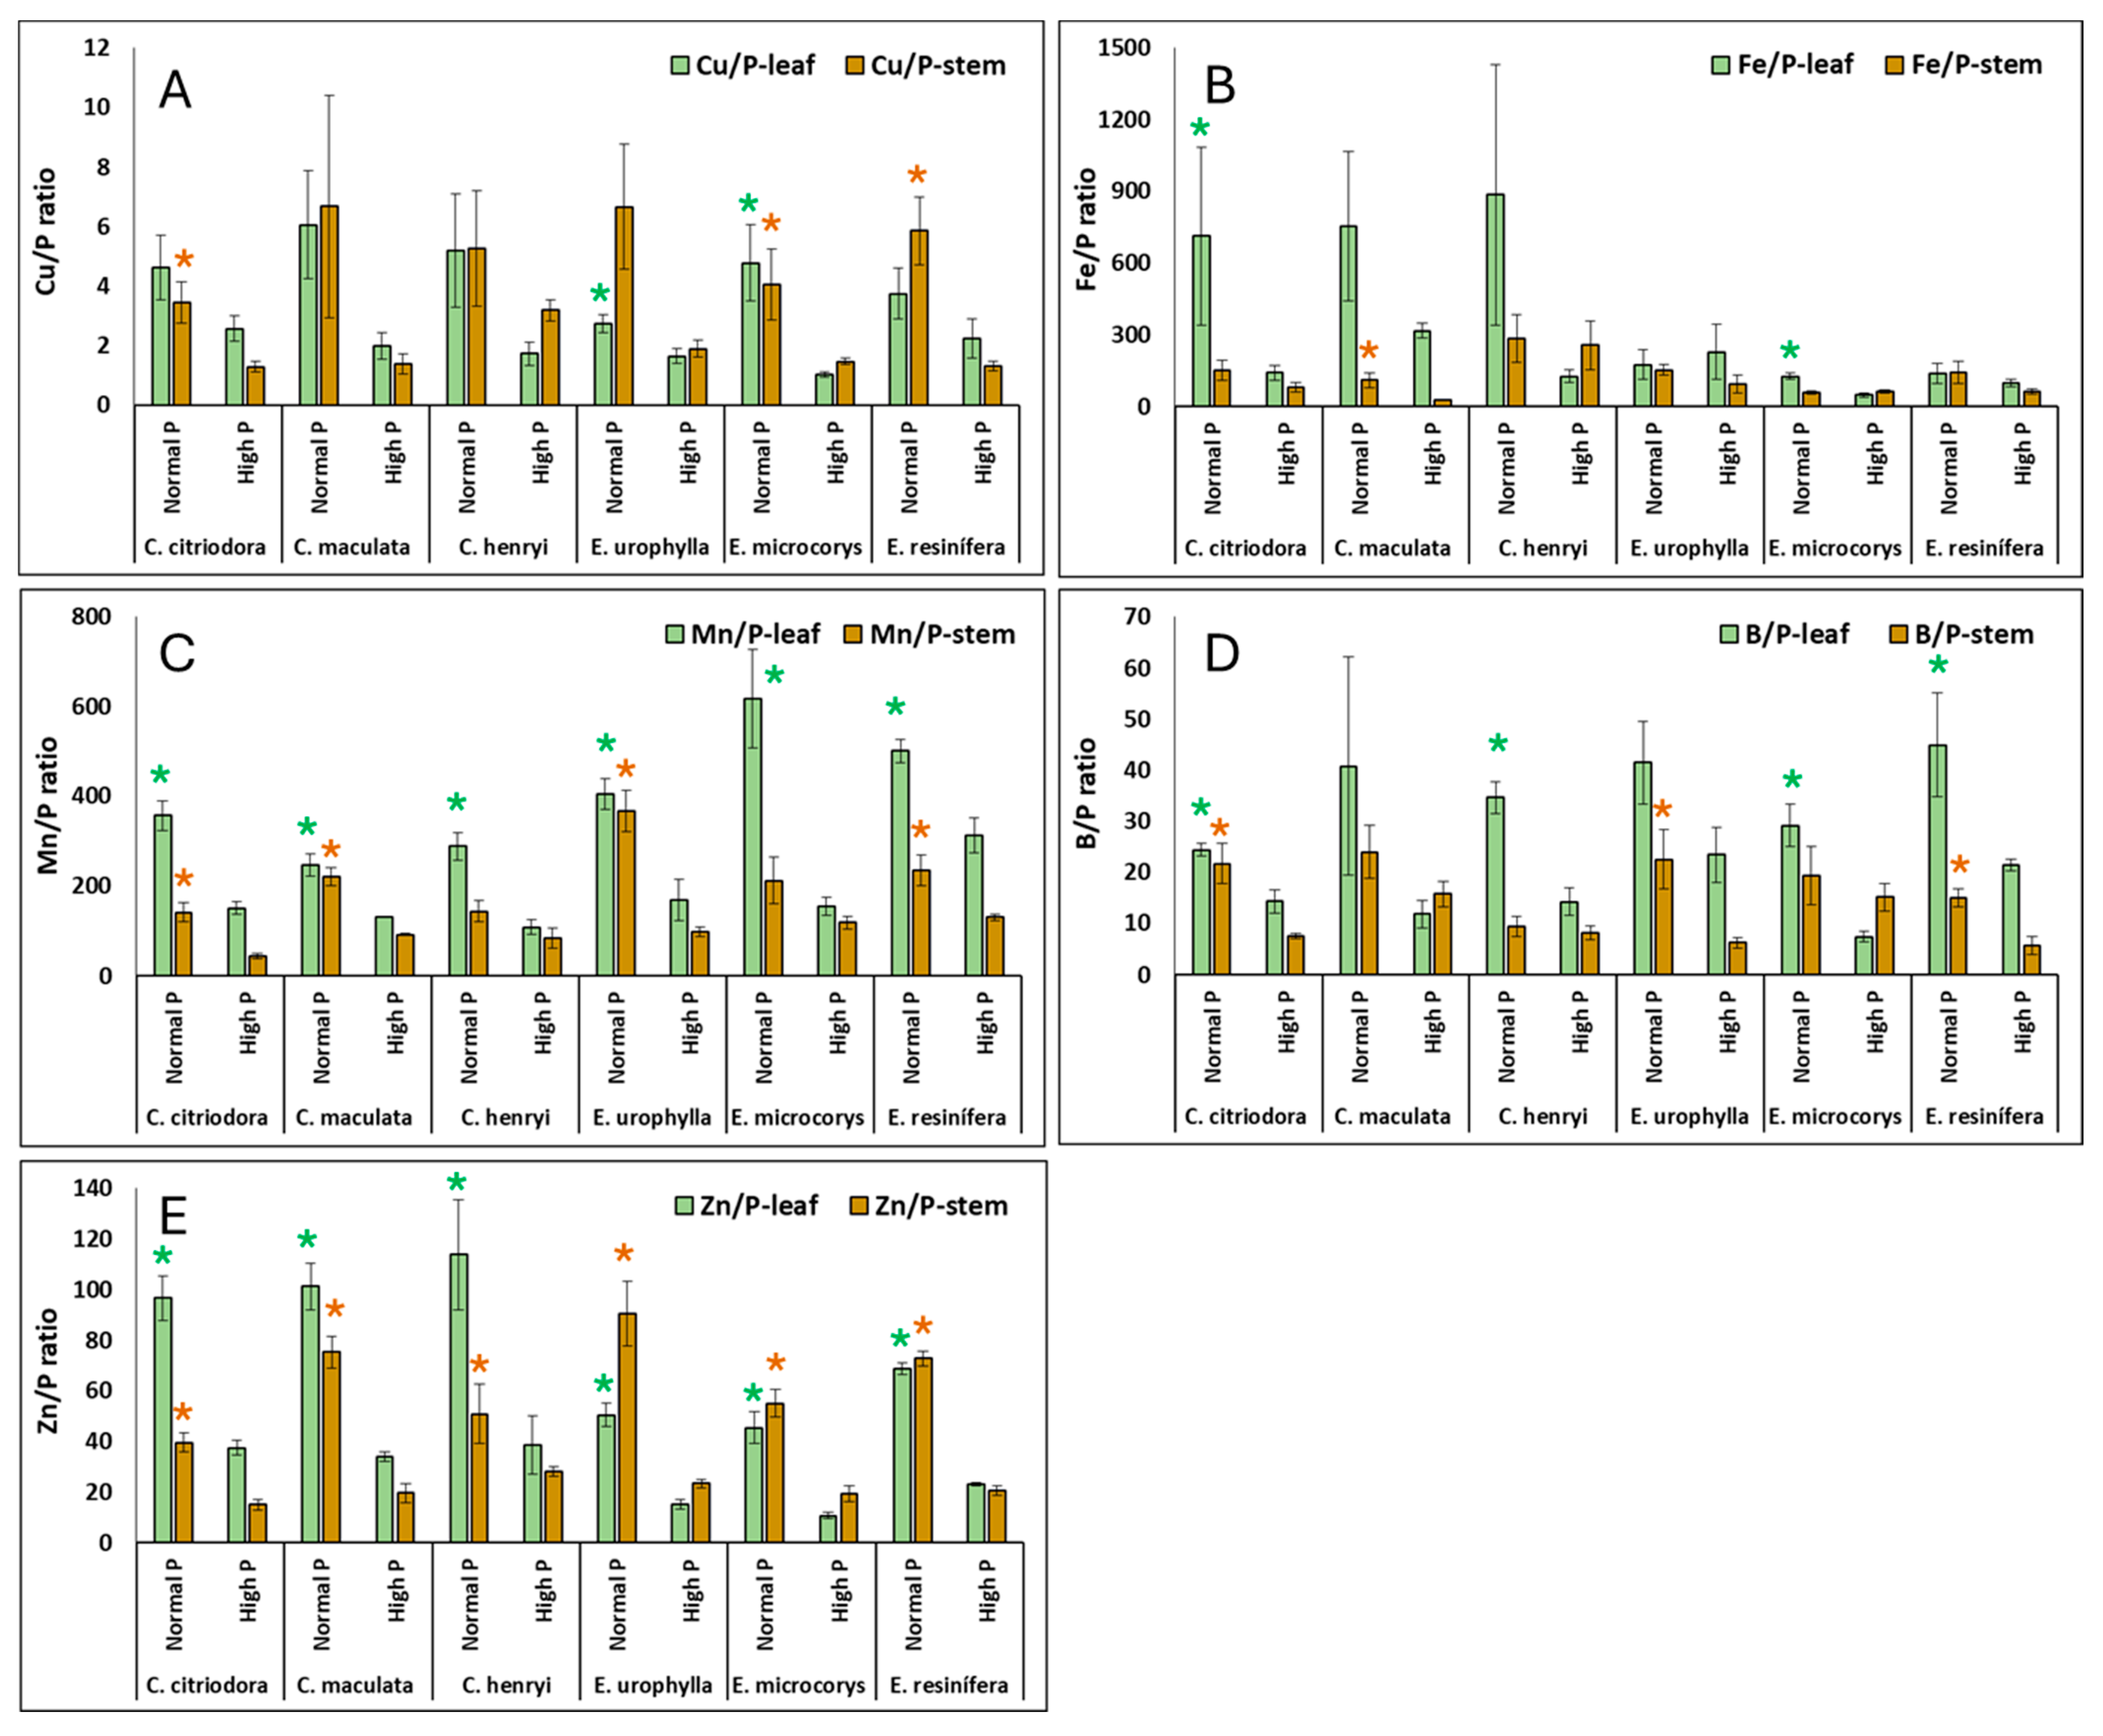
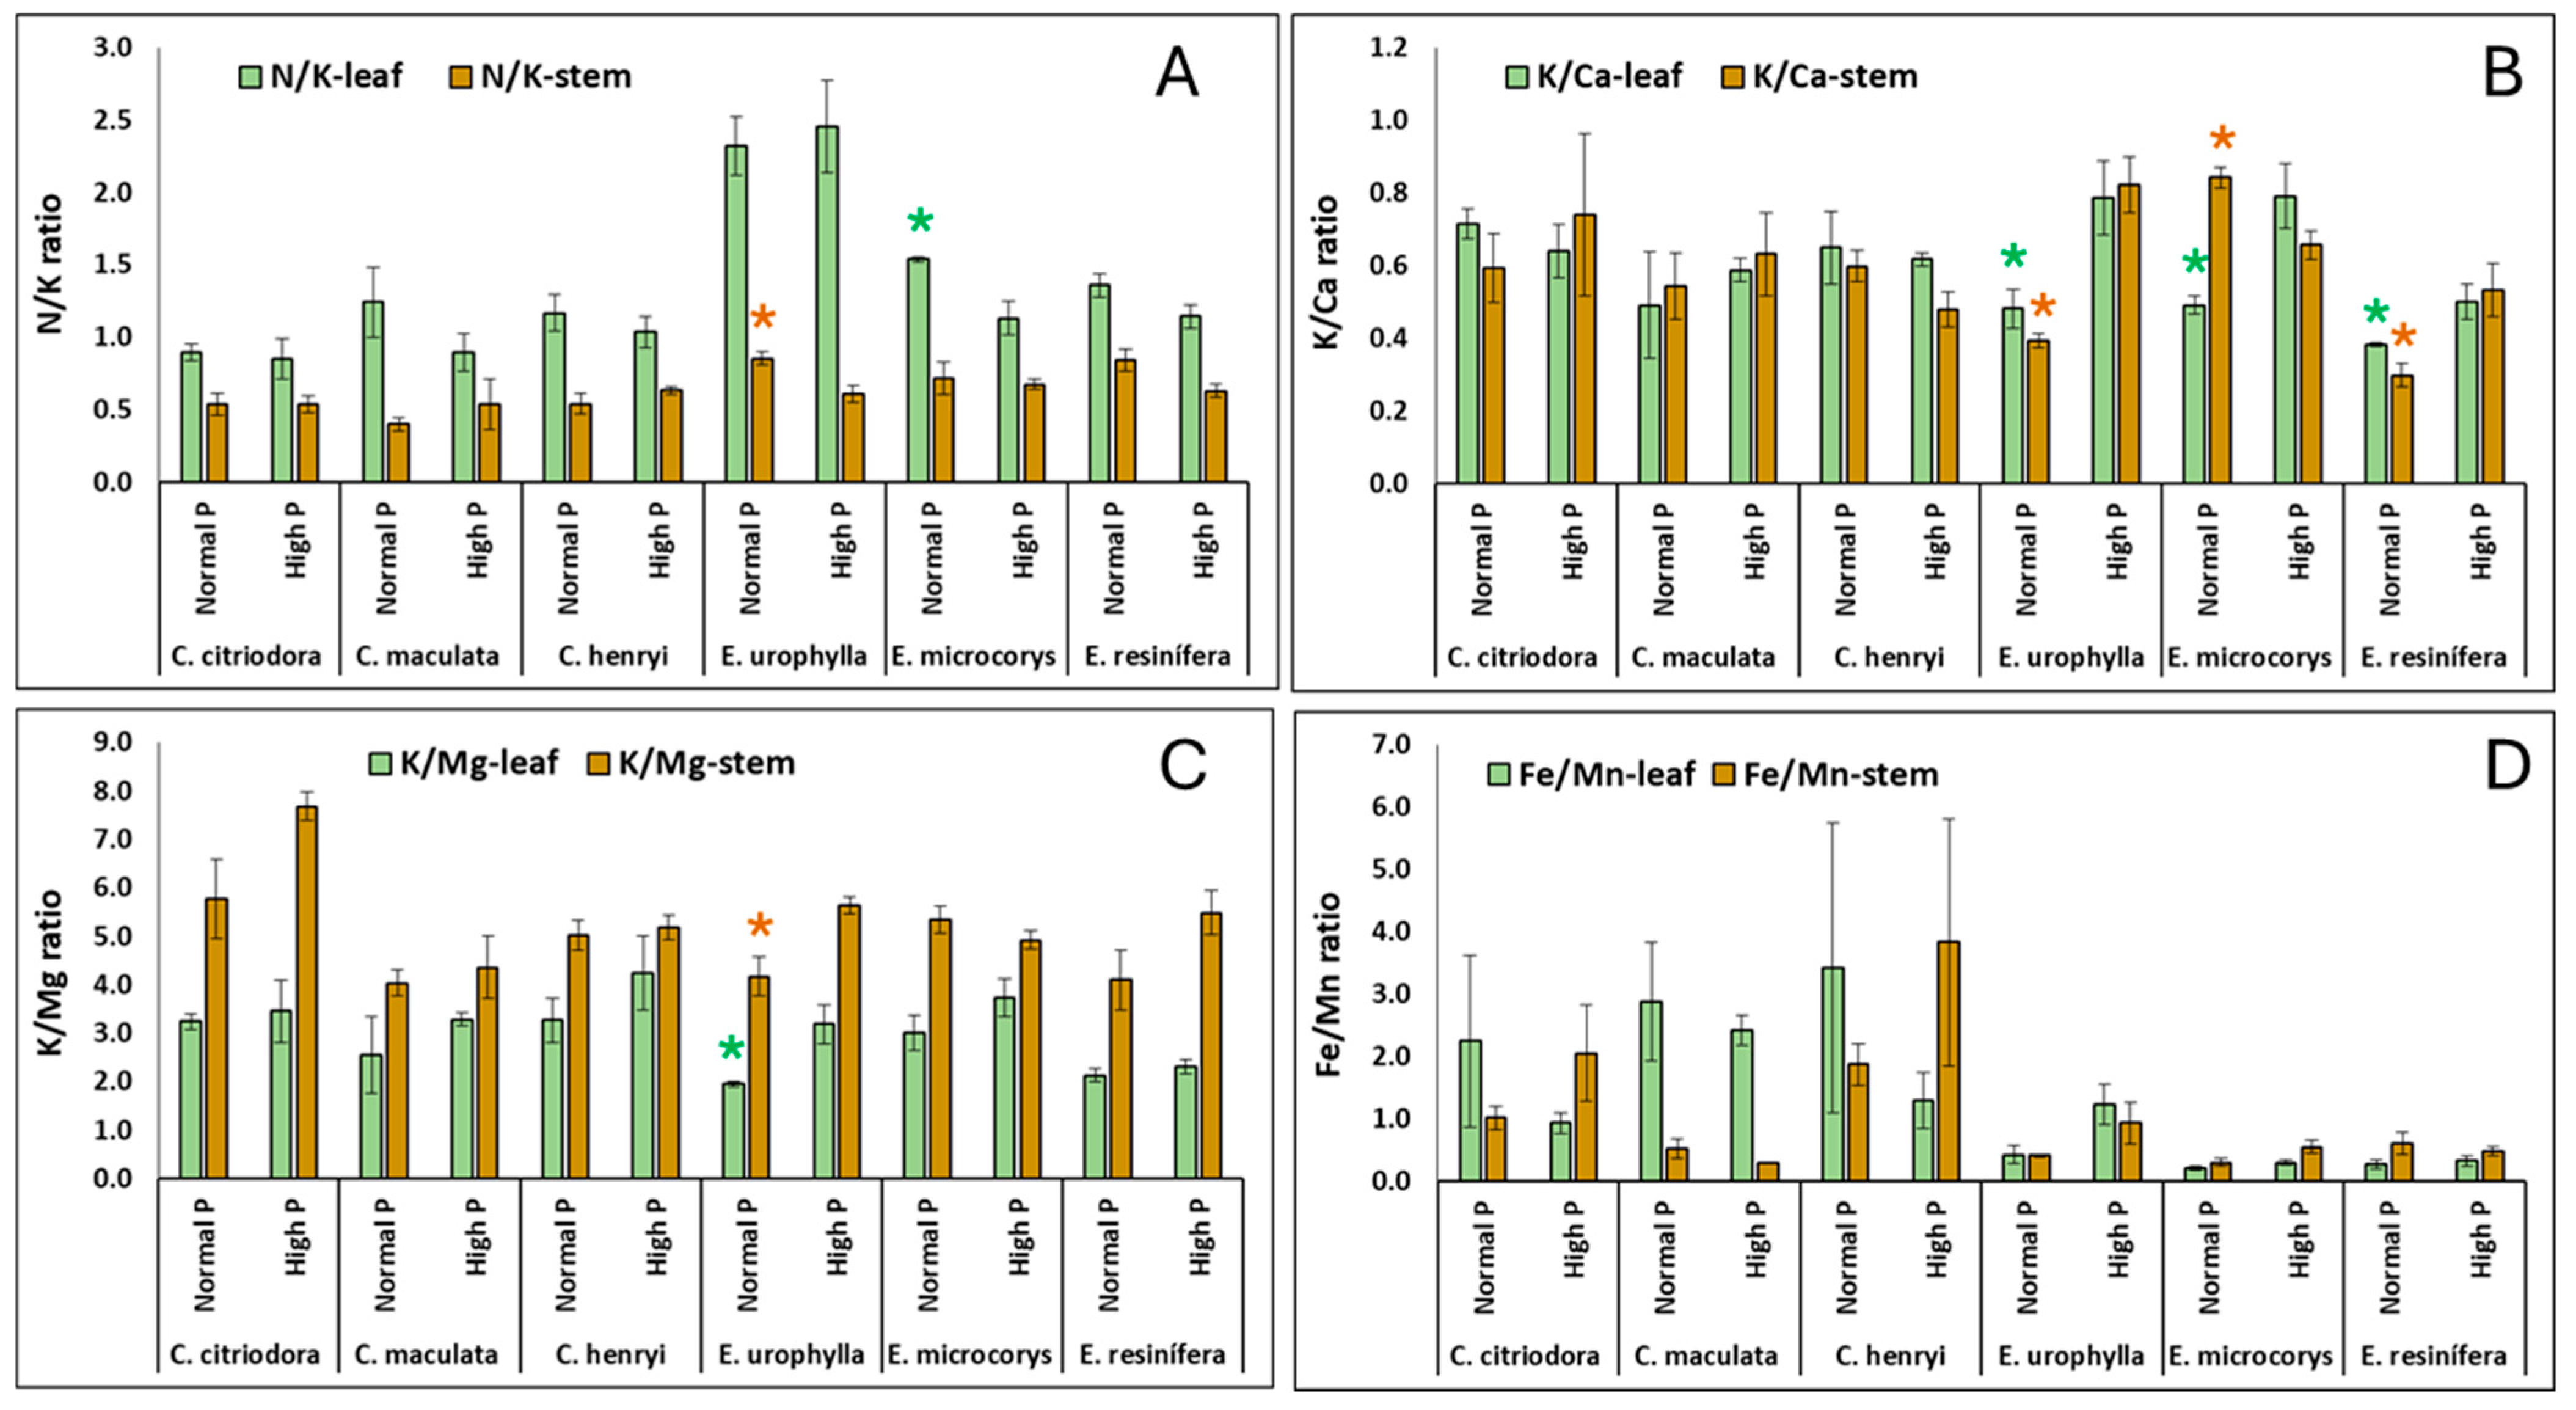
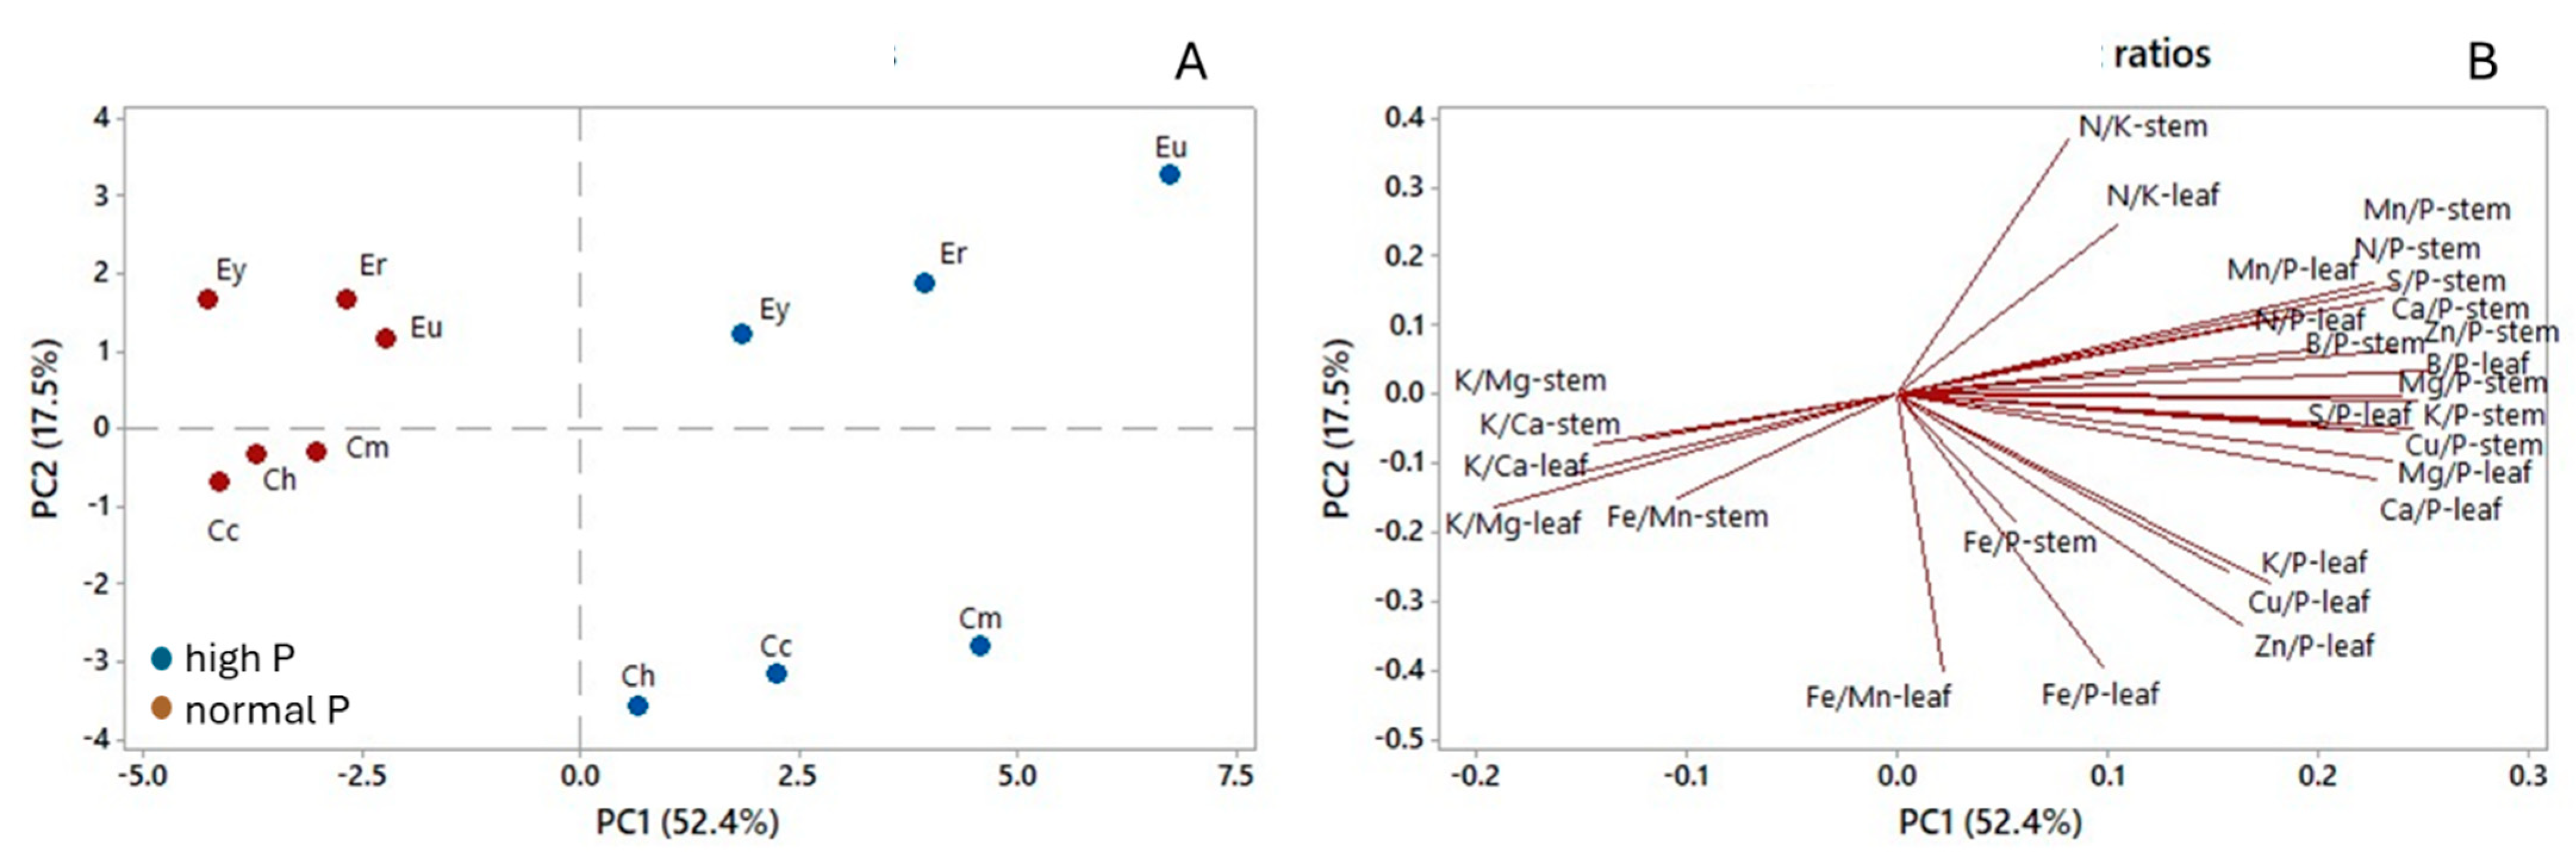
3. Results
4. Discussion
4.1. Plant Growth and Photosynthesis Under Normal and High P Soil Conditions
4.2. Nutrient Concentrations and Ratios in Leaves and Stems
5. Conclusions
Author Contributions
Funding
Informed Consent Statement
Data Availability Statement
Acknowledgments
Conflicts of Interest
References
- Lee, Y.; Wisor, J.P. Multi-Modal Regulation of Circadian Physiology by Interactive Features of Biological Clocks. Biology 2021, 11, 21. [Google Scholar] [CrossRef] [PubMed]
- Rouached, H.; Secco, D.; Arpat, B.A. Regulation of Ion Homeostasis in Plants: Current Approaches and Future Challenges. Plant Signal. Behav. 2010, 5, 501–502. [Google Scholar] [CrossRef] [PubMed]
- Guan, D.-X.; Menezes-Blackburn, D.; Li, G. The Importance of Mineral Elements for Sustainable Crop Production. Agronomy 2024, 14, 209. [Google Scholar] [CrossRef]
- George, E.; Marschner, H. Nutrient and Water Uptake by Roots of Forest Trees. Z. Pflanzenernährung Bodenkunde 1996, 159, 11–21. [Google Scholar] [CrossRef]
- Hagen-Thorn, A.; Stutis Armolaitis, K.; Callesen, I.; Stjernquist, I. Macronutrients in Tree Stems and Foliage: A Comparative Study of Six Temperate Forest Species Planted at the Same Sites. Ann. For. Sci. 2004, 61, 489–498. [Google Scholar] [CrossRef]
- Elser, J.J.; Fagan, W.F.; Kerkhoff, A.J.; Swenson, N.G.; Enquist, B.J. Biological Stoichiometry of Plant Production: Metabolism, Scaling and Ecological Response to Global Change. New Phytol. 2010, 186, 593–608. [Google Scholar] [CrossRef]
- Flückiger, W.; Braun, S. Critical Limits for Nutrient Concentrations and Ratios for Forest Trees—A Comment. In Empirical Critical Loads for Nitrogen; Achermann, B., Bobbink, R., Eds.; Swiss Agency for the Environment, Forests and Landscape (SAEFL): Berne, Switzerland, 2003; 280p. [Google Scholar]
- Sumner, M.E. Interpretation of Nutrient Ratios in Plant Tissue. Commun. Soil Sci. Plant Anal. 1978, 9, 335–345. [Google Scholar] [CrossRef]
- Lambers, H. Phosphorus Acquisition and Utilization in Plants. Annu. Rev. Plant Biol. 2022, 73, 17–42. [Google Scholar] [CrossRef]
- Gonçalves, J.L.d.M.; van Raij, B.; Gonçalves, J.C. Florestais. In Boletim Técnico 100: Recomendações de Adubação e Calagem para o Estado de São Paulo; Instituto Agronômico de Campinas: Campinas, Brazil, 1996; pp. 247–259. [Google Scholar]
- van Raij, B.; Cantarella, H.; Quaggio, J.A.; Furlani, A.M.C. Recomendações de Adubação e Calagem Para o Estado de São Paulo; Instituto Agronômico de Campinas: Campinas, Brazil, 1996. [Google Scholar]
- Pavinato, P.S.; Cherubin, M.R.; Soltangheisi, A.; Rocha, G.C.; Chadwick, D.R.; Jones, D.L. Revealing Soil Legacy Phosphorus to Promote Sustainable Agriculture in Brazil. Sci. Rep. 2020, 10, 15615. [Google Scholar] [CrossRef]
- Malhotra, H.; Vandana; Sharma, S.; Pandey, R. Phosphorus Nutrition: Plant Growth in Response to Deficiency and Excess. In Plant Nutrients and Abiotic Stress Tolerance; Springer: Singapore, 2018; pp. 171–190. [Google Scholar]
- Tibbett, M.; Daws, M.I.; Ryan, M.H. Phosphorus Uptake and Toxicity Are Delimited by Mycorrhizal Symbiosis in P-Sensitive Eucalyptus marginata but Not in P-Tolerant Acacia celastrifolia. AoB Plants 2022, 14, plac037. [Google Scholar] [CrossRef]
- Bull, L.T.; Forli, F.; Tecchio, M.A.; Corrêa, J.C. Relations between Resin Extractable Soil Phosphorus and Response of Vernalized Garlic to Phosphate Fertilization of Five Soils, with and without Organic Fertilizer. Rev. Bras. Cienc. Solo 1988, 22, 459–470. [Google Scholar]
- Büll, L.T.; Novello, A.; Corrêa, J.C.; Villas Boas, R.L. Doses de Fósforo e Zinco Na Cultura Do Alho Em Condições de Casa de Vegetação. Bragantia 2008, 67, 941–949. [Google Scholar] [CrossRef]
- Bulgarelli, R.G.; de Oliveira Silva, F.M.; Bichara, S.; Andrade, S.A.L.; Mazzafera, P. Eucalypts and Low Phosphorus Availability: Between Responsiveness and Efficiency. Plant Soil 2019, 445, 349–368. [Google Scholar] [CrossRef]
- De Andrade, S.A.L.; Borghi, A.A.; De Oliveira, V.H.; Gouveia, L.d.M.; Martins, A.P.I.; Mazzafera, P. Phosphorus Shortage Induces an Increase in Root Exudation in Fifteen Eucalypts Species. Agronomy 2022, 12, 2041. [Google Scholar] [CrossRef]
- Viscarra Rossel, R.A.; Bui, E.N. A New Detailed Map of Total Phosphorus Stocks in Australian Soil. Sci. Total Environ. 2016, 542, 1040–1049. [Google Scholar] [CrossRef]
- Silva, F.M.d.O.; Bulgarelli, R.G.; Mubeen, U.; Caldana, C.; Andrade, S.A.L.; Mazzafera, P. Low Phosphorus Induces Differential Metabolic Responses in Eucalyptus Species Improving Nutrient Use Efficiency. Front. Plant Sci. 2022, 13, 989827. [Google Scholar] [CrossRef]
- Bulgarelli, R.G.; Araujo, P.; Engel, E.; Mazzafera, P.; de Andrade, S.A.L. Eucalypt Seedlings Lack a Clear Phosphate Starvation Response under Low Phosphorus Availability. Theor. Exp. Plant Physiol. 2024, 36, 179–197. [Google Scholar] [CrossRef]
- Turnbull, J.W. Eucalypt Plantations. New For. 1999, 17, 37–52. [Google Scholar] [CrossRef]
- Teulières, C.; Bossinger, G.; Moran, G.; Marque, C. Stress Studies in Eucalyptus, The Australian National University: Canberra, Australia, 2007.
- Santos, H.G.; Jacomine, P.K.T.; Anjos, L.H.C.; Oliveira, V.A.; Oliveira, J.B.; Coelho, M.R.; Lumbreras, J.F.; Cunha, T.J.F. Sistema Brasileiro de Classificação de Solos, 2nd ed.; Embrapa: Rio de Janeiro, Brazil, 2006. [Google Scholar]
- Bulgarelli, R.G.; Leite, M.F.A.; de Hollander, M.; Mazzafera, P.; Andrade, S.A.L.; Kuramae, E.E. Eucalypt Species Drive Rhizosphere Bacterial and Fungal Community Assembly but Soil Phosphorus Availability Rearranges the Microbiome. Sci. Total Environ. 2022, 836, 155667. [Google Scholar] [CrossRef]
- van Raij, B.; Quaggio, J.A. Determinação de Fósforo, Cálcio, Magnésio e Potássio Extraídos Com Resina Trocadora de Íons. In Análise Química para Avaliação da Fertilidade de Solos Tropicais; van Raij, B., Andrade, J.C., Cantarella, H., Quaggio, J.A., Eds.; Secretaria de Agricultura e Abastecimento, APTA/IAC: Campinas, Brazil, 2001; pp. 189–199. [Google Scholar]
- Bremner, J.M. Total Nitrogen. In Methods of Soil Analysis; Black, C.A., Ed.; American Society of Agronomy: Madison, IL, USA, 1965; pp. 1149–1178. [Google Scholar]
- Ferreira, D.F. Sisvar: A Guide for Its Bootstrap Procedures in Multiple Comparisons. Ciência Agrotecnologia 2014, 38, 109–112. [Google Scholar] [CrossRef]
- Teng, W.; Deng, Y.; Chen, X.-P.; Xu, X.-F.; Chen, R.-Y.; Lv, Y.; Zhao, Y.-Y.; Zhao, X.-Q.; He, X.; Li, B.; et al. Characterization of Root Response to Phosphorus Supply from Morphology to Gene Analysis in Field-Grown Wheat. J. Exp. Bot. 2013, 64, 1403–1411. [Google Scholar] [CrossRef] [PubMed]
- Ruban, A.V. Nonphotochemical Chlorophyll Fluorescence Quenching: Mechanism and Effectiveness in Protecting Plants from Photodamage. Plant Physiol. 2016, 170, 1903–1916. [Google Scholar] [CrossRef] [PubMed]
- Bilger, W.; Schreiber, U.; Bock, M. Determination of the Quantum Efficiency of Photosystem II and of Non-Photochemical Quenching of Chlorophyll Fluorescence in the Field. Oecologia 1995, 102, 425–432. [Google Scholar] [CrossRef]
- Carstensen, A.; Herdean, A.; Schmidt, S.B.; Sharma, A.; Spetea, C.; Pribil, M.; Husted, S. The Impacts of Phosphorus Deficiency on the Photosynthetic Electron Transport Chain. Plant Physiol. 2018, 177, 271–284. [Google Scholar] [CrossRef]
- Santos, E.F.; Pongrac, P.; Reis, A.R.; Rabêlo, F.H.S.; Azevedo, R.A.; White, P.J.; Lavres, J. Unravelling Homeostasis Effects of Phosphorus and Zinc Nutrition by Leaf Photochemistry and Metabolic Adjustment in Cotton Plants. Sci. Rep. 2021, 11, 13746. [Google Scholar] [CrossRef]
- Körner, C. Paradigm Shift in Plant Growth Control. Curr. Opin. Plant Biol. 2015, 25, 107–114. [Google Scholar] [CrossRef]
- Fromm, J. Wood Formation of Trees in Relation to Potassium and Calcium Nutrition. Tree Physiol. 2010, 30, 1140–1147. [Google Scholar] [CrossRef]
- Uggla, C.; Moritz, T.; Sandberg, G.; Sundberg, B. Auxin as a Positional Signal in Pattern Formation in Plants. Proc. Natl. Acad. Sci. USA 1996, 93, 9282–9286. [Google Scholar] [CrossRef]
- Deslauriers, A.; Huang, J.-G.; Balducci, L.; Beaulieu, M.; Rossi, S. The Contribution of Carbon and Water in Modulating Wood Formation in Black Spruce Saplings. Plant Physiol. 2016, 170, 2072–2084. [Google Scholar] [CrossRef]
- Santos, E.F.; Mateus, N.S.; Rosário, M.O.; Garcez, T.B.; Mazzafera, P.; Lavres, J. Enhancing Potassium Content in Leaves and Stems Improves Drought Tolerance of Eucalyptus Clones. Physiol. Plant. 2021, 172, 552–563. [Google Scholar] [CrossRef]
- Barber, S.A. Soil Nutrient Bioavailability: A Mechanistic Approach, 2nd ed.; John Wiley & Sons: Hoboken, NJ, USA, 1995; 432p. [Google Scholar]
- Bellote, A.F.J.; Sarruge, J.R.; Haag, H.P.; Oliveira, G.D. Extração e Exportação de Nutrientes Pelo Eucalyptus Grandis Hill Ex Maiden Em Função Da Idade: 1—Macronutrientes. IPEF Inst. Pesqui. Estudos Florestais 1980, 20, 1–23. [Google Scholar]
- Laclau, J.-P.; Bouillet, J.-P.; Ranger, J. Dynamics of Biomass and Nutrient Accumulation in a Clonal Plantation of Eucalyptus in Congo. For. Ecol. Manag. 2000, 128, 181–196. [Google Scholar] [CrossRef]
- Teng, Y.; Timmer, V.R. Phosphorus-Induced Micronutrient Disorders in Hybrid Poplar—I. Preliminary Diagnosis. Plant Soil 1990, 126, 19–29. [Google Scholar] [CrossRef]
- Pedas, P.; Husted, S.; Skytte, K.; Schjoerring, J.K. Elevated Phosphorus Impedes Manganese Acquisition by Barley Plants. Front. Plant Sci. 2011, 2, 12699. [Google Scholar] [CrossRef]
- Mousavi, S.R.; Galavi, M.; Rezaei, M. The Interaction of Zinc with Other Elements in Plants: A Review. Int. J. Agric. Crop Sci. 2012, 4, 1881–1884. [Google Scholar]
- Gonçalves, J.L.M. Eucalipto. In Boas Práticas para Uso Eficiente de Fertilizantes; Prochnow, L.I., Casarin, V., Stipp, S.R., Eds.; Livroceres: Piracicaba, Brazil, 2011; Volume 3, pp. 30–45. [Google Scholar]


| Soil | OM | pH CaCl2 | Pres | K | Ca | Mg | H + Al | CEC | BS | S | Fe | Mn | Cu | Zn | B | PTotal |
|---|---|---|---|---|---|---|---|---|---|---|---|---|---|---|---|---|
| g/dm3 | mg dm−3 | mmolc dm−3 | % | mg dm−3 | mg kg−1 | |||||||||||
| Normal P | 3.7 | 5.3 | 7.7 | 2.7 | 14.0 | 9.3 | 11.0 | 37.7 | 68.9 | 32.7 | 2.0 | 1.4 | 0.2 | 3.7 | 0.2 | 152.3 |
| High P | 3.7 | 5.4 | 45.3 | 6.1 | 12.7 | 9.3 | 12.0 | 40.9 | 69.9 | 36.7 | 2.7 | 1.5 | 0.2 | 2.8 | 0.2 | 198.7 |
Disclaimer/Publisher’s Note: The statements, opinions and data contained in all publications are solely those of the individual author(s) and contributor(s) and not of MDPI and/or the editor(s). MDPI and/or the editor(s) disclaim responsibility for any injury to people or property resulting from any ideas, methods, instructions or products referred to in the content. |
© 2025 by the authors. Licensee MDPI, Basel, Switzerland. This article is an open access article distributed under the terms and conditions of the Creative Commons Attribution (CC BY) license (https://creativecommons.org/licenses/by/4.0/).
Share and Cite
Mazzafera, P.; Bulgarelli, R.G.; de Oliveira Silva, F.M.; de Andrade, S.A.L. Nutrient Ratios in the Leaves and Stems of Eucalyptus and Corymbia Species Under High Soil Phosphate. Forests 2025, 16, 869. https://doi.org/10.3390/f16060869
Mazzafera P, Bulgarelli RG, de Oliveira Silva FM, de Andrade SAL. Nutrient Ratios in the Leaves and Stems of Eucalyptus and Corymbia Species Under High Soil Phosphate. Forests. 2025; 16(6):869. https://doi.org/10.3390/f16060869
Chicago/Turabian StyleMazzafera, Paulo, Rafaela Gageti Bulgarelli, Franklin Magnum de Oliveira Silva, and Sara Adrián López de Andrade. 2025. "Nutrient Ratios in the Leaves and Stems of Eucalyptus and Corymbia Species Under High Soil Phosphate" Forests 16, no. 6: 869. https://doi.org/10.3390/f16060869
APA StyleMazzafera, P., Bulgarelli, R. G., de Oliveira Silva, F. M., & de Andrade, S. A. L. (2025). Nutrient Ratios in the Leaves and Stems of Eucalyptus and Corymbia Species Under High Soil Phosphate. Forests, 16(6), 869. https://doi.org/10.3390/f16060869