Article

Projected Spatial Distribution Patterns of Three Dominant Desert Plants in Xinjiang of Northwest China

1
Joint Innovation Center for Modern Forestry Studies, College of Forestry, Nanjing Forestry University, Nanjing 210037, China
2
Xinjiang Institute of Ecology and Geography, Chinese Academy of Sciences, Urumqi 830011, China
*
Author to whom correspondence should be addressed.
Forests 2025, 16(6), 1031; https://doi.org/10.3390/f16061031
Submission received: 8 April 2025 / Revised: 11 June 2025 / Accepted: 12 June 2025 / Published: 19 June 2025
(This article belongs to the Special Issue Applications of Artificial Intelligence in Forestry: 2nd Edition)

Abstract

Desert plants in arid regions are facing escalating challenges from global warming, underscoring the urgent need to predict shifts in the distribution and habitats of dominant species under future climate scenarios. This study employed the Maximum Entropy (MaxEnt) model to project changes in the potential suitable habitats of three keystone desert species in Xinjiang—Halostachys capsica (M. Bieb.) C. A. Mey (Caryophyllales: Amaranthaceae), Haloxylon ammodendron (C. A. Mey.) Bunge (Caryophyllales: Amaranthaceae), and Karelinia caspia (Pall.) Less (Asterales: Asteraceae)—under varying climatic conditions. The area under the Receiver Operating Characteristic curve (AUC) exceeded 0.9 for all three species training datasets, indicating high predictive accuracy. Currently, Halos. caspica predominantly occupies mid-to-low elevation alluvial plains along the Tarim Basin and Tianshan Mountains, with a suitable area of 145.88 × 10⁴ km2, while Halox. ammodendrum is primarily distributed across the Junggar Basin, Tarim Basin, and mid-elevation alluvial plains and aeolian landforms at the convergence zones of the Altai, Tianshan, and Kunlun Mountains, covering 109.55 × 10⁴ km2. K. caspia thrives in mid-to-low elevation alluvial plains and low-elevation alluvial fans in the Tarim Basin, western Taklamakan Desert, and Junggar–Tianshan transition regions, with a suitable area of 95.75 × 10⁴ km2. Among the key bioclimatic drivers, annual mean temperature was the most critical factor for Halos. caspica, precipitation of the coldest quarter for Halox. ammodendrum, and precipitation of the wettest month for K. caspia. Future projections revealed that under climate warming and increased humidity, suitable habitats for Halos. caspica would expand in all of the 2050s scenarios but decline by the 2070s, whereas Halox. ammodendrum habitats would decrease consistently across all scenarios over the next 40 years. In contrast, the suitable habitat area of K. caspia would remain nearly stable. These projections provide critical insights for formulating climate adaptation strategies to enhance soil–water conservation and sustainable desertification control in Xinjiang.

1. Introduction

In the fragile ecosystems of arid regions, vegetation plays a pivotal role in maintaining ecological stability by regulating hydrological cycles and carbon sequestration, forming a critical ecological barrier against desertification and climate change [1,2,3]. The dynamic relationship between vegetation shifts and climatic factors remains a central focus in global change and biogeographical research [4,5,6]. Climate change is driving alterations in species’ suitable habitats, habitat fragmentation, and accelerated biodiversity loss worldwide. While recent studies have documented a global greening trend under climate change [7,8], particularly in arid zones [9,10,11], revealed that a 2 °C temperature rise could reduce plant distributions by 16%. These contrasting findings highlight the urgent need to identify and predict future suitable habitats for desert vegetation [12,13].
Species distribution models (SDMs), grounded in ecological niche theory, employ machine learning algorithms to correlate environmental variables with species occurrence data, enabling predictions of current and future potential habitats [14]. Various SDM approaches—including Generalized Additive Models (GAMs), Genetic Algorithm for Rule Sets (GARP), Generalized Linear Models (GLMs), and Maximum Entropy (MaxEnt) modeling—have been applied to predict species’ suitable ranges under climate change [15]. However, methodological differences among SDMs can yield divergent projections, necessitating comparative evaluations [16]. In a landmark study comparing 16 SDMs across 226 species globally [17], it was demonstrated that while all models performed adequately, MaxEnt consistently achieved superior predictive accuracy. Consequently, MaxEnt has become the predominant single-model approach for climate change impact assessments [18,19]. Notable applications include analysis of viticulture suitability shifts and evaluation of medicinal plants such as Pentatropis spiralis, now Vincetoxicum spirale, Tylophora hirsuta, now Vincetoxicum hirsutum, and Vincetoxicum arnottianum, all belonging to the order Gentianales, family Apocynaceae, in Pakistan [19], which informed targeted conservation strategies. Such studies confirm MaxEnt’s robustness in habitat prediction, enabling science-based species protection [20].
SSP126, SSP245, SSP370, and SSP585 are scenarios that combine different Shared Socioeconomic Pathways (SSPs) with specific levels of radiative forcing by the year 2100. These scenarios are used to explore a range of possible futures for climate change research.
SSP126 is a sustainable development scenario with a radiative forcing of 2.6 W/m2 by 2100 [21]. It assumes significant efforts to reduce emissions and achieve the goals of the Paris Agreement. This scenario is often associated with a green development pathway [22]. SSP245 represents a medium development pathway with a radiative forcing of 4.5 W/m2 by 2100. It reflects a world with moderate economic growth and some efforts to mitigate climate change. This scenario is considered an intermediate development pathway [22]. SSP370 has a radiative forcing of 7 W/m2 by 2100 and represents a world with high challenges for mitigation and adaptation due to regional conflicts and slow development. This scenario is often associated with significant increases in heatwave exposure, especially in South Asia. SSP585 is characterized by a radiative forcing of 8.5 W/m2 by 2100. It represents a world with rapid economic growth but high dependence on fossil fuels, leading to significant greenhouse gas emissions [23]. This scenario is considered a high development pathway.
In the vast northwestern arid regions of China, three keystone desert species—Halos. caspica, Halox. ammodendrum, and K. caspia—serve as ecological linchpins, maintaining ecosystem balance and combating land degradation [24]. In Central Asia, Haloxylon ammodendron, as an important desert plant, has also been significantly affected by climate change in terms of its distribution and ecological functions. Studies have shown that under the climate change scenarios of the 21st century, the potential geographical distribution of Halos. species in Central Asia is likely to undergo substantial changes [25]. Currently, significant progress has been made in the fields of systematic classification, introduction and cultivation, genetic breeding, and growth rhythm for Halos. caspica, Halox. ammodendrum, and K. caspia [26,27,28,29]. However, research on their responses to climate change remains limited, especially regarding the potential suitable areas of K. caspia Therefore, it is urgent to explore the resources and protect these desert plants.
Among these species, Halos. caspica, a member of the family Amaranthaceae and genus Halostachys, is distributed in Afghanistan, Russia, Mongolia, Iran, and China. Within China, it is specifically found in the northern parts of Xinjiang and Gansu provinces. This species thrives in saline–alkali flats, river valleys, and the margins of salt lakes. It is an excellent shrub for sand fixation, afforestation, and soil and water conservation, and it is widely used in desertification control, saline–alkali land reclamation, and the protection of desert highways. Halox. ammodendrum is a shrub or small tree belonging to the family Amaranthaceae and genus Haloxylon. It is native to northwest Ningxia, western Gansu, northern Qinghai, Xinjiang, and Inner Mongolia in China, and it is also distributed in Central Asia and Siberia, Russia. Halox. ammodendrum plays a vital role in curbing land desertification, improving soil quality, and restoring vegetation. It also protects the surrounding desertified grasslands and maintains ecological balance in a way that other tree species cannot match. It is an important sand-fixing plant in temperate deserts. Karelinia caspica is a perennial herb belonging to the family Asteraceae and genus Karelinia. It is distributed in Xinjiang, Gansu, and Inner Mongolia in China. Karelinia caspica grows in Gobi desert areas, sand dunes, meadow saline–alkali soils, and the edges of reed fields and paddy fields. It accelerates soil desalination, improves soil aeration, enhances leaching effects, and reduces soil salinization rates. It also helps in the utilization of brackish water resources, transforming harmful conditions into beneficial ones for saline–alkali land reclamation.
Despite their remarkable adaptability, these species face mounting threats from both climatic and anthropogenic pressures. Over the past three decades, northwest China has experienced approximately 1.5 °C of warming, accompanied by increasingly erratic precipitation patterns and more frequent extreme drought events. These climatic changes have directly impaired Halox. ammodendrum seedling establishment and Halos. caspica physiological processes [30,31,32]. Drought stress has a significant negative impact on the chlorophyll content, stomatal conductance, and net photosynthetic rate of Halox. ammodendrum seedlings. As the degree of drought increases, the chlorophyll content of the seedlings gradually decreases, stomatal conductance significantly declines, and consequently, the photosynthetic rate is markedly reduced. Concurrently, human activities such as overgrazing have decimated K. caspia populations, while energy infrastructure development (e.g., oil fields, solar farms) continues to encroach upon native habitats. Particularly concerning is the illegal harvesting of Cistanche sp. (Lamiales: Orobanchaceae), which damages the root systems of Halox. ammodendrum. Satellite monitoring has revealed alarming declines, including a 37% reduction in Halos. caspica communities around Xinjiang’s Aibi Lake and a 50% decrease in Halox. ammodendrum forest density in Inner Mongolia’s Alxa region over recent decades.
While preliminary studies have examined these species biochemical and ecological traits [33,34,35], comprehensive conservation-oriented research remains critically lacking. To address this gap, this study employs the MaxEnt model to evaluate habitat suitability for these three ecologically vital species under three Shared Socioeconomic Pathway scenarios (SSP2-4.5, SSP3-7.0, and SSP5-8.5) during two future periods (2041–2060 and 2061–2080). Specifically, our research aims to (I) characterize the current distributions of these desert dominants; (II) identify key environmental drivers influencing their ranges; (III) project potential distribution shifts under climate change scenarios; and (IV) assess the implications of these changes for desertification control in Xinjiang. The findings will provide crucial insights for developing targeted conservation strategies to protect these ecologically and economically important species in the face of ongoing climate change and human pressures.

2. Materials and Methods

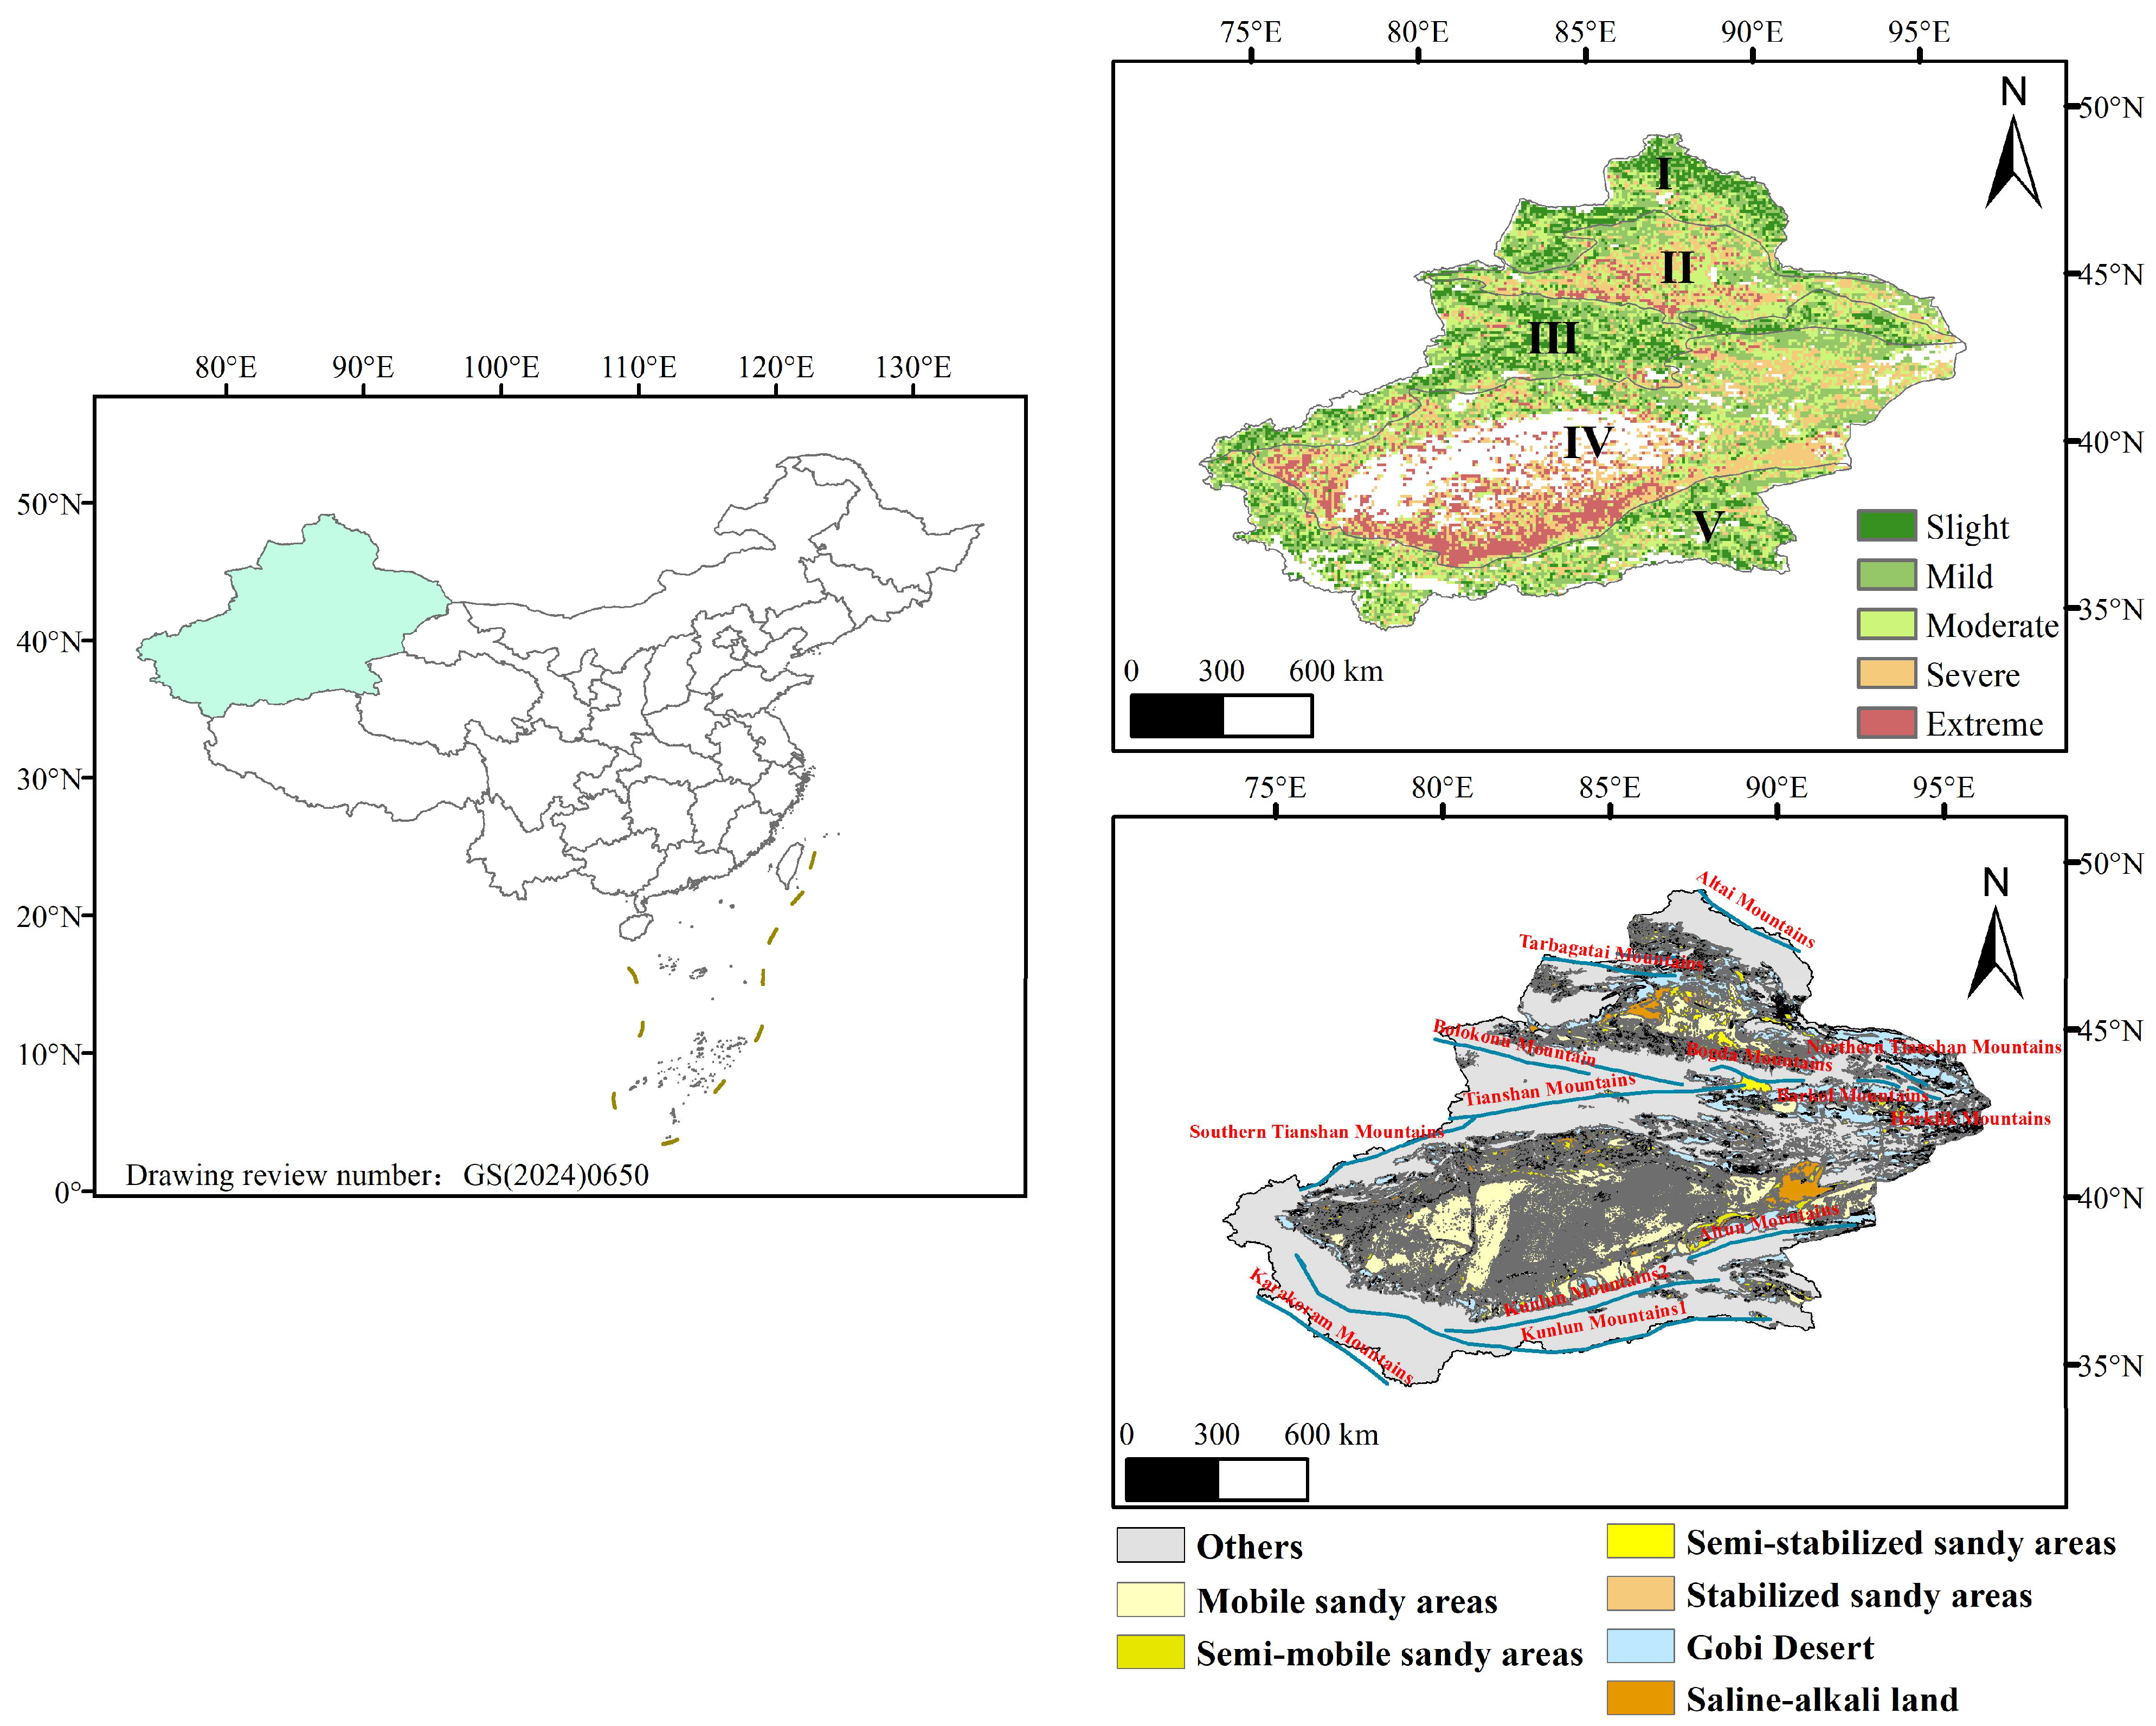
2.1. Study Area Overview

Xinjiang can be divided into five major ecological zones: I. Altai Mountains-Junggar Western Mountain forest-steppe ecoregion, II. Junggar Basin desert ecoregion, III. Tianshan Mountains forest-steppe ecoregion, IV. Tarim Basin-East Xinjiang desert ecoregion, and V. Pamir–Kunlun–Altun Mountains alpine desert-steppe ecoregion. Based on meteorological observations, vegetation NDVI (Normalized Difference Vegetation Index), NPP (Net Primary Productivity), land use, soil erosion, and socioeconomic data, 12 indicator factors were selected, including annual precipitation, annual mean temperature, elevation, slope gradient, slope aspect, soil type, soil erosion intensity, land use type, NDVI, NPP, population density, and per capita GDP. An ecological vulnerability assessment system was constructed using the SRP (Sensitivity–Resistance–Pressure) model. The weights of different indicator factors were calculated using the Analytic Hierarchy Process (AHP) and verified through a consistency test (CR < 0.1). The ecological vulnerability index for the Xinjiang region was obtained by the weighted summation method, and the ecological vulnerability assessment results under different ecological zones were analyzed. Within the study area, these five ecoregions exhibit varying ecological vulnerability indices ranging from Slight to Extreme, as illustrated in Figure 1.

2.2. Species Occurrence Data Collection

The occurrence records of Halos. caspica, Halox. ammodendrum, and K. caspia were obtained from the Global Biodiversity Information Facility (GBIF; https://www.gbif.org/, accessed on 15 May 2024) and the Chinese Virtual Herbarium (CVH; https://www.cvh.ac.cn/, accessed on 15 May 2024). To minimize spatial autocorrelation and avoid overfitting in model predictions, the raw occurrence data were carefully processed through several steps. First, duplicate records and occurrences from cultivated or obviously unnatural locations were removed. Next, a spatial filtering buffer of 30 km was applied to reduce sampling bias, ensuring that only one representative point was retained when multiple records fell within the same buffer zone [36]. After rigorous filtering, the final datasets consisted of 44 occurrence points for Halos. caspica, 63 for Halox. ammodendrum, and 57 for K. caspia. This spatial thinning approach ensured that the distribution data were ecologically representative while maintaining statistical independence for robust model performance. Table 1 records the basic information of these species.
In this study, the so-called absence data were not directly observed but were instead simulated through background points used in the MaxEnt model. These points represent the range of environmental conditions in areas where the species has not been recorded. Unlike true absence data, background points do not indicate that the species is definitively absent, but they serve as a contrast to presence data. While this approach cannot fully substitute for real absence information, it offers a practical and widely accepted method for estimating potential species distributions in the absence of systematic surveys.

2.3. Environmental Variable Acquisition

Building upon previous research and considering the environmental characteristics of desertification-resistant tree species habitats, this study incorporated climatic, habitat, and disturbance factors to construct the MaxEnt model [37]. We selected 19 environmental variables related to temperature, temperature variation, and precipitation for model construction (Table 2), with a spatial resolution of 2.5 arcmin. These bioclimatic variables, derived from monthly mean temperature and precipitation data, reflect regional thermal and hydrological characteristics that are biologically relevant to species survival [3].
For future climate projections, we utilized data from the Beijing Climate Center’s medium-resolution climate system model (BCC-CSM2-MR) within the Coupled Model Intercomparison Project Phase 6 (CMIP6), as this model demonstrates reliable performance in simulating precipitation and temperature patterns across China [4]. More accurate soil moisture data provided by the BCC-CSM2-MR, combined with projections indicating increased frequency, duration, and spatial extent of global droughts in most regions during the 21st century, underscore the mutually constraining relationship among rainfall and temperature [38].
The current climate data represent 1970–2000 bioclimatic variables, while future projections incorporate three Shared Socioeconomic Pathways (SSPs): the intermediate emission scenario SSP2-4.5, the medium-high emission scenario SSP3-7.0, and the high emission scenario SSP5-8.5. The selection of the SSP2-4.5, SSP3-7.0, and SSP5-8.5 scenarios, rather than the SSP1-2.6 scenario, is primarily because the SSP1-2.6 scenario assumes that the global community will achieve the goals of the Paris Agreement, resulting in a significant reduction in greenhouse gas emissions and a relatively smaller degree of global warming. This scenario is considered more optimistic. However, the ecosystem in the Xinjiang region is fragile and highly sensitive to climate change. The focus of the research is to assess the ecological responses under broader climate change pressures. The SSP2-4.5, SSP3-7.0, and SSP5-8.5 scenarios cover a range of possibilities from medium to high emissions, which can more comprehensively reflect the potential impacts of future climate change on the distribution of desert plants. This provides richer scientific evidence for ecological protection and desertification control. These projections cover two time periods:

2.4. Variable Screening

The Maxent model estimates a set of functions that correlate environmental variables with distribution probabilities based on the principle of Maximum Entropy in presence data to approximate species’ ecological niches and potential geographic distributions [17]. Given the inherent correlations among environmental variables where excessively high interdependencies may cause model overfitting, this study implemented systematic environmental factor screening and correlation analysis to ensure prediction reliability [15]. The program first uses the 19 bioclimatic variables in MaxEnt 3.4.4 to conduct preliminary simulations for three desertification-resistant species and assesses the predictive contribution of each variable. ArcGIS 10.8 then extracted values of residual bioclimatic variables at species occurrence points, followed by Pearson correlation analysis in ENMTools 1.0 [15,16,17]. Variables with correlation coefficients |r| < 0.8 were all retained, while for |r| ≥ 0.8 pairs, selection prioritized higher contribution rates and permutation importance [39]. Final variable sets showed species-specific patterns (Table 3): Halos. caspica retained annual mean temperature, mean diurnal range, isothermality, temperature seasonality, mean temperature of the driest quarter, precipitation of the wettest month, precipitation of the wettest quarter and precipitation of the coldest quarter (8 variables); Halox. ammodendrum kept mean diurnal range, temperature seasonality, maximum temperature of warmest month, mean temperature of driest quarter, precipitation of wettest month, precipitation of wettest quarter and precipitation of coldest quarter (7 variables); K. caspia. preserved mean diurnal range, temperature seasonality, maximum temperature of warmest month, mean temperature of wettest quarter, mean temperature of driest quarter, mean temperature of coldest quarter, precipitation of wettest month and precipitation of coldest quarter (8 variables).

2.5. Model Parameterization and Performance Evaluation

The selected climatic variables and species occurrence data were incorporated into MaxEnt version 3.4.4 for each target species, with the dataset partitioned into 25% for testing and 75% for training purposes. The output format was configured to logistic values while maintaining default settings for other parameters [15,16,18,40]. Model accuracy was quantitatively assessed using the Receiver Operating Characteristic (ROC) curve analysis, where the Area Under the Curve (AUC) serves as a critical indicator of predictive performance. The AUC metric ranges from 0.5 to 1.0, with values approaching 1.0 denoting higher model reliability [16]. The formula for AUC can be derived from its physical meaning:
A U C = p i , n j p i > n j P N
where P is the number of positive samples and N is the number of negative samples. pi is the probability that a positive sample is predicted to be a positive case; nj is the rate at which a negative sample is predicted to be a positive case [41].
Following established ecological modeling conventions, we classified model performance according to standardized AUC thresholds: predictions were considered failed (AUC 0.5–0.6), poor (AUC 0.6–0.7), moderate (AUC 0.7–0.8), good (AUC 0.8–0.9), or excellent (AUC 0.9–1.0) [15,18]. To enhance result robustness, each species distribution model underwent 10 bootstrap replicates using MaxEnt’s built-in resampling functionality, with the final output representing the mean prediction across all iterations. This repeated subsampling approach mitigates potential bias from single-run simulations while providing more stable estimates of species–environment relationships.

2.6. Habitat Suitability Zonation

Based on the predictive outputs from the MaxEnt model, we classified habitat suitability probabilities for the target species within Xinjiang using a standardized categorization system. The natural breaks classification method [42] was employed to delineate four distinct suitability zones: non-suitable habitat (p ≤ 0.2), marginally suitable habitat (0.2 < p ≤ 0.4), moderately suitable habitat (0.4 < p ≤ 0.7), and highly suitable habitat (p > 0.7). Spatial analysis tools were subsequently applied to quantify the areal extent of potential suitable habitats across different temporal scenarios. In accordance with the threshold determination methodology outlined in the IPCC Fifth Assessment Report, we implemented the Maximum Training Sensitivity plus Specificity (MaxSSS) logistic threshold criterion [43]. This approach established a binary classification system where areas with predicted probabilities below the MaxSSS threshold (p < MaxSSS) were designated as non-suitable (assigned value 0), while those meeting or exceeding the threshold (p ≥ MaxSSS) were classified as suitable habitat (assigned value 1). This procedure generated presence–absence matrices representing species distribution patterns under varying climatic conditions. This method minimizes the within-class variance while maximizing the between-class differences, which is consistent with the ecological thresholds observed in arid plant communities [44]. The maximum training sensitivity plus specificity (MaxSSS) threshold derived from the ROC curve analysis is applied to convert continuous probabilities into binary presence–absence maps, a method that has been validated in plant studies [45]. This dual-criterion framework ensures ecological interpretability while reducing model overfitting, as demonstrated in similar applications of MaxEnt for medicinal plant species [46]. The final analytical phase involved geospatial processing in ArcGIS 10.8, where the derived matrix values were spatially rendered to produce visualized distribution patterns for Halos. caspica, Halox. ammodendrum, and Karelinia caspica. This cartographic representation effectively demonstrates spatiotemporal dynamics in habitat suitability across the study region.

3. Results

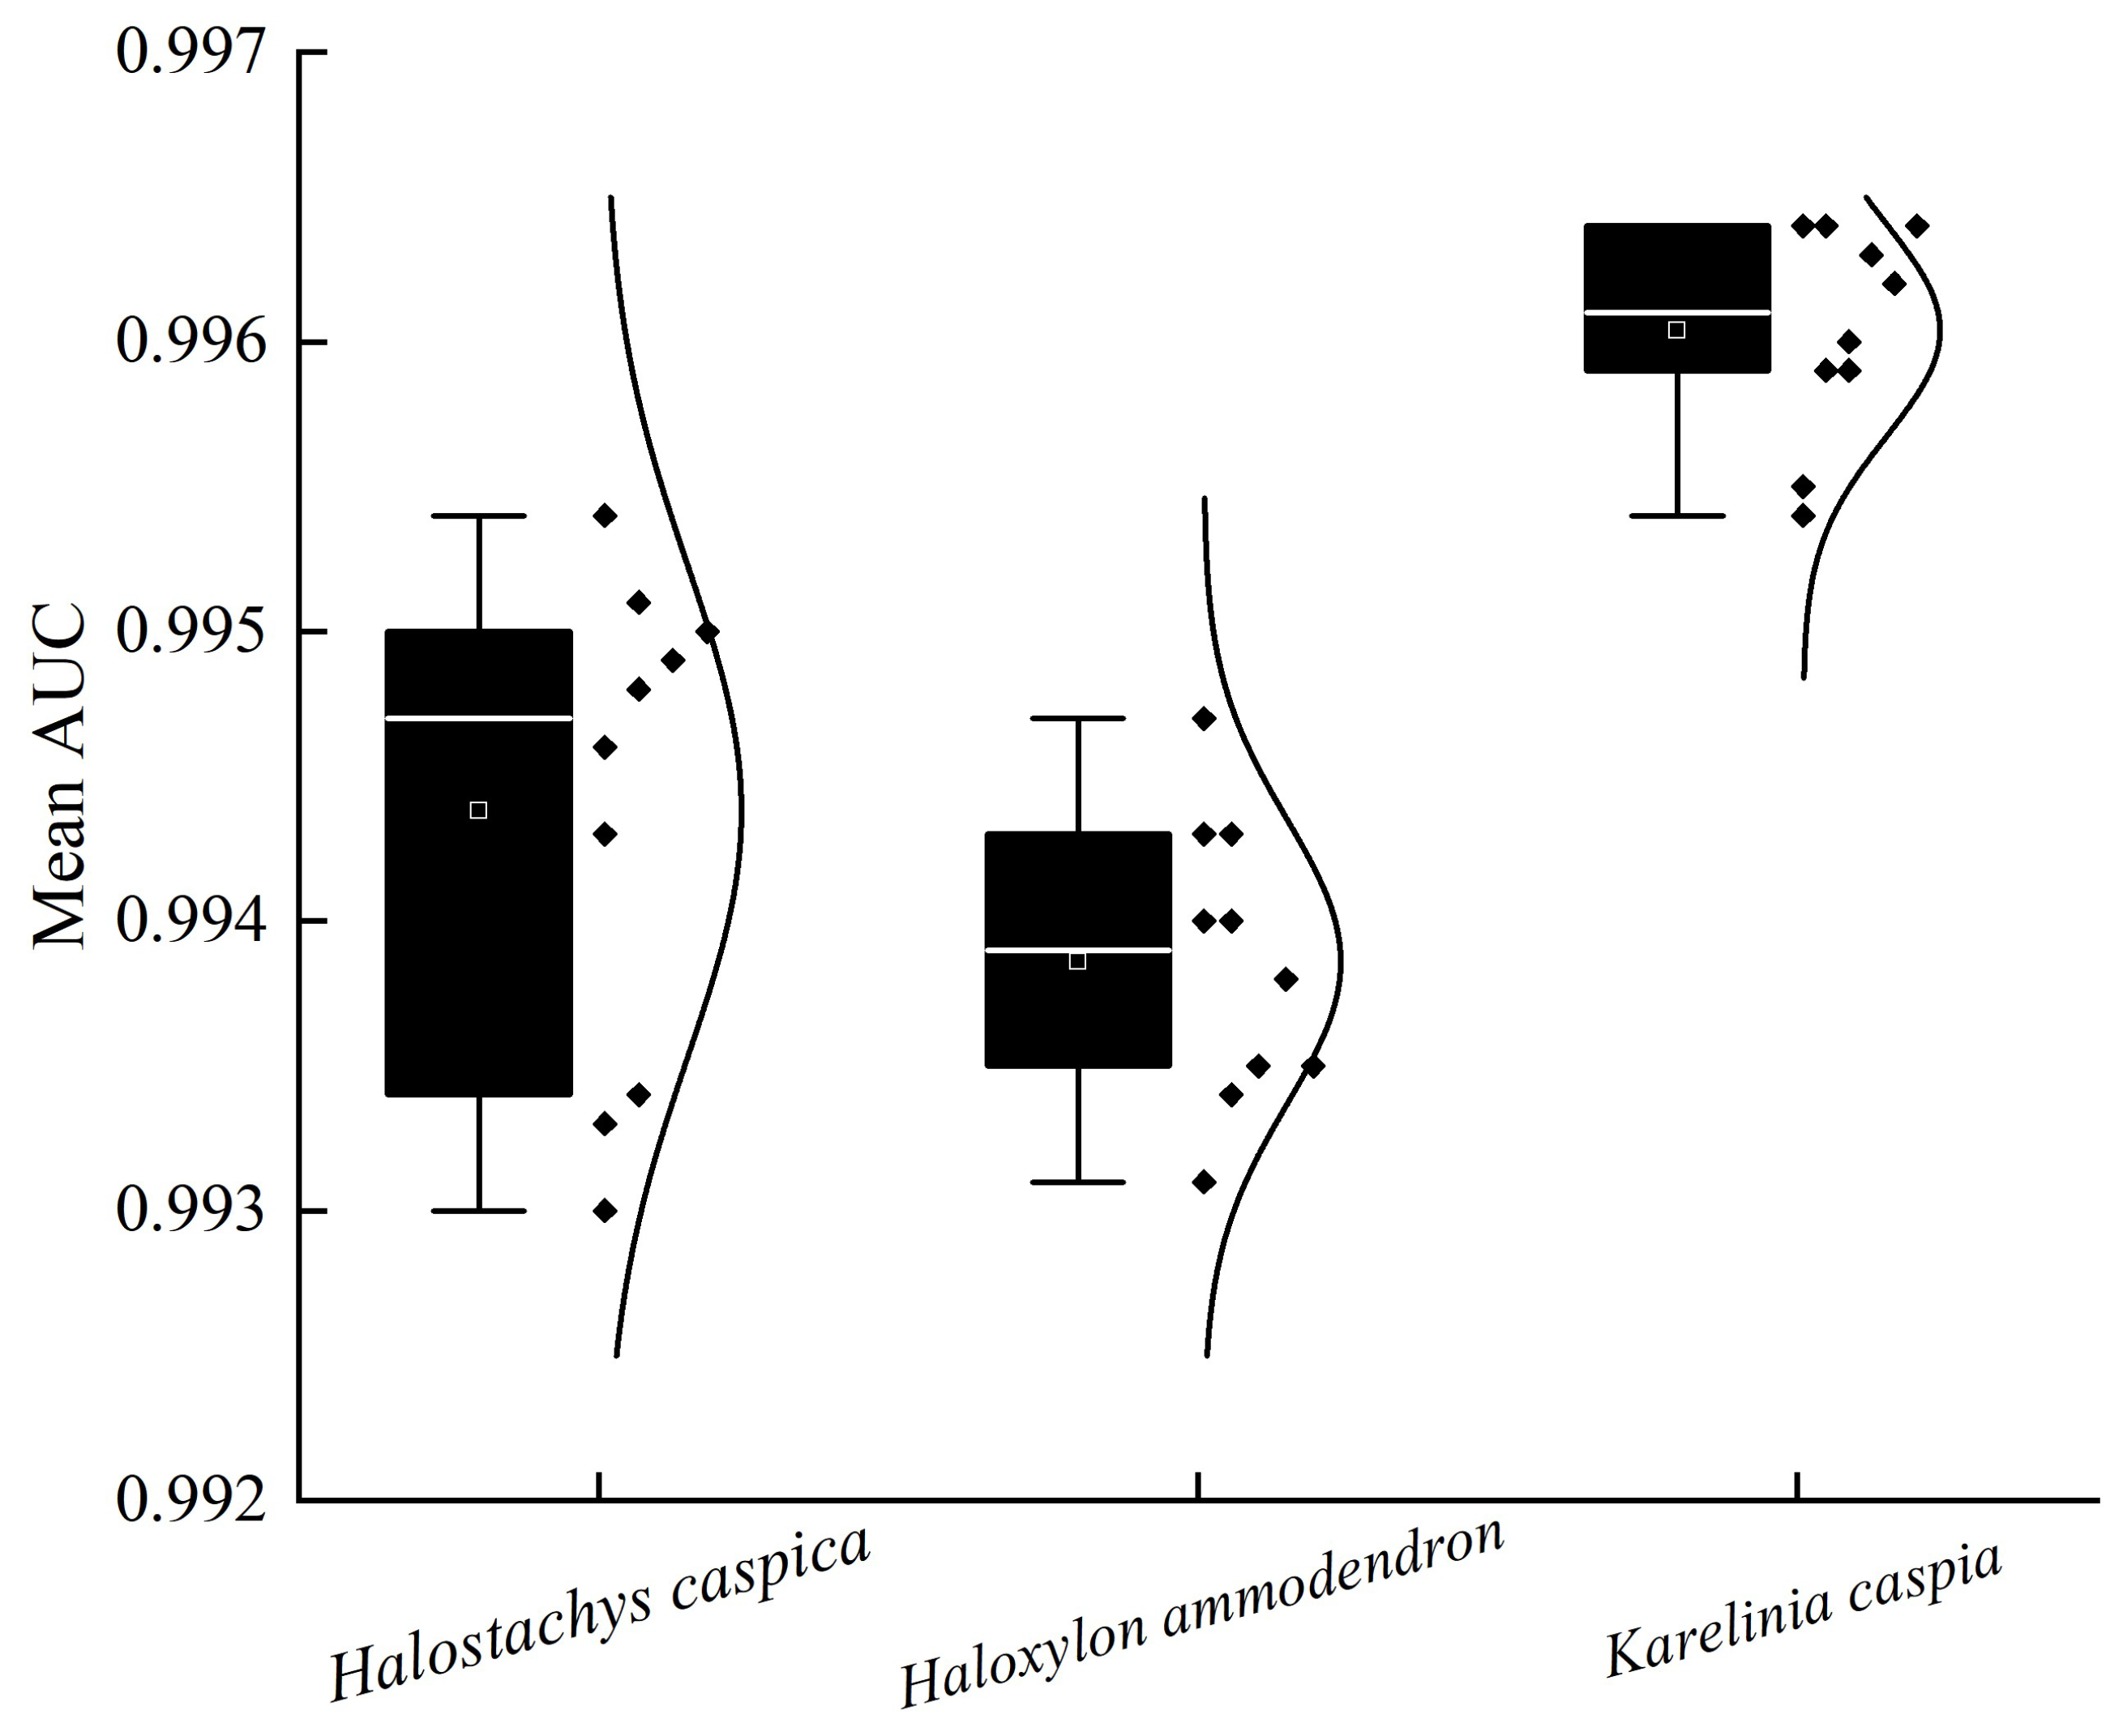
3.1. Model Predictive Accuracy Evaluation

The MaxEnt model results showed mean training AUC values of 0.994, 0.994, and 0.996 (Figure 2), indicating highly accurate predictions. These results demonstrate the effectiveness of using MaxEnt to predict potential distributions of Halos. caspica, Halox. ammodendrum, and K. caspia. under current and future climate scenarios.

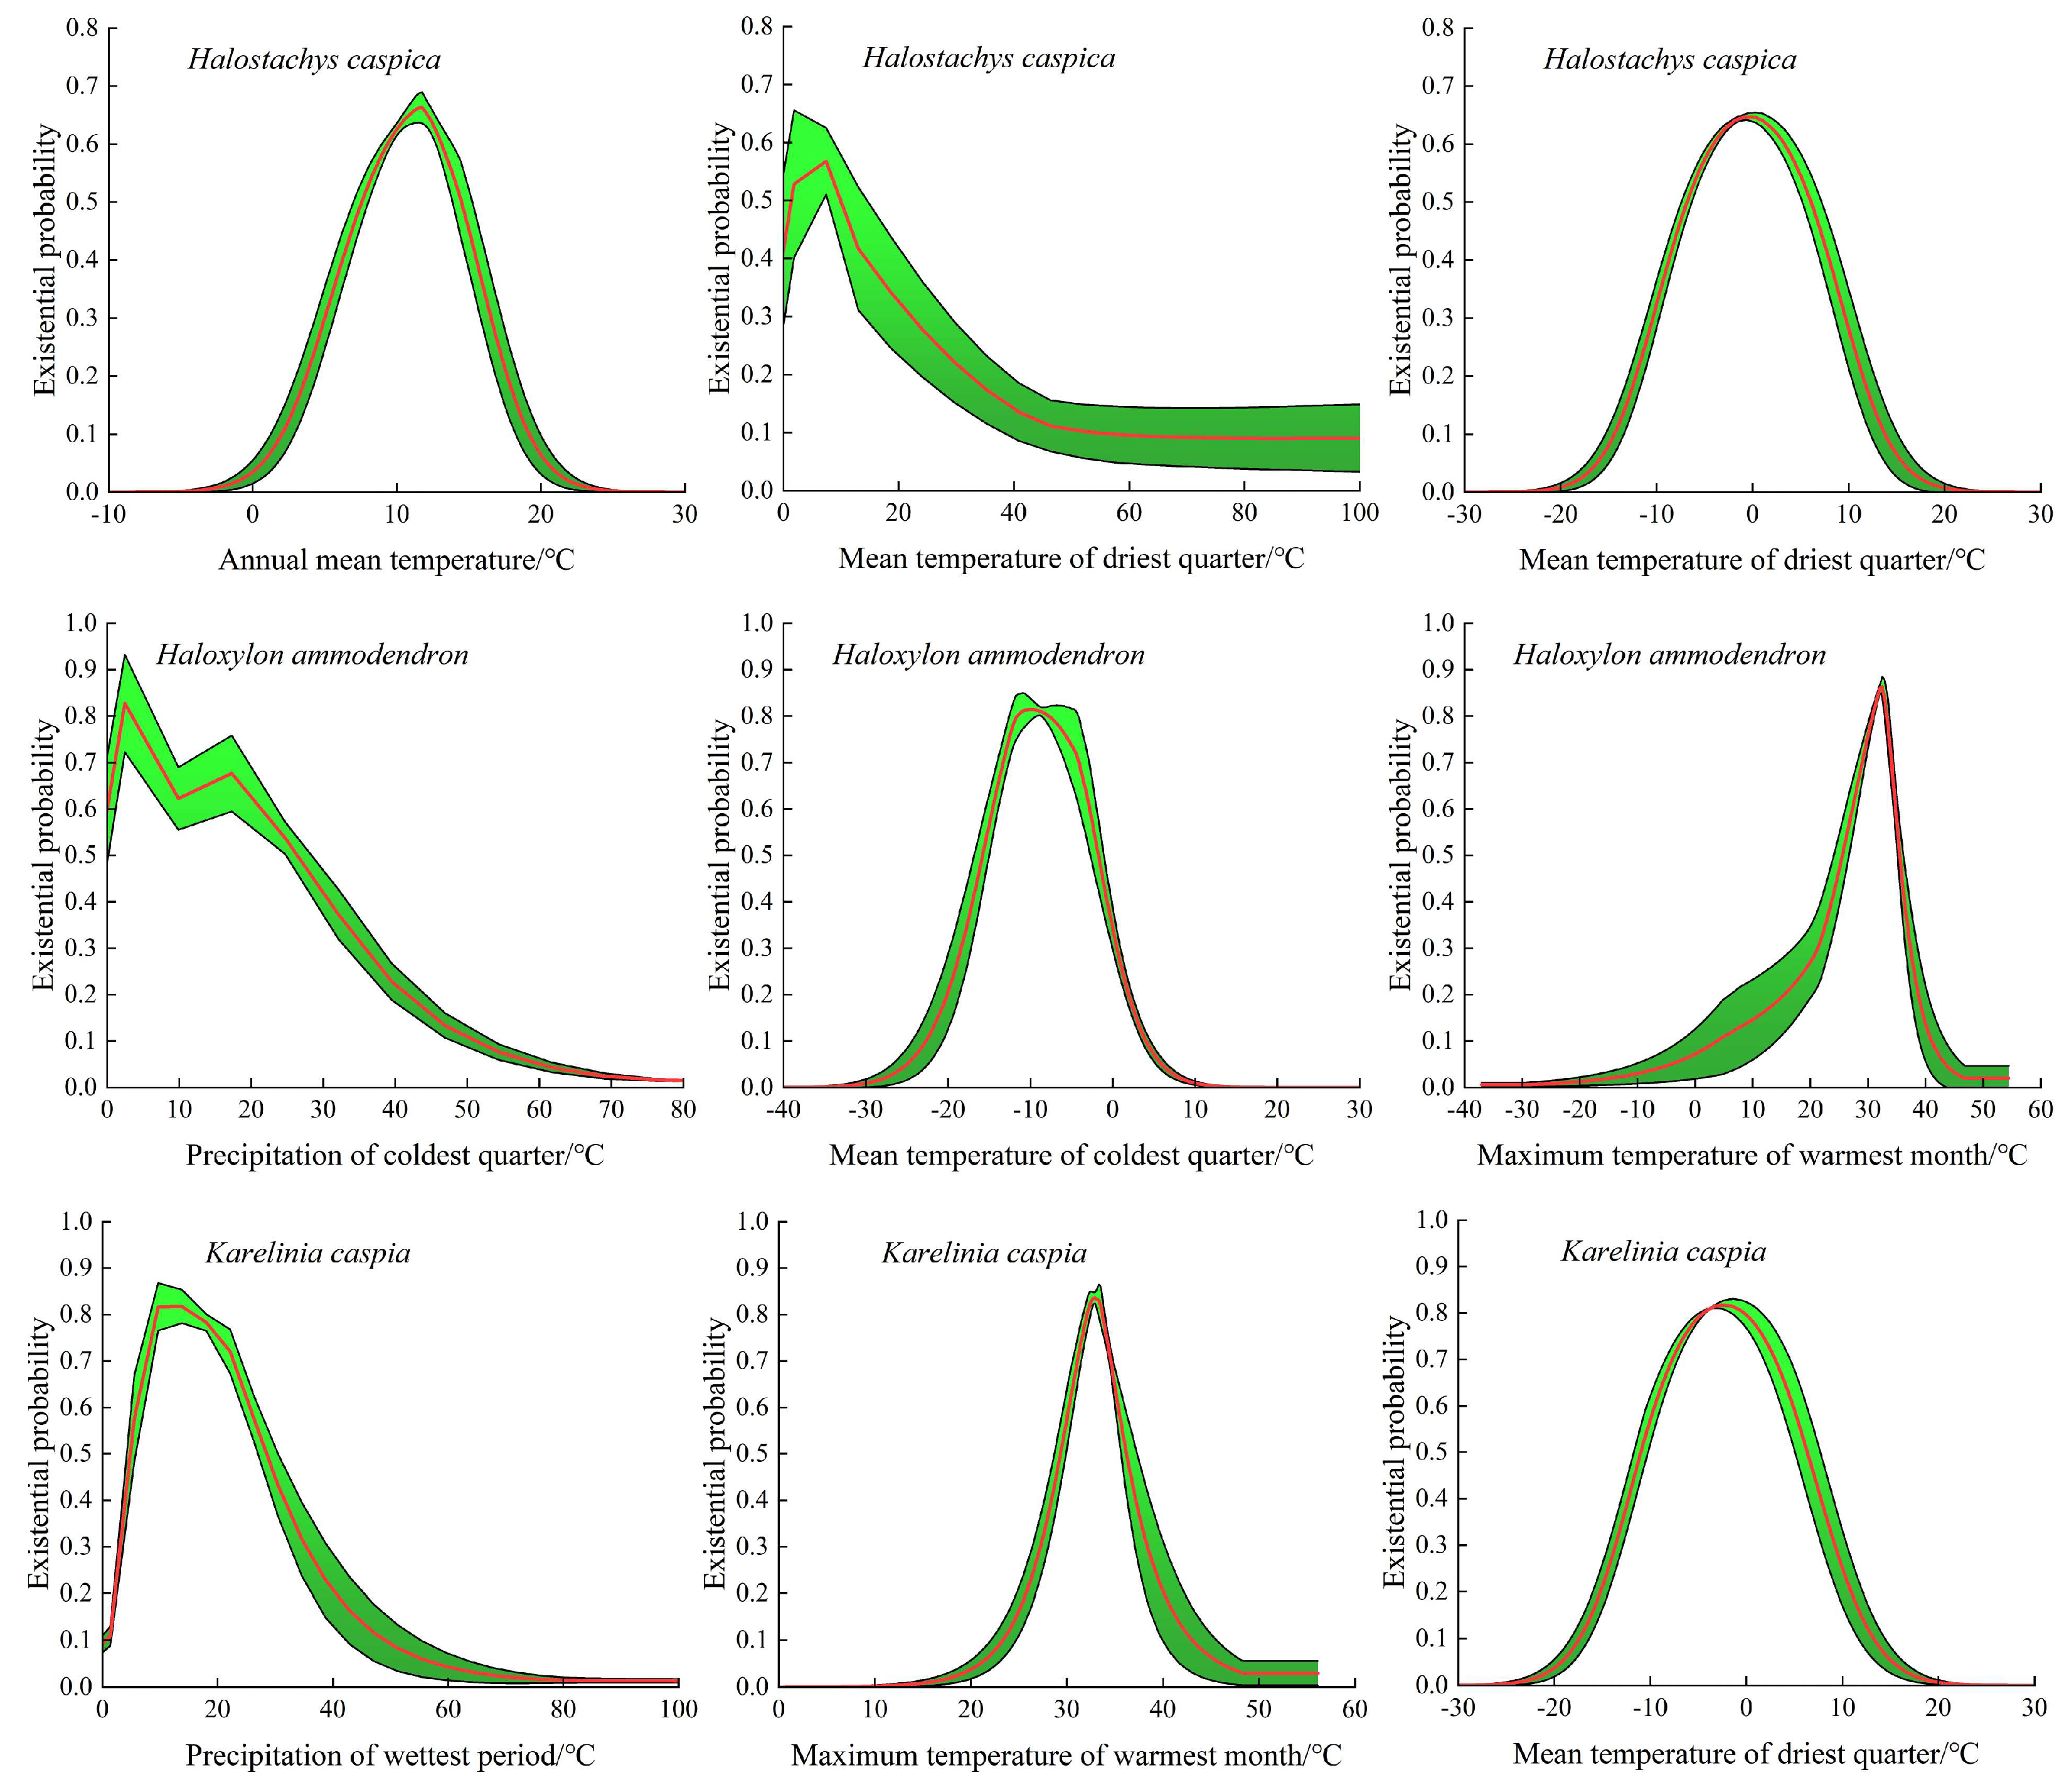
3.2. Analysis of Dominant Environmental Factors

The MaxEnt model output results, based on percentage contribution rates, clearly demonstrate the influence of different climatic factors on the potential suitable habitats of the three species. For Halos. caspica, the dominant environmental factors determining its potential distribution were mean annual temperature, precipitation of the coldest quarter, and mean temperature of the driest quarter, collectively accounting for 66.5% of the total contribution rate. Halox. ammodendrum distribution was primarily influenced by precipitation of the coldest quarter, mean temperature of the coldest quarter, and maximum temperature of the warmest month, totaling 51.9% contribution. K. caspia suitable habitats were mainly determined by precipitation of the wettest month, maximum temperature of the warmest month, and mean temperature of the driest quarter, comprising 60.1% of the total contribution.
As shown in Figure 3, the presence probability of Halos. caspica exhibited a positive correlation with mean annual temperature and mean temperature of the driest quarter, showing an initial increase followed by a decrease, while demonstrating a negative correlation with precipitation of the coldest quarter, displaying a gradual declining trend. Specifically, the maximum presence probability occurred at 11 °C for mean annual temperature (optimal range: 8–14 °C), 0 °C for mean temperature of the driest quarter (optimal range: −7 to 6 °C), and 7 mm for precipitation of the warmest quarter (optimal range: 2–7 mm).
For Halox. ammodendrum, the presence probability followed a normal distribution with mean temperature of the coldest quarter and maximum temperature of the warmest month, while showing a negative correlation with precipitation of the coldest quarter. The peak presence probability occurred at 2 mm for the precipitation of the coldest quarter (optimal range: 2–25 mm), −9 °C for the mean temperature of the coldest quarter (optimal range: −16 to 2 °C), and 32 °C for the maximum temperature of the warmest month (optimal range: 26–35 °C).
The presence probability of K. caspia showed approximately positive correlations with precipitation of the wettest month, maximum temperature of the warmest month, and mean temperature of the driest quarter. The maximum probabilities occurred at 14 mm for the precipitation of the wettest month (optimal range: 6–26 mm), 33 °C for the maximum temperature of the warmest month (optimal range: 29–36 °C), and −2 °C for the mean temperature of the driest quarter (optimal range: −11 to 6 °C).

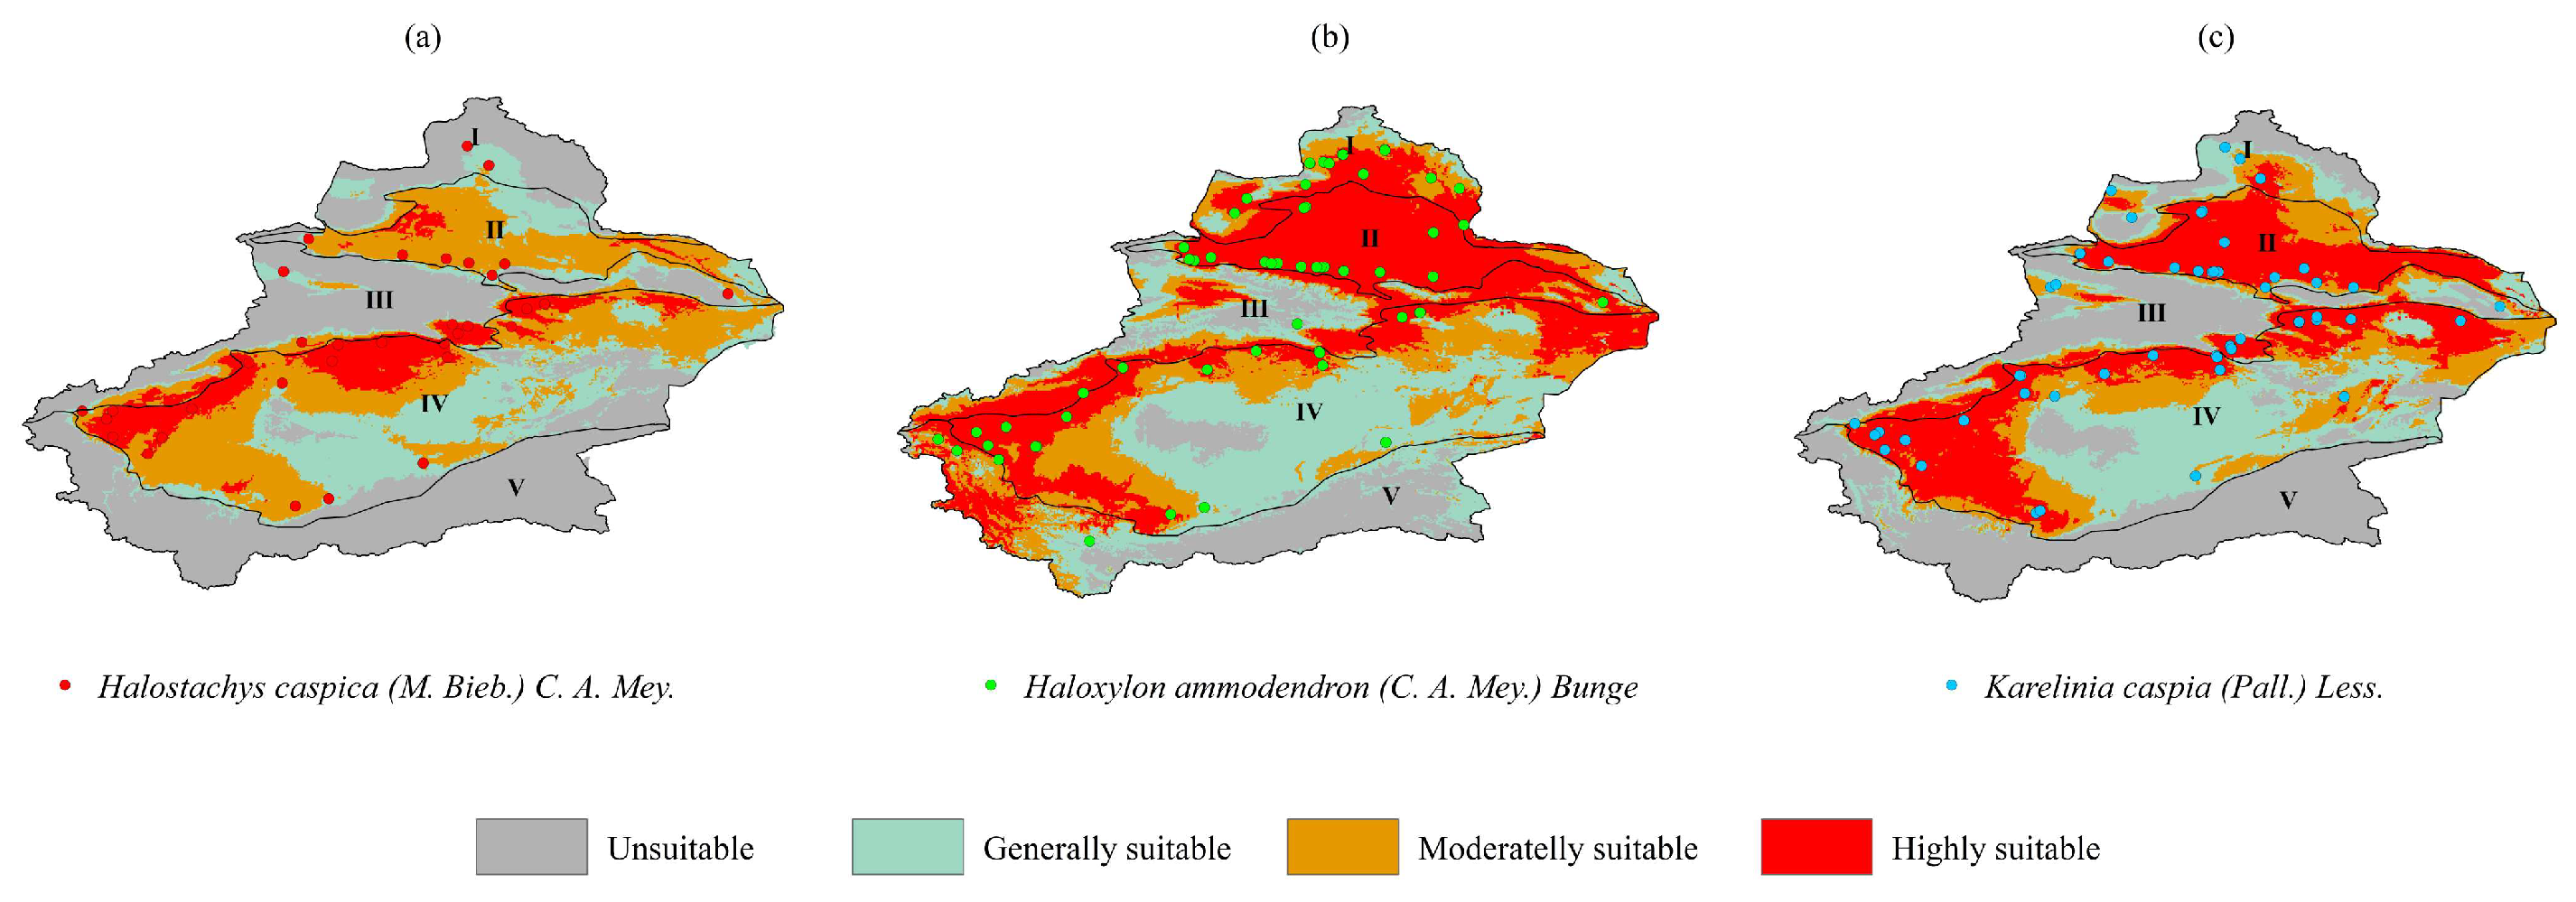
3.3. Spatial Pattern Changes in Three Species Under Current Climate Conditions

As shown in Figure 4, the current potential suitable distribution areas of Halos. caspica in Xinjiang are primarily concentrated in central Xinjiang. The moderately and highly suitable habitats are mainly distributed in (1) the northwestern part of Ecoregion II (Junggar Basin Desert Ecoregion), and (2) areas adjacent to the Tianshan Mountains within Ecoregion IV (Tarim Basin-East Xinjiang Desert Ecoregion). The total areas of high, moderate, and low suitability habitats are 15.05 × 10⁴ km2, 46.02 × 10⁴ km2, and 34.70 × 10⁴ km2, respectively. The current potential distribution of Halox. ammodendrum is predominantly located in northern and central Xinjiang. Its moderately and highly suitable habitats are distributed across (1) the entire Ecoregion II, (2) extensive areas of Ecoregion I (Altai Mountains-Junggar Western Mountain Forest-Steppe Ecoregion), (3) partial areas along the Tianshan Mountains in Ecoregion IV, with limited distribution in (4) Ecoregion III (Tianshan Mountains Forest-Steppe Ecoregion), and (5) Ecoregion V (Pamir–Kunlun–Altun Mountains Alpine Desert-Steppe Ecoregion). The total suitable habitat area in contemporary Xinjiang is 145.88 × 10⁴ km2, comprising 52.32 × 10⁴ km2 (high), 34.13 × 10⁴ km2 (moderate), and 59.42 × 10⁴ km2 (low) suitability areas. The current potential distribution of K. caspia is mainly found in central and northern Xinjiang. The moderately and highly suitable habitats primarily occur in (1) Ecoregion II and (2) areas bordering the Tianshan and Kunlun Mountains within Ecoregion IV. The total contemporary suitable habitat area in Xinjiang is 109.55 × 10⁴ km2, with high, moderate, and low suitability areas covering 43.45 × 10⁴ km2, 30.70 × 10⁴ km2, and 35.51 × 10⁴ km2, respectively.

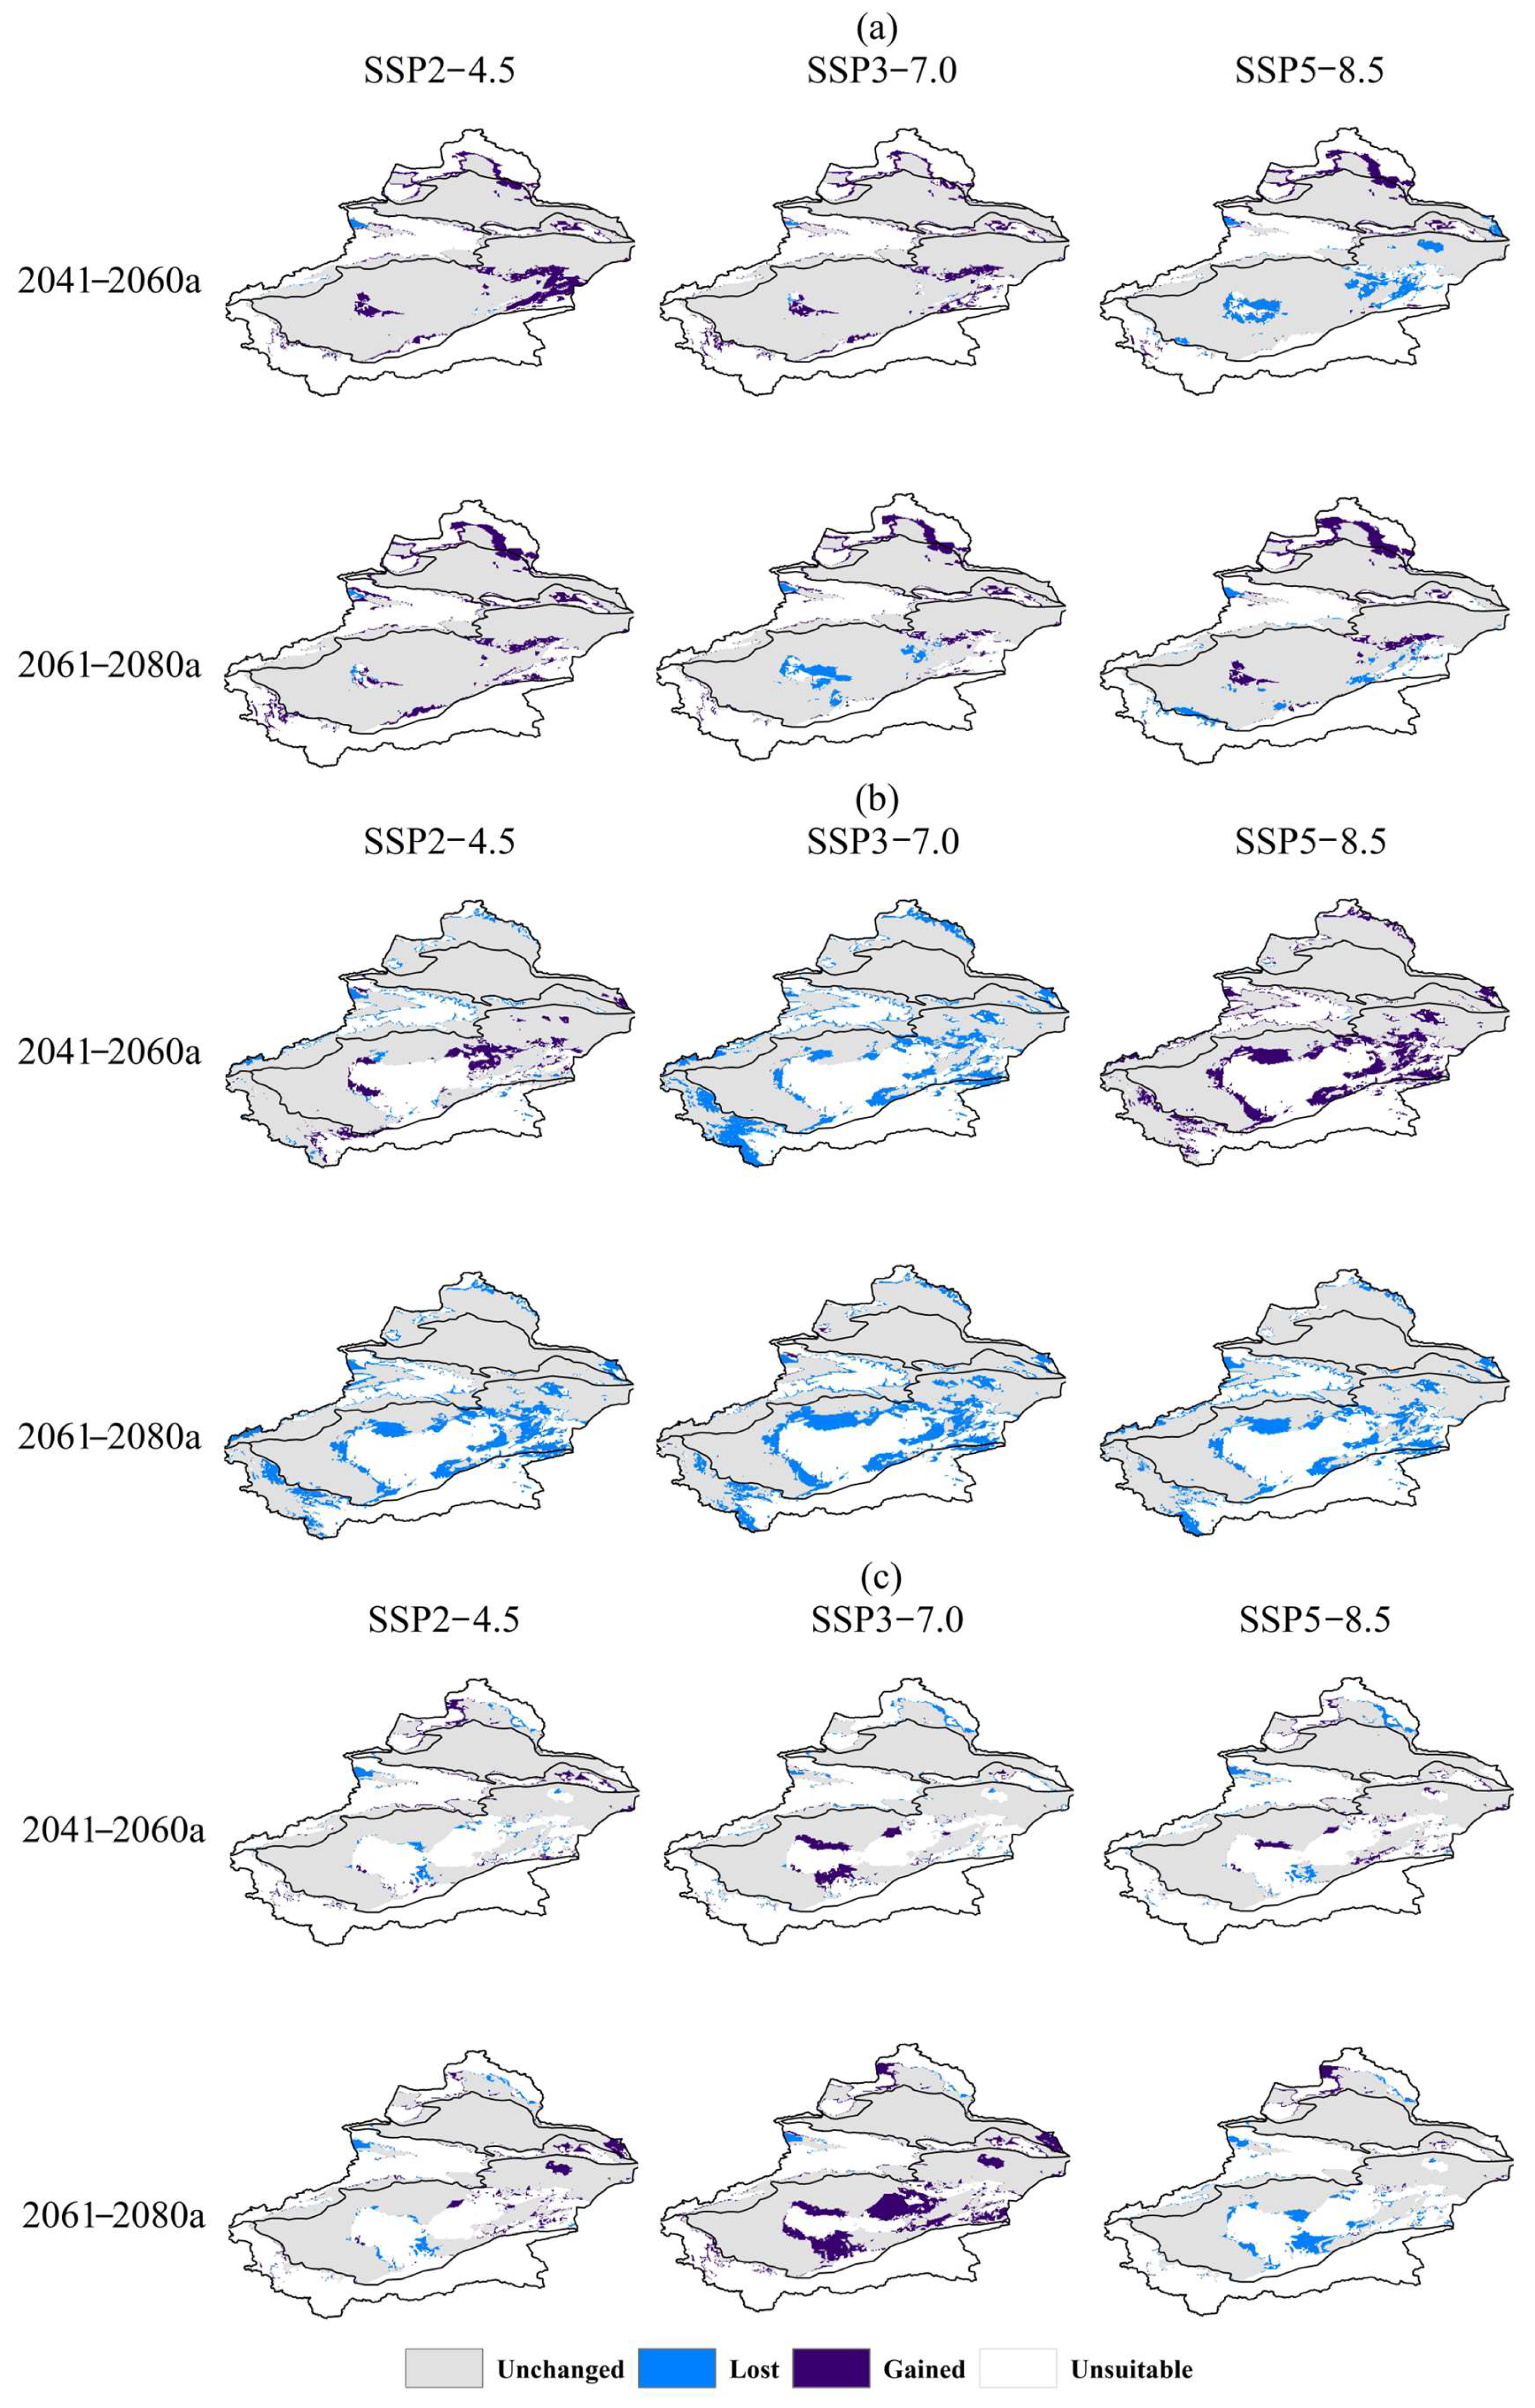
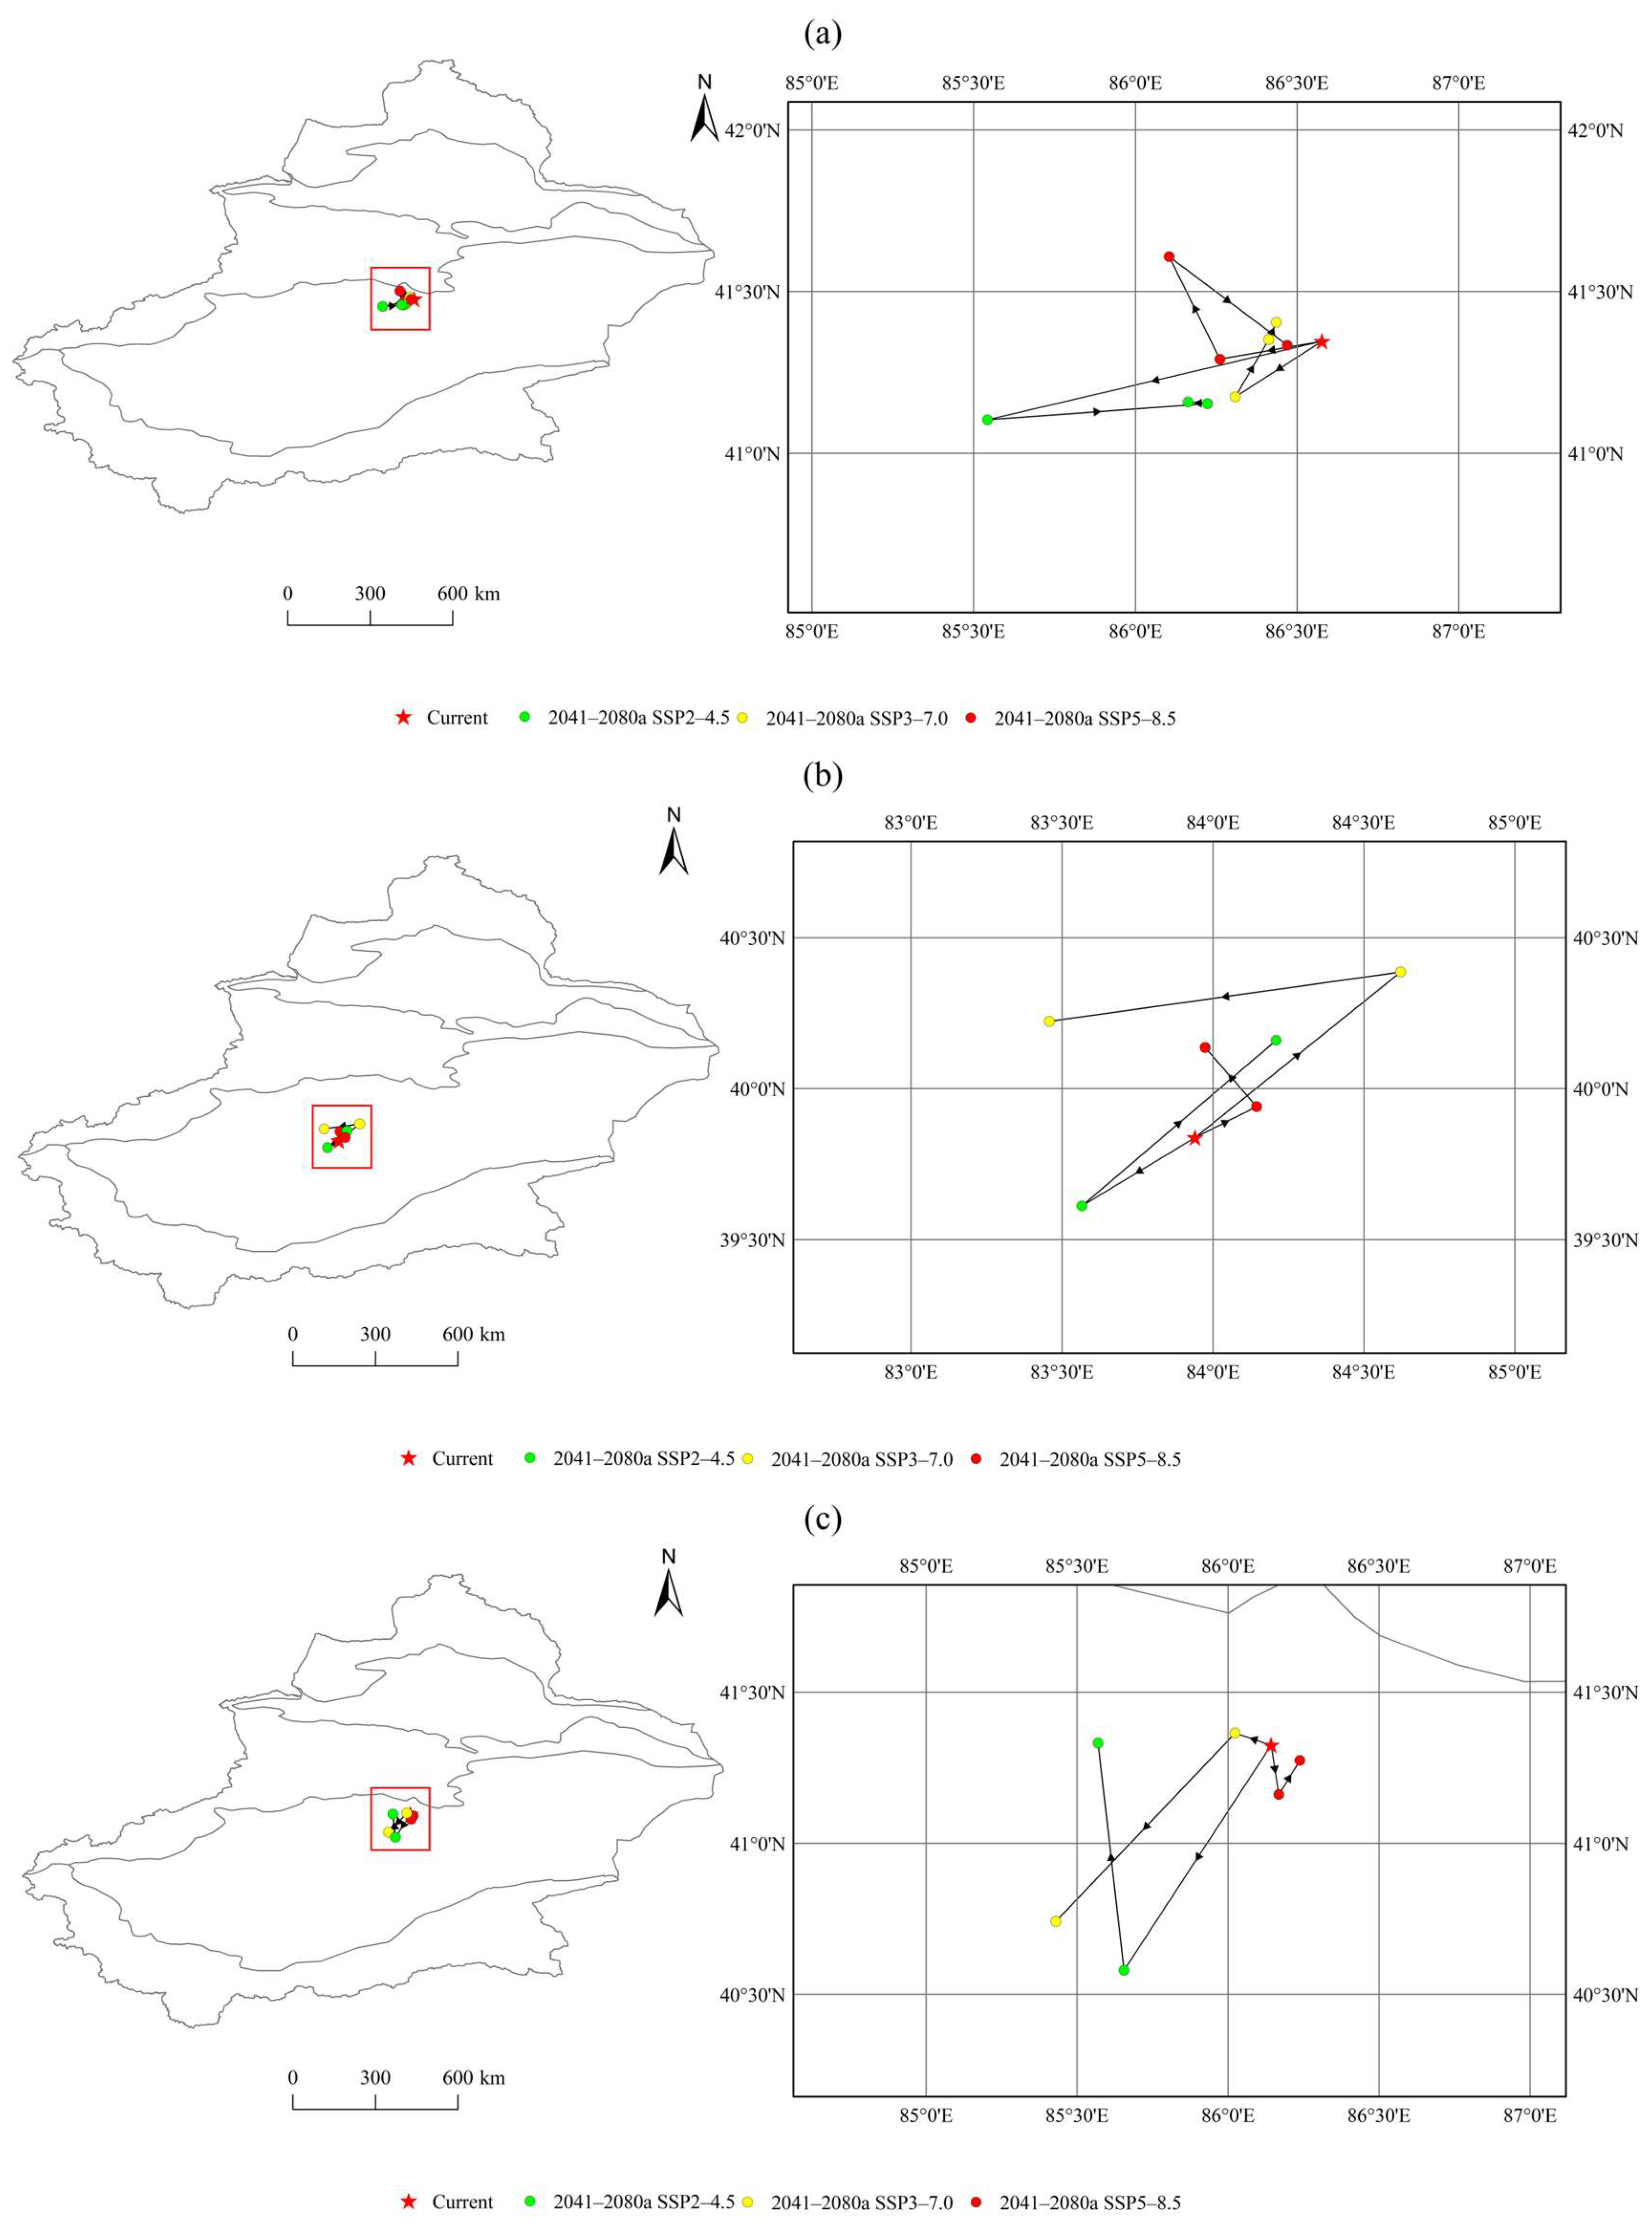
3.4. Spatial Pattern Changes in Three Species Under Different Scenarios

3.4.1. Future Spatial Pattern Changes in Halos. caspica

Analysis of Figure 5 and Figure 6 and Table 4 reveals distinct phased evolution characteristics of ecological adaptability under different climate scenarios.
Under the SSP2-4.5 scenario, the suitable habitat distribution remained generally stable from 2041 to 2060, with marginal expansion observed in transition zones surrounding the core distribution area in central Xinjiang. By 2061–2080, significant range expansion occurred, particularly with new potential habitat patches forming in northern Xinjiang. Quantitative assessment showed a net expansion of ≤10.38 × 10⁴ km2 and net contraction of ≤0.47 × 10⁴ km2 compared to baseline conditions. Spatial centroid analysis indicated an overall southwestward displacement over 40 years.
Under the SSP3-7.0 scenario, 2041–2060 witnessed moderate habitat contraction, followed by continued contraction in 2061–2080, particularly in the central Tarim Basin. Net expansion remained ≤10.38 × 10⁴ km2, while net contraction increased to ≤3.48 × 10⁴ km2. The habitat centroid shifted westward during the study period.
Under the SSP5-8.5 scenario, 2041–2060 exhibited large-scale contraction in southern and eastern Xinjiang but expansion in northern regions. By 2061–2080, contraction rates decreased, with emerging expansion in central Xinjiang. Net expansion reached ≤7.92 × 10⁴ km2, while net contraction was ≤7.03 × 10⁴ km2. Over four decades, the centroid migrated northwestward.

3.4.2. Future Spatial Pattern Changes in Halox. ammodendrum

Figure 5 and Figure 6 and Table 2 demonstrate that the spatial patterns of ecological adaptability exhibit distinct phased evolutionary characteristics under different climate scenarios. Under the SSP2-4.5 scenario, the potential suitable habitat of Halox. ammodendrum in northern and southern Xinjiang will contract during the 2041–2060 period, while expansion will occur in central Xinjiang. By the 2061–2080 period, the suitable habitat area shows a significant contraction trend, with large-scale shrinkage particularly evident in southern Xinjiang. Quantitative assessment reveals that, compared to baseline climate conditions, the net expansion area of the species’ potential suitable habitat is within 6.74 × 10⁴ km2, while the net contraction area remains below 12.2 × 10⁴ km2. Spatial centroid migration analysis further indicates that the centroid of Halox. ammodendrum suitable habitat will shift southeastward over the next 40 years.
Under the SSP3-7.0 scenario, the contraction range of potential suitable habitat will progressively expand, with a particularly pronounced shrinkage in the Tarim Basin region. Quantitative assessment shows that, relative to baseline conditions, the net expansion area of potential suitable habitat is below 0.23 × 10⁴ km2, while the net contraction area is within 20.26 × 10⁴ km2. Spatial centroid migration analysis further demonstrates that the centroid of Halox. ammodendrum suitable habitat will shift northeastward over the next four decades.
Under the SSP5-8.5 scenario, the potential suitable habitat of Halox. ammodendrum in southern Xinjiang will exhibit substantial expansion during the 2041–2060 period. However, by the 2061–2080 period, contraction areas gradually dominate, with nearly no expansion zones remaining. Quantitative assessment indicates that, compared to baseline conditions, the net expansion area of potential suitable habitat is below 18.93 × 10⁴ km2, while the net contraction area is within 10.75 × 10⁴ km2. Spatial centroid migration analysis further reveals that the centroid of Halox. ammodendrum suitable habitat will shift northwestward over the next 40 years.

3.4.3. Future Spatial Pattern Changes in K. caspia

As shown in Figure 5 and Figure 6 and Table 4, the spatial patterns of ecological adaptability under different climate scenarios exhibit distinct phased evolutionary characteristics. Under the SSP2-4.5 scenario, the potential suitable habitats of K. caspia in northern Xinjiang are projected to expand during the 2041–2060 period, while those in southern Xinjiang are expected to contract. By the 2061–2080 period, extensive contraction is predicted to occur in eastern Xinjiang. Quantitative assessment indicates that, compared to baseline climatic conditions, the net expansion area of the species’ potential suitable habitat is limited to 3.47 × 10⁴ km2, while the net contraction area remains below 2.5 × 10⁴ km2. Spatial centroid migration analysis further reveals that the centroid of K. caspia suitable habitat will generally shift southeastward over the next 40 years.
Under the SSP3-7.0 scenario, the potential suitable habitats in southern Xinjiang are projected to gradually contract, with virtually no observable expansion areas. Quantitative evaluation demonstrates that, relative to baseline conditions, the net expansion area of the species’ potential suitable habitat is confined to 9.15 × 10⁴ km2, while the net contraction area reaches up to 2.23 × 10⁴ km2. Spatial centroid migration analysis further indicates that the centroid of K. caspia suitable habitat will shift northwestward over the next four decades.
Under the SSP5-8.5 scenario, the potential suitable habitats of K. caspia in northern Xinjiang are expected to experience significant expansion during the 2041–2060 period, while partial contraction is predicted in central Xinjiang. By the 2061–2080 period, the contraction area in central Xinjiang progressively enlarges, with almost no remaining expansion zones. Quantitative assessment shows that, compared to baseline climatic conditions, the net expansion area of the species’ potential suitable habitat is limited to 3.34 × 10⁴ km2, while the net contraction area reaches 3.27 × 10⁴ km2. Spatial centroid migration analysis further suggests that the centroid of K. caspia suitable habitat will generally shift southwestward over the next 40 years.

4. Discussion

Vegetation plays an irreplaceable and crucial role in maintaining climate stability, and its dynamic characteristics serve as important indicators for evaluating ecological environments [47]. At large geographic scales, climatic factors act as dominant environmental drivers shaping species distribution patterns by limiting physiological tolerance boundaries and resource availability [48]. Zhu et al.’s research showed that the highest temperature of 25 °C and 30/15 °C inhibited seed germination of Halox. ammodendrum in the Mutthar Desert [49], and Guo et al.’s research showed that the annual average water vapor content in the Ili River Valley is on an overall upward trend, with higher levels in the plains than in the mountainous areas, peaking at certain elevations before decreasing, and showing large regional fluctuations [50]. Wu Xiaodan et al. reported significant increases in extreme precipitation indices across Xinjiang [51], and Xie Pei’s analysis of spatiotemporal precipitation characteristics (1961–2015) showed marked increases in precipitation indices, particularly in northern Xinjiang with a north–south disparity in trends [52]. The study deliberately focused on climatic drivers given research objectives to quantify climate change impacts. While acknowledging potential influences from edaphic factors and biotic interactions, these were excluded due to data availability constraints in the arid environment. Our models therefore represent climate envelope projections rather than comprehensive ecological niche models. Our findings confirm that temperature and precipitation are primary drivers determining the distribution patterns of the three plant species studied within the Xinjiang region. Notably, the continued global surface temperature rise is projected to alter their suitable habitat ranges at the regional scale [53]. Given Xinjiang’s fragile ecosystems and the species’ broader biogeographical distributions, enhanced monitoring of these climate-sensitive variables should be integrated with cross-regional habitat assessments to develop effective climate adaptation strategies [54].
Xinjiang is located in arid northwest China and covers about one-sixth of the total land area of the country. It is distant from oceans and blocked from moist air inflow by the Qinghai–Tibet Plateau and surrounding high mountains, resulting in an arid continental climate [55]. Under different future climate scenarios, the potential suitable areas for Halos. caspica in northern Xinjiang are projected to expand. This may be attributed to the relatively low dependency of Halos. caspica on its current habitat and its ability to adapt to a broader range of environmental conditions. However, in northern Xinjiang, the decline in suitable areas under high greenhouse gas emission scenarios is particularly significant. Climate change may render the current environmental conditions unsuitable for its survival [56]. From 2061 to 2080, the potential suitable areas for Halox. ammodendrum are projected to shrink significantly, with the maximum reduction reaching 20.26 × 10⁴ km2. This is likely due to the global increase in temperature, which will trigger changes in the global average water vapor content, precipitation patterns, and evapotranspiration. These changes will further affect runoff, groundwater flow, and soil moisture. The complexity of the natural environment in Xinjiang adds a high degree of uncertainty to future hydrological conditions. Under the SSP3-7.0 climate scenario from 2061 to 2080, the potential suitable areas for K. caspia are projected to expand substantially. This may be due to global warming, which reduces diurnal temperature variations and thus favors vegetation growth. Additionally, concentrated precipitation and higher nighttime temperatures may promote the growth of vegetation in Xinjiang [57].
Climate change has led to shifts in the distribution range centers of Halos. caspica, Halox. ammodendrum, and K. caspia under different Shared Socioeconomic Pathway (SSP) scenarios, with each species exhibiting distinct migration directions. Under various climate scenarios, the potential suitable areas for Halox. ammodendrum generally shift towards higher latitudes. This may be because the projected climate changes under low greenhouse gas emission scenarios result in more favorable temperature and precipitation conditions in higher latitude regions [58]. In contrast, the potential suitable areas for Halos. caspica and K. caspia generally migrate towards lower latitudes. This is likely due to the degradation of suitable areas in lower latitude regions under medium- to high-greenhouse gas emission scenarios, which forces these species to seek new suitable habitats [56]. It is important to note that migration towards lower latitudes may be relative and does not necessarily indicate that the climate conditions in lower latitude regions have become more favorable. Instead, it may simply be a result of the degradation of suitable areas in higher latitude regions [59]. Additionally, geographical anomalies may also lead to species migration towards lower latitudes, indicating that changes in species distribution may not only be driven by climate change but could also be influenced by other factors. For example, human activities that help certain species overcome natural barriers may expand their range of activity.
Future preparations to fully identify the complementary information collected on spectral reflectance and vertical structure of the three desertification tree species using spectral index data from optical remote sensing imagery and radar index data from radar imagery [60]. In the future, we plan to integrate high-resolution multispectral or visible light imagery obtained from drones to extract key ecological parameters such as vegetation cover, canopy height, leaf area index, and soil surface characteristics. These parameters will be used to identify micro-environmental differences at a small spatial scale and enhance the spatial resolution and prediction accuracy of the potential suitable habitats for the three plant species. This approach will help to compensate for the limitations of medium- and high-altitude remote sensing in recognizing local heterogeneity [61].

5. Conclusions

When projecting future distribution patterns using tools like MaxEnt, it is essential to acknowledge model limitations in accounting for species’ actual dispersal capacities. For tree species specifically, migration rates to suitable areas may lag behind environmental changes, resulting in future distributions intermediate between no-migration and full-migration scenarios. Predictions neglecting dispersal capabilities inevitably contain uncertainties. Future research should integrate species migration abilities, land use changes, anthropogenic factors, and other variables to improve projection accuracy. This multidimensional approach will enhance our capacity to forecast and manage vegetation responses to climate change.
This study utilized the MaxEnt model to analyze the changes in potential suitable areas of three dominant desert plants in Xinjiang under current and future climate conditions. The results indicate that the suitable areas of these plants are primarily concentrated in the Gurbantünggüt Desert of the Junggar Basin and the southern foothills of the Tianshan Mountains. Currently, the suitable area for Halox. ammodendrum is the largest (145.88 × 10⁴ km2), followed by Karelinia caspica (109.55 × 10⁴ km2), and Halos. caspica has the smallest suitable area (95.75 × 10⁴ km2). Under future climate scenarios, the suitable area of Halos. caspica is projected to increase in the 2050s but will decrease by the 2070s. The suitable area of Halox. ammodendrum is expected to continue shrinking over the next 40 years, while that of Karelinia caspica remains relatively stable. The centroids of the suitable areas for all three plants are shifting westward. Climatic factors significantly influence the distribution of these plants. Halos. caspica is most affected by the mean annual temperature, Halox. ammodendrum by the precipitation of the coldest quarter, and Karelinia caspica by the precipitation of the wettest month. These results demonstrate that different plants exhibit varying responses to climate change, necessitating the development of targeted conservation strategies. This study provides a scientific basis for the conservation of desert ecosystems in Xinjiang. Future research should incorporate additional environmental variables and field survey data to improve the accuracy of model predictions. Moreover, human activities and land use changes should be integrated into the analysis to develop more forward-looking and adaptive conservation measures to address the challenges posed by climate change.

Author Contributions

H.C.: data curation, writing—original draft preparation. Z.Z.: conceptualization, methodology. H.T.: supervision. All authors have read and agreed to the published version of the manuscript.

Funding

This paper was financially supported by the Major Science and Technology Special Project of Xinjiang Uygur Autonomous Region (No. 2024A03009-1), the Key Research and Development Program of Xinjiang Uygur Autonomous Region, China (grant number 2022B03030), Postgraduate Research and Practice Innovation Program of Jiangsu Province (Project number KYCX24_1258; KYCX23_1228); Development of Jiangsu Higher Education Institutions (PAPD).

Data Availability Statement

Data will be made available on request.

Acknowledgments

We sincerely thank the editor and anonymous reviewers for their valuable comments and suggestions to improve the quality of this paper.

Conflicts of Interest

The authors declare no conflicts of interest.

References

  1. Wang, X.; Ge, Q.; Geng, X.; Wang, Z.; Gao, L.; Bryan, B.A.; Chen, S.; Su, Y.; Cai, D.; Ye, J.; et al. Unintended Consequences of Combating Desertification in China. Nat. Commun. 2023, 14, 1139. [Google Scholar] [CrossRef] [PubMed]
  2. Yao, J.; Liu, H.; Huang, J.; Gao, Z.; Wang, G.; Li, D.; Yu, H.; Chen, X. Accelerated Dryland Expansion Regulates Future Variability in Dryland Gross Primary Production. Nat. Commun. 2020, 11, 1665. [Google Scholar] [CrossRef] [PubMed]
  3. Zhang, Q.; Yang, J.; Wang, W.; Ma, P.; Lu, G.; Liu, X.; Yu, H.; Fang, F. Climatic Warming and Humidification in the Arid Region of Northwest China: Multi-Scale Characteristics and Impacts on Ecological Vegetation. J. Meteorol. Res. 2021, 35, 113–127. [Google Scholar] [CrossRef]
  4. Bellard, C.; Bertelsmeier, C.; Leadley, P.; Thuiller, W.; Courchamp, F. Impacts of Climate Change on the Future of Biodiversity. Ecol. Lett. 2012, 15, 365–377. [Google Scholar] [CrossRef]
  5. Bonan, G.B.; Doney, S.C. Climate, Ecosystems, and Planetary Futures: The Challenge to Predict Life in Earth System Models. Science 2018, 359, eaam8328. [Google Scholar] [CrossRef]
  6. Kaufmann, R.K.; Zhou, L.; Myneni, R.B.; Tucker, C.J.; Slayback, D.; Shabanov, N.V.; Pinzon, J. The Effect of Vegetation on Surface Temperature: A Statistical Analysis of NDVI and Climate Data. Geophys. Res. Lett. 2003, 30, 2003GL018251. [Google Scholar] [CrossRef]
  7. Chen, C.; Park, T.; Wang, X.; Piao, S.; Xu, B.; Chaturvedi, R.K.; Fuchs, R.; Brovkin, V.; Ciais, P.; Fensholt, R.; et al. China and India Lead in Greening of the World through Land-Use Management. Nat. Sustain. 2019, 2, 122–129. [Google Scholar] [CrossRef]
  8. Piao, S.; Wang, X.; Park, T.; Chen, C.; Lian, X.; He, Y.; Bjerke, J.W.; Chen, A.; Ciais, P.; Tømmervik, H.; et al. Characteristics, Drivers and Feedbacks of Global Greening. Nat. Rev. Earth Environ. 2020, 1, 14–27. [Google Scholar] [CrossRef]
  9. Lian, X.; Piao, S.; Chen, A.; Huntingford, C.; Fu, B.; Li, L.Z.X.; Huang, J.; Sheffield, J.; Berg, A.M.; Keenan, T.F.; et al. Multifaceted Characteristics of Dryland Aridity Changes in a Warming World. Nat. Rev. Earth Environ. 2021, 2, 232–250. [Google Scholar] [CrossRef]
  10. Yin, G.; Hu, Z.; Chen, X.; Tiyip, T. Vegetation Dynamics and Its Response to Climate Change in Central Asia. J. Arid Land 2016, 8, 375–388. [Google Scholar] [CrossRef]
  11. Warren, R.; Price, J.; Graham, E.; Forstenhaeusler, N.; VanDerWal, J. The Projected Effect on Insects, Vertebrates, and Plants of Limiting Global Warming to 1.5 °C Rather than 2 °C. Science 2018, 360, 791–795. [Google Scholar] [CrossRef] [PubMed]
  12. Ali, H.; Din, J.U.; Bosso, L.; Hameed, S.; Kabir, M.; Younas, M.; Nawaz, M.A. Expanding or Shrinking? Range Shifts in Wild Ungulates under Climate Change in Pamir-Karakoram Mountains, Pakistan. PLoS ONE 2022, 16, e0260031. [Google Scholar] [CrossRef] [PubMed]
  13. Wei, B.; Wang, R.; Hou, K.; Wang, X.; Wu, W. Predicting the Current and Future Cultivation Regions of Carthamus Tinctorius L. Using MaxEnt Model under Climate Change in China. Glob. Ecol. Conserv. 2018, 16, e00477. [Google Scholar] [CrossRef]
  14. Paim, F.P.; Carretero-Pinzón, X.; Guzmán-Caro, D.C.; Alfaro, J.L.; Calouro, A.M. The IUCN Red List of Threatened Species; IUCN: Gland, Switzerland, 2021. [Google Scholar]
  15. Gaston, K.J. Species-Range-Size Distributions: Patterns, Mechanisms and Implications. Trends Ecol. Evol. 1996, 11, 197–201. [Google Scholar] [CrossRef] [PubMed]
  16. Wei-Yao, K.; Xin-Hai, L.I.; Hong-Fei, Z.O.U. Optimizing MaxEnt Model in the Prediction of Species Distribution. Yingyong Shengtai Xuebao 2019, 30, 2116. [Google Scholar]
  17. Elith, J.; Graham, C.H.; Anderson, R.P.; Dudík, M.; Ferrier, S.; Guisan, A.; Hijmans, R.J.; Huettmann, F.; Leathwick, J.R.; Lehmann, A. Novel Methods Improve Prediction of Species’ Distributions from Occurrence Data. Ecography 2006, 29, 129–151. [Google Scholar] [CrossRef]
  18. Hannah, L.; Roehrdanz, P.R.; Ikegami, M.; Shepard, A.V.; Shaw, M.R.; Tabor, G.; Zhi, L.; Marquet, P.A.; Hijmans, R.J. Climate Change, Wine, and Conservation. Proc. Natl. Acad. Sci. USA 2013, 110, 6907–6912. [Google Scholar] [CrossRef]
  19. Khanum, R.; Mumtaz, A.S.; Kumar, S. Predicting Impacts of Climate Change on Medicinal Asclepiads of Pakistan Using Maxent Modeling. Acta Oecol. 2013, 49, 23–31. [Google Scholar] [CrossRef]
  20. Hosseini, N.; Ghorbanpour, M.; Mostafavi, H. Habitat Potential Modelling and the Effect of Climate Change on the Current and Future Distribution of Three Thymus Species in Iran Using MaxEnt. Sci. Rep. 2024, 14, 3641. [Google Scholar] [CrossRef]
  21. Su, B.; Huang, J.; Mondal, S.K.; Zhai, J.; Wang, Y.; Wen, S.; Gao, M.; Lv, Y.; Jiang, S.; Jiang, T.; et al. Insight from CMIP6 SSP-RCP Scenarios for Future Drought Characteristics in China. Atmos. Res. 2021, 250, 105375. [Google Scholar] [CrossRef]
  22. Li, S.-Y.; Miao, L.-J.; Jiang, Z.-H.; Wang, G.-J.; Gnyawali, K.R.; Zhang, J.; Zhang, H.; Fang, K.; He, Y.; Li, C. Projected Drought Conditions in Northwest China with CMIP6 Models under Combined SSPs and RCPs for 2015–2099. Adv. Clim. Change Res. 2020, 11, 210–217. [Google Scholar] [CrossRef]
  23. Zheng, Y.; Li, S.; He, Y. Projection of Summer Rainfall in the Yangtze River Basin in the Next 30 Years under Different Shared Socioeconomic Pathways. Chin. J. Atmos. Sci. 2023, 47, 1405–1420. [Google Scholar] [CrossRef]
  24. Wu, X.; Zheng, X.J.; Yin, X.W.; Yue, Y.M.; Li, Y. Seasonal Variation in the Groundwater Dependency of Two Dominant Woody Species in a Desert Region of Central Asia. Plant Soil 2019, 444, 39–55. [Google Scholar] [CrossRef]
  25. Xiao, F.; Liu, Q.; Qin, Y. Predicting the Potential Distribution of Haloxylon Ammodendron under Climate Change Scenarios Using Machine Learning of a Maximum Entropy Model. Biology 2024, 13, 3. [Google Scholar] [CrossRef]
  26. Zeng, Y.; Li, L.; Yang, R.; Yi, X.; Zhang, B. Contribution and Distribution of Inorganic Ions and Organic Compounds to the Osmotic Adjustment in Halostachys Caspica Response to Salt Stress. Sci. Rep. 2015, 5, 13639. [Google Scholar] [CrossRef]
  27. Zhang, R.; Zhang, H.; Wang, L.; Zeng, Y. Effect of Salt-Alkali Stress on Seed Germination of the Halophyte Halostachys Caspica. Sci. Rep. 2024, 14, 13199. [Google Scholar] [CrossRef]
  28. Lü, X.-P.; Gao, H.-J.; Zhang, L.; Wang, Y.-P.; Shao, K.-Z.; Zhao, Q.; Zhang, J.-L. Dynamic Responses of Haloxylon Ammodendron to Various Degrees of Simulated Drought Stress. Plant Physiol. Biochem. 2019, 139, 121–131. [Google Scholar] [CrossRef]
  29. Islam, W.; Zeng, F.; Mubarak Alwutayd, K.; Ali Khan, K. Beneath the Surface: Investigating Soil Microbial and Metazoa Communities at Various Depths in a Natural Desert Ecosystem Inhabited by Karelinia Caspia. Ecol. Indic. 2024, 159, 111745. [Google Scholar] [CrossRef]
  30. Du, H.; Zhou, C.; Tang, H.; Jin, X.; Chen, D.; Jiang, P.; Li, M. Correction to: Simulation and Estimation of Future Precipitation Changes in Arid Regions: A Case Study of Xinjiang, Northwest China. Clim. Change 2021, 167, 43. [Google Scholar] [CrossRef]
  31. Tian, Y.; Li, J.G.; Pan, L.P.; Zhao, Y. The Key Factors Affecting Haloxylon Ammodendron Germination and Survival at Very Early Stage. Acta Ecol. Sin. 2010, 30, 4898–4904. [Google Scholar]
  32. Hua, Y.C.; Zhong, D.J.; Mei, S.Q.; Ke, Z.; Yong, Z.Z.; Yan, T.C. Salt Island Effect of Halophytic Shrubs in Different Habitats and Its Ecological Implication. Acta Pedol. Sin. 2012, 49, 289–295. [Google Scholar]
  33. Chen, L.; Li, M.; Li, C.; Zheng, W.; Liu, R. Different Physiological Responses to Continuous Drought between Seedlings and Younger Individuals of Haloxylon Ammodendron. Plants 2023, 12, 3683. [Google Scholar] [CrossRef] [PubMed]
  34. Liang, S.; Jun, C.; Sai, L.; Rong, X.U.; Chang-qing, X.U.; Tong-ning, L.I.U. Influence of Dehydration and Diurnal Variation on Characteristics of Chlorophyll Fluorescence of Leaves in Haloxylon Ammodendron and H. Persicum. Yingyong Shengtai Xuebao 2015, 26, 2321. [Google Scholar]
  35. Yan, K.; Ablimit, M.; Liu, S.; Liu, Z.; Wang, Y. A Novel Metallothionein Gene HcMT from Halophyte Shrub Halostachys Caspica Respond to Cadmium and Sodium Stress. Plant Physiol. Biochem. 2023, 201, 107763. [Google Scholar] [CrossRef]
  36. Mielke, K.P.; Claassen, T.; Busana, M.; Heskes, T.; Huijbregts, M.A.J.; Koffijberg, K.; Schipper, A.M. Disentangling Drivers of Spatial Autocorrelation in Species Distribution Models. Ecography 2020, 43, 1741–1751. [Google Scholar] [CrossRef]
  37. Wan, G.-Z.; Wang, L.; Jin, L.; Chen, J. Evaluation of Environmental Factors Affecting the Quality of Codonopsis Pilosula Based on Chromatographic Fingerprint and MaxEnt Model. Ind. Crops Prod. 2021, 170, 113783. [Google Scholar] [CrossRef]
  38. Wang, T.; Tu, X.; Singh, V.P.; Chen, X.; Lin, K. Global Data Assessment and Analysis of Drought Characteristics Based on CMIP6. J. Hydrol. 2021, 596, 126091. [Google Scholar] [CrossRef]
  39. Su, W.; Wu, D.; Wu, H.; Zhang, M.; Zhang, R. Upscaling Method for Corn Canopy LAI Using MaxEnt Model. Trans. Chin. Soc. Agric. Eng. 2016, 32, 165–172. [Google Scholar]
  40. Elith, J.; Phillips, S.J.; Hastie, T.; Dudík, M.; Chee, Y.E.; Yates, C.J. A Statistical Explanation of MaxEnt for Ecologists: Statistical Explanation of MaxEnt. Divers. Distrib. 2011, 17, 43–57. [Google Scholar] [CrossRef]
  41. Dreiseitl, S. Towards More Efficient Multiclass AUC Computations. In Proceedings of the 31st European Modeling and Simulation Symposium, EMSS 2019, Lisbon, Portugal, 18–20 September 2019; pp. 327–331. [Google Scholar] [CrossRef]
  42. Niels, J.; Mark, R. Assessing the Performance and Accuracy of Invasive Plant Habitat Suitability Models in Detecting New Observations in Wisconsin. Invasive Plant Sci. Manag. 2021, 14, 214–222. [Google Scholar]
  43. Zhao, Y.; Deng, X.; Xiang, W.; Chen, L.; Ouyang, S. Predicting Potential Suitable Habitats of Chinese Fir under Current and Future Climatic Scenarios Based on Maxent Model. Ecol. Inform. 2021, 64, 101393. [Google Scholar] [CrossRef]
  44. Liu, C.; Berry, P.M.; Dawson, T.P.; Pearson, R.G. Selecting Thresholds of Occurrence in the Prediction of Species Distributions. Ecography 2005, 28, 385–393. [Google Scholar] [CrossRef]
  45. Phillips, S.J.; Anderson, R.P.; Schapire, R.E. Maximum Entropy Modeling of Species Geographic Distributions. Ecol. Model. 2006, 190, 231–259. [Google Scholar] [CrossRef]
  46. Zhang, K.; Yao, L.; Meng, J.; Tao, J. Maxent Modeling for Predicting the Potential Geographical Distribution of Two Peony Species under Climate Change. Sci. Total Environ. 2018, 634, 1326–1334. [Google Scholar] [CrossRef]
  47. He, Y.; Huang, W.; Zhao, X.; Lv, P.; Wang, H. Review on the Impact of Climate Change on Plant Diversity. J. Desert Res. 2021, 41, 59. [Google Scholar]
  48. Wu, J.; Lv, J.; Ai, L. The Impacts of Climate Change on the Biodiversity: Vulnerability and Adaptation. Ecol. Environ. 2009, 18, 693. [Google Scholar]
  49. Zhu, Y.; Jia, Z.; Wang, G. Response of Seed Germination and Seedling Emergence of Haloxylon Ammodendron to Climate Change in Desert Ecosystem. Res. Gate 2022. [Google Scholar] [CrossRef]
  50. Guo, N.; Chen, F.; He, C.; Wang, T.; Long, A.; Xu, X. Multi-Year Average Water Vapor Characteristics and Potential Sources and Transport Pathways of Intense Water Vapor during Extreme Precipitation Events in the Ili River Valley, China. J. Hydrol. Reg. Stud. 2025, 58, 102278. [Google Scholar] [CrossRef]
  51. Wu, X.; Luo, M.; Meng, F.; Sa, C.; Yin, C.; Bao, Y. New Characteristics of Spatio-Temporal Evolution of Extreme Climate Events in Xinjiang under the Background of Warm and Humid Climate. Arid. Zone Res. 2022, 39, 1695–1705. [Google Scholar]
  52. Xie, P.; Zhang, Y.; Qiao, F. Spatial and Temporal Characteristics of Extreme Precipitation in Xinjiang and Its Response to ENSO. J. Meteorol. Res. Appl. 2019, 40, 5–12. [Google Scholar]
  53. Trew, B.T.; Maclean, I.M.D. Vulnerability of Global Biodiversity Hotspots to Climate Change. Glob. Ecol. Biogeogr. 2021, 30, 768–783. [Google Scholar] [CrossRef]
  54. Adapting to the Impacts of Climate Change|The National Academies Press. Available online: https://nap.nationalacademies.org/catalog/12783/adapting-to-the-impacts-of-climate-change (accessed on 26 May 2025).
  55. Zhang, H.-X.; Zhang, M.-L. Insight into Distribution Patterns and Conservation Planning in Relation to Woody Species Diversity in Xinjiang, Arid Northwestern China. Biol. Conserv. 2014, 177, 165–173. [Google Scholar] [CrossRef]
  56. McDowell, N.G.; Anderson-Teixeira, K.; Biederman, J.A.; Breshears, D.D.; Fang, Y.; Fernández-de-Uña, L.; Graham, E.B.; Mackay, D.S.; McDonnell, J.J.; Moore, G.W.; et al. Ecohydrological Decoupling under Changing Disturbances and Climate. One Earth 2023, 6, 251–266. [Google Scholar] [CrossRef]
  57. Yu, H.; Bian, Z.; Mu, S.; Yuan, J.; Chen, F. Effects of Climate Change on Land Cover Change and Vegetation Dynamics in Xinjiang, China. Int. J. Environ. Res. Public Health 2020, 17, 4865. [Google Scholar] [CrossRef]
  58. Carrillo, J.; Hernández-Barrera, S.; Expósito, F.J.; Díaz, J.P.; González, A.; Pérez, J.C. The Uneven Impact of Climate Change on Drought with Elevation in the Canary Islands. npj Clim. Atmos. Sci. 2023, 6, 31. [Google Scholar] [CrossRef]
  59. Jiang, K.; Teuling, A.J.; Chen, X.; Huang, N.; Wang, J.; Zhang, Z.; Gao, R.; Men, J.; Zhang, Z.; Wu, Y.; et al. Global Land Degradation Hotspots Based on Multiple Methods and Indicators. Ecol. Indic. 2024, 158, 111462. [Google Scholar] [CrossRef]
  60. Wang, J.; Peng, J.; Li, H.; Yin, C.; Liu, W.; Wang, T.; Zhang, H. Soil Salinity Mapping Using Machine Learning Algorithms with the Sentinel-2 MSI in Arid Areas, China. Remote Sens. 2021, 13, 305. [Google Scholar] [CrossRef]
  61. Wang, E.; Huang, T.; Liu, Z.; Bao, L.; Guo, B.; Yu, Z.; Feng, Z.; Luo, H.; Ou, G. Improving Forest Above-Ground Biomass Estimation Accuracy Using Multi-Source Remote Sensing and Optimized Least Absolute Shrinkage and Selection Operator Variable Selection Method. Remote Sens. 2024, 16, 4497. [Google Scholar] [CrossRef]
Figure 1. Map of ecological and climatic zoning and vulnerability classification of Xinjiang, and topographic map of mountain ranges.
Forests 16 01031 g001
Figure 2. ROC curve prediction results of the MaxEnt model.
Forests 16 01031 g002
Figure 3. Response curves of dominant environmental factors.
Forests 16 01031 g003
Figure 4. Areas suitable for three major desert species under modern climatic (1970–2000) conditions based on modeling results. (a) Halostachys caspica (M. Bieb.) C. A. Mey. (b) Hafoxylon ammodendron (C. A. Mey.) Bunge. (c) Karelinia caspia (Pall.) Less.
Forests 16 01031 g004
Figure 5. The spatial patterns of habitat shifts for Halostachys caspia (a), Haloxylon ammodendron (b), and Karelinia caspia (c) under different climate scenarios in Xinjiang.
Forests 16 01031 g005
Figure 6. The changes in the centroids of the potential distribution areas for Halostachys caspia (a), Haloxylon ammodendron (b), and Karelinia caspia (c) over different periods.
Forests 16 01031 g006
Table 1. Research on the basic information of the species.
Species NamesClassification (Family)Habitat CharacteristicsSpecies Growth HabitsDistribution Range in Central Asia
Halostachys capsica
(M. Bieb.) C. A. Mey
AmaranthaceaeSaline–alkali flats, river valleys, salt lake shores, and saline–alkali soils.Shrubs, 50–200 cm tall.Distributed in Afghanistan, Russia, Mongolia, Iran, and China; in China, it is mainly found in Xinjiang and northern Gansu.
Haloxylon ammodendron (C. A. Mey.) BungeChenopodiaceaeDunes, saline–alkali deserts, riverside sandy areas, sandy soils and saline–alkali soils.Small trees, 1–9 m tall, with a ground diameter of up to 50 cm on their trunks.Distributed in Central Asia, Xinjiang, western Gansu, Inner Mongolia, and other regions; suitable habitats are found in areas such as the Tarim Basin, the northern slopes of the Tianshan Mountains, and the western edge of the Taklamakan Desert in Central Asia.
Karelinia caspia
(Pall.) Less
AsteraceaeHalophytic meadows and salinized lowlands in desert zones, along farmland edges, with soils ranging from slightly to moderately salinized or severely salinized.Perennial herb, 50–100 cm tall, sometimes up to 150 cm.Distributed in Central Asia, Mongolia, Iran, Turkey, and regions such as Inner Mongolia, Ningxia, and Gansu in China; it is also found in countries like Kazakhstan and Uzbekistan in Central Asia.
Table 2. Environmental variables.
NumberingEnvironmental VariablesUnit
Bio1Annual mean temperature°C
Bio2Mean diurnal range°C
Bio3Isothermality
Bio4Standard deviation of seasonal variation in temperature
Bio5Maximum temperature of warmest month
Bio6Minimum temperature of coldest month°C
Bio7Temperature annual range°C
Bio8Mean temperature of wettest quarter°C
Bio9Mean temperature of driest quarter°C
Bio10Mean temperature of warmest quarter°C
Bio11Mean temperature of coldest quarter°C
Bio12Annual precipitationmm
Bio13Precipitation of wettest periodmm
Bio14Precipitation of driest periodmm
Bio15Precipitation of wettest quarter
Bio16Precipitation of driest quartermm
Bio17Precipitation seasonalitymm
Bio18Precipitation of warmest quartermm
Bio19Precipitation of coldest quartermm
2041–2060 (2050s) and 2061–2080 (2070s), providing comprehensive scenarios of potential climate change impacts under varying greenhouse gas concentrations.
Table 3. Contribution rates of bioclimatic factors to the contemporary prediction of Halos. caspica based on the MaxEnt model.
NumberingEnvironmental VariablesPercent ContributionUnit
Bio1Annual mean temperature30.5°C
Bio2Mean diurnal range2.6°C
Bio3Isothermality0.7
Bio4Standard deviation of seasonal variation in temperature14.6
Bio16Precipitation of driest quarter17mm
Bio19Precipitation of coldest quarter13.9mm
Bio16Precipitation of driest quarter1.7mm
Bio19Precipitation of coldest quarter19mm
Table 4. Changes in the spatial distribution of suitable habitats for three species during different periods.
Period–Climate
Scenario
Area Change/104 km2
Halostachys capsicaHaloxylon ammodendron
Karelinia caspia
IncreaseLostIncreaseLostIncreaseLost
2041–2060 SSP-2.4510.380.476.744.153.472.5
2041–2060 SSP-3.708.440.30.0720.264.072.23
2041–2060 SSP-5.855.337.0318.930.223.272.57
2061–2080 SSP-2.45100.460.0612.22.631.31
2061–2080 SSP-3.706.733.480.2313.289.150.44
2061–2080 SSP-5.857.923.220.0710.751.053.34
Disclaimer/Publisher’s Note: The statements, opinions and data contained in all publications are solely those of the individual author(s) and contributor(s) and not of MDPI and/or the editor(s). MDPI and/or the editor(s) disclaim responsibility for any injury to people or property resulting from any ideas, methods, instructions or products referred to in the content.

